Article

Determination of Nutrient Supplementation by Means of ATR-FTIR Spectroscopy during Wine Fermentation

by
Miquel Puxeu
1,
Imma Andorra
1,
Sílvia De Lamo-Castellví
2 and
Raúl Ferrer-Gallego
1,*
1
Centro Tecnológico del Vino—VITEC, Carretera de Porrera Km. 1, 43730 Falset, Spain
2
Departament d’Enginyeria Química, Universitat Rovira i Virgili, Avinguda Països Catalans, 26 Campus Sescelades, 43007 Tarragona, Spain
*
Author to whom correspondence should be addressed.
Fermentation 2019, 5(3), 58; https://doi.org/10.3390/fermentation5030058
Submission received: 13 June 2019 / Revised: 27 June 2019 / Accepted: 1 July 2019 / Published: 3 July 2019
(This article belongs to the Special Issue Bioprocess and Fermentation Monitoring, Volume II)

Abstract

:
Nitrogen is a limiting factor for the development of wine alcoholic fermentation. The addition of nutrients and different nitrogen sources is a usual practice for many winemakers. Currently, there is a market trend toward wine that is additive-free and there are also restrictions on the amount of ammonium fermentation agents that can be added to the wine. In this work, the changes produced on the alcoholic fermentation by the addition of different nitrogen sources were evaluated by the use of ATR-FTIR. The results showed the feasibility of this technique to observe differences in the growth yeast capacity depending on the type of the nutrients added. A high influence on the development of the alcoholic fermentation was observed, especially at its exponential and the stationary phases. Moreover, the changes observed in the recorded spectra were related to the proteins and lipid esters composition of the yeast cell wall. This technique should be a useful tool to evaluate nitrogen deficiencies during winemaking although further studies should be done in order to evaluate more influential factors.

Graphical Abstract

1. Introduction

The authenticity and traceability of beverages is a current target in avoiding fraud [1]. The evaluation of the authenticity of wine involves checking several claims, such as the declaration of origin, vintage, and production method [2]. Wine quality is affected by numerous factors, from grape harvest to the fermentation process and ageing. Among these, low temperature winemaking, novel (additive-free) techniques, additions, or even new isolated yeast strains may clearly influence its quality [3,4,5,6,7]. Wines originate as a result of winemaking practices including, among others, the addition and supplementation of some enological products, such as grape juice nutrients. These additions do not usually appear on the labeling and may be misrepresented. Detecting the additions performed during winemaking, at that moment, even if it is legal supplementation, is important for fraud detection and consumer protection. The wine yeast nutrition is essential to ensure their right growth during the wine alcoholic fermentation [8]. The grape juice is the main source of nutrients and its quantitative and qualitative composition strongly influences the fermentation kinetics. Nitrogen is one of the most important nutrients and it is critical to the growth of S. cerevisiae [8,9,10,11]. The grape juice nitrogen composition influences the final wine quality since it has an important effect on the wine aroma and the health-related metabolic by-products [12,13,14]. Yeast available nitrogen (YAN) content is limited in the wine alcoholic fermentation process and therefore the addition of nitrogen sources is a usual practice in the winemaking process.
The nitrogen addition allows yeasts growth, the activation of the fermentation process, and the formation of the end-products. Otherwise, the limited nitrogen content directly restricts the metabolic activity of yeasts and may induce sluggish fermentation or even a fermentation stop [15]. Moreover, the undesirable production of by-products, such as H2S, produced by a deficient nutrition environment is considered a great winemaking concern [16,17]. Several studies have shown that S. cerevisiae requires minimum levels of YAN (ranged from 120 to 180 mg/L) to obtain the optimum fermentation kinetics [18,19]. Nitrogen addition is recommended to enhance the characteristics of wines [20] and to ensure the end of the fermentation process [9]. The supplementation time is also important, and it seems to be most effective when nitrogen source is added during the acclimation phase of the yeasts, at the beginning of the alcoholic fermentation [9,19]. At this stage, the nitrogen addition has a direct effect on the fermentation kinetics, through the protein synthesis reactivation [21]. On the other hand, a late addition may prevent the sugar transportation and its assimilation by the yeast cells [22]. The timing and also the nature of nitrogen are important factors on the fermentation kinetics, being the organic source the most adequate in some cases [23]. However, the addition inorganic nitrogen sources, mainly the ammonium chloride and the diammonium phosphate salts, can reduce the slow down fermentation risks and the formation of undesirable sulphur compounds [8,13] and improve the aromatic profile of wines [20]. Therefore, the amount, timing, and type of nitrogen supplement can substantially modulate wine volatiles composition [13].
There is currently a market trend toward wine that is additive-free and also there are restrictions on the amount of the ammonium fermentation agents that can be added to the wine [24]. In this way, infrared spectroscopy has been widely used in winemaking as a rapid technique to determine some quality control parameters [25]. In this way, this study was to evaluate the feasibility on the use of ATR-FTIR to determine the wine nitrogen supplementation during alcoholic fermentation.

2. Materials and Methods

2.1. Nutrient Additions and Enological Analysis

This study was performed by “Grenache Blanc” white grapes provided by Gandesa winery from Tarragona (Gandesa, Spain). The obtained must was sulphited (40 mg/L of sulphur dioxide), clarified (10 mg/L of commercial enzymes), and settled during 24 h to remove the solid fraction. Then, three batches of cleaned must (150 mL) were inoculated by the E491 S. cerevisiae strain (Zymaflore X5®, Laffort, Bordeaux, France). The recommendation provided by the supplier to reach an initial concentration in must of 106 cfu/mL was considered (200 mg/L of inoculum). Afterwards, 100 mg/L of ammonium salts with thiamine was added as inorganic nitrogen source (20 mg/L of YAN, Thiazote, Laffort, Bordeaux, France) and 300 mg/L of amino acids, vitamins and minerals (21 mg/L of YAN, NutriStart OrganiQ, Laffort) was added as organic nitrogen source. Nutrients were added during the yeast rehydration process, following the supplier instructions. Fermentations were performed in triplicate at 21 °C using a thermostatic water bath, and the wine density and the glucose plus fructose content were daily monitored. The basic oenological analysis (pH, acidity, Brix, turbidity, and alcohol content) were performed according to the methods established by the Organisation Internationale de la Vigne et du Vin [26]. Acetic acid and yeast assimilable nitrogen (YAN) was calculated according to the enzymatic methodologies developed by BioSistems S.A.

2.2. Infrared Spectroscopy Measurements

Infrared analyses were performed at 0 h (initial point), 18 h (early exponential phase), 42 h (exponential phase), and 90 h (stationary phase). Samples (1.5 mL) were taken by the use of sterilized laboratory material and centrifuged (15,900× g for five minutes at room temperature). Then, the supernatant was carefully removed, and the obtained pellets were washed with a standard sodium chloride solution. Spectral data was acquired with a zinc selenide crystal accessory in reflectance mode from 1.5 µL of sample. Six spectra per each sample were collected in the mid-infrared region (from 4000 to 800 cm−1 with 2 cm−1 of resolution) by 32 average scans. Spectra were recorded by the use of a Thermo Nicolet 380 FTIR spectrometer with an ATR ultra-high-performance and the OMNICTM, as control software.

2.3. Statistical and Chemometric Analyses

SAS® software (SAS® System for Windows™, 8.02, 1999; SAS Institute, Cary, NC, USA) was used and a Tukey test was performed at p < 0.05. Spectra were exported to the Pirouette® multivariate analysis software (version 4.0, InfoMetrix, Inc., Washington, DC, USA). The spectral data were mean-centered, transformed to their second derivative using a 15-point Savitzky-Golay polynomial filter, and vector-length normalized. Mahalanobis distance and sample residuals were used to determine outliers. SIMCA was used as predictive model based on the PCA construction models for each class. SIMCA class models were interpreted according to the misclassifications, the class projections, the discriminating power and the interclass distances.

3. Results and Discussion

3.1. Enological Parameters and Fermentation Process

Table 1 shows the enological parameters of the grape juice used to produce the corresponding wines. The YAN content of the initial must was enough to the strain used (S. cerevisiae E491) to grow and complete the alcoholic fermentation on the control samples. All sugars were consumed without any nutritional problems [9,19]. The total acidity (5.5 g/L) and pH (3.1) also presented normal values for “Grenache Blanc” musts [27].
The percentage of alcohol produced during the fermentation process showed significant differences (Table 2). Control wines obtained lower alcohol concentration than wines with inorganic and organic nitrogen, in agreement with other authors who reported that an increase of nitrogen favors the formation of the end-products [28,29]. Fermentations were monitored by the daily measurement of residual sugar content (Table 3). The sugar content of samples at the early stage of the exponential phase (18 h) showed significant differences. The samples with inorganic nitrogen showed the highest sugar content (164.7 g/L) at this time. Moreover, lower significant sugar content was also observed at exponential (42 h) and at stationary phase (90 h) in control wines. According to other authors, the nitrogen addition at the beginning of the alcoholic fermentation was quickly assimilated by yeast and had clearly effects on the fermentation kinetics, in this case, the fermentation activity and the formation of the end-products was increased [21,28,29].
At exponential phase, the sugar concentration was 71.6 g/L for control, 56.0 g/L for samples with addition of inorganic nitrogen, and 57.8 g/L for samples with addition of organic nitrogen. At stationary phase, sugar concentrations were 2 g/L for Control and 0 g/L for the samples supplemented with inorganic and organic nitrogen. The nutrient additions at the beginning of alcoholic fermentation is quickly assimilated by yeast and immediately have effects on the fermentation kinetics [21], stimulating fermentation activity and the formation of the end-products [28,29]. This behavior had been reported by several authors and could explain the significant differences between sugar concentration values detected at exponential and stationary phases.

3.2. Changes during the Alcoholic Fermentation by ATR-FTIR

The representative ATR-FTIR spectra and their second derivative of fresh pellet of S. cerevisiae strain E491 fermented with and without the supplementation of inorganic and organic source of nitrogen are shown in Figure 1. The IR bands of highest proportion in the raw spectra were mainly concentrated in two different regions. The first one was located between 900 and 1200 cm−1 mainly associated with the polysaccharide absorbing region of S. cerevisiae [30] and the second region was located between 1500 and 1750 cm−1 mainly formed by the vibrations of proteins and lipid structures [31,32].
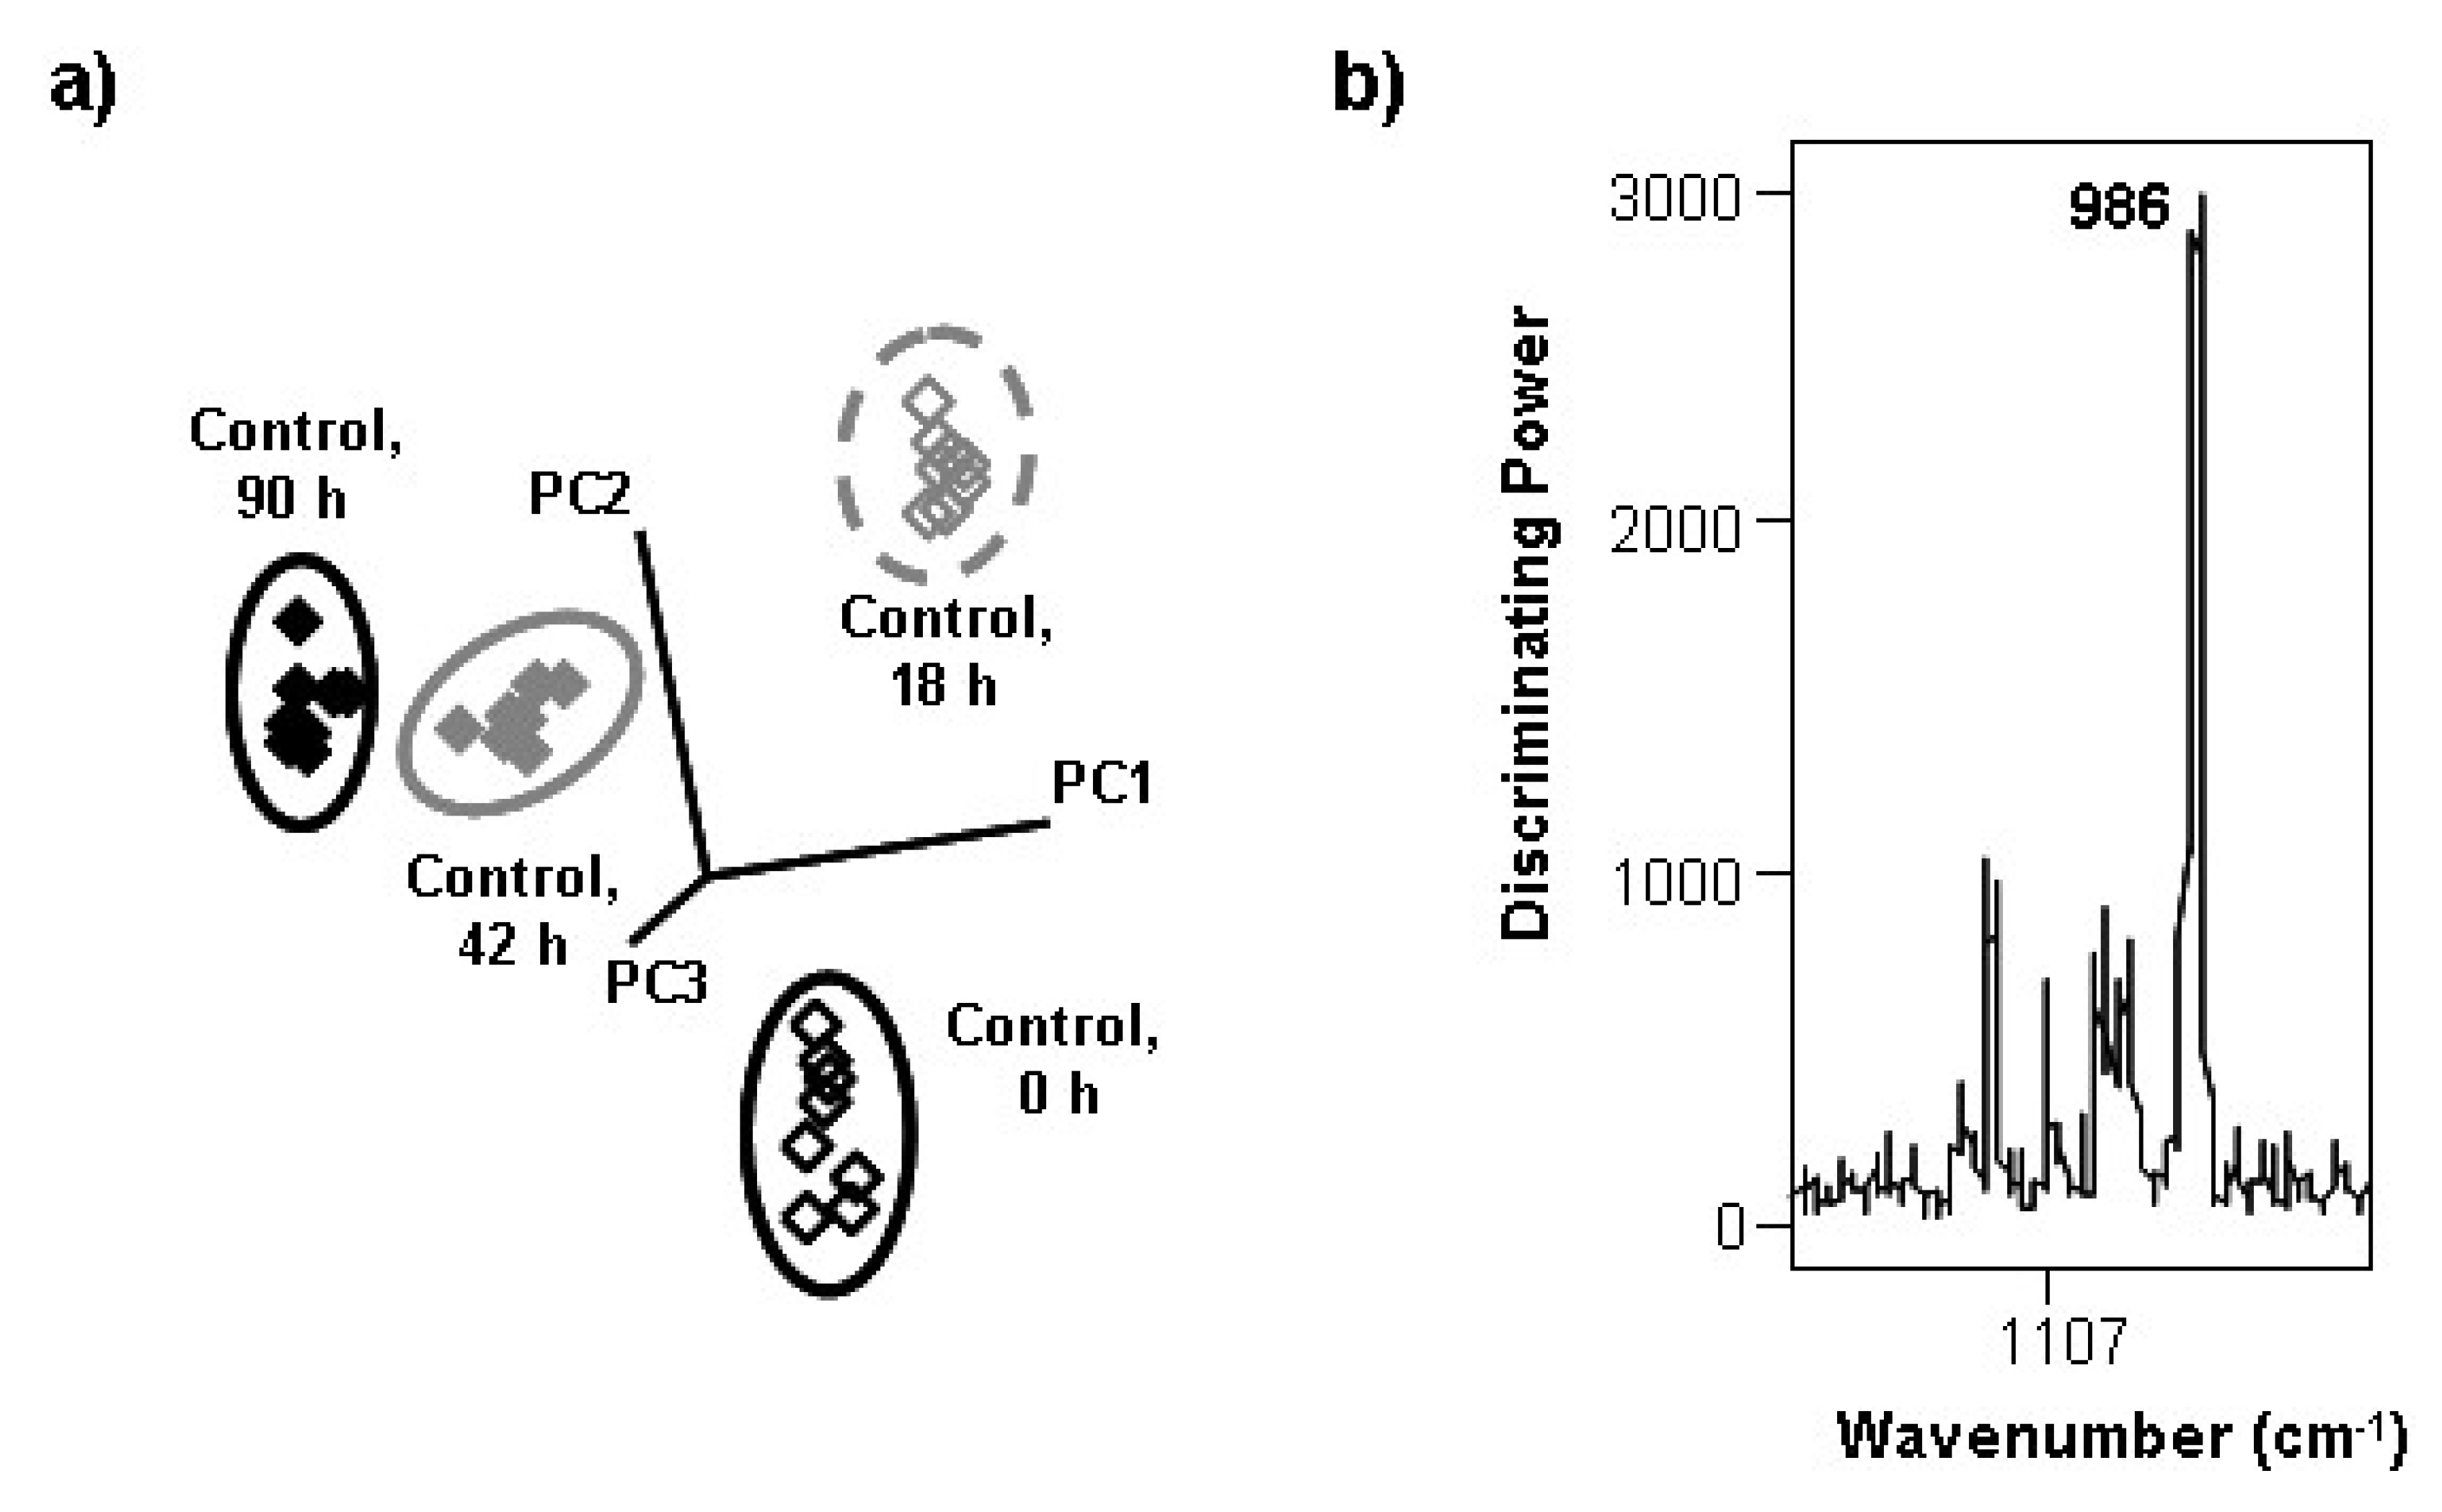
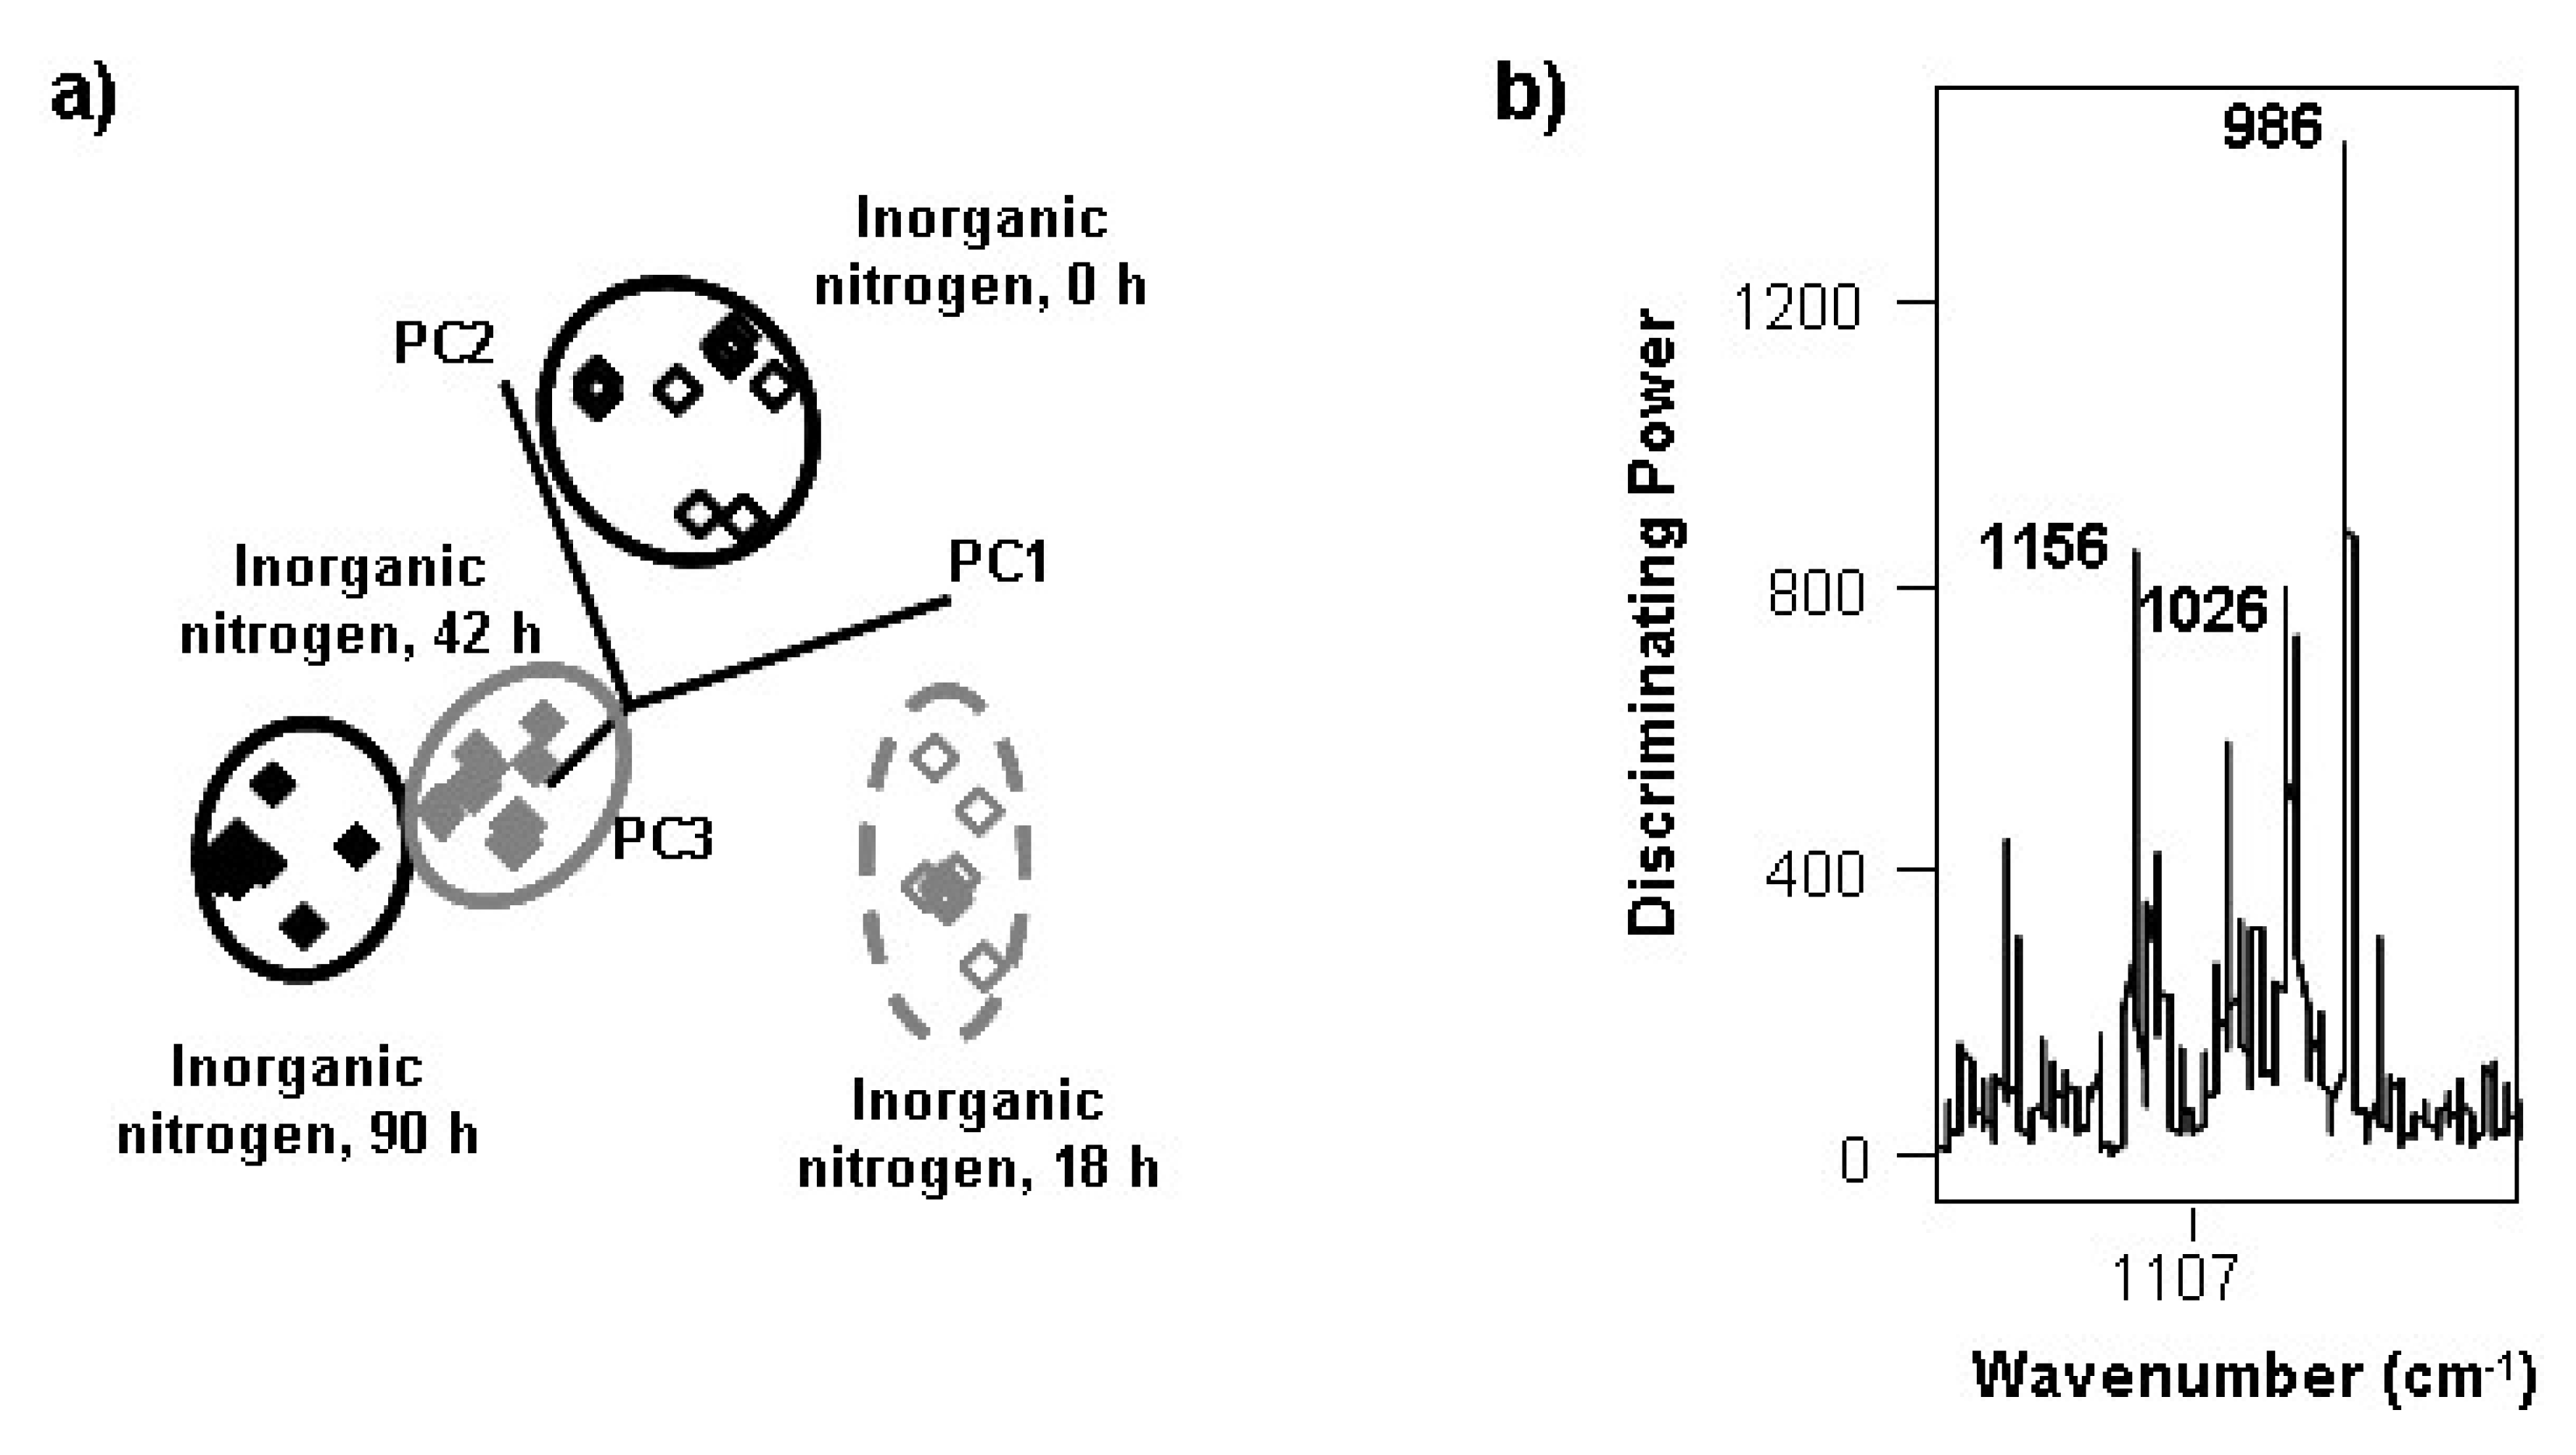
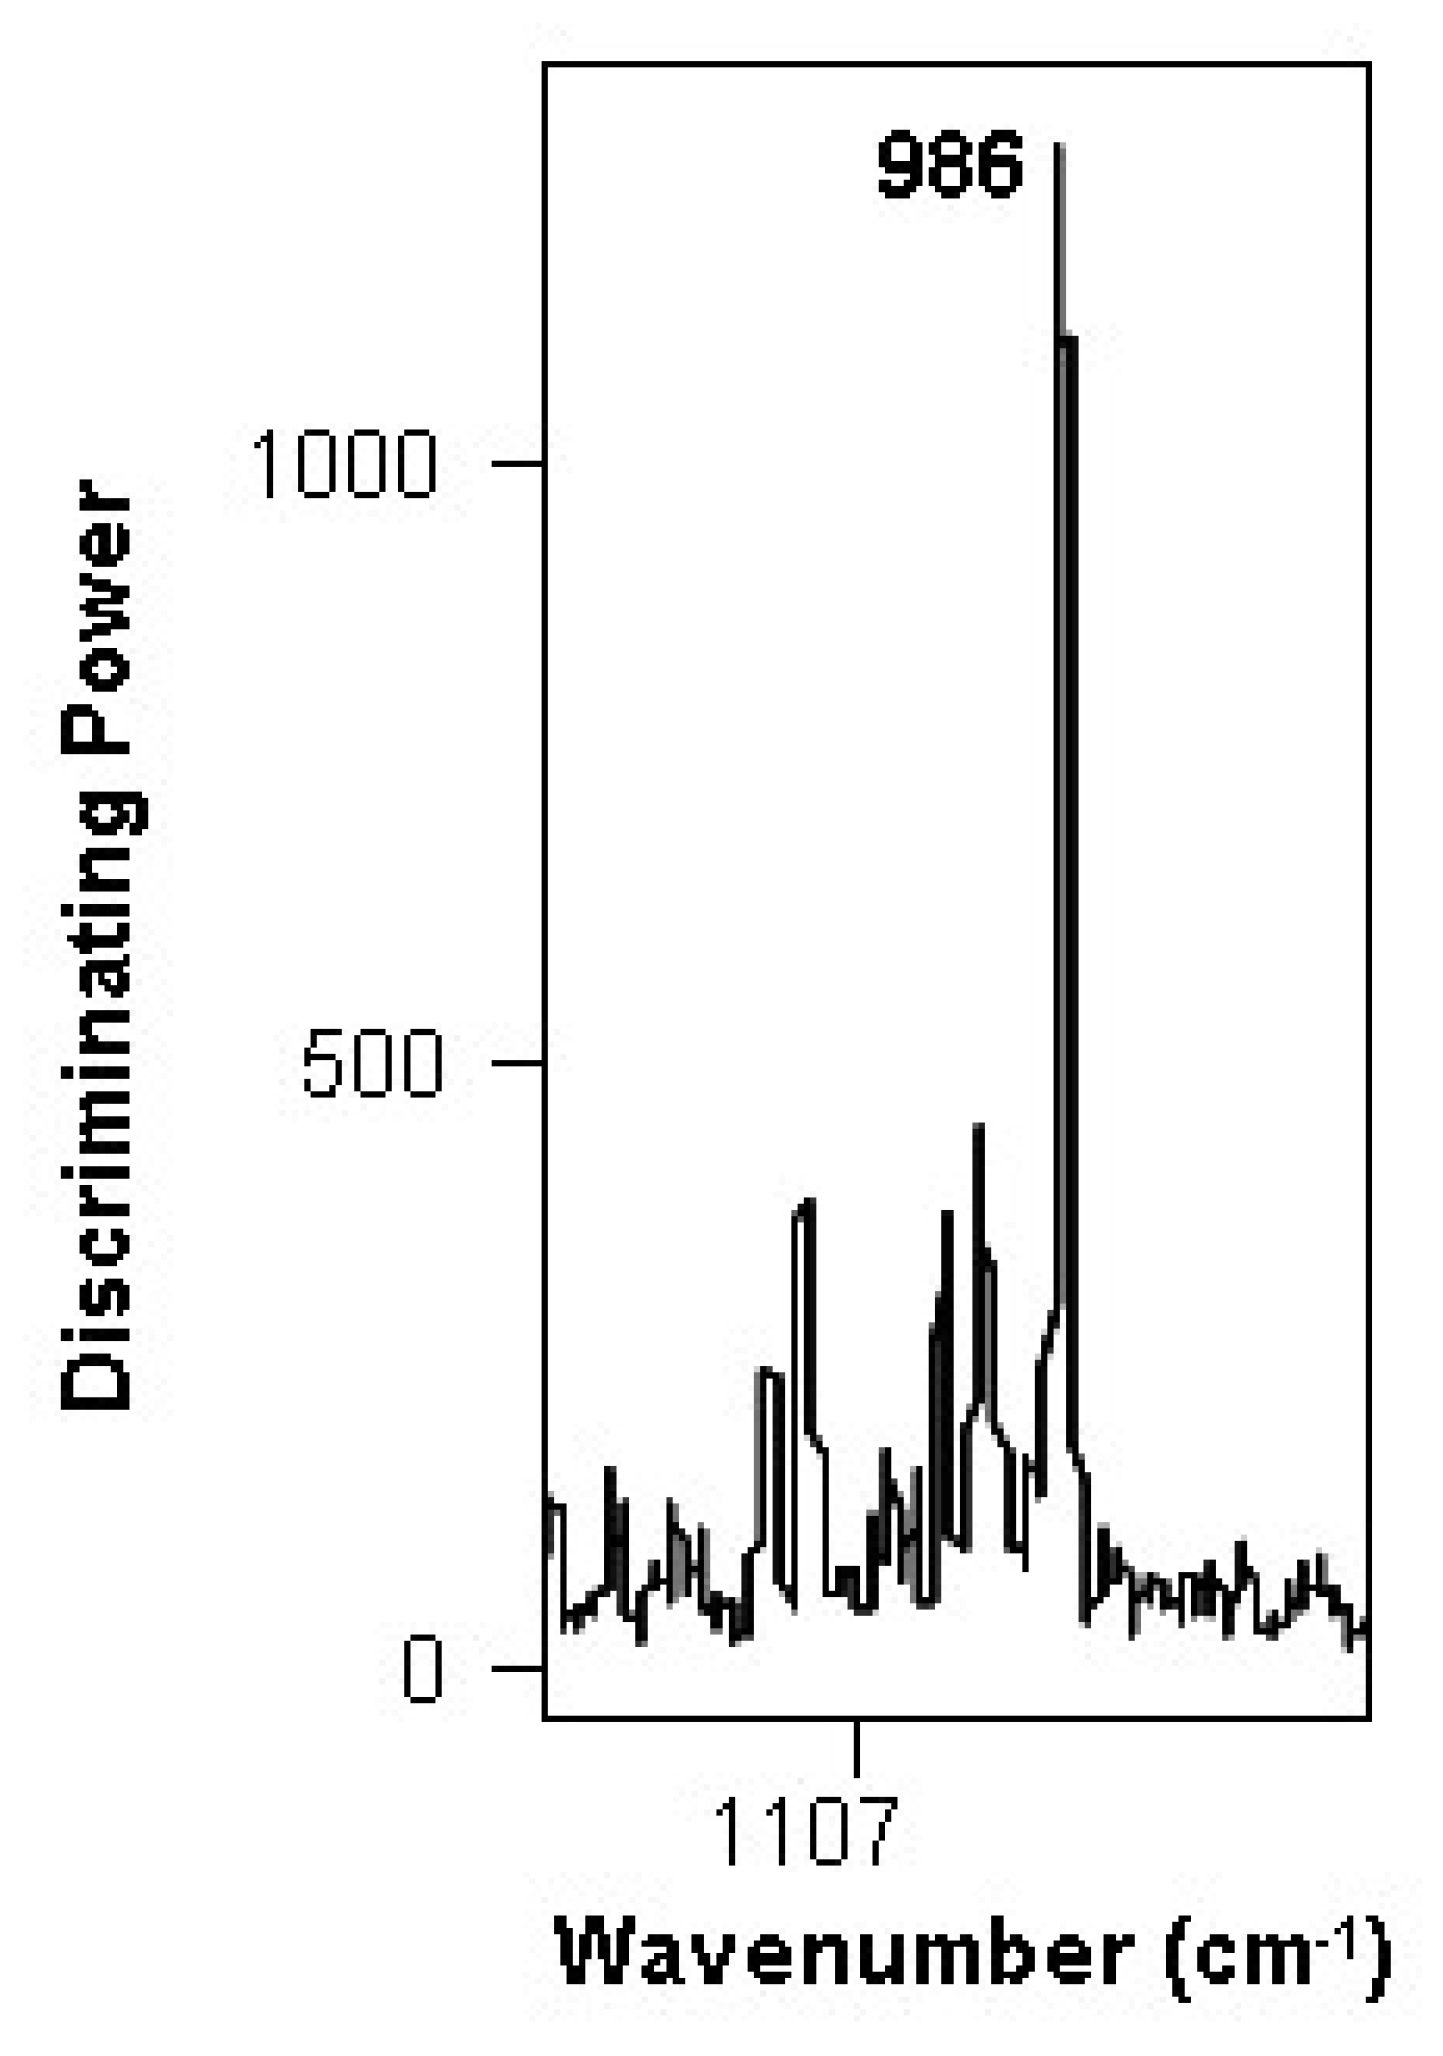
The class projections of SIMCA classification model of transformed spectra (1900–800 cm−1) of S. cerevisiae strain E491 fermented in Grenache blanc must with and without using an extra nitrogen source showed clear differentiation between non-fermented (0 h) and fermented S. cerevisiae cells at different fermentation times 18, 42, and 90 h (Figure 2a, Figure 3a and Figure 4a).
Interclass distances (ICD) values further proved these findings since, generally, ICD values above 3.0 are considered significant to discriminate two clusters of samples as a different class [33]. ICD values between non-fermented and fermented S. cerevisiae cells without extra nitrogen added, inorganic source and organic source of nitrogen (Table 4) varied from 4.4 to 22.4 showing different pattern of clustering between S. cerevisiae cells at early and exponential phase and at stationary phase. Moreover, S. cerevisiae cells cluster fermented for 18 h (early exponential phase) without and with nitrogen supplementation showed the highest values of ICD when was compared with the clusters of S. cerevisiae cells fermented for 42 h (exponential phase) and 90 h (stationary phase). For instance, in the case of Grenache blanc must supplemented with the organic source of nitrogen (Table 4) the ICD values of S. cerevisiae cells fermented for 18 h compared with S. cerevisiae cells fermented for 42 h and 90 h were 13.7 and 17.1, respectively. Nonetheless, when S. cerevisiae cells fermented for 42 h and 90 h were compared among them, the ICD value was 5.8 and 4.4 for inorganic and organic nitrogen sources, respectively. These results showed that the highest biochemical differences between S. cerevisiae cells happened when yeast cells were at early exponential phase in the three matrices tested. Discriminating power of S. cerevisiae cells non-fermented and fermented without and with nitrogen supplementation (Figure 2b, Figure 3b and Figure 4b) showed a common band at 986 cm−1 linked to β(1→6) glucans [31]. In the case of discriminating power of S. cerevisiae cells non-fermented and fermented with nitrogen supplementation (Figure 3b and Figure 4b), two secondary IR bands at 1026 and 1156 cm−1 may be linked to β(1→4) glucans and C-O, C-OH carbohydrates present in yeast cell wall [31]. According to a previous work made in our laboratory, the compounds mainly responsible of S. cerevisiae cells discrimination during the entirely fermentation were the mannoproteins, lipids, and RNA [32]. Moreover, it is important to mention that discrimination power values of 986 cm−1 band decreased with the supplementation of inorganic (2990 to 1432 units) and organic nitrogen (2990 to 1646 units) showing higher discrimination when S. cerevisiae cells were fermenting without nitrogen supplementation.
It was also important to study if it was possible to discriminate between S. cerevisiae cells fermented without and with nitrogen supplementation. For this purpose, SIMCA models were built up using IR data from non-fermented (0 h) and fermented S. cerevisiae cells (18, 42, and 90 h) without and with inorganic and organic nitrogen supplementation (data not shown). The distance between the clusters of non-fermented without and with nitrogen supplementation and fermented samples increased over the time of fermentation excepting for S. cerevisiae cells fermented for 42 h (exponential phase) with the addition of nitrogen and S. cerevisiae cells fermented for 90 h (stationary phase) with the addition of organic nitrogen (data not shown). In this case, ICD values of non-fermented and fermented S. cerevisiae cells without and with the supplementation of nitrogen varied from 1.6 to 19.1 (data not shown). In general, S. cerevisiae cells fermented without and with the addition of inorganic source of nitrogen were clearly differentiated at early (ICD 2.7), exponential (ICD 4.2) and at stationary phase (ICD 3.6). Nonetheless, S. cerevisiae cells fermented without and with the addition of organic nitrogen were only differentiated at exponential phase (ICD 2.8). When S. cerevisiae cells fermented with the supplementation of inorganic and organic sources of nitrogen were compared, just yeast cells fermented for 42 h (exponential phase) were different (ICD 3.1) and the lowest differences were shown at stationary phase (ICD 1.6). Moreover, S. cerevisiae cells cluster fermented for 18 h without and with the supplementation of nitrogen showed the highest values of ICD when was compared with the clusters of S. cerevisiae cells fermented for 42 h and 90 h (data not shown). This trend was also detected when SIMCA models of fermented S. cerevisiae cells without and with nutrient supplementation were built up separately (Figure 2a, Figure 3a and Figure 4a, and Table 4). Discriminating power (Figure 5) showed a unique IR band at 986 cm−1, mainly responsible of the biochemical differences between the compared samples. This band also played an important role on the differentiation of non-fermented and fermented S. cerevisiae cells when SIMCA models were built up separately. All the IR bands mainly responsible of the biochemical differences between the samples compared were related with compounds presents in the S. cerevisiae cell wall [34,35,36]. According to these results, supplementing the Grenache blanc must with inorganic and organic sources of nitrogen had an impact on the composition of the yeast cell wall, especially at early exponential phase related to the presence of β(1→6) glucans.
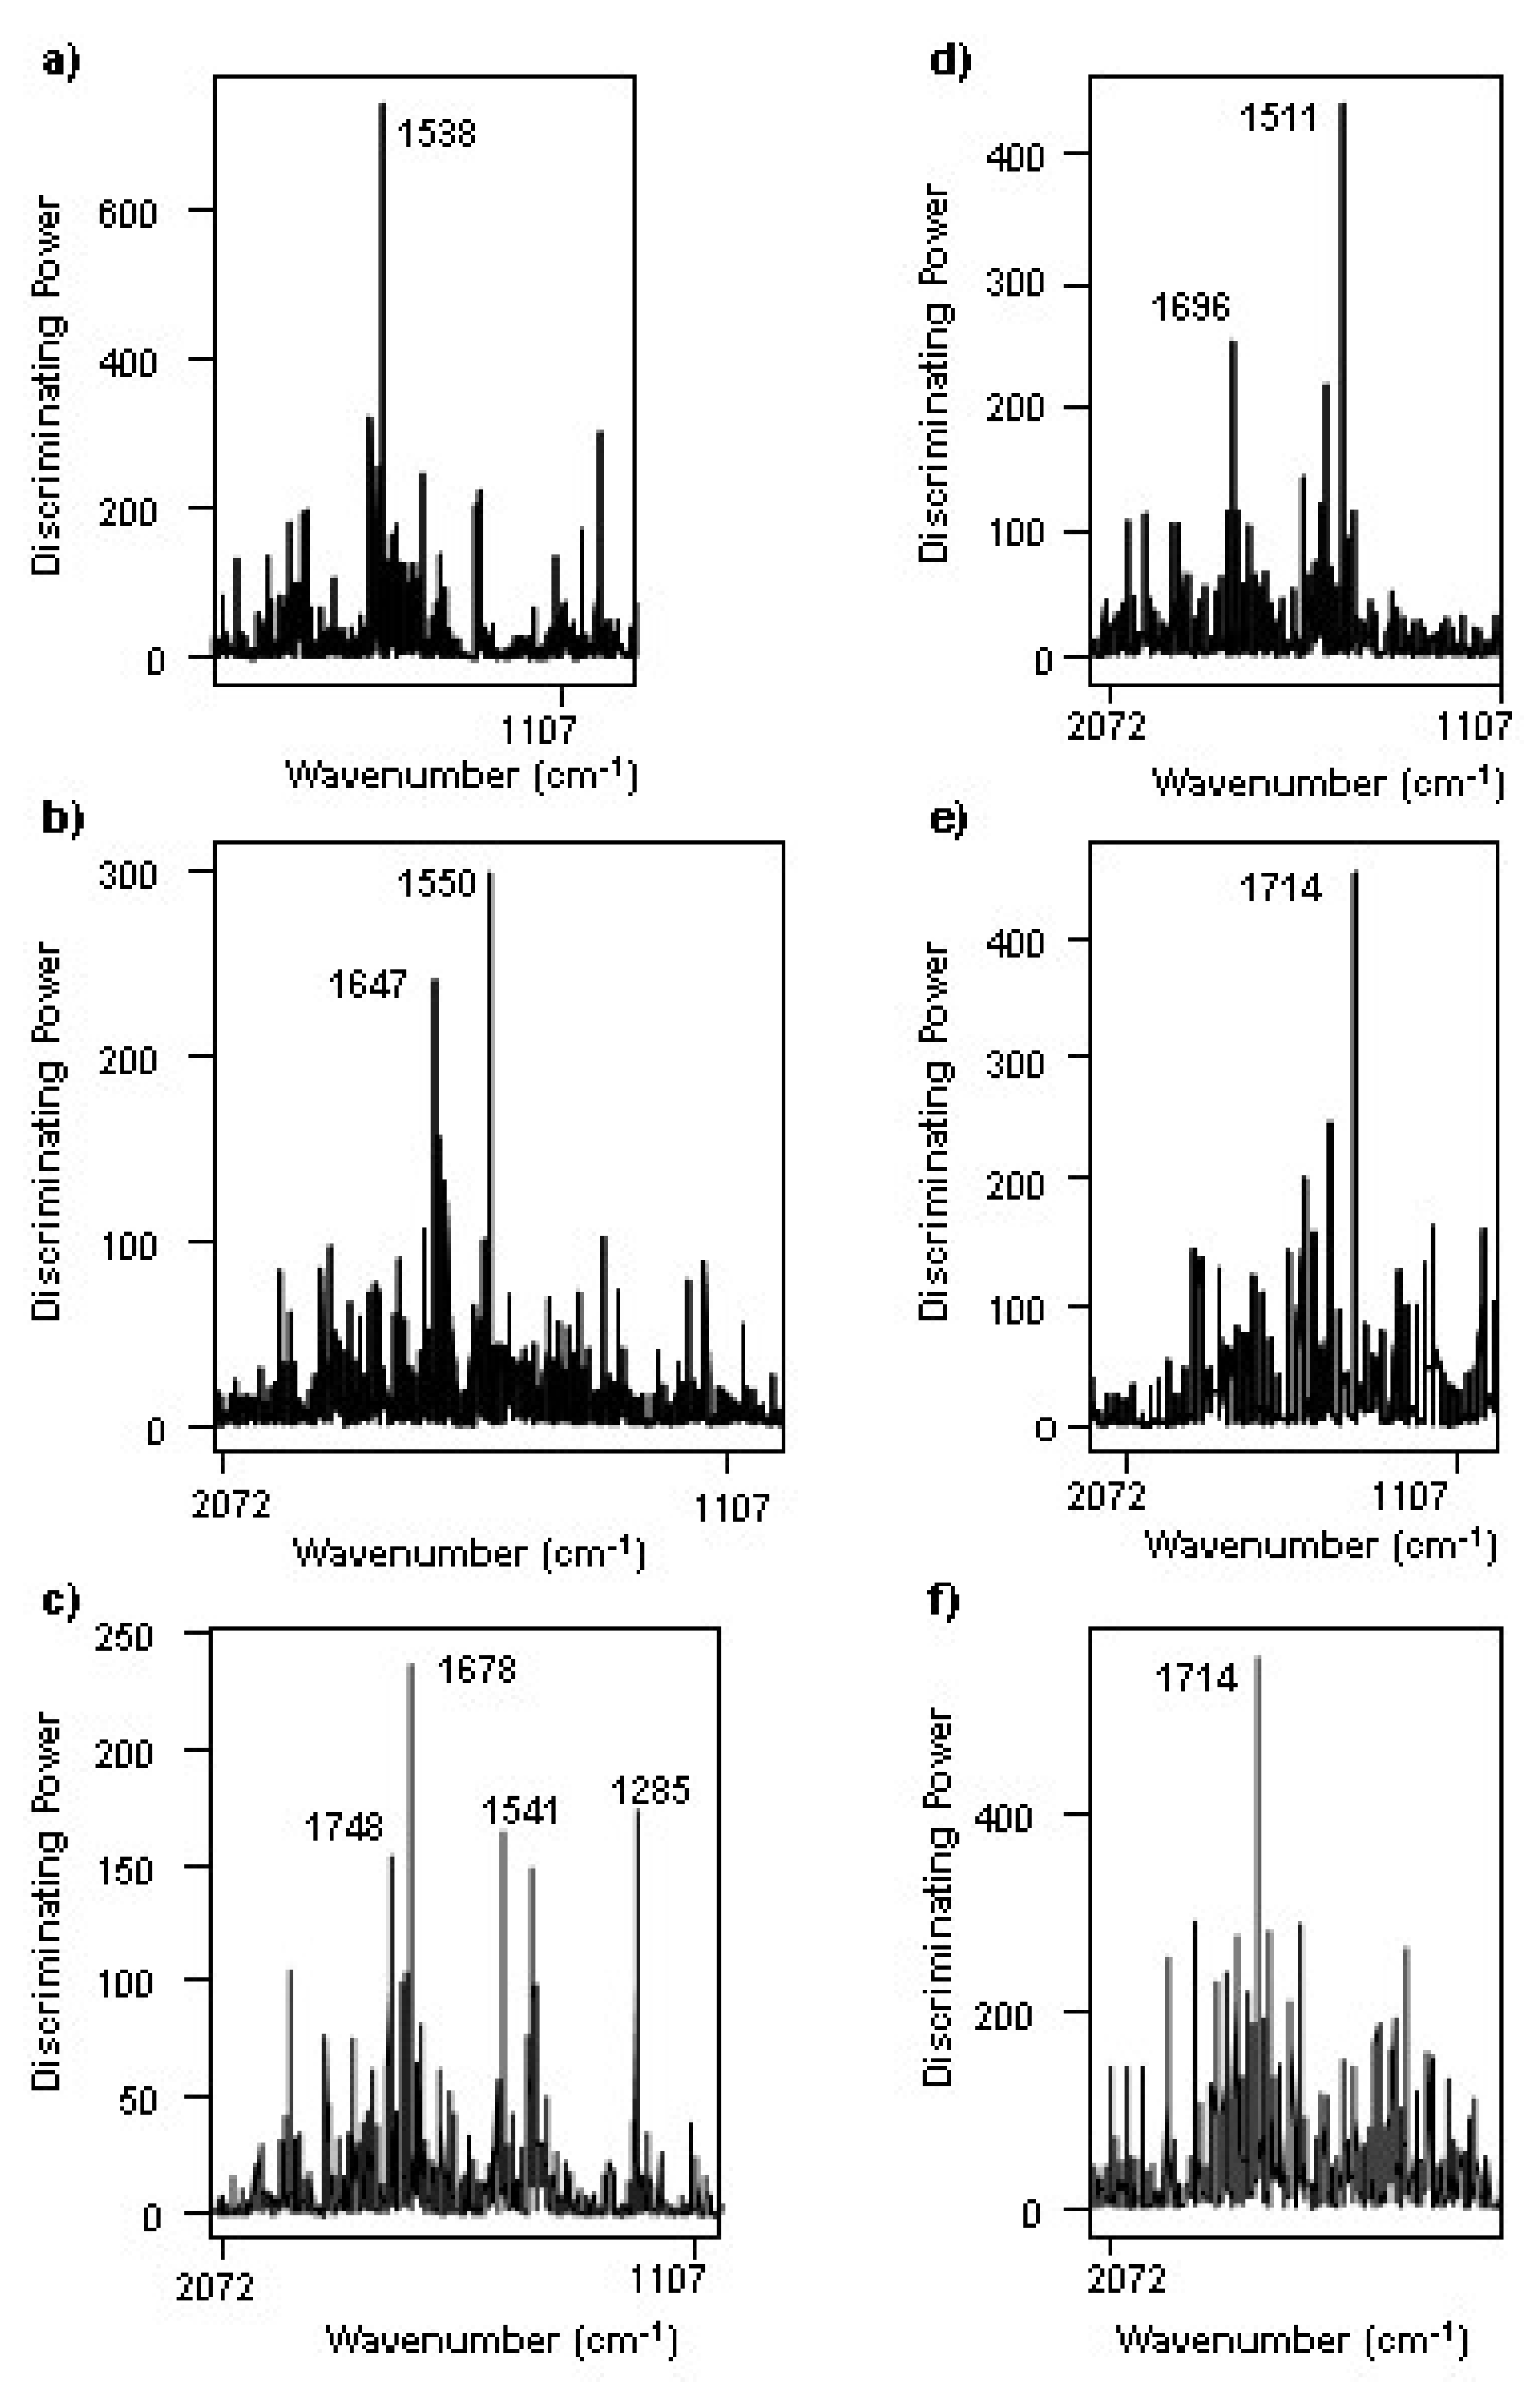
In this research it was also interesting to compare among fermented S. cerevisiae cells without and with nitrogen supplementation at early exponential (18 h), exponential phase (42 h) and stationary phase (90 h) to study the biochemical differences present in each physiological phase depending on the source of nitrogen used. At early exponential phase, clusters from fermented S. cerevisiae cells without (Control) and with inorganic (ICD 4.4) and organic (ICD 3.1) nitrogen supplementation were clearly separated (data not shown). The major discriminating bands observed when 2-classes SIMCA classification models were developed using transformed spectra from S. cerevisiae fermented without (Control) and with inorganic (Figure 6a) and organic (Figure 6d) sources of nitrogen were 1538 and 1511 cm−1, respectively. The IR bands at 1538 and 1511 cm−1 were related to amide II group vibrations of N-H and C-N bounds from peptides [31]. In addition to these major discriminating bands, there was a small contribution of amide I band resulting from antiparallel pleated sheets and β-turns of proteins at 1696 cm−1 [37] in the discrimination of S. cerevisiae fermented without (Control) and with organic (Figure 6d) nitrogen. In the case of S. cerevisiae cells at exponential phase (42 h) fermented without (Control) and with inorganic nitrogen (Figure 6b), the biochemical differences were also linked to IR bands (1550 and 1647 cm−1) related to different protein structures. Whereas, when SIMCA models were built up using IR data from S. cerevisiae cells fermented at exponential phase without (Control) and with organic nitrogen (Figure 6e), the discrimination among clusters was due to one IR band at 1714 cm−1 related to C-O stretching of carbonic acid or nucleic acids [37]. Finally, at stationary phase (90 h), S. cerevisiae cells fermented without (Control) and with inorganic nitrogen were mainly discriminated by IR bands related to protein structures (1678 and 1541 cm−1) and to asymmetric stretching of PO2 in RNA and phospholipids and lipid esters (1285 and 1748 cm−1) (Figure 6c). In the case of S. cerevisiae cells fermented at stationary phase without (Control) and with organic nitrogen (Figure 6f) a unique band at 1714 cm−1 linked to C-O stretching of carbonic acid or nucleic acids [37] was mainly responsible of their discrimination.
Summarizing these results, the supplementation of white musts with inorganic and organic nitrogen sources showed biochemical differences, especially when S. cerevisiae cells grown at exponential and stationary phase of the alcoholic fermentation. Some authors have described the relation between must nitrogen supplementation and the formation of ethyl esters from medium-chain fatty acids (MCFA) [38] derived from the metabolism of sugars and also amino acids by yeast [39,40,41]. The synthesis of MCFA ethyl esters is produced by of substrate availability and could be related to the relative increase of fatty acids synthesis due to nitrogen supplementation [38,42]. Other studies showed that the addition of organic nitrogen (mixture of amino acid and ammonium nitrogen) resulted in higher concentrations of MCFA ethyl esters that those samples supplemented with inorganic sources alone (ammonium salts) [13]. In contrast to these results, other authors have suggested that when a high total YAN concentration is naturally present in the grape must, the addition of amino acids can reduce ester concentration due to feedback inhibition suppressing amino acid uptake [43]. As other authors suggested, a relation between total nitrogen and the esters formation was observed [44,45] and the nature of the source of nitrogen used can influence the production of these compounds.

4. Conclusions

The combination of ATR-FTIR with chemometrics allowed studying the changes produced during alcoholic fermentation by the supplementation of different nitrogen sources. The feasibility of the use ATR-FTIR spectroscopy as a useful tool to monitor the changes during the white wine alcoholic fermentation produced by the nutrient supplementation has been demonstrated. The results obtained in this work will allow making decision during winemaking process related to the nutrients supplementation of musts. However, further studies should be done in order to evaluate this technique as a rapid tool on the detection of nitrogen deficiencies during fermentation.

Author Contributions

M.P.: data curation, writing—original draft preparation. I.A.: investigation, methodology, writing—original draft preparation. S.D.L.-C., R.F.-G.: supervision, writing—review and editing.

Acknowledgments

The authors would like to acknowledge AIRE program (2009AIRE/06) and Departament d’Enginyeria Química from Universitat Rovira i Virgili for their financial support and the Ministerio de Ciencia e Innovación, Proyecto PTQ-10-03144. Authors also thanks Proyecto IR-WINE ref. RTC-2015-4501-2 from Ministerio de Economía, Industria y Competitividad.

Conflicts of Interest

The authors declare no conflict of interest.

References

  1. Kamiloglu, S. Authenticity and traceability in beverages. Food Chem. 2019, 277, 12–24. [Google Scholar] [CrossRef] [PubMed]
  2. Dordevic, N.; Camin, F.; Marianella, R.M.; Postma, G.J.; Buydens, L.M.C.; Wehrens, R. Detecting the addition of sugar and water to wine. Aust. J. Grape Wine Res. 2013, 19, 324–330. [Google Scholar] [CrossRef]
  3. Alcalde-Eon, C.; Pérez-Mestre, C.; Ferreras-Charro, R.; Rivero, F.J.; Heredia, F.J.; Escribano-Bailón, M.T. Addition of Mannoproteins and/or Seeds during Winemaking and Their Effects on Pigment Composition and Color Stability. J. Agric. Food Chem. 2019, 67, 4031–4042. [Google Scholar] [CrossRef] [PubMed]
  4. Ferrer-Gallego, R.; Puxeu, M.; Nart, E.; Martín, L.; Andorrà, I. Evaluation of Tempranillo and Albariño SO2-free wines produced by different chemical alternatives and winemaking procedures. Food Res. Int. 2017, 102, 647–657. [Google Scholar] [CrossRef] [PubMed]
  5. Gao, Y.T.; Zhang, Y.S.; Wen, X.; Song, X.W.; Meng, D.; Li, B.J.; Wang, M.Y.; Tao, Y.Q.; Zhao, H.; Guan, W.Q.; et al. The glycerol and ethanol production kinetics in low-temperature wine fermentation using Saccharomyces cerevisiae yeast strains. Int. J. Food Sci. Technol. 2019, 54, 102–110. [Google Scholar] [CrossRef]
  6. Miller, K.V.; Oberholster, A.; Block, D.E. Predicting the impact of red winemaking practices using a reactor engineering model. Am. J. Enol. Vitic. 2019, 70, 162–168. [Google Scholar] [CrossRef]
  7. Ortiz-Tovar, G.; Minebois, R.; Barrio, E.; Querol, A.; Pérez-Torrado, R. Aroma production and fermentation performance of S. cerevisiae × S. kudriavzevii natural hybrids under cold oenological conditions. Int. J. Food Microbiol. 2019, 297, 51–59. [Google Scholar] [CrossRef] [PubMed]
  8. Bell, S.J.; Henschke, P.A. Implications of nitrogen nutrition for grapes, fermentation and wine. Aust. J. Grape Wine Res. 2005, 11, 242–295. [Google Scholar] [CrossRef]
  9. Bely, M.; Sablayrolles, J.M.; Barre, P. Description of alcoholic fermentation kinetics: Its variability and significance. Am. J. Enol. Vitic. 1990, 41, 319–324. [Google Scholar]
  10. Bezenger, M.-C.; Navarro, J.-M. Alcoholic fermentation: Model accounting for initial nitrogen influence. Biotechnol. Bioeng. 1988, 31, 747–749. [Google Scholar] [CrossRef]
  11. Manginot, C.; Roustan, J.L.; Sablayrolles, J.M. Nitrogen demand of different yeast strains during alcoholic fermentation. Importance of the stationary phase. Enzym. Microb. Technol. 1998, 23, 511–517. [Google Scholar] [CrossRef]
  12. Amerine, M.A.; Berg, H.W.; Kunkee, R.E.; Ough, C.S.; Singleton, V.L.; Webb, A.D. The Technology of Wine Making, 4th ed.; AVI Publishing Co.: Westport, CT, USA, 1980. [Google Scholar]
  13. Torrea, D.; Varela, C.; Ugliano, M.; Ancin-Azpilicueta, C.; Leigh Francis, I.; Henschke, P.A. Comparison of inorganic and organic nitrogen supplementation of grape juice—Effect on volatile composition and aroma profile of a Chardonnay wine fermented with Saccharomyces cerevisiae yeast. Food Chem. 2011, 127, 1072–1083. [Google Scholar] [CrossRef] [PubMed]
  14. Gobert, A.; Tourdot-Maréchal, R.; Sparrow, C.; Morge, C.; Alexandre, H. Influence of nitrogen status in wine alcoholic fermentation. Food Microbiol. 2019, 83, 71–85. [Google Scholar] [CrossRef] [PubMed]
  15. Jiranek, V.; Langridge, P.; Henschke, P.A. Amino acid and ammonium Utilization by Saccharomyces cerevisiae wine yeasts from a chemically defined medium. Am. J. Enol. Vitic. 1995, 46, 75–83. [Google Scholar]
  16. Bisson, L.F. Stuck and sluggish fermentations. Am. J. Enol. Vitic. 1999, 50, 107–119. [Google Scholar]
  17. Spiropoulos, A.; Tanaka, J.; Flerianos, I.; Bisson, L.F. Characterization of Hydrogen Sulfide Formation in Commercial and Natural Wine Isolates of Saccharomyces. Am. J. Enol. Vitic. 2000, 51, 233–248. [Google Scholar]
  18. Bely, M.; Sablayrolles, J.M.; Barre, P. Automatic detection of assimilable nitrogen deficiencies during alcoholic fermentation in oenological conditions. J. Ferment. Bioeng. 1990, 70, 246–252. [Google Scholar] [CrossRef]
  19. Sablayrolles, J.-M.; Dubois, C.; Manginot, C.; Roustan, J.-L.; Barre, P. Effectiveness of combined ammoniacal nitrogen and oxygen additions for completion of sluggish and stuck wine fermentations. J. Ferment. Bioeng. 1996, 82, 377–381. [Google Scholar] [CrossRef]
  20. Vilanova, M.; Siebert, T.E.; Varela, C.; Pretorius, I.S.; Henschke, P.A. Effect of ammonium nitrogen supplementation of grape juice on wine volatiles and non-volatiles composition of the aromatic grape variety Albariño. Food Chem. 2012, 133, 124–131. [Google Scholar] [CrossRef]
  21. Bely, M.; Salmon, J.M.; Barre, P. Assimilable nitrotgen addition and hexose transport system activity during enological fermentation. J. Inst. Brew. 1994, 100, 279–282. [Google Scholar] [CrossRef]
  22. Bisson, L.F. Influence of nitrogen on yeast and fermentation of grapes. In Proceedings of the International Symposium on Nitrogen in Grapes and Wine, Seattle, WA, USA, 18–19 June 1991; pp. 78–89. [Google Scholar]
  23. Seguinot, P.; Rollero, S.; Sanchez, I.; Sablayrolles, J.M.; Ortiz-Julien, A.; Camarasa, C.; Mouret, J.R. Impact of the timing and the nature of nitrogen additions on the production kinetics of fermentative aromas by Saccharomyces cerevisiae during winemaking fermentation in synthetic media. Food Microbiol. 2018, 76, 29–39. [Google Scholar] [CrossRef] [PubMed]
  24. OIV. List of OIV Admitted Compounds and Their Status as Additives and Processing Aids and the Use Levels or Residual Limits; OIV: Paris, France, 2017. [Google Scholar]
  25. Aleixandre-Tudo, J.L.; Nieuwoudt, H.; Aleixandre, J.L.; du Toit, W. Chemometric compositional analysis of phenolic compounds in fermenting samples and wines using different infrared spectroscopy techniques. Talanta 2018, 176, 526–536. [Google Scholar] [CrossRef] [PubMed]
  26. OIV. Compendium of International Methods of Wine and Must Analysis; OIV-MA-ANNEX-C; OIV: Paris, France, 2016; Volume 2, p. 2. [Google Scholar]
  27. Ricardo-da-Silva, J.M.; Cheynier, V.; Samsom, A.; Bourzeix, M. Effect of Pomace Contact, Carbonic Maceration, and Hyperoxidation on the Procyanidin Composition of Grenache blanc Wines. Am. J. Enol. Vitic. 1993, 44, 168–172. [Google Scholar]
  28. Bisson, L.F.; Butzke, C.E. Diagnosis and rectification of stuck and sluggish fermentations. Am. J. Enol. Vitic. 2000, 51, 168–177. [Google Scholar]
  29. Gobbi, M.; Comitini, F.; D’Ignazi, G.; Ciani, M. Effects of nutrient supplementation on fermentation kinetics, H2S evolution, and aroma profile in Verdicchio DOC wine production. Eur. Food Res. Technol. 2013, 236, 145–154. [Google Scholar] [CrossRef]
  30. Sockalingum, G.D.; Manfait, M.; Belarbi, A.; Galichet, A. FTIR spectroscopic analysis of Saccharomyces cerevisiae cell walls: Study of an anomalous strain exhibiting a pink-colored cell phenotype. FEMS Microbiol. Lett. 2001, 197, 179–186. [Google Scholar] [CrossRef]
  31. Cavagna, M.; Dell’Anna, R.; Monti, F.; Rossi, F.; Torriani, S. Use of ATR-FTIR Microspectroscopy to Monitor Autolysis of Saccharomyces cerevisiae Cells in a Base Wine. J. Agric. Food Chem. 2010, 58, 39–45. [Google Scholar] [CrossRef] [PubMed]
  32. Puxeu, M.; Andorra, I.; De Lamo-Castellví, S. Monitoring Saccharomyces cerevisiae Grape Must Fermentation Process by Attenuated Total Reflectance Spectroscopy. Food Bioprocess Technol. 2015, 8, 637–646. [Google Scholar] [CrossRef]
  33. Dunn, W.J.; Wold, S. SIMCA Pattern Recognition and Classification. In Chemometric Methods in Molecular Design; van de Waterbeemd, H., Ed.; VCH Publishers, Inc: New York, NY, USA, 1995; Volume 1, pp. 179–193. [Google Scholar]
  34. Hellingwerf, K.; Mol, P.; Klis, F.M.; Brul, S. Dynamics of cell wall structure in Saccharomyces cerevisiae. FEMS Microbiol. Rev. 2002, 26, 239–256. [Google Scholar] [CrossRef]
  35. Kapteyn, J.C.; Van Den Ende, H.; Klis, F.M. The contribution of cell wall proteins to the organization of the yeast cell wall. Biochim. Biophys. Acta Gen. Subj. 1999, 1426, 373–383. [Google Scholar] [CrossRef]
  36. Klis, F.M.; Boorsma, A.; De Groot, P.W.J. Cell wall construction in Saccharomyces cerevisiae. Yeast 2006, 23, 185–202. [Google Scholar] [CrossRef] [PubMed]
  37. Maquelin, K.; Kirschner, C.; Choo-Smith, L.P.; van den Braak, N.; Endtz, H.P.; Naumann, D.; Puppels, G.J. Identification of medically relevant microorganisms by vibrational spectroscopy. J. Microbiol. Methods 2002, 51, 255–271. [Google Scholar] [CrossRef]
  38. Saerens, S.M.G.; Verstrepen, K.J.; Van Laere, S.D.M.; Voet, A.R.D.; Van Dijck, P.; Delvaux, F.R.; Thevelein, J.M. The Saccharomyces cerevisiae EHT1 and EEB1 genes encode novel enzymes with medium-chain fatty acid ethyl ester synthesis and hydrolysis capacity. J. Biol. Chem. 2006, 281, 4446–4456. [Google Scholar] [CrossRef] [PubMed]
  39. Boido, E.; Medina, K.; Farina, L.; Carrau, F.M.; Henschke, P.A.; Dellacassa, E. Production of fermentation aroma compounds by Saccharomyces cerevisiae wine yeasts: Effects of yeast assimilable nitrogen on two model strains. FEMS Yeast Res. 2008, 8, 1196–1207. [Google Scholar] [CrossRef]
  40. Lilly, M.; Lambrechts, M.G.; Pretorius, I.S. Effect of Increased Yeast Alcohol Acetyltransferase Activity on Flavor Profiles of Wine and Distillates. Appl. Environ. Microbiol. 2000, 66, 744–753. [Google Scholar] [CrossRef] [PubMed] [Green Version]
  41. Swiegers, J.H.; Pretorius, I.S. Yeast Modulation of Wine Flavor. Adv. Appl. Microbiol. 2005, 57, 131–175. [Google Scholar] [PubMed]
  42. Saerens, S.M.G.; Delvaux, F.; Verstrepen, K.J.; Van Dijck, P.; Thevelein, J.M.; Delvaux, F.R. Parameters Affecting Ethyl Ester Production by Saccharomyces cerevisiae during Fermentation. Appl. Environ. Microbiol. 2008, 74, 454–461. [Google Scholar] [CrossRef] [PubMed]
  43. Miller, A.C.; Wolff, S.R.; Bisson, L.F.; Ebeler, S.E. Yeast Strain and Nitrogen Supplementation: Dynamics of Volatile Ester Production in Chardonnay Juice Fermentations. Am. J. Enol. Vitic. 2007, 58, 470–483. [Google Scholar]
  44. Ugliano, M.; Siebert, T.; Mercurio, M.; Capone, D.; Henschke, P.A. Volatile and Color Composition of Young and Model-Aged Shiraz Wines as Affected by Diammonium Phosphate Supplementation before Alcoholic Fermentation. J. Agric. Food Chem. 2008, 56, 9175–9182. [Google Scholar] [CrossRef]
  45. Vilanova, M.; Ugliano, M.; Varela, C.; Siebert, T.; Pretorius, I.S.; Henschke, P.A. Assimilable nitrogen utilisation and production of volatile and non-volatile compounds in chemically defined medium by Saccharomyces cerevisiae wine yeasts. Appl. Microbiol. Biotechnol. 2007, 77, 145–157. [Google Scholar] [CrossRef]
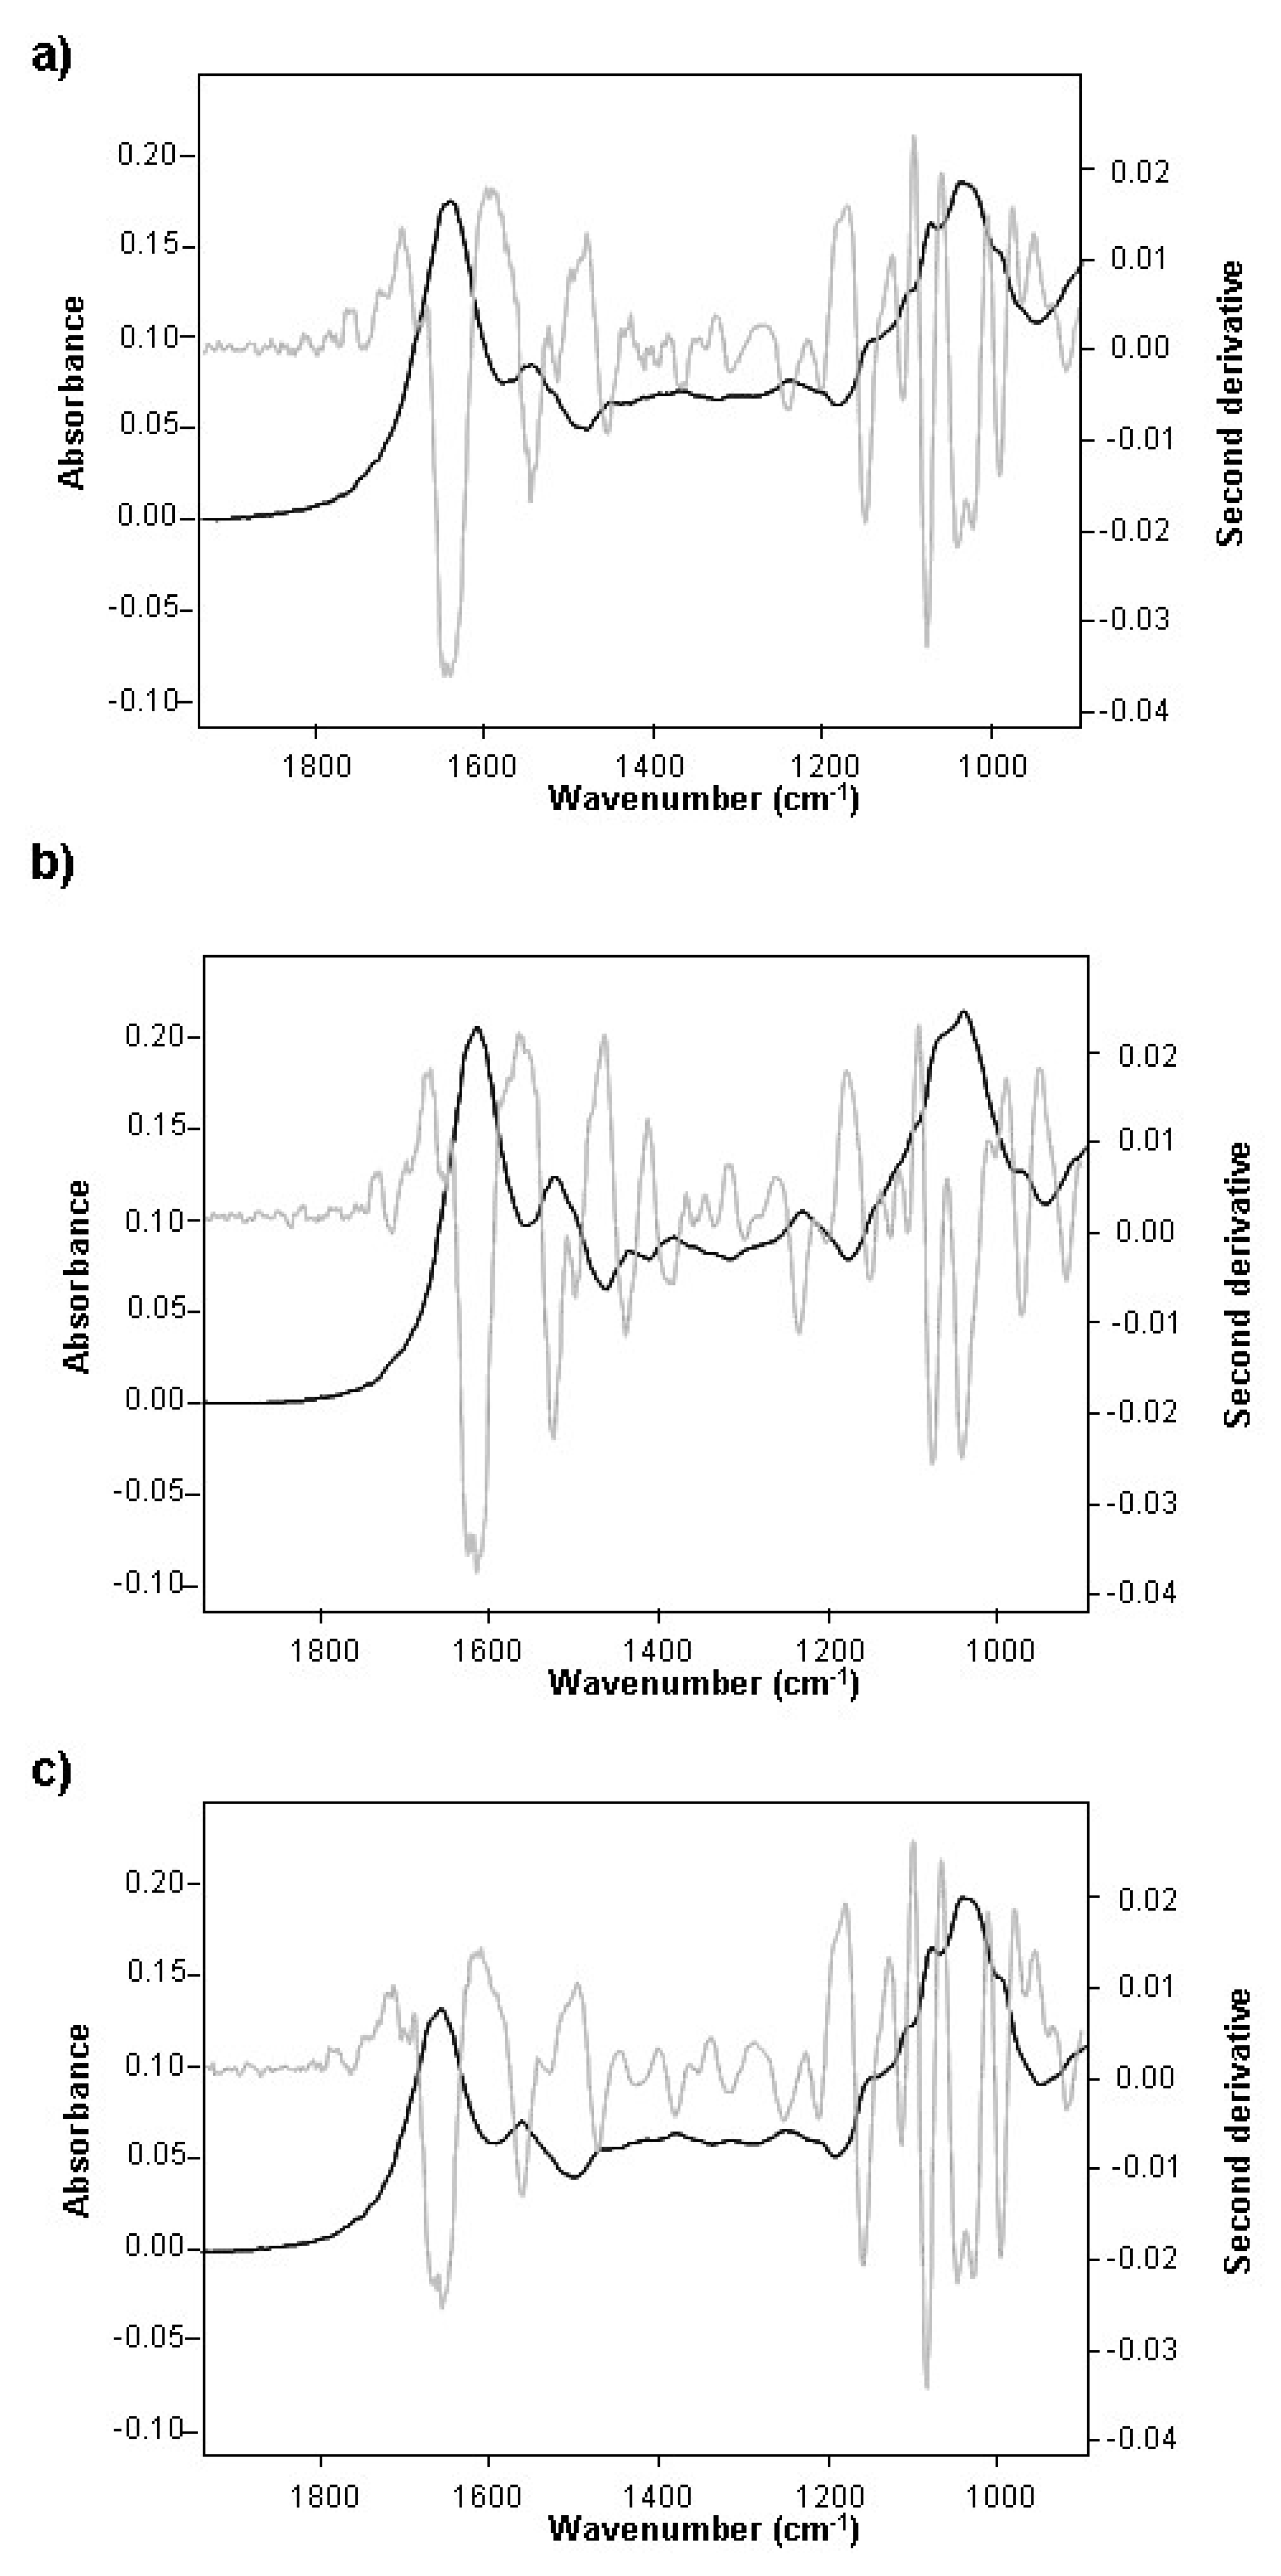
Figure 1. Representative ATR-FTIR spectra (in black) and the second derivative (in grey) of S. cerevisiae strain ES491 fermented for 18 h without (a) and with a source of inorganic (b) and organic (c) nitrogen. The spectra were taken with a zinc selenide crystal accessory in reflectance mode.
Fermentation 05 00058 g001
Figure 2. Soft independent modeling class analogy (SIMCA) of class projections (a) and discriminating power (b) of transformed (second derivative, 15 points window) attenuated total reflectance infrared spectroscopy spectra of S. cerevisiae strain E491 fermented in Grenache must without nitrogen supplementation (Control) for 0, 18, 42, and 90 h.
Fermentation 05 00058 g002
Figure 3. Soft independent modeling class analogy (SIMCA) of class projections (a) and discriminating power (b) of transformed (second derivative, 15 points window) attenuated total reflectance infrared spectroscopy spectra of S. cerevisiae strain E491 fermented in Grenache must with supplementation of inorganic source of nitrogen for 0, 18, 42, and 90 h.
Fermentation 05 00058 g003
Figure 4. Soft independent modeling class analogy (SIMCA) of class projections (a) and discriminating power (b) of transformed (second derivative, 15 points window) attenuated total reflectance infrared spectroscopy spectra of S. cerevisiae strain E491 fermented in Grenache must with supplementation of organic source of nitrogen for 0, 18, 42, and 90 h.
Fermentation 05 00058 g004
Figure 5. Soft independent modeling of class analogy (SIMCA) of discriminating power of S. cerevisiae E491 strain fermented in Grenache must for 0, 18, 42, and 90 h without and with inorganic and organic nitrogen supplementation.
Fermentation 05 00058 g005
Figure 6. Soft independent modeling class analogy (SIMCA) of discriminating power of transformed (second derivative, 15 points window) attenuated total reflectance infrared spectroscopy spectra of S. cerevisiae strain E491 fermented in Grenache must without and with inorganic nitrogen for 18 h (a), 42 h (b), and 90 h (c) and without and with organic nitrogen for 18 h (d), 42 h (e), and 90 h (f).
Fermentation 05 00058 g006
Table 1. Enological parameters of the “Grenache Blanc” grape juice.
Initial MustMean ± SD
Brix degree (°Bx)20.3 ± 0.2
Alcoholic potential strength (% vol.)11.8 ± 0.2
YAN (mg/L)170 ± 6
pH3.1 ± 0.1
Total acidity (g/L)5.5 ± 0.1
Turbidity (NTU *)18 ± 2
Press yield (%)54 ± 0.7
Clarification yield (%)81 ± 0.8
Different upper-case letter superscripts differ significantly at p < 0.05. * Nephelometric Turbidity Units.
Table 2. Acetic acid and alcohol content of wines.
WinesAcetic Acid (g/L)Alcohol (% vol.)
Control0.42 ± 0.03 a12.1 ± 0.1 b
Inorganic nitrogen0.38 ± 0.02 a12.3 ± 0.1 a
Organic nitrogen0.40 ± 0.02 a12.3 ± 0.1 a
Different upper-case letter superscripts differ significantly at p < 0.05.
Table 3. Sugar content of must-wine (g/L) at different fermentation times (18, 42, and 90 h).
Treatment18 h42 h90 h
Control162.1 ±1.5 a71.6 ± 1.5 c1.7 ± 0.5 e
Inorganic nitrogen164.7 ±1.5 ab56.0 ± 1.5 d0.0 ± 0.0 f
Organic nitrogen161.2 ± 0.7 b57.8 ± 1.5 d0.0 ± 0.0 f
Different upper-case letter superscripts differ significantly at p < 0.05.
Table 4. Soft independent modeling of class analogy (SIMCA) of interclass distance of transformed (second derivative, 15 points window) attenuated total reflectance infrared spectroscopy spectra of S. cerevisiae E491 strain fermented in Grenache must with and without inorganic and organic nitrogen supplementation for 0, 18, 42, and 90 h.
Control0 h18 h42 h90 h
0 h0.0
18 h13.30.0
42 h10.315.60.0
90 h16.022.46.20.0
Inorganic nitrogen0 h18h42h90 h
0 h0.0
18 h7.90.0
42 h7.013.90.0
90 h9.516.35.80.0
Organic nitrogen0 h18 h42 h90 h
0 h0.0
18 h4.70.0
42 h9.513.70.0
90 h11.717.14.40.0