Comparison of Different Extraction Methods to Predict Anthocyanin Concentration and Color Characteristics of Red Wines


Abstract
:
1. Introduction
2. Materials and Methods
2.1. Winemaking
2.1.1. Grapes
2.1.2. Small Scale Fermentations
2.2. Extraction Methods
2.2.1. Solvent Based Extraction of Grape Skins
2.2.2. Microwave Assisted Extraction
2.2.3. Ultrasound Assisted Extraction
2.2.4. ITV Standard Extraction Method
2.2.5. AWRI Based Extraction Method
2.2.6. Glorie Extraction Assay
2.3. Analytical Tools
2.3.1. Photometric Quantification of Polyphenols and Anthocyanins
2.3.2. Berry, Juice, and Wine Analyses
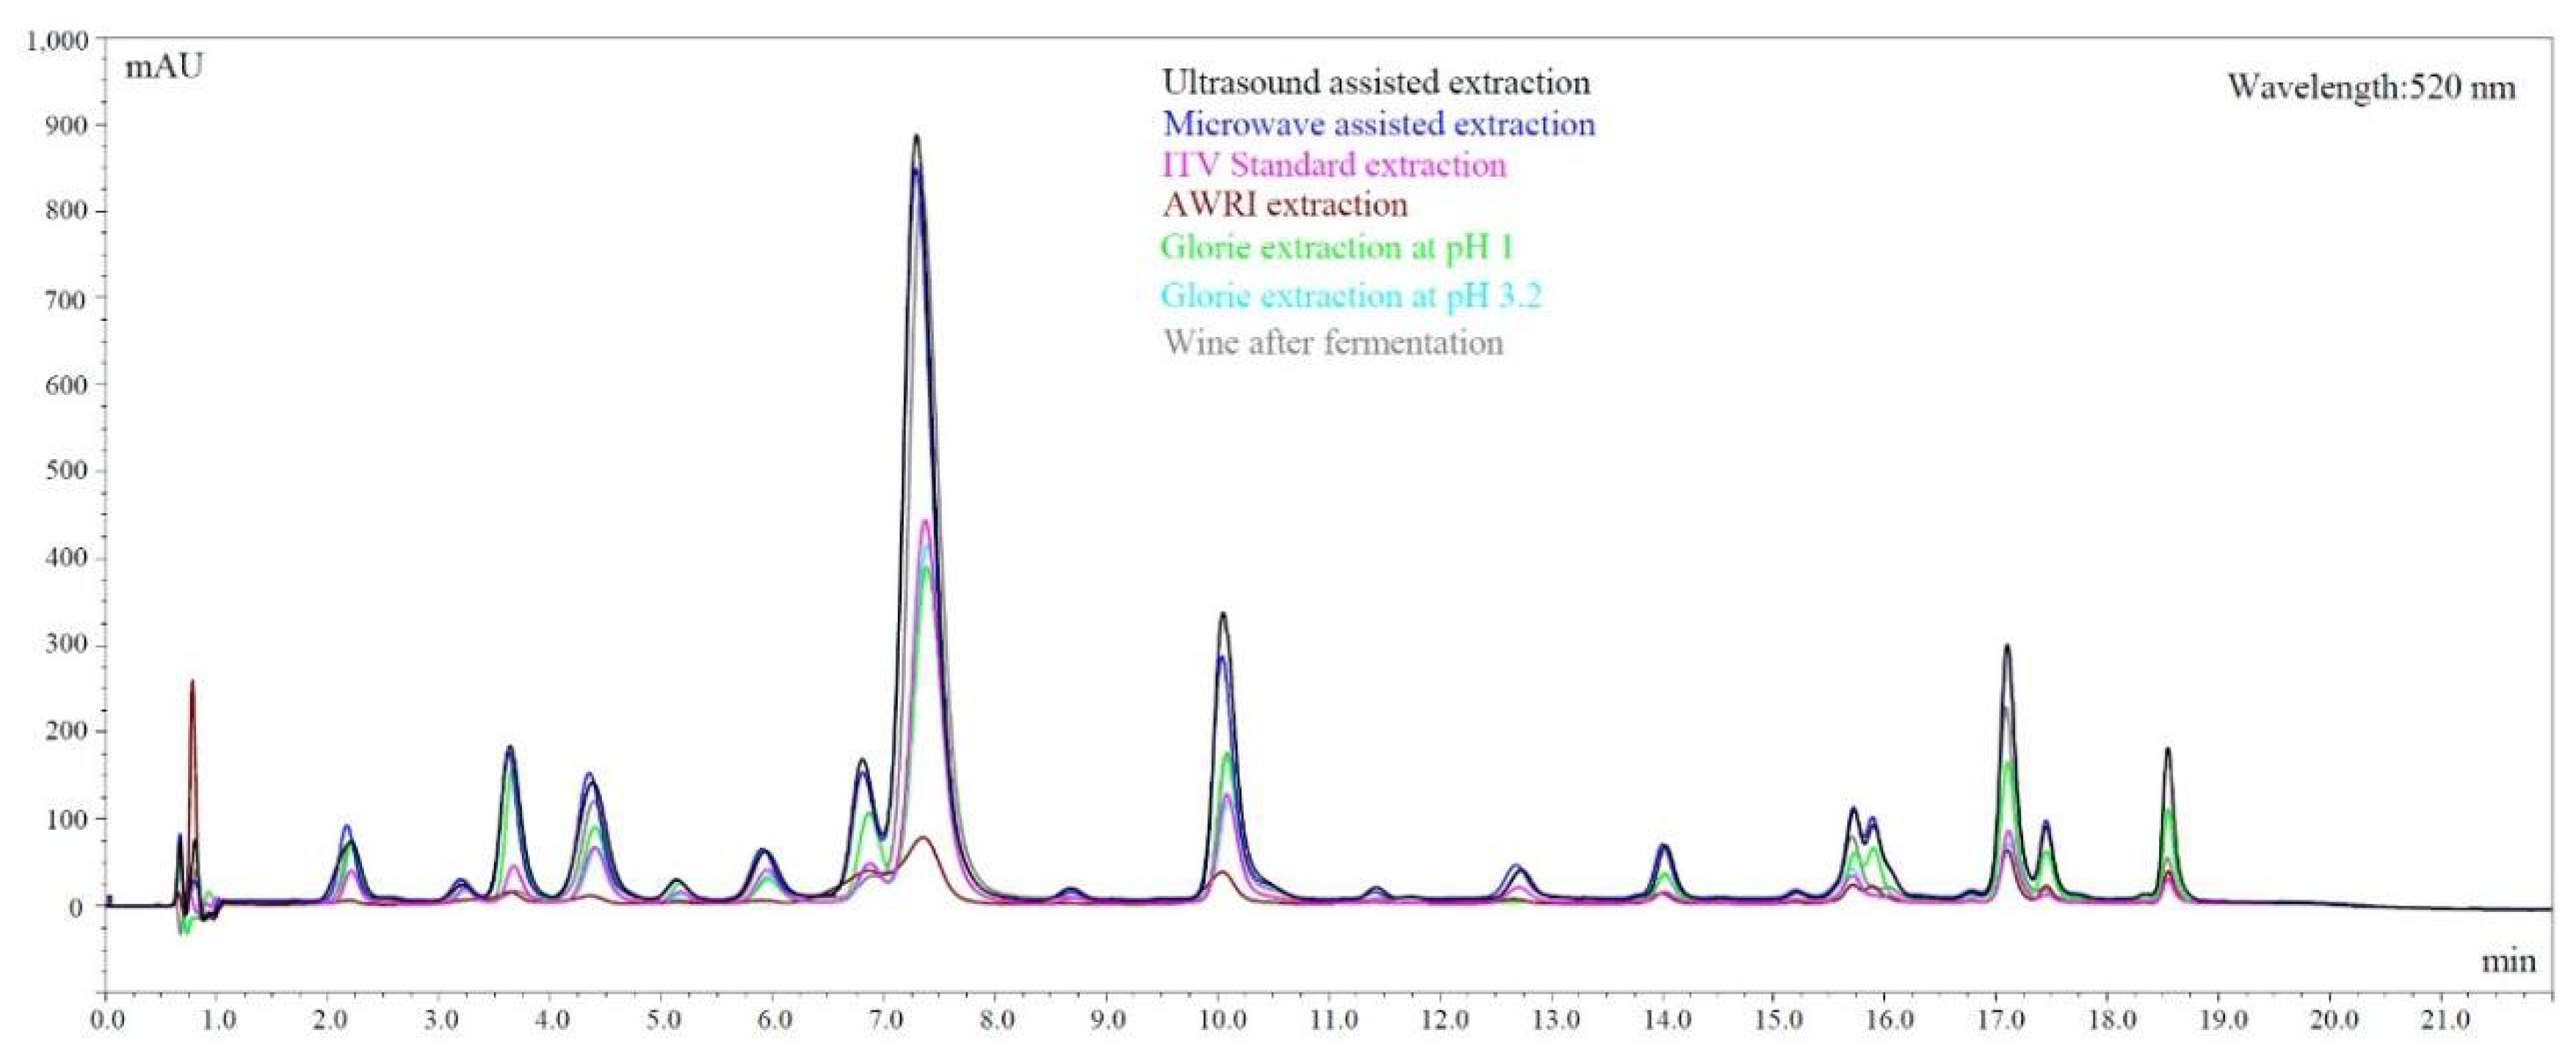
2.3.3. Analysis of Anthocyanins by LC-DAD
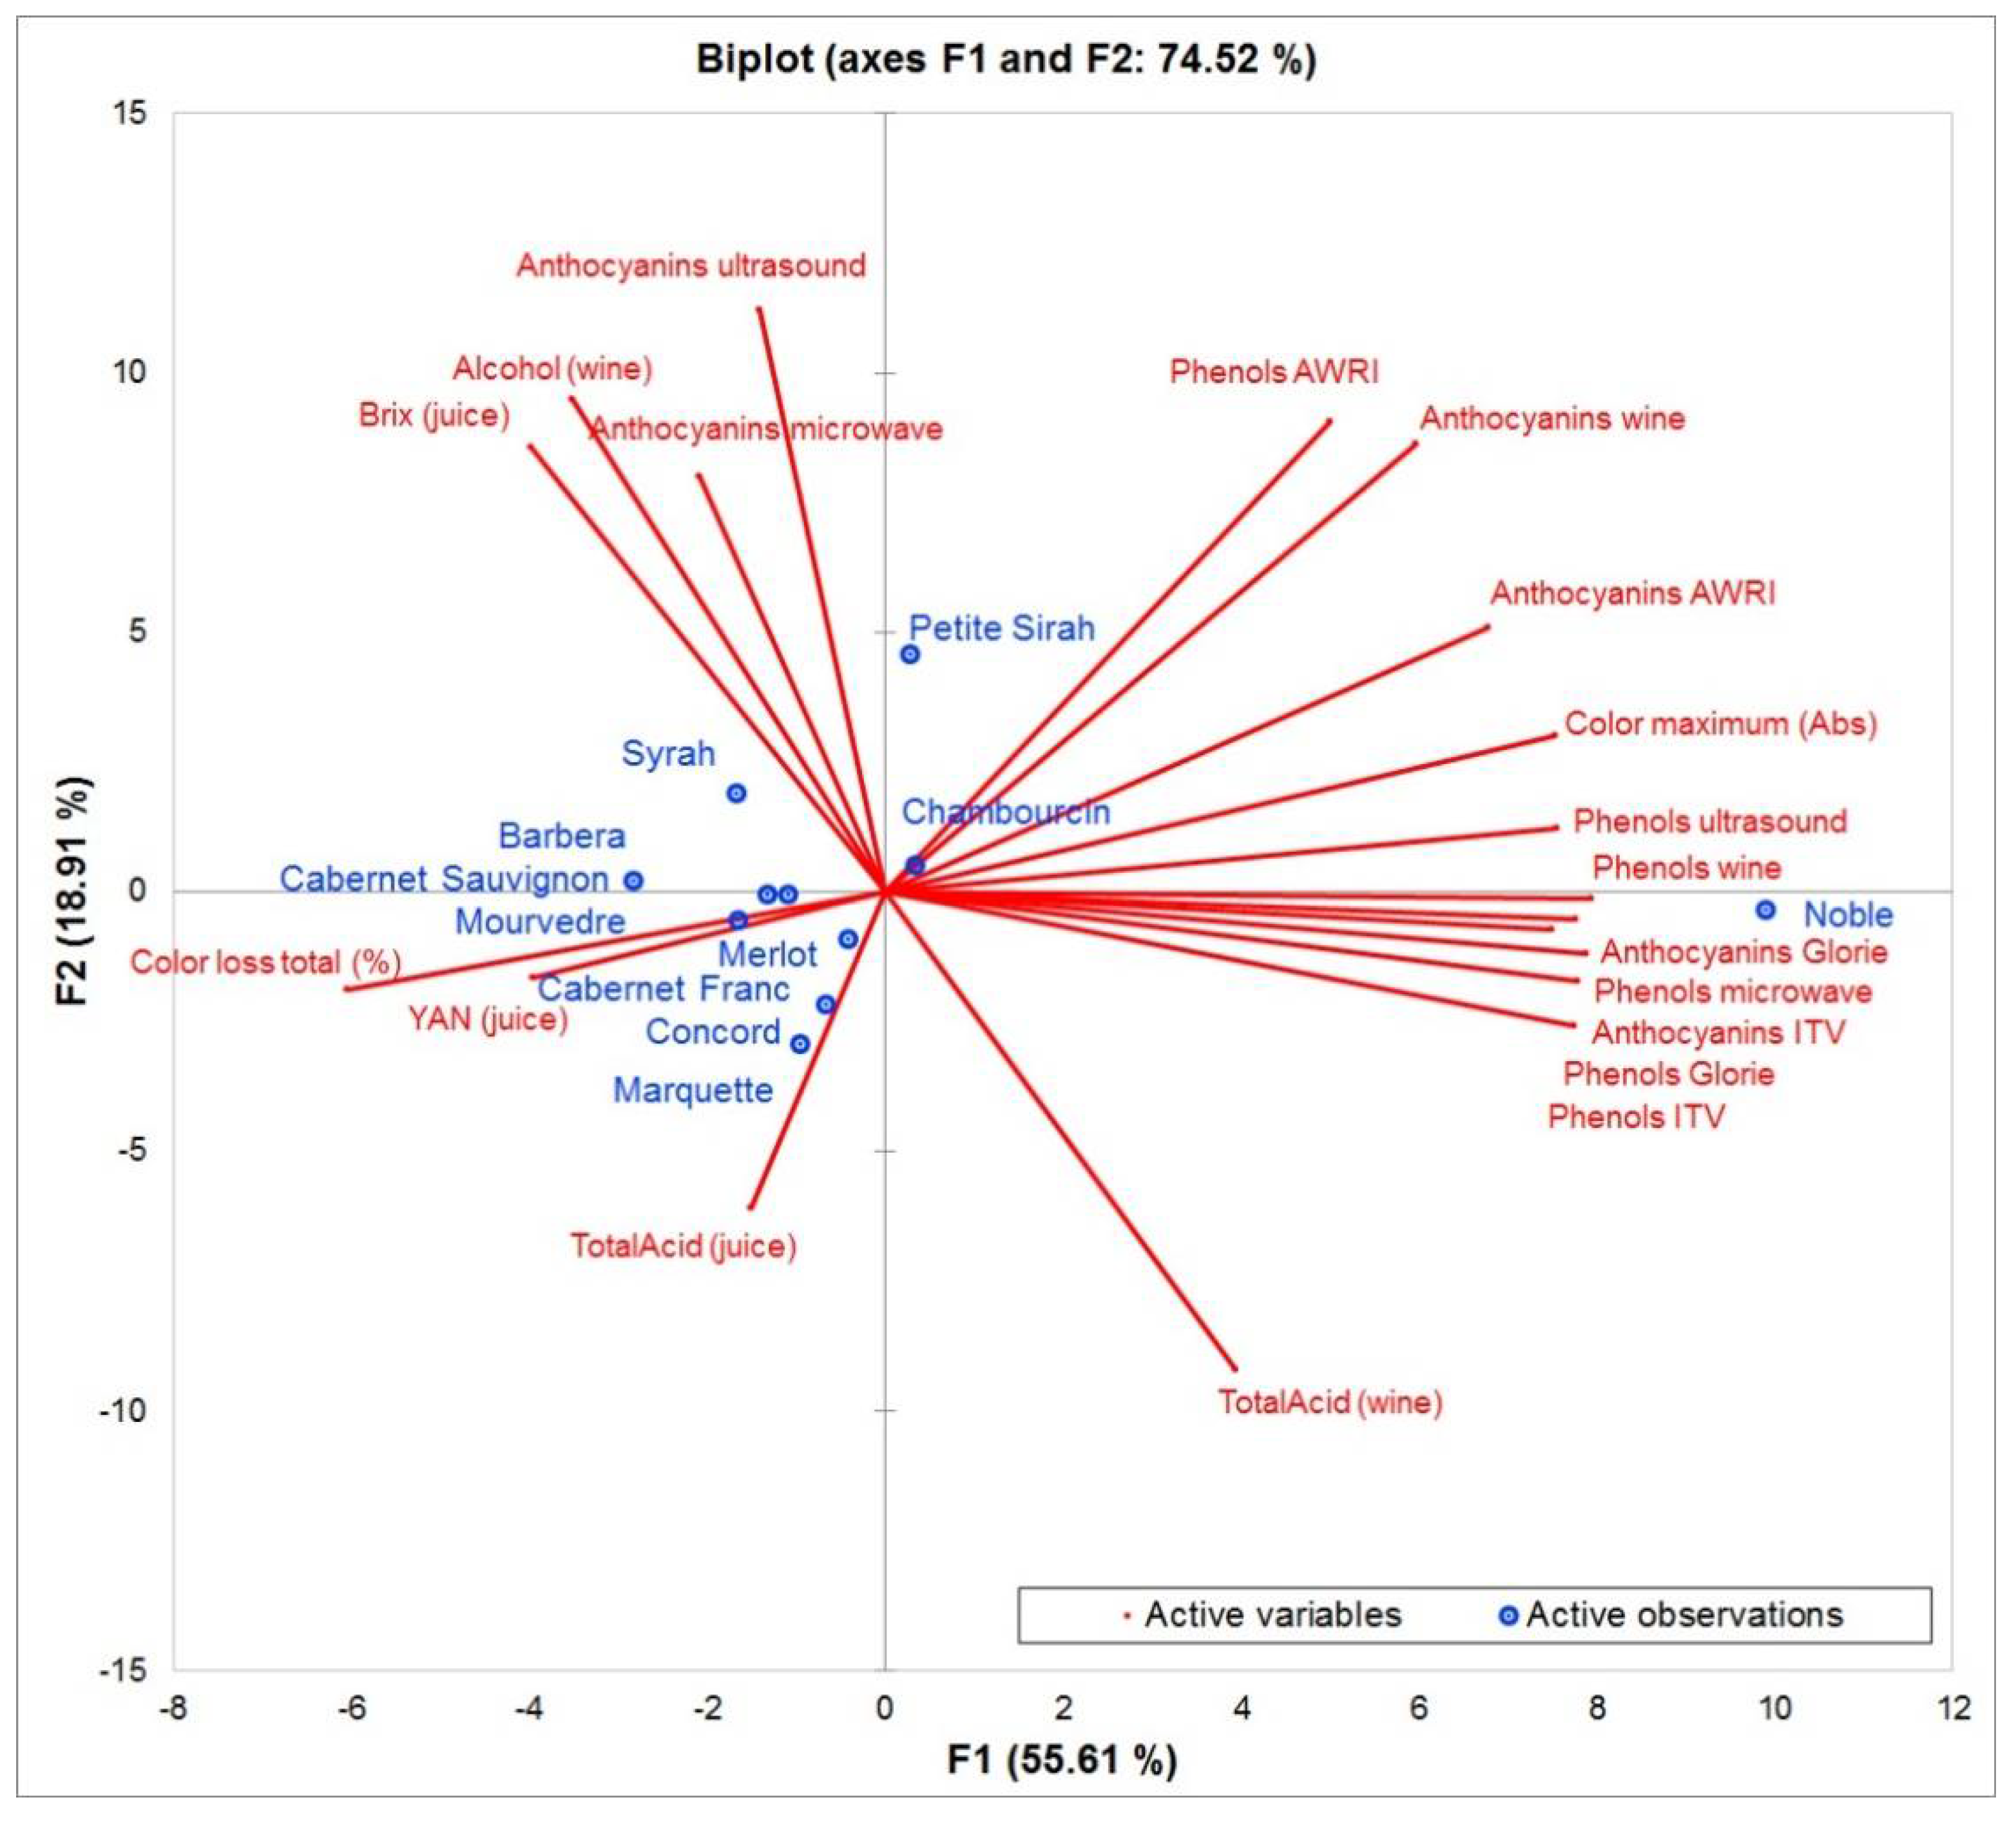
2.4. Statistical Analyses
3. Results and Discussion
4. Conclusions
Author Contributions
Acknowledgments
Conflicts of Interest
References
- Revilla, E.; Garcı́a-Beneytez, E.; Cabello, F.; Martı́n-Ortega, G.; Ryan, J.-M.A. Value of high-performance liquid chromatographic analysis of anthocyanins in the differentiation of red grape cultivars and red wines made from them. J. Chromatogr. A 2001, 915, 53–60. [Google Scholar] [CrossRef]
- Wu, X.; Prior, R.L. Systematic identification and characterization of anthocyanins by hplc-esi-ms/ms in common foods in the United States: Fruits and berries. J. Agric. Food Chem. 2005, 53, 2589–2599. [Google Scholar] [CrossRef] [PubMed]
- Glories, Y.; Augustin, M. Maturité Phénolique du Raisin, Conséquences Technologiques: Application Aux Millésimes 1991 et 1992; CR Colloque Journée Techn; CIVB: Bordeaux, France, 1993; pp. 56–61. [Google Scholar]
- Kontoudakis, N.; Esteruelas, M.; Fort, F.; Canals, J.M.; Zamora, F. Comparison of methods for estimating phenolic maturity in grapes: Correlation between predicted and obtained parameters. Anal. Chim. Acta 2010, 660, 127–133. [Google Scholar] [CrossRef] [PubMed]
- García-Beneytez, E.; Revilla, E.; Cabello, F. Anthocyanin pattern of several red grape cultivars and wines made from them. Eur. Food Res. Technol. 2002, 215, 32–37. [Google Scholar] [CrossRef]
- Huang, Z.; Wang, B.; Williams, P.; Pace, R.D. Identification of anthocyanins in muscadine grapes with hplc-esi-ms. LWT Food Sci. Technol. 2009, 42, 819–824. [Google Scholar] [CrossRef]
- Ribéreau-Gayon, P.; Dubourdieu, D.; Donèche, B.; Lonvaud, A. Handbook of Enology; John Wiley & Sons: Hoboken, NJ, USA, 2006; Volume 1. [Google Scholar]
- Romero-Cascales, I.; Fernández-Fernández, J.I.; López-Roca, J.M.; Gómez-Plaza, E. The maceration process during winemaking extraction of anthocyanins from grape skins into wine. Eur. Food Res. Technol. 2005, 221, 163–167. [Google Scholar] [CrossRef]
- Cayla, L.; Cottereau, P.; Renard, R. Estimation de la maturité phénolique des raisins rouges par la méthode i.T.V. Standard. Rev. Fr. d’OEnol. 2002, 193, 10–16. [Google Scholar]
- Glories, Y. La couler des vins rouges: 2a. Partie mesure, origine et interpretation. Connaiss. Vigne Vin 1984, 18, 253–271. [Google Scholar]
- Iland, P.; Bruer, N.; Edwards, G.; Weeks, S.; Wilkes, E. Chemical Analysis of Grapes and Wine: Techniques and Concepts; Patrick Iland Wine Promotions PTY Ltd.: Campbelltown, Australia, 2004. [Google Scholar]
- Corrales, M.; Toepfl, S.; Butz, P.; Knorr, D.; Tauscher, B. Extraction of anthocyanins from grape by-products assisted by ultrasonics, high hydrostatic pressure or pulsed electric fields: A comparison. Innov. Food Sci. Emerg. Technol. 2008, 9, 85–91. [Google Scholar] [CrossRef]
- Li, Y.; Skouroumounis, G.K.; Elsey, G.M.; Taylor, D.K. Microwave-assistance provides very rapid and efficient extraction of grape seed polyphenols. Food Chem. 2011, 129, 570–576. [Google Scholar] [CrossRef]
- Liazid, A.; Guerrero, R.F.; Cantos, E.; Palma, M.; Barroso, C.G. Microwave assisted extraction of anthocyanins from grape skins. Food Chem. 2011, 124, 1238–1243. [Google Scholar] [CrossRef]
- Fragoso, S.; Mestres, M.; Busto, O.; Guasch, J. Comparison of three extraction methods used to evaluate phenolic ripening in red grapes. J. Agric. Food Chem. 2010, 58, 4071–4076. [Google Scholar] [CrossRef] [PubMed]
- Corrales, M.; García, A.F.; Butz, P.; Tauscher, B. Extraction of anthocyanins from grape skins assisted by high hydrostatic pressure. J. Food Eng. 2009, 90, 415–421. [Google Scholar] [CrossRef]
- Ageorges, A.; Fernandez, L.; Vialet, S.; Merdinoglu, D.; Terrier, N.; Romieu, C. Four specific isogenes of the anthocyanin metabolic pathway are systematically co-expressed with the red colour of grape berries. Plant Sci. 2006, 170, 372–383. [Google Scholar] [CrossRef]
- Barnes, J.S.; Nguyen, H.P.; Shen, S.; Schug, K.A. General method for extraction of blueberry anthocyanins and identification using high performance liquid chromatography-electrospray ionization-ion trap-time of flight-mass spectrometry. J. Chromatogr. A 2009, 1216, 4728–4735. [Google Scholar] [CrossRef] [PubMed]
- Dukes, B.C.; Butzke, C.E. Rapid determination of primary amino acids in grape juice using an o-phthaldialdehyde/N-acetyl-l-cysteine spectrophotometric assay. Am. J. Enol. Vitic. 1998, 49, 125–134. [Google Scholar]
- Singleton, V.L.; Rossi, J.A. Colorimetry of total phenolics with phosphomolybdic-phosphotungstic acid reagents. Am. J. Enol. Vitic. 1965, 16, 144–158. [Google Scholar]
- Sarneckis, C.J.; Dambergs, R.G.; Jones, P.; Mercurio, M.; Herderich, M.J.; Smith, P.A. Quantification of condensed tannins by precipitation with methyl cellulose: Development and validation of an optimised tool for grape and wine analysis. Aust. J. Grape Wine Res. 2006, 12, 39–49. [Google Scholar] [CrossRef]
- Rentzsch, M.; Weber, F.; Durner, D.; Fischer, U.; Winterhalter, P. Variation of pyranoanthocyanins in red wines of different varieties and vintages and the impact of pinotin A addition on their color parameters. Eur. Food Res. Technol. 2009, 229, 689–696. [Google Scholar] [CrossRef]
- Sacchi, K.L.; Bisson, L.F.; Adams, D.O. A review of the effect of winemaking techniques on phenolic extraction in red wines. Am. J. Enol. Vitic. 2005, 56, 197–206. [Google Scholar]
- Jurd, L. Reactions involved in sulfite bleaching of anthocyanins. J. Food Sci. 1964, 29, 16–19. [Google Scholar] [CrossRef]


| Cultivar | Density | Sugar [% Bx] | Total Acid [g/L] | pH | NOPA [mg/L] | NH4 [mg/L] | YAN [mg/L] |
|---|---|---|---|---|---|---|---|
| Mourvedre | 1.0838 | 20.2 | 5.5 | 3.58 | 265 | 60 | 325 |
| Cabernet Franc | 1.0744 | 18.1 | 9.7 | 3.28 | 81 | 14 | 95 |
| Marquette | 1.0799 | 19.3 | 14.0 | 3.19 | 270 | 83 | 353 |
| Syrah | 1.1021 | 24.2 | 4.3 | 3.63 | 122 | 10 | 132 |
| Merlot | 1.0843 | 20.3 | 4.8 | 3.69 | 111 | 37 | 148 |
| Barbera | 1.1119 | 26.3 | 6.3 | 3.72 | 226 | 36 | 262 |
| Petite Sirah | 1.1005 | 23.9 | 4.5 | 3.90 | 164 | 44 | 208 |
| Cabernet Sauvignon | 1.0934 | 22.3 | 5.8 | 3.74 | 139 | 24 | 163 |
| Chambourcin | 1.1038 | 24.6 | 5.6 | 3.77 | 192 | 40 | 232 |
| Noble | 1.0665 | 16.2 | 8.7 | 3.04 | 46 | 12 | 58 |
| Concord | 1.0645 | 15.8 | 2.3 | 3.36 | 93 | 14 | 107 |
| Cultivar | Density | Ethanol [g/L] | Total Acid [g/L] | pH | Total Phenols [mg/L] | Total Tannins [mg/L} |
|---|---|---|---|---|---|---|
| Mourvedre | 0.9965 ± 0.0004 | 83.7 ± 1.1 | 5.0 ± 0.1 | 4.0 ± 0.1 | 758 ± 32 | 932 ± 36 |
| Cabernet Franc | 0.9972 ± 0.0001 | 75.7 ± 0.4 | 7.7 ± 0.2 | 3.4 ± 0.1 | 823 ± 11 | 1154 ± 6 |
| Marquette | 0.9996 ± 0.0001 | 76.8 ± 0.1 | 8.9 ± 0.2 | 3.5 ± 0.1 | 519 ± 86 | 463 ± 158 |
| Syrah | 0.9921 ± 0.0001 | 111.2 ± 2.1 | 5.5 ± 0.1 | 3.5 ± 0.1 | 717 ± 75 | 976 ± 80 |
| Merlot | 0.9950 ± 0.0002 | 89.6 ± 0.6 | 5.1 ± 0.1 | 3.7 ± 0.1 | 1194 ± 99 | 1621 ± 131 |
| Barbera | 0.9933 ± 0.0001 | 118.2 ± 1.2 | 6.3 ± 0.2 | 3.4 ± 0.1 | 601 ± 2 | 332 ± 9 |
| Petit Sirah | 0.9934 ± 0.0001 | 107.1 ± 3.6 | 5.1 ± 0.1 | 3.8 ± 0.1 | 972 ± 135 | 1224 ± 312 |
| Cabernet Sauvignon | 0.9958 ± 0.0001 | 95.0 ± 0.9 | 5.8 ± 0.2 | 4.0 ± 0.1 | 1071 ± 39 | 1434 ± 104 |
| Chambourcin | 0.9946 ± 0.0003 | 107.0 ± 1.7 | 5.8 ± 0.1 | 3.6 ± 0.1 | 901 ± 52 | 942 ± 116 |
| Noble | 1.0015 ± 0.0001 | 68.2 ± 0.3 | 8.7 ± 0.2 | 2.9 ± 0.1 | 1858 ± 417 | 978 ± 77 |
| Concord | 0.9993 ± 0.0002 | 62.3 ± 0.2 | 7.8 ± 0.1 | 2.9 ± 0.1 | 688 ± 43 | 780 ± 119 |
| Cultivar | 100 Berry Weight | Average Weight per Berry | Skin Weight per Berry | Skin Dry Weight per Berry | Extractable Anthocyanins | Extractable Polyphenols |
|---|---|---|---|---|---|---|
| [g] | [g] | [g] | [g] | [mg/g Fresh Skin] | [mg/g Fresh Skin] | |
| Mourvedre | 219.6 ± 17.4 | 2.20 ± 0.17 | 0.565 ± 0.025 | 0.165 ± 0.007 | 0.37 ± 0.04 | 1.12 ± 0.35 |
| Merlot | 149.5 ± 1.9 | 1.50 ± 0.02 | 0.647 ± 0.032 | 0.211 ± 0.009 | 0.83 ± 0.09 | 1.56 ± 0.22 |
| Cabernet Franc | 139.4 ± 1.4 | 1.39 ± 0.01 | 0.638 ± 0.029 | 0.196 ± 0.009 | 1.44 ± 0.18 | 1.98 ± 0.64 |
| Marquette | 105.6 ± 7.8 | 1.06 ± 0.08 | 0.591 ± 0.032 | 0.154 ± 0.007 | 0.62 ± 0.11 | 1.23 ± 0.35 |
| Noble | 305.0 ± 3.2 | 3.05 ± 0.03 | 0.697 ± 0.063 | 0.251 ± 0.013 | 2.91 ± 0.41 | 3.90 ± 0.81 |
| Petite Sirah | 107.3 ± 7.6 | 1.07 ± 0.08 | 0.660 ± 0.030 | 0.230 ± 0.012 | 1.83 ± 0.08 | 3.41 ± 0.63 |
| Chambourcin | 228.2 ± 0.9 | 2.28 ± 0.01 | 0.612 ± 0.043 | 0.219 ± 0.009 | 1.37 ± 0.21 | 1.88 ± 0.53 |
| Cabernet Sauvignon | 143.3 ± 0.1 | 1.43 ± 0.01 | 0.608 ± 0.031 | 0.205 ± 0.010 | 1.46 ± 0.17 | 2.25 ± 0.21 |
| Barbera | 149.6 ± 2.0 | 1.50 ± 0.02 | 0.685 ± 0.041 | 0.242 ± 0.012 | 0.66 ± 0.09 | 1.03 ± 0.16 |
| Syrah | 153.5 ± 3.7 | 1.53 ± 0.04 | 0.708 ± 0.042 | 0.214 ± 0.011 | 1.62 ± 0.23 | 2.19 ± 0.42 |
| Concord | 300.2 ± 0.4 | 3.00 ± 0.01 | 0.858 ± 0.069 | 0.305 ± 0.015 | 1.29 ± 0.12 | 1.85 ± 0.66 |
| Days to Maximum Extraction | Average Color Loss in Free-Run until Pressing [%] | |||||||
| Cultivar | 420 nm | 520 nm | 620 nm | Total Σ | 420 nm | 520 nm | 620 nm | Total Σ |
| Mourvedre | 10 | 7 | 10 | 10 | 4.6 | 8.4 | 3.7 | 6.3 |
| Merlot | 4 | 5 | 4 | 5 | 12.6 | 22.2 | 35.0 | 18.2 |
| Cabernet Franc | 7 | 7 | 6 | 7 | 5.8 | 22.3 | 7.0 | 15.7 |
| Marquette | 5 | 7 | 6 | 7 | 21.7 | 31.9 | 25.6 | 26.5 |
| Barbera | 7 | 6 | 7 | 7 | 9.0 | 14.8 | 3.0 | 11.6 |
| Syrah | 2 | 5 | 5 | 5 | 22.1 | 32.1 | 22.7 | 27.3 |
| Petit Sirah | 5 | 5 | 8 | 5 | 6.2 | 18.2 | 8.7 | 13.3 |
| Cabernet Sauvignon | 10 | 5 | 3 | 6 | 1.0 | 25.0 | 10.1 | 13.1 |
| Chambourcin | 5 | 4 | 3 | 4 | 14.8 | 45.7 | 29.5 | 35.8 |
| Noble | 4 | 6 | 5 | 6 | −1.9 | 20.4 | 32.5 | 17.1 |
| Concord | 3 | 3 | 3 | 3 | 27.6 | 45.8 | 35.0 | 40.2 |
| Average Color Loss in Press-Wine [%] | Average Color Loss after SO2and 60 Days [%] | |||||||
| Cultivar | 420 nm | 520 nm | 620 nm | Total Σ | 420 nm | 520 nm | 620 nm | Total Σ |
| Mourvedre | 14.2 | 19.3 | 20.6 | 17.5 | 35.2 | 54.1 | 52.0 | 47.1 |
| Merlot | 21.3 | 36.3 | 45.4 | 30.5 | 37.6 | 56.4 | 63.9 | 49.9 |
| Cabernet Franc | 20.7 | 39.0 | 39.1 | 33.3 | 48.4 | 68.8 | 66.6 | 62.4 |
| Marquette | 14.7 | 39.8 | 28.4 | 29.8 | 28.0 | 56.3 | 44.1 | 45.8 |
| Barbera | 19.4 | 22.7 | 21.2 | 21.2 | 41.1 | 53.9 | 47.2 | 49.0 |
| Syrah | 38.5 | 48.6 | 54.6 | 46.1 | 58.4 | 72.5 | 73.8 | 68.4 |
| Petit Sirah | 7.2 | 28.4 | 19.8 | 21.2 | 18.0 | 44.2 | 35.4 | 35.6 |
| Cabernet Sauvignon | 9.9 | 29.9 | 24.7 | 20.8 | 24.6 | 51.8 | 48.0 | 41.1 |
| Chambourcin | 25.4 | 53.5 | 44.1 | 44.6 | 44.9 | 66.6 | 59.7 | 57.0 |
| Noble | −48.3 | 26.3 | 35.0 | 13.3 | 0.0 | 15.4 | 14.5 | 11.2 |
| Concord | 39.1 | 51.0 | 25.8 | 46.1 | 52.7 | 69.9 | 64.0 | 64.8 |
| Cultivar | Finished Wines | Microwave Extraction | Ultrasound Extraction | Glorie Method (pH 3.2) | ITV Standard | AWRI Method | ||||||
|---|---|---|---|---|---|---|---|---|---|---|---|---|
| Total Phenols | Anthocyanins | Total Phenols | Anthocyanins | Total Phenols | Anthocyanins | Total Phenols | Anthocyanins | Total Phenols | Anthocyanins | Total Phenols | Anthocyanins | |
| [g/L] | [g/L] | [g/L] | [g/L] | [g/L] | [g/L] | [g/L] | [g/L] | [g/L] | [g/L] | [g/L] | [g/L] | |
| Mourvedre | 1.02 ± 0.25 | 0.21 ± 0.01 | 2.09 ± 0.14 | 0.35 ± 0.05 | 2.09 ± 0.07 | 0.40 ± 0.02 | 0.44 ± 0.01 | 0.24 ± 0.01 | 0.96 ± 0.08 | 0.37 ± 0.01 | 0.59 ± 0.08 | 0.32 ± 0.01 |
| Merlot | 1.23 ± 0.08 | 0.24 ± 0.01 | 2.21 ± 0.16 | 0.39 ± 0.03 | 1.84 ± 0.04 | 0.37 ± 0.01 | 0.42 ± 0.19 | 0.29 ± 0.01 | 0.91 ± 0.01 | 0.38 ± 0.01 | 0.54 ± 0.09 | 0.32 ± 0.06 |
| Cabernet Franc | 0.98 ± 0.01 | 0.22 ± 0.01 | 1.83 ± 0.28 | 0.37 ± 0.01 | 1.99 ± 0.04 | 0.43 ± 0.02 | 0.44 ± 0.02 | 0.33 ± 0.02 | 1.14 ± 0.03 | 0.44 ± 0.01 | 0.72 ± 0.06 | 0.39 ± 0.03 |
| Petite Sirah | 1.43 ± 0.30 | 0.34 ± 0.05 | 2.24 ± 0.10 | 0.53 ± 0.02 | 2.37 ± 0.06 | 0.54 ± 0.03 | 0.37 ± 0.02 | 0.34 ± 0.01 | 0.78 ± 0.07 | 0.45 ± 0.03 | 0.90 ± 0.12 | 0.54 ± 0.08 |
| Cabernet Sauvignon | 1.46 ± 0.18 | 0.24 ± 0.01 | 1.96 ± 0.29 | 0.34 ± 0.04 | 2.05 ± 0.01 | 0.38 ± 0.01 | 0.30 ± 0.06 | 0.25 ± 0.01 | 0.69 ± 0.01 | 0.32 ± 0.02 | 0.56 ± 0.01 | 0.35 ± 0.01 |
| Barbera | 0.75 ± 0.02 | 0.21 ± 0.01 | 1.46 ± 0.19 | 0.33 ± 0.03 | 1.47 ± 0.10 | 0.36 ± 0.02 | 0.22 ± 0.02 | 0.23 ± 0.01 | 0.80 ± 0.07 | 0.31 ± 0.01 | 0.58 ± 0.01 | 0.39 ± 0.01 |
| Syrah | 1.03 ± 0.29 | 0.23 ± 0.01 | 1.78 ± 0.15 | 0.37 ± 0.04 | 2.44 ± 0.02 | 0.49 ± 0.01 | 0.25 ± 0.14 | 0.25 ± 0.01 | 0.80 ± 0.02 | 0.34 ± 0.02 | 0.65 ± 0.14 | 0.38 ± 0.11 |
| Chambourcin | 1.64 ± 0.04 | 0.24 ± 0.01 | 2.46 ± 0.04 | 0.39 ± 0.01 | 2.19 ± 0.22 | 0.36 ± 0.01 | 0.59 ± 0.01 | 0.56 ± 0.05 | 1.35 ± 0.01 | 0.70 ± 0.01 | 0.59 ± 0.16 | 0.49 ± 0.08 |
| Marquette | 1.04 ± 0.08 | 0.20 ± 0.01 | 1.86 ± 0.06 | 0.36 ± 0.01 | 1.98 ± 0.08 | 0.35 ± 0.01 | 0.44 ± 0.01 | 0.40 ± 0.02 | 1.07 ± 0.08 | 0.55 ± 0.01 | 0.49 ± 0.03 | 0.39 ± 0.01 |
| Noble | 4.87 ± 0.16 | 0.35 ± 0.01 | 3.93 ± 0.31 | 0.30 ± 0.03 | 3.95 ± 0.23 | 0.35 ± 0.01 | 1.26 ± 0.18 | 1.13 ± 0.12 | 2.92 ± 0.18 | 1.61 ± 0.09 | 0.89 ± 0.28 | 0.71 ± 0.13 |
| Concord | 1.45 ± 0.22 | 0.19 ± 0.01 | 2.61 ± 0.13 | 0.42 ± 0.05 | 2.32 ± 0.01 | 0.37 ± 0.01 | 0.34 ± 0.01 | 0.23 ± 0.01 | 1.03 ± 0.04 | 0.42 ± 0.01 | 0.41 ± 0.02 | 0.26 ± 0.02 |
| Observation | Microwave Assisted Extraction | Ultrasound Assisted Extraction | ITV Standard | AWRI Extraction | Glorie Extraction | Potential Anthocynins (Glorie) | Extractable Anthocyanins (Glorie) |
|---|---|---|---|---|---|---|---|
| Anthocyanins finished wines | 0.199 (n.s.) | 0.345 (n.s.) | 0.638 (*) | 0.797 (***) | 0.650 (*) | 0.674 (**) | 0.650 (*) |
| Color maximum during fermentation | 0.086 (n.s.) | 0.005 (n.s.) | 0.895 (***) | 0.741 (***) | 0.870 (***) | 0.898 (***) | 0.868 (***) |
| Total phenolics finished wines | 0.902 (***) | 0.924 (***) | 0.933 (***) | 0.452 (*) | 0.909 (***) |
© 2018 by the authors. Licensee MDPI, Basel, Switzerland. This article is an open access article distributed under the terms and conditions of the Creative Commons Attribution (CC BY) license (http://creativecommons.org/licenses/by/4.0/).
Share and Cite
Sommer, S.; Cohen, S.D. Comparison of Different Extraction Methods to Predict Anthocyanin Concentration and Color Characteristics of Red Wines. Fermentation 2018, 4, 39. https://doi.org/10.3390/fermentation4020039
Sommer S, Cohen SD. Comparison of Different Extraction Methods to Predict Anthocyanin Concentration and Color Characteristics of Red Wines. Fermentation. 2018; 4(2):39. https://doi.org/10.3390/fermentation4020039
Chicago/Turabian StyleSommer, Stephan, and Seth D. Cohen. 2018. "Comparison of Different Extraction Methods to Predict Anthocyanin Concentration and Color Characteristics of Red Wines" Fermentation 4, no. 2: 39. https://doi.org/10.3390/fermentation4020039
APA StyleSommer, S., & Cohen, S. D. (2018). Comparison of Different Extraction Methods to Predict Anthocyanin Concentration and Color Characteristics of Red Wines. Fermentation, 4(2), 39. https://doi.org/10.3390/fermentation4020039