


Abstract
Two-stage anaerobic digestion systems are extensively researched for enhancing process stability and phase separation when processing complex organic materials. Scaling from laboratory setups to pilot plants necessitates engineering modifications to ensure operational feasibility. In this study, a laboratory-scale system comprising a 100 L horizontal CSTR and a packed-bed reactor was scaled up 100-fold. The design separates solid and liquid retention times, with fibers retained in the first stage while liquids and volatile fatty acids flow into the second. Fiber retention in the lab was achieved using a 100 µm sieve dividing the CSTR into two chambers, allowing prolonged lignocellulosic degradation. During scale-up, a filtration and recirculation system was introduced, able to return the fibers to the first reactor through a 1000 µm edge-gap filter, which separates liquids for the second reactor and recycles undegraded fibers. An economic analysis indicated a scale-up exponent of 0.396, indicating that unit costs decrease with plant size and demonstrating economies of scale. Laboratory-based mass balance estimates biogas production at approximately 16.3 m3 daily at the pilot scale, equivalent to 90 kWh. The modular system aims to be transferred to small farms, promoting cost-effective biogas from manure and local residues to support decentralized renewable energy in agriculture.
1. Introduction
Anaerobic digestion (AD) of organic waste has become an increasingly popular biotechnology in recent years, primarily for its applications in renewable energy and biofuel production [1]. Biogas production through AD is widely regarded as a sustainable, eco-friendly, and viable alternative for generating clean energy [2]. The process involves four sequential stages: hydrolysis, acidogenesis, acetogenesis, and methanogenesis, which produces a mixture of methane (CH4) and carbon dioxide (CO2). These stages are mediated by specialized microbial communities and influenced by key operational parameters, including substrate composition, temperature, organic loading rate (OLR), pH, and hydraulic retention time (HRT) [2,3].
In Europe, 95% of the full-scale AD plants are operated using a single-stage process, in which substrates are introduced into a single reactor, and the four digestion stages occur simultaneously under uniform conditions [4]. However, microbial communities involved in AD are highly sensitive to changes in their environment. Consequently, it is essential to monitor and control operational parameters carefully to avoid issues such as process failure or the buildup of inhibitory substances [2]. To address these challenges, a two-stage AD system has been developed, consisting of two reactors arranged sequentially and operating under different conditions [5]. In this configuration, the process begins with the acidogenic phase in the first reactor, which is typically maintained at a moderately acidic pH range of 5–6 to promote acidogenic bacterial activity [6]. This first stage can operate at thermophilic or mesophilic temperatures, depending on goals. Thermophilic conditions (~55 °C) accelerate hydrolysis and permit higher organic loading rates and shorter HRTs, while mesophilic conditions (~35 °C) offer greater microbial diversity and operational stability [3]. The second reactor, which hosts the methanogenic phase, operates at a neutral pH level, which is optimal for methanogens [6]. This reactor is typically run under mesophilic conditions to maximize microbial diversity and stability. Shifting the methanogenic stage to thermophilic temperatures could risk losing microbial diversity and promote the formation of inhibitory intermediates [3,7]. When optimized, this configuration improves system stability by regulating the acidification process in the first reactor and reducing the risk of overloading or inhibiting the methanogenic microbes in the second reactor [8,9].
Compared to traditional single-stage AD, two-stage systems generally enhance CH4 production by a range of approximately 10–30% [7]. Numerous studies comparing single-stage and two-stage processes demonstrate superior overall reactor performance and higher CH4 yields in two-stage configurations [10,11,12]. Under certain substrate compositions and operational conditions, the increase in CH4 yield can exceed 65% [12]. Additionally, two-stage systems have been reported to achieve energy recovery rates in a range approximately 8–43% higher than those of single-stage AD, while also enhancing the CH4 content of the resulting biogas [10,12,13]. The benefits of two-stage AD have been demonstrated to a variety of feedstocks, including lignocellulosic biomass [14,15], high-solids municipal waste [11,16], food waste [17,18], and have been explored extensively in co-digestion trials [9,19,20].
Beyond substrate diversity, studies have explored various reactor configurations, most commonly using continuous stirred-tank reactors (CSTRs) in both stages [21,22], but the literature also reports a wide range of other reactor configurations [6,7,23]. A CSTR provides excellent mixing, consistent conditions, and effective control of process parameters, making it ideal for stable, continuous-flow operations [24]. However, in the second stage, CSTRs suffer bacterial washout of slow-growing methanogens at HRTs <15–20 days, leading to lower methane production, process instability, and reduced efficiency [25]. To overcome this, high-rate reactors such as anaerobic filters (AFs) [14,17,23,26], up-flow anaerobic sludge blanket (UASB) [27,28], and internal circulation (IC) [29,30] reactors have been applied to enhance biomass retention [27,31]. Among these, AF systems offer a balance between performance and operational simplicity by providing surface area for biofilm growth while avoiding the complexity and sensitivity associated with granular sludge systems [17,26,32,33]. Their main limitation lies in handling high-solids feedstocks, which can lead to clogging and require solid separation before feeding [34].
Combining a CSTR with an AF reactor provides a complementary approach that leverages the strengths of both systems. The first-stage CSTR employs vigorous mixing and robust solids management to accelerate the hydrolysis of recalcitrant materials into soluble organics, thereby enhancing overall process efficiency [24]. Meanwhile, the AF provides an extensive surface area for attached methanogenic biofilms, effectively decoupling solids retention time (SRT) from liquid HRT and producing CH4 at higher volumetric rates [6]. Importantly, this two-stage configuration does not imply biochemical phase separation of AD; rather, it physically separates solid and liquid handling so that operational conditions in the first stage (for example, pH and temperature) can be treated as experimental variables rather than fixed acidogenic settings. In other words, slightly acidic conditions do not have to be imposed a priori in the first stage, as different substrates may respond better to different conditions [14,35]. This reduces the risk of washout and facilitates scale-up and operation, especially when appropriate solids retention strategies are employed. Moreover, this integrated, well-established approach has been extensively optimized at the laboratory scale (LS) for various waste types, demonstrating versatility and reliability across applications, although prior studies primarily focused on AD phases separation rather than investigating the separation of retention times between solid and liquid fractions [6,14,17,26,36].
Although numerous advantages for this system exist, most studies on two-stage AD systems remain limited to bench or LS studies. Systematic documentation of the design, construction, and hydraulic integration of pilot-scale (PS) units is rarely reported [37]. A literature review conducted by the authors, covering publications from 2000 to 2026 in the Scopus database, using the search terms “two-stage” AND “anaerobic digestion,” versus “two-stage,” “anaerobic digestion,” AND “pilot scale,” reveals that most experimental investigations are conducted in LS settings. Only approximately 5% of studies describe PS systems. This gap reflects persistent challenges, including increased technical complexity, higher capital costs, and difficulties in maintaining stable operation under real-world conditions [37,38,39]. Moreover, scaling up introduces hydrodynamic and control-related constraints that are not captured in LS studies [38].
Despite these challenges, PS studies remain essential for identifying real-world constraints, deriving practical insights, and advancing technologies tailored to decentralized applications [38]. Addressing these limitations, this study presents the design and implementation of a PS two-stage CSTR–AF system specifically engineered to decouple solid and liquid retention times. The system integrates a dedicated solid-retention strategy in the CSTR with liquid-phase transfer to an AF reactor for methanogenesis. The objective is to bridge the gap between laboratory optimization and PS application by systematically documenting reactor design, hydraulic integration, instrumentation, control strategies, and mass balance. Additionally, operational and construction challenges are analyzed to provide practical insights for scaling up two-stage AD systems in real-world applications.
2. Materials and Methods
2.1. Laboratory Scale Setup
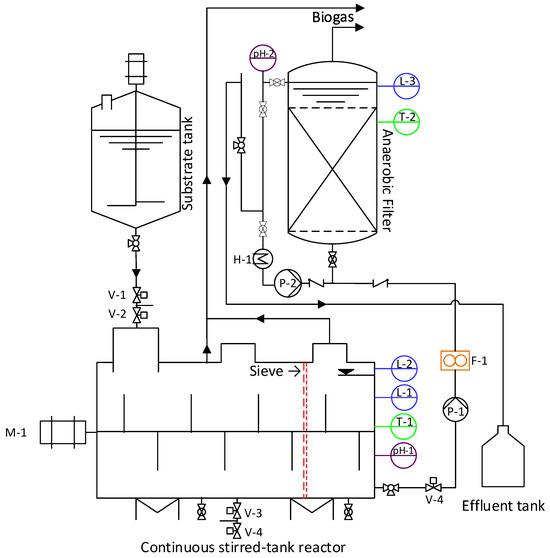
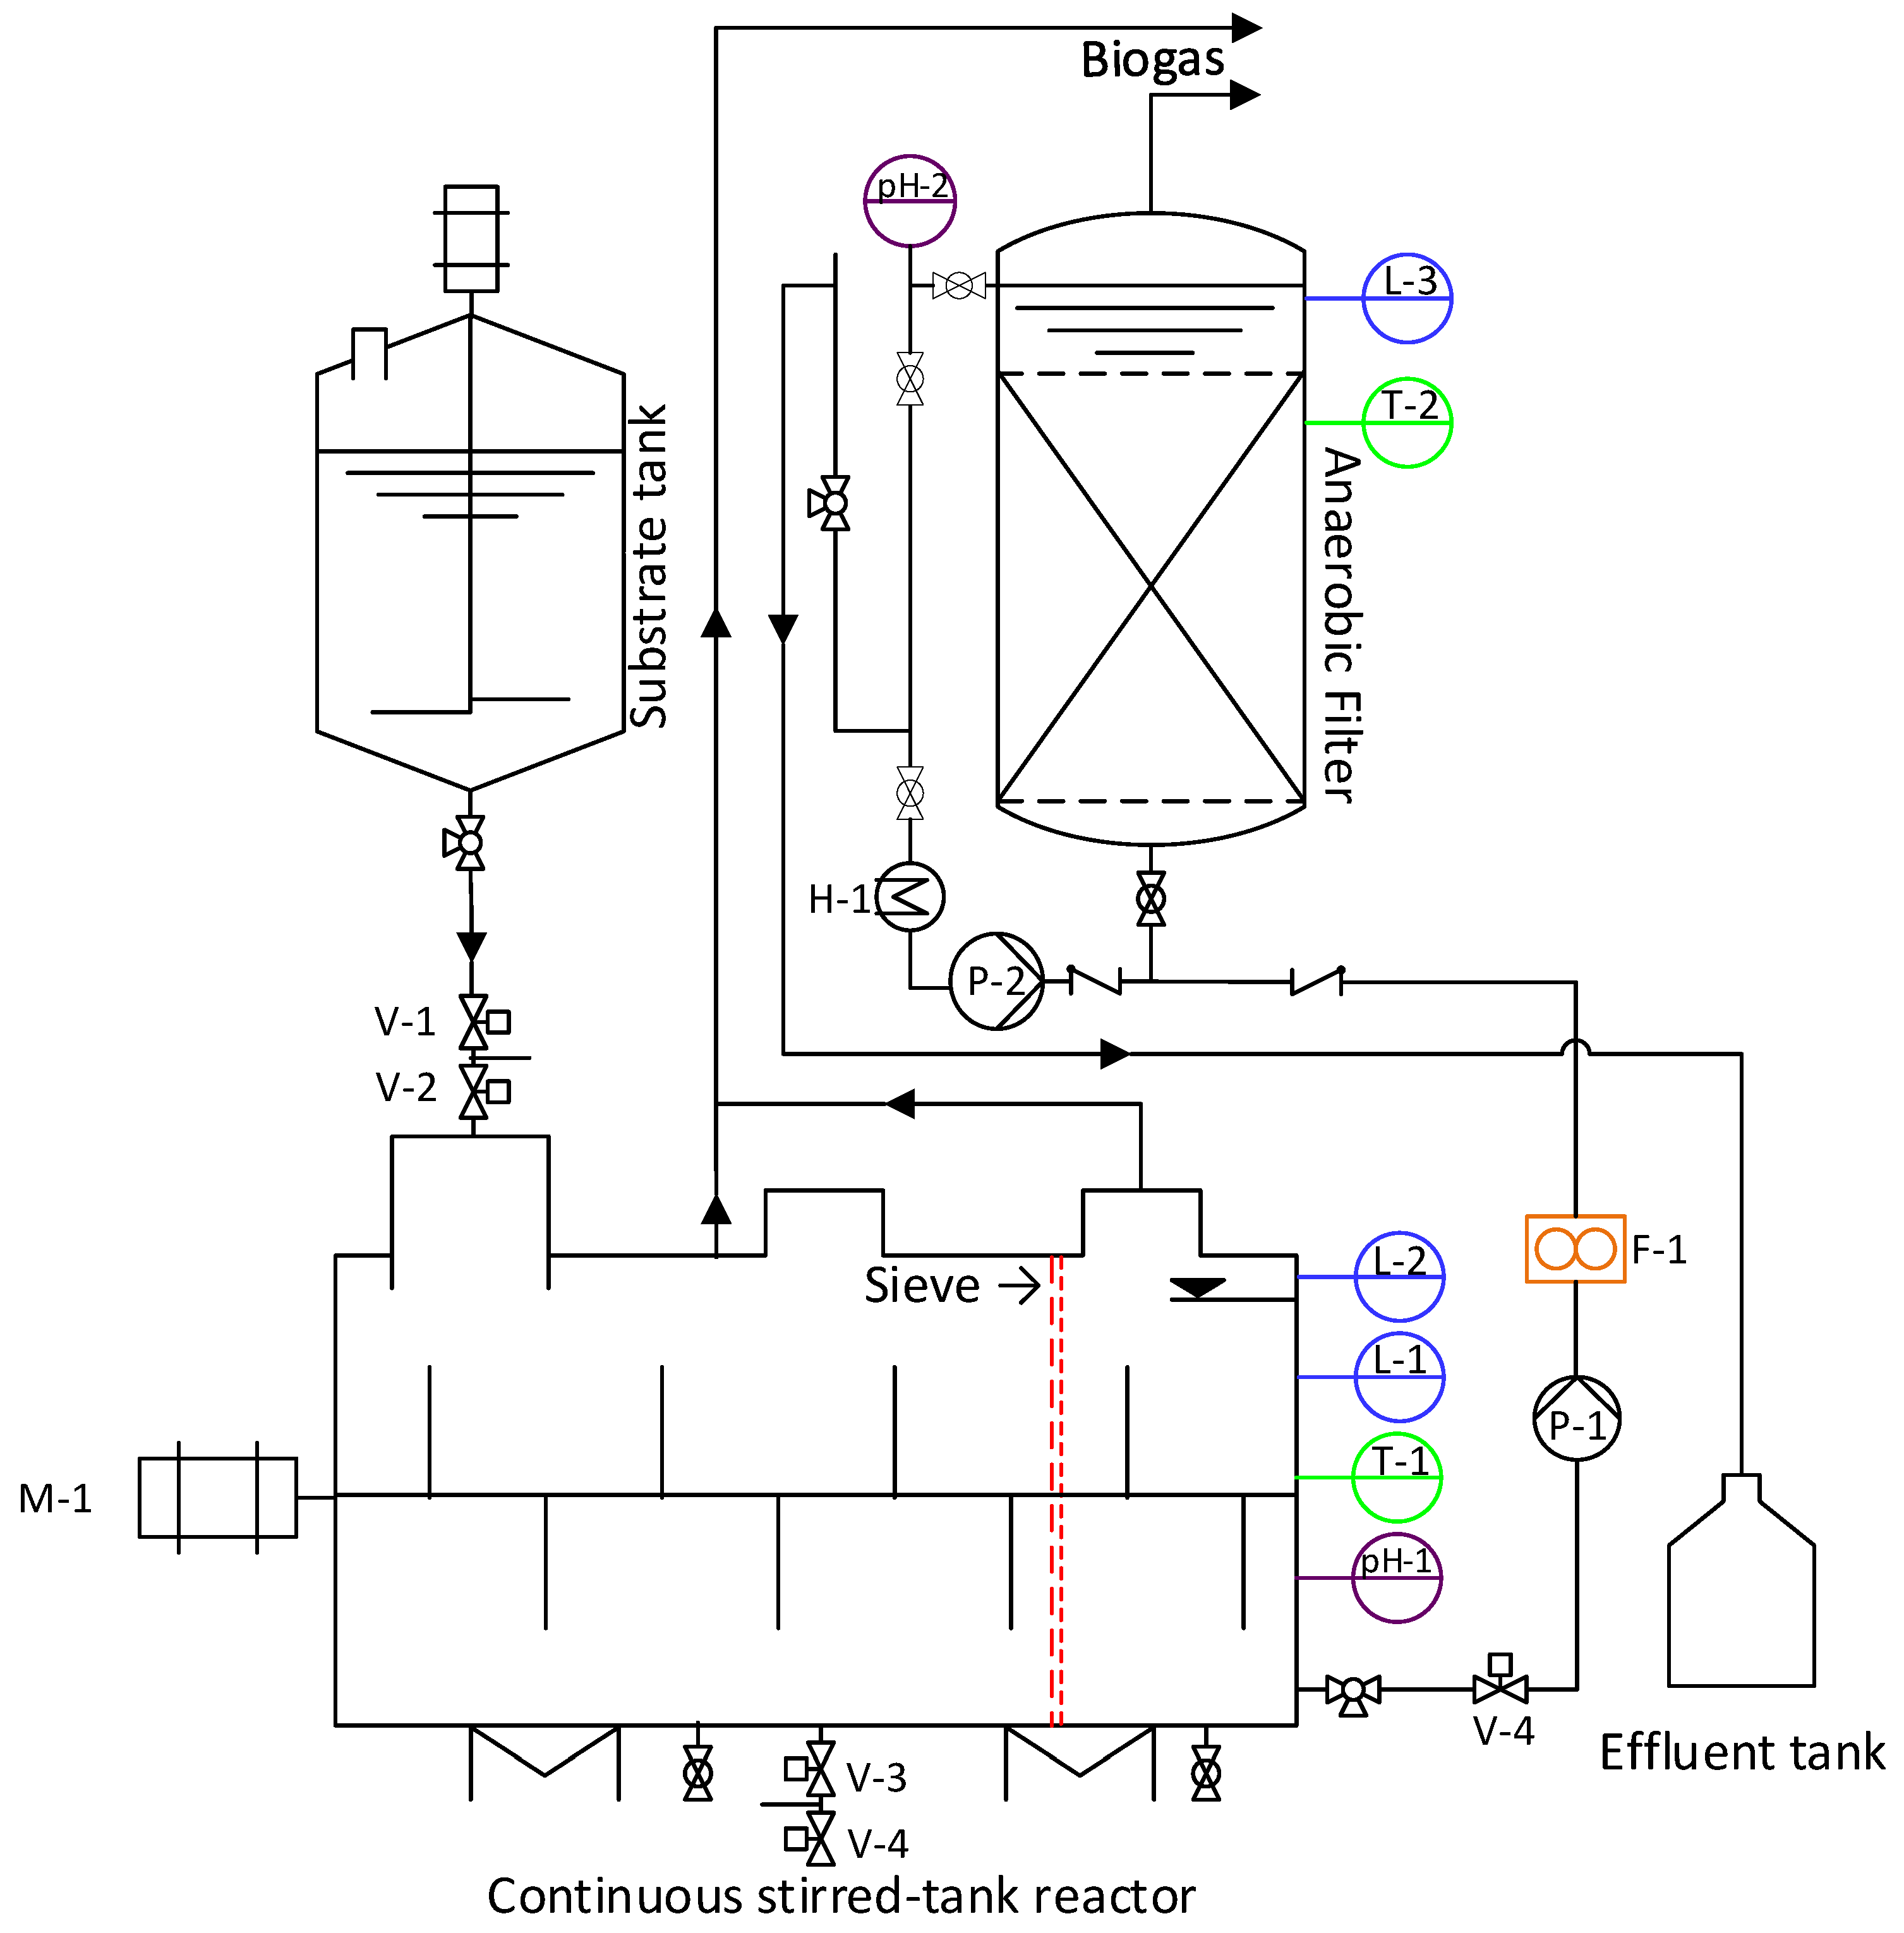
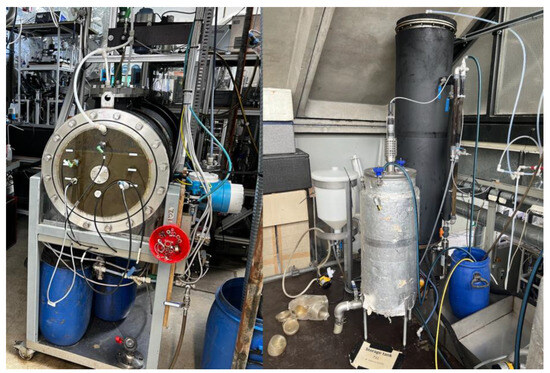
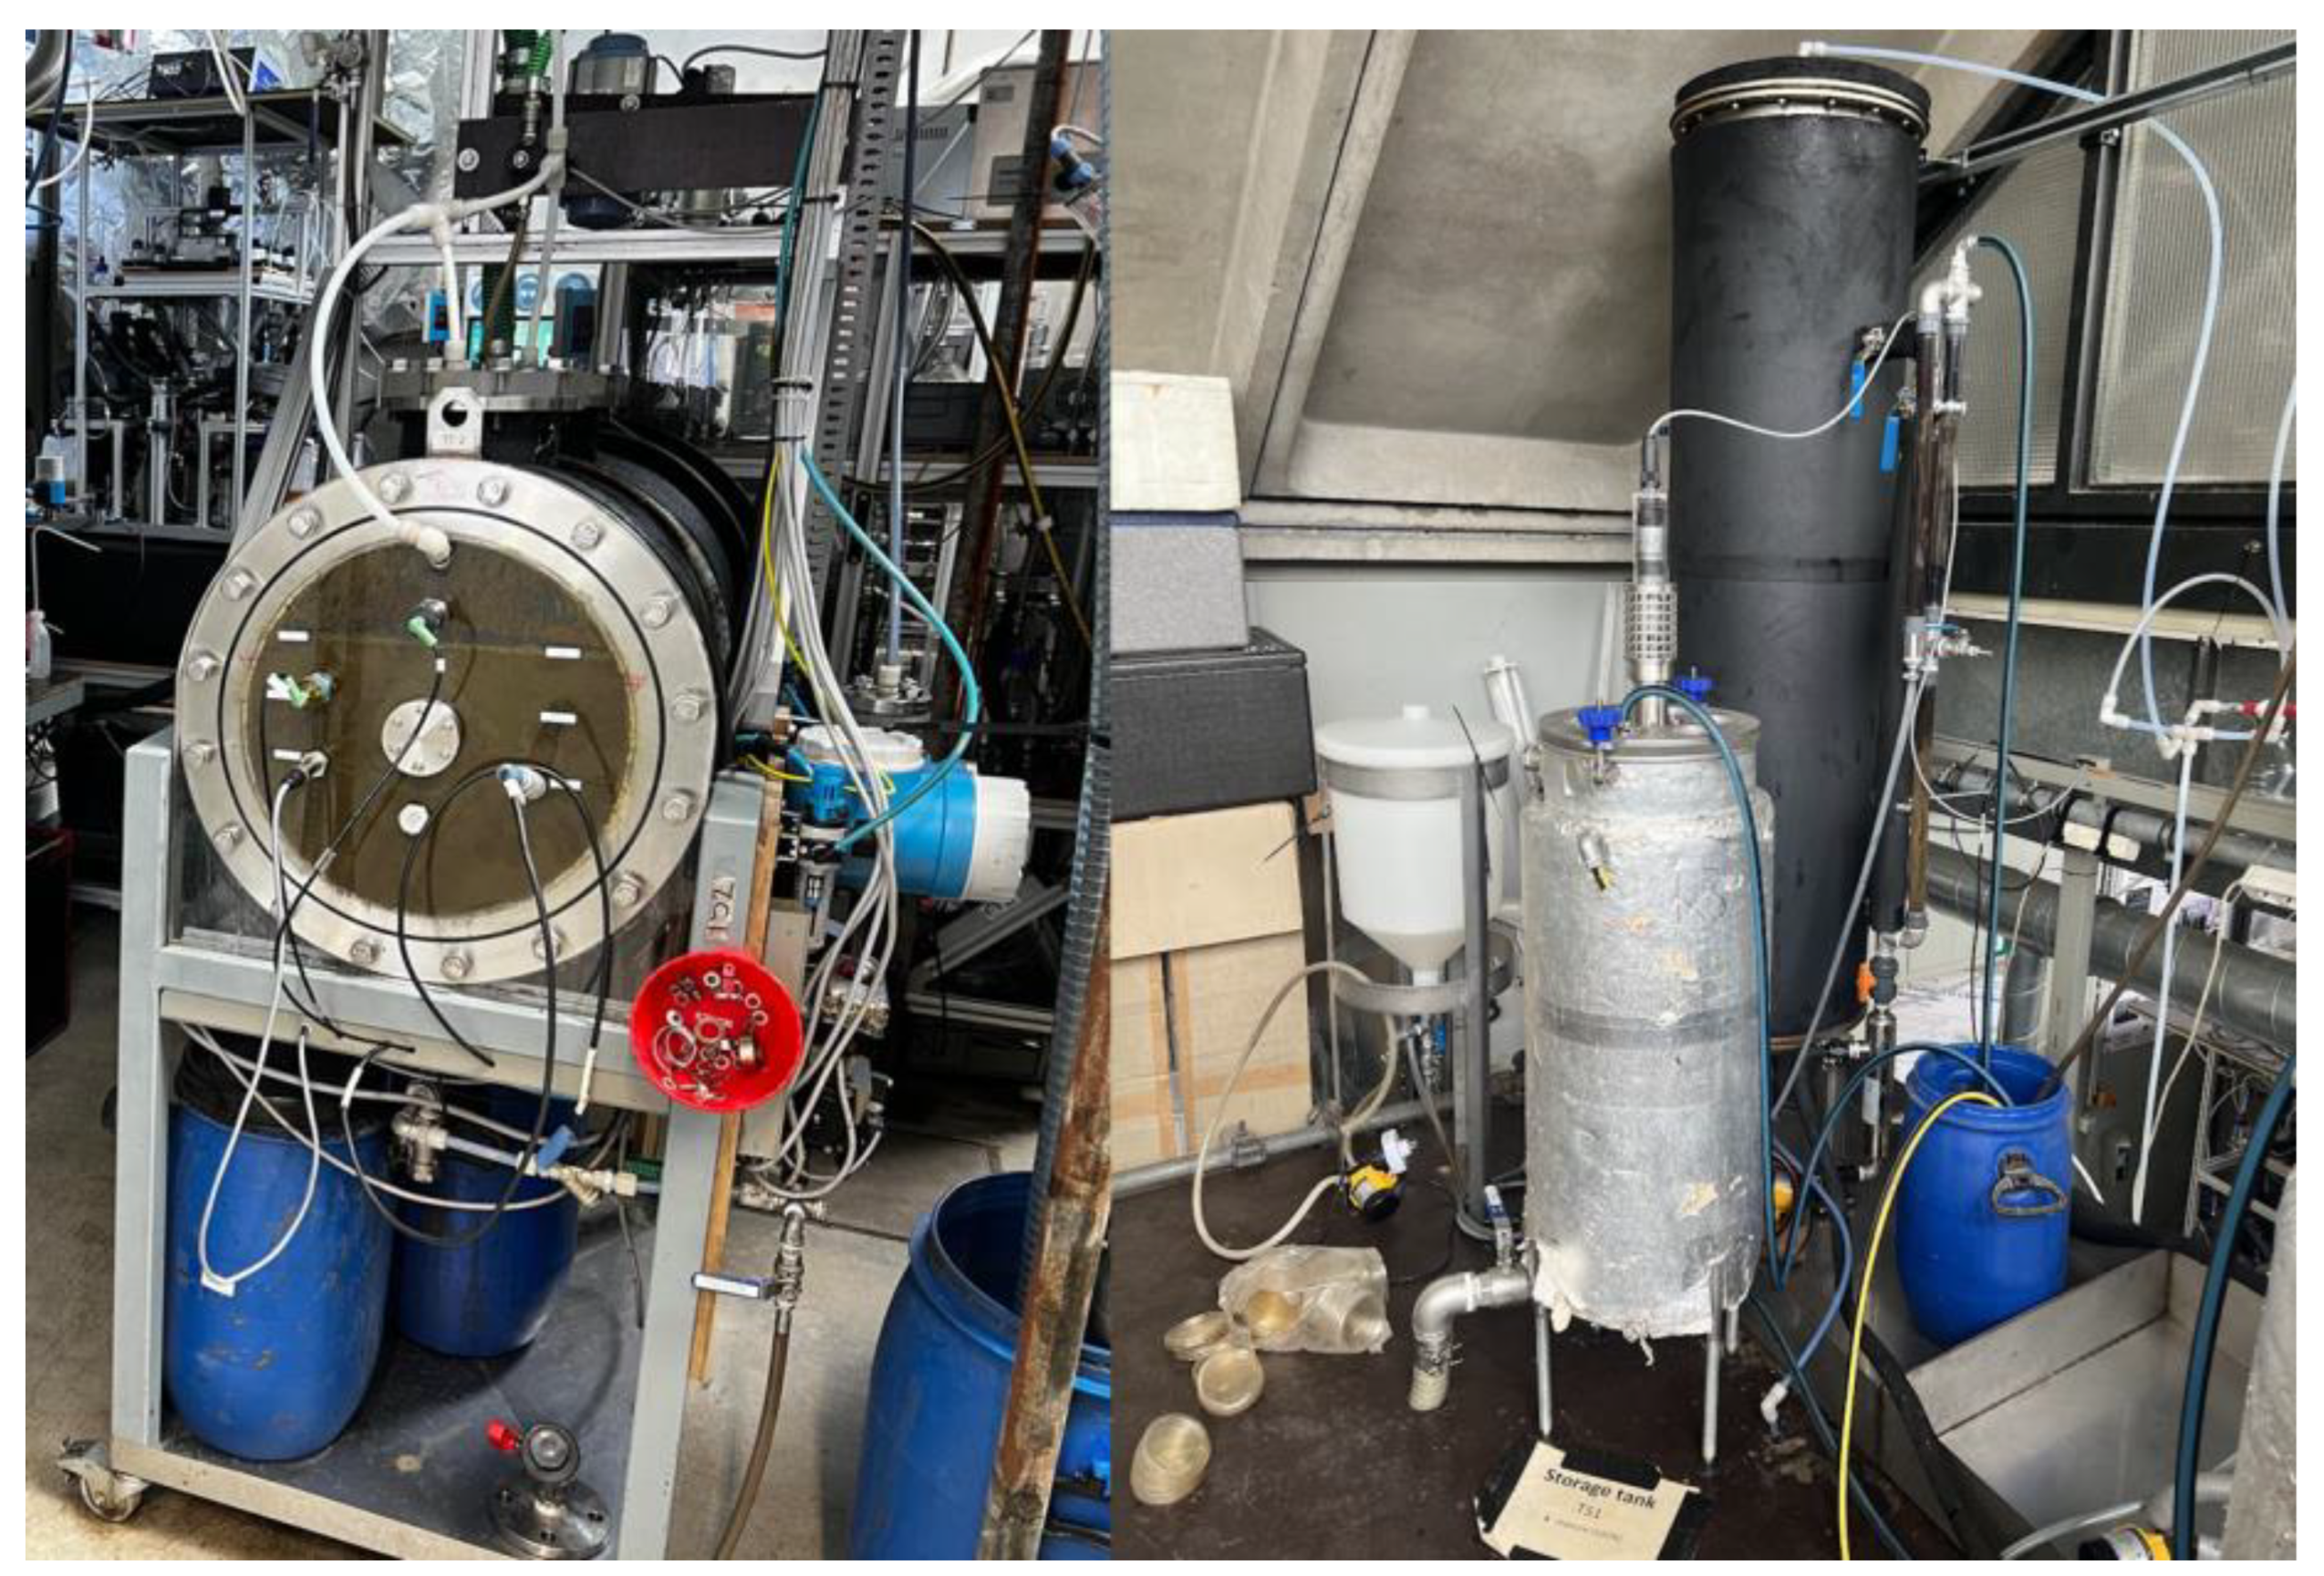
The piping and instrumentation diagram (P&ID) of the LS system is presented in Figure 1, and the system is depicted in Figure 2.
Figure 1.
Piping and instrumentation diagram (P&ID) of the laboratory-scale anaerobic digestion (LS AD) system, showing the continuous stirred-tank reactor (CSTR) with internal sieve, the anaerobic filter (AF), and all major pumps, valves, sensors, and flow paths. The sensors are distinguished by color: blue for level, green for temperature, purple for pH, and orange for flow.
Figure 2.
Laboratory-scale (LS) setup. (Left) First-stage horizontal continuous stirred-tank reactor (CSTR); (Right) substrate tank and 2nd-stage anaerobic filter (AF).
The setup consisted of a horizontal stainless steel CSTR with a total volume of 124 L and a working volume of 100 L. The reactor was equipped with a horizontal reel agitator (M-1) containing string rods to promote efficient substrate mixing. Temperature control was achieved using electric heating foils (H1, Thermo Flaechenheizungs, Rohrbach, Germany). Instrumentation included two level sensors (L-1 and L-2, Liquiphant T FTL20, Endress + Hauser, Weil am Rhein, Germany), which prevented overfeeding and overflow, a pH sensor (pH-1, Orbipac CPF81D, Endress + Hauser, Weil am Rhein, Germany), and a temperature probe (T-1, TMR31, Endress + Hauser, Weil am Rhein, Germany), recording measurements every 60 s. As previously described, the second stage of the system could only receive a substrate free of structural solids. To ensure this, a 100 µm stainless-steel sieve (highlighted in red in Figure 1) was integrated within the reactor to separate fibrous solids from the liquid portion. This configuration divided the reactor’s working volume into two compartments: a 78 L zone for solid accumulation and a 22 L zone for fiber-free liquid, which was subsequently fed into the AF. To prevent sieve clogging, two brushes attached to the string rod continuously cleaned the surface. The sieve integration allowed the solid phase to remain in the first stage, while the separated liquid phase was transferred to the AF using a valve (V-5, type 2051A, Christian Bürkert GmbH & Co. KG, Ingelfingen, Germany) and a centrifugal pump (P-1, type TMB, Lutz Pumpen GmbH, Wertheim, Germany). The volume transferred was quantified by a flow meter (F-1, Promag 53P, Endress + Hauser, Weil am Rhein, Germany), which also monitored the substrate feed into the AF.
The second stage employed a cylindrical AF. After adding bio-carriers (Bioflow 40, RVT Process Equipment, Steinwiesen, Germany) with a diameter of 40 mm and a specific surface area of 307 m2 m−3, the effective working volume of each AF reactor was determined to be 100 L. A combined pH/T sensor (pH-2, Orbisint CPS16D, Endress + Hauser, Weil am Rhein, Germany) measured both pH and temperature within the packed-bed region. Additional temperature monitoring at the lower section of the reactor was achieved using a screw-in Pt100 probe (T-2, JUMO, Fulda, Germany). A level sensor (L-3, Liquiphant T FTL20, Endress + Hauser, Weil am Rhein, Germany) maintained the desired operating volume; any excess effluent automatically flowed to the effluent tank. Recirculation within the AF was accomplished using a magnetic pump (P-2, type NH-10PX, Pan World, Mitsukaido Yamadamachi, Jōsō, Japan). This circulation was crucial for temperature regulation, as the substrate flow passed through a heat exchanger (H-1, type PR16A, Poolrelaxe Deutschland GmbH, Ennepetal, Germany) connected to a thermostated water bath (type ED (v.2), JULABO GmbH, Seelbach, Germany) maintained at a specified setpoint temperature.
Substrates were introduced daily into the CSTR through two inlet valves (V-1 and V-2, type 2051A, Christian Bürkert GmbH & Co. KG, Ingelfingen, Germany), connected via a flexible PVC feed line with a volume of 1 L. Digestate was discharged daily through the bottom outlet valves (V-3 and V-4, VAG ZETA, VAG-Gruppe, Mannheim, Germany) to maintain a stable working volume of 100 L. Biogas generated from both the CSTR and AF was collected in 150 L gas bags and analyzed periodically for volume and composition. Daily gas production was measured using a drum-type gas meter (TG 20, Ritter Apparatebau GmbH & Co. KG, Bochum, Germany), while biogas composition (methane, carbon dioxide, and hydrogen fractions) was determined with a gas analyzer (S710, SICK Vertriebs GmbH, Düsseldorf, Germany). All gas volumes were normalized to standard temperature and pressure (STP: 1013 hPa, 273.15 K).
2.2. Pilot-Scale Setup
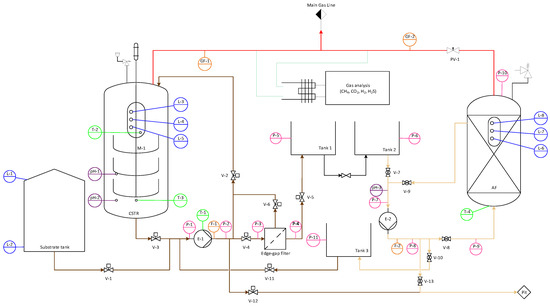
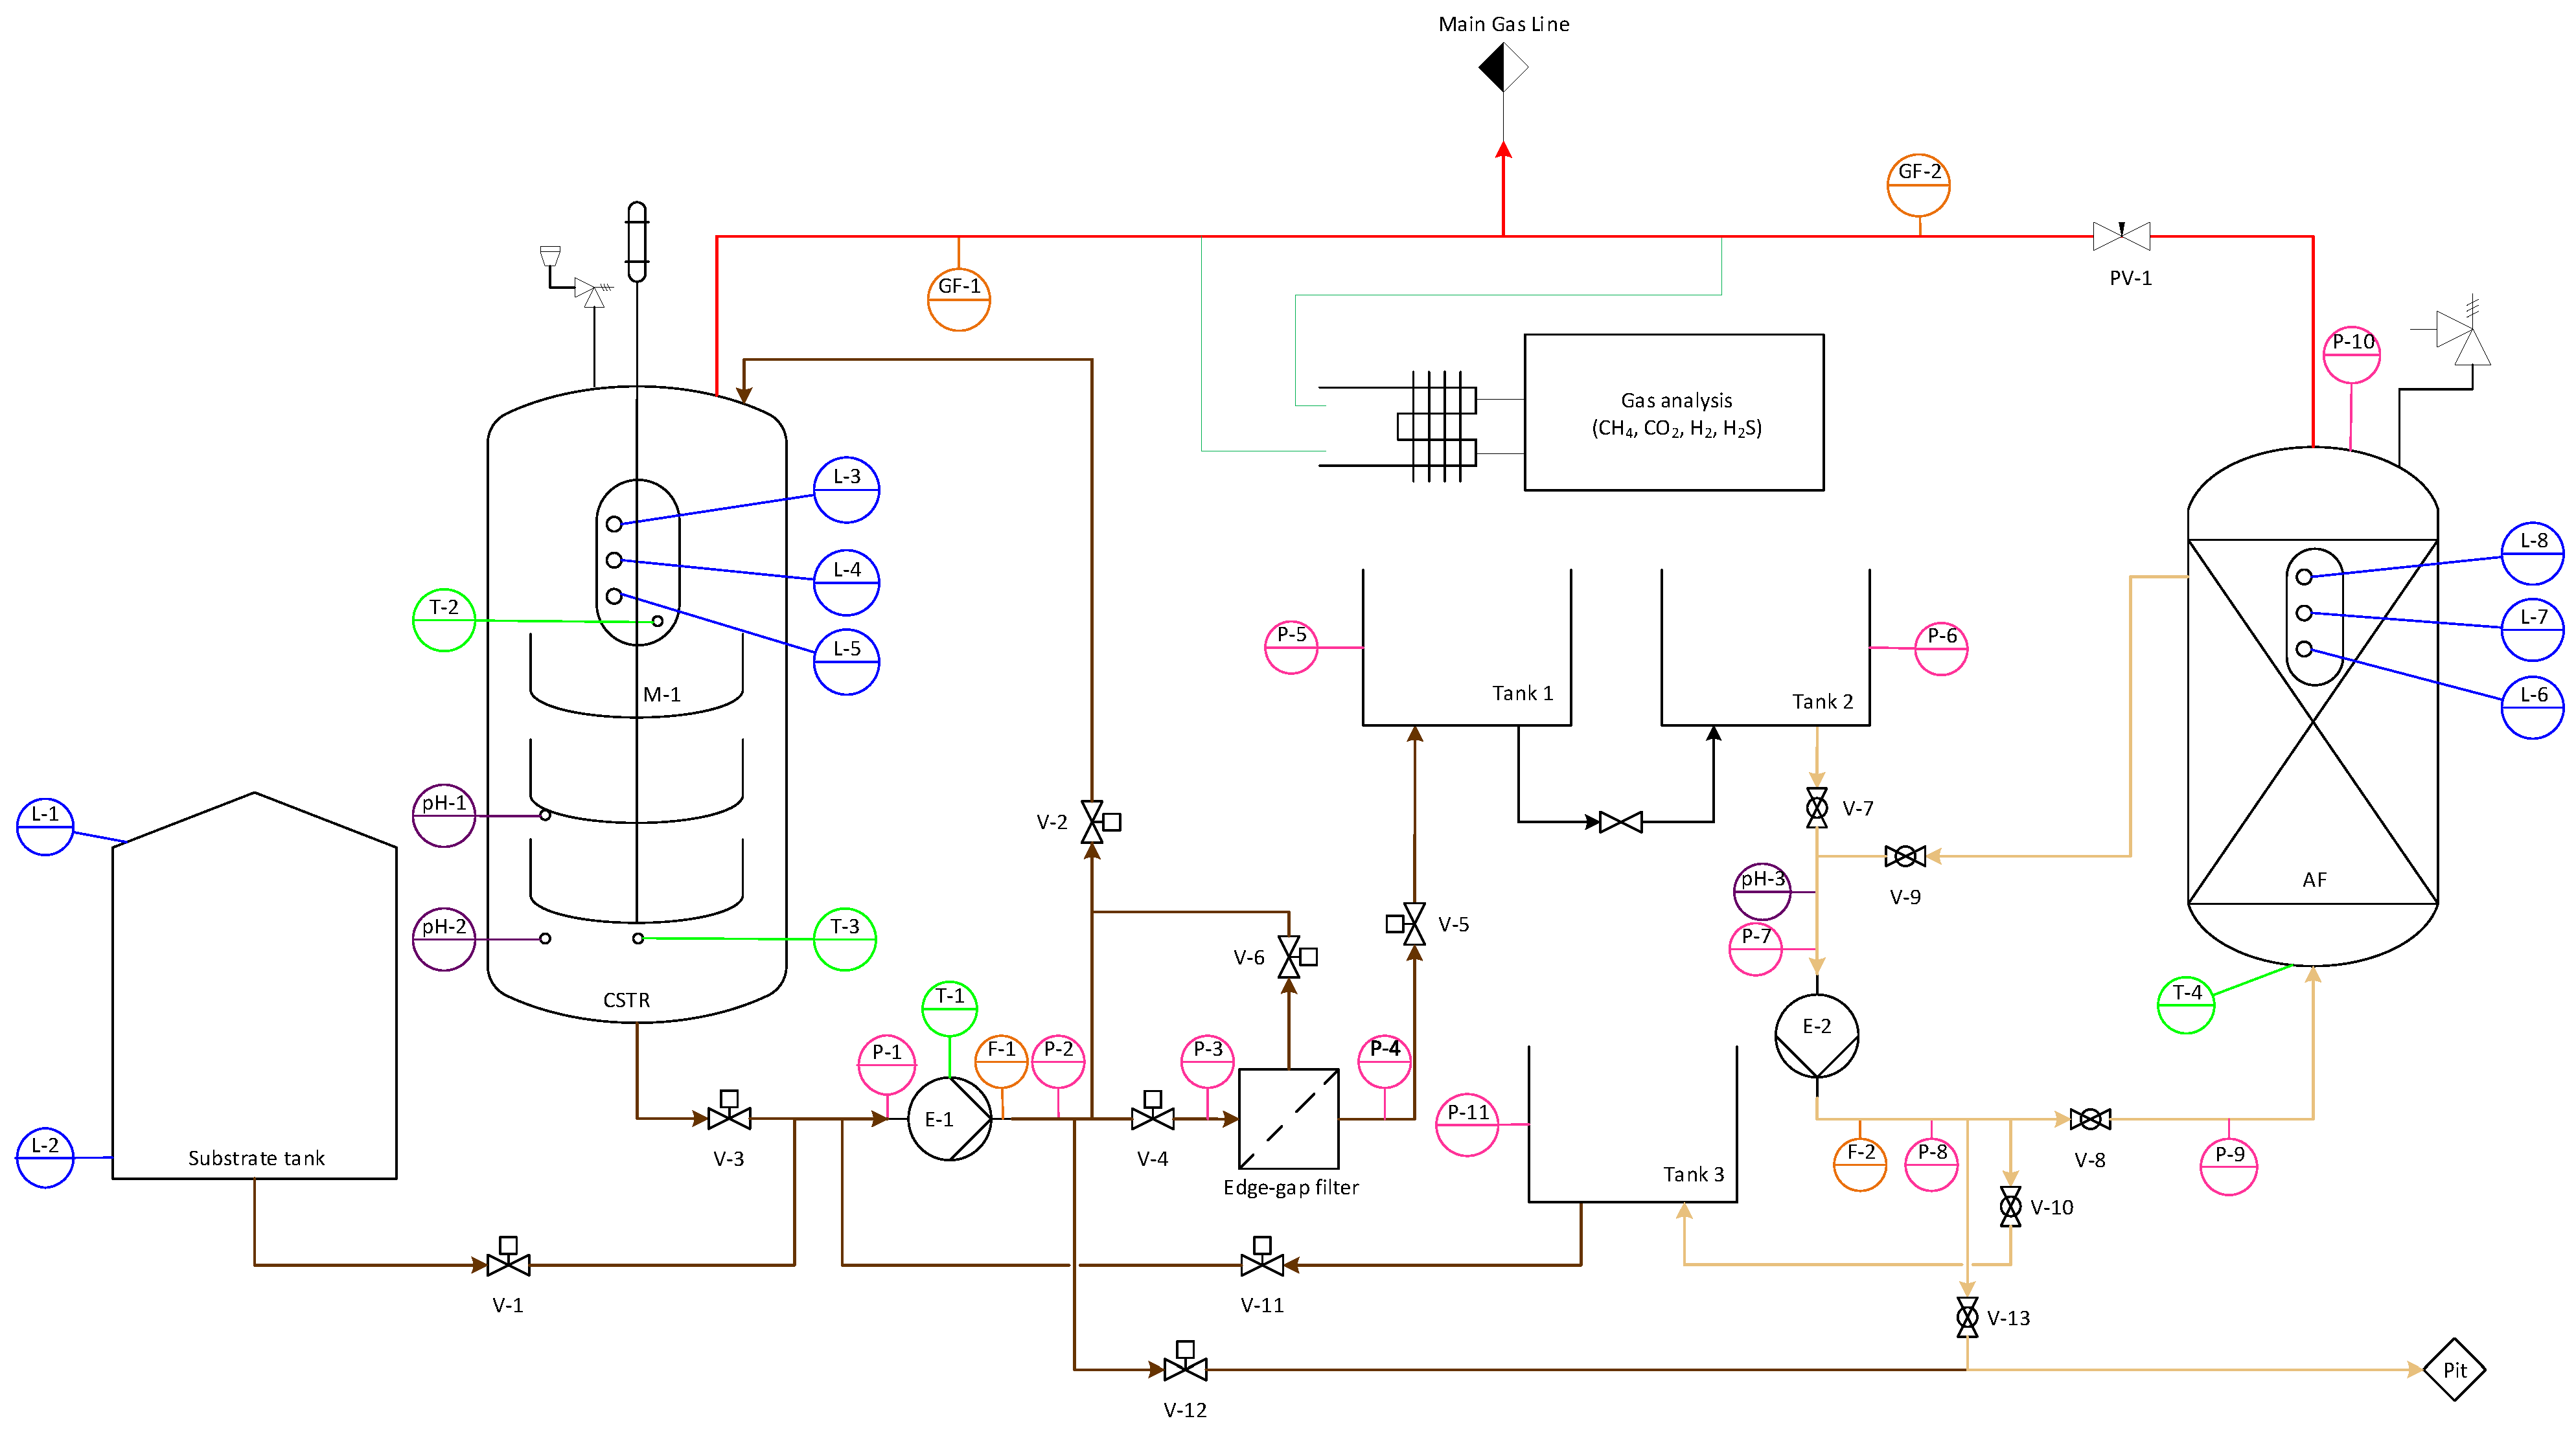
Figure 3.
Piping and instrumentation diagram (P&ID) of the pilot-scale (PS) plant, showing main components and material flow. Sensors are color-coded for easy identification: blue indicates level, pink for pressure, green for temperature, purple for pH, and yellow for flow. The brown streams represent the liquid flow within the system, with dark brown for ambient pressure pipes and light brown for high-pressure pipes. The red stream shows the biogas produced in each reactor, accompanied by a thin green pipe used to collect samples for gas quality analysis.
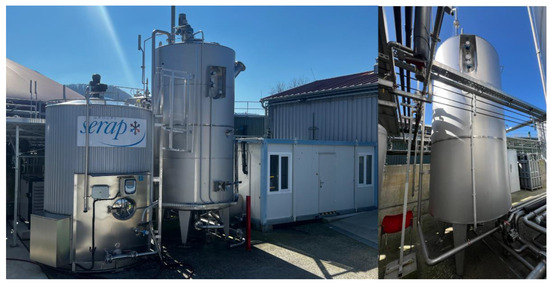
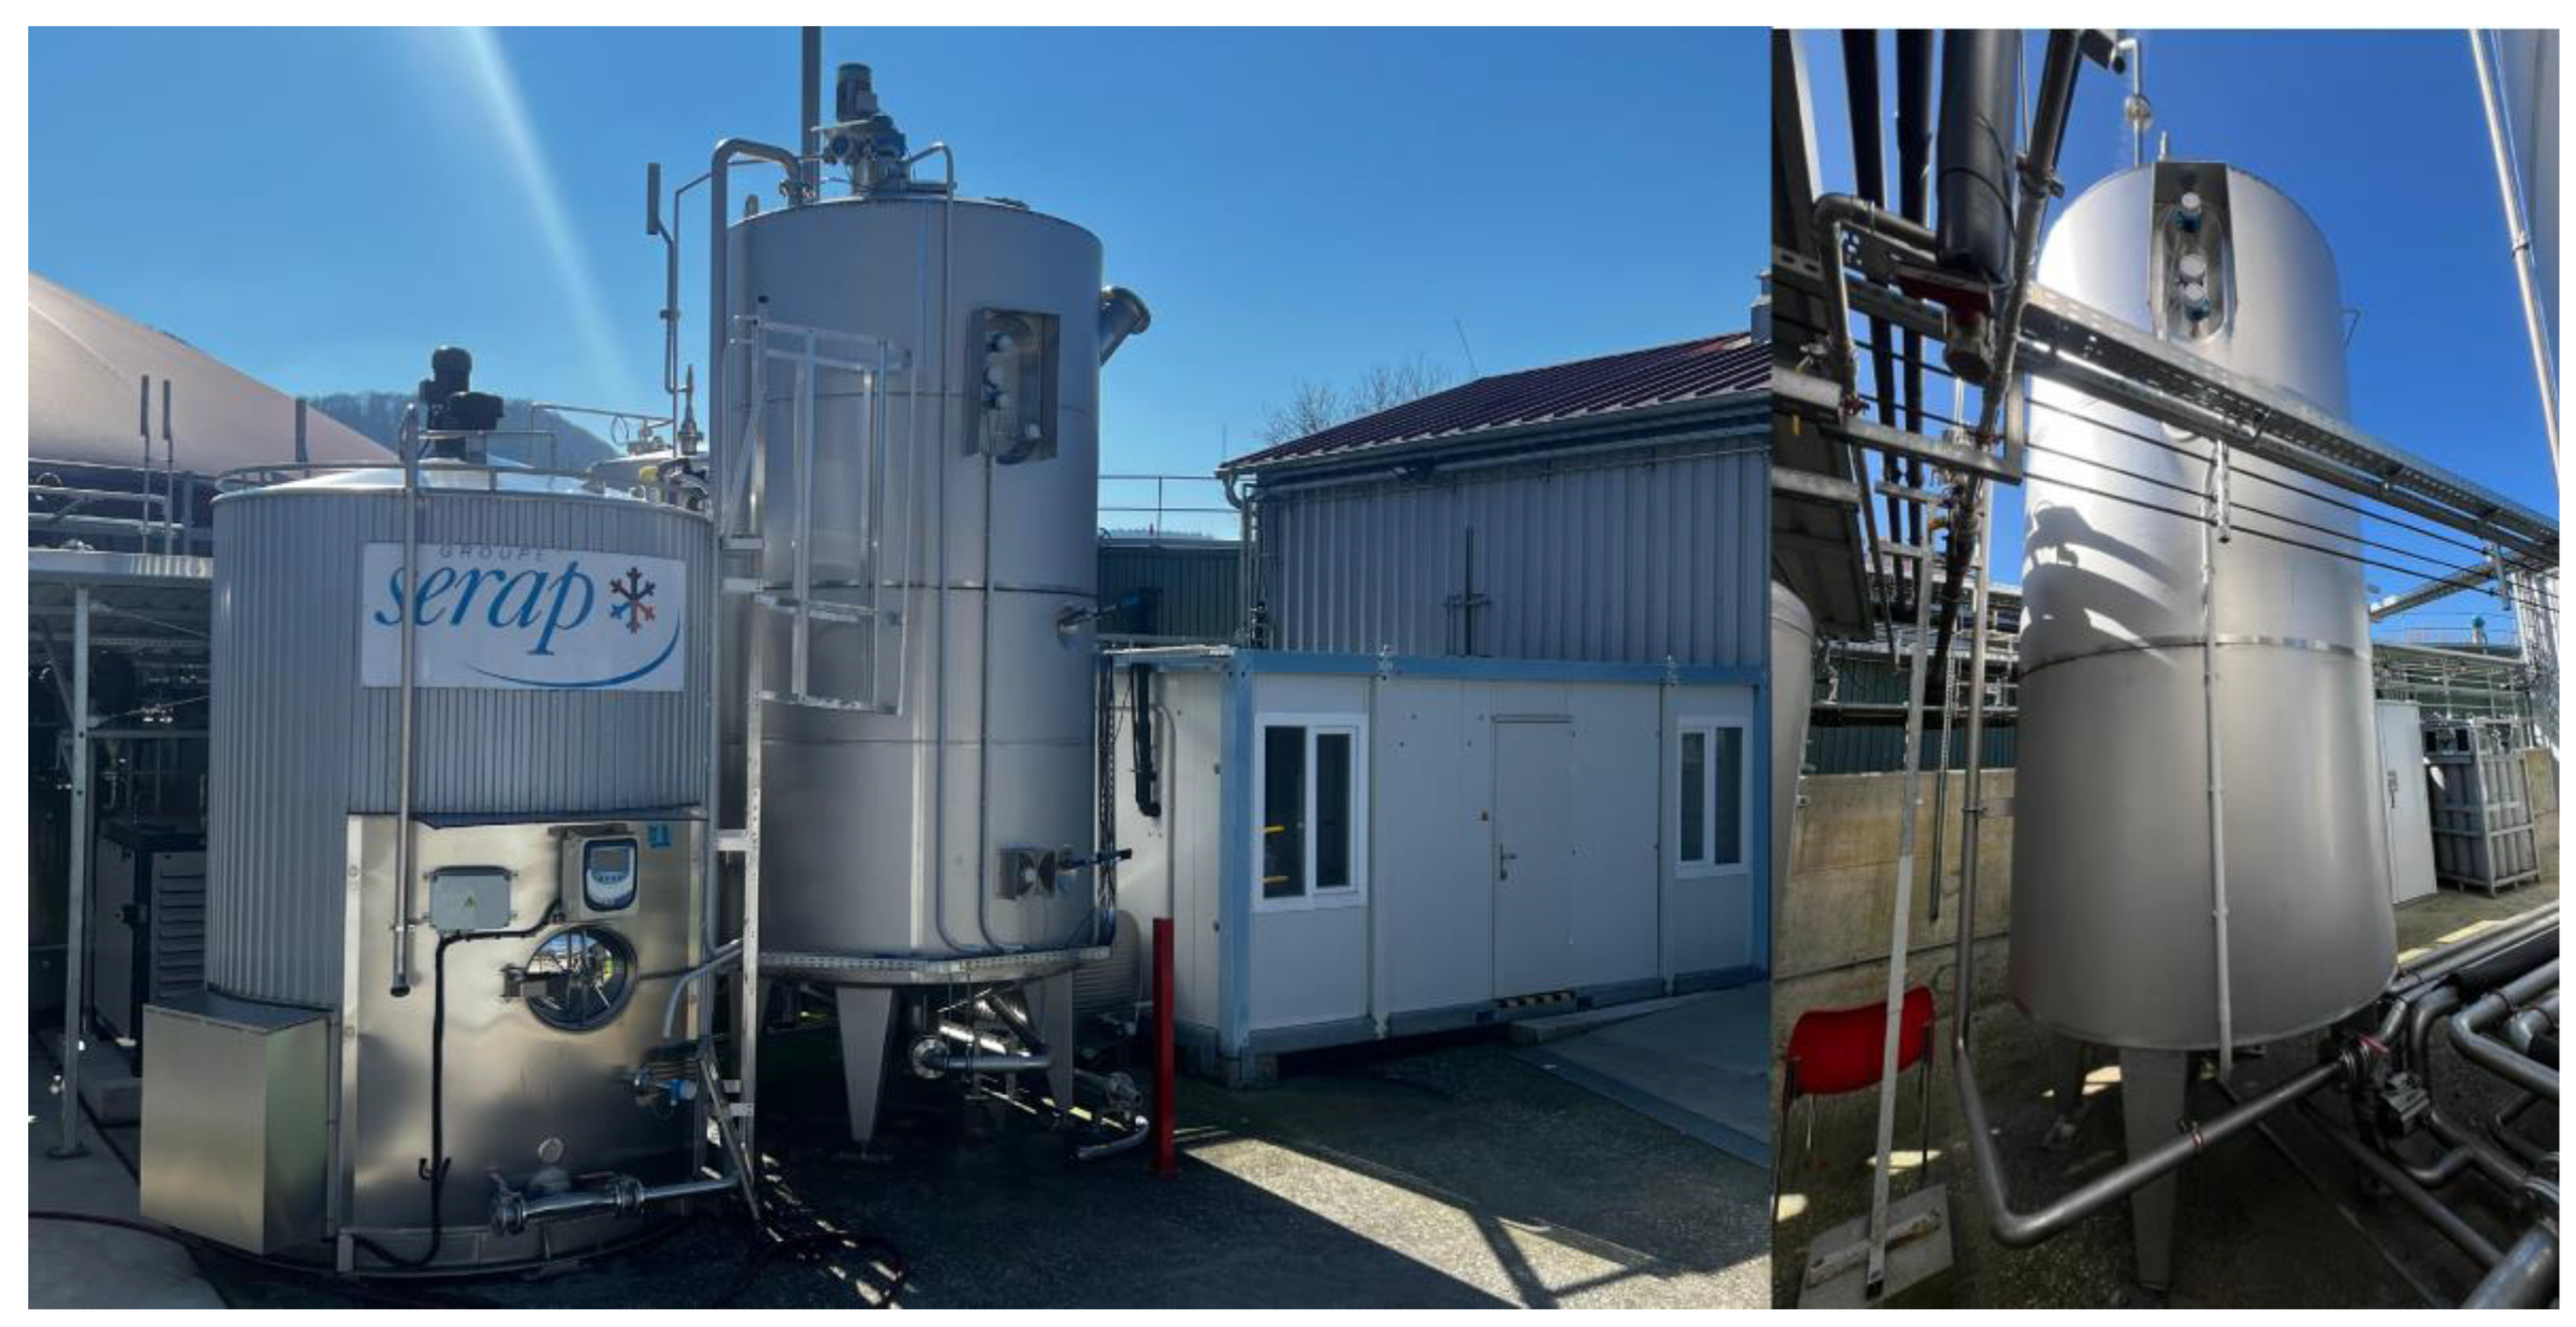
Figure 4.
Pilot-scale (PS) configuration. From left to right: substrate tank, continuous stirred-tank reactor (CSTR), pump container, and 2nd-stage anaerobic filter (AF).
The system was adapted from the LS using a similar setup. The substrate tank is a 10 m3 double-walled unit (type FIRST.SV 2.0, Groupe Serap, Gorron, France), featuring an interior stainless-steel lining and built-in mixing and cooling functions to prevent pre-digestion during storage. The tank is equipped with two level sensors: one for filling level monitoring and the other for detection of the minimum level (L-1, type VEGAPULS 11, VEGA Grieshaber KG, Schiltach, Germany; and L-2, type Liquicap M FEI52, Endress + Hauser GmbH + Co. KG, Weil am Rhein, Germany).
The first stage comprised a stainless-steel CSTR with a total volume of 13 m3 and a working volume of 10m3 (RIEGER Behälterbau GmbH, Bietigheim-Bissingen, Germany). The reactor was equipped with an agitator with 3 impellers (M-1, type VP2-650, MUT-Tschamber Misch- und Trenntechnik GmbH, Wher, Germany) to ensure proper mixing of the digestate inside the reactor. The CSTR was equipped with seven sensors. Three of them were for maximum-, target-, and minimum-level detection (L-3, type Liquicap M FTI51, L-4, type Liquiphant FTL51B, L-5, type Liquicap M FTI51). Following this, two pH sensors (pH-1 and pH-2, type CPS16D) were installed, with an integrated manual retractable assembly (Cleanfit CPA450, Endress + Hauser GmbH + Co. KG, Weil am Rhein, Germany) that allowed the removal of the sensors for calibration without emptying the reactor. Lastly, two temperature sensors detected the temperature from the top and bottom of the reactor (T-2 and T-3, model TR10). All installed sensors from this reactor were from Endress + Hauser GmbH + Co. KG, Weil am Rhein, Germany.
The feeding and all pumping processes occurring within the first stage were carried out by the eccentric screw pump with an integrated temperature sensor that prevented overheating of the pump (E-1, type BN 10–12S, and T-1, type Pt1000, SEEPEX GmbH, Bottrop, Germany). To control all the parameters in the pump, three more sensors were installed. Two of them measured the pressure before and after the pump (P-1, type PR20, SEEPEX GmbH, Bottrop, Germany, and P-2, type Cerabar PMP11, Endress + Hauser GmbH + Co. KG, Weil am Rhein, Germany). Lastly, a flow sensor monitored the flow (F-1, type PROMAG 55, Endress + Hauser GmbH + Co. KG, Weil am Rhein, Germany).
To achieve effective fiber retention in the initial reactor, a self-cleaning edge gap filter (type AS175, MTS & APIC Filter GmbH & Co. KG, Bad Liebenzell, Germany) was installed. The filtration occurred from the outside inward, with solids collecting on the exterior of the filter element. A gear motor rotated the cylindrical wedge wire, while a scraper blade removed solids from its outer surface. Two pressure sensors (P-3 and P-4, Cerabar PMC11, Endress + Hauser GmbH + Co. KG, Weil am Rhein, Germany) monitored the pressure on the filter’s inlet and outlet pipes. A high-pressure difference indicated fiber buildup on the filter, signaling the need for cleaning. The cleaning process flushed the fibers back to the reactor, restoring normal pressure and allowing filtration to continue. The filtered material was stored in two stainless-steel intermediate tanks with a 1600 L capacity each. Two relative pressure sensors (P-5 and P-6, type Ceraphant T PTC31, Endress + Hauser GmbH + Co. KG, Weil am Rhein, Germany) were installed to measure the filling level of the tanks.
The second stage reactor was a stainless-steel packed-bed reactor, with a total volume of 5.6 m3 (RIEGER Behälterbau GmbH, Bietigheim-Bissingen, Germany). To allow the growth of microbial communities, the reactor was filled with a packing material made of polyethylene, with a surface area of 307 m2 m−3 (type Bioflow 40, RVT Process Equipment GmbH, Marktrodach, Germany). After filling the reactor with the packing material, the working volume of the AF was determined to be 4.7 m3. The AF was equipped with six sensors. Three sensors measured the minimum, target, and maximum levels (L-6, type Liquicap M FTI52, L-7, type Liquiphant FTL51B, and L-8, type Liquicap M FTI51). Two sensors measured the pressure in the liquid and gas phases (P-9, type Vegabar 28, and P-10, type Vegabar 29, VEGA Grieshaber KG, Schiltach, Germany). Lastly, a temperature sensor was located on the bottom of the reactor (T-4, type TMR31). The temperature and level sensors were purchased from Endress + Hauser GmbH + Co. KG, Weil am Rhein, Germany.
The operation of all pumping processes happening in the AF, including feeding and circulation, was carried out by the eccentric screw pump (E-2, type BN 17–24, SEEPEX GmbH, Bottrop, Germany), which can operate up to a pressure of 10 bar. The same sensors present in the pump E-1 were also present in E-2, with the addition of a pH sensor to measure pH during the circulation process (pH-3, type CPS16D, Endress + Hauser GmbH + Co. KG, Weil am Rhein, Germany). The pH sensor was mounted on an automatic retractable assembly (Cleanfit CPA871, Endress + Hauser GmbH + Co. KG, Weil am Rhein, Germany), allowing for easy calibration. The effluent collected from the AF went to Tank 3, an intermediate tank with the same specifications as Tanks 1 and 2, and could either be fed back to the CSTR or discarded.
The automatic valves involved in the process were of two distinct types. Valves V-1 to V-6, plus V-11 and V-12, were knife gate valves (type VNC, Sistag GmbH, Ettlingen, Germany), and valves V-7 to V-10 plus V-13 were ball valves (type SC150, Christian Bürkert GmbH & Co. KG, Ingelfingen, Germany). A pressure regulator needle valve with a pneumatic control unit was installed on the gas outlet pipe from the second reactor. This valve (PV-1, type 8697, Christian Bürkert GmbH & Co. KG, Ingelfingen, Germany) allowed for continuous regulation of system pressure by adjusting the valve position via pneumatic actuation, ensuring precise control of the process pressure. The pipes represented in dark brown were designed for ambient pressure, and had a nominal diameter of DN 80, while the light brown, for higher pressure, had a nominal diameter of DN 50. Both reactors were thermally insulated and equipped with an external helical coil, in which hot water was circulated. This configuration ensured effective heat transfer to the reactor while reducing heat loss to ambient, thereby maintaining a stable operating temperature.
2.3. Scale-Up Costs
The influence of scale on construction costs was analyzed by examining the actual material and construction expenses incurred by the LS and PS plants. The LS plant was constructed between 2011 and 2016, whereas the PS plant was built from 2018 to 2025. To account for inflation, adjustments were made using the German Consumer Price Index, and all costs were converted to constant prices based on the reference year 2025 [40]. To compare cost differences between the two systems, the cost–capacity relationship outlined in Equation (1) was employed, where C1 and C2 represent the construction costs of the smaller and larger plants, respectively; V1 and V2 denote their corresponding system volumes; and n is the scale exponent [41].
2.4. Mass Balance
To generate data for the mass balance, the LS system previously described was operated with cattle manure (from “Bauer”, Filderstadt, Germany) containing 5% (m/m) dry matter (DM) and 3.75% (m/m) volatile solids (VSs). The reactors were run under mesophilic conditions at 37 °C in both stages, with a total HRT of 25 days, equally divided between both stages, and an OLR of 1.5 gVS L−1 d−1. No pH control was applied. The inoculum consisted of separated liquid digestate obtained from the research station “Unterer Lindenhof” in Eningen, Germany. The system was operated for a period of three HRTs, which was considered sufficient to adapt the microbial community to the operating temperature and to allow biofilm development in the AF. The reactor was fed with 8000 g d−1 of fresh mass, corresponding to 300 gVS d−1. To determine the biodegradability of the substrate, its specific methane potential (SMP) was initially determined through a laboratory batch test conducted at 37 °C, following the method outlined by Hülsemann et al. (2020) [42]. The process involves incubating small substrate aliquots with active inoculum in sealed bottles, with periodic CH4 measurements, following the VDI 4630. These data were used solely to support the simplified mass balance estimation for the PS plant and were not intended as a full process-performance evaluation.
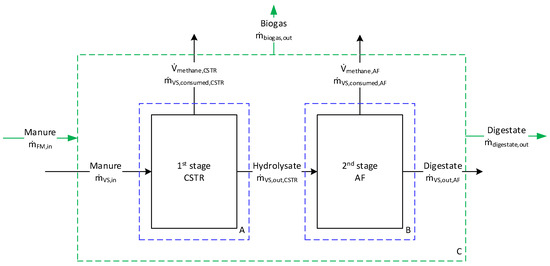
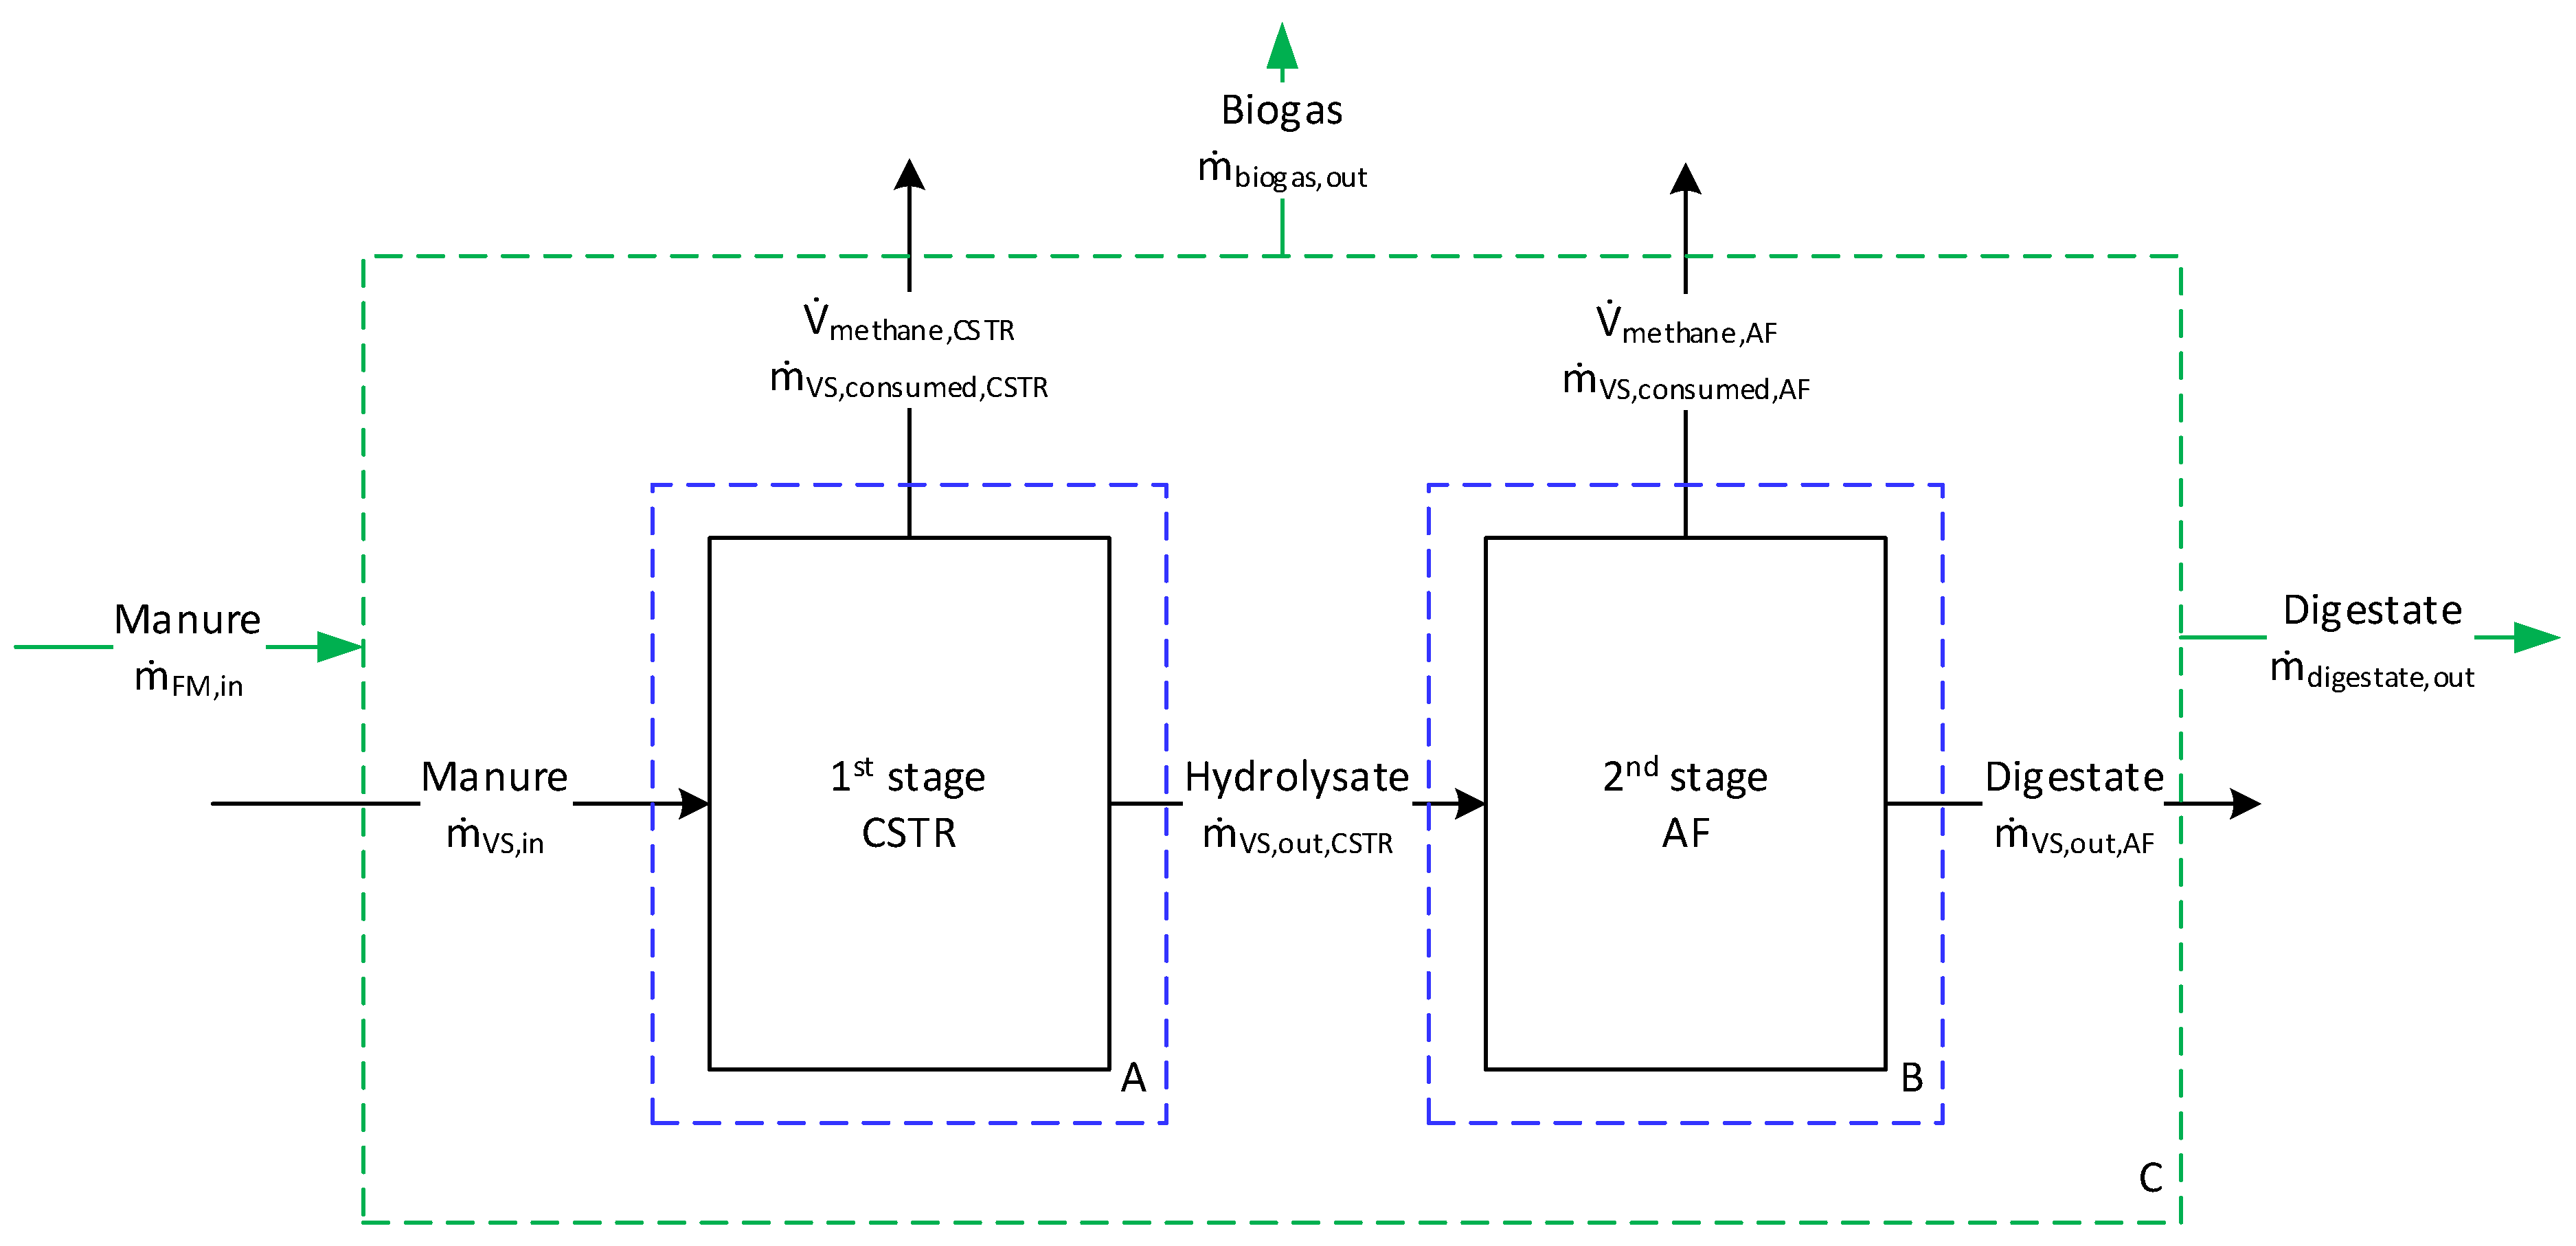
The mass balance was performed on a VS basis to calculate CH4 generation in each stage, and later on an FM basis to determine the final digestate output. The system boundaries and associated streams are shown in Figure 5, where boundary A represents the first-stage CSTR and boundary B the second-stage AF. Boundary C represents the whole system.
Figure 5.
System boundaries and streams considered for the mass balance. Boundary A corresponds to the first stage while B is the second stage.
The VS degradation in each stage was described using stage-specific conversion efficiencies (η1 and η2), defined as the fraction of VS consumed relative to the inlet of each stage. CH4 production was calculated based on the SMP, assuming proportionality to the amount of VS degraded. Finally, the digestate was calculated on a fresh matter basis as the difference between the total fresh feedstock input and the mass of biogas produced.
Mass flows across boundaries A, B, and C are described in Equations (2)–(4), respectively.
The values for the CSTR and AF was calculated according to Equations (5) and (6), respectively.
The CH4 volume produced in the first and second stages was calculated according to Equations (7) and (8), respectively.
The efficiency of the first (η1) and second (η2) stages could be determined considering the outcomes from the laboratory experiment using the Solver function from Excel®.
The produced CH4 volume was converted into mass using the ideal gas law, applying the molar volume of a gas under standard conditions and the molar mass of CH4. Finally, the total biogas mass was calculated by accounting for CH4 as the main component and scaling it according to the assumed biogas composition (i.e., CH4 fraction obtained in the laboratory experiments), thereby deriving the overall biogas output from the system. The formula used to calculate the mass is shown in Equation (9), where VCH4 and VCO2 are the volumes of each gas produced; MCH4 and MCO2 are their respective molar masses in g mol−1; and Vm is the molar volume of 22.414 L mol−1.
With all the parameters well defined for the LS plant, the same procedure was used to estimate the gas and digestate productions at the PS plant at the same OLR level and also extrapolating to a maximum OLR of 5 gVS L−1 d−1.
3. Results
3.1. LS and PS System Design Comparison
This chapter presents a detailed comparison between the two systems, focusing on their configuration, hydraulics, instrumentation, control, and the key challenges associated with scale-up.
3.1.1. Reactor and Hydraulic Configuration
The comparison of the main reactor and hydraulic components between the LS and PS is summarized in Table 1.
Table 1.
Geometry and hydraulics comparison between laboratory-scale (LS) and pilot-scale (PS) plants.
Regarding the first stage, there is a notable difference in reactor design: the LS system employs a horizontal CSTR, while the PS system utilizes a vertical one. This vertical orientation was selected to optimize installation space, as a vertical reactor occupies less floor area than horizontal ones. The scale-up factor was determined based on the first stage, considering that hydrolysis, the rate-limiting step of AD, occurs primarily in this reactor [3]. The scale-up factor was set at 100, indicating that the PS reactor volume is 100 times larger than that of the LS. Additionally, the headspace ratio increases from 19% in the LS to 23% in the PS. The increased headspace in the PS reactor can enhance pressure stability, improve the accuracy of biogas measurements, and bolster the robustness of gas composition analysis [43]. In the second stage, the reactor configuration remained unchanged, utilizing a packed-bed reactor with a volume 47 times larger in the PS. Additionally, the headspace was raised from 9% to 16% in the PS.
Another difference between the two setups relates to their pump configurations. In the LS system, no pump is used for feeding the CSTR; instead, the feed volume is determined by the volume of the pipeline segment between the feeding valves, which is fixed at 1 L. As a result, feeding can only occur in multiples of this volume. Conversely, the PS system employs a progressive cavity pump that allows for precise feeding of any volume, with a maximum flow rate of 4 m3/h. In the LS system, feeding the AF is achieved through a centrifugal pump, whereas in the PS system, a progressive cavity pump is used. The same pump is also used for circulation in the AF, with a higher maximum flow rate of 10 m3/h and operating at pressures up to 10 bars.
One of the fundamental principles of the two-stage AD plant is the retention of fibrous material in the first stage for further degradation. On the LS, this is achieved by installing a sieve within the CSTR, which partitions it into two separate chambers: one for solids and one for liquids. However, this method does not scale effectively for larger systems due to issues such as clogging, maintenance challenges, and limited operational control. At the PS, this approach was improved by implementing an edge-gap filter. This filtration system functions from the outside in, with digestate flowing across a cylindrical wedge-wire element where solids settle on the external surface. The filter’s rotation, driven by a gear mechanism and complemented by a scraper blade, allows continuous removal of accumulated fibers, thereby preventing clogging and ensuring stable operation. The cleaning cycle is automatically initiated when pressure sensors detect a pre-defined pressure difference between the filter’s inlet and outlet. An increased pressure drop signifies fiber accumulation, triggering a cleaning process that flushes the retained solids back into the first-stage reactor.
The filtration process highlights a key difference between the LS and PS systems also regarding intermediate storage tanks. In the LS setup, the filtered liquid stays within the reactor, with the second-stage AF being fed directly from the CSTR. When the CSTR is fed, an equal volume of liquid is immediately transferred from the filtered compartment to the AF. In contrast, the PS system uses intermediate tanks to isolate each stage, allowing the filtered liquid to be collected and stored before feeding into the AF. This setup enables the independent operation of both stages, with adjustable feeding rates and HRTs. Additionally, while excess effluent from the AF is discarded in the LS system, in the PS system, it can be recirculated back to the CSTR or collected for external use, such as a nutrient-rich fertilizer.
A further enhancement was achieved in the biogas analysis process. At the LS, the gas analyzer was limited to measuring the concentrations of CH4, CO2, and H2 in the biogas. However, these measured components often did not sum to 100%, suggesting the presence of unmeasured gases. In contrast, the PS setup employed a more advanced gas analyzer capable of quantifying additional gases such as oxygen (O2) and hydrogen sulfide (H2S), along with calculating both the net and gross calorific values. The gross calorific value indicates the maximum potential energy content of the biogas, whereas the net calorific value reflects the amount of energy that can practically be recovered. The difference between these two values is significant for assessing energy efficiency and informing process design.
The final distinction between setups involves the potential for high-pressure operation of the AF within the PS. Given the greater solubility of CO2 in liquids compared to CH4, CO2 is removed from the AF along with the liquid stream. As a result, the upgraded biogas achieves a CH4 concentration of approximately 79% at 10 bar, according to the literature [44].
3.1.2. Instrumentation and Control System
The shift from LS to PS operation involved a significant enhancement in instrumentation and process control capabilities. Although both plants operated with full automation, the LS system featured more limited data acquisition and management, whereas the PS configuration incorporated a wider sensor network and more sophisticated data handling. This advancement enabled more comprehensive monitoring of processes and greater flexibility in operations.
The level sensing systems differ between the LS and PS plants. The LS plant utilizes only three sensors, while the PS plant is equipped with eleven: seven point-level detectors, three relative-pressure sensors, and one radar sensor. The LS substrate tank lacks a level sensor, whereas the PS tank includes two sensors. The radar sensor positioned at the top of the tank provides continuous measurement of the liquid level, whereas the point-level sensor at the bottom serves to detect the minimum level and stop the feeding process until refilling occurs. In the LS configuration, the CSTR is fitted with two level sensors addressing minimum and maximum levels, while the AF uses a single sensor for the maximum level. In the PS, both reactors in the setup are equipped with three sensors each (minimum, target, and maximum levels), automatically disengaging the process when the maximum level is reached, or the minimum level falls below. The three additional relative-pressure sensors incorporated in the PS for level detection are absent in the LS, due to the absence of intermediate tanks in it.
The temperature and pH sensors are similarly configured in both systems; however, the PS plant is more extensively instrumented. In the LS setup, each reactor is fitted with only one temperature sensor and one pH sensor, positioned at a single point and calibrated solely when the reactors are emptied. This approach limited the frequency of calibration and allowed digestate buildup that impaired measurement accuracy over time. In contrast, the PS CSTR is equipped with two temperature sensors and two pH sensors, placed at different heights along the reactor to monitor the vertical distribution of temperature and pH. The retractable assemblies connected to the PS pH sensors enable easy removal from the reactor or feeding line for frequent calibration without the need to empty the system, thereby enhancing measurement reliability.
The LS system was not designed to work under high pressures and therefore had no pressure sensor installed. In contrast, the PS had several sensors controlling pressure at the inlet and outlet of the pumps and the filter, as well as two in the AF to monitor pressure in the liquid and gas phases. Additionally, a pressure controller valve was installed in the second stage to release gas whenever the set pressure is reached.
The flow sensors differ significantly between the two configurations. At LS, a single flow sensor monitors the hydrolysate feed to the AF. In contrast, the PS plant employs two liquid flow sensors installed in the feeding pumps, allowing for real-time monitoring of the liquid inflow into each reactor, and two additional gas flow sensors positioned at the outlet of each reactor, enabling continuous measurement of gas production. While the LS setup involved collecting gas from each reactor into bags for periodic analysis, the PS system provides continuous, online data on gas flow and cumulative biogas production.
Finally, data management represents a significant advancement within the PS system. Unlike the LS configuration, which logs data every 60 s, the PS plant records measurements at a five-second interval, allowing for a more detailed temporal analysis of process dynamics. Additionally, the PS system monitors a broader range of parameters, including the frequency, current, apparent power, and mechanical power of all motors in the facility, such as pumps, filters, and agitators. These data facilitate a comprehensive and precise evaluation of the plant’s energy consumption, thus supporting a thorough energy balance assessment.
3.1.3. Operational Challenges and Scale-Up Implications
The implementation of PS signifies a crucial phase bridging the feasibility of LS with large-scale operation [37]. Nonetheless, it remains considerably smaller than an actual industrial plant, typically by a factor of 80 to 100 in terms of volume and capacity. At this intermediate stage, the system must process feedstocks comparable to those encountered at full scale, such as fibrous, high-viscosity substrates including manure-rich mixtures, lignocellulosic residues, or municipal organic waste, rather than simplified, diluted, or pre-filtered laboratory materials [45]. Consequently, the PS system encounters authentic rheological and fluid dynamic challenges: uneven mixing, elevated power requirements for agitation, potential clogging of pumps and filters, and the development of dead zones or short-circuiting flow patterns [46]. These issues are subtle in small reactors but become significant, affecting process efficiency. Addressing these challenges demands industrial-grade equipment, heavy-duty pumps, agitators, and screening or filtration systems, and reactor geometries that reflect real-world constraints, which in turn influence variables such as volatile fatty acids distribution, pH gradients, and overall process stability.
Operating the PS plant involves more than just mechanical and hydraulic challenges; it also requires adherence to engineering, safety, and regulatory standards [47]. Full-scale biogas plants demand extensive documentation, including P&IDs, safety and hazard analyses, construction permits, and quality-control records for materials and welding. When a PS plant is designed, many of these procedural requirements must be applied, introducing a level of bureaucracy and administrative complexity that far exceeds that of a simple LS experiment. This includes detailed internal reporting and data logging, as well as external compliance with local environmental and occupational safety regulations, which can delay construction and start-up and demand close coordination among engineers, authorities, and operators.
From a financial standpoint, these requirements substantially increase the capital investment relative to LS, even though the total outlay remains well below that of a full-scale commercial plant [45]. Costs come from the larger reactors, more robust and standardized components, advanced instrumentation and data-acquisition systems, and the engineering and permitting overhead, elements that are often negligible at LS.
The main potential failure points for the PS system are outlined in Table 2. This overview maps key units, challenges, root causes, and mitigation strategies to ensure stable scalability.
Table 2.
Summary of operational risks associated with the pilot-scale (PS) configuration, categorized by process unit and including causes, consequences, and mitigation strategies.
Although these additional challenges exist, PS testing remains crucial because such systems are considerably more affordable than full-scale plants, easier to design and adapt, and simpler to implement on smaller farms. Operating at this scale allows researchers to assess process efficiency, equipment performance, and control strategies under real substrate conditions while maintaining flexibility and reducing financial risk. Ultimately, PS plants serve as an essential stepping stone, helping to bring innovative biogas solutions to decentralize farming communities and contribute to a cleaner, more sustainable future.
3.2. Scale-Up Costs Analysis
The actual construction expenses for the LS and PS setups are presented in Table 3.
Table 3.
Distribution of actual construction expenditures for laboratory-scale (LS) and pilot-scale (PS) setups across the main cost categories.
To facilitate the comparison between both systems and to identify the main cost drivers, the expenditures were assigned to six categories. Electrical, electronic, and automation components encompass items used for power supply, control, and signal transmission, including control cabinets, PLCs, relays, power supplies, cables, connectors, pneumatic components, switches, protection devices, and data acquisition hardware. Manufacturing and fabrication involve custom-built and project-specific parts such as reactors, tanks, vessels, and other fabricated units. Services and engineering refer to non-material expenses associated with plant realization, covering assembly, installation, engineering, design, consulting, programming, and logistics. Fluid and process systems comprise components designed for the transportation, containment, and processing of liquids and gases, including pipes, hoses, fittings, valves, pumps, filters, gas systems, and heat exchange or cooling devices. Sensors and instrumentation encompass equipment used for process monitoring and analytical control, such as temperature, pressure, and flow sensors, gas analyzers, pH probes, and transmitters. Mechanical components and hardware consist of standard structural and assembly parts, including screws, bolts, nuts, bearings, springs, seals, gaskets, mounting materials, insulation, and other mechanical support elements.
The PS plant was substantially more expensive than the LS setup, with total construction costs increasing from EUR 98,732.95 to EUR 611,611.99; however, this increase was not uniform across categories. In absolute terms, manufacturing and fabrication saw the largest increase, rising from EUR 20,611.46 in the LS setup to EUR 296,407.97 in the PS setup. Fluid and process systems also experienced a significant rise, increasing from EUR 20,611.46 to EUR 191,264.52. These two categories are the main contributors to the higher investment cost in the PS, due to increased material needs, fabrication effort, and the complexity of fluid handling and process integration in the PS plant. Electrical, electronics and automation costs grew notably, from EUR 9560.96 to EUR 61,285.85, reflecting the greater requirements for power supply, control, and automation infrastructure in the PS system.
Some categories experienced only moderate increases despite a significant overall scale. Sensors and instrumentation grew from EUR 31,677.14 to EUR 42,792.68, while services and engineering increased from EUR 3851.62 to EUR 13,631.27. A portion of the analytical, monitoring, and engineering efforts was already in place at the LS plant and did not scale directly with reactor volume.
The distribution of costs significantly differed between the two scales. In the LS setup, sensors and instrumentation accounted for the largest portion of the total investment at 32.1%, followed by manufacturing and fabrication and fluid and process systems, each comprising 20.9%. Conversely, the PS setup was primarily composed of manufacturing and fabrication (48.5%) and fluid and process systems (31.3%), together constituting nearly 80% of the total cost.
The scale-up cost analysis yielded a scaling exponent n of 0.396 for a 100-fold increase in the first reactor’s volume. In the cost–capacity relationship, this exponent reflects how construction costs respond to changes in plant size [41]. An n value of 1 indicates that costs increase proportionally with volume; so, a 100-fold increase in volume would lead to a 100-fold rise in costs. An n less than 1 suggests that costs grow less than proportionally, demonstrating economies of scale. Consequently, a lower n value signifies greater cost advantages when scaling up.
The calculated exponent of 0.396 is below the widely accepted 0.6 rule, an empirical estimate commonly used in engineering economics to predict how equipment or plant costs scale with capacity. The 0.6 rule assumes costs increase proportionally to capacity raised to the 0.6 power, indicating economies of scale since cost growth is slower than size increase [48]. The lower exponent here indicates an even more pronounced economy of scale than traditionally anticipated. The development of the PS system demonstrated that building larger reactors could be achieved with relatively less additional cost, thereby improving cost efficiency at larger scales.
3.3. Mass Balance
To enable an accurate mass balance estimation for the PS plant, experimental data were obtained from the LS system. The gas production results for each stage, as well as for the overall two-stage system, are presented in Table 4.
Table 4.
Summary of measured biogas production and derived mass balance parameters for the laboratory-scale (LS) system, including biogas production, specific methane yield (SMY), conversion efficiencies (η), and digestate mass, reported on volatile solids (VSs) and fresh mass (FM) bases.
The CSTR produced approximately 38 L d−1 of biogas with an average CH4 content of 55%, while the AF generated 28 L d−1 with a CH4 content of 60%. In addition, the SMP was determined as 0.140 LCH4 gVS−1. This value is lower than the ones reported in literature, which are usually in the range of 0.190–0.210 LCH4 gVS−1, but it served as a benchmark to evaluate the experiments carried out [49,50]. Based on measured CH4 production, SMP, and daily VS input, the conversion efficiency of each stage was calculated. This efficiency was defined as the ratio between the specific methane yield (SMY) achieved in each stage and the corresponding SMP. The LS system achieved approximately 50% SMP conversion in the first stage and 40% in the second stage, yielding an overall efficiency of 89.7%. This two-stage setup allows the retention and further degradation of the fibers, exploring the full potential of hard-degradable substrates and allowing them to substantially exceed single-stage manure digestion performance. It is reported in the literature that full-scale biogas plants can leave more than 50% of the substrate’s potential unexploited in the digestate [51]. Approximately 7.9 kg d−1 of digestate were produced, which could be valorized as fertilizer in agricultural fields.
Mass balances for the PS system were developed based on the experimentally determined conversion efficiencies for the LS configuration. The SMP considered (0.210 m3CH4 kgVS−1) was the one reported in the literature, as it can vary depending on the substrate [49]. The OLR was kept consistent with the LS trials and limited to a maximum of 5 kgVS m−3 d−1. This threshold is recognized as the point for stable operation, as exceeding it can lead to excessive hydrolysis and volatile fatty acid build-up, both of which impede methanogenesis [52,53]. The resulting mass balances are presented in Table 5.
Table 5.
Theoretical mass balance for the pilot-scale (PS) system, including expected gas and digestate productions considering a specific methane potential (SMP) of 0.210 m3CH4 kgVS−1 and the same efficiencies as laboratory scale (LS) for organic loading rates (OLRs) of 1.5 and 5 kgVS m3 d−1.
At an OLR of 1.5 kgVS m3 d−1, biogas production is expected to be approximately 7.5 m3, with 4.3 m3 originating from the first stage and 3.2 m3 from the second stage. Assuming an average CH4 content of 55% throughout the system, this biogas yield translates to about 40 kWh of energy generated per day, given that each cubic meter of biogas with 55% CH4 content can produce 5.5 kWh [54]. When the OLR is increased, biogas production rises to approximately 16.5 m3 d−1, corresponding to roughly 90 kWh of energy daily. The 590 and 1312 kg d−1 digestate produced at OLRs of 1.5 and 5 kgVS m3 d−1, respectively, can also be used in agriculture. After leaving the CSTR, it can be separated into solid and liquid parts, while from the AF, depending on its DM content, it can be directly spread on fields.
It is important to note that these estimates were derived exclusively from manure digestion, which generally leads to relatively low energy yields because of its high water content and limited degradability. In AD systems, methane production is directly influenced by parameters such as pH, VFA formation, temperature, substrate potential, and biodegradability. Previous studies on the same CSTR + AF configuration show that these factors can substantially alter process performance. Kumanowska et al. reported improved degradation when pH was increased from 4.5 to 6.0 in a thermophilic CSTR followed by a mesophilic AF [36]. Ravi et al. observed increased VFA formation in vegetable waste digestion as pH rose from 5.5 to 6.0, although the specific methane yield decreased by 8% [17]. Likewise, Yeshanew et al. found that higher OLR increased VFA accumulation in the first stage, while the second stage, at the highest OLR, achieved a methane yield of 334 LCH4 kgVSadded−1 [34]. The literature results confirm that gas production is highly influenced by the characteristics of the substrate and the chosen operating conditions. They also suggest that the two-stage PS system is versatile and can be applied to a wider variety of substrates. An additional advantage that will be present in the PS is the potential to operate the second stage under elevated pressure, which can elevate the methane concentration in the biogas and thereby increase its energy yield [44].
4. Conclusions and Outlook
The successful development and implementation of the PS plant confirm the system’s technical feasibility and establish a solid basis for subsequent experimental investigations. The main innovation of this work lies in the separation of retention times for the solid and liquid fractions, which extends the conventional two-stage AD concept beyond simple phase separation and provides a new concept to be studied. The cost analysis showed that the increase in expenditure from LS to PS was driven primarily by custom fabrication and by the expansion of the process system, with a scaling exponent of 0.396. At the same time, the unit cost per reactor volume decreased with increasing plant size, demonstrating clear economies of scale.
Future work should focus on process optimization, particularly HRT, OLR, pH, and pressure, together with substrate-specific performance testing. An energy balance will also be essential to assess overall system efficiency and guide further development.
Author Contributions
Conceptualization, M.I.L.G. and A.L.; investigation, M.I.L.G.; writing—original draft preparation, M.I.L.G.; writing—review and editing, J.M. and A.L.; supervision, A.L.; funding acquisition, A.L. All authors have read and agreed to the published version of the manuscript.
Funding
This research was funded by Fachagentur Nachwachsende Rohstoffe e. V., under the project “DEMETHA”, grant number 2222WD116A.
Institutional Review Board Statement
Not applicable.
Informed Consent Statement
Not applicable.
Data Availability Statement
The original contributions presented in this study are included in the article. Further inquiries can be directed to the corresponding author.
Conflicts of Interest
The authors declare no conflicts of interest.
Abbreviations
The following abbreviations are used in this manuscript:
| AD | Anaerobic Digestion |
| AF | Anaerobic Filter |
| COD | Chemical Oxygen Demand |
| CSTR | Continuously Stirred-Tank Reactor |
| DM | Dry Matter |
| FM | Fresh Matter |
| HRT | Hydraulic Retention Time |
| LS | Laboratory Scale |
| OLR | Organic Loading Rate |
| P&ID | Process and Instruments Diagram |
| PS | Pilot Scale |
| SMP | Specific Methane Potential |
| SMY | Specific Methane Yield |
| VSs | Volatile Solids |
References
- Simeonov, I.; Kabaivanova, L.; Chorukova, E. Two-Stage anaerobic digestion of organic wastes: A review. Ecol. Eng. Environ. Prot. 2021, 2021, 38–56. [Google Scholar] [CrossRef] [Scilit]
- Dhull, P.; Kumar, S.; Yadav, N.; Lohchab, R.K. A comprehensive review on anaerobic digestion with focus on potential feedstocks, limitations associated and recent advances for biogas production. Environ. Sci. Pollut. Res. Int. 2025, 32, 19129–19164. [Google Scholar] [CrossRef] [Scilit]
- Cremonez, P.A.; Teleken, J.G.; Weiser Meier, T.R.; Alves, H.J. Two-Stage anaerobic digestion in agroindustrial waste treatment: A review. J. Environ. Manag. 2021, 281, 111854. [Google Scholar] [CrossRef] [Scilit]
- Pramanik, S.K.; Suja, F.B.; Porhemmat, M.; Pramanik, B.K. Performance and Kinetic Model of a Single-Stage Anaerobic Digestion System Operated at Different Successive Operating Stages for the Treatment of Food Waste. Processes 2019, 7, 600. [Google Scholar] [CrossRef] [Scilit]
- Pohland, F.G.; Ghosh, S. Developments in Anaerobic Stabilization of Organic Wastes—The Two-Phase Concept. Environ. Lett. 1971, 1, 255–266. [Google Scholar] [CrossRef] [Scilit] [PubMed]
- Holl, E.; Steinbrenner, J.; Merkle, W.; Krümpel, J.; Lansing, S.; Baier, U.; Oechsner, H.; Lemmer, A. Two-stage anaerobic digestion: State of technology and perspective roles in future energy systems. Bioresour. Technol. 2022, 360, 127633. [Google Scholar] [CrossRef] [Scilit]
- Rajendran, K.; Mahapatra, D.; Venkatraman, A.V.; Muthuswamy, S.; Pugazhendhi, A. Advancing anaerobic digestion through two-stage processes: Current developments and future trends. Renew. Sustain. Energy Rev. 2020, 123, 109746. [Google Scholar] [CrossRef] [Scilit]
- Jo, Y.; Kim, J.; Hwang, K.; Lee, C. A comparative study of single- and two-phase anaerobic digestion of food waste under uncontrolled pH conditions. Waste Manag. 2018, 78, 509–520. [Google Scholar] [CrossRef] [Scilit]
- Dareioti, M.A.; Tsigkou, K.; Vavouraki, A.I.; Kornaros, M. Hydrogen and Methane Production from Anaerobic Co-Digestion of Sorghum and Cow Manure: Effect of pH and Hydraulic Retention Time. Fermentation 2022, 8, 304. [Google Scholar] [CrossRef] [Scilit]
- Baldi, F.; Pecorini, I.; Iannelli, R. Comparison of single-stage and two-stage anaerobic co-digestion of food waste and activated sludge for hydrogen and methane production. Renew. Energy 2019, 143, 1755–1765. [Google Scholar] [CrossRef] [Scilit]
- Markphan, W.; Mamimin, C.; Suksong, W.; Prasertsan, P.; O-Thong, S. Comparative assessment of single-stage and two-stage anaerobic digestion for biogas production from high moisture municipal solid waste. PeerJ 2020, 8, e9693. [Google Scholar] [CrossRef] [Scilit]
- Pham Van, D.; Takeshi, F.; Hoang Minh, G.; Pham Phu, S.T. Comparison Between Single and Two-Stage Anaerobic Digestion of Vegetable Waste: Kinetics of Methanogenesis and Carbon Flow. Waste Biomass Valorization 2020, 11, 6095–6103. [Google Scholar] [CrossRef] [Scilit]
- Schievano, A.; Tenca, A.; Lonati, S.; Manzini, E.; Adani, F. Can two-stage instead of one-stage anaerobic digestion really increase energy recovery from biomass? Appl. Energy 2014, 124, 335–342. [Google Scholar] [CrossRef] [Scilit]
- Lindner, J.; Zielonka, S.; Oechsner, H.; Lemmer, A. Effect of different pH-values on process parameters in two-phase anaerobic digestion of high-solid substrates. Environ. Technol. 2015, 36, 198–207. [Google Scholar] [CrossRef] [Scilit] [PubMed]
- Li, Y.; Xu, H.; Hua, D.; Zhao, B.; Mu, H.; Jin, F.; Meng, G.; Fang, X. Two-phase anaerobic digestion of lignocellulosic hydrolysate: Focusing on the acidification with different inoculum to substrate ratios and inoculum sources. Sci. Total Environ. 2020, 699, 134226. [Google Scholar] [CrossRef] [Scilit]
- Nguyen, P.-D.; Tran, N.-S.T.; Nguyen, T.-T.; Dang, B.-T.; Le, M.-T.T.; Bui, X.-T.; Mukai, F.; Kobayashi, H.; Ngo, H.H. Long-term operation of the pilot scale two-stage anaerobic digestion of municipal biowaste in Ho Chi Minh City. Sci. Total Environ. 2021, 766, 142562. [Google Scholar] [CrossRef] [Scilit] [PubMed]
- Ravi, P.P.; Lindner, J.; Oechsner, H.; Lemmer, A. Effects of target pH-value on organic acids and methane production in two-stage anaerobic digestion of vegetable waste. Bioresour. Technol. 2018, 247, 96–102. [Google Scholar] [CrossRef] [Scilit] [PubMed]
- Ohdoi, K.; Okamoto, Y.; Koga, T.; Takahashi, H.; Oshiro, M.; Morimitsu, T.; Muraoka, H.; Tashiro, Y.; Sakai, K. Efficient Two-Stage Meso- and Thermophilic Anaerobic Digestion of Food Waste from a Microbial Perspective. Fermentation 2024, 10, 607. [Google Scholar] [CrossRef] [Scilit]
- Yin, Z.; Zhou, S.; Zhang, X.; Li, X.; Wang, Z.; Wang, J.; Cao, W.; Sun, C. A Novel Batched Four-Stage–Two-Phase Anaerobic Digestion System to Facilitate Methane Production from Rice Straw and Cow Manure with Low Inoculum/Substrate Ratios. Fermentation 2023, 9, 565. [Google Scholar] [CrossRef] [Scilit]
- Aminzadeh, M.; Bardi, M.J.; Aminirad, H. A new approach to enhance the conventional two-phase anaerobic co-digestion of food waste and sewage sludge. J. Environ. Health Sci. Eng. 2021, 19, 295–306. [Google Scholar] [CrossRef] [Scilit]
- Wang, Z.; Ma, T.; Xing, L. Process performance and microbial interaction in two-stage continuously stirred tank reactors for sludge anaerobic digestion operated at different temperatures. Biochem. Eng. J. 2020, 161, 107682. [Google Scholar] [CrossRef] [Scilit]
- Nammana, B.; Racho, P.; Nawong, S.; Wichitsathian, B.; Tantrakarnapa, K. Feasibility of anaerobic co-digestion for biogas production from recycled paper industry sludge: Optimization of mixing ratios and application in two-stage CSTR system design. Water Sci. Technol. 2025, 92, 683–703. [Google Scholar] [CrossRef] [Scilit]
- Tang, S.; Wang, Z.; Lu, H.; Si, B.; Wang, C.; Jiang, W. Design of stage-separated anaerobic digestion: Principles, applications, and prospects. Renew. Sustain. Energy Rev. 2023, 187, 113702. [Google Scholar] [CrossRef] [Scilit]
- Usack, J.G.; Spirito, C.M.; Angenent, L.T. Continuously-stirred anaerobic digester to convert organic wastes into biogas: System setup and basic operation. J. Vis. Exp. 2012, 65, e3978. [Google Scholar] [CrossRef] [Scilit]
- Lago, A.; Greses, S.; Aboudi, K.; Moreno, I.; González-Fernández, C. Effect of decoupling hydraulic and solid retention times on carbohydrate-rich residue valorization into carboxylic acids. Sci. Rep. 2023, 13, 20590. [Google Scholar] [CrossRef] [Scilit] [PubMed]
- Lindner, J.; Zielonka, S.; Oechsner, H.; Lemmer, A. Is the continuous two-stage anaerobic digestion process well suited for all substrates? Bioresour. Technol. 2016, 200, 470–476. [Google Scholar] [CrossRef] [Scilit] [PubMed]
- Diamantis, V.I.; Kapagiannidis, A.G.; Ntougias, S.; Tataki, V.; Melidis, P.; Aivasidis, A. Two-stage CSTR–UASB digestion enables superior and alkali addition-free cheese whey treatment. Biochem. Eng. J. 2014, 84, 45–52. [Google Scholar] [CrossRef] [Scilit]
- Held, C.; Wellacher, M.; Robra, K.-H.; Gübitz, G.M. Two-stage anaerobic fermentation of organic waste in CSTR and UFAF-reactors. Bioresour. Technol. 2002, 81, 19–24. [Google Scholar] [CrossRef] [Scilit]
- Li, Q.; Li, Y. Coproduction of hydrogen and methane in a CSTR-IC two-stage anaerobic digestion system from molasses wastewater. Water Sci. Technol. 2019, 79, 270–277. [Google Scholar] [CrossRef] [Scilit]
- Liu, Z.-G.; Zhou, X.-F.; Zhang, Y.-L.; Zhu, H.-G. Enhanced anaerobic treatment of CSTR-digested effluent from chicken manure: The effect of ammonia inhibition. Waste Manag. 2012, 32, 137–143. [Google Scholar] [CrossRef] [Scilit]
- Nualsri, C.; Kongjan, P.; Reungsang, A. Direct integration of CSTR-UASB reactors for two-stage hydrogen and methane production from sugarcane syrup. Int. J. Hydrogen Energy 2016, 41, 17884–17895. [Google Scholar] [CrossRef] [Scilit]
- Kosgey, K.; Chandran, K.; Gokal, J.; Kiambi, S.L.; Bux, F.; Kumari, S. Critical Analysis of Biomass Retention Strategies in Mainstream and Sidestream ANAMMOX-Mediated Nitrogen Removal Systems. Environ. Sci. Technol. 2021, 55, 9–24. [Google Scholar] [CrossRef] [Scilit] [PubMed]
- Daud, M.K.; Rizvi, H.; Akram, M.F.; Ali, S.; Rizwan, M.; Nafees, M.; Jin, Z.S. Review of Upflow Anaerobic Sludge Blanket Reactor Technology: Effect of Different Parameters and Developments for Domestic Wastewater Treatment. J. Chem. 2018, 2018, 1596319. [Google Scholar] [CrossRef] [Scilit]
- Yeshanew, M.M.; Frunzo, L.; Pirozzi, F.; Lens, P.N.L.; Esposito, G. Production of biohythane from food waste via an integrated system of continuously stirred tank and anaerobic fixed bed reactors. Bioresour. Technol. 2016, 220, 312–322. [Google Scholar] [CrossRef] [Scilit]
- Weinrich, S.; Nelles, M. Basics of Anaerobic Digestion: Biochemical Conversion and Process Modelling; Deutsches Biomasseforschungszentrum Gemeinnützige GmbH: Leipzig, Germany, 2021. [Google Scholar]
- Kumanowska, E.; Uruñuela Saldaña, M.; Zielonka, S.; Oechsner, H. Two-stage anaerobic digestion of sugar beet silage: The effect of the pH-value on process parameters and process efficiency. Bioresour. Technol. 2017, 245, 876–883. [Google Scholar] [CrossRef] [Scilit]
- Nikolausz, M.; Kornatz, P. The Future of Anaerobic Digestion: Challenges and Opportunities. Bioengineering 2025, 12, 524. [Google Scholar] [CrossRef] [Scilit]
- Almansa, X.F.; Starostka, R.; Raskin, L.; Zeeman, G.; Reyes, F.d.L.; Waechter, J.; Yeh, D.; Radu, T. Anaerobic Digestion as a Core Technology in Addressing the Global Sanitation Crisis: Challenges and Opportunities. Environ. Sci. Technol. 2023, 57, 19078–19087. [Google Scholar] [CrossRef] [Scilit]
- Wang, H.; Zhou, Q. Dominant factors analyses and challenges of anaerobic digestion under cold environments. J. Environ. Manag. 2023, 348, 119378. [Google Scholar] [CrossRef] [Scilit]
- Statistisches Bundesamt. Verbraucherpreisindex: Deutschland, Jahresdurchschnitte, Basis 2020 = 100. 2026. Available online: https://www-genesis.destatis.de/datenbank/online/statistic/61111/details (accessed on 24 April 2026).
- Remer, D.S.; Lin, S.; Yu, N.; Hsin, K. An update on cost and scale-up factors, international inflation indexes and location factors. Int. J. Prod. Econ. 2008, 114, 333–346. [Google Scholar] [CrossRef] [Scilit]
- Hülsemann, B.; Zhou, L.; Merkle, W.; Hassa, J.; Müller, J.; Oechsner, H. Biomethane Potential Test: Influence of Inoculum and the Digestion System. Appl. Sci. 2020, 10, 2589. [Google Scholar] [CrossRef] [Scilit]
- Orlando, M.-Q. Design Implications of Headspace Ratio VHS/Vtot on Pressure Stability, Gas Composition and Methane Productivity—A Systematic Review. Energies 2026, 19, 193. [Google Scholar] [CrossRef] [Scilit]
- Merkle, W.; Baer, K.; Lindner, J.; Zielonka, S.; Ortloff, F.; Graf, F.; Kolb, T.; Jungbluth, T.; Lemmer, A. Influence of pressures up to 50bar on two-stage anaerobic digestion. Bioresour. Technol. 2017, 232, 72–78. [Google Scholar] [CrossRef] [Scilit]
- Azevedo, A.; Lapa, N.; Moldão, M.; Duarte, E. Opportunities and challenges in the anaerobic co-digestion of municipal sewage sludge and fruit and vegetable wastes: A review. Energy Nexus 2023, 10, 100202. [Google Scholar] [CrossRef] [Scilit]
- Wei, P.; Uijttewaal, W.; Spanjers, H.; van Lier, J.B.; de Kreuk, M. Optimising flow and mixing in a full-scale gas-mixed anaerobic digester by integrating sludge rheological data using computational fluid dynamics. Chem. Eng. J. 2023, 468, 143647. [Google Scholar] [CrossRef] [Scilit]
- Wickham, R.; Xie, S.; Galway, B.; Bustamante, H.; Nghiem, L.D. Pilot-scale operation experience of anaerobic Co-digestion for possible full scale implementation. Int. Biodeterior. Biodegrad. 2019, 142, 137–142. [Google Scholar] [CrossRef] [Scilit]
- Amigun, B.; von Blottnitz, H. Investigation of scale economies for African biogas installations. Energy Convers. Manag. 2007, 48, 3090–3094. [Google Scholar] [CrossRef] [Scilit]
- KTBL. Gasdichte Lagerung von Rinder- und Schweinegülle: Eine Maßnahme zur Minderung und Vermeidung von Klimarelevanten Emissionen aus der Wirtschaftsdüngerlagerung; Kuratorium für Technik und Bauwesen in der Landwirtschaft e.V. (KTBL): Darmstadt, Germany, 2021. [Google Scholar]
- Wedwitschka, H.; Hayes, A.; Ibanez, D.G.; Jenson, E.; Liebetrau, J.; Nelles, M.; Stinner, W. Material characterization and conditioning of cattle feedlot manure as feedstock for dry batch anaerobic digestion. Waste Manag. 2022, 138, 210–218. [Google Scholar] [CrossRef] [Scilit]
- Ruile, S.; Schmitz, S.; Mönch-Tegeder, M.; Oechsner, H. Degradation efficiency of agricultural biogas plants—A full-scale study. Bioresour. Technol. 2015, 178, 341–349. [Google Scholar] [CrossRef] [Scilit] [PubMed]
- Mei, Z.; Liu, X.; Huang, X.; Li, D.; Yan, Z.; Yuan, Y.; Huang, Y. Anaerobic Mesophilic Codigestion of Rice Straw and Chicken Manure: Effects of Organic Loading Rate on Process Stability and Performance. Appl. Biochem. Biotechnol. 2016, 179, 846–862. [Google Scholar] [CrossRef] [Scilit]
- Gou, C.; Yang, Z.; Huang, J.; Wang, H.; Xu, H.; Wang, L. Effects of temperature and organic loading rate on the performance and microbial community of anaerobic co-digestion of waste activated sludge and food waste. Chemosphere 2014, 105, 146–151. [Google Scholar] [CrossRef] [Scilit]
- World Bioenergy Association. Biogas—An Important Renewable Energy Source; World Bioenergy Association: Stockholm, Sweden, 2013. [Google Scholar]

Disclaimer/Publisher’s Note: The statements, opinions and data contained in all publications are solely those of the individual author(s) and contributor(s) and not of MDPI and/or the editor(s). MDPI and/or the editor(s) disclaim responsibility for any injury to people or property resulting from any ideas, methods, instructions or products referred to in the content. |
© 2026 by the authors. Licensee MDPI, Basel, Switzerland. This article is an open access article distributed under the terms and conditions of the Creative Commons Attribution (CC BY) license.