
Article

Production of Mevalonate from Glycerol by Escherichia coli Citrate Synthase Variants
by
Caroline E. Hartner
and
Mark A. Eiteman
*
School of Chemical, Materials and Biomedical Engineering, University of Georgia, Athens, GA 30602, USA
*
Author to whom correspondence should be addressed.
Fermentation 2026, 12(4), 186; https://doi.org/10.3390/fermentation12040186
Submission received: 4 March 2026 / Revised: 25 March 2026 / Accepted: 1 April 2026 / Published: 3 April 2026
(This article belongs to the Section Microbial Metabolism, Physiology & Genetics)

Abstract

Mevalonate is a biochemical precursor to a wide range of isoprenoids. Because the mevalonate pathway uses three moles of acetyl–CoA, native pathways which metabolize acetyl–CoA, including citrate synthase, strongly compete with mevalonate synthesis. Our hypothesis is that modifications in citrate synthase, with the aim of reducing this enzyme’s activity, can result in increased mevalonate. Previous research has demonstrated that citrate synthase variants can increase generation of acetyl–CoA-derived products from glucose, but research has not evaluated citrate synthase variants with other common carbon sources like xylose and glycerol. Using five variant strains with chromosomal modifications of citrate synthase, we first compared the growth of these variants with wild-type Escherichia coli on glucose, xylose, or glycerol. In general, any particular modification in citrate synthase (GltA) led to the greatest effect on growth rate in glucose-grown cells. Because the GltA[Y87N D101D* P208L] and GltA[A267T] variants showed the greatest effect on growth using glycerol, we selected these two variants to study the formation of mevalonate from glycerol by E. coli with an introduced mevalonate pathway. Controlled batch processes at the 1.3 L scale demonstrated significantly increased mevalonate production in variants compared to the wild-type background, with the GltA[A267T] attaining 7.3 g/L mevalonate in 16.5 h from 30 g/L glycerol. Nitrogen-limited or phosphorus-limited fed-batch processes using the GltA[A267T] variant performed similarly, and generated over 12 g/L mevalonate in 24–32 h at a yield of 0.24 g/g. This study demonstrates that GltA variants offer a means to generate acetyl–CoA-derived products from glycerol.

1. Introduction

Mevalonate is a key intermediate in the biochemical formation of isoprenoids, which are among the most abundant and structurally diverse naturally occurring compounds. Isoprenoids are found in all Kingdoms of life and serve a myriad of roles including cell signaling [1], fruit maturation [2], and microbial abatement [3], and include a wide range of valuable products, including biofuels like isoprene and specialty chemicals and pharmaceuticals such as artemisinin, squalene, linalool, and retinol [4]. Mevalonate is found in some moisturizers [5], and its lactone has been proposed as a treatment for statin-induced myopathy [6]. The mevalonate (MVA) pathway found in eukaryotes and archaea involves three steps. First, acetyl–CoA acetyltransferase condenses two molecules of acetyl–CoA to acetoacetyl–CoA. Then, hydroxymethylglutaryl–CoA (HMG-CoA) synthase adds a third acetyl–CoA to form HMG-CoA, and finally HMG-CoA reductase reduces HMG-CoA with NADPH to mevalonate. Mevalonate can be further phosphorylated by mevalonate kinase and phosphomevalonate kinase to form mevalonate pyrophosphate, which is decarboxylated by mevalonate pyrophosphate decarboxylase to form the key isoprenoid building block isopentenyl-5-pyrophosphate [7,8].
Numerous approaches have been tried to increase titer and productivity of mevalonate using the MVA pathway in hosts such as Escherichia coli. For example, deletions of nine genes associated with the synthesis of unnecessary by-products increased mevalonate production two-fold [9]. Since the final reduction to mevalonate requires NADPH, another approach proposed to improve mevalonate formation is to encourage cellular NADPH generation. Thus, careful control of the expression of the pgi gene coding glucose-6-phosphate isomerase increases the relative flux into the pentose phosphate pathway over the Embden–Meyerhof–Parnas pathway, and increases mevalonate yield by 25% [10]. Other results, though, suggest that redirection of carbon into the pentose phosphate pathway does not improve mevalonate formation, and the process might not be limited by NADPH availability [11]. Specific mevalonate productivity and glucose uptake increased nearly two-fold in a strain with an E672K substitution in RNA polymerase subunit B, a modification which increases DNA binding efficiency of RpoB and transcription globally while downregulating other cellular processes like chemotaxis and flagellar development [12]. Others have focused on limiting growth and the consumption of carbon toward biomass, and making more available to mevalonate. For example, sulfate starvation led to an 80% increase in the mevalonate yield from glucose in shake flasks [13]. Sulfur starvation increases mevalonate production in two ways: limiting the TCA cycle, and supplying more NADPH to the final reduction step [14]. Similarly, E. coli cells harboring an inducible mevalonate pathway were first grown aerobically with glucose, then switched to acetate, and gene transcription induced under aerobic, microaerobic, or anaerobic conditions. In this second phase, aerobic conditions achieved the highest mevalonate titer (7.9 g/L) and productivity (0.13 g/L·h), although mevalonate yield (0.37 g/g acetate) was the greatest under anaerobic conditions [15].
Glycerol is a by-product of biodiesel synthesis, an industry that is growing rapidly due to the desire to reduce fossil fuel dependence and carbon footprint [16]. The high glycerol yield from biodiesel production facilitates the economic feasibility of fermentation processes using glycerol [17]. Glycerol has been studied as a substrate for the microbial production of numerous biochemicals, including ethanol [18], succinate [19], pyruvate [20], 2-butanol [21], citramalate [22], muconate [23], and 2,3-butanediol [24]. An advantage in the microbial conversion of glycerol is that crude glycerol directly from biodiesel production and without refinement can be used as the carbon source, despite having as much as 3 g/L methanol [22].
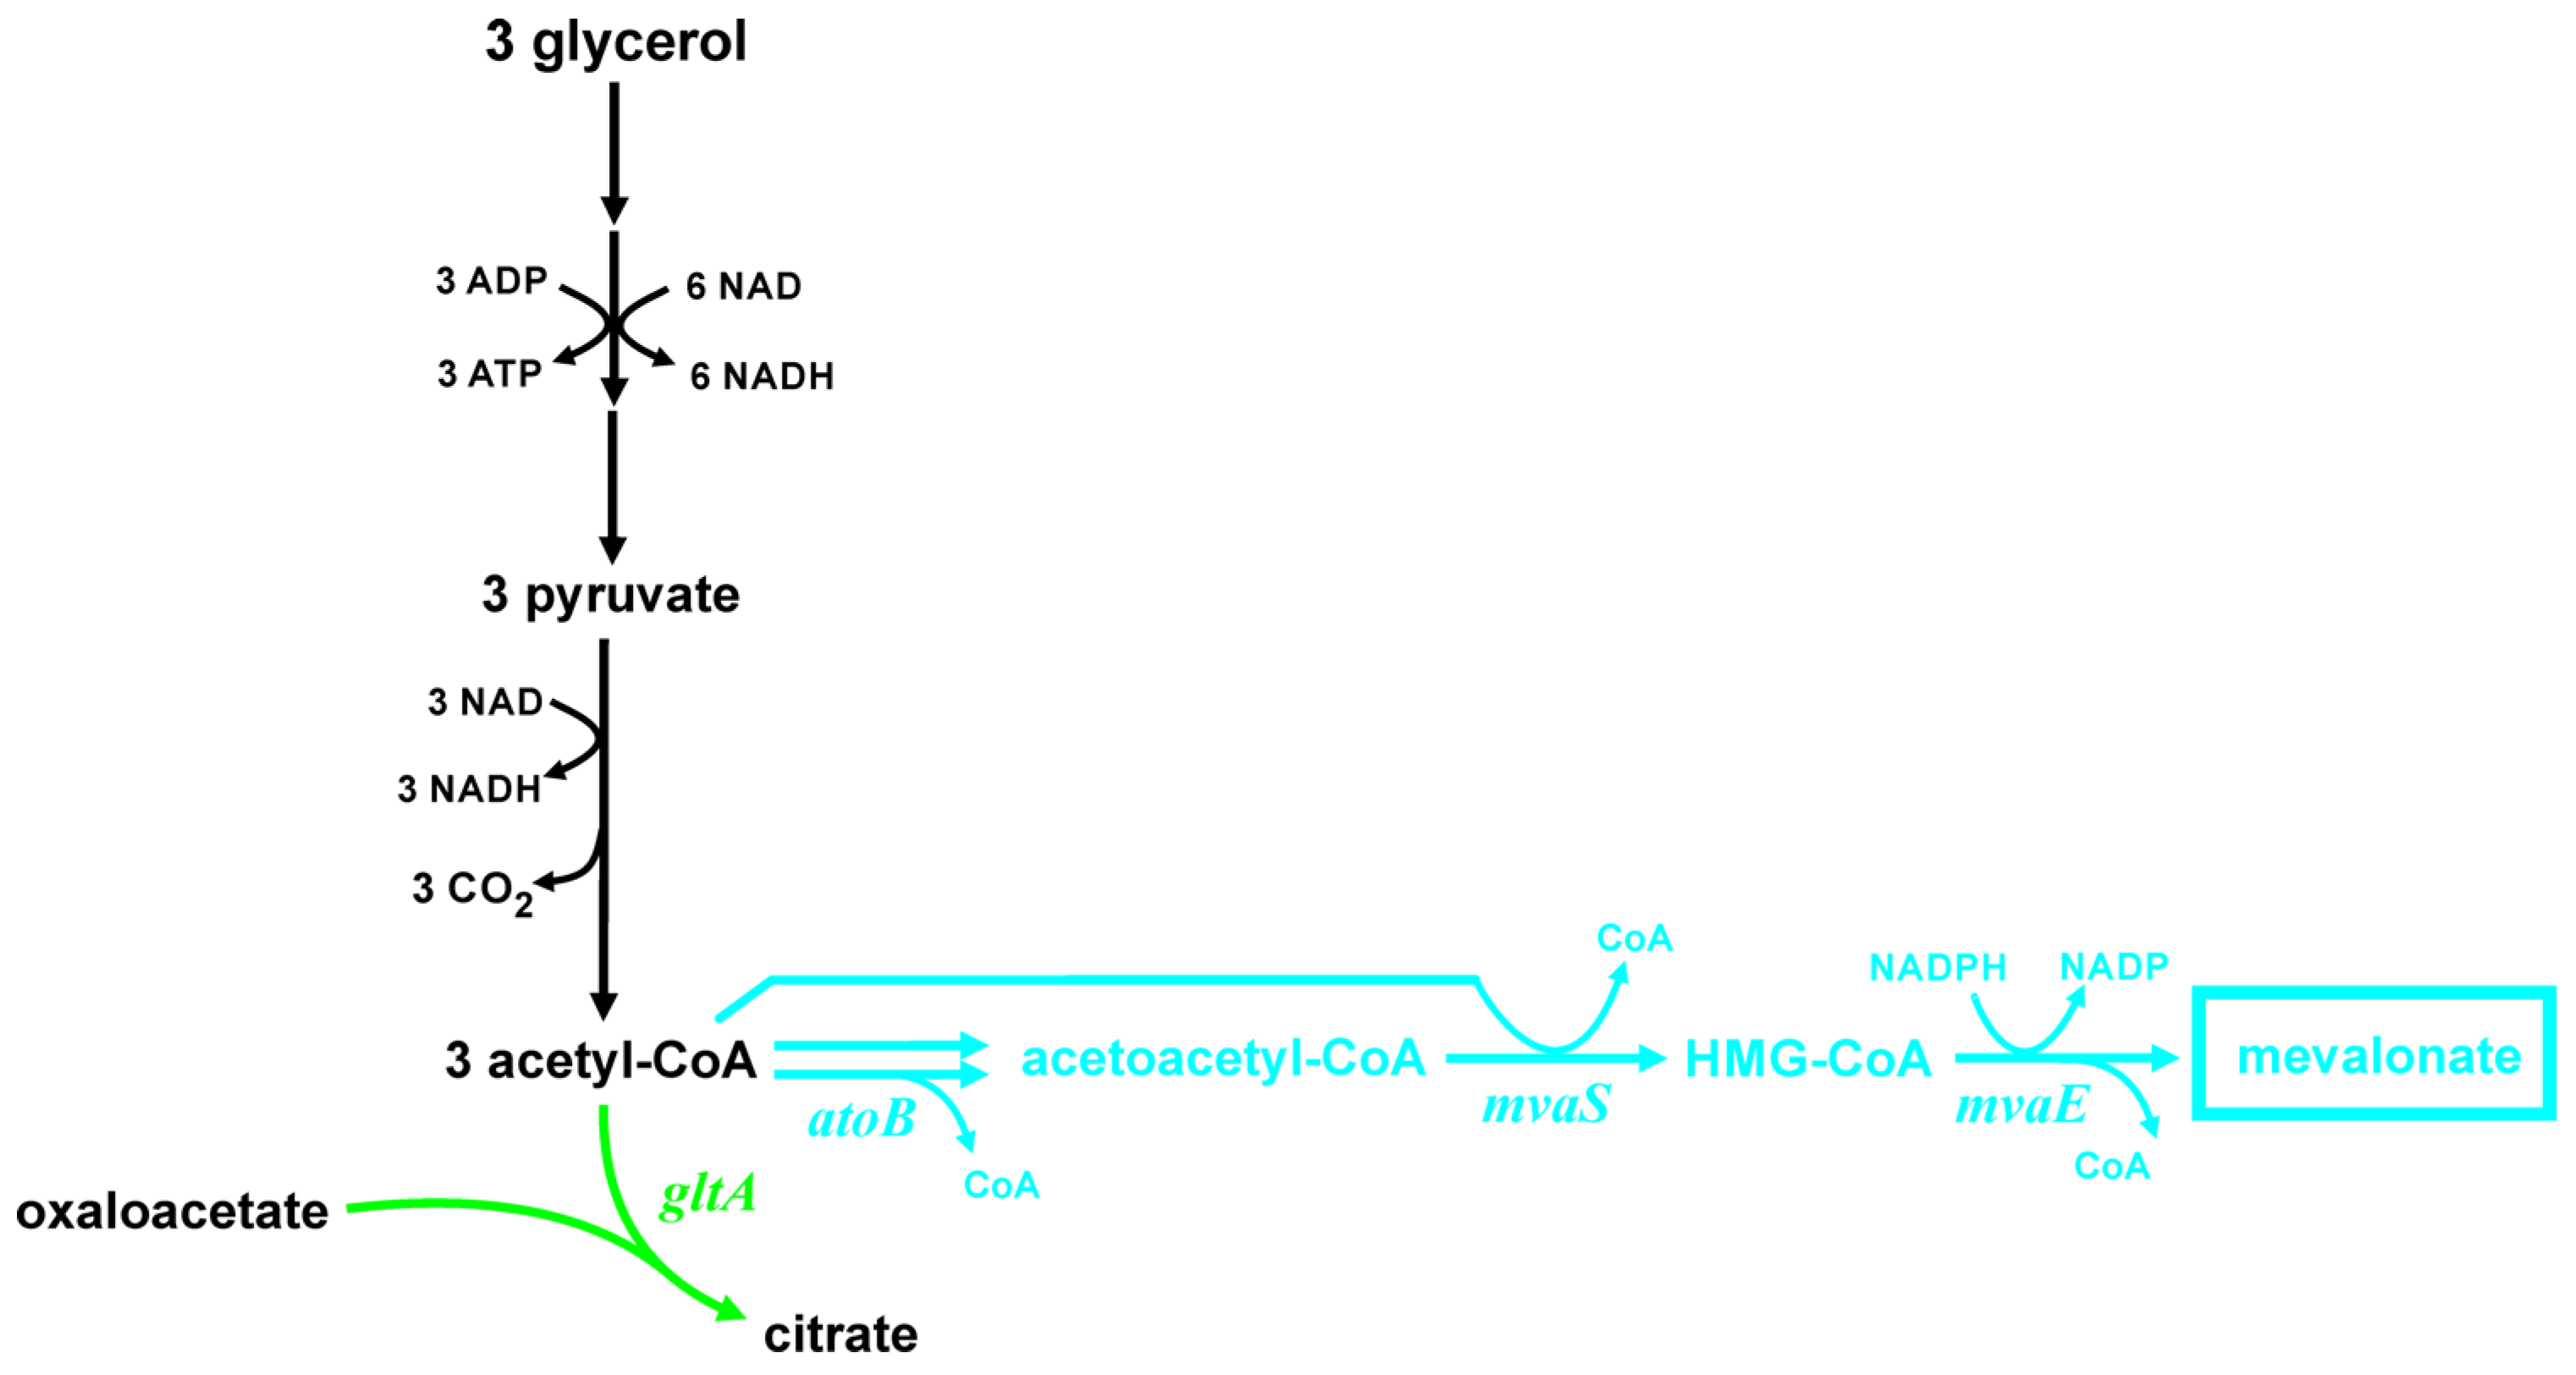
The formation of one mole of mevalonate requires three moles of glycerol (Figure 1) for a maximum theoretical yield of 0.54 g/g. The stoichiometric equation representing this conversion is
3 glycerol + 9 NAD+ + NADPH + 3 ADP + 3 Pi → mevalonate + 3 CO2 + 9 NADH + NADP + 3 ATP + 3 H2O
Acetyl–CoA is the key metabolite in this pathway, serving as a substrate for both acetyl–CoA acetyltransferase and HMG-CoA synthase. The metabolism of glycerol in E. coli is much less studied than the metabolism of glucose, and steady-state wild-type E. coli growing on glucose as the sole carbon source directs 62% of the acetyl–CoA through citrate synthase coded by the gltA gene [25]. In both glucose and glycerol metabolism, the mevalonate pathway directly competes with citrate synthase and other enzymes for the common substrate acetyl–CoA. Unsurprisingly, a simple gltA deletion does increase mevalonate yield from glucose [26,27]. However, since a ΔgltA strain does not grow on glucose as the sole carbon source [28], the culture must be supplemented with glutamate or complex components like yeast extract or peptone. Another strategy is to block partly the flux into the tricarboxylic acid (TCA) cycle by modifying rather than eliminating citrate synthase [29]. For the metabolism of most carbohydrates (including glucose, xylose, and glycerol), reducing the flux through citrate synthase by lowering its intrinsic activity would tend to allow for other pathways that require acetyl–CoA as a substrate to compete more effectively for the common substrate, without tending to reduce the concentration of acetyl–CoA itself. This general approach of using enzyme variants has been studied for the formation of n-butanol [30], pyruvate [31], 3-hydroxybutyrate [32], citramalate [33], and mevalonate [34]. Variants can be carefully selected based on the degree of TCA cycle flux curtailment needed, and this strategy complements other methods of redirecting metabolism such as modulating promoter strength [35] or the use of molecular toggles [36]. In addition, modifications inhibiting nearly the entire TCA cycle have been studied, providing another method to force acetyl–CoA into more desired pathways [37]. Because different carbon sources lead to differences in growth rates, intracellular metabolite concentration and gene expression, the effect of a specific citrate synthase variant on growth and product formation would likely be dependent on the carbon source and growth conditions.
Nutrient limited conditions are often employed to grow cells using fed-batch processes. In nutrient-limited conditions, bacteria are known to exhibit up or down-regulation of specific genes, which can result in the generation of secondary metabolites [38]. When the growth limiting nutrient is an element other than carbon, the excess carbon is often diverted into the organic product at higher yield [39]. For example, 3-hydroxybutyrate accumulated to over 12 g/L under nitrogen-limited conditions [40], and poly(hydroxybutyrate) is known to accumulate under nitrogen-limited conditions [41,42].
Currently growth and product formation using citrate synthase variants have been examined only during growth on glucose as the sole carbon source. The effect of reducing citrate synthase activity during growth on other carbon sources is unknown. Because differing redox and regulatory constraints during growth may lead to differences among carbon sources, we first compared growth of several E. coli citrate synthase variants on glucose, xylose, or glycerol. Given the important role that citrate synthase plays in the availability of acetyl–CoA, a precursor molecule needed by all microbes for growth, we hypothesize that curtailing, but not eliminating, the activity of citrate synthase (GltA) will increase the formation of mevalonate from glycerol. Thus, in addition to comparing the effect of citrate synthase variants on E. coli growth on three different sole carbon sources, a goal of this study is to examine the formation of mevalonate from glycerol under batch and nutrient-limiting conditions.

2. Materials and Methods

Wild-type E. coli W and six citrate synthase variants were selected for this study (Table 1). Each of the variants selected was constructed as previously described [34]. No other chromosomal modification was made to these strains.

2.1. Shake Flask Studies

The defined medium used for shake flasks contained (per L): 0.288 g KH2PO4, 0.502 g K2HPO4, 2.0 g K2SO4, 3.5 g NH4Cl, 20 mg Na2(EDTA)·2H2O, 0.15 g MgSO4·7H2O, 20 mg citric acid, 0.25 mg ZnSO4·7H2O, 0.125 mg CuCl2·2H2O, 1.25 mg MnSO4·H2O, 0.875 mg CoCl2·6H2O, 0.06 mg H3BO3, 0.25 mg Na2MoO4·2H2O, 5.5 mg FeSO4·7H2O, 20 mg thiamine·HCl, and 5 g of a single carbon source (glucose, xylose, or glycerol) in 150 mM HEPES buffer (pH 7.0). For each experiment, a single colony was used to inoculate a test tube containing 2 mL of medium, and these tubes were grown overnight at 37 °C with agitation at 250 rpm. These tube cultures were used to inoculate triplicate 125 mL shake flasks containing 25 mL of identical defined medium to an initial optical density (OD) of 0.05. Approximately 6–8 samples were taken at regular intervals between an OD of 0.1 and 2, diluted by a factor of 5 to ensure linearity, to measure the cell growth rate.

2.2. Batch Reactor Studies

The wild-type strain, MEC1502 (GltA[A267T]), and MEC1484 (GltA[Y87N D101D* P208L]) were selected for further study for the production of mevalonate in duplicate 1.3 L batch fermentations using glycerol (BioFlo 2000, New Brunswick Scientific, Edison, NJ, USA). Each of these strains was transformed with the pMVA1 plasmid (pJ23100:atoB-mvaS-mvaE:trrnB, cam, p15A) expressing the three genes of the MVA pathway [44]. The same procedure was employed as described above for the study of growth rates, with a 50 mL culture in a 250 mL shake flask at an OD of 1.5 used to inoculate a 1.25 L culture. The medium used for batch studies was (per liter): 1.0 g KH2PO4, 1.76 g K2HPO4, 2.0 g K2SO4, 8.0 g NH4Cl, 20 mg Na2(EDTA)·H2O, 0.60 g MgSO4·7H2O, 50 mg citric acid, 0.25 mg ZnSO4·7H2O, 0.125 mg CuCl2·2H2O, 1.25 mg MnSO4·H2O, 1.0 mg CoSO4·7H2O, 0.06 mg H3BO3, 0.25 mg Na2MoO4·2H2O, 5.5 mg FeSO4·7H2O, 20 mg thiamine·HCl, 2.0 g casamino acids, 30 mg chloramphenicol, and 30 g of glycerol. The pH was maintained at 7.0 using 30% w/v KOH. The bioreactor operated at 37 °C, 400 RPM and was sparged with 1.3 L/min air supplemented with oxygen as necessary to maintain a dissolved oxygen concentration above 40% of saturation.
Statistical significance of growth rate and yield differences between each variant and the wild type in batch culture was assessed using a paired, two-tailed Student’s t-test performed, with p < 0.05 considered statistically significant.

2.3. Fed-Batch Reactor Studies

The GltA[A267T] variant was selected for nitrogen-limited and phosphate-limited fed-batch studies. For the nitrogen-limited process, the composition of the initial medium was modified to contain 4.0 g/L NH4Cl (instead of 8.0 g/L). In this medium, N available from NH4Cl is 1047 mg/L, while the casamino acids contribute 154 mg N/L, for a total of approximately 1.20 g N/L. Using a biomass yield of 7–8 g cells/g N [39] the maximum attainable OD is about 24–27. For phosphorus-limited processes, the composition of the initial medium was modified to contain 1.10 g K2HPO4/L as the sole phosphorous source, corresponding to a total P available of 196 mg/L. Using a biomass yield of 35 g cells/g P [39], the maximum attainable OD is about 17–19.
Fed-batch processes were initiated in the same way as the batch processes. In this case, when the glycerol was nearly depleted (16–19 h), 32.5 g glycerol was added. The culture was also supplemented at the same time with the following components to increase their concentrations by (per L): 0.6758 g trimethylglycine monohydrate, 0.25 mg ZnSO4·7H2O, 0.125 mg CuCl2·2H2O, 1.25 mg MnSO4·H2O, 0.875 mg CoCl2·6H2O, 0.06 mg H3BO3, 0.25 mg Na2MoO4·2H2O, 5.5 mg FeSO4·7H2O, 0.961 mg chloramphenicol and 50 mg citric acid.
For N-limited processes, also at the time that glycerol was depleted, a sterile feed of 660 µL/h of a 125 g/L NH4Cl commenced, corresponding to a constant addition rate of 21.6 mg N/h. For P-limited processes, similarly a feed of 660 µL/h of a 42.9 g/L K2HPO4 was started at the time of glycerol depletion, corresponding to a constant addition rate of 5.0 mg P/h to the solution. Samples were taken during the batch and fed-batch phases for analysis.

2.4. Analytical Methods

Optical density (OD) at 600 nm was used for the measurement of cell density (DU-650 spectrophotometer, Beckman Industries, San Jose, CA, USA). Organic substrates and products were measured using HPLC. Samples frozen at −20 °C were thawed and centrifuged (10 min at 13,000× g). The HPLC method used a Coregel 64H column with a refractive index detector, 5 µL sample volume, 5 mM H2SO4 flowing at 0.5 mL/min [45]. A mevalonate standard was prepared by dissolving mevalonolactone in 1.47 H2SO4 [12]. A temperature of 45 °C with a flowrate was 0.5 mL/min resulted in the elution of glycerol (16.4 min) and mevalonate (22.1 min). Dry cell weight (DCW) was determined by centrifugation at 3500× g for 10 min three times with intermediate washing of the cells with deionized water. The washed cells were incubated for 24 h at 60 °C prior to measuring mass. Nitrogen and phosphorous concentrations were determined at the onset of the fed-batch process and at the end of the fed-batch process using standard methods for N [46] and P [47].

3. Results and Discussion

3.1. Growth of Citrate Synthase Variants on Carbon Sources

The goals of this study are to compare wild-type E. coli and five citrate synthase variants for growth and mevalonate formation. Specifically, the GltA[A267T] and GltA[F383M] variants have been characterized to elucidate substrate binding in the active site [48,49]. GltA[P313S] and GltA[Y87A D101D* P208L] variants were obtained by random mutagenesis and selection for acetate accumulation in wild-type E. coli, as a reporter for decreased citrate synthase activity [50]. The effect of these amino acid substitutions on the enzyme structure and function is unknown. The GltA[K167A] variant has been examined for its impact on the allosteric NADH binding site [43]. Importantly, each of the citrate synthase variants has a reduced catalytic activity as a consequence of a lower turnover number (kcat), and/or an increased Michaelis constant (KM), and each has been studied previously in the context of improving product yield from glucose [32,33,34]. For example, wild-type citrate synthase has a kcat of about 45 s−1 and a KM(acetyl–CoA) of 135 µM. The GltA[F383M] variant has sigmoidal kinetics with a kcat of 2.5 s−1, a KM(acetyl CoA) of 688 µM and a Hill coefficient of 2.73 [33,51]. Given that E. coli is reported to have an intracellular acetyl–CoA concentration of 600 µM during exponential growth on glucose [52], one can compare the relative catalytic activities of the two enzymes at given intracellular conditions. At a fixed acetyl–CoA concentration of 600 µM, for example, the GltA[F383M] variant has less than 3% of the activity of the wild-type citrate synthase. Such a lowered activity for this key metabolic enzyme should allow for other enzymes that use acetyl–CoA to compete more favorably with citrate synthase, supporting increased formation of products derived from acetyl–CoA. However, reduction in citrate synthase activity also lowers cell growth rate [29], and thus a balance exists between high growth and product yield. Furthermore, this activity calculation is based on a fixed substrate concentration; reduction in citrate synthase activity itself would tend to cause cells to increase intracellular acetyl CoA concentration, although cells have complex regulatory circuits to stabilize the concentrations of key metabolites such as acetyl–CoA. Cells also can respond to a reduced intrinsic activity of key metabolic enzymes by increasing the expression of that enzyme [31]. Nevertheless, reducing the citrate synthase activity is a means to make other pathways which use the same substrate more competitive.
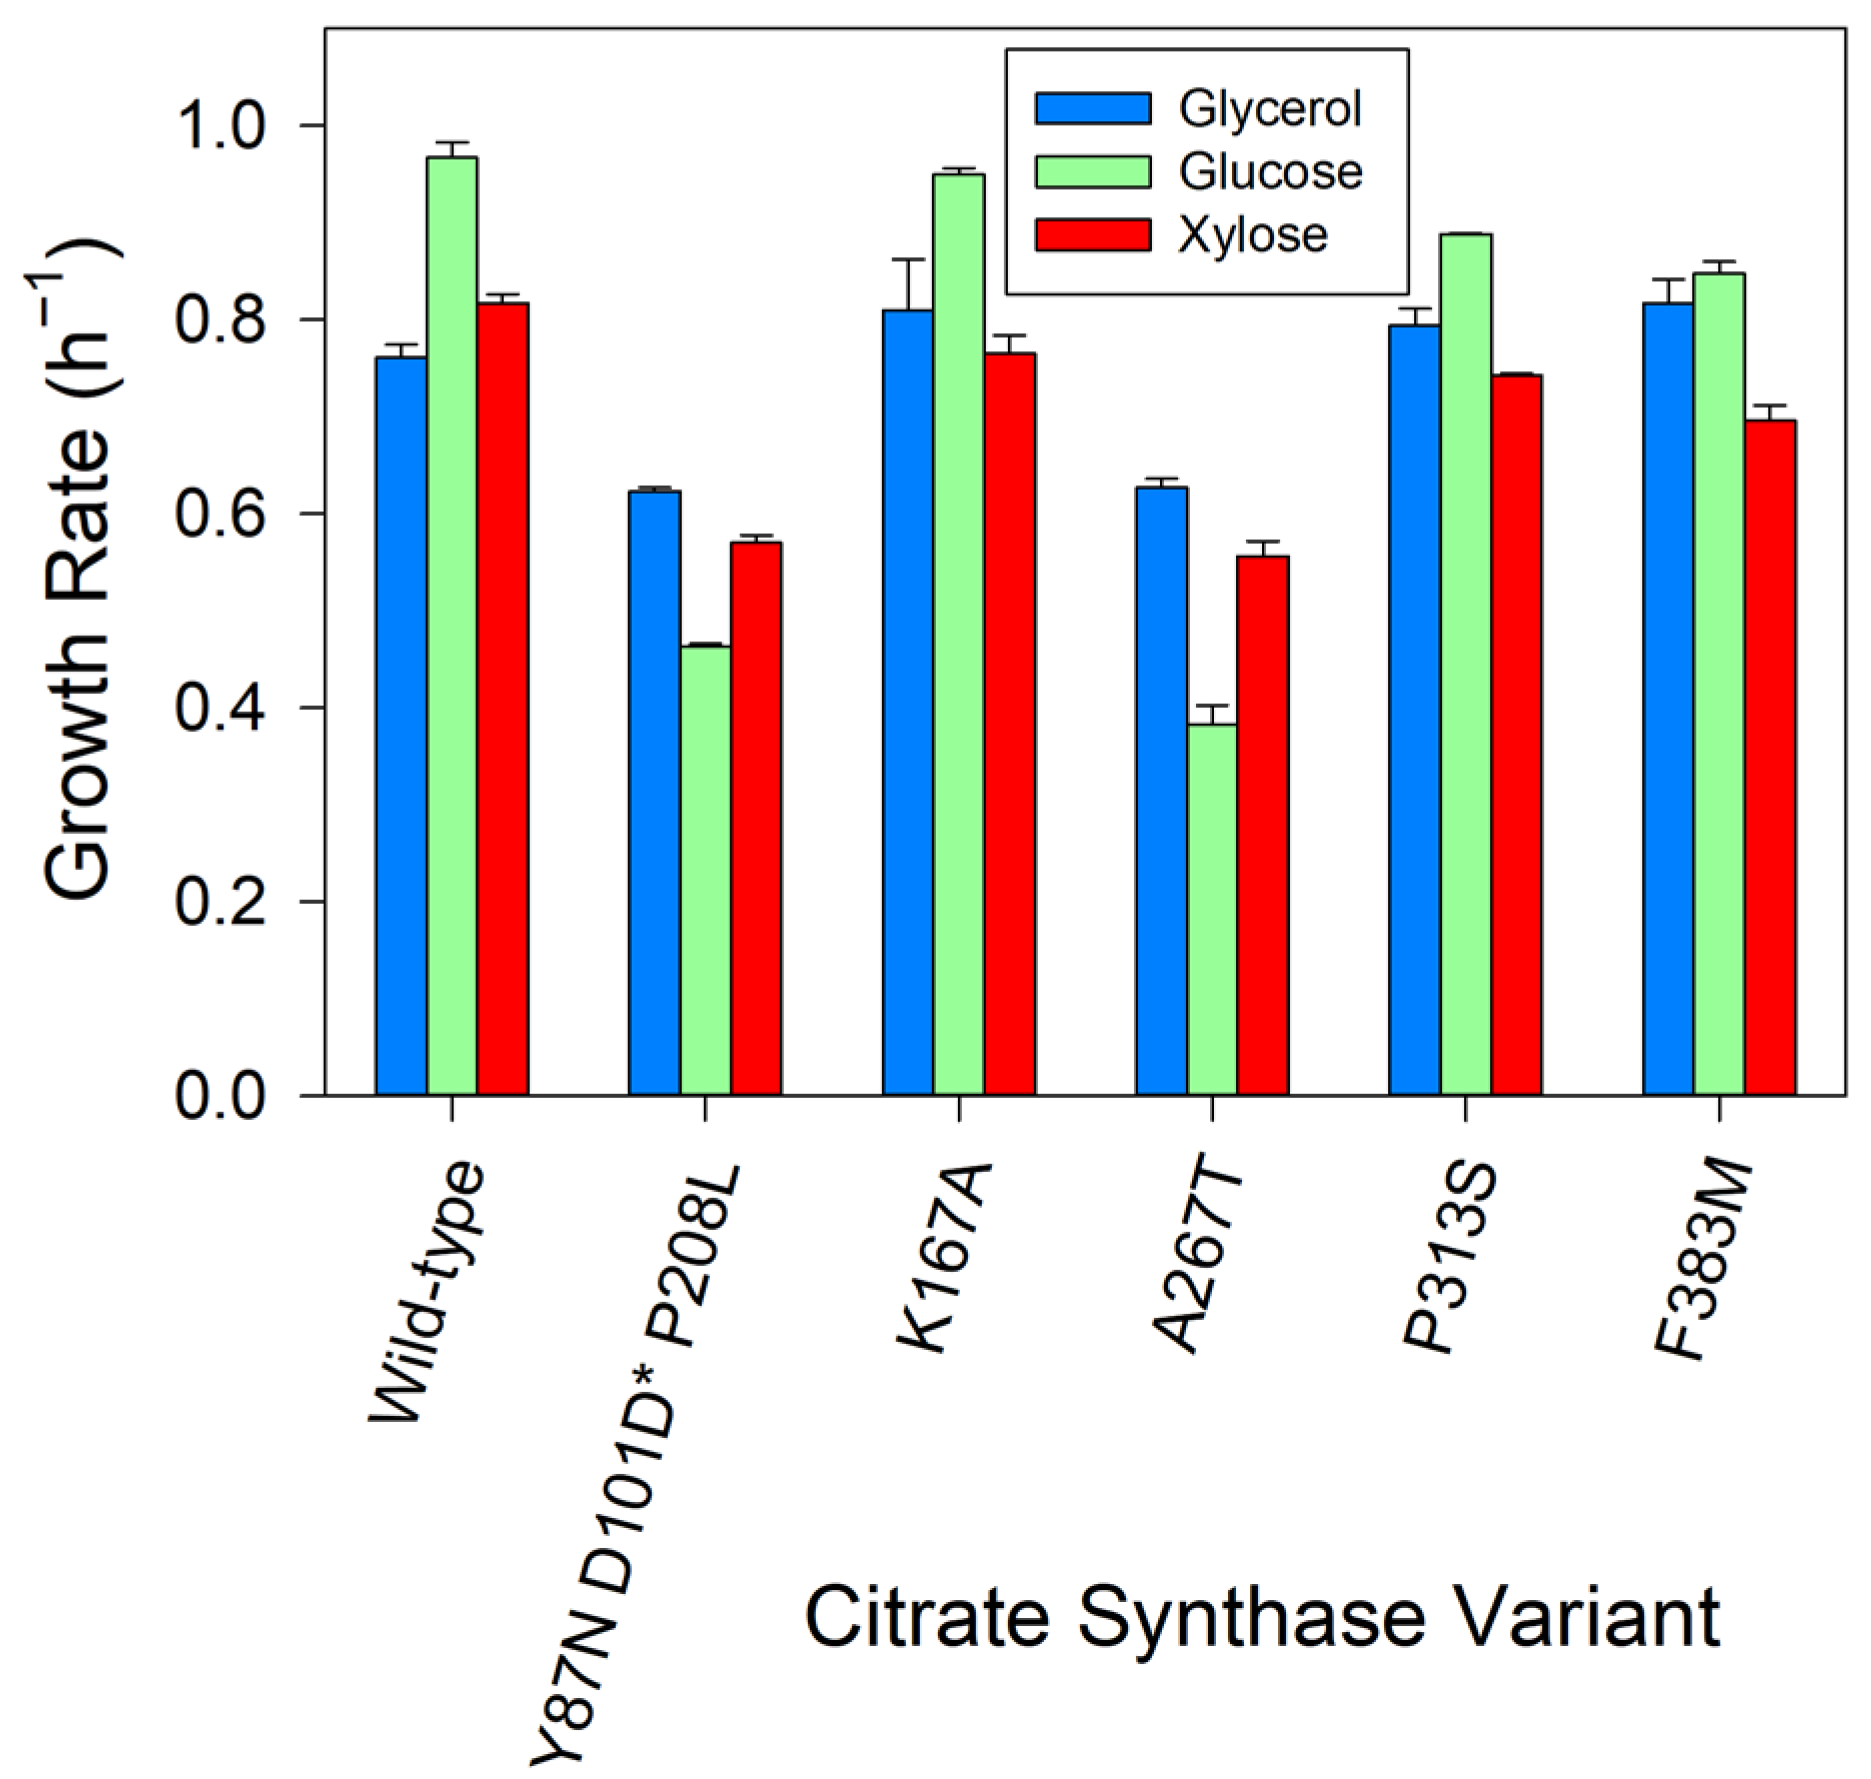
We first examined the specific growth rate of wild-type E. coli and five citrate synthase variants on glycerol, glucose or xylose (Figure 2). Modification of citrate synthase was most impactful to growth on glucose, while growth on glycerol was least impacted by the reduced activity of citrate synthase. For example, the growth rate of the GltA[A267T] variant on glucose was 60% lower than the growth rate observed on the wild-type strain, while the growth rate of the GltA[A267T] variant was only 18% lower than wild-type growth on glycerol (Figure 2). Interestingly, compared to growth on glucose, growth on glycerol is known to result in a 50% lower intracellular acetyl–CoA concentration [52] and the absence of acetate formation under batch conditions [53]. Nevertheless, despite the differences in growth rates of variant strains relative to the growth of the wild-type strain, the variants show similar trends on the three carbon sources. For example, the GltA[A267T] and GltA[Y87N D101D* P208L] variants showed the lowest growth rates of all variants regardless of which carbon source was used for growth (p < 0.05). Similarly, the GltA[K167A] variant exhibited a growth rate similar to the wild-type strain for all three individual carbon sources examined. Additional studies using transcript measurements would clarify whether cells respond to changes in citrate synthase by increasing the expression of the enzyme.

3.2. Batch Production of Mevalonate on Glycerol

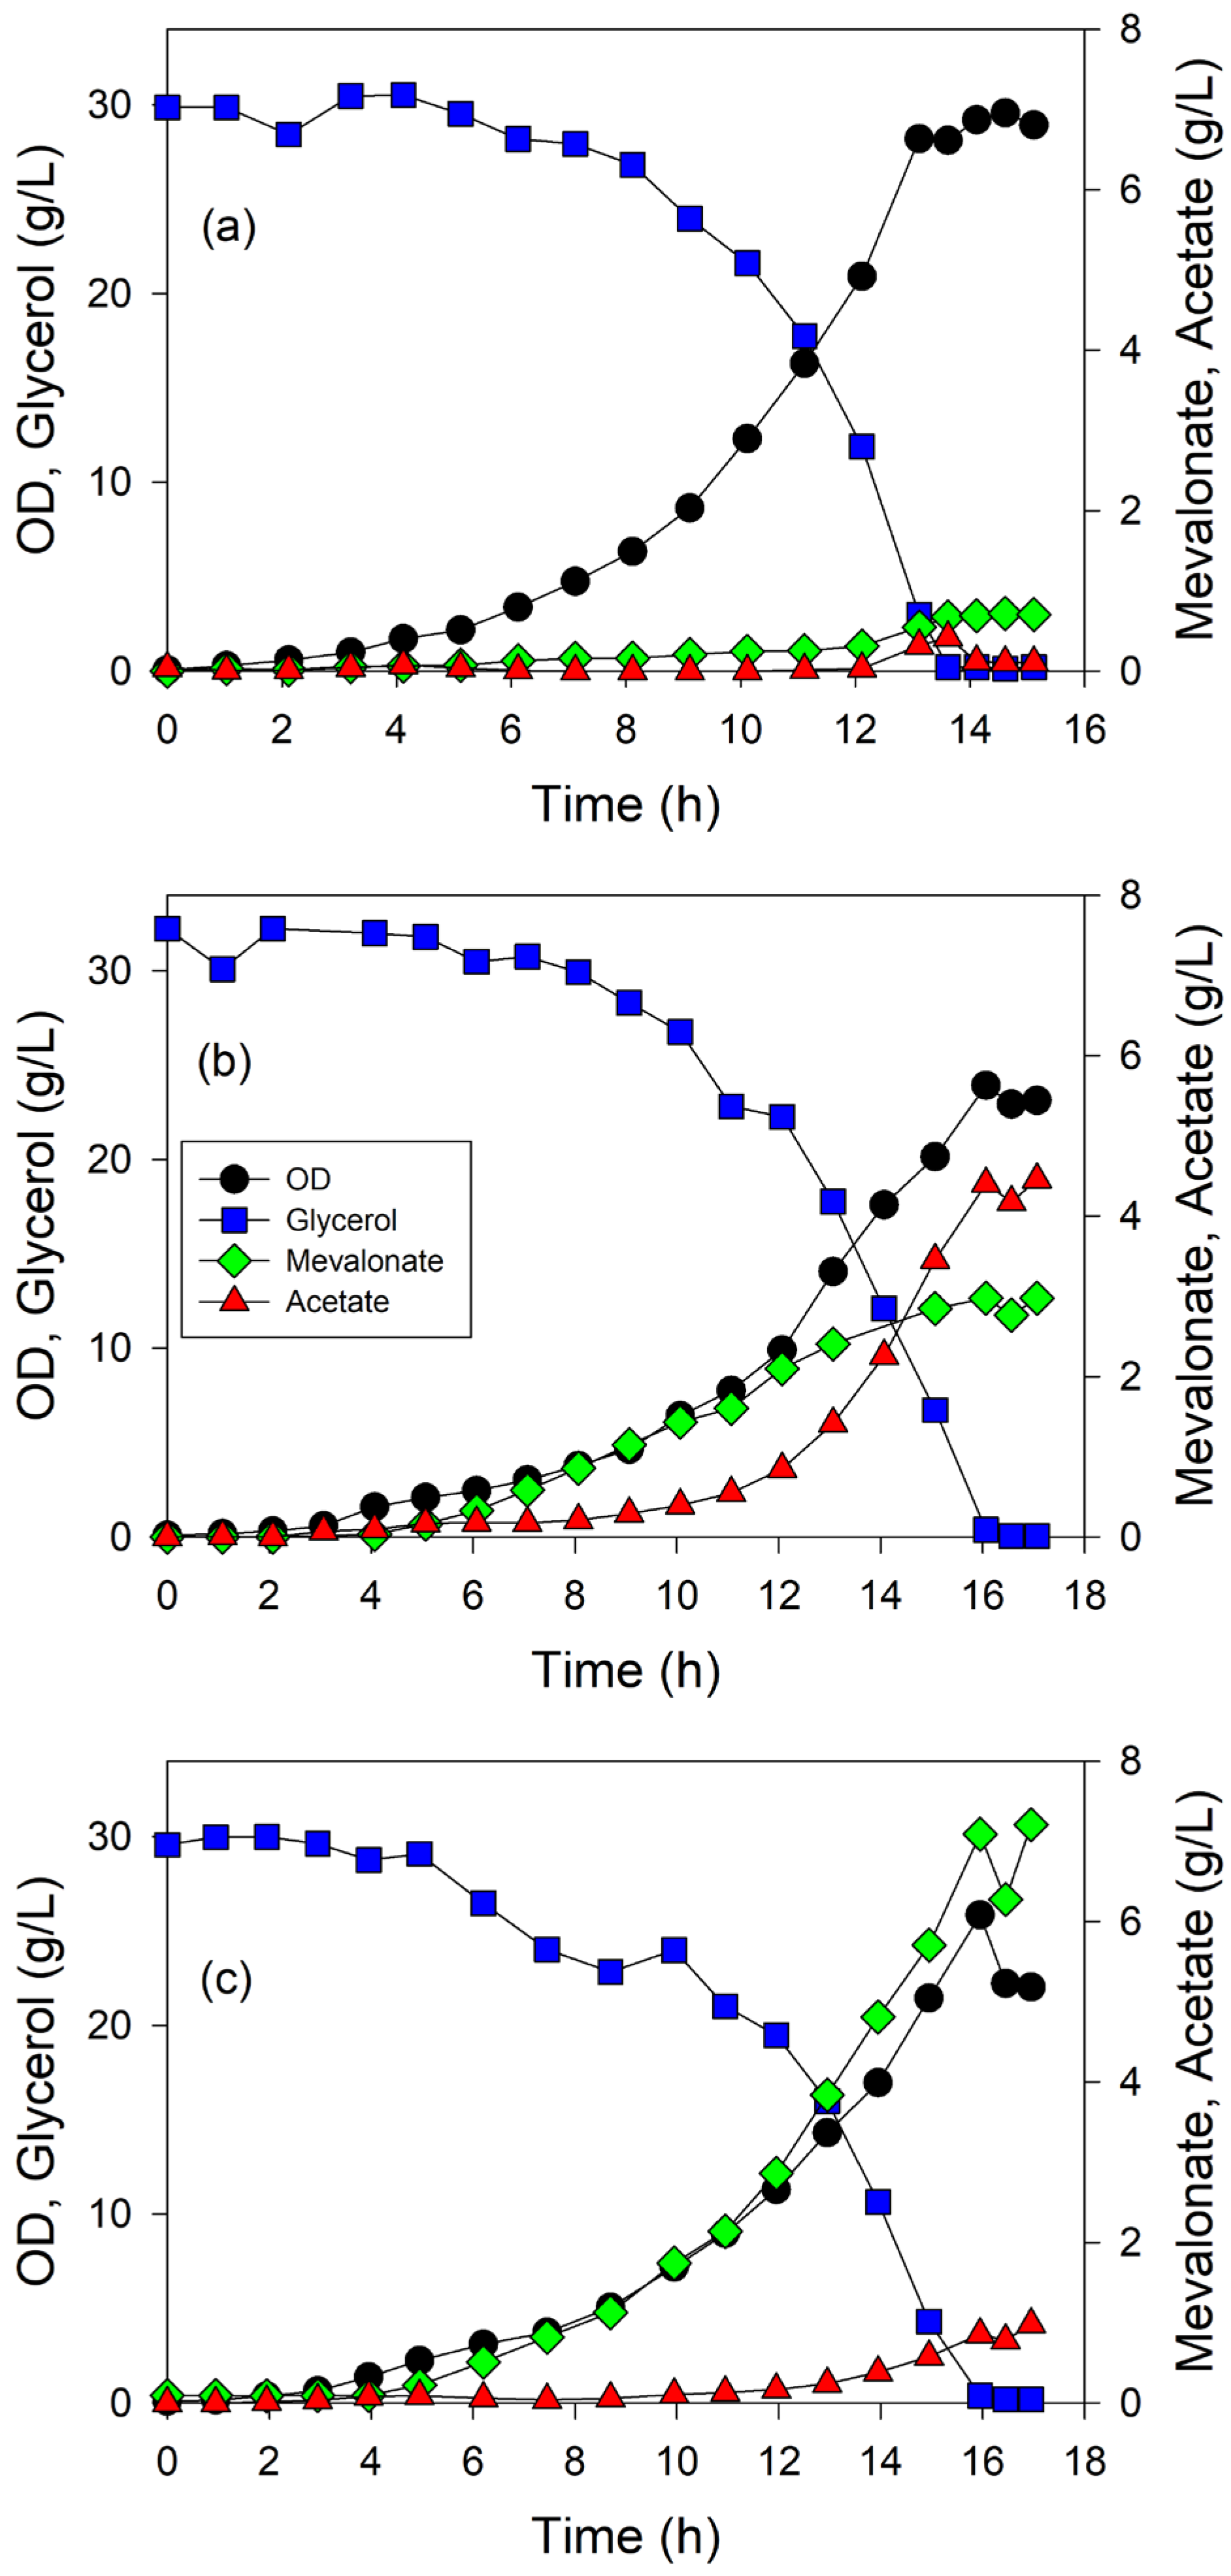
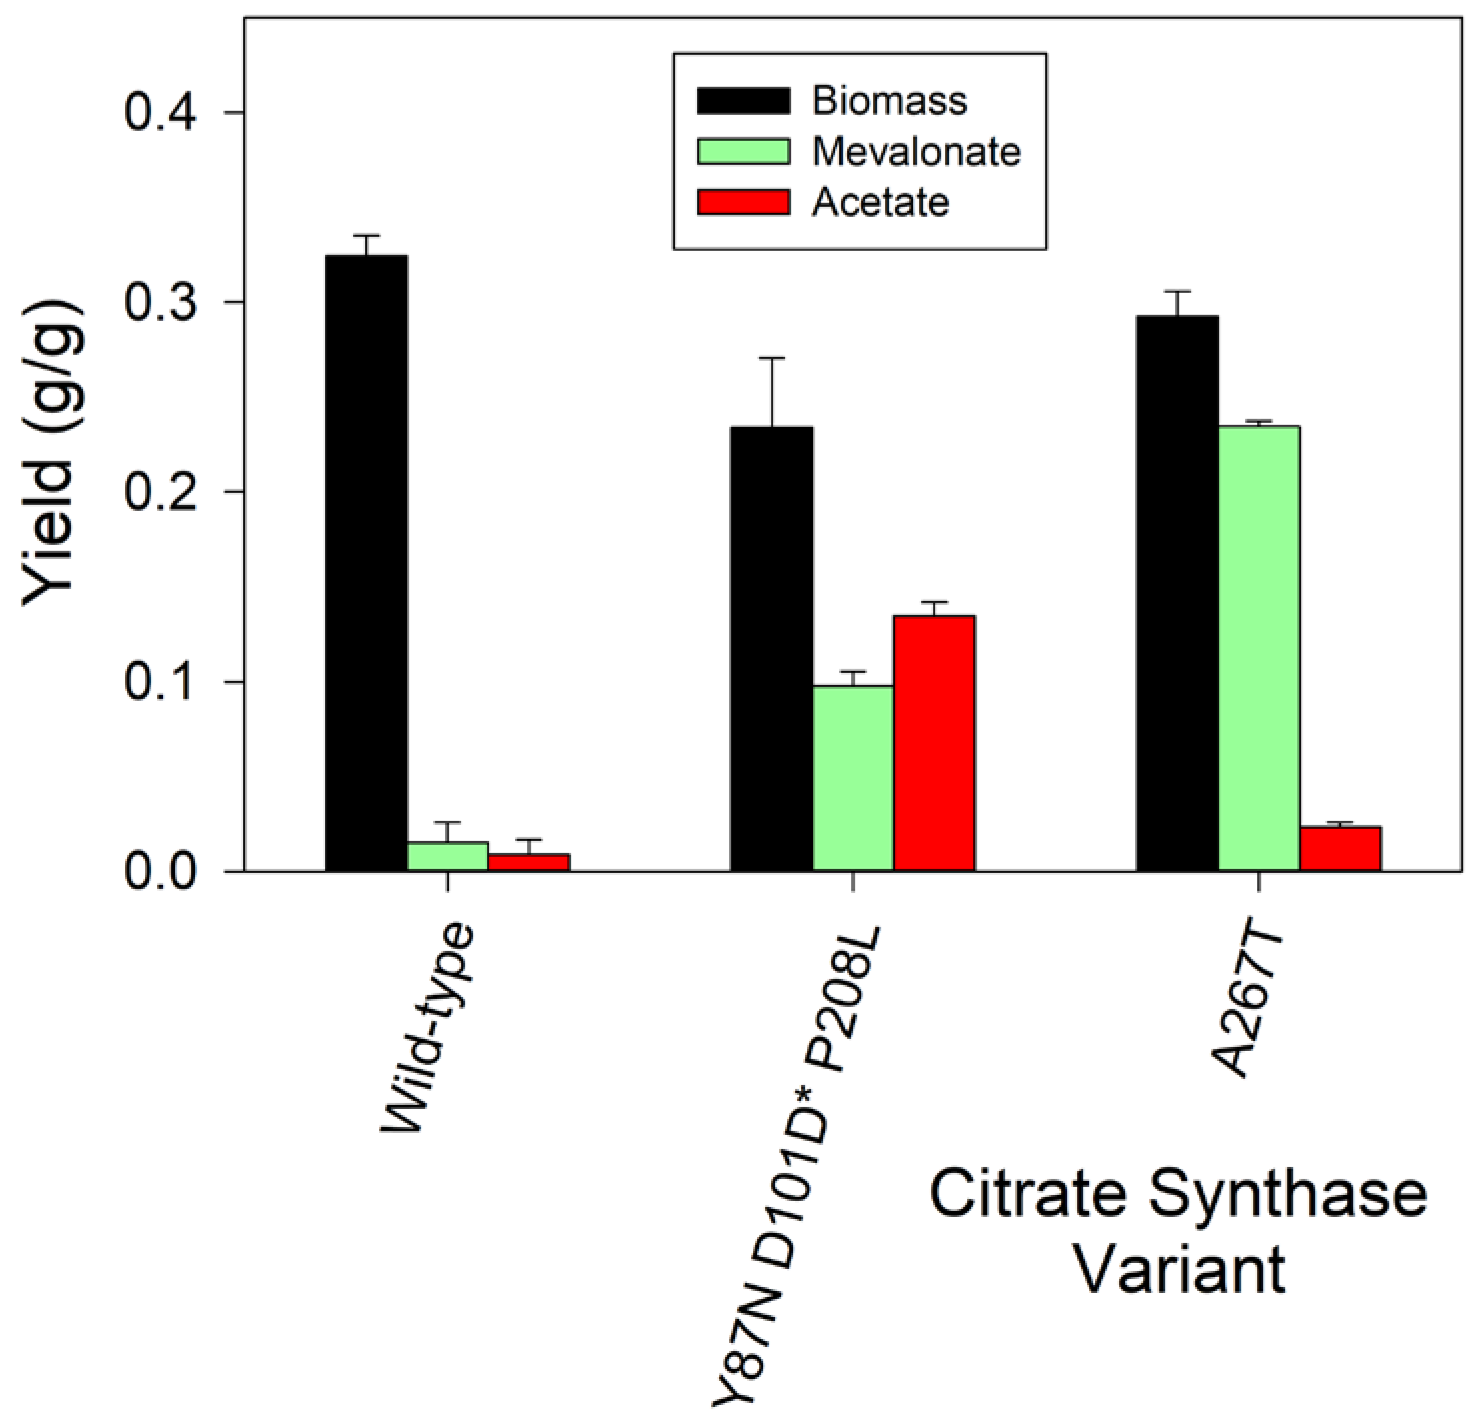
Based on the results of the shake flask studies, E. coli W expressing the wild-type citrate synthase, MEC1484 (expressing GltA[Y87N D101D* P208L]) and MEC1502 (GltA[A267T]) were selected for duplicate batch experiments on defined medium containing 30 g/L glycerol and supplemented with 2 g/L casamino acids. The presence of the small amount of protein hydrolysate has been observed to result in a very large benefit for the formation of mevalonate by E. coli [34]. Each of these strains was transformed with the pMVA1 plasmid which encodes for the three genes constitutively expressing enzymes in the mevalonate pathway. Use of a bioreactor at 1.3 L scale permitted consistent control of the culture environment, including pH and oxygenation, and allowed the cultures to achieve a greater cell density than attainable in shake flask cultures. Batch conditions compare the strains growing at each one’s maximum specific growth rate under nutrient-excess conditions during the course of the processes. Sample withdrawal had a negligible impact on volume. Illustrative results of these batch experiments are shown in Figure 3. The yield calculations for biomass, mevalonate, and the native product acetate are shown in Figure 4.
The wild-type strain expressing the pMVA1 plasmid generated about 0.5 g/L mevalonate and 0.3 g/L acetate from 30 g/L in 14.1 h resulting in a productivity of 0.03 g/L·h. MEC1484 (GltA[Y87N D101D* P208L])/pMVA1 generated 3 g/L mevalonate in 16.0 h, corresponding to yield of 0.10 g/g and a productivity of 0.19 g/L·h. MEC1502 (GltA[A267T])/pMVA1 generated 7.1 g/L mevalonate in 16.0 h for a yield of 0.23 g/g and a productivity of 0.45 g/L·h. Interestingly, MEC1484 also generated 4.2 g/L acetate (yield of 0.14 g/g) while MEC1502 generated only 0.7 g/L acetate (0.02 g/g yield). Thus, the observed mevalonate yield does not correlate with acetate yield for these three strains. There is no immediate explanation for the surprising increased acetate for one variant having decreased citrate synthase activity (GltA[Y87N D101D* P208L]) but not another having likely even lower activity (GltA[A267T]). Although the GltA[A267T] variant attained a growth rate on glycerol 18% lower than the wild-type strain (Figure 2), this variant required only 13% more time to deplete the 30 g/L glycerol (Figure 3), while attaining 15-fold greater mevalonate yield (Figure 4). Differences between mevalonate yield and productivity between the three variants are significant at p < 0.05. The analytical method used would readily show the formation of other typical E. coli products (e.g., formate, lactate, succinate, pyruvate, ethanol) [45], and none were observed to an appreciable concentration.
As noted previously, modification of citrate synthase can affect not only the turnover number kcat and Michaelis constant KM, but also the expression level of the enzyme. Moreover, cells regulate the intracellular acetyl–CoA concentration and the expression level of other enzymes which use acetyl–CoA as a substrate. Thus, a complex combination of these factors may increase both acetate and mevalonate production in MEC1484 (at the expense of biomass) compared to wild-type strain, while increasing mevalonate only and not acetate yield in MEC1502. Recent determination of kinetic parameters for purified GltA[Y87N D101D* P208L] demonstrate that its kinetics are distinctly sigmoidal for both acetyl–CoA and oxaloacetate, with Hill coefficients of approximately 2 for both substrates [50]. This enzyme, more than GltA[A267T] or the wild-type enzyme, likely behaves as an on–off switch.

3.3. Nutrient-Limited Fed-Batch Processes

Fed-batch fermentations were conducted using MEC1502 (GltA[A267T] variant) to examine the effect of nutrient limitation on mevalonate yield and productivity. Both phosphorus-limited and nitrogen-limited processes were compared. For the nitrogen-limited process, the initial bioreactor medium was altered so that nitrogen would become depleted when the OD reached about 24. At approximately the time nitrogen was depleted, a single dose of glycerol and nutrients were added, and a NH4Cl feed commenced which supplied a constant 21.6 mg N/h.
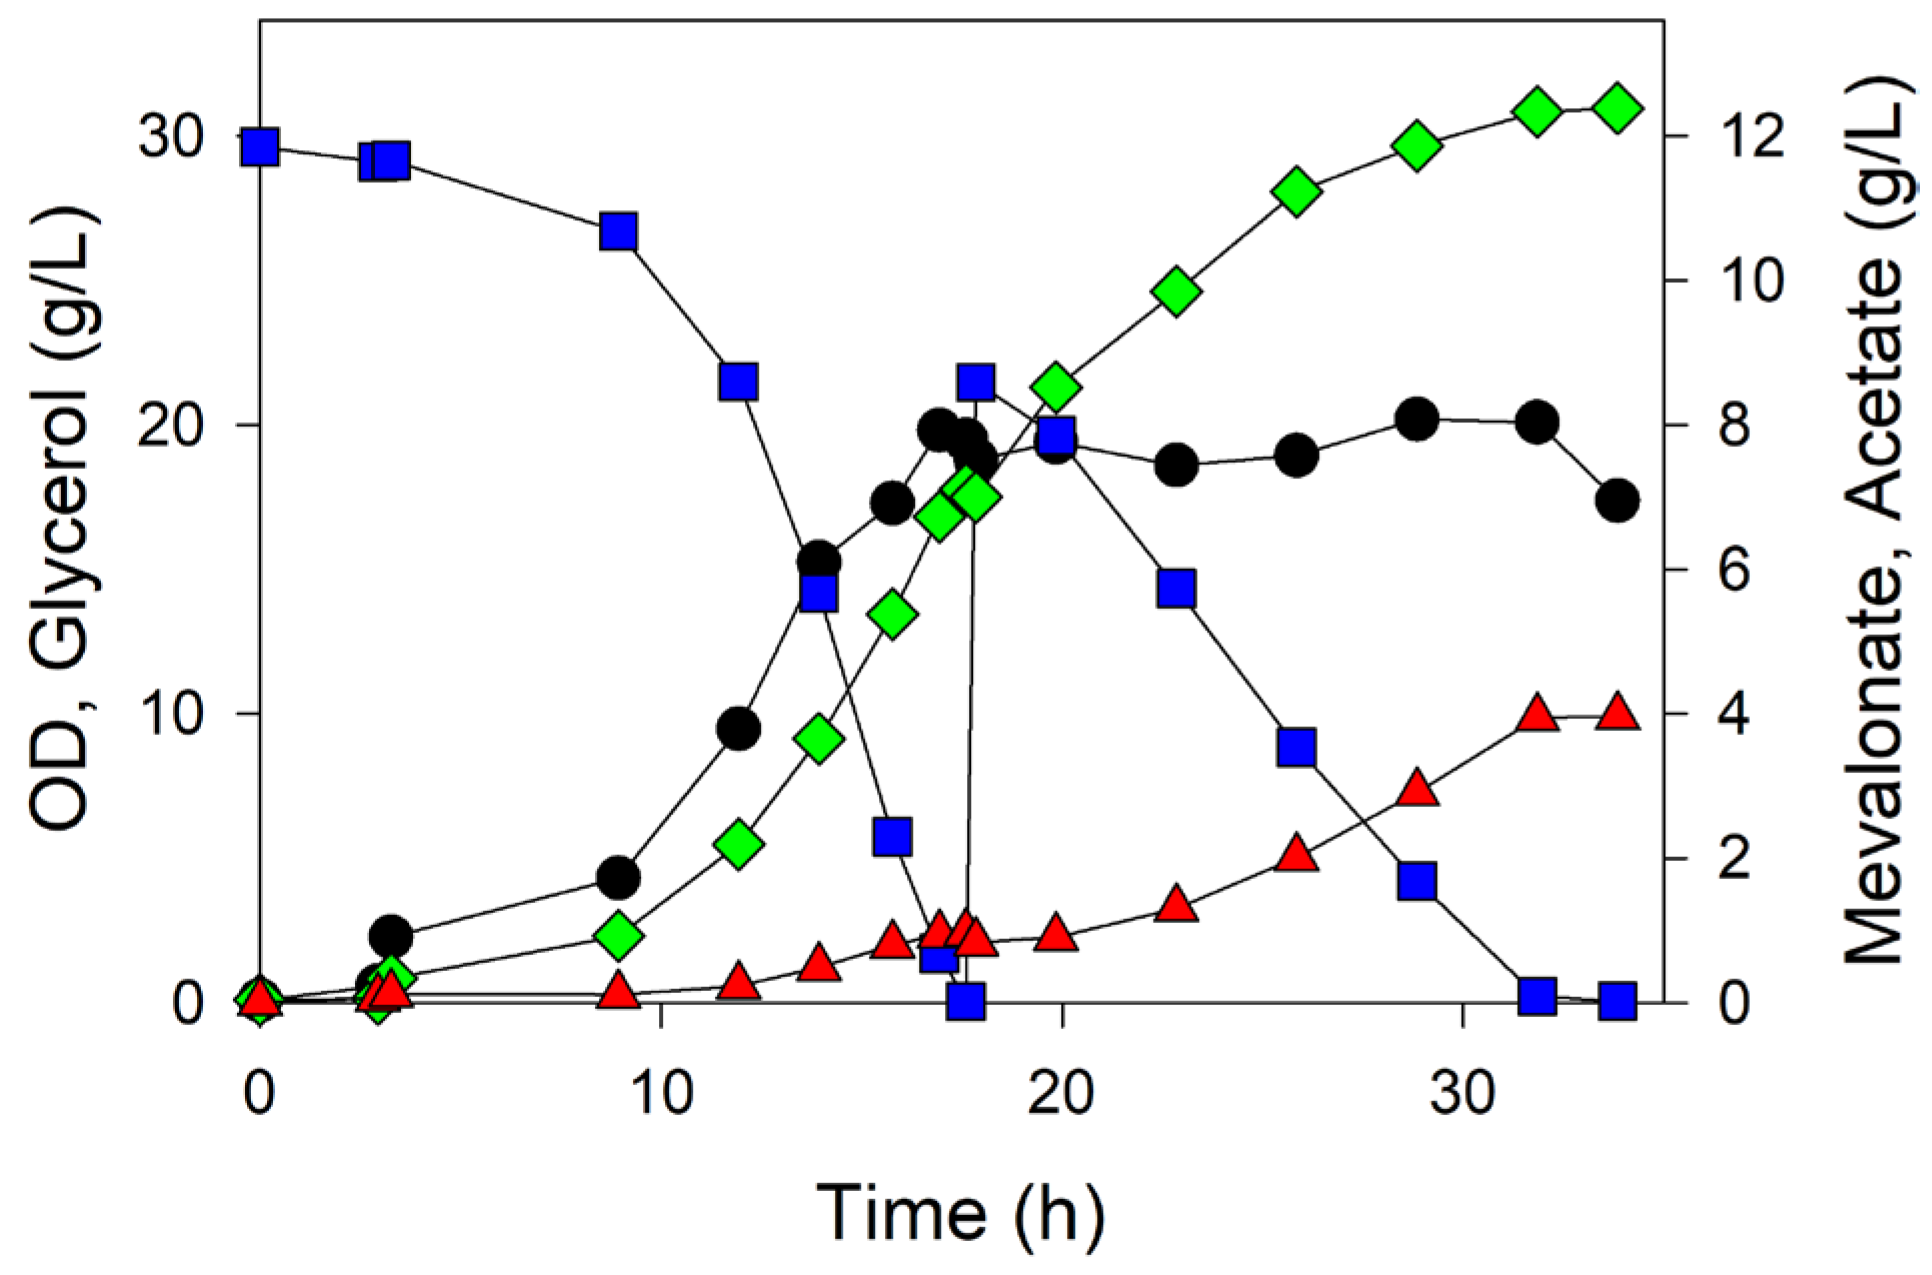
The nitrogen-limited process yielded 12.4 g/L mevalonate in about 34 h (Figure 5). The mevalonate yield was 0.24 g/g during the batch portion, and about 0.25 g/g during the fed-batch process. The acetate yield was about 0.03 g/g during the batch portion, but this yield increased to 0.15 g/g during the nutrient-limited portion of the process. Although nitrogen was added slowly during the fed-batch portion of the process, the biomass concentration did not appreciably change, at least as measured by OD. The biomass concentration as measured by dry cell weight increased from 6.7 g/L to 7.6 g/L, suggesting that the correlation between OD and mass concentration changed during the course of the nitrogen-limited process. The N concentration at the time of initial glycerol depletion (18 h) was about 73 mg/L, and about 1 mg/L at the end of the process, confirming nitrogen-limited conditions. The specific rate of mevalonate production during the nitrogen-limited portion of the process was 45 mg/g biomass·h.
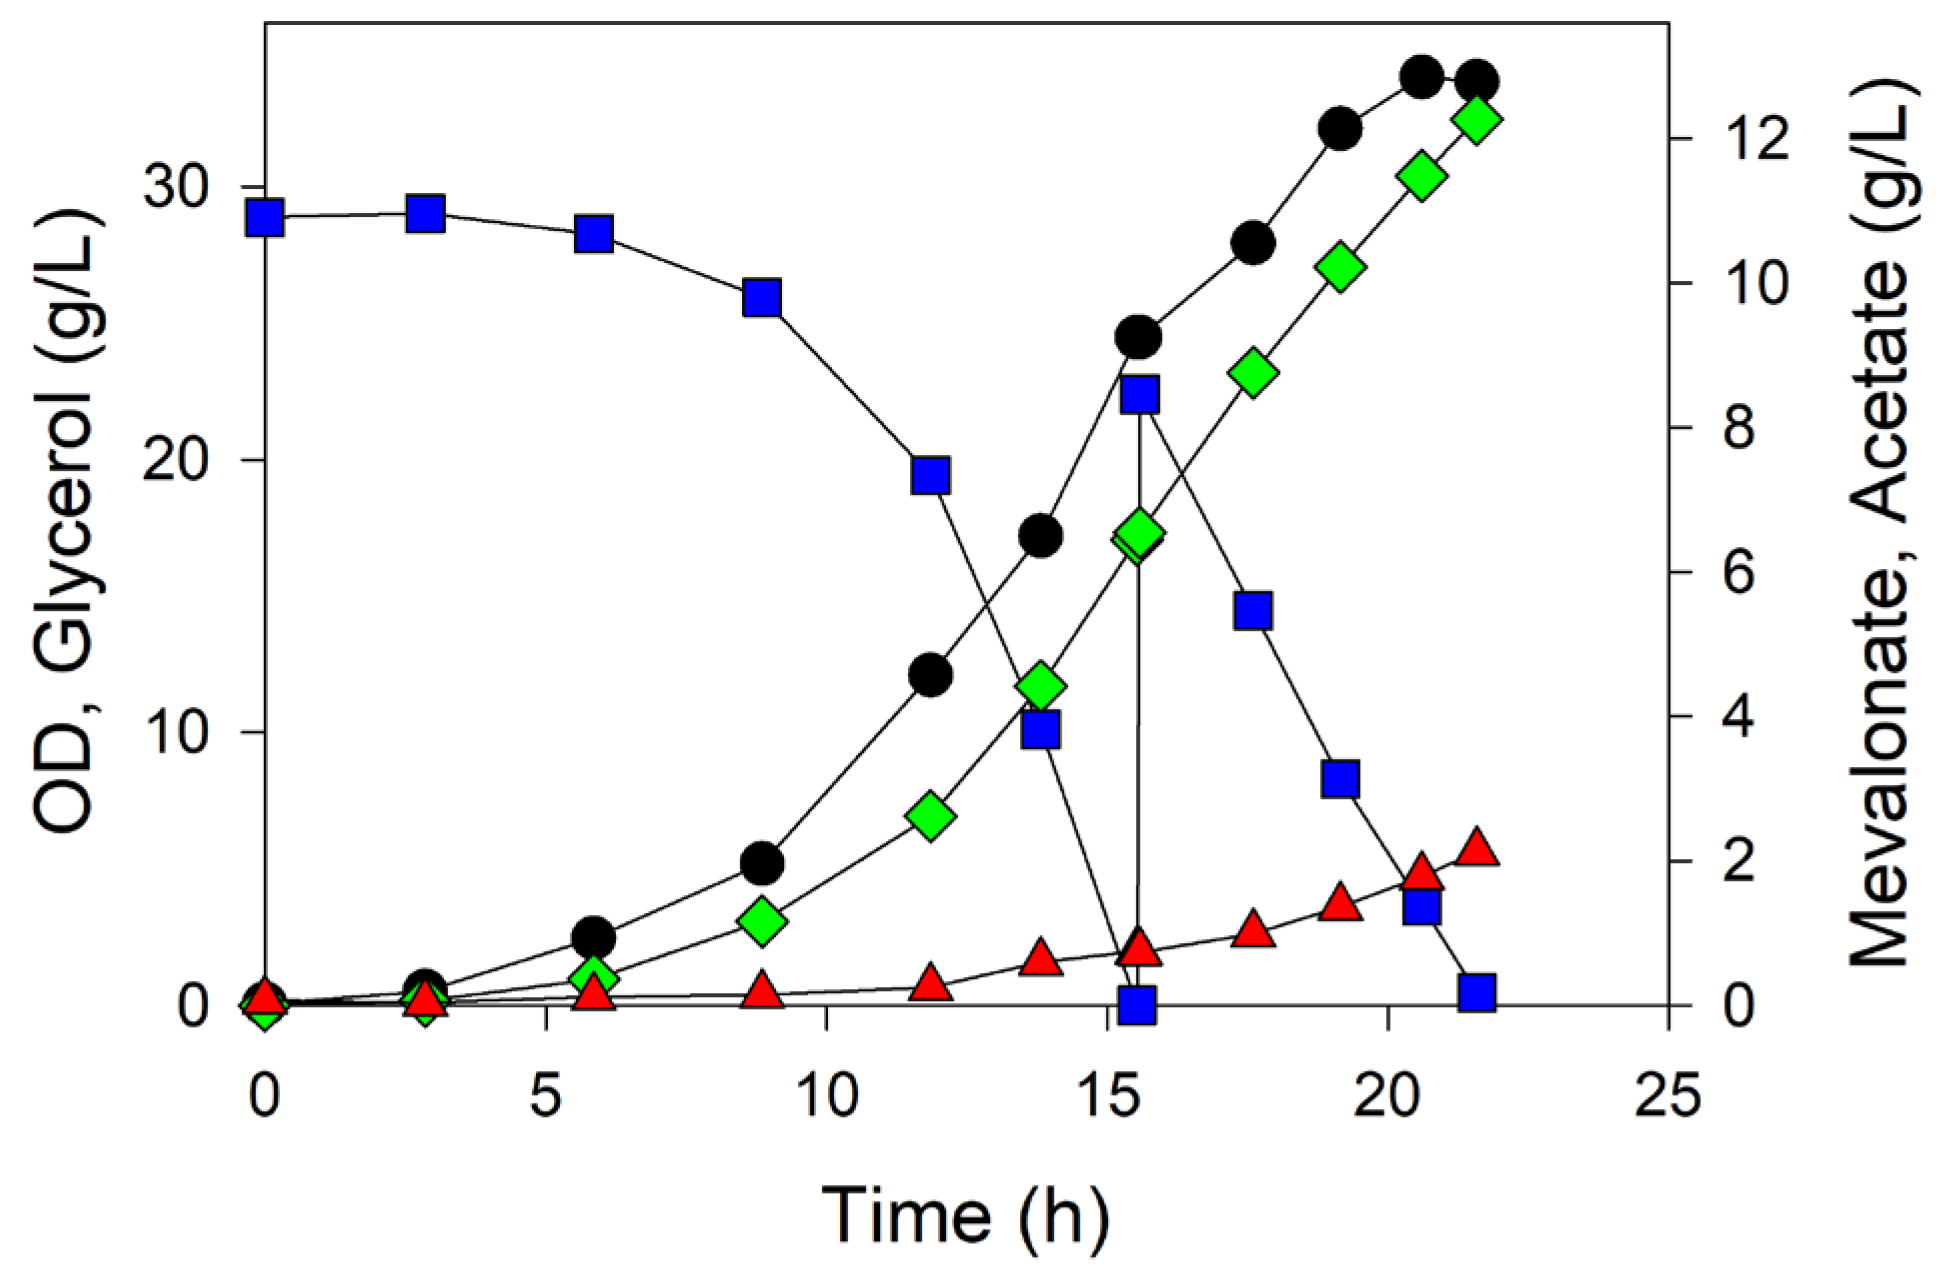
The phosphorus-limited processes yielded 12.3 g/L mevalonate in about 22 h (Figure 6). The mevalonate yield was 0.22 g/g during the batch portion, and about 0.26 g/g during the fed-batch process. The acetate yield was about 0.02 g/g during the batch portion and 0.06 g/g during the fed-batch process. The biomass (OD) increased initially (from about 24 to 34) but then plateaued at 20 h, about 1 h before glycerol was depleted during the fed-batch portion of the process. The biomass concentration as measured by dry cell weight increased from 9.0 g/L to 9.8 g/L between 17.6 h and the end of the process, while the P concentration decreased from 47 mg/L to 15 mg/L. The specific rate of mevalonate production during the phosphorus-limited portion of the process was 94 mg/g biomass·h. However, the cells appeared to grow during the phosphorus-limited phase (as measured by OD), suggesting that the cells were not fully “limited”, possibly because they did not have a fixed P composition, and significantly restructured as a response to the limitation in this nutrient. This phenomenon has been observed in many other contexts [39].
The nitrogen-limited and phosphorus-limited processes showed similar, indistinguishable mevalonate yield. For both processes, mevalonate formation ceased when glycerol was depleted (Figure 5 and Figure 6). Nitrogen-limitation yielded much greater acetate than phosphorus-limitation. One possible explanation for this observation is an increased flux through the pentose-phosphate pathway, which has been previously observed under phosphorus-limited conditions [54]. Although the mevalonate yields were similar, phosphorus-limited conditions showed greater specific mevalonate formation rate compared to nitrogen-limited conditions. However, this difference might be attributable to how much less ‘limited’ cells were under phosphorus-limited conditions, in which evidence is observed for cell restructuring in response to nutrient limitation.

4. Conclusions

The current work demonstrates the benefit of citrate synthase variants, compared to wild-type citrate synthase, during the conversion of glycerol to mevalonate, a product derived from acetyl–CoA. Despite difference in carbon metabolism from other typical sugar substrates, glycerol is readily converted by citrate synthase variants to mevalonate at a yield of 0.26 g/g with an extended fed-batch process. In a defined medium under batch conditions, the GltA[A267T] variant accumulated 15-fold greater mevalonate than the wild-type strain, with only a 10–15% increase in the time required to deplete the carbon source. The relatively small difference in growth rate and substrate utilization for glycerol comparing the wild-type strain and the most sever variants lies in contrast with observations made when glucose was the carbon source. This approach provides a straightforward way to allow introduced pathways to compete favorably with existing metabolic pathways, and it can readily be coupled with other existing approaches including those involving dynamic expression of pathways. Nutrient-limited fed-batch processes increased the yield by an additional 10–15%.

Author Contributions

C.E.H. and M.A.E. designed the study. C.E.H. performed the cultivations, sampling and analysis. C.E.H. and M.A.E. interpreted the results and wrote the manuscript. M.A.E. was responsible for funding acquisition and project administration. All authors have read and agreed to the published version of the manuscript.

Funding

This work was funded internally by the University of Georgia and by the U.S. National Science Foundation (CBET-1802533).

Institutional Review Board Statement

Not applicable.

Informed Consent Statement

Not applicable.

Data Availability Statement

The original contributions presented in this study are included in the article. Further inquiries can be directed to the corresponding author.

Acknowledgments

The authors acknowledge Gabriel Eschedor for technical assistance. The authors thank M.O.A. Sommer for the pMVA1 plasmid.

Conflicts of Interest

The authors declare no conflicts of interest.

References

  1. Zaroubi, L.; Ozugergin, I.; Mastronardi, K.; Imfeld, A.; Law, C.; Gélina, Y.; Piekny, A.; Findlay, B.L. The ubiquitous soil terpene geosmin acts as a warning chemical. Appl. Environ. Microbiol. 2022, 88, e00093-22. [Google Scholar] [CrossRef] [PubMed]
  2. Hui, W.; Wang, J.; Ma, L.; Zhao, F.; Jia, L.; Zhong, Y.; Zhang, S.; Gong, W. Identification of key genes in the biosynthesis pathways related to terpenoids, alkaloids and flavonoids in fruits of Zanthoxylum armatum. Sci. Hort. 2021, 290, 110523. [Google Scholar] [CrossRef]
  3. Guimarães, A.C.; Meireles, L.M.; Lemos, M.F.; Guimarães, M.C.C.; Endringer, D.C.; Fronza, M.; Scherer, R. Antibacterial activity of terpenes and terpenoids present in essential oils. Molecules 2019, 24, 2471. [Google Scholar] [CrossRef] [PubMed]
  4. Schwab, W.; Fuchs, C.; Huang, F.C. Transformation of terpenes into fine chemicals. Eur. J. Lipid Sci. Technol. 2013, 115, 3–8. [Google Scholar] [CrossRef]
  5. Kuzuyama, T.; Dairi, T.; Yamashita, H.; Shoji, Y.; Seto, H. Heterologous mevalonate production in Streptomyces lividans TK23. Biosci. Biotechnol. Biochem. 2004, 68, 931–934. [Google Scholar] [CrossRef][Green Version]
  6. Yogev, Y.; Shorer, Z.; Koifman, A.; Wormser, O.; Drabkin, M.; Halperin, D.; Dolgin, V.; Proskorovski-Ohayon, R.; Hadar, N.; Davidov, G.; et al. Limb girdle muscular disease caused by HMGCR mutation and statin myopathy treatable with mevalonolactone. Proc. Natl. Acad. Sci. USA 2023, 120, e2217831120. [Google Scholar] [CrossRef]
  7. Lombard, J.; Moreira, D. Origins and early evolution of the mevalonate pathway of isoprenoid biosynthesis in the three domains of life. Mol. Biol. Evol. 2011, 28, 87–99. [Google Scholar] [CrossRef]
  8. Miziorko, H.M. Enzymes of the mevalonate pathway of isoprenoid biosynthesis. Arch. Biochem. Biophys. 2011, 505, 131–143. [Google Scholar] [CrossRef]
  9. Kim, J.-H.; Wang, C.; Jang, H.-J.; Cha, M.-S.; Park, J.-E.; Jo, S.-Y.; Choi, E.-S.; Kim, S.-W. Isoprene production by Escherichia coli through the exogenous mevalonate pathway with reduced formation of fermentation byproducts. Microb. Cell Fact. 2016, 15, 214. [Google Scholar] [CrossRef]
  10. Kamata, K.; Toya, Y.; Shimizu, H. Effect of precise control of flux ratio between the glycolytic pathways on mevalonate production in Escherichia coli. Biotechnol. Bioeng. 2019, 116, 1080–1088. [Google Scholar] [CrossRef]
  11. Wang, Y.; Zhou, S.; Li, R.; Liu, Q.; Shao, X.; Zhu, L.; Kang, M.-K.; Wei, G.; Kim, S.-W.; Wang, C. Reassessing acetyl-CoA supply and NADPH availability for mevalonate biosynthesis from glycerol in Escherichia coli. Biotechnol. Bioeng. 2022, 119, 2868–2877. [Google Scholar] [CrossRef] [PubMed]
  12. Rugbjerg, P.; Feist, A.M.; Sommer, M.O.A. Enhanced metabolite productivity of Escherichia coli adapted to glucose M9 minimal medium. Front. Bioeng. Biotechnol. 2018, 6, 166. [Google Scholar] [CrossRef] [PubMed]
  13. Li, S.; Jendresen, C.B.; Nielsen, A.T. Increasing production yield of tyrosine and mevalonate through inhibition of biomass formation. Process Biochem. 2016, 51, 1992–2000. [Google Scholar] [CrossRef]
  14. Masuda, A.; Toya, Y.; Shimizu, H. Metabolic impact of nutrient starvation in mevalonate-producing Escherichia coli. Bioresour. Technol. 2017, 245, 1634–1640. [Google Scholar] [CrossRef]
  15. Xu, X.; Xie, M.; Zhao, Q.; Xian, M.; Liu, H. Microbial production of mevalonate by recombinant Escherichia coli using acetic acid as a carbon source. Bioengineered 2018, 9, 116–123. [Google Scholar] [CrossRef]
  16. Glycerol Market Size & Share 2024-2034–Market Size by Product Type (Crude, Refined), by Source (Biodiesel, Fatty Acids, Fatty Alcohols, Soap Industry), by Application, Downstream Application & Global Forecast. Global Market Insights. 2025. Available online: https://www.gminsights.com/industry-analysis/glycerol-market-size (accessed on 30 June 2025).
  17. Chilakamarry, C.R.; Mimi Sakinah, A.M.; Zularisam, A.W.; Pandey, A. Glycerol waste to value added products and its potential applications. Syst. Microbiol. Biomanufact. 2021, 1, 378–396. [Google Scholar] [CrossRef]
  18. Trinh, C.T.; Srienc, F. Metabolic engineering of Escherichia coli for efficient conversion of glycerol to ethanol. Appl. Environ. Microbiol. 2009, 75, 6696–6705. [Google Scholar] [CrossRef]
  19. Blankschein, M.D.; Clomberg, J.M.; Gonzalez, R. Metabolic engineering of Escherichia coli for the production of succinate from glycerol. Metabol. Eng. 2010, 12, 409–419. [Google Scholar] [CrossRef]
  20. Zhu, Y.; Eiteman, M.A.; Lee, S.A.; Altman, E. Conversion of glycerol to pyruvate by Escherichia coli using acetate- and acetate/glucose-limited fed-batch processes. J. Industr. Microbiol. Biotechnol. 2010, 37, 307–312. [Google Scholar] [CrossRef]
  21. Oh, B.-R.; Heo, S.-Y.; Lee, S.-M.; Hong, W.-K.; Park, J.M.; Jung, Y.R.; Kim, D.-H.; Sohn, J.-H.; Seo, J.-W.; Kim, C.H. Production of 2-butanol from crude glycerol by a genetically-engineered Klebsiella pneumoniae strain. Biotechnol. Lett. 2014, 36, 57–62. [Google Scholar] [CrossRef]
  22. Wu, X.; Eiteman, M.A. Synthesis of citramalic acid from glycerol by metabolically engineered Escherichia coli. J. Industr. Microbiol. Biotechnol. 2017, 44, 1483–1490. [Google Scholar] [CrossRef]
  23. Zhang, H.; Li, Z.; Pereira, B.; Stephanopoulos, G. Engineering E. coliE. coli cocultures for production of muconic acid from glycerol. Microb. Cell Fact. 2015, 14, 134. [Google Scholar] [CrossRef]
  24. Yang, T.; Rao, Z.; Zhang, X.; Xu, M.; Xu, Z.; Yang, S.-T. Enhanced 2,3-butanediol production from biodiesel-derived glycerol by engineering or cofactor regeneration and manipulating carbon flux in Bacillus amyloliquefaciens. Microb. Cell Fact. 2015, 14, 122. [Google Scholar] [CrossRef]
  25. Zhao, J.; Baba, T.; Mori, H.; Shimizu, K. Effect of zwf gene knockout on the metabolism of Escherichia coli grown on glucose or acetate. Metabol. Eng. 2004, 6, 164–174. [Google Scholar] [CrossRef] [PubMed]
  26. Satowa, D.; Fujiwara, R.; Uchio, S.; Nakano, M.; Otomo, C.; Hirata, Y.; Matsumoto, T.; Noda, S.; Tanaka, T.; Kondo, A. Metabolic engineering of E. coli for improving mevalonate production to promote NADPH regeneration and enhance acetyl-CoA supply. Biotechnol. Bioeng. 2020, 117, 2153–2164. [Google Scholar] [CrossRef] [PubMed]
  27. Vandedrinck, S.; Deschamps, G.; Sablon, E.; Vandamme, E.J. Metabolic engineering of Escherichia coli: Construction and characterization of a gltA (citrate synthase) knockout mutant. Meded. Rijksuniv. Gent. Fak. Landbouwkd. Toegep. Biol. Wet. 2001, 66, 333–336. [Google Scholar] [PubMed]
  28. Wu, X.; Eiteman, M.A. Production of citramalate by metabolically engineered Escherichia coli. Biotechnol. Bioeng. 2016, 113, 2670–2675. [Google Scholar] [CrossRef]
  29. Tovilla-Coutiño, D.B.; Momany, C.; Eiteman, M.A. Engineered citrate synthase alters acetate accumulation in Escherichia coli. Metabol. Eng. 2020, 61, 171–180. [Google Scholar] [CrossRef]
  30. Heo, M.-J.; Jung, H.-M.; Um, J.; Lee, S.-W.; Oh, M.-K. Controlling Citrate Synthase Expression by CRISPR/Cas9 Genome Editing for n-Butanol production in Escherichia coli. ACS Synth. Biol. 2017, 6, 182–189. [Google Scholar] [CrossRef]
  31. Moxley, W.C.; Eiteman, M.A. Pyruvate production by Escherichia coli using pyruvate dehydrogenase variants. Appl. Environ. Microbiol. 2021, 87, e00487-21. [Google Scholar] [CrossRef]
  32. Rajpurohit, H.; Eiteman, M.A. Citrate synthase variants improve yield of acetyl-CoA derived 3-hydroxybutyrate in Escherichia coli. Microb. Cell Fact. 2024, 23, 173. [Google Scholar] [CrossRef] [PubMed]
  33. Wu, X.; Tovilla-Coutiño, D.B.; Eiteman, M.A. Engineered citrate synthase improves citramalic acid generation in Escherichia coli. Biotechnol. Bioeng. 2020, 117, 2781–2790. [Google Scholar] [CrossRef] [PubMed]
  34. Dodelin, J.K.; Rose, A.E.; Rajpurohit, H.; Eiteman, M.A. Increased mevalonate production using engineered citrate synthase and phosphofructokinase variants of Escherichia coli. Biotechnol. Bioeng. 2024, 122, 548–560. [Google Scholar] [CrossRef] [PubMed]
  35. Van Ooyen, J.; Noack, S.; Bott, M.; Reth, A.; Eggeling, L. Improved L-lysine production with Corynebacterium glutamicum and systemic insight into citrate synthase flux and activity. Biotechnol. Bioeng. 2012, 109, 2070–2081. [Google Scholar] [CrossRef]
  36. Soma, Y.; Tsuruno, K.; Wada, M.; Yokota, A.; Hanai, T. Metabolic flux redirection from a central metabolic pathway toward a synthetic pathway using a metabolic toggle switch. Metabol. Eng. 2014, 23, 175–184. [Google Scholar] [CrossRef]
  37. Zhou, H.; Zhang, Y.; Long, C.P.; Xia, X.; Xue, Y.; Ma, Y.; Antoniewicz, M.R.; Tao, Y.; Lin, B. A citric acid cycle-deficient Escherichia coli as an efficient chassis for aerobic fermentations. Nat. Commun. 2024, 15, 2372. [Google Scholar] [CrossRef]
  38. Gonzalez, J.M.; Aranda, B. Microbial Growth under Limiting Conditions-Future Perspectives. Microorganisms 2023, 11, 1641. [Google Scholar] [CrossRef]
  39. Rajpurohit, H.; Eiteman, M.A. Nutrient-limited operational strategies for the microbial production of biochemicals. Microorganisms 2022, 10, 2226. [Google Scholar] [CrossRef]
  40. Perez-Zabaleta, M.; Guevara-Martínez, M.; Gustavsson, M.; Quillaguamán, J.; Larsson, G.; van Maris, A.J.A. Comparison of engineered Escherichia coli AF1000 and BL21 strains for (R)-3-hydroxybutyrate production in fed-batch cultivation. Appl. Microbiol. Biotechnol. 2019, 103, 5627–5639. [Google Scholar] [CrossRef]
  41. Kim, B.S.; Lee, S.C.; Lee, S.Y.; Chang, H.N.; Chang, Y.K.; Woo, S.I. Production of poly(3-hydroxybutyric-co-3-hydroxyvaleric acid) by fed-batch culture of Alcaligenes eutrophus with substrate control using on-line glucose analyzer. Enzym. Microb. Technol. 1994, 16, 556–561. [Google Scholar] [CrossRef]
  42. Kim, B.S.; Lee, S.C.; Lee, S.Y.; Chang, H.N.; Chang, Y.K.; Woo, S.I. Production of poly(3-hydroxybutyric acid) by fed-batch culture of Alcaligenes eutrophus with glucose concentration control. Biotechnol. Bioeng. 1994, 43, 892–898. [Google Scholar] [CrossRef]
  43. Stokell, D.J.; Donald, L.J.; Maurus, R.; Nguyen, N.T.; Sadler, G.; Choudhary, K.; Hultin, P.G.; Brayer, G.D.; Duckworth, H.W. Probing the roles of key residues in the unique regulatory NADH binding site of type II citrate synthase of Escherichia coli. J. Biol. Chem. 2003, 278, 35435–35443. [Google Scholar] [CrossRef] [PubMed]
  44. Rugbjerg, P.; Myling-Petersen, N.; Porse, A.; Sarup-Lytzen, K.; Sommer, M.O.A. Diverse genetic error modes constrain large-scale bio-based production. Nat. Commun. 2018, 9, 787. [Google Scholar] [CrossRef] [PubMed]
  45. Eiteman, M.A.; Chastain, M.J. Optimization of the ion exchange analysis of organic acids from fermentation. Anal. Chim. Acta 1997, 338, 69–75. [Google Scholar] [CrossRef]
  46. United States EPA Method 350.1; Determination of Ammonia Nitrogen by Semi-Automated Colorimetry. United States EPA: Cincinnati, OH, USA, 1993.
  47. United States EPA Method 200.8; Determination of Trace Elements in Waters and Wastes by Inductively Coupled Plasma–Mass Spectrometry. United States EPA: Cincinnati, OH, USA, 1994.
  48. Duckworth, H.W.; Nguyen, N.T.; Gao, Y.; Donald, L.J.; Maurus, R.; Ayed, A.; Bruneau, B.; Brayer, G.D. Enzyme-substrate complexes of allosteric citrate synthase: Evidence for a novel intermediate in substrate binding. Biochim. Biophys. Acta Protein Proteonomics 2013, 1834, 2546–2553. [Google Scholar] [CrossRef]
  49. Pereira, D.S.; Donald, L.J.; Hosfield, D.J.; Duckworth, H.W. Active site mutants of Escherichia coli citrate synthase. J. Biol. Chem. 1994, 269, 412–417. [Google Scholar] [CrossRef]
  50. Dodelin, J.K. Selection and Characterization of Escherichia coli Citrate Synthase Variants That Improve Biosynthesis of Products Derived from Acetyl-CoA. Doctoral Dissertation, University of Georgia, Athens, GA, USA, 2024. [Google Scholar]

  51. Quandt, E.M.; Gollihar, J.; Blount, Z.D.; Ellington, A.D.; Georgiou, G.; Barrick, J.E. Fine-tuning citrate synthase flux potentiates and refines metabolic innovation in the Lenski evolution experiment. eLife 2015, 4, e09696. [Google Scholar] [CrossRef]
  52. Takamura, Y.; Nomura, G. Changes in the intracellular concentration of aetyl-CoA and malonyl-CoA in relation to the carbon and energy metabolism of Escherichia coli K12. J. Gen. Microbiol. 1988, 134, 2249–2253. [Google Scholar] [CrossRef]
  53. Martínez-Gómez, K.; Flores, N.; Castañeda, H.M.; Martínez-Batallar, G.; Hernández-Chávez, G.; Ramírez, O.T.; Gosset, G.; Encarnación, S.; Bolivar, F. New insights into Escherichia coli metabolism: Carbon scavenging, acetate metabolism and carbon recycling responses during growth on glycerol. Microb. Cell Fact. 2012, 11, 46. [Google Scholar] [CrossRef]
  54. Van Bogelen, R.A.; Olson, E.R.; Wanner, B.L.; Neidhardt, F.C. Global analysis of proteins synthesized during phosphorus restriction in Escherichia coli. J. Bacteriol. 1996, 178, 4344. [Google Scholar] [CrossRef]
Figure 1. Conversion of glycerol to mevalonate via the mevalonate pathway (in blue) introduced into E. coli. This study focuses on making modifications to citrate synthase expressed by the gltA gene (in green) which is the primary competitor to the mevalonate pathway.
Fermentation 12 00186 g001
Figure 2. Maximum specific growth rate of E. coli citrate synthase variants on glycerol (blue), glucose (green), and xylose (red) as the sole carbon source. An asterisk (*) indicates that a chromosomal mutation did not alter the amino acid sequence.
Fermentation 12 00186 g002
Figure 3. Batch microbial processes on 30 g/L glycerol using citrate synthase variants expressing the pMVA1 plasmid: (a) the wild-type strain; (b) the strain expressing GltA[Y87N, D101D*, P208L]; and (c) the strain expressing GltA[A267T]. Plots show biomass (black circles), glycerol (blue squares), acetate (red triangles), and mevalonate (green diamonds).
Fermentation 12 00186 g003
Figure 4. Mass yields of products from 30 g/L glycerol using citrate synthase variants expressing the pMVA1 plasmid. Plots show yield of biomass (black), mevalonate (green), and acetate (red). An asterisk (*) indicates that a chromosomal mutation did not alter the amino acid sequence.
Fermentation 12 00186 g004
Figure 5. Batch growth of GltA[A267T] variant followed by a nitrogen-limited fed-batch process. In initial medium contained 4.0 g/L NH4Cl for an initial total nitrogen concentration of 1.2 g N/L and nominally 30 g/L glycerol. When the glycerol was nearly depleted, glycerol and additional nutrients were added as described in Section 2. Also, a sterile feed of 660 µL/h of a 125 g/L NH4Cl commenced, corresponding to a constant addition rate of 21.6 mg N/h. Plot shows biomass (black circles), glycerol (blue squares), acetate (red triangles), and mevalonate (green diamonds).
Fermentation 12 00186 g005
Figure 6. Batch growth of GltA[A267T] variant followed by a phosphorus-limited fed-batch process. In initial medium contained 1.10 g K2HPO4/L for an initial total phosphorus concentration of 196 mg P/L and nominally 30 g/L glycerol. When the glycerol was nearly depleted, glycerol and additional nutrients were added as described in Section 2. Also, a sterile feed of 660 µL/h of a 42.9 g/L K2HPO4 commenced, corresponding to a constant addition rate of 5.0 mg P/h. Plot shows biomass (black circles), glycerol (blue squares), acetate (red triangles), and mevalonate (green diamonds).
Fermentation 12 00186 g006
Table 1. Citrate synthase variants of Escherichia coli selected for this study. An asterisk (*) indicates that a chromosomal mutation did not alter the amino acid sequence.
Strain NameCitrate Synthase
Substitutions
Reference
E. coli WWild-Type enzymeATCC 9637
MEC1484Y87N, D101D*, P208L[34]
MEC1501K167A[43]
MEC1502A267T[29]
MEC1503F383M[29,33]
MEC1558P313S[34]
Disclaimer/Publisher’s Note: The statements, opinions and data contained in all publications are solely those of the individual author(s) and contributor(s) and not of MDPI and/or the editor(s). MDPI and/or the editor(s) disclaim responsibility for any injury to people or property resulting from any ideas, methods, instructions or products referred to in the content.