
Article

A Kinetics Study on Co-Digestion of Cattle Manure, Macroalgae and Cheese Whey

by
Figen Taşcı Durgut
Machinery and Metal Technology Department, Vocational College of Technical Sciences, Tekirdag Namik Kemal University, 59030 Tekirdağ, Türkiye
Fermentation 2026, 12(2), 94; https://doi.org/10.3390/fermentation12020094
Submission received: 4 January 2026 / Revised: 20 January 2026 / Accepted: 5 February 2026 / Published: 7 February 2026

Abstract

In this research, cattle manure, macroalgae, and cheese whey were mixed in various proportions (cattle manure:macroalgae:cheese whey ratios of 50:30:20, 30:20:50 and 20:50:30) and subjected to co-digestion under laboratory conditions at two different digestion temperatures (30 and 45 °C). The modified Gompertz and first-order kinetic models were used to predict biomethane potentials. The highest experimental biochemical methane potential of 0.373 Nm3CH4/kgVS was obtained from Mixture-2 at 45 °C, while the lowest, 0.154 Nm3CH4/kgVS, was achieved with Mixture-1 at 30 °C. Feedstock rates in the mixture and digestion temperature significantly influenced the biochemical methane potential (p < 0.05). Cheese whey was observed to positively contribute to increasing biomethane potential. Increasing the whey ratio in the mixture from 20% to 50% resulted in a 62.5% increase in biomethane production. While R2 values for the modified Gompertz model ranged from 0.993 to 0.999, those of the first-order model varied between 0.968 and 0.984. Of the two kinetic models employed for estimating biomethane potentials, the modified Gompertz model yielded values closer to the experimental biomethane potentials.

1. Introduction

Converting organic residues from forestry and agro-industrial sectors into energy using appropriate conversion technologies provides both economic benefits and positive environmental impacts. Various technologies, including incineration, gasification, pyrolysis, and anaerobic digestion (AD), are employed to recover energy and value-added products while mitigating negative environmental impacts of organic waste [1]. Among these technologies, AD of biomass is the oldest biological process approach that has been utilized by humans for the longest amount of time. Anaerobic digestion technology offers significant environmental benefits and can also serve as a source of income for farmers. Furthermore, biological conversion can be integrated with thermal processes such as incineration, pyrolysis, and gasification to enhance bioconversion [2]. The economic efficiency of anaerobic digestion depends on factors such as investment costs, operational expenses of the biogas plant, and the optimization of methane production [3,4]. Determining the biochemical methane potential of feedstocks in the AD process is crucial for conversion efficiency. The biochemical methane potential (BMP) is heavily influenced by the physical and chemical structure of the feedstock. The structure of organic materials varies widely, resulting in different BMP values for each raw material. Many experimental and theoretical methods have been developed to determine the BMP of feedstocks. Experimental methods for determining BMP are typically both costly and time-consuming. To address this issue, kinetic models were developed to provide faster and more convenient estimations of BMP [5].
Many previous studies have used kinetic models to determine biochemical methane production potential [6]. Kinetic modeling of the AD process has an important role in anaerobic bioreactor design [7,8]. Microorganisms play important roles in different stages of the AD process. In parallel with the bacterial growth process, the cumulative biogas production process generally follows an exponential path [9,10]. For this reason, the first-order kinetic model is generally used to simulate the anaerobic biodegradation [9]. Additionally, kinetic models such as the modified Gompertz equation, logistic function, and transference function (reaction curve-type model), which simulate cumulative gas accumulation, are also widely used [11].
A kinetic evaluation was conducted for the degradation of swine manure (SM) and the generation of biogas by Kafle and Kim [7]. They stated that the modified Gompertz equation is the most suitable model for predicting biogas and methane production from SM. The modified Gompertz model was used to determine the effect of alkaline pretreatment applied to wheat straw on biogas production. Alkaline pretreatment of wheat straw with KOH resulted in significant changes in physical and chemical properties of the substrates and increased their biodegradability [12]. Five different kinetic models (pseudo-first-order kinetics, logistics, modified Gompertz, double-Gompertz, and multi-Gompertz) were applied to determine the cumulative methane production potential of marine microalgae with low solid content. All applied models were compatible with experimental data (R2 > 0.988). However, the multi-Gompertz provided the best performance parameters for all experimental conditions tested [13]. In the study conducted to determine the biogas production potential from the anaerobic co-digestion of wood sawdust and chicken manure, the modified Gompertz, logistic and cone models had low prediction errors (<10%) [14]. Different kinetic models were applied in the research to determine the best mixing ratio, C:N ratio and total solids ratio in the anaerobic co-digestion of wheat straw, food waste and cattle manure. In the research, four kinetic models (Gompertz, first-order, transference, and logistic) were used for kinetic study and curve fitting of experimental data. The experimental data fit well with all the models, with coefficient of discrimination (R2) ranging from 0.882 to 0.999 [1]. Ovamah and Izinyon [15] developed the biodegradability kinetic (BIK) model by using the parameters of the modified Gompertz model to estimate the biodegradability coefficient (k). They used this model for co-digestion of food waste and corn husk and calculated the k as 0.11 d−1. Jijai and Siripatana [16] aimed to evaluate BMP of Thai rice noodle wastewater co-digested with chicken manure. In their study, batch anaerobic digestion systems were operated at room temperature (28–30 °C) for 45 days. They added five different amounts of chicken manure to Thai rice noodle wastewater, operating in five digesters (10 g, 20 g, 30 g, 40 g, and 50 g of chicken manure added, respectively). They stated that the Gompertz model and its related extensions were used to represent the experimental data in biogas production due to their simplicity and good fit to batch data (R2 > 0.990). Three mathematical models (first-order, Gompertz, and surface-based) were implemented to describe the hydrolysis kinetics and cumulative biogas production during the anaerobic digestion of waste from date palm fruits. The Gompertz model had the best fit for these experimental results, suggesting that bacterial growth is the limiting step in the generation of biogas from date palm fruit wastes. The maximum deviation between the model predictions and the experimental data was 6%, while the lowest deviation was 2% [17].
Temperature is a crucial operational parameter in AD. Historically, mesophilic (35–40 °C) and thermophilic (50–60 °C) temperature ranges have been extensively utilized for AD. Each temperature range presents unique benefits and drawbacks. Thermophilic digestion increases the degradation rate, methane generation, and pathogen inactivation; however, it necessitates greater energy input for heating and is vulnerable to ammonia inhibition and process instability. Conversely, mesophilic digestion provides enhanced stability and reduced energy requirements, although it produces less methane and exhibits inferior pathogen elimination [18,19].
Research indicates that the ideal temperature for anaerobic digestion may vary depending on the feedstock. The necessity of relinquishing entrenched practices, especially those regarding process temperature, to enhance biogas generation was noted. Recent studies indicate that the ideal temperature for anaerobic digestion of cattle dung in co-fermentation is 45 °C. These findings contest conventional perspectives on optimal temperatures for anaerobic digestion, indicating a need to reevaluate the efficiency of manure-based co-fermentation within the temperature range of approximately 45 °C. The data indicates that the temperature influence on AD is contingent upon the feedstock, with 45 °C serving as a general optimum that enhances energy efficiency, process stability, and rheological qualities. Notwithstanding these observations, comprehensive and systematic investigations linking feedstock composition to anaerobic digestion efficacy at mesophilic, medium, and thermophilic temperatures are scarce [18,19].
While previous studies have examined co-digestion of binary mixtures (manure-whey or manure-algae), limited research has evaluated ternary co-digestion systems combining cattle manure, macroalgae, and cheese whey at intermediate temperatures (30 °C and 45 °C). This study aims to: (1) determine the optimal mixture ratio for biomethane production, (2) evaluate temperature effects on BMP at non-conventional temperature ranges, and (3) validate kinetic models for predicting methane yields from this specific substrate combination.

2. Materials and Methods

In this research, cattle manure, cheese whey, and macroalgae were utilized as feedstocks for co-digestion. Cattle manure was obtained daily during the experiments from the farm of the Faculty of Agriculture, Tekirdağ. Macroalgae collected from the Sea of Marmara in May-June were washed with freshwater to remove residual salt and sand, then mechanically crushed using a blender to achieve a homogeneous paste with particle size < 2 mm. Due to its perishable nature, whey was obtained after cheese production and used immediately. All analyses were performed using standard methods before anaerobic digestion to determine the properties of the materials used in the experiments. To ensure the desired dry matter ratio in the experiments, the dry matter (TS) of each material was determined by placing samples in an oven at 105 °C until they reached constant weight. Ash content and volatile solids (VS) were determined by burning the materials in a muffle furnace at 550 °C [20]. The results of the analyses performed to determine the solid matter, volatile solid matter, and ash in dairy cattle manure, macroalgae and whey used in anaerobic digestion experiments are given in Table 1.

2.1. Experimental Setup

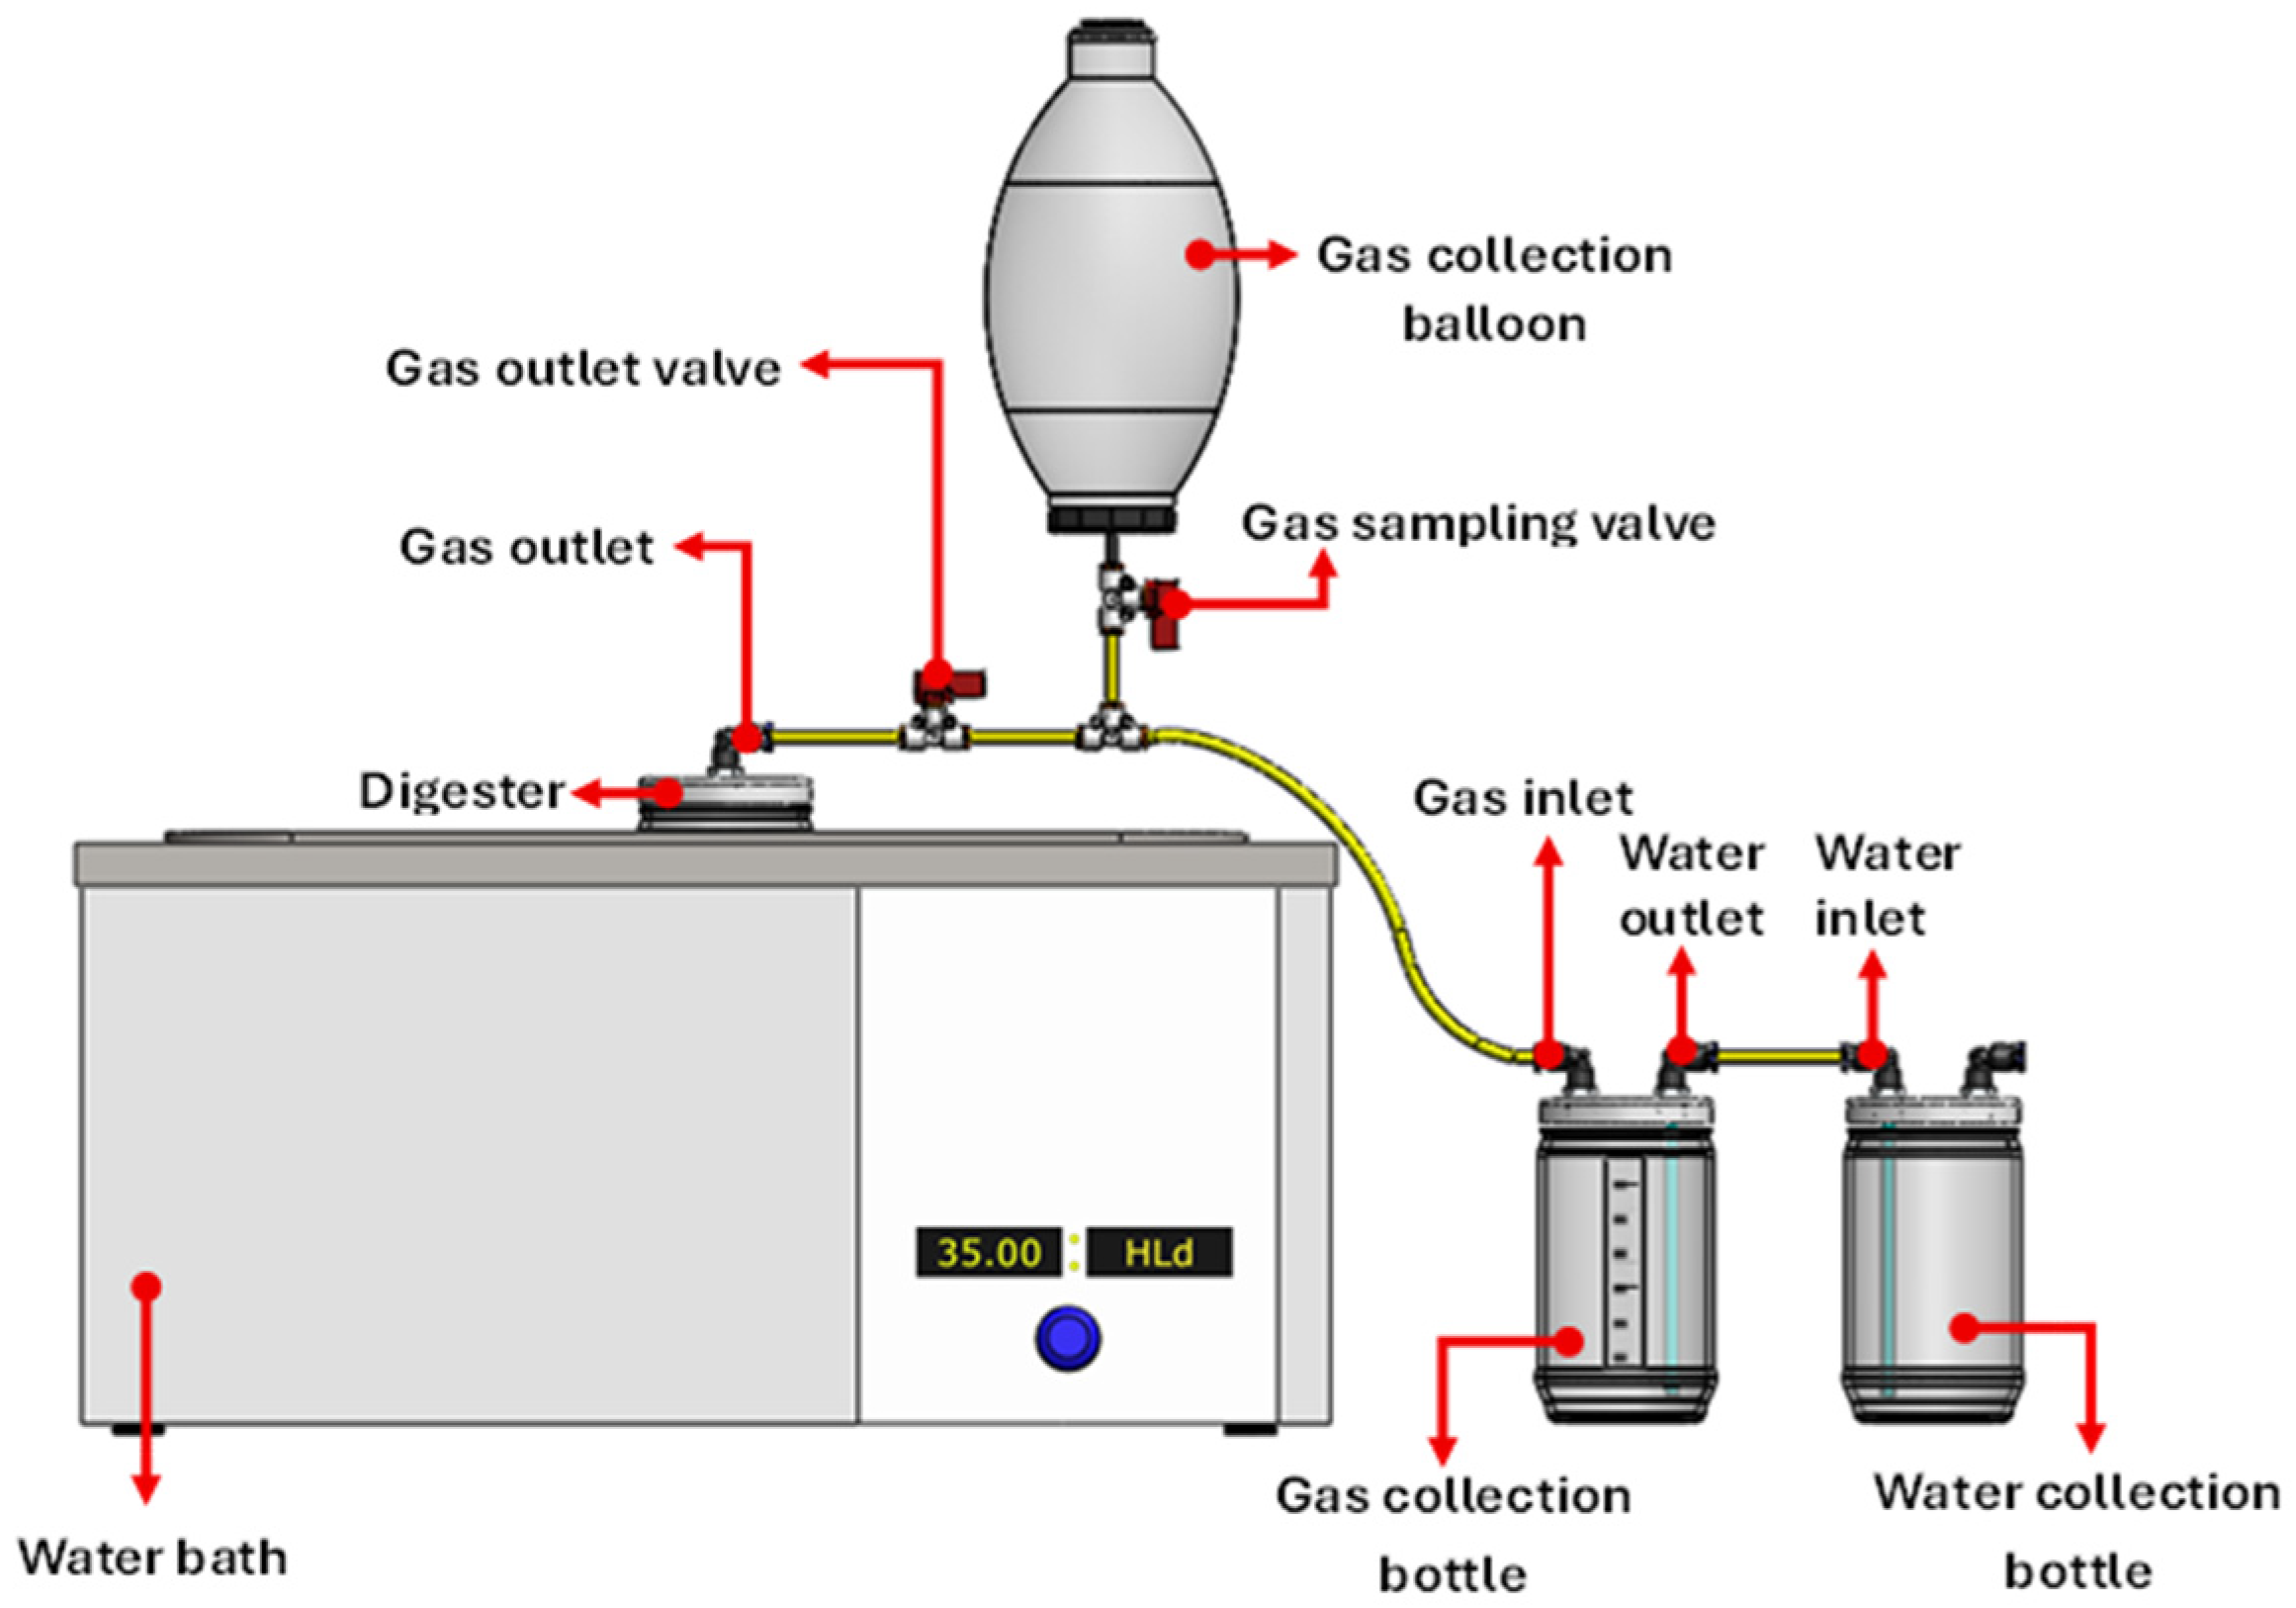
The experimental setup for the co-digestion experiments was constructed under laboratory conditions (see Figure 1). Glass bottles with a volume of 0.5 L served as digesters in the experiments. To prevent sunlight penetration, all bottles were covered with aluminum foil. All bottles used in the tests were checked for leaks using a hand pump. The digesters were maintained in a water bath (±0.5 °C accuracy) during fermentation to ensure controlled temperature conditions.
To measure the biogas produced in the digester, two glass bottles operating on the water displacement principle were connected using pneumatic sealing elements. The first bottle, connected to the digester, was filled with water and its outer surface was marked with a scale. As biogas was produced in the digester, it exerted pressure on the water in this bottle, causing it to transfer to the second bottle. Consequently, the volume of gas produced was determined by measuring the amount of overflowing water. The volume was then converted to the standard biogas volume under normal conditions of pressure and temperature (1 atm, 0 °C), according to the ideal gas law. In the water displacement method, the water was acidified to reduce CO2 solubility.
For gas sampling purposes, two valves were incorporated into the connection line between the digester and the first bottle. Prior to incubation, the headspace of each reactor was flushed with pure nitrogen gas for 3 min to displace residual air and establish a strictly anaerobic environment.
Biogas production was conducted at two temperatures (30 °C and 45 °C) using three mixture ratios (Table 2). Laboratory-scale anaerobic digestion experiments were conducted under two different temperature conditions with three replications. Each bottle was filled with 200 mL of manure. The batch anaerobic digestion method was employed, with a retention time (RT) of 21 days. The total solid matter ratio (TS) in the mixtures was adjusted to 12% (24 g dry matter). At the start of the experiment, the pH of the mixtures was adjusted to between 6.8 and 7.0 by adding NaOH. To ensure mixture homogeneity and prevent crust formation, the digester was mixed for 1–2 min, three times a day (every 8 h), thus preventing precipitation at the bottom and crust formation at the top of the mixture. The experiments were carried out with 3 repetitions.
The biogas sample was analyzed for methane content with a gas chromatograph (Agilent 7890B GC - (Tekirdağ, Türkiye)) equipped with a thermal conductivity detector (TCD) and a flame-ionizing detector (FID). Methane percentage was measured separately for each sample. The instrument was fitted with an Agilent J&W GC column, 19095P-Q04 (with 0.53 mm of inner diameter and 30 m of length). High purity argon was used as the carrier gas for GC measurements, and a dry air tube was used to ensure the proper functioning of the pneumatic valves on the device. The injection inlet, oven and detector temperatures were 250 °C, 80 °C and 155 °C, respectively. The standard gas used for calibrating the column consisted of a mixture of CO (15%), H2 (10%), CH4 (5%), CO2 (10%), and N2 (balance).

2.2. Kinetic Models

The experimental data was used to estimate biochemical methane potentials using the following kinetic models [6,10,11,21]:
The first order (FO) model:
Y m t = Y o . ( 1 exp k h . t ) ,
where Y m t (Nm3CH4/kgVS) is the cumulative methane production at specific time, Y o (Nm3CH4/kgVS) is the maximum methane production potential of feedstock, k h (1/day) is the apparent kinetic rate constant and t (days) is the cumulative time for methane production.
The modified Gompertz (GM) model:
Y m t = Y o . exp exp R m . e Y o λ t + 1 ,
where R m (Nm3CH4/kgVS day) is the maximum methane production rate, λ (days) is the lag time, and e is a mathematical constant (2.71828).

2.3. Statistical Analysis

All experimental data were subjected to a two-way analysis of variance (two-way ANOVA) at a significance level of p < 0.05 using the SPSS Ver18 statistical program. Means were compared using the Duncan test. Homogeneity of variance was tested with Levene statistics. Kinetic analysis was performed using nonlinear regression analysis with the SPSS Ver18 statistical program.
To assess the goodness of model fit, the coefficient of determination (R2) and root mean square error (RMSE) were employed [7]:
R M S E = i N Y m e x p , i Y m p r e d , i 2 N ,
where Y m e x p , i is the i th experimental methane production, Y m p r e d , i is the i th predicted methane production and N is the number of observations.
The coefficients for the kinetic models were determined through non-linear regression analysis using the SPSS program.

3. Results and Discussion

The experimental biochemical methane potentials of mixtures are given in Table 3. The interaction between temperature and mixture ratio was statistically significant (p < 0.05).
The highest biochemical methane potential of 0.373 Nm3CH4/kgVS was obtained from Mixture-2 at 45 °C, while the lowest, 0.154 Nm3CH4/kgVS, was achieved with Mixture-1 at 30 °C. The difference between the average biochemical methane potentials of the feedstock mixtures was found to be statistically significant (p < 0.05). Two-way ANOVA revealed that both mixture and temperature exerted statistically significant main effects on process performance (mixture: F = 22.60, p = 0.042; temperature: F = 20.49, p = 0.045). The highest average biochemical methane potential occurred with Mixture-2 (0.317 Nm3CH4/kgVS). The highest proportion of cheese whey (50%) was in Mixture-2. In their research, Bertin et al. [22] indicated that the highest biomethane potential was found for the mixture consisting of 50% whey and 50% cattle manure (0.320 Nm3CH4/kgVS). They reported that as the cheese whey ratio in the mixture increased, the biomethane potential also increased. The high BMP from whey-rich mixtures is attributed to its high lactose content (4–5% w/v), which rapidly hydrolyzes to glucose and galactose, providing readily available substrates for acidogenic bacteria. This accelerates the hydrolysis step, which is often rate-limiting in lignocellulosic substrates like macroalgae [23,24,25]. The biochemical methane potential obtained in this study is largely consistent with the data obtained by Bertin et al. [22] and reviewed by Esposito et al. [26]. Additionally, digestion temperature significantly influenced the biochemical methane potential (p < 0.05). The 62.5% increase in BMP when whey ratio increased from 20% to 50% suggests synergistic co-digestion effects beyond simple additive contributions. This may result from optimized C/N ratio and buffering capacity provided by whey’s protein content [27]. At digestion temperatures of 30 °C and 45 °C, the average biochemical methane potentials were 0.222 Nm3CH4/kgVS) and 0.302 Nm3CH4/kgVS, respectively. Raising temperature from 30 °C to 45 °C increased experimental yields by ~35.6% on average.
The methane potential of substrates is crucial for the design and operation of biogas facilities. Its ascertainment is not consistently feasible due to protracted experimental durations and insufficient infrastructure. Consequently, kinetic models are employed for the precise forecasting of methane potential.
Results of kinetic study using first order and modified Gompertz kinetic models are summarized in Table 4. In both models, the maximum methane production potential (Yo) was higher for all mixtures at 45 °C. Budiyono et al. [28] used the modified Gompertz kinetic model in their research to produce biogas from cattle manure in a batch reactor under different temperature conditions. The researchers stated that biogas production increases at high temperature and that temperature is a very important operational parameter in the AD process. The kinetic rate constant (kh) according to the First-Order model was highest at 45 °C across all mixtures. The lowest kinetic rate constant was observed in Mixture-1 at 30 °C (0.103 1/day), while the highest was in Mixture-2 at 45 °C (0.183 1/day) which has high cheese whey ratio. The higher kh at 45 °C (0.106–0.183 day−1) compared to 30 °C (0.103–0.114 day−1) reflects increased microbial metabolic rates at elevated temperatures, consistent with Arrhenius kinetics. Our kh values (0.103–0.183 day−1) fall within the range reported for manure-based systems (0.05–0.25 day−1) validating our experimental approach. Similarly, the maximum methane production rate (Rm) with the modified Gompertz model was higher at 45 °C for all three mixtures. These results fit within the range observed in the literature of 0.1196–0.43 for manure-based anaerobic digestion systems [29]. While the maximum methane production rate was lowest at 30 °C from Mixture-1 (0.014 Nm3CH4/kgVS day), it was highest at 45 °C from Mixture-2 (0.054 Nm3CH4/kgVS day). Lag phase (λ) values for the modified Gompertz model varied between 0.106 and 0.539 days. Although the Modified Gompertz Model applied to biogas production data generally yields a high coefficient of determination (R2 > 0.99), it has been observed that the standard errors associated with the λ parameter—representing the lag phase—are notably high. This phenomenon can be attributed to “parameter uncertainty” arising from the heterogeneous nature of the substrates used (cattle manure, whey, and macroalgae).
While whey ferments rapidly due to its soluble sugar content [30,31], the hydrolysis of lignocellulosic structures in macroalgae and cattle manure takes significantly longer [24,25]. These two contrasting kinetic processes make it mathematically difficult for the model to define a single, discrete starting point (lag phase). Ware and Power (2017) noted that in the co-digestion of complex substrates, the model is hypersensitive to minor fluctuations in initial data, which creates high variance in the λ value [32]. This indicates that the system adapted quickly and that the lag phase was not dominant; it alone does not negatively affect the overall fit of the model [33]. In the modified Gompertz model RMSE values were lower and R2 values were higher than in the first-order model for all mixtures. In general, there was overall agreement between the predicted methane potentials in both models and the experimental methane potentials. However the modified Gompertz model is more suitable due to its low RMSE values and high R2 values. Kaffle and Kim [7], in their study on the kinetics of anaerobic digestion of swine manure in a batch reactor, stated that the modified Gompertz model provides the best fit with experimental data. Etuwe et al. [34] used the data obtained with the modified Gompertz model in the design of a batch type biogas reactor. In the literature, the most frequently used kinetic model for methane production is the Gompertz model [11,12,17].
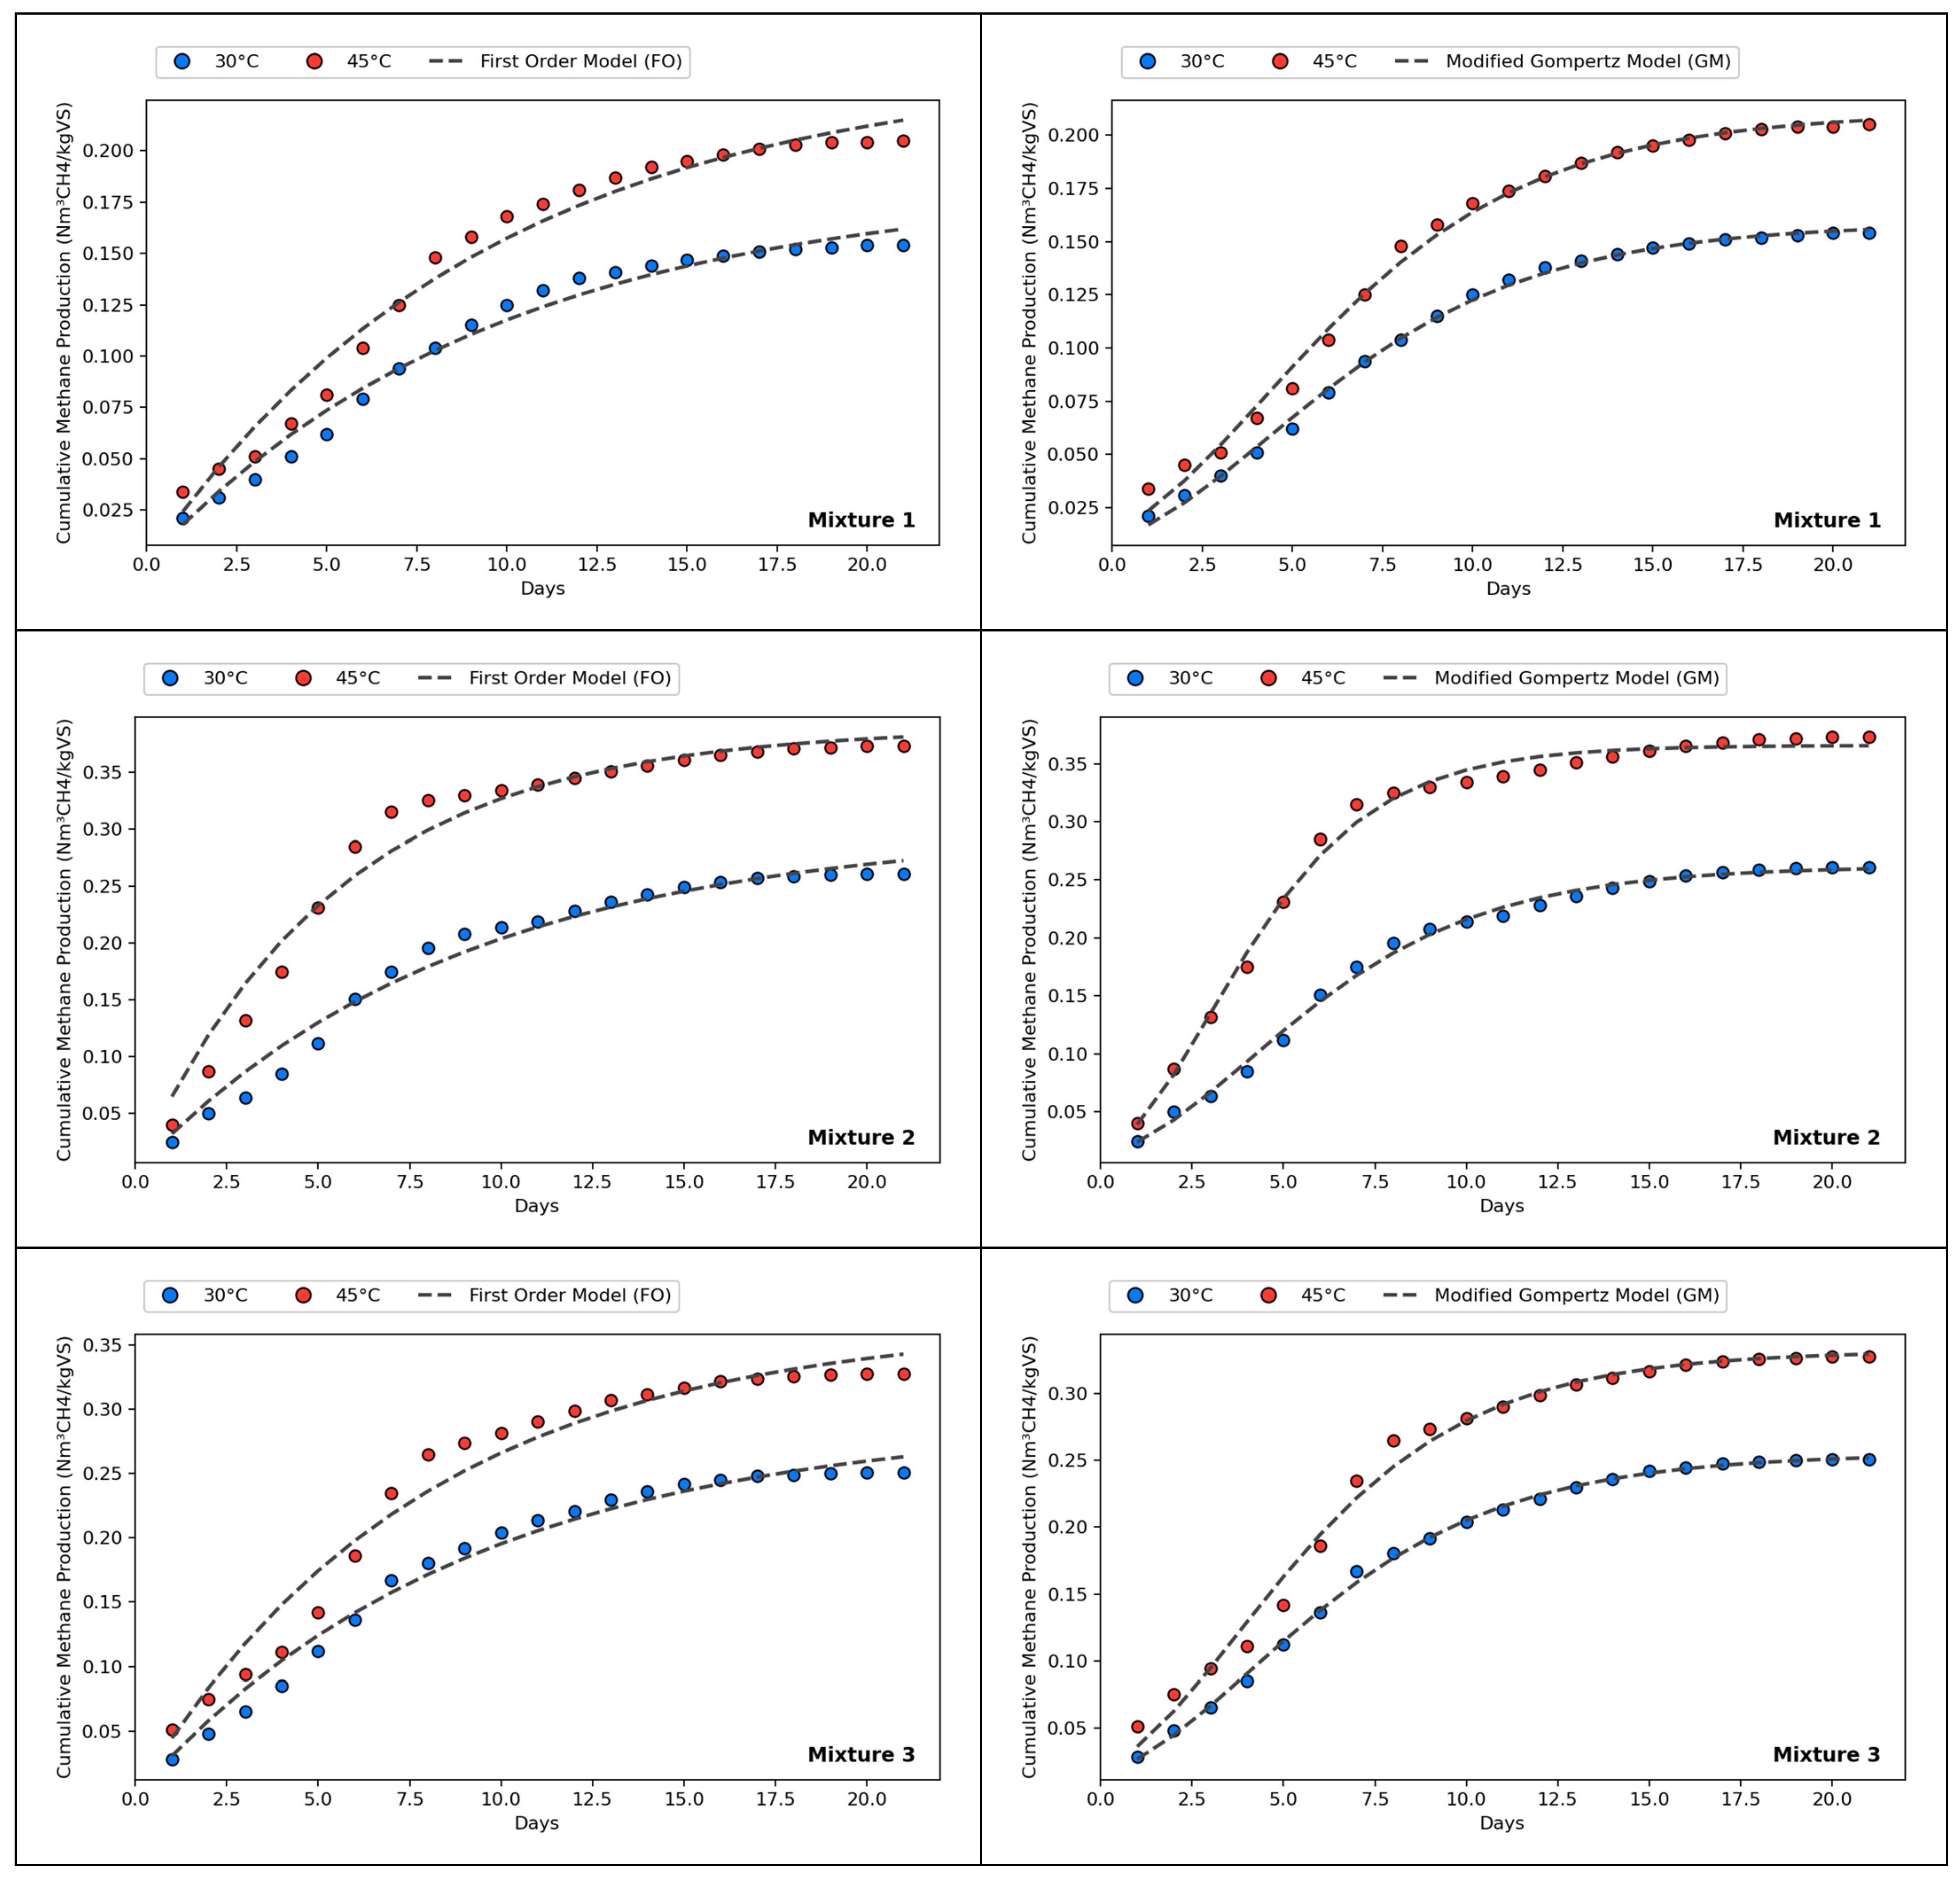
Experimental and predicted biomethane production potentials in both models are also given graphically in Figure 2. As can be seen from the graphs in Figure 2, the Gompertz model fits better for all 3 mixtures compared to the first-order model.
Proportional differences between experimental and predicted biomethane yield of both models at the end of digestion (RT = 21 days) are given in Table 5. The proportional difference ranged from 0.5% to 2% with the modified Gompertz model, whereas it ranged from 2.1% to 5.2% in the first-order model. Meanwhile, the modified Gompertz model for Mixture-2 at 45 °C yielded values lower than those found experimentally, and the model failed to accurately estimate the cumulative daily biogas yield data. This discrepancy is not unexpected, given the slope of the experimental biogas production [35,36]. The GM model’s 2.0% underestimation for Mixture-2 at 45 °C (Table 5) may reflect limitations of sigmoid growth models when substrate degradation kinetics deviate from typical exponential patterns. The high lactose content in whey-rich mixtures may cause biphasic gas production (rapid initial phase from lactose fermentation, slower secondary phase from more recalcitrant macroalgae components), which the single-phase Gompertz function cannot fully capture. Future work should explore multi-phase kinetic models (e.g., double-Gompertz) for heterogeneous substrate mixtures. Raposo et al. [37] reported an error of 10% or less in predicting methane production from sunflower oil cake when using the first-order kinetic model. In their study on swine manure anaerobic digestion, Krishna and Kim [7] noted that the variance between measured and predicted biomethane yield was less than 2% when employing the first-order kinetic model. While the proportional differences obtained when using the first-order model in our study were similar to those in previous studies, the values for the modified Gompertz model were significantly lower compared to the first-order model.

4. Conclusions

This study evaluated co-digestion of cattle manure, macroalgae, and cheese whey at 30 °C and 45 °C using three mixture ratios. Key findings include:
  • Optimal conditions: The highest BMP (0.373 Nm3CH4/kgVS) was achieved with Mixture-2 (30% manure, 20% macroalgae, 50% whey) at 45 °C, representing a 62.5% increase over Mixture-1 at 30 °C. Temperature and mixture composition exerted significant effects on BMP (p < 0.05).
  • Cheese whey contribution: Increasing whey proportion from 20% to 50% substantially enhanced biomethane yields, attributed to its readily fermentable lactose content and favorable buffering capacity.
  • Kinetic modeling: The Modified Gompertz model (R2 = 0.993–0.999, proportional error 0.5–2.0%) outperformed the First-Order model (R2 = 0.968–0.984, error 2.1–5.2%) in predicting cumulative methane production across all experimental conditions. Kinetic rate constants increased with temperature, consistent with enhanced microbial activity at 45 °C.
  • Practical implications: These results support the feasibility of integrated biogas systems utilizing ternary co-digestion of agricultural, aquacultural, and dairy wastes at intermediate mesophilic temperatures (45 °C), offering a balance between methane yield optimization and energy input for heating.
    Future research should:
  • Evaluate continuous reactor operation at pilot scale
  • Investigate multi-phase kinetic models for heterogeneous substrate mixtures
  • Assess long-term process stability and microbial community dynamics
  • Conduct techno-economic analysis of full-scale implementation.

Funding

This research received no external funding.

Institutional Review Board Statement

In accordance with the legislation in force within the Republic of Türkiye, Article 8, paragraph 8(k)(4) of the Regulation on the Working Principles and Procedures of Animal Experiments Ethics Committees, published in the Official Gazette dated 15 February 2014 and numbered 28914, stipulates that the procedure of “collection of feces or bedding samples” does not require approval from an animal experiments ethics committee.

Informed Consent Statement

Not applicable.

Data Availability Statement

The original contributions presented in this study are included in the article. Further inquiries can be directed to the corresponding author.

Conflicts of Interest

The author declares no conflicts of interest.

References

  1. Rahmani, A.M.; Tyagi, V.K.; Ahmed, B.; Kazmi, A.A.; Ojha, C.S.P.; Singh, R. Critical Insights into Anaerobic Co-Digestion of Wheat Straw with Food Waste and Cattle Manure: Synergistic Effects on Biogas Yield and Kinetic Modeling. Environ. Res. 2022, 212, 113382. [Google Scholar] [CrossRef] [PubMed]
  2. Pecchi, M.; Baratieri, M. Coupling Anaerobic Digestion with Gasification, Pyrolysis or Hydrothermal Carbonization: A Review. Renew. Sustain. Energy Rev. 2019, 105, 462–475. [Google Scholar] [CrossRef]
  3. Xia, T.; Huang, H.; Wu, G.; Sun, E.; Jin, X.; Tang, W. The Characteristic Changes of Rice Straw Fibers in Anaerobic Digestion and Its Effect on Rice Straw-Reinforced Composites. Ind. Crops Prod. 2018, 121, 73–79. [Google Scholar] [CrossRef]
  4. Patowary, D.; Baruah, D.C. Effect of Combined Chemical and Thermal Pretreatments on Biogas Production from Lignocellulosic Biomasses. Ind. Crops Prod. 2018, 124, 735–746. [Google Scholar] [CrossRef]
  5. Moreira, A.J.G.; de Sousa, T.A.T.; Franco, D.; Lopes, W.S.; de Castilhos Junior, A.B. Kinetic Modeling and Interrelationship Aspects of Biogas Production from Waste Activated Sludge Solubilized by Enzymatic and Thermal Pre-Treatment. Fuel 2023, 347, 128452. [Google Scholar] [CrossRef]
  6. Gunaseelan, V.N. Regression Models of Ultimate Methane Yields of Fruits and Vegetable Solid Wastes, Sorghum and Napiergrass on Chemical Composition. Bioresour. Technol. 2007, 98, 1270–1277. [Google Scholar] [CrossRef]
  7. Kafle, G.K.; Kim, S.-H. Kinetic Study of the Anaerobic Digestion of Swine Manure at Mesophilic Temperature: A Lab Scale Batch Operation. J. Biosyst. Eng. 2012, 37, 233–244. [Google Scholar] [CrossRef]
  8. Li, P.; Li, W.; Sun, M.; Xu, X.; Zhang, B.; Sun, Y. Evaluation of Biochemical Methane Potential and Kinetics on the Anaerobic Digestion of Vegetable Crop Residues. Energies 2019, 12, 26. [Google Scholar] [CrossRef]
  9. De Gioannis, G.; Muntoni, A.; Cappai, G.; Milia, S. Landfill Gas Generation after Mechanical Biological Treatment of Municipal Solid Waste. Estimation of Gas Generation Rate Constants. Waste Manag. 2009, 29, 1026–1034. [Google Scholar] [CrossRef]
  10. Kumar, S.; Mondal, A.N.; Gaikwad, S.A.; Devotta, S.; Singh, R.N. Qualitative Assessment of Methane Emission Inventory from Municipal Solid Waste Disposal Sites: A Case Study. Atmos. Environ. 2004, 38, 4921–4929. [Google Scholar] [CrossRef]
  11. Donoso-Bravo, A.; Pérez-Elvira, S.I.; Fdz-Polanco, F. Application of Simplified Models for Anaerobic Biodegradability Tests. Evaluation of Pre-Treatment Processes. Chem. Eng. J. 2010, 160, 607–614. [Google Scholar] [CrossRef]
  12. Rani, P.; Bansal, M.; Pathak, V.V. Experimental and Kinetic Studies for Improvement of Biogas Production from KOH Pretreated Wheat Straw. Curr. Res. Green Sustain. Chem. 2022, 5, 100283. [Google Scholar] [CrossRef]
  13. Pardilhó, S.; Pires, J.C.; Boaventura, R.; Almeida, M.; Maia Dias, J. Biogas Production from Residual Marine Macroalgae Biomass: Kinetic Modelling Approach. Bioresour. Technol. 2022, 359, 127473. [Google Scholar] [CrossRef] [PubMed]
  14. Hakimi, M.; Manogaran, M.D.; Shamsuddin, R.; Mohd Johari, S.A.; Abdalla, M.; Hassan, M.; Soehartanto, T. Co-Anaerobic Digestion of Sawdust and Chicken Manure with Plant Herbs: Biogas Generation and Kinetic Study. Heliyon 2023, 9, e17096. [Google Scholar] [CrossRef]
  15. Owamah, H.I.; Izinyon, O.C. Development of Simple-to-Apply Biogas Kinetic Models for the Co-Digestion of Food Waste and Maize Husk. Bioresour. Technol. 2015, 194, 83–90. [Google Scholar] [CrossRef]
  16. Jijai, S.; Siripatana, C. Kinetic Model of Biogas Production from Co-Digestion of Thai Rice Noodle Wastewater (Khanomjeen) with Chicken Manure. Energy Procedia 2017, 138, 386–392. [Google Scholar] [CrossRef]
  17. Ben Khedher, N.; Lattieff, F.A.; Mahdi, J.M.; Ghanim, M.S.; Majdi, H.S.; Jweeg, M.J.; Baazaoui, N. Modeling of Biogas Production and Biodegradability of Date Palm Fruit Wastes with Different Moisture Contents. J. Clean. Prod. 2022, 375, 134103. [Google Scholar] [CrossRef]
  18. Pincam, T.; Liu, Y.-Q.; Short, M.; Guo, B.; Sadhukhan, J.; Bywater, A. Challenging Conventional Temperature Ranges in Anaerobic Digestion: Intermediate (45 °C) as General Optimum with Feedstock-Dependent Performance Differences from Mesophilic (35 °C) and Thermophilic (55 °C) Conditions. Bioresour. Technol. 2026, 441, 133609. [Google Scholar] [CrossRef]
  19. Masebinu, S.O.; Fanoro, O.T.; Insam, H.; Mbohwa, C.; Wagner, A.O.; Markt, R.; Hupfauf, S. Can the Addition of Biochar Improve the Performance of Biogas Digesters Operated at 45 °C? Environ. Eng. Res. 2022, 27, 200648. [Google Scholar] [CrossRef]
  20. Karabulut, A.; Canbolat, Ö. Yem Değerlendirme ve Analiz Yöntemleri; Uludağ Üniversitesi: Bursa, Turkey, 2005. [Google Scholar]
  21. Patowary, D.; West, H.; Clarke, M.; Baruah, D.C. Biogas Production from Surplus Plant Biomass Feedstock: Some Highlights of Indo-UK R&D Initiative. Procedia Environ. Sci. 2016, 35, 785–794. [Google Scholar] [CrossRef]
  22. Bertin, L.; Grilli, S.; Spagni, A.; Fava, F. Innovative Two-Stage Anaerobic Process for Effective Codigestion of Cheese Whey and Cattle Manure. Bioresour. Technol. 2013, 128, 779–783. [Google Scholar] [CrossRef]
  23. Mata-Alvarez, J.; Dosta, J.; Romero-Güiza, M.S.; Fonoll, X.; Peces, M.; Astals, S. A Critical Review on Anaerobic Co-Digestion Achievements between 2010 and 2013. Renew. Sustain. Energy Rev. 2014, 36, 412–427. [Google Scholar] [CrossRef]
  24. Bella, K.; Venkateswara Rao, P. Anaerobic Co-Digestion of Cheese Whey and Septage: Effect of Substrate and Inoculum on Biogas Production. J. Environ. Manag. 2022, 308, 114581. [Google Scholar] [CrossRef]
  25. Kavitha, S.; Ravi, Y.K.; Bhaskar, R.K.; Bajhaiya, A.K.; Rajesh Banu, J. Energy Efficient Pretreatment for Enhanced Conversion of Macroalgal Biomass to Bioenergy: Detailed Energy and Cost Assessment. Energy Convers. Manag. 2025, 329, 119631. [Google Scholar] [CrossRef]
  26. Espesito, C.; Frunzo, L.; Giordano, A.; Pirozzi, F. Anaerobic Co-Digestion of Organic Wastes. Rev. Environ. Sci. Biotechnol. 2012, 11, 325–341. [Google Scholar] [CrossRef]
  27. Merlin, G.; Outin, J.; Boileau, H. Co-Digestion of Extended Aeration Sewage Sludge with Whey, Grease and Septage: Experimental and Modeling Determination. Sustainability 2021, 13, 9199. [Google Scholar] [CrossRef]
  28. Budiyono, I.; Widiasa, N.; Johari, S.a.S. The Kinetic of Biogas Production Rate from Cattle Manure in Batch Mode. Int. J. Chem. Biol. Eng. 2010, 3, 39–44. [Google Scholar]
  29. Lower, L.; Qiu, Y.; Sartor, R.C.; Sagues, W.J.; Cheng, J.J. Kinetic Modeling of Thermophilic Anaerobic Digestion of Lemnaceae for Biogas Production. Bioenergy Res. 2025, 18, 23. [Google Scholar] [CrossRef]
  30. Bella, K.; Pilli, S.; Venkateswara Rao, P.; Tyagi, R.D. Bio-Conversion of Whey Lactose Using Enzymatic Hydrolysis with β-Galactosidase: An Experimental and Kinetic Study. Environ. Technol. 2024, 45, 1234–1247. [Google Scholar] [CrossRef]
  31. Azkarahman, A.R.; Cysneiros, D.; Chatzifragkou, A.; Karatzas, K.A.G. Optimisation of Whey Permeate Anaerobic Digestion at Different Inoculum to Substrate Ratios and Initial PH Values under Mesophilic Conditions. Int. J. Sustain. Energy 2025, 44, 2505444. [Google Scholar] [CrossRef]
  32. Ware, A.; Power, N. Modelling Methane Production Kinetics of Complex Poultry Slaughterhouse Wastes Using Sigmoidal Growth Functions. Renew. Energy 2017, 104, 50–59. [Google Scholar] [CrossRef]
  33. Galal, O.H.; Abdel-Daiem, M.M.; Alharbi, H.S.; Said, N. Mathematical Modeling and Machine Learning Approaches for Biogas Production from Anaerobic Digestion: A Review. Bioresources 2025, 20, 11237–11266. [Google Scholar] [CrossRef]
  34. Etuwe, C.N.; Momoh, Y.O.L.; Iyagba, E.T. Development of Mathematical Models and Application of the Modified Gompertz Model for Designing Batch Biogas Reactors. Waste Biomass Valorization 2016, 7, 543–550. [Google Scholar] [CrossRef]
  35. Sayoud, S.; Derbal, K.; Panico, A.; Pontoni, L.; Fabbricino, M.; Pirozzi, F.; Benalia, A. The Effect of Hydrogen Peroxide on Biogas and Methane Produced from Batch Mesophilic Anaerobic Digestion of Spent Coffee Grounds. Fermentation 2025, 11, 60. [Google Scholar] [CrossRef]
  36. Mohammadianroshanfekr, M.; Pazoki, M.; Pejman, M.B.; Ghasemzadeh, R.; Pazoki, A. Kinetic Modeling and Optimization of Biogas Production from Food Waste and Cow Manure Co-Digestion. Results Eng. 2024, 24, 103477. [Google Scholar] [CrossRef]
  37. Raposo, F.; Borja, R.; Martín, M.A.; Martín, A.; Rubia, M.A.; Rincon, B. Influence of Inoculum–Substrate Ratio on the Anaerobic Digestion of Sunflower Oil Cake in Batch Mode: Process Stability and Kinetic Evaluation. Chem. Eng. J. 2009, 149, 70–77. [Google Scholar] [CrossRef]
Figure 1. Schematic view of the experimental setup.
Fermentation 12 00094 g001
Figure 2. Comparison between experimental and predicted biomethane potentials with two kinetic models.
Fermentation 12 00094 g002
Table 1. Physical and chemical characteristics of feedstocks used for co-digestion experiments.
FeedstocksTotal Solid (TS)
(%)
Volatile Solid (VS)
(% TS)
Ash
(%TS)
Cattle manure23.4780.5119.49
Macroalgae17.2063.8936.11
Cheese whey5.4379.2620.74
Table 2. Mixture ratios used in the experiments.
CodeCattle Manure
(%)
Macroalgae
(%)
Cheese Whey
(%)
Total VS
(DM%)
Total VS
(g)
Mixture-150302013.83.32
Mixture-23020509.42.28
Mixture-320503010.32.47
VS: volatile solid; DM: Dry matter.
Table 3. Experimental biochemical methane potentials (Nm3CH4/kgVS).
FeedstocksDigestion TemperatureAverage
30 °C45 °C
Mixture-10.154 ± 0.011 a0.205 ± 0.009 b0.180 A
Mixture-20.261 ± 0.007 c0.373 ± 0.008 e0.317 C
Mixture-30.251 ± 0.009 c0.328 ± 0.004 d0.290 B
Average0.222 A0.302 B
a, b, c, d and e show statistical differences between them in the same column. A, B and C show statistical differences between averages. Rows shown with different letters indicate significant differences (p < 0.05) according to Duncan’s test.
Table 4. Predicted parameters of first order (FO) and modified Gompertz (GM) models at two digestion temperatures.
TemperatureModelsParametersMixture-1Mixture-2Mixture-3
30 °CFO Y o 0.183 ± 0.0070.300 ± 0.0110.291 ± 0.009
k h 0.103 ± 0.0080.114 ± 0.0100.111 ± 0.008
RMSE0.00130.00250.0020
R 2 0.9820.9780.984
GM Y o 0.159 ± 0.0010.262 ± 0.0030.255 ± 0.002
R m 0.014 ± 0.0000.027 ± 0.0010.024 ± 0.001
λ0.188 ± 0.1360.539 ± 0.1720.303 ± 0.104
RMSE0.00040.00110.0006
R 2 0.9980.9960.999
45 °CFO Y o 0.241 ± 0.0100.389 ± 0.0090.368 ± 0.007
k h 0.106 ± 0.0100.183 ± 0.0140.129 ± 0.009
RMSE0.00200.00380.0037
R 2 0.9760.9690.968
GM Y o 0.211 ± 0.0030.366 ± 0.0030.332 ± 0.005
R m 0.019 ± 0.0010.054 ± 0.0020.035 ± 0.002
λ0.102 ± 0.2240.512 ± 0.1540.298 ± 0.255
RMSE0.00100.00180.0020
R 2 0.9940.9930.990
Values represent mean ± standard error (n = 3). FO: first order; GM: modified Gompertz; RMSE: root mean square error; R2: coefficient of determination; YO: maximum methane production; Rm: maximum methane production rate; λ: lag time; kh: constant kinetic rate.
Table 5. Proportional differences between experimental and predicted gas yield at the end of digestion (RT = 21 days).
Temperature ModelsMixture-1Mixture-2Mixture-3
30 °C Y m e x p 0.1540.2610.251
FO Y m p r e 0.1620.2730.263
Difference (%)5.24.54.7
GM Y m p r e 0.1560.260.252
Difference (%)1.30.50.4
45 °C Y m e x p 0.2050.3730.328
FO Y m p r e 0.2150.3810.343
Difference (%)4.92.14.7
GM Y m p r e 0.2070.3650.33
Difference (%)1.0−2.00.5
FO: first order; GM: modified Gompertz; Y m e x p : experimental methane production; Y m p r e : predicted methane production.
Disclaimer/Publisher’s Note: The statements, opinions and data contained in all publications are solely those of the individual author(s) and contributor(s) and not of MDPI and/or the editor(s). MDPI and/or the editor(s) disclaim responsibility for any injury to people or property resulting from any ideas, methods, instructions or products referred to in the content.