Article

Targeted Mutations in d-ldh and budA Differentially Affect Adaptive Traits and Fermented Milk Quality in Companilactobacillus crustorum MN047


School of Food Science and Engineering, Shaanxi University of Science and Technology, Xi’an 710021, China
*
Author to whom correspondence should be addressed.
Fermentation 2026, 12(10), 460; https://doi.org/10.3390/fermentation12100460
Submission received: 30 August 2026 / Revised: 24 September 2026 / Accepted: 27 September 2026 / Published: 29 September 2026

Abstract

This study examined how targeted mutations in two pyruvate-associated genes, d-ldh and budA, affected adaptive phenotypes and fermented milk quality in Companilactobacillus crustorum MN047. Premature stop codons were introduced into d-ldh and budA by CRISPR-assisted base editing and verified by Sanger sequencing. The resulting nonsense mutants, designated ΔbudA and Δd-ldh, retained growth comparable to the wild-type strain (wt) but showed contrasting phenotypes. At 24 h, auto-aggregation was 4.44-fold the wt value in Δd-ldh and 0.71-fold the wt value in ΔbudA, whereas ΔbudA showed lower aggregation and stress survival. Viable counts remained 7.2–7.7 log10 CFU/mL, although titratable acidity and textural properties differed among fermented milk groups. ΔbudA produced higher firmness and consistency, whereas Δd-ldh showed lower values for both parameters. Electronic nose PCA clearly separated the three groups, while GC-MS identified strain-dependent differences in selected relative volatile compounds. These findings show that the two pyruvate-associated mutations affected bacterial robustness and fermented milk quality in distinct ways.

1. Introduction

Fermented milk is widely consumed, and its quality is strongly influenced by the metabolic activity of lactic acid bacteria (LAB). During fermentation, acidification reduces electrostatic repulsion between casein particles and promotes the formation of an acid-induced protein network, thereby affecting texture, viscosity, water-holding capacity, and physical stability [1,2,3]. Appearance, rheological behavior, viable cell counts, acidity, and volatile compounds together define important technological and sensory attributes of fermented milk. Volatile composition additionally depends on the metabolic capabilities of the culture, the milk matrix, and processing conditions [4]. Linking bacterial metabolism with product quality can guide the selection and improvement of food-derived LAB cultures.
Central carbon metabolism is a major determinant of LAB fermentation phenotypes. Pyruvate is a metabolic branch point that can be converted into lactate, acetoin, diacetyl, acetate, ethanol, acetaldehyde, and other fermentation-related metabolites [5,6]. Carbon partitioning among these routes depends on enzyme availability, environmental conditions, and intracellular redox balance [7,8]. Lactate dehydrogenase (LDH) reduces pyruvate to lactate while oxidizing NADH [9], whereas α-acetolactate decarboxylase converts α-acetolactate to acetoin in the C4 branch [10]. Modification of ldh genes can alter acidification and fermented milk metabolite profiles [11], and inactivation of α-acetolactate decarboxylase in Lactococcus lactis changed the distribution of α-acetolactate, acetoin, and diacetyl during milk fermentation [12]. These studies show that changes in individual pyruvate branches can affect acidification and fermentation-related metabolites. Recent strain-level evidence further showed that diacetyl formation in fermented dairy systems is associated with coordinated variation in α-acetolactate pathway enzymes, NADH oxidase, lactate dehydrogenase, and competing pyruvate-consuming routes, emphasizing the network-level control of pyruvate-derived flavor formation [13]. However, how mutations in d-ldh and budA influence bacterial adaptation, milk texture, and volatile profiles within the same genetic background remains unclear.
Companilactobacillus crustorum is a food-associated LAB species with potential as a starter or adjunct culture for fermented foods [14]. Its technological utility depends on both metabolic activity during fermentation and robustness under adverse conditions. Auto-aggregation and survival under acid or bile salt exposure are commonly used as in vitro indicators of cell surface behavior and stress tolerance [15,16]. Genome-editing methods enable direct testing of relationships between specific genes and technological traits in LAB [17]. A CRISPR/Cas9-based editing platform has also been established for C. crustorum, permitting targeted gene inactivation and functional analysis in this species [18]. Nevertheless, the respective contributions of d-ldh and budA to the adaptive and milk fermentation phenotypes of C. crustorum MN047 have not been defined.
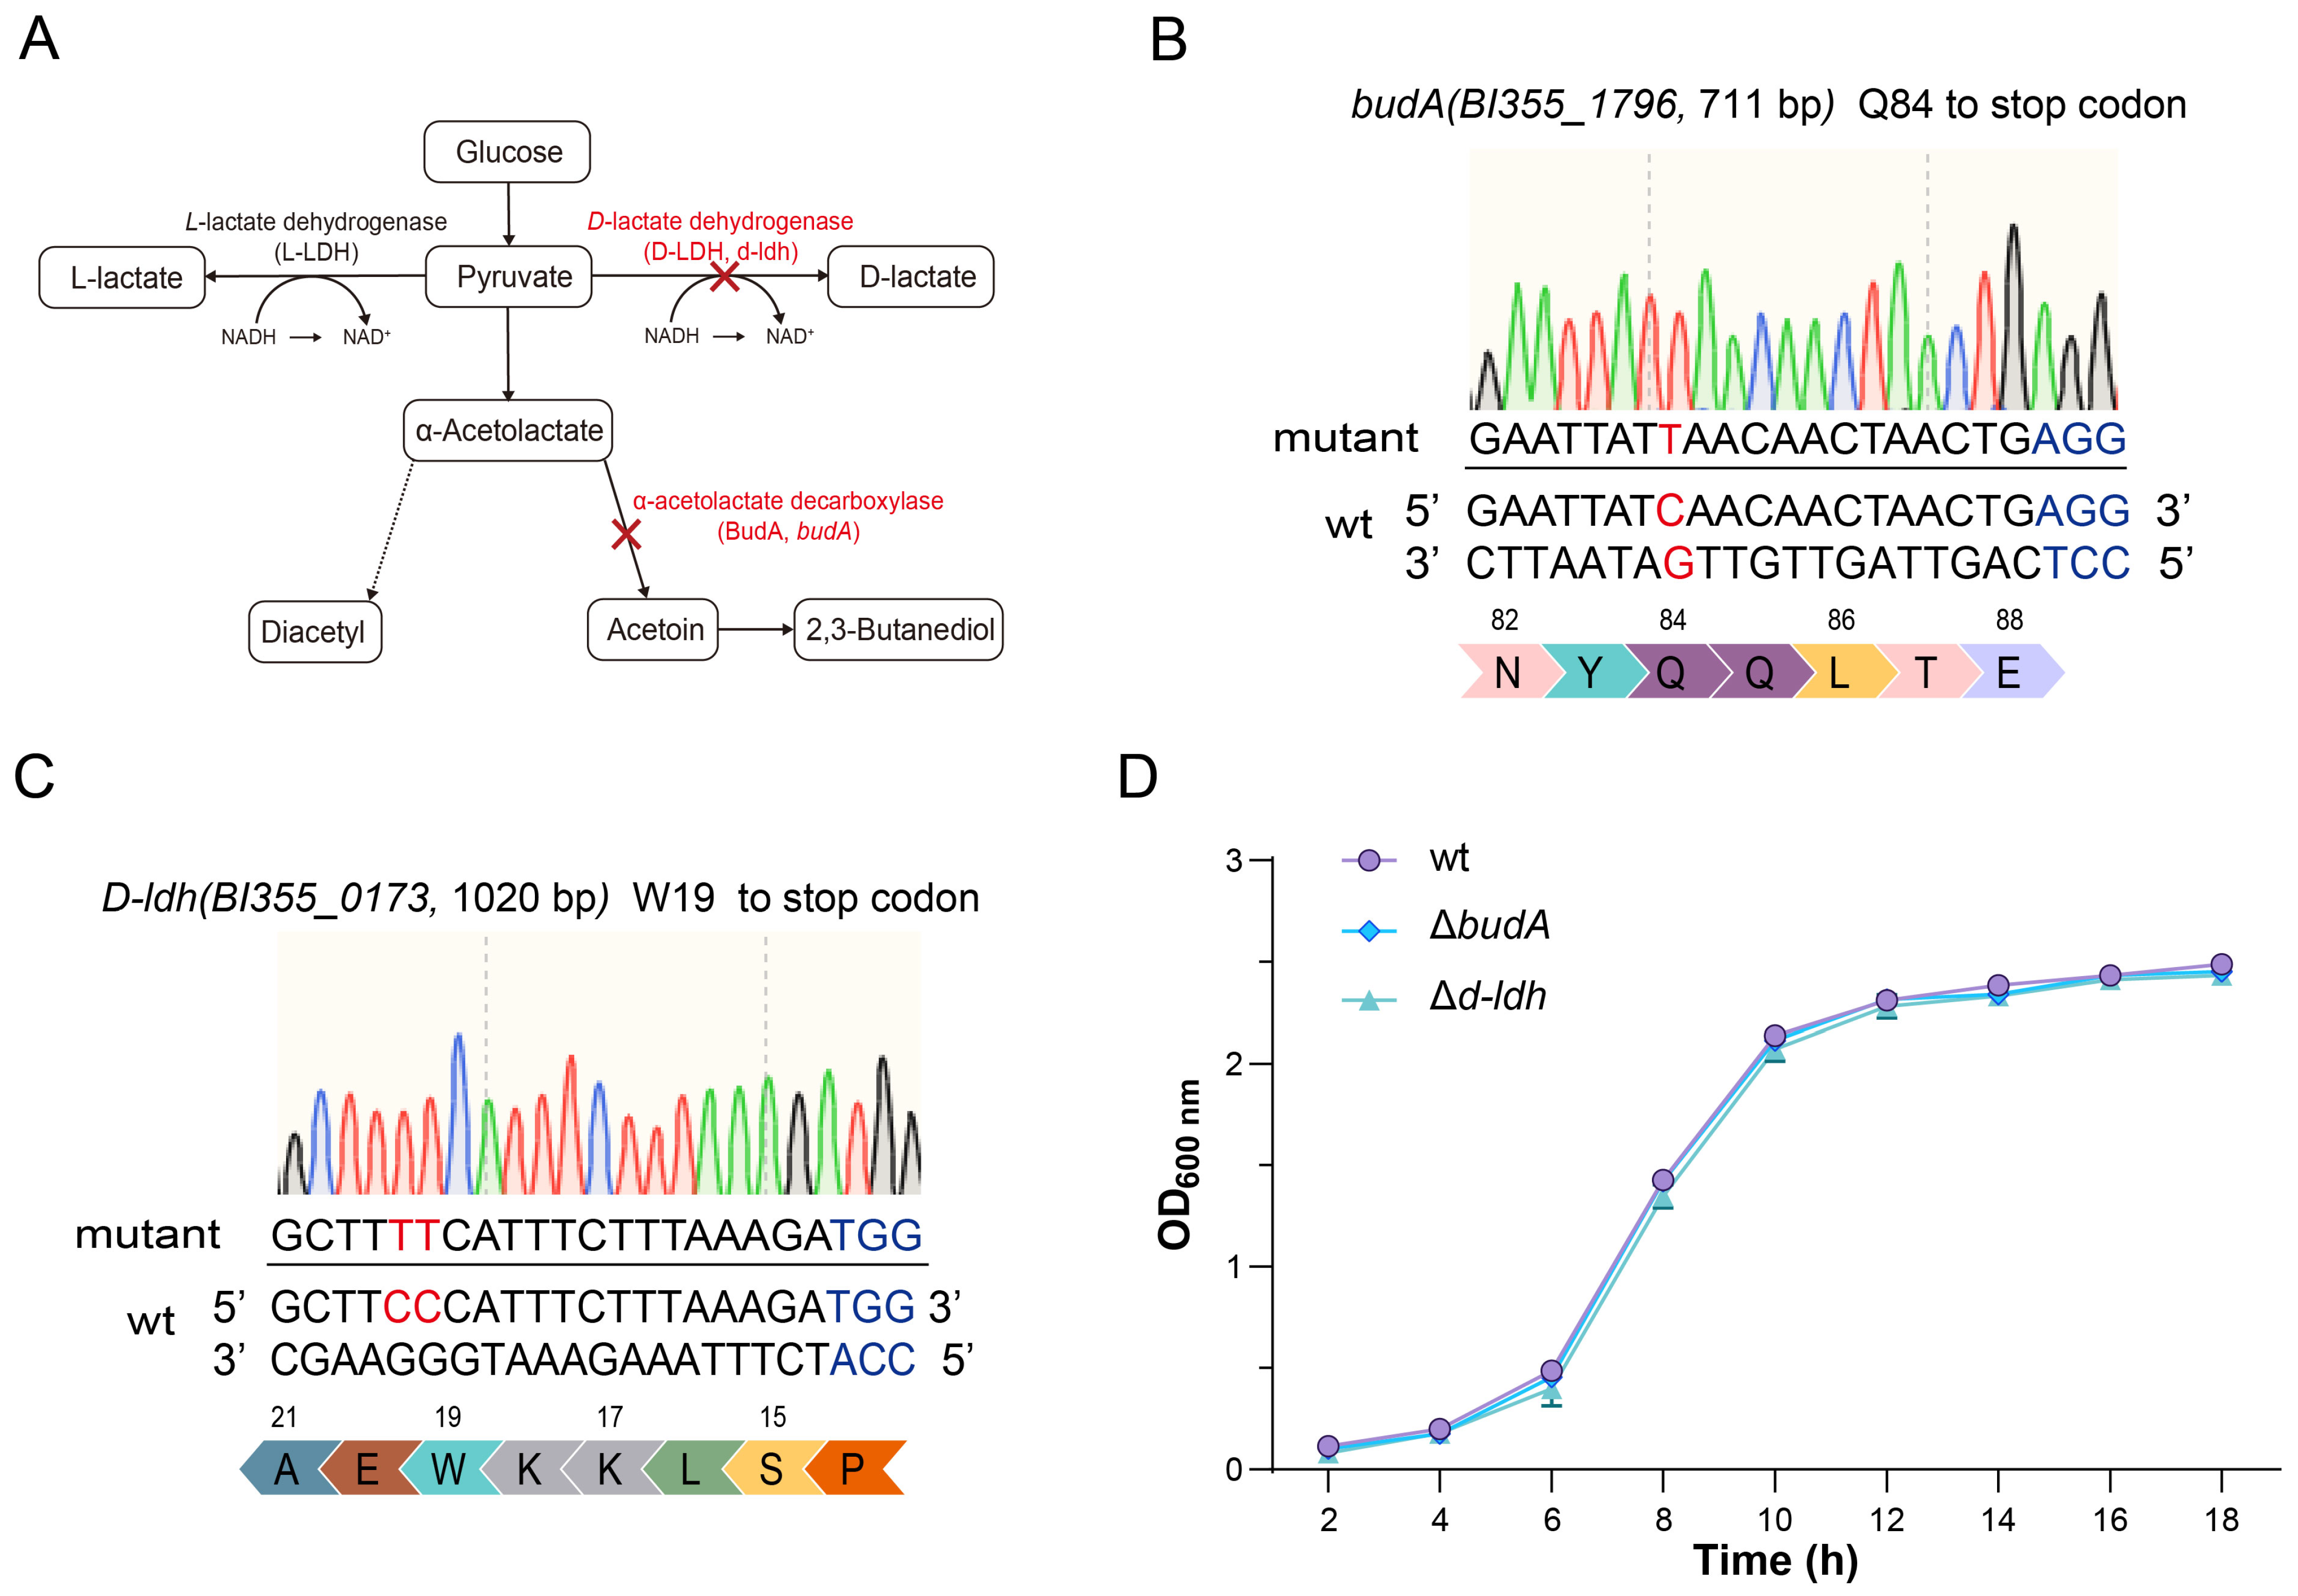
In this study, d-ldh and budA were selected for targeted mutation in C. crustorum MN047. D-lactate dehydrogenase catalyzes the NADH-dependent reduction of pyruvate to D-lactate [19], whereas α-acetolactate decarboxylase, encoded by budA, catalyzes the conversion of α-acetolactate to acetoin in the C4 branch [10,12] (Figure 1A). We hypothesized that disruption of these two branches would alter pyruvate-associated metabolism in different ways, leading to distinct effects on bacterial stress adaptation and fermented milk performance. Changes in the d-ldh-associated branch were expected to affect lactate-related acidification, whereas budA disruption was expected to influence the α-acetolactate-derived aroma branch. The two nonsense mutants were compared with the wild-type strain (wt) for growth, auto-aggregation, acid tolerance, bile salt tolerance, and milk-fermentation performance. The fermented milk was further evaluated for titratable acidity, viable counts, color, back-extrusion parameters, electronic nose responses, and GC-MS-based relative volatile profiles. This work aimed to compare the effects of d-ldh and budA mutations on strain-level phenotypes and fermented milk quality in C. crustorum MN047.

2. Materials and Methods

2.1. Bacterial Strains and Culture Conditions

C. crustorum MN047 and its derivative strains were routinely propagated in de Man, Rogosa, and Sharpe (MRS) broth at 37 °C. The wild-type strain is referred to as wt throughout this study. For cultivation on solid medium, MRS broth was supplemented with 1.5% (w/v) agar. When required, selective antibiotics were added for plasmid maintenance or mutant screening according to the resistance markers carried by the editing constructs.

2.2. Construction and Verification of Mutant Strains

Premature stop codons were introduced into d-ldh or budA using the CRISPR-assisted base-editing platform established for C. crustorum, with modifications [18]. Briefly, gene-specific single-guide RNAs (sgRNAs) targeting the d-ldh or budA locus were designed adjacent to suitable protospacer-adjacent motif sequences and cloned into the corresponding editing plasmids. Electrocompetent C. crustorum cells were prepared using a previously established protocol [20]. Editing plasmids were introduced by electroporation at 11.25 kV/cm, 25 μF, and 200 Ω. Cells were recovered at 30 °C in MRS broth containing 0.5 M sucrose, 20 mM MgCl2, and 2 mM CaCl2 and then plated on selective MRS agar. Candidate colonies were screened by colony PCR, and genomic regions spanning the target sites were amplified using verification primers and analyzed by Sanger sequencing. The verified strains carried premature stop codons at Gln84 in budA and Trp19 in d-ldh. For consistency with the strain labels used throughout this study, these nonsense mutants are hereafter designated ΔbudA and Δd-ldh, respectively. These designations refer to premature stop-codon mutants and do not denote complete deletion of the corresponding genes. Confirmed mutants were serially passaged in antibiotic-free MRS broth to cure the editing plasmids. Plasmid loss was verified by the absence of growth on selective MRS agar. The plasmids and primers used for mutant construction are listed in Table S1.

2.3. Bacterial Growth Assay

Growth was monitored using a previously reported procedure with modifications [21]. The wt, ΔbudA, and Δd-ldh strains were activated in MRS broth at 37 °C for 18 h. Activated cultures were inoculated into fresh MRS broth at 1% (v/v), and the starting OD600 was adjusted to 0.02. Cultures were incubated at 37 °C, and OD600 was measured every 2 h for 18 h (0, 2, 4, 6, 8, 10, 12, 14, 16, and 18 h). At least three independently prepared cultures were analyzed for each strain.

2.4. Adaptive Phenotypes

2.4.1. Auto-Aggregation

Auto-aggregation was measured using published procedures with modifications [15,21]. Overnight cultures were harvested at 4000× g for 8 min at 4 °C, washed twice with phosphate-buffered saline (PBS; pH 7.4), and resuspended in PBS to an OD600 of 0.25 ± 0.05. The suspensions were incubated without agitation at 37 °C. At 0, 4, 12, 16, 20, and 24 h, aliquots were carefully withdrawn from the upper phase without disturbing settled cells, and OD600 was measured. Auto-aggregation was calculated as (1 − At/A0) × 100, where A0 is the initial absorbance and At is the absorbance of the upper phase at time t.

2.4.2. Acid Tolerance

Acid tolerance was evaluated by viable counts before and after exposure to acidified MRS broth, using a published procedure with modifications [22]. Logarithmic-phase cultures were harvested at 6000× g for 10 min at 4 °C, washed twice with sterile PBS, and resuspended to the original volume in MRS broth adjusted to pH 2.0 or 3.0. Cell suspensions were incubated at 37 °C for 3 h. Samples collected before and after acid exposure were serially diluted and plated on MRS agar for viable enumeration. Survival was calculated as Nt/N0 × 100, where N0 and Nt are the viable counts before and after acid exposure, respectively.

2.4.3. Bile Salt Tolerance

Bile salt tolerance was evaluated from bacterial survival after short-term exposure to bovine bile salts, using published procedures with modifications [22,23]. Logarithmic-phase cells were harvested at 6000× g for 10 min at 4 °C, washed twice with sterile PBS, and resuspended in MRS broth containing 0.3% or 0.6% (w/v) bovine bile salts. After incubation at 37 °C for 3 h, the suspensions were serially diluted and plated on MRS agar. Survival was calculated relative to the viable count measured immediately before bile salt exposure.

2.5. Preparation of Fermented Milk

Fermented milk was prepared using published procedures with modifications [24,25]. C. crustorum MN047 and its derivative strains were subcultured twice in MRS broth at 37 °C for 18 h. Following cultivation, cells were harvested by centrifugation and washed three times with sterile saline (0.9% NaCl). The washed cell pellets were then resuspended and inoculated into milk to achieve a final concentration of 5 × 10⁶ CFU/mL. Commercial ultra-high-temperature-treated whole milk (Yili Co., Ltd., Hohhot, China; composition: 4.8 g/100 mL lactose, 3.8 g/100 mL fat, and 3.0 g/100 mL protein) served as the fermentation substrate. Sterile sucrose was added aseptically to a final concentration of 5% (w/v). Each cell suspension was inoculated into 100 mL of milk at 1% (v/v), mixed, and incubated at 38 °C until the pH reached 4.55–4.65. Samples were rapidly cooled to 4 °C to limit further acidification and stored at 4 °C until analysis.

2.6. Physicochemical Analysis

2.6.1. Titratable Acidity

Titratable acidity was determined by using the phenolphthalein endpoint method [25].

2.6.2. Viable Counts

Viable bacteria in fermented milk were enumerated by plate counting. Samples were homogenized, serially diluted with sterile saline, and plated on MRS agar. After incubation at 37 °C for 48 h, colonies were counted on plates containing 30–300 colonies.

2.6.3. Color Measurement

The color of fermented milk was measured using a Ci7600 colorimeter (X-Rite, Grand Rapids, MI, USA) based on the CIE L*, a*, and b* system [26,27]. Lightness (L*), the green/red component (a*), the yellow/blue component (b*), and the CMC color difference (ΔEcmc) were recorded.

2.7. Textural Properties Analysis

Instrumental texture was evaluated using a TA.XTplus/50 texture analyzer (Stable Micro Systems, Godalming, UK) equipped with a back-extrusion rig and a 35 mm disk probe [28]. Samples stored at 4 °C were equilibrated at room temperature for 30 min before analysis. Measurements were performed in compression mode using the following settings: pre-test speed, 1.0 mm/s; test speed, 1.0 mm/s; post-test speed, 1.0 mm/s; penetration distance, 30 mm; and trigger force, 5 g. Firmness, consistency, cohesiveness, and index of viscosity were calculated using the instrument software.

2.8. Electronic Nose Analysis

Volatile fingerprints were measured using a PEN3 portable electronic nose equipped with ten metal-oxide-semiconductor sensors (AIRSENSE Analytics GmbH, Schwerin, Germany), following published dairy applications with modifications [29,30]. Fermented milk (5.0 g) was placed in a sealed 20 mL headspace vial and equilibrated at 40 °C for 30 min. The instrument was controlled using WinMuster version 1.6.2 (AIRSENSE Analytics GmbH, Schwerin, Germany) with the following settings: sampling interval, 1.0 s; pre-sampling time, 5.0 s; zero-point trim time, 10.0 s; measurement time, 40.0 s; flushing time, 40.0 s; chamber flow, 400 mL/min; and initial injection flow, 400 mL/min. Conductance ratios (G/G0) were recorded for sensors W1C, W5S, W3C, W6S, W5C, W1S, W1W, W2S, W2W, and W3S. Their general sensitivity characteristics are listed in Table S2 according to the manufacturer’s specifications. The G/G0 response recorded at the end of the 40 s measurement period was used for multivariate analysis. Responses from the ten sensors and five independent biological replicates per strain were assembled into a sample-by-sensor matrix. PCA was performed using the built-in multivariate analysis module of WinMuster software. The PCA scores and explained-variance values were exported and replotted in R version 4.5.3 for graphical presentation.

2.9. GC-MS Analysis of Volatile Compounds

Volatile compounds were analyzed using a GCMS-QP2010 Ultra gas chromatography–mass spectrometry system (Shimadzu, Kyoto, Japan). Headspace solid-phase microextraction (HS-SPME) was performed using published dairy product methods as a basis, with modifications [24,31]. Fermented milk (5.0 g) was placed in a 20 mL headspace vial and equilibrated at 50 °C for 30 min. A 50/30 μm DVB/CAR/PDMS fiber was exposed to the headspace for 30 min and then desorbed in the injector at 250 °C for 5 min. Volatiles were separated on a DB-5MS capillary column (30 m × 0.25 mm × 0.25 μm).
Samples were introduced in splitless mode, with helium as the carrier gas at 1.00 mL/min. The oven was held at 40 °C for 3 min, increased to 120 °C at 4 °C/min, then increased to 240 °C at 6 °C/min and held for 12 min. The ion source and interface temperatures were 230 °C, and mass spectra were acquired in full-scan mode over m/z 35–500. A C7–C30 n-alkane series was analyzed under the same chromatographic conditions to calculate retention indices. Compounds were tentatively identified by matching spectra against the NIST library (match score >750) and comparing calculated retention indices with published values. Detected peaks were manually reviewed before group comparison. Compounds with poor spectral or retention-index agreement, inconsistent retention behavior, obvious siloxane/TMS-related background signals, or chemically implausible library assignments were excluded. Fourteen fermentation-related volatiles were retained based on reliable tentative identification, reproducible detection across biological samples, and relevance to major volatile classes reported in fermented milk. Compound selection was performed independently of between-group statistical significance. Relative peak areas (%) were calculated by dividing the peak area of each compound by the summed areas of all integrated volatile peaks.

2.10. Statistical Analysis

Unless otherwise stated, data are presented as the mean ± standard deviation (SD) from at least three independent experiments. Statistical analyses and data visualization were performed using GraphPad Prism 9.0 (GraphPad Software, San Diego, CA, USA) and R version 4.5.3. Differences among wt, ΔbudA, and Δd-ldh under a single condition were assessed by one-way analysis of variance (ANOVA), followed by Dunnett’s multiple-comparisons test with wt as the reference. Assays containing both strain and time or treatment factors were analyzed by two-way ANOVA, followed by Dunnett’s multiple-comparisons test comparing each mutant with wt at the corresponding time point or treatment level. Statistical significance is denoted as * p < 0.05, ** p < 0.01, and *** p < 0.001.

3. Results

3.1. Construction and Growth Characteristics of d-ldh and budA Nonsense Mutants

To examine the roles of budA and d-ldh in C. crustorum MN047, targeted nonsense mutations were introduced into the corresponding chromosomal loci using a CRISPR-assisted base editing system. Sanger sequencing confirmed premature stop codons in both target genes. In budA (BI355_1796, 711 bp), a single-nucleotide substitution introduced a premature stop codon at Gln84, resulting in the ΔbudA mutant (Figure 1B). Similarly, in d-ldh (BI355_0173, 1020 bp), the codon encoding Trp19 was converted to a premature stop codon, generating the Δd-ldh mutant (Figure 1C).
The growth of wt, ΔbudA, and Δd-ldh was compared in MRS broth. All three strains showed similar growth profiles during 18 h of cultivation (Figure 1D). After a short initial lag phase, the three strains entered exponential growth and showed a rapid increase in OD600 between approximately 6 and 10 h. Growth subsequently slowed, and all strains approached the stationary phase after roughly 10 to 12 h. Their final OD600 values were similar under the tested MRS conditions, with no evident reduction in growth observed for either mutant compared with wt.

3.2. d-ldh and budA Mutations Produced Contrasting Auto-Aggregation and Stress Tolerance Phenotypes

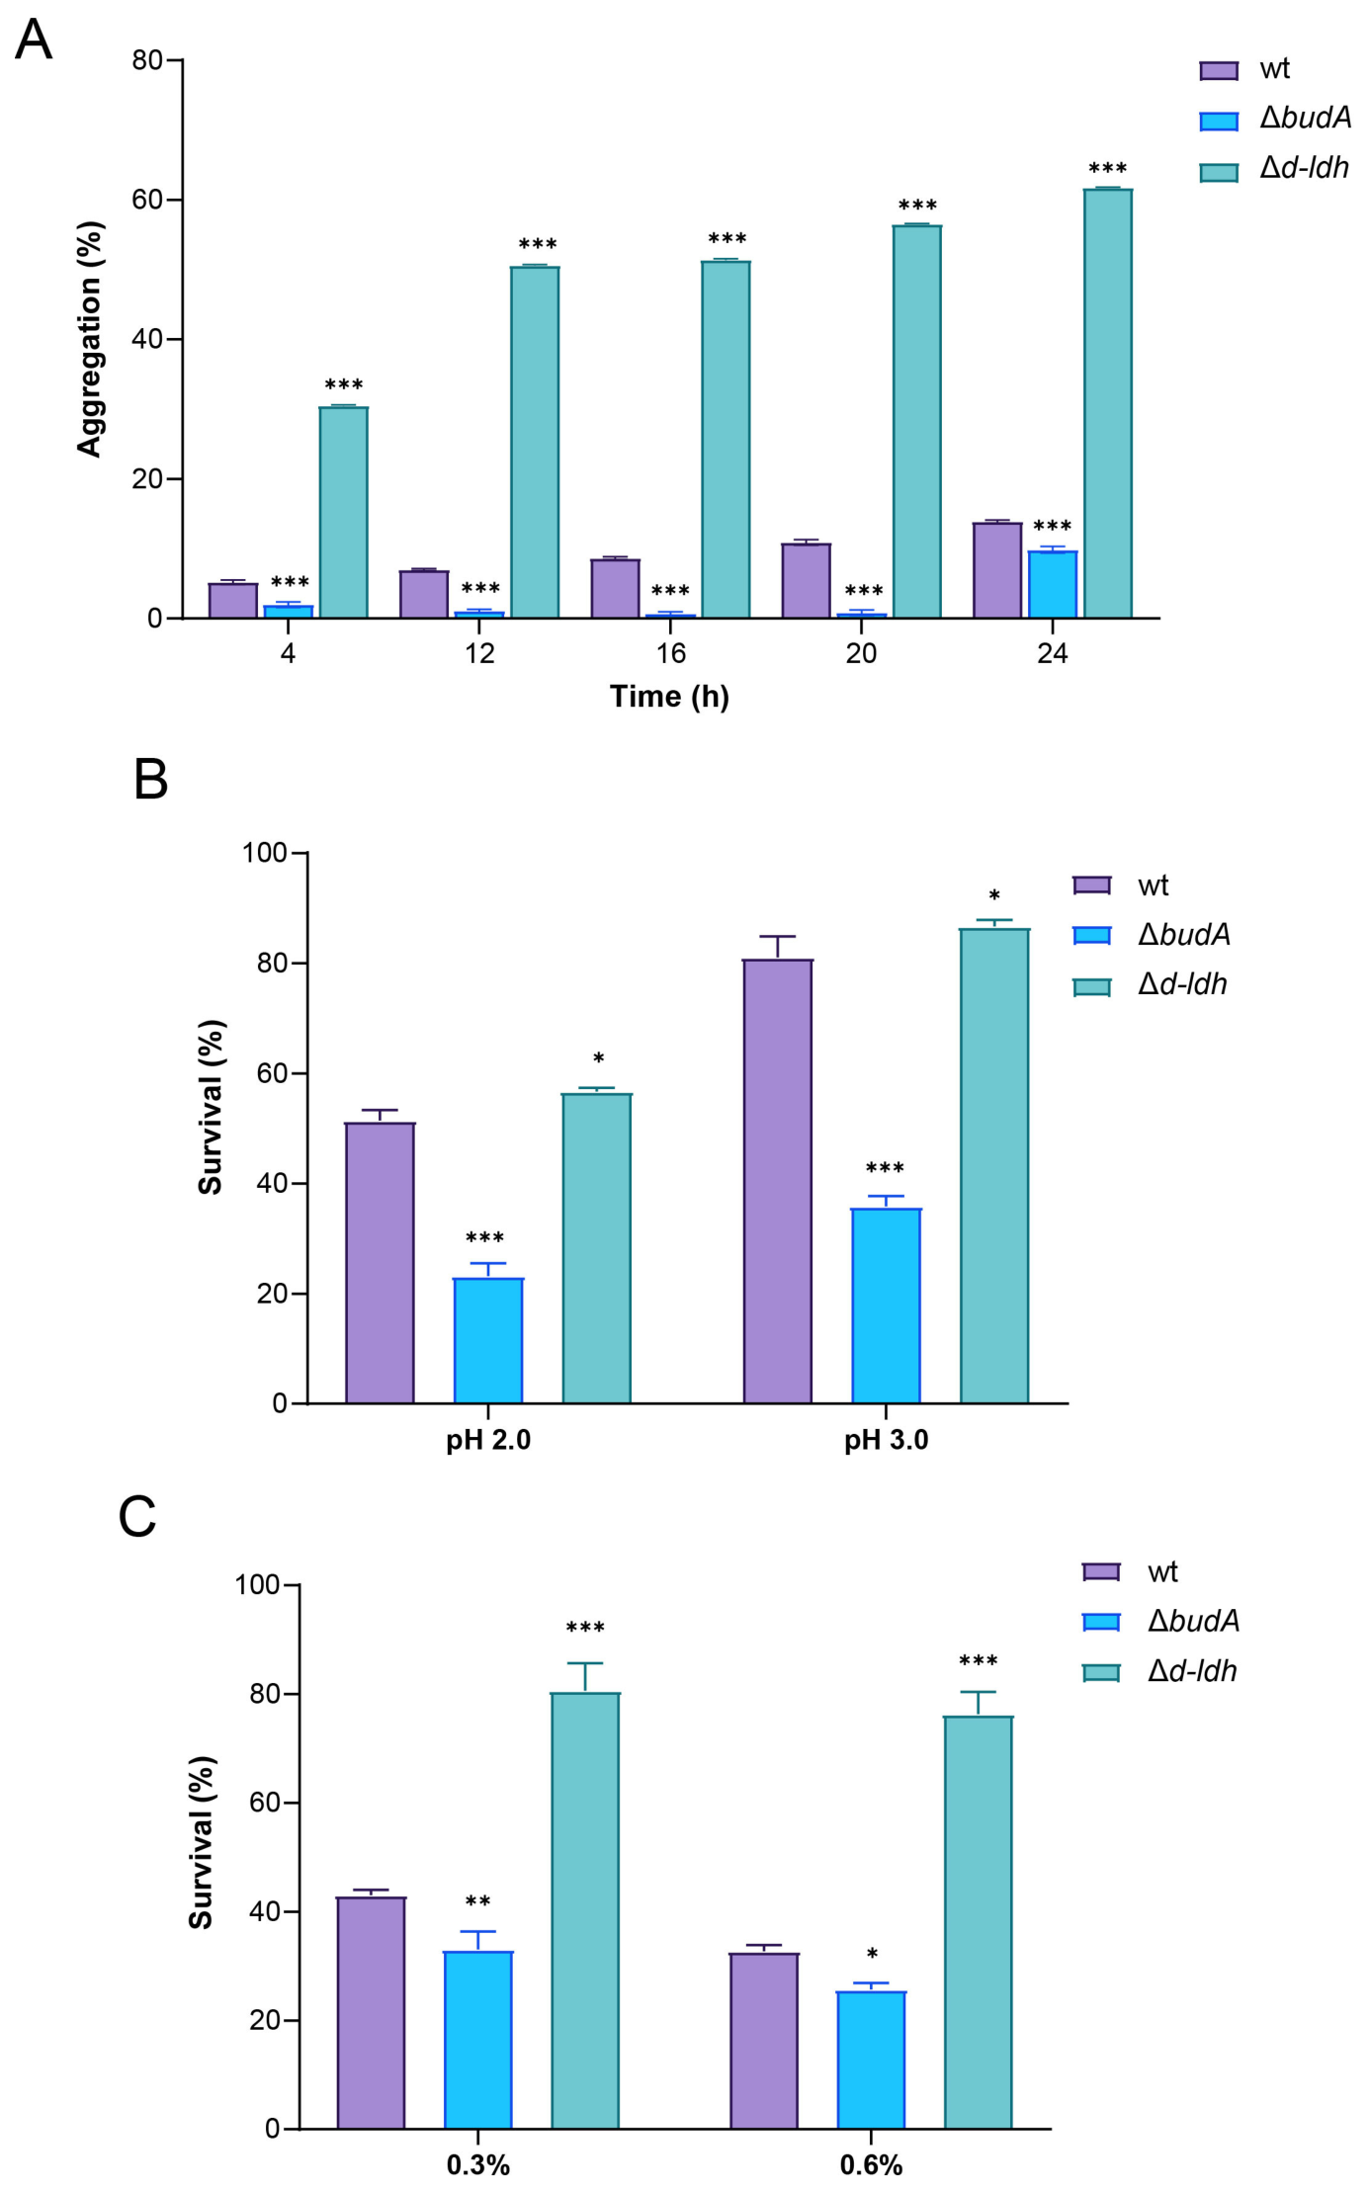
Auto-aggregation of wt, ΔbudA, and Δd-ldh was compared during static incubation (Figure 2A). The value for wt increased from 5.2% at 4 h to 13.9% at 24 h. ΔbudA showed significantly lower auto-aggregation than wt at every time point (p < 0.001), remaining close to 1% through 20 h before reaching 9.8% at 24 h. By contrast, Δd-ldh showed significantly higher auto-aggregation throughout incubation (p < 0.001), increasing from 30.5% at 4 h to 61.7% at 24 h. The two mutants therefore displayed divergent aggregation profiles across the incubation period.
Survival under acidic conditions was evaluated at pH 2.0 and 3.0 (Figure 2B). Values were numerically higher at pH 3.0 than at pH 2.0 for all strains. At pH 2.0, wt showed 51.4% survival, while ΔbudA and Δd-ldh showed 23.2% (p < 0.001) and 56.7% (p < 0.05), respectively. At pH 3.0, survival increased to 81.1% for wt and 86.7% for Δd-ldh (p < 0.05), whereas ΔbudA remained lower at 35.8% (p < 0.001). The direction of the strain differences was consistent at both tested pH values.
Strain-dependent differences were also observed after exposure to 0.3% and 0.6% bovine bile salts (Figure 2C). At 0.3%, survival was 43.1% for wt and 33.1% for ΔbudA (p < 0.01), whereas Δd-ldh retained 80.7% viability (p < 0.001). At 0.6%, survival declined to 32.8% for wt and 25.7% for ΔbudA (p < 0.05), while Δd-ldh retained 76.3% viability (p < 0.001). Thus, Δd-ldh showed substantially greater bile salt tolerance than wt under both conditions, whereas ΔbudA was more susceptible.

3.3. Effects of budA and d-ldh Mutations on Acidity, Viable Counts, and Color Parameters of Fermented Milk

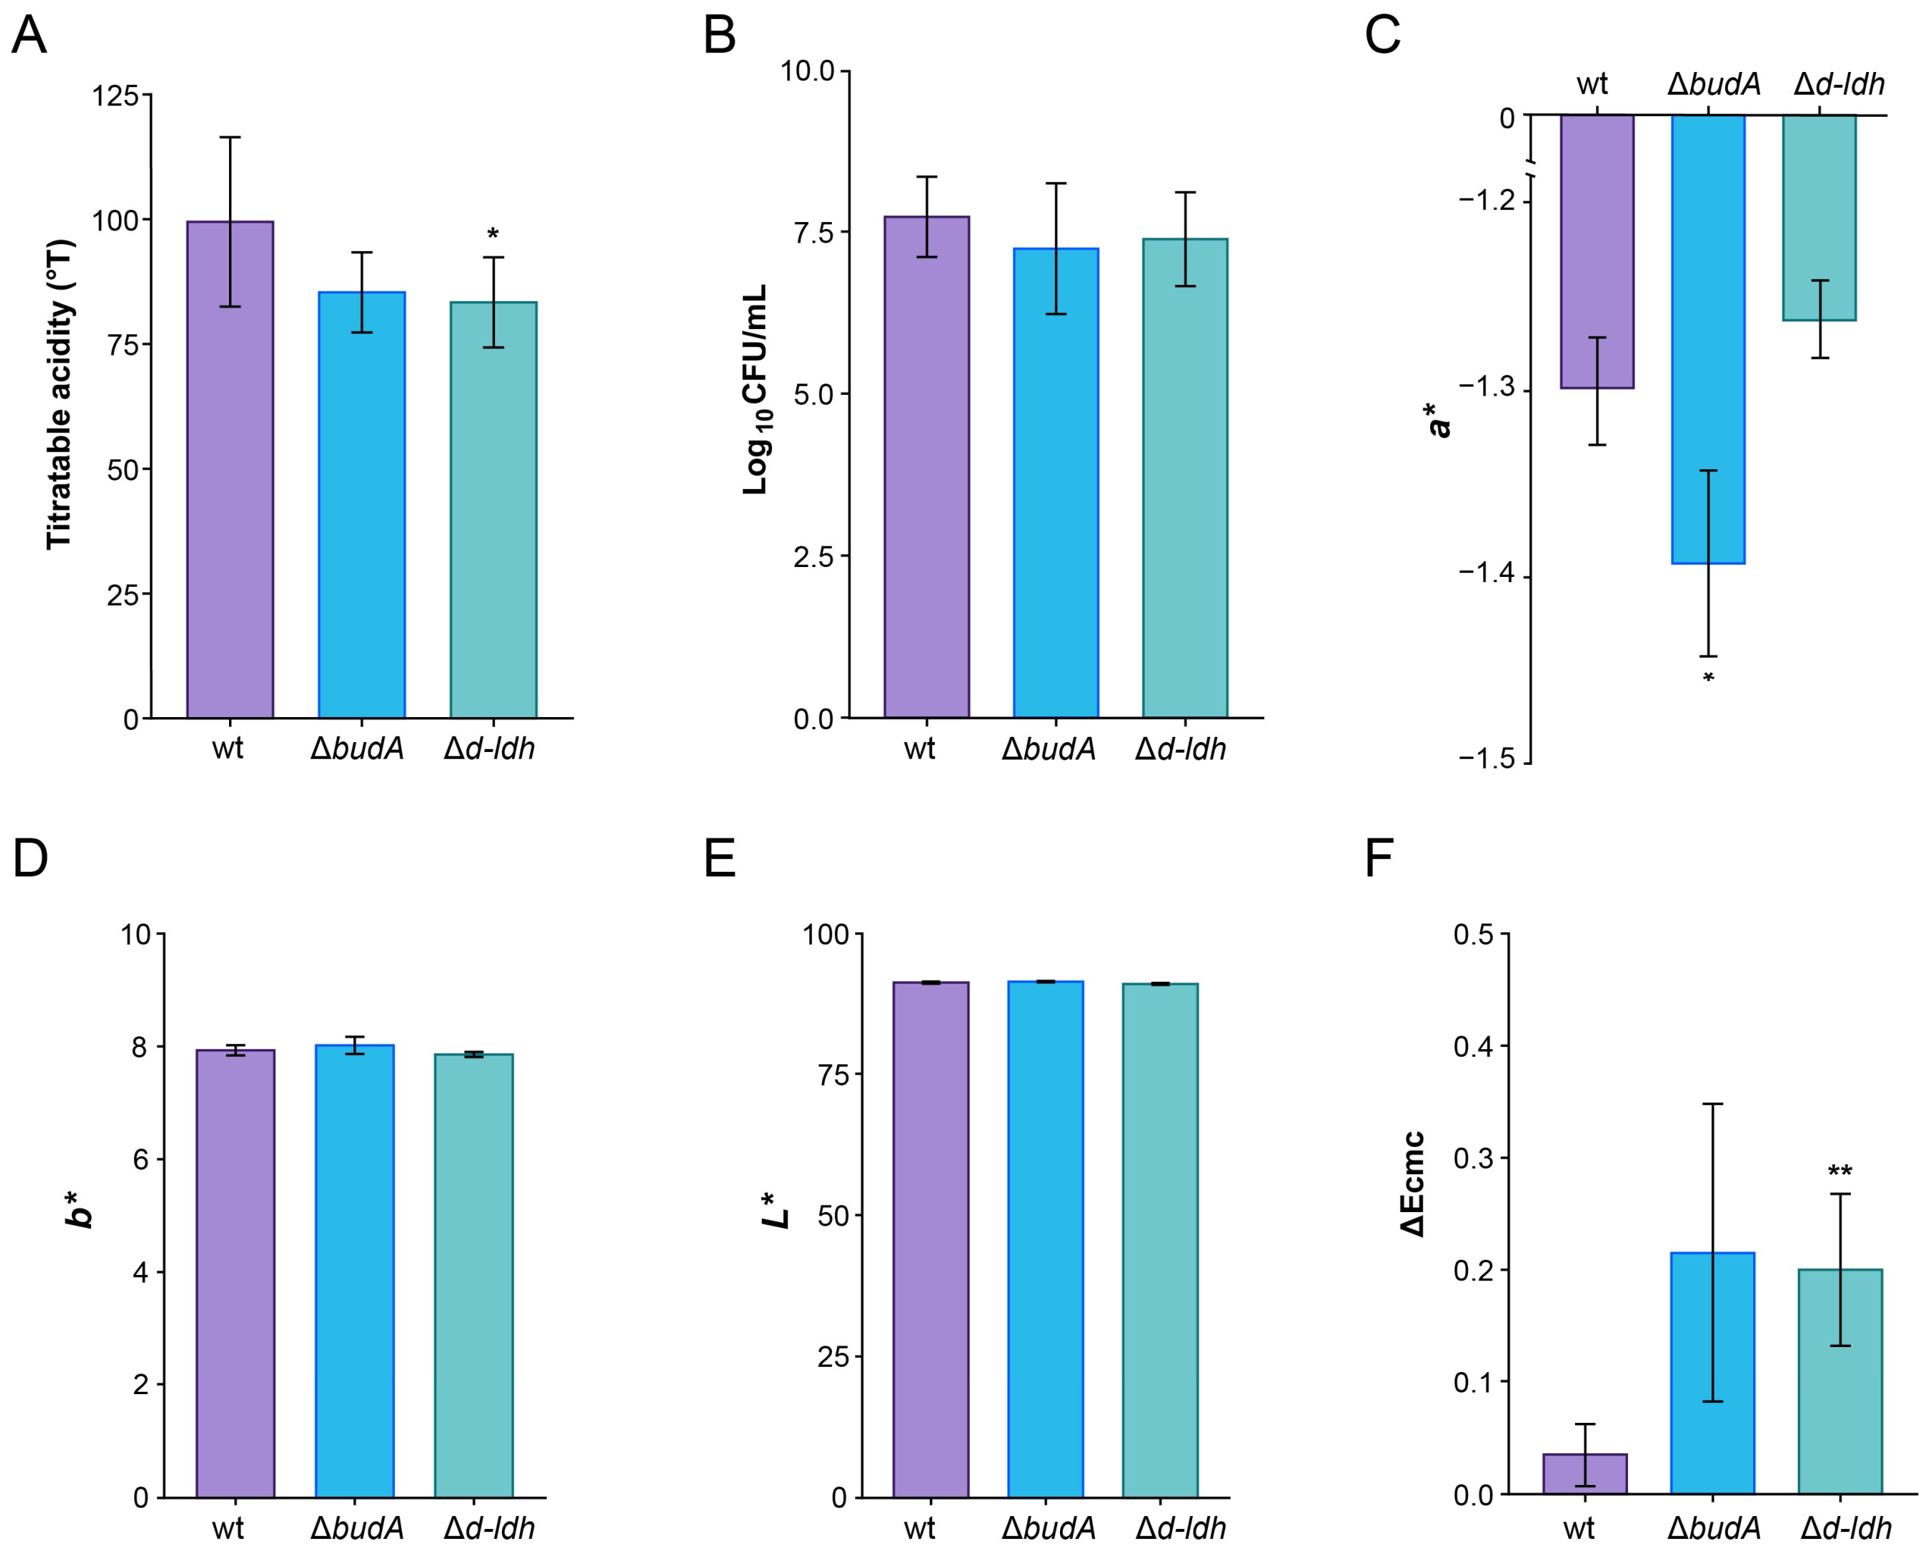
Titratable acidity differed among fermented milk samples prepared with wt, ΔbudA, and Δd-ldh (Figure 3A). Fermented milk prepared with wt had a titratable acidity of 99.4 °T. The value was numerically lower for ΔbudA-fermented milk, although the difference from wt did not reach statistical significance (p = 0.059), and significantly lower for Δd-ldh-fermented milk than for wt-fermented milk (p < 0.05). Viable counts ranged from 7.2 to 7.7 log10 CFU/mL, with no significant differences among the three groups (Figure 3B). Color varied mainly in a* and ΔEcmc, whereas L* and b* were similar among groups (Figure 3C–F). The a* value was significantly lower for ΔbudA than for wt (p < 0.05), while Δd-ldh did not differ significantly from wt (Figure 3C). No significant differences were detected in b* or L* (Figure 3D,E). L* remained 90.9–91.3 and b* remained close to 8.0. ΔEcmc was significantly higher for Δd-ldh-fermented milk than for wt-fermented milk (p < 0.01), whereas the higher mean value in ΔbudA-fermented milk did not reach statistical significance (p = 0.0675) (Figure 3F).

3.4. The Effects of budA and d-ldh Mutations on the Back-Extrusion Properties of Fermented Milk

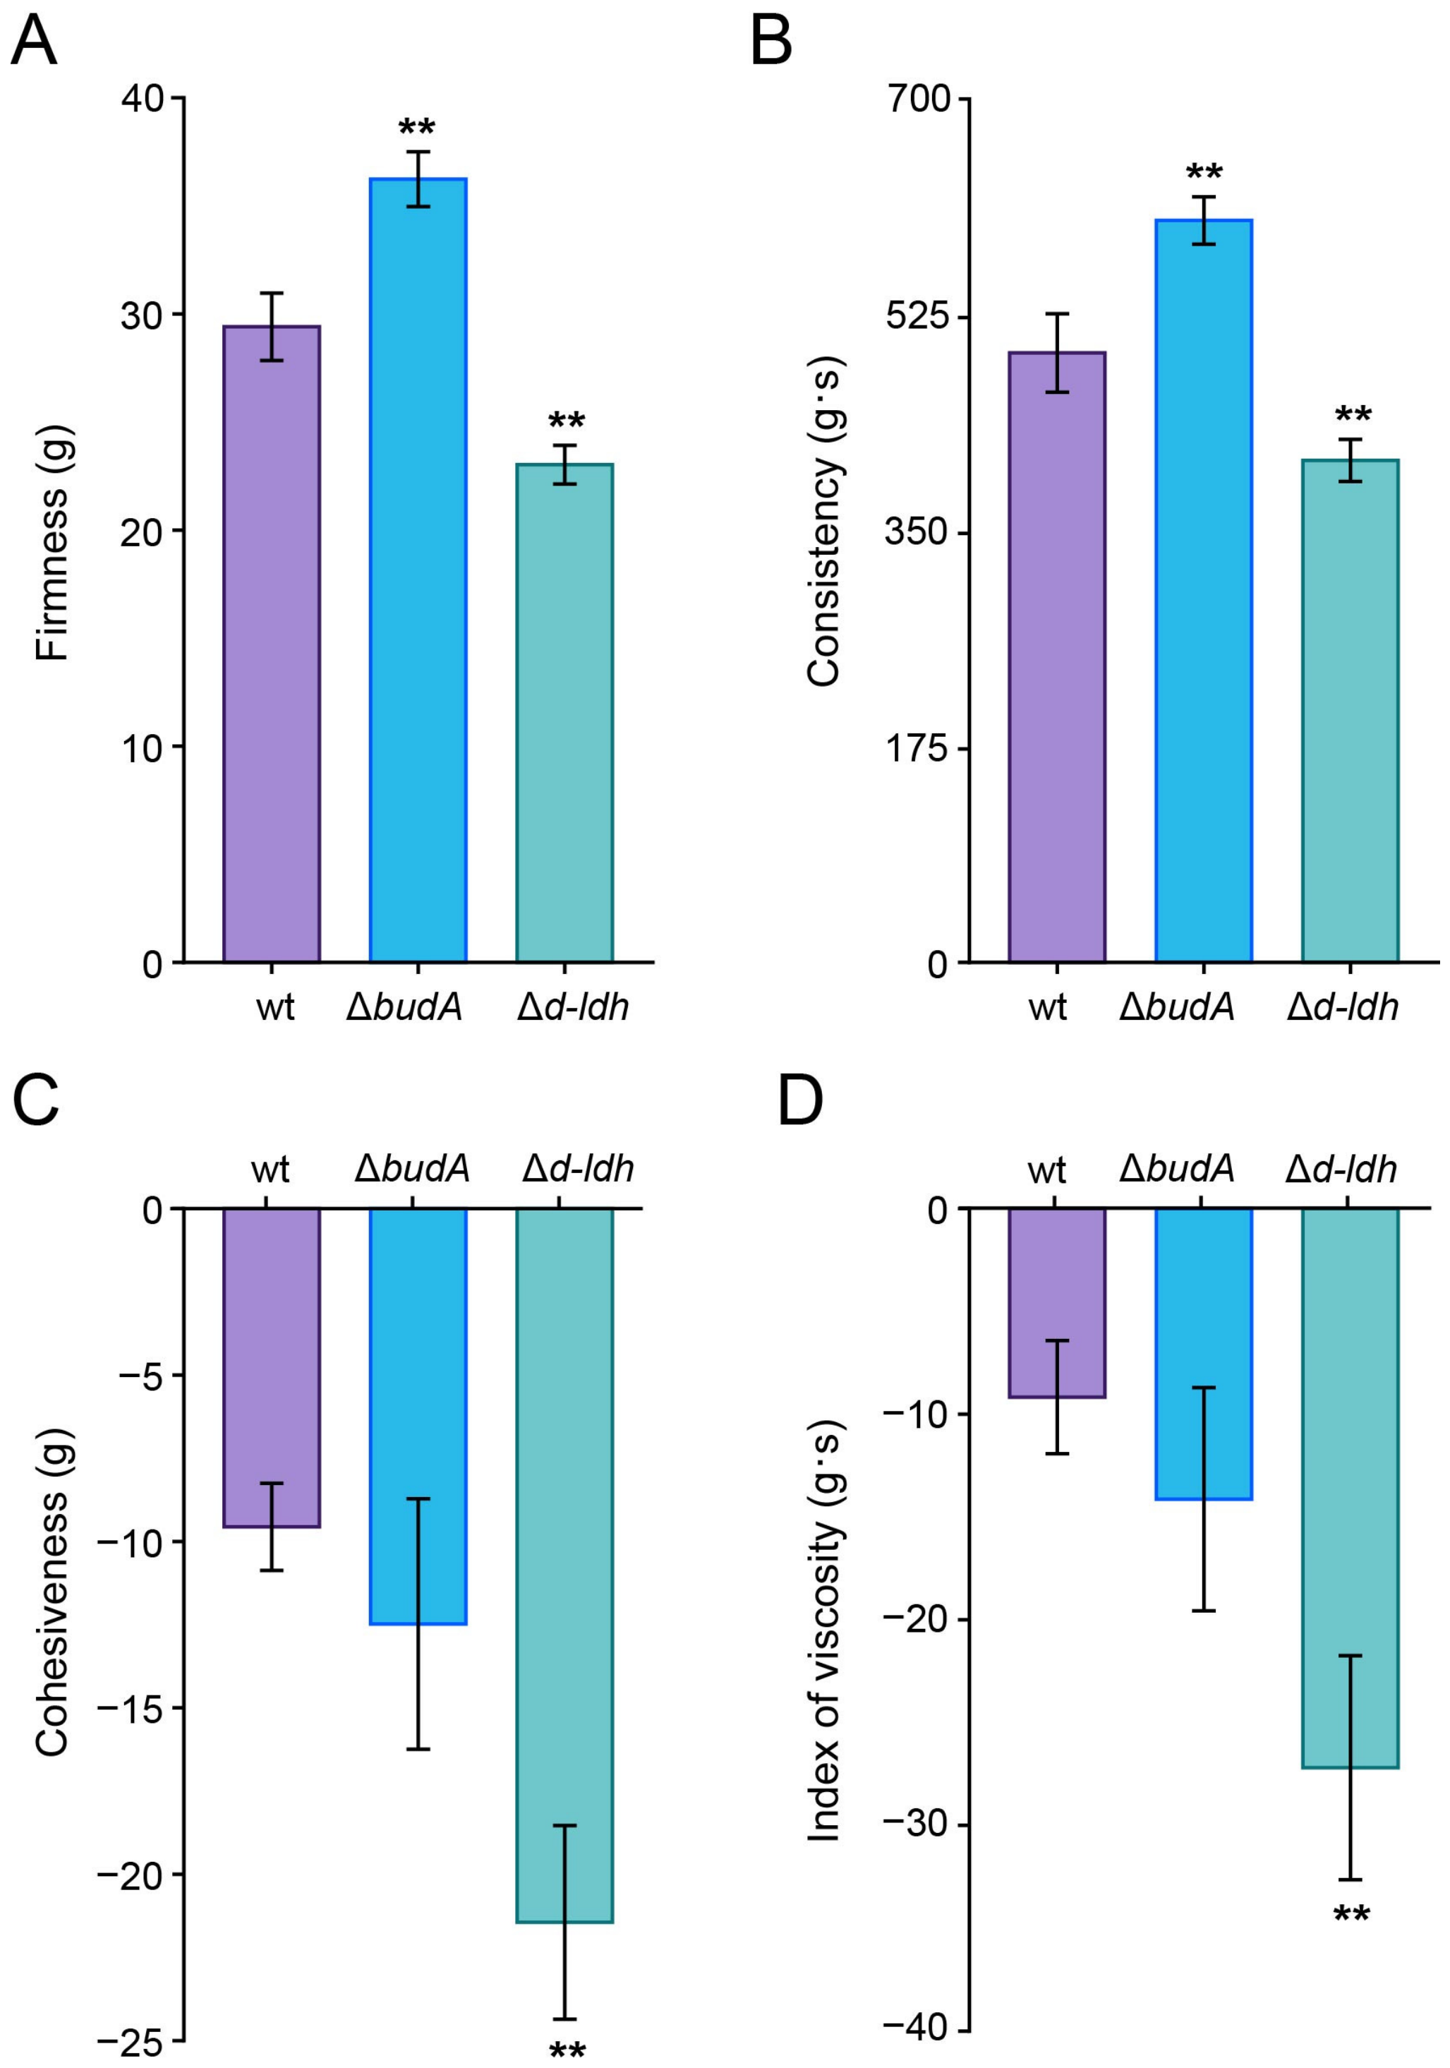
Back-extrusion analysis revealed clear differences in the textural profiles of fermented milk prepared with wt, ΔbudA, and Δd-ldh. Compared with wt-fermented milk, ΔbudA-fermented milk had significantly higher firmness (36.2 ± 1.3 g) and consistency (599.8 ± 19.2 g·s), whereas Δd-ldh-fermented milk had significantly lower values for both parameters (p < 0.01; Figure 4A,B).
Withdrawal-related cohesiveness and index of viscosity also differed among the three groups (Figure 4C,D). Compared with wt-fermented milk, Δd-ldh-fermented milk showed significantly higher absolute values of cohesiveness (21.4 ± 2.9 g) and index of viscosity (27.2 ± 5.5 g·s) (p < 0.01), whereas ΔbudA-fermented milk did not differ significantly from wt for either parameter. ΔbudA showed greater firmness and consistency during compression, while Δd-ldh combined lower firmness and consistency with larger absolute withdrawal-related responses.

3.5. Electronic Nose Profiling Revealed Distinct Volatile Fingerprints Among Fermented Milk Samples

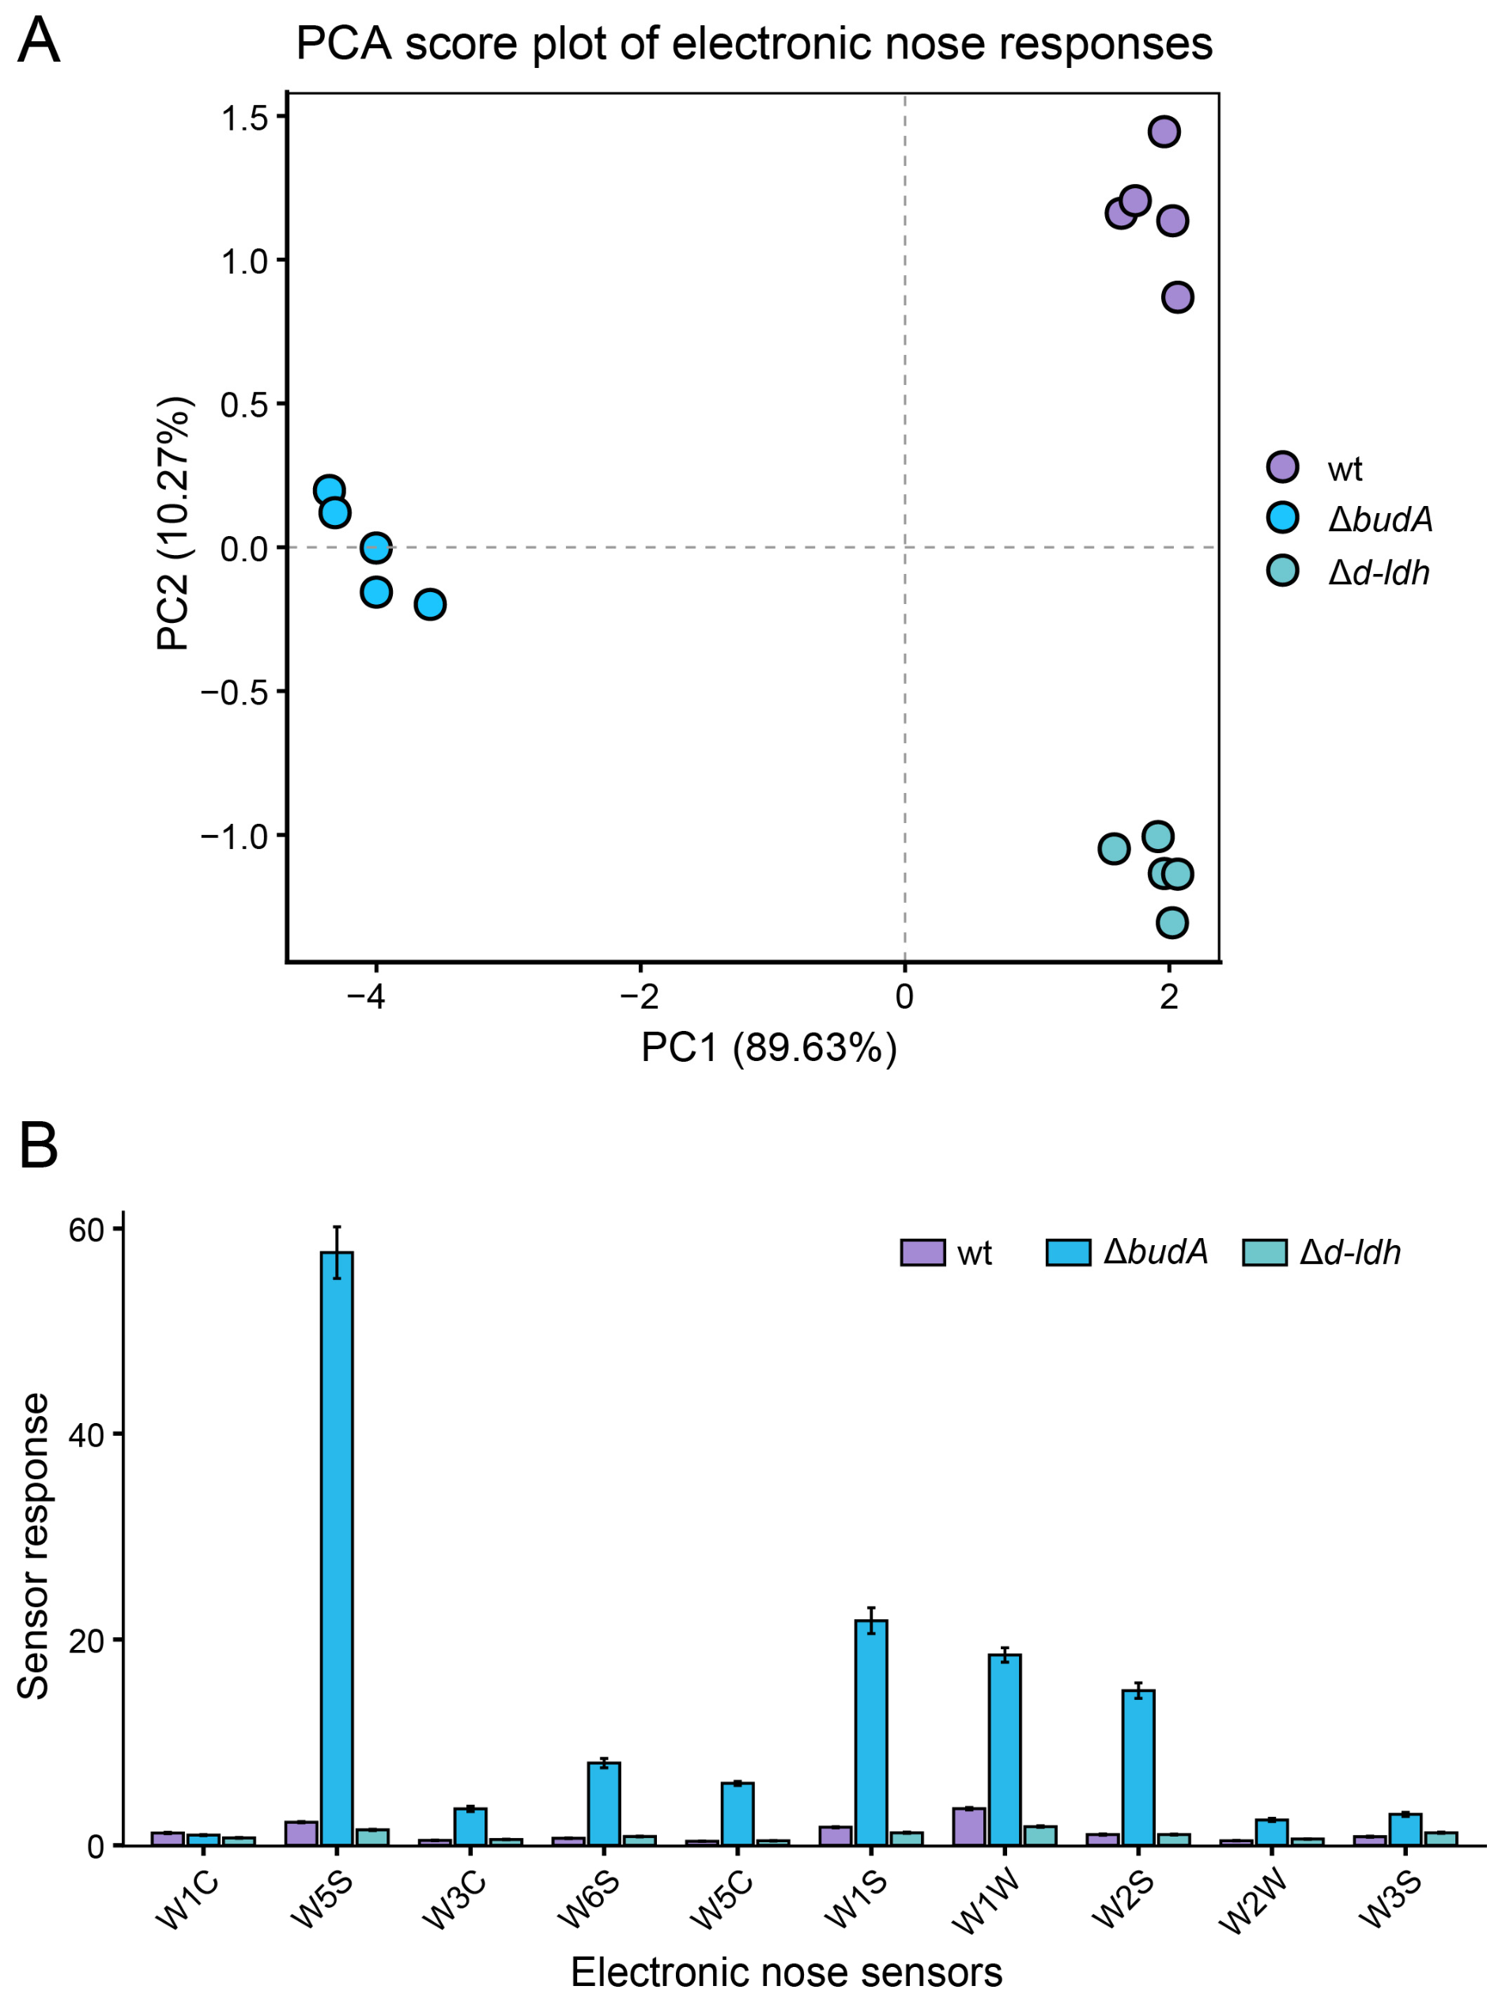
Electronic nose analysis distinguished the volatile fingerprints of fermented milk prepared with wt, ΔbudA, and Δd-ldh. The five biological replicates from each group occupied distinct regions of the PCA score plot (Figure 5A). PC1 and PC2 explained 89.63% and 10.27% of the total variance, respectively.
The individual sensor response profiles were consistent with the broad PCA separation (Figure 5B). ΔbudA-fermented milk showed substantially greater mean responses for several sensors, particularly W5S, W1S, W1W, and W2S. W5S showed the largest response difference, reaching a mean value of 57.7 in ΔbudA compared with 2.2 in wt and 1.5 in Δd-ldh. The wt and Δd-ldh groups showed lower and more similar response magnitudes across most sensors.

3.6. GC-MS Profiling Revealed Strain-Dependent Differences in Relative Volatile Composition

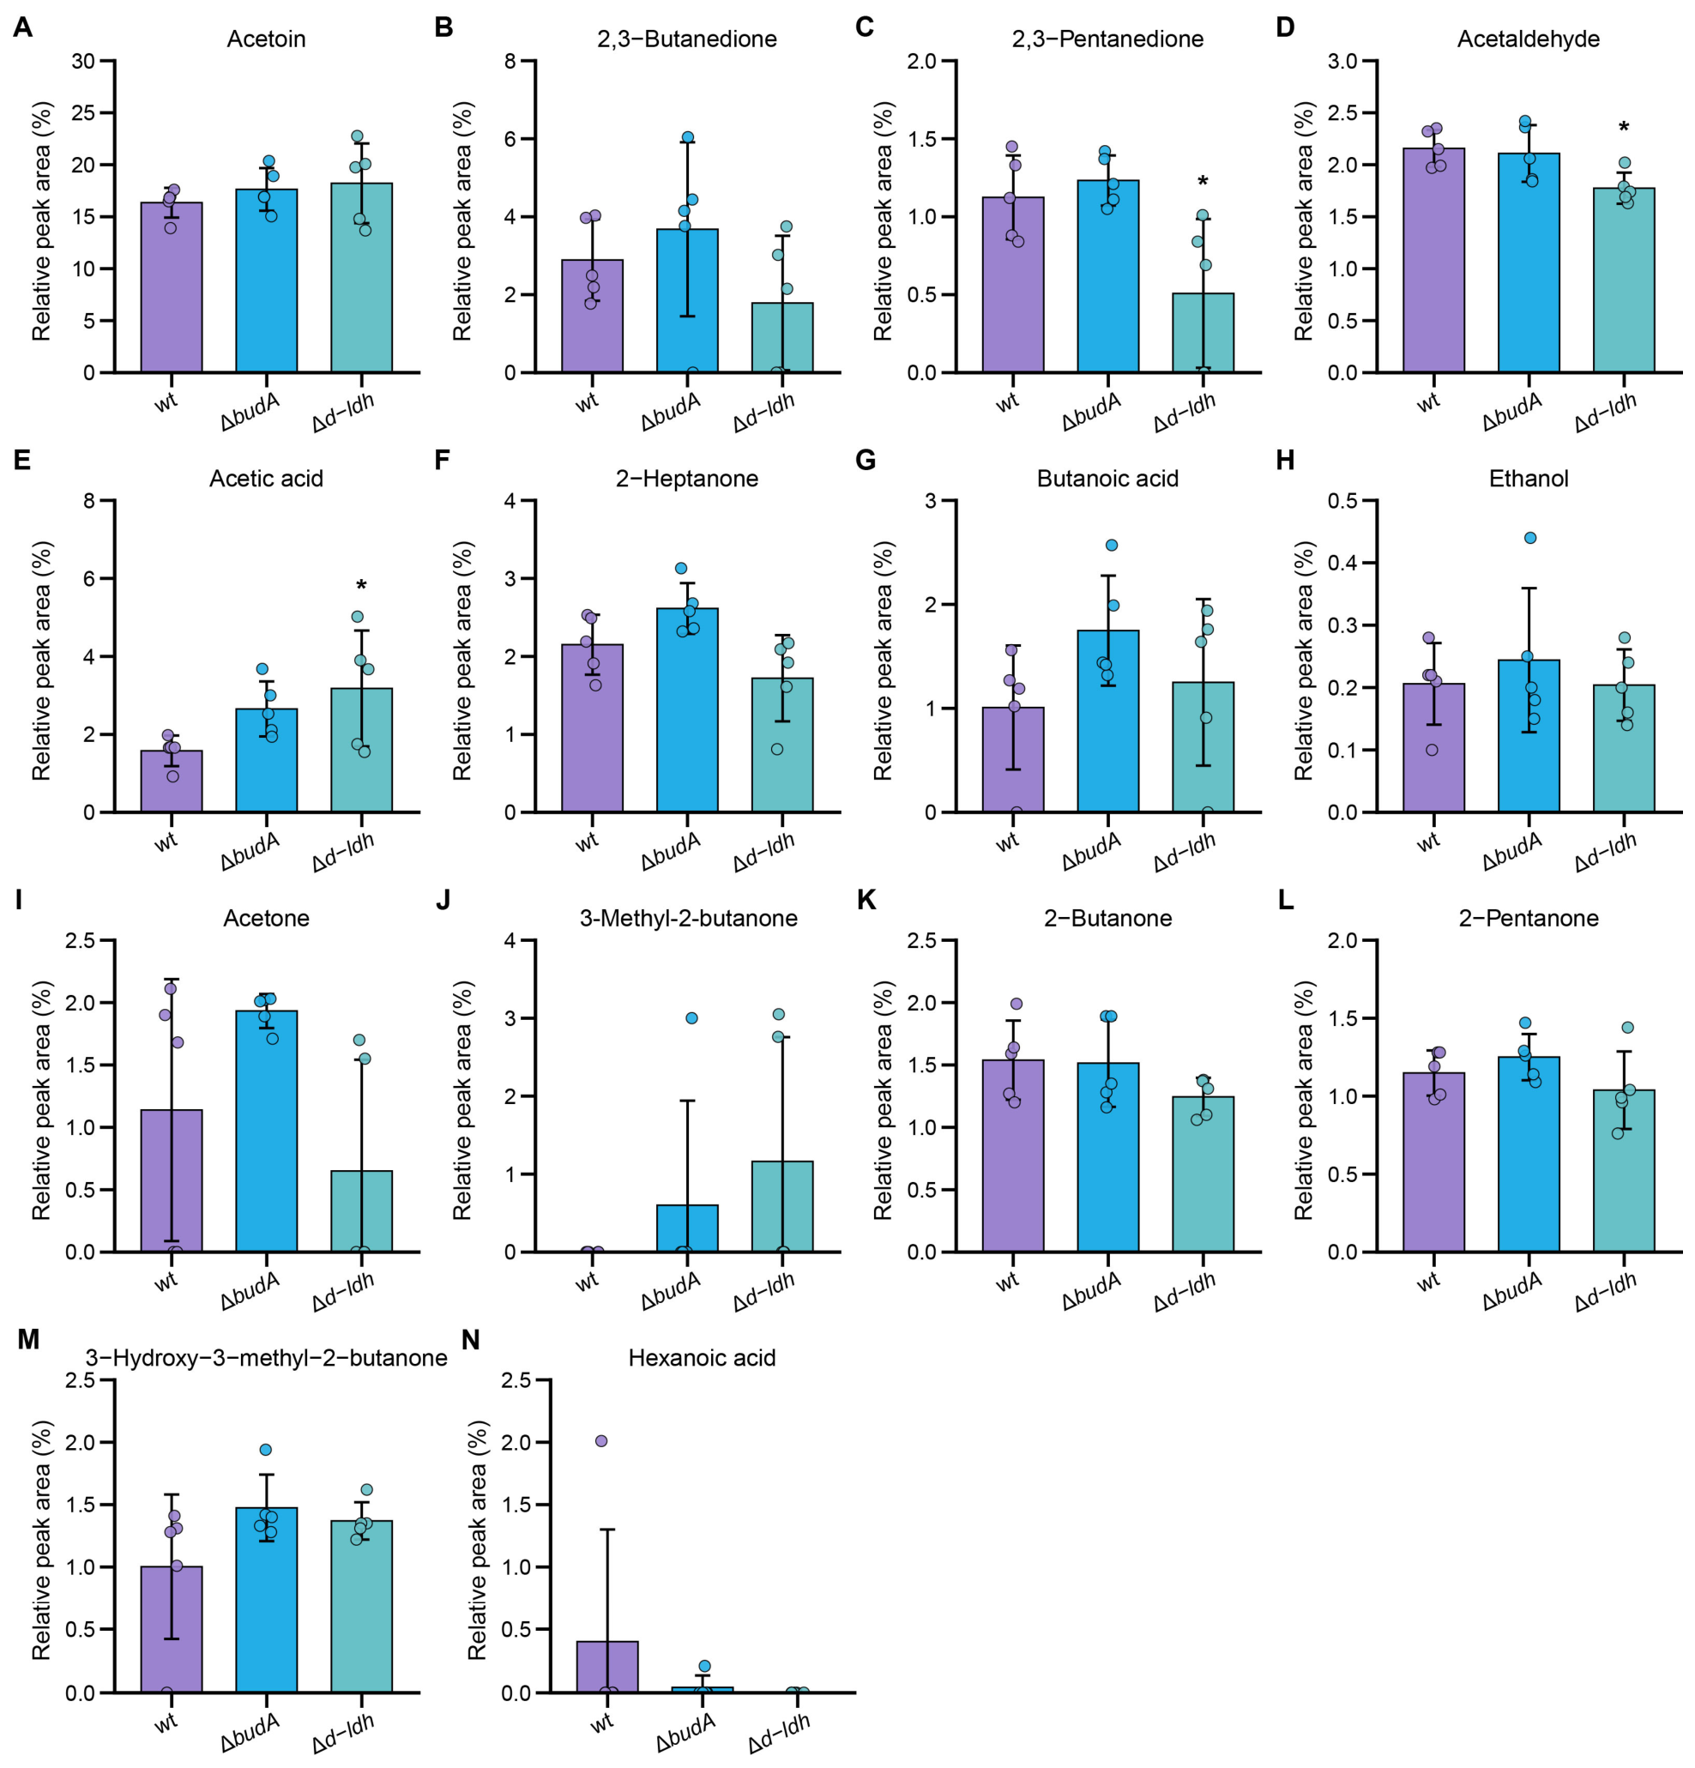
GC-MS analysis was used to compare the relative peak areas of 14 selected volatile compounds in fermented milk prepared with wt, ΔbudA, and Δd-ldh (Figure 6). Data were summarized from five independent biological replicates per strain. Compared with wt, Δd-ldh showed significantly lower relative peak areas of 2,3-pentanedione and acetaldehyde, whereas the relative peak area of acetic acid was significantly higher (p < 0.05). The remaining compounds showed smaller or more variable differences among strains, and no significant differences were detected between ΔbudA and wt for the individual compounds shown. These compound-level differences provide information complementary to the electronic nose analysis, which captured broader strain-dependent changes in the overall headspace fingerprint.

4. Discussion

Targeted mutations in d-ldh and budA within the same C. crustorum MN047 background produced distinct combinations of bacterial adaptation and fermented milk properties. Both nonsense mutants retained growth comparable to wt in nutrient-rich MRS broth, yet their subsequent phenotypes differed substantially. Δd-ldh showed greater auto-aggregation and stress survival together with lower titratable acidity, firmness, and consistency, whereas ΔbudA showed weaker adaptive phenotypes, greater firmness and consistency, and the most distinct electronic nose fingerprint. GC-MS further revealed significant differences in selected relative volatile compounds in Δd-ldh. Similar growth in nutrient-rich MRS coexisted with pronounced differences in stress tolerance and fermented milk properties.
LDH couples pyruvate reduction and lactate formation with NADH oxidation, but modification of one ldh gene need not eliminate lactate production because LAB may contain multiple lactate-producing enzymes or compensatory routes [32]. The MN047 genome contains additional lactate-dehydrogenase-related loci, including an annotated L-lactate dehydrogenase gene (BI355_0380) and another D-lactate dehydrogenase locus (BI355_1267), in addition to the targeted BI355_0173 [33]. These enzymes provide additional capacity for lactate metabolism and are consistent with the persistence of growth and acidification in Δd-ldh. The relative contribution of each LDH locus remains uncertain because D- and L-lactate were not measured separately. More extensive LDH disruption can redistribute pyruvate-derived end products, illustrating the metabolic flexibility of LAB [34]. Fang et al. [11] likewise reported that ldh disruption in Lacticaseibacillus paracasei altered acidification and fermented milk metabolites. In the present study, Δd-ldh maintained growth while showing higher auto-aggregation and survival under acid and bile salt stress, but its fermented milk had lower titratable acidity, firmness, and consistency (Figure 2A–C, Figure 3A and Figure 4A,B). The gain in stress robustness was accompanied by weaker acidification-related product properties. LDH modification can alter NADH turnover and the distribution of pyruvate-derived metabolites [32], while aggregation and stress tolerance are also influenced by cell-surface properties [15]. All strains were challenged under the same externally imposed pH and bile salt conditions, so the higher survival of Δd-ldh was observed under matched assay conditions. Shared stress-response mechanisms may contribute, as acid and bile stresses engage overlapping processes involving intracellular pH homeostasis, membrane function, and energy metabolism [35]. Redox balance, cell-surface properties, and lactate stereoisomer distribution may all contribute to this phenotype, but these variables were not measured in the current experiments. Likewise, the lower titratable acidity does not establish reduced D-lactate formation, since D- and L-lactate were not quantified separately.
The ΔbudA phenotype provides a contrasting view of the C4 branch. budA encodes α-acetolactate decarboxylase, which converts α-acetolactate to acetoin. In Lactococcus lactis lacking this enzyme, α-acetolactate accumulation and subsequent acetoin and diacetyl formation depended on oxygen availability and citrate supplementation [12]. García-Quintáns et al. further showed that activation of the diacetyl/acetoin pathway in L. lactis responds to acidic growth conditions and intracellular pyruvate availability [36]. More recently, Tian et al. showed that transcriptional changes in glycolysis and pyruvate-related pathways were associated with the formation of acetoin, diacetyl, and acetaldehyde during yogurt fermentation [37]. These studies place BudA within a metabolically flexible C4 branch in which changes in α-acetolactate decarboxylation can alter the distribution of downstream products. Although budA encodes the enzyme catalyzing α-acetolactate decarboxylation to acetoin, disruption of this route does not necessarily eliminate acetoin formation. α-Acetolactate is chemically unstable and can undergo spontaneous conversion to acetoin and diacetyl, as demonstrated previously in α-acetolactate decarboxylase-deficient L. lactis [12]. Moreover, C4 aroma formation depends on the balance among several competing pyruvate-consuming reactions [13]. Consistent with this metabolic flexibility, neither acetoin nor 2,3-butanedione differed significantly between ΔbudA and wt in the relative GC-MS analysis. These endpoint relative peak areas do not reveal the direction of α-acetolactate flux, particularly because α-acetolactate and the absolute concentrations of acetoin and diacetyl were not determined.
Electronic nose and GC-MS analyses captured different levels of strain-dependent volatile variation. ΔbudA-fermented milk showed the most distinct global sensor response pattern and was clearly separated from wt and Δd-ldh in the electronic nose PCA (Figure 5). In contrast, none of the 14 GC-MS compounds differed significantly between ΔbudA and wt, whereas Δd-ldh showed lower relative peak areas of 2,3-pentanedione and acetaldehyde and a higher relative peak area of acetic acid (Figure 6). This difference between the two analytical platforms is plausible because the electronic nose integrates cross-sensitive responses to the overall headspace, while the GC-MS comparison was restricted to selected tentatively identified compounds and their relative peak areas [38]. The electronic nose separation reflects a broad ΔbudA-associated headspace fingerprint, although no individual GC-MS compound accounted for this pattern. For Δd-ldh, the differences in acetaldehyde, acetic acid, and 2,3-pentanedione are compatible with altered fermentation-derived volatile composition, although relative peak areas provide compositional comparisons and do not yield absolute production rates or flux estimates. Time-resolved metabolomic analysis of yogurt fermentation has recently identified pyruvate metabolism among the hub pathways associated with changes in acetic acid and 2,3-pentanedione, supporting the broader metabolic relevance of these compounds during milk fermentation [39].
Viable counts remained similar in fermented milk prepared with wt, ΔbudA, and Δd-ldh despite differences in titratable acidity and texture (Figure 3B and Figure 4), showing that final cell abundance alone did not account for product quality. Although all fermentations were stopped within the same terminal pH range, titratable acidity remained lower in Δd-ldh-fermented milk. This difference is compatible with the buffering behavior of milk, because pH reflects hydrogen-ion activity whereas titratable acidity reflects the amount of base required to neutralize acids within a matrix containing proteins, phosphate, citrate, and other buffering components [40,41]. Consequently, similar terminal pH values do not necessarily indicate identical acid production or acid composition. The lower acidity of Δd-ldh-fermented milk coincided with lower firmness and consistency (Figure 3A and Figure 4A,B), a pattern consistent with the central role of acidification in reducing casein repulsion and promoting acid-induced gel formation [1,2,42]. ΔbudA-fermented milk, however, showed greater firmness and consistency despite only a modest acidity difference from wt. This contrast indicates that endpoint acidity accounted for only part of the observed textural variation. Acidification rate can substantially affect acid-milk gel formation [43], and culture-dependent changes in acidification may occur together with changes in rheological and volatile properties [44]. Factors beyond acidification can also modify the gel structure. Differences in EPS production and strain-derived proteolysis have been associated with changes in viscosity, water-holding capacity, protein conformation, and casein gelation in fermented milk [45,46]. Whether these processes contributed to the texture differences observed in MN047 remains to be determined. The larger absolute withdrawal-related responses for Δd-ldh further show that the mutations affected compression and withdrawal parameters differently (Figure 4C,D), revealing a multidimensional change in the textural profile.
Colorimetry provided an additional indication of product-level changes associated with the two mutations. In the CIELAB system, the significantly lower a* value of ΔbudA-fermented milk indicates a small shift toward more negative values on the green-to-red axis (Figure 3C). This axis-specific change did not translate into a significant difference in ΔEcmc (p = 0.0675) (Figure 3F). The two results are statistically compatible. a* describes a single chromatic coordinate, whereas ΔEcmc integrates weighted differences in lightness, chroma, and hue and reflects the variability among biological replicates. Thus, color changes associated with ΔbudA were limited to specific instrumental coordinates. Optical properties of fermented milk are influenced by light scattering from the protein and fat matrix, which can change with acidification and gel development [47,48]. The concurrent increase in firmness and consistency observed for ΔbudA-fermented milk may have contributed to the small instrumental color shift, although microstructure and optical scattering were not directly measured. Sensory color was not evaluated, so the visual perceptibility of these instrumental differences remains unknown.
Within the same C. crustorum MN047 background, the two mutations produced different technological profiles. Δd-ldh combined greater stress robustness with weaker acidification-related gel properties and changes in selected relative volatile compounds, whereas ΔbudA showed weaker adaptive phenotypes with greater firmness and consistency and a distinct electronic nose fingerprint. Direct quantification of D- and L-lactate, α-acetolactate, acetoin, and diacetyl, together with genetic complementation and metabolic-flux analysis, will be required to define the underlying pathway changes. Continuous acidification curves and the time required to reach the terminal pH were not recorded in the original experiment. Future measurements of these variables will be needed to distinguish the contribution of fermentation kinetics from endpoint acidity. These findings illustrate that selection for stress robustness and selection for desirable fermented milk properties may involve different physiological trade-offs.

5. Conclusions

CRISPR-assisted base editing generated two C. crustorum MN047 nonsense mutants that retained comparable basic growth but showed distinct strain-level and product-level phenotypes. Δd-ldh displayed greater auto-aggregation and survival under acid and bile salt stress, while fermented milk produced with this mutant had lower titratable acidity, firmness, and consistency. GC-MS further identified significant differences in selected relative volatile compounds in Δd-ldh. ΔbudA showed weaker adaptive phenotypes but produced fermented milk with greater firmness and consistency and the most distinct electronic nose fingerprint. Viable counts remained comparable among groups despite these differences in fermented milk properties. Together, the two mutations produced different combinations of bacterial robustness and fermented milk performance. Their contrasting phenotypes support further evaluation of these metabolic branches during strain development for fermented milk applications.

Supplementary Materials

The following supporting information can be downloaded at https://www.mdpi.com/article/10.3390/fermentation12100460/s1: Table S1. Plasmids and primers used for construction and verification of budA and d-ldh mutants; Table S2. Sensor array and main response characteristics of the PEN3 electronic nose.

Author Contributions

J.L.: Writing—original draft, Validation, Methodology, Data curation, Software. P.W.: Project administration, Writing—review & editing, Investigation, Funding acquisition, Formal analysis. Z.Q.: Investigation, Data curation. Y.X.: Formal analysis, Data curation. W.L.: Data curation, Software. Y.S.: Data curation, Software. Y.Q.: Software, Formal analysis. All authors have read and agreed to the published version of the manuscript.

Funding

This work was supported by the National Natural Science Foundation of China (No. 32302260), the Key Research and Development Program of Shaanxi (No. 2026NC-YBXM338), the Scientific Research Program Funded by Shaanxi Provincial Education Department (No. 25JC008), the Shaanxi Province Postdoctoral Science Foundation (No. 2025BSHEDZZ031), and the Shaanxi Natural Science Basic Research Program (No. 2026JC-YBQN-0217).

Institutional Review Board Statement

Not applicable.

Informed Consent Statement

Not applicable.

Data Availability Statement

The data supporting the findings of this study are available from the corresponding author upon reasonable request.

Conflicts of Interest

The authors declare no conflicts of interest.

References

  1. Lucey, J.A.; Singh, H. Formation and physical properties of acid milk gels: A review. Food Res. Int. 1997, 30, 529–542. [Google Scholar] [CrossRef] [Scilit]
  2. Lee, W.J.; Lucey, J.A. Formation and Physical Properties of Yogurt. Asian-Australas. J. Anim. Sci. 2010, 23, 1127–1136. [Google Scholar] [CrossRef] [Scilit]
  3. Li, D.; Cui, Y.; Wu, X.; Li, J.; Min, F.; Zhao, T.; Zhang, J.; Zhang, J. Graduate Student Literature Review: Network of flavor compounds formation and influence factors in yogurt. J. Dairy Sci. 2024, 107, 8874–8886. [Google Scholar] [CrossRef] [Scilit] [PubMed]
  4. Alam, M.K.; Prete, R.; Faieta, M.; Rannou, C.; Prost, C.; Lethuaut, L.; Corsetti, A.; Pittia, P. Yogurt volatile compounds as affected by processing and compositional factors: A review. Trends Food Sci. Technol. 2025, 158, 104921. [Google Scholar] [CrossRef] [Scilit]
  5. Liu, S.Q. Practical implications of lactate and pyruvate metabolism by lactic acid bacteria in food and beverage fermentations. Int. J. Food Microbiol. 2003, 83, 115–131. [Google Scholar] [CrossRef] [Scilit] [PubMed]
  6. Gänzle, M.G. Lactic metabolism revisited: Metabolism of lactic acid bacteria in food fermentations and food spoilage. Curr. Opin. Food Sci. 2015, 2, 106–117. [Google Scholar] [CrossRef] [Scilit]
  7. Neves, A.R.; Ramos, A.; Costa, H.; van Swam, I.I.; Hugenholtz, J.; Kleerebezem, M.; de Vos, W.M.; Santos, H. Effect of different NADH oxidase levels on glucose metabolism by Lactococcus lactis: Kinetics of intracellular metabolite pools determined by in vivo nuclear magnetic resonance. Appl. Environ. Microbiol. 2002, 68, 6332–6342. [Google Scholar] [CrossRef] [Scilit] [PubMed]
  8. Smid, E.J.; Kleerebezem, M. Production of aroma compounds in lactic fermentations. Annu. Rev. Food Sci. Technol. 2014, 5, 313–326. [Google Scholar] [CrossRef] [Scilit] [PubMed]
  9. Goffin, P.; Lorquet, F.; Kleerebezem, M.; Hols, P. Major role of NAD-dependent lactate dehydrogenases in aerobic lactate utilization in Lactobacillus plantarum during early stationary phase. J. Bacteriol. 2004, 186, 6661–6666. [Google Scholar] [CrossRef] [Scilit] [PubMed]
  10. Marlow, V.A.; Rea, D.; Najmudin, S.; Wills, M.; Fulop, V. Structure and mechanism of acetolactate decarboxylase. ACS Chem. Biol. 2013, 8, 2339–2344. [Google Scholar] [CrossRef] [Scilit] [PubMed]
  11. Fang, S.; Song, X.; Cui, L.; Bai, J.; Lu, H.; Wang, S. The lactate dehydrogenase gene is involved in the growth and metabolism of Lacticaseibacillus paracasei and the production of fermented milk flavor substances. Front. Microbiol. 2023, 14, 1195360. [Google Scholar] [CrossRef] [Scilit] [PubMed]
  12. Aymes, F.; Monnet, C.; Corrieu, G. Effect of alpha-acetolactate decarboxylase inactivation on alpha-acetolactate and diacetyl production by Lactococcus lactis subsp. lactis biovar diacetylactis. J. Biosci. Bioeng. 1999, 87, 87–92. [Google Scholar] [CrossRef] [Scilit] [PubMed]
  13. Tian, H.; Hang, S.; Huang, N.; Yu, H.; Chen, C.; Ge, C. Strain-level variation in diacetyl production by Lactiplantibacillus plantarum reveals genetic drivers of flavor in fermented dairy. J. Dairy Sci. 2025, 108, 10689–10699. [Google Scholar] [CrossRef] [Scilit] [PubMed]
  14. Pradal, I.; Gonzalez-Alonso, V.; Wardhana, Y.R.; De Vuyst, L. Companilactobacillus crustorum LMG 23699 and Wickerhamomyces anomalus IMDO 010110 form a candidate, stable, mixed-strain starter culture for sourdough production. Int. J. Food Microbiol. 2025, 440, 111278. [Google Scholar] [CrossRef] [Scilit] [PubMed]
  15. Zawistowska-Rojek, A.; Kosmider, A.; Stepien, K.; Tyski, S. Adhesion and aggregation properties of Lactobacillaceae strains as protection ways against enteropathogenic bacteria. Arch. Microbiol. 2022, 204, 285. [Google Scholar] [CrossRef] [Scilit] [PubMed]
  16. Ruiz, L.; Margolles, A.; Sanchez, B. Bile resistance mechanisms in Lactobacillus and Bifidobacterium. Front. Microbiol. 2013, 4, 396. [Google Scholar] [CrossRef] [Scilit] [PubMed]
  17. Xie, Z.; McAuliffe, O.; Jin, Y.S.; Miller, M.J. Invited review: Genomic modifications of lactic acid bacteria and their applications in dairy fermentation. J. Dairy Sci. 2024, 107, 8749–8764. [Google Scholar] [CrossRef] [Scilit] [PubMed]
  18. Wang, P.; Yi, Y.; Lu, X. CRISPR/Cas9-Based Genome Editing Platform for Companilactobacillus crustorum to Reveal the Molecular Mechanism of Its Probiotic Properties. J. Agric. Food Chem. 2021, 69, 15279–15289. [Google Scholar] [CrossRef] [Scilit] [PubMed]
  19. Jia, B.; Pu, Z.J.; Tang, K.; Jia, X.; Kim, K.H.; Liu, X.; Jeon, C.O. Catalytic, Computational, and Evolutionary Analysis of the d-Lactate Dehydrogenases Responsible for d-Lactic Acid Production in Lactic Acid Bacteria. J. Agric. Food Chem. 2018, 66, 8371–8381. [Google Scholar] [CrossRef] [Scilit] [PubMed]
  20. Wang, P.; Wang, T.; Ismael, M.; Wang, X.; Yi, Y.; Lü, X. Development of an electroporation method and expression patterns of bacteriocin-encoding genes in Companilactobacillus crustorum MN047. Food Biosci. 2021, 44, 101420. [Google Scholar] [CrossRef] [Scilit]
  21. Wang, P.; Yao, X.; Zhang, S.; Wang, T.; Zhang, S.; Qü, Z.; Lü, X. Disruption of luxS gene enhances auto-aggregation and colitis-alleviating capacity in Companilactobacillus crustorum MN047: Insights from transcriptomic and microbiome analysis. Food Biosci. 2026, 78, 108545. [Google Scholar] [CrossRef] [Scilit]
  22. Nandha, M.C.; Shukla, R.M. Exploration of probiotic attributes in lactic acid bacteria isolated from fermented Theobroma cacao L. fruit using in vitro techniques. Front. Microbiol. 2023, 14, 1274636. [Google Scholar] [CrossRef] [Scilit] [PubMed]
  23. Megur, A.; Ambrutaitytė, K.; Sadauskas, M.; Stankevičiūtė, J.; Meškys, R.; Lastauskienė, E.; Burokas, A. Investigating tryptophan-producing probiotic lactic acid bacteria from Lithuanian fermented foods: Functional characterization, safety evaluation, and genomic analysis. J. Funct. Foods 2026, 140, 107281. [Google Scholar] [CrossRef] [Scilit]
  24. Dan, T.; Chen, H.; Li, T.; Tian, J.; Ren, W.; Zhang, H.; Sun, T. Influence of Lactobacillus plantarum P-8 on Fermented Milk Flavor and Storage Stability. Front. Microbiol. 2018, 9, 3133. [Google Scholar] [CrossRef] [Scilit] [PubMed]
  25. Li, C.; Song, J.; Kwok, L.Y.; Wang, J.; Dong, Y.; Yu, H.; Hou, Q.; Zhang, H.; Chen, Y. Influence of Lactobacillus plantarum on yogurt fermentation properties and subsequent changes during postfermentation storage. J. Dairy Sci. 2017, 100, 2512–2525. [Google Scholar] [CrossRef] [Scilit] [PubMed]
  26. Lan, T.; Wang, J.; Yuan, Q.; Lei, Y.; Peng, W.; Zhang, M.; Li, X.; Sun, X.; Ma, T. Evaluation of the color and aroma characteristics of commercially available Chinese kiwi wines via intelligent sensory technologies and gas chromatography-mass spectrometry. Food Chem. X 2022, 15, 100427. [Google Scholar] [CrossRef] [Scilit] [PubMed]
  27. Jia, J.; Deng, X.; Jia, X.; Guo, C.; Liu, X.; Liu, Y.; Duan, X. Comparison and evaluation of L. reuteri and L. rhamnosus-fermented egg yolk on the physicochemical and flavor properties of cookies. Food Chem. X 2024, 21, 101096. [Google Scholar] [CrossRef] [Scilit] [PubMed]
  28. Najgebauer-Lejko, D.; Żmudziński, D.; Ptaszek, A.; Socha, R. Textural properties of yogurts with green tea and Pu-erh tea additive. Int. J. Food Sci. Technol. 2014, 49, 1149–1158. [Google Scholar] [CrossRef] [Scilit]
  29. Tan, C.; Tian, Y.; Tao, L.; Xie, J.; Wang, M.; Zhang, F.; Yu, Z.; Sheng, J.; Zhao, C. Exploring the Effect of Milk Fat on Fermented Milk Flavor Based on Gas Chromatography-Ion Mobility Spectrometry (GC-IMS) and Multivariate Statistical Analysis. Molecules 2024, 29, 1099. [Google Scholar] [CrossRef] [Scilit] [PubMed]
  30. Chi, X.; Zhang, Y.; Zheng, N.; Wang, J.; Liu, H. HS-GC-IMS and HS-SPME/GC-MS coupled with E-nose and E-tongue reveal the flavors of raw milk from different regions of China. Curr. Res. Food Sci. 2024, 8, 100673. [Google Scholar] [CrossRef] [Scilit] [PubMed]
  31. Papaioannou, G.; Kosma, I.; Badeka, A.V.; Kontominas, M.G. Profile of Volatile Compounds in Dessert Yogurts Prepared from Cow and Goat Milk, Using Different Starter Cultures and Probiotics. Foods 2021, 10, 3153. [Google Scholar] [CrossRef] [Scilit] [PubMed]
  32. Rico, J.; Yebra, M.J.; Perez-Martinez, G.; Deutscher, J.; Monedero, V. Analysis of ldh genes in Lactobacillus casei BL23: Role on lactic acid production. J. Ind. Microbiol. Biotechnol. 2008, 35, 579–586. [Google Scholar] [CrossRef] [Scilit] [PubMed]
  33. Yi, L.; Guo, X.; Liu, L.; Shao, C.; Lu, X. First Report on the Complete Genome Sequence of Lactobacillus crustorum MN047, a Potent Probiotic Strain Isolated from Koumiss in China. Genome Announc. 2017, 5, 10–1128. [Google Scholar] [CrossRef] [Scilit] [PubMed]
  34. Ferain, T.; Schanck, A.N.; Delcour, J. 13C nuclear magnetic resonance analysis of glucose and citrate end products in an ldhL-ldhD double-knockout strain of Lactobacillus plantarum. J. Bacteriol. 1996, 178, 7311–7315. [Google Scholar] [CrossRef] [Scilit] [PubMed]
  35. Yang, H.; He, M.; Wu, C. Cross protection of lactic acid bacteria during environmental stresses: Stress responses and underlying mechanisms. LWT 2021, 144, 111203. [Google Scholar] [CrossRef] [Scilit]
  36. Garcia-Quintans, N.; Repizo, G.; Martin, M.; Magni, C.; Lopez, P. Activation of the diacetyl/acetoin pathway in Lactococcus lactis subsp. lactis bv. diacetylactis CRL264 by acidic growth. Appl. Environ. Microbiol. 2008, 74, 1988–1996. [Google Scholar] [CrossRef] [Scilit] [PubMed]
  37. Tian, H.; Huang, N.; Yao, W.; Yu, H.; Yu, B.; Chen, X.; Chen, C. Comparative transcriptomic analysis of the flavor production mechanism in yogurt by traditional starter strains. J. Dairy Sci. 2024, 107, 5402–5415. [Google Scholar] [CrossRef] [Scilit] [PubMed]
  38. Li, J.; Wen, R.; Wang, J.; Zou, T.; Zhang, D.; Hou, Y.; Song, H.; Li, H.; Ma, H.; Shi, J. Identification of key aroma-active compounds in long shelf-life yoghurt and milk produced by different pre-sterilisation processes of raw milk using SBSE-GC × GC–O–MS. Int. J. Food Sci. Technol. 2024, 59, 3667–3678. [Google Scholar] [CrossRef] [Scilit]
  39. Han, H.; Wang, Y.; Meng, T.; Hou, B.; He, J.; Li, B.; Kong, C.; Wang, B. Unveiling metabolic mechanisms of aroma-active compounds during yogurt fermentation through volatilomics, sensomics, and untargeted metabolomics analysis. J. Dairy Sci. 2026, 109, 8027–8042. [Google Scholar] [CrossRef] [Scilit] [PubMed]
  40. Salaün, F.; Mietton, B.; Gaucheron, F. Buffering capacity of dairy products. Int. Dairy J. 2005, 15, 95–109. [Google Scholar] [CrossRef] [Scilit]
  41. Akarca, G.; Denizkara, A.J. Changes of quality in yoghurt produced under magnetic field effect during fermentation and storage processes. Int. Dairy J. 2024, 150, 105841. [Google Scholar] [CrossRef] [Scilit]
  42. McMahon, D.J.; Du, H.; McManus, W.R.; Larsen, K.M. Microstructural changes in casein supramolecules during acidification of skim milk. J. Dairy Sci. 2009, 92, 5854–5867. [Google Scholar] [CrossRef] [Scilit] [PubMed]
  43. Jacob, M.; Nöbel, S.; Jaros, D.; Rohm, H. Physical properties of acid milk gels: Acidification rate significantly interacts with cross-linking and heat treatment of milk. Food Hydrocoll. 2011, 25, 928–934. [Google Scholar] [CrossRef] [Scilit]
  44. Ge, Y.; Yu, X.; Zhao, X.; Liu, C.; Li, T.; Mu, S.; Zhang, L.; Chen, Z.; Zhang, Z.; Song, Z.; et al. Fermentation characteristics and postacidification of yogurt by Streptococcus thermophilus CICC 6038 and Lactobacillus delbrueckii ssp. bulgaricus CICC 6047 at optimal inoculum ratio. J. Dairy Sci. 2024, 107, 123–140. [Google Scholar] [CrossRef] [Scilit] [PubMed]
  45. Zhang, X.; LaPointe, G.; Liu, Y.; Wang, X.; Xiao, L.; Zhao, X.; Li, W. Comparative analysis of exopolysaccharide-producing Lactiplantibacillus plantarum with ropy and non-ropy phenotypes on the gel properties and protein conformation of fermented milk. Food Chem. 2023, 420, 136117. [Google Scholar] [CrossRef] [Scilit] [PubMed]
  46. Kuerman, M.; Liu, Z.; Liu, Y.; Yi, H.; Hou, B.; Li, B.; Zhang, L.; Liu, T. Lactiplantibacillus plantarum enhances the texture of fermented milk by facilitating protein gelatinization through the action of a novel coagulation-promoting protease. Food Hydrocoll. 2024, 154, 110044. [Google Scholar] [CrossRef] [Scilit]
  47. Chopde, S.S.; Minz, P.S.; Sinha, C.; Sharma, A.K.; Kumari, K.; Hussain, S.A. Novel approach to monitor yoghurt fermentation process using selected color parameters. Food Control 2025, 178, 111480. [Google Scholar] [CrossRef] [Scilit]
  48. Tavşanlı, H.; Güner, T.E.; Altundal, B.; Ektik, N.; İlhak, O.İ. The effect of ultrasound process on lactic acid bacteria, physicochemical and sensory properties of yoghurt, before and after inoculation of starter cultures into milk. Int. J. Dairy Technol. 2023, 77, 105–113. [Google Scholar] [CrossRef] [Scilit]
Figure 1. Verification and growth characteristics of budA and d-ldh mutant strains. (A) A simplified schematic representation of the pyruvate-associated branches targeted in this study. d-ldh encodes D-lactate dehydrogenase involved in conversion of pyruvate to D-lactate, whereas budA encodes α-acetolactate decarboxylase involved in conversion of α-acetolactate to acetoin. (B) Sanger sequencing confirmation of the premature stop codon introduced into budA. (C) Sanger sequencing confirmation of the premature stop codon introduced into d-ldh, which converted the Trp19 codon to a premature stop codon. (D) Growth curves of wt, ΔbudA, and Δd-ldh in MRS broth. Data are presented as the mean ± SD (n = 3 independent biological replicates).
Fermentation 12 00460 g001
Figure 2. The effects of budA and d-ldh mutations on auto-aggregation and stress tolerance of C. crustorum MN047. (A) Auto-aggregation of wt, ΔbudA, and Δd-ldh strains during static incubation for 4, 12, 16, 20, and 24 h. (B) Survival after exposure to MRS broth at pH 2.0 or 3.0 for 3 h. (C) Survival after exposure to 0.3% or 0.6% bovine bile salts for 3 h. Data are presented as the mean ± SD (n = 3 independent biological replicates). Significant differences were determined relative to wt at the same time point or under the same treatment condition. * p < 0.05, ** p < 0.01, and *** p < 0.001.
Fermentation 12 00460 g002
Figure 3. The effects of budA and d-ldh mutations on the basic quality and color parameters of fermented milk. (A) Titratable acidity. (B) Viable counts expressed as log10 CFU/mL. (C–E) Color parameters a*, b*, and L*, respectively. (F) CMC color difference (ΔEcmc). Data are presented as the mean ± SD (n = 3 independent biological replicates). Significant differences were determined relative to wt. * p < 0.05; ** p < 0.01.
Fermentation 12 00460 g003
Figure 4. The effects of budA and d-ldh mutations on the back-extrusion properties of fermented milk. (A) Firmness. (B) Consistency. (C) Cohesiveness. (D) The index of viscosity. Parameters were obtained from back-extrusion force–time curves for fermented milk prepared with wt, ΔbudA, and Δd-ldh. Data are presented as the mean ± SD (n = 5 independent biological replicates). Significant differences were determined relative to wt. ** p < 0.01.
Fermentation 12 00460 g004
Figure 5. Electronic nose analysis of fermented milk prepared with wt, ΔbudA, and Δd-ldh. (A) The PCA score plot based on the responses of ten electronic nose sensors. (B) The mean responses of sensors W1C, W5S, W3C, W6S, W5C, W1S, W1W, W2S, W2W, and W3S. Data are presented as the mean ± SD (n = 5 independent biological replicates).
Fermentation 12 00460 g005
Figure 6. Relative volatile profiles of fermented milk prepared with wt, ΔbudA, and Δd-ldh. Relative peak areas of (A) Acetoin; (B) 2,3-Butanedione; (C) 2,3-Pentanedione; (D) Acetaldehyde; (E) Acetic acid; (F) 2-Heptanone; (G) Butanoic acid; (H) Ethanol; (I) Acetone; (J) 3-Methyl-2-butanone; (K) 2-Butanone; (L) 2-Pentanone; (M) 3-Hydroxy-3-methyl-2-butanone; and (N) Hexanoic acid were determined by HS-SPME-GC-MS. Data are shown as the mean ± SD from five independent biological replicates per strain. Significant differences were determined relative to wt using one-way ANOVA followed by Dunnett’s multiple-comparisons test. * p < 0.05.
Fermentation 12 00460 g006
Disclaimer/Publisher’s Note: The statements, opinions and data contained in all publications are solely those of the individual author(s) and contributor(s) and not of MDPI and/or the editor(s). MDPI and/or the editor(s) disclaim responsibility for any injury to people or property resulting from any ideas, methods, instructions or products referred to in the content.