Abstract
This study investigates the impact of epigenetic modification on Saccharomyces cerevisiae using sodium butyrate (SB), a histone deacetylase inhibitor (HDACi), to enhance sensory characteristics in beer fermentation. Epigenetics offers a non-GMO approach to modifying gene expression, with potential for cost-effective strain development in brewing. A commercial ale yeast was cultured under different SB exposure regimes and used to ferment wort. Sensory evaluation was conducted with untrained participants, alongside GC-MS and enzymatic assays for ethanol, glycerol, and residual sugars. While no significant differences were found in ethanol production or smoothness and creaminess—likely due to uniform wort composition—flavor and taste scores varied between treatments. Notably, yeast pre-treated with SB but fermented without additional SB (1G W/O) received the highest flavor acceptability. Treatments involving SB during fermentation showed reduced sensory scores, likely due to butyric off-notes. Higher alcohol levels remained within acceptable thresholds and were more likely influenced by wort amino acid content than epigenetic modification. Though SB had a limited impact on metabolic pathways, this study highlights the feasibility of using dietary epigenetic modifiers to develop novel yeast strains with improved sensory profiles in beer or other fermented beverages and warrants further investigation with alternative compounds.
1. Introduction
Epigenetics is the study of phenotypic changes that occur through the alteration in gene expression in organisms. The heritable changes in gene expression predominantly occur through changes in the chromatin structure, more specifically altering the nucleotides and histones present in the chromatin structure. These gene expression mechanisms do not alter the DNA sequence in the organism; hence, epigenetics is considered as a non-GMO approach [1]. DNA methylation, a well-researched mechanism, mainly occurs by the transferring of a methyl group in at the 5th position of the pyrimidine ring of the cytosine residue [2]. Histone modification usually occurs at the amino acids of the N-terminal tails of histone proteins by the addition or removal of an acetyl group to the lysine reside. The addition of the acetyl group is known as acetylation while the removal of the acetyl group is called deacetylation. The post-translation modifications of histone proteins are controlled by histone acetyltransferases (HATs) and histone deacetylases (HDACs) [1].
Saccharomyces cerevisiae is a eukaryotic organism and is an ideal model for genetic analysis due to its small genome, both haploid and diploid genome, and its rapid cell cycle [3]. DNA methylation is extensively present in both plants and animals, and its absent presence in S. cerevisiae has led to histone modification, which is the epigenetic regulatory mechanism in this organism [4].
Epigenetic modifiers can modify genetic material to bring forth or suppress specific phenotypes in target organisms. Epigenetic modifiers are abundant and available as dietary nutrients in many foods. Many of these compounds are available as methyl donors, amino acids, vitamins, minerals, phytochemicals, and fatty acids [5]. This study focuses on sodium butyrate (SB), a fatty acid produced in the intestinal lumen by microbial fermentation. Sodium butyrate has been linked to many clinical studies [6] and has been shown to act as an HDAC inhibitor [7]. It hyperacetylates histones and loosens the chromatin structure, increasing accessibility of DNA and activating gene expression [8].
Consistent with previous work [9], sodium butyrate is a potent HDAC inhibitor in S. cerevisiae, capable of inducing histone modifications and altering phenotypes without DNA sequence changes. Kong et al. (2022) [9] investigated the HDAC inhibition capability of different HDAC modifiers. The study revealed that sodium butyrate had the highest HDAC inhibition of 17.6%, following curcumin. Sodium butyrate was chosen in this project due to its solubility and its cost-effectiveness [10]. Curcumin, in comparison, has poor solubility [11] and is prone to precipitate. Hence, sodium butyrate was chosen as the epigenetic modifier in this study.
This study aims to investigate and possibly develop a new S. cerevisiae strain with desirable sensory characteristics for brewing beer by treating the yeast with an epigenetic modifier, sodium butyrate. Sodium butyrate is a known HDACi and, therefore, was selected in addition to its low cost and solubility in aqueous solutions. This study looks at how S. cerevisiae, under the influence of sodium butyrate, affects the flavor and aroma profile of beer.
Beer is one of the most popular alcoholic drinks available on the market, with it being valued at USD 680.9 Billion in 2021 and, therefore, is a competitive industry [12]. The epigenetic modification of brewer’s yeast can be a cost-effective method for producing new strains, compared to the isolation of wild yeast, use of non-conventional yeast strains, and creating new malted grains or hops. This study attempts to demonstrate the possibility of using epigenetic modifiers like sodium butyrate to develop a non-GMO yeast strain with desirable sensory characteristics.
2. Materials and Methods
2.1. Culture Preparation and Pitching of Wort
A commercially available freeze-dried S. cerevisiae yeast, “London”, an English-style ale yeast (Lallemand Brewing, Montreal, QC, Canada), was used as the fermentation starter. Cultures were grown in YPD broth adjusted to pH~7, and sodium butyrate was added to a final concentration of 5 mM for pretreatment. Two types of broths were prepared with 300 mL of regular YPD and 200 mL of YPD with 5 mM sodium butyrate. The media was autoclaved at 121 °C for 15 min prior to inoculation. The yeast was dissolved in 7.5 mL of regular YPD and vortexed, followed by the transfer of 1 mL of the preparation into 25 mL of regular and 5 mM sodium butyrate YPD each. Five different treatments were produced using the regular YPD and 5 mM sodium butyrate YPD broth. These can be seen in Table 1.

Table 1.
Yeast treatment conditions.
2.2. Fermentation and Monitoring
The treatments were performed in triplicate. The wort provided by Three Boys Brewery (Woolston, Christchurch, New Zealand) were filled into 2 L Schott bottles, and each was pitched with the above-prepared yeast at 1 × 10⁶ CFU/mL. The fermentation was monitored for 13 days, and the vessels were kept at 20 °C in a water bath. The temperatures and specific gravity readings were taken throughout the 13-day fermentation process with a refractometer and digital thermometer respectively.
2.3. Sensory Analysis
A total number of nine untrained participants (n = 9) was recruited from Three Boys Brewery (Woolston, Christchurch, New Zealand). According to Lincoln University’s policies and procedures, they were asked to complete the consent form regarding human ethics before they started tasting the beer samples. A brief introduction was given to the participants at the beginning of the sensory session, and they were instructed to complete a questionnaire while tasting the beer samples. In the questionnaire, the participants were asked to rate the acceptability of six attributes of each beer sample, including taste, flavor, aroma, smoothness, creaminess, and overall liking. The acceptability test was based on a 9-point hedonic scale, which represents 9 hedonic responses using number 1 (dislike extremely) to 9 (like extremely), with a mutual response as 5 (neither like nor dislike). In the second part of the questionnaire, sweetness, sourness, dairy flavor, smoothness, and creaminess will be evaluated using the just-about-right-scale (JAR) in terms of both intensity and acceptability (1 = too little, 2 = just about right, 3 = too much). The last section of the questionnaire was the evaluation of emotional responses.
2.4. Ethanol and Higher Alcohol Analysis
2.4.1. Sample Preparation
A total of 0.9 mL of the sample was pipetted into a 20 mL amber SPME vial and diluted with 8.0 mL of 5 g/L tartaric acid buffer pH 3.5, and 40 µL of composite internal standard was added, followed by 4.5 g of sodium chloride before the vial was immediately capped.
2.4.2. Preparation of Working Standards
The composite standard was diluted in a suitable sample matrix (rotary evaporated to remove volatile background and reconstituted to give the sample ethanol content and pH, to prepare the top standard of the calibration curve). This was then serially diluted in the provided matrix to ensure each vial had a maximum volume of 0.9 mL of matrix present. Each vial was then diluted further with 8.0 mL of tartaric acid buffer, as in the samples, with 40 µL of composite internal standard being added followed by 4.5 g of sodium chloride before the vials were immediately capped.
2.4.3. GC-MS Instrumentation
GC-MS analysis was carried out according to Tomasino (2015) [13]. In brief, the samples were run on a Shimadzu QP2010 GC-MS (Shimadzu Scientific Instruments, Columbia, MD, USA). The columns used were two columns in a series, an Rtx-wax column (30 m × 0.25 mm ID × 0.5 µm film thickness, polyethylene glycol, Restek, Bellefonte, PA, USA) and an Rxi-1MS column (15 m × 0.25 mm ID × 0.5 µm film thickness, 100% dimethyl polysiloxane, Restek, Bellefonte, PA, USA). The carrier gas was helium, at a linear velocity of 33.5 cm/s. The GC-MS oven temperature was held at 35 °C for 3 min, then ramped to 250 °C at 4 °C/min and then held for 10 min. The interface and MS source temperature was set at 250 °C and 200 °C, respectively, with the MS source operated in electron impact (EI) mode at an ionisation energy of 70 eV.
2.5. Determination of Glycerol Concentration
The glycerol concentration of the five treatments was determined using a glycerol assay kit (K-GCROL 04/20) by Megazyme® (Megazyme, Wicklow, Ireland). The assay was conducted according to the manufacturer’s protocols with a few alterations to the sample volumes. All samples were prepared in 2.5 mL visible plastic cuvettes, with 1950 µL distilled water, 50 µL sample/standard and 100 µL buffer solution (solution 1), 50 µL solution 2 (NADH/ATP/PEP), and 10 µL of suspension 3 (PK/L-LDH), except for the blanks, where distilled water was 2000 µL. The samples/standards were incubated, and the absorbance was measured using UV-VIS spectrophotometer (Shimadzu UV-1800, Kyoto, Japan), followed by the calculation of the glycerol concentration according to the manufacturer’s instructions.
2.6. Determination of Residual Sugar Concentration
The residual sugar concentrations were determined using the enzymatic kit Vintessential Laboratories, Tasmania, Australia) for the determination of D-glucose and D-fructose in grape juice and wine. Samples did not require dilution, as the readings were within 1 g/L. The reagents were mixed with the sample according to manufacturer’s instructions, followed by seven times inversion of the cuvettes and an incubation time of 3 min. The absorbance readings were taken with a UV-VIS spectrophotometer (Shimadzu UV-1800, Kyoto, Japan). The calculations were conducted according to the manufacturer’s instructions.
2.7. Statistical Analysis
Data was analyzed using analysis of variance (ANOVA) with a generalized linear model, followed by post-hoc Tukey’s mean comparison test by using Minitab 20 (Minitab, LLC, State College, PA, USA). PCA and AHC were analyzed using XLSTAT Statistical Software 2016 (Addinsoft, Paris, France). A confidence level of 95% was applied to the statistical analysis, and the data were presented as mean ± SD.
3. Results and Discussion
3.1. Sensory
Table 2 shows the mean and standard error of the liking score of different sensory attributes in five different beer treatments. There were no significant differences in the overall liking score. Similarly, there was no significant difference in aroma, smoothness, and creaminess across the five treatments. There was no significant difference in taste between the control and sodium butyrate-treated wild-type strain, although there was a significant difference between SS W/O and SS SB. Furthermore, there was significant difference between the taste scores between SS SB and 1G W/O treatment. In terms of flavor, the 1G W/O treatment had the highest liking score. There was a significant difference between the acceptability score for flavor between treatments SS SB and 1G W/O.
Table 2.
Acceptability scores * of the five different treatments.
The epigenetically modified yeast-treated beer had different acceptability scores with regards to taste, while the treatment that did not contain sodium butyrate in the wort (SS W/O) had a higher acceptability score compared to the treated beer with sodium butyrate in it. Sodium butyrate (SB), which is a short-chain fatty acid, has shown functions as a histone modification inhibitor that has been used in clinical studies [14]. Although SB has shown promising results in the clinical field, it has its drawbacks due to its butyric smell and taste [15]. This would explain the results in terms of different acceptability scores for taste between the two epigenetically treated beers, SS W/O and SS SB. Yeast metabolism during fermentation mainly contributes to the sensory attributes such as flavor and aroma [16]. Attributes such as creaminess and smoothness are highly dependent on the wort. Hence, we do not see a significant difference between the treatments with regards to smoothness and creaminess, as the same wort was used for all five treatments. Overall, the acceptability scores across all sensory attributes were not high and could improve. As mentioned above, such low scores could be due to the negative sensory effects of sodium butyrate and other secondary metabolites present in the beer that will be discussed in later sections.
JAR sensory analysis was used in this experiment, as it is a tool used to link hedonic scales to the five specific attributes in the product being evaluated: smoothness, creaminess, sweetness, sourness, and dairy flavor.
This type of diagnostic tool helps determine which product attribute is liked or disliked, is efficient in time and resources, and is useful in screening experiments and product development.
Figure 1, Figure 2, Figure 3, Figure 4 and Figure 5 show the JAR frequencies (%) and mean drops based on the penalty analysis for the five different treatments regarding their sweetness, sourness, dairy flavor, smoothness, and creaminess. As shown in Figure 1, WT W/O had the highest selection of JAR for smoothness (78%) and creaminess (78%). The selection of “too much” was for both sweetness (33%) and sourness (33%), whereas the highest selection for “too little” was for sourness (44%). In Figure 2, WT SB had the highest selection of JAR for the same attributes for WT W/O with 89%, just about right. WT SB had the highest selection of “too little” for both sourness (22%) and dairy flavor (22%) in equal proportion, and “too much” for sourness (33%). With regards to epigenetically modified yeast without sodium butyrate (SS W/O) (Figure 3), all participants showed JAR selection for sweetness (100%) and smoothness (100%), while the highest selection of “too little” was for both sourness (22%) and dairy flavor (22%) and “too much” for sourness, dairy flavor, and creaminess with equal frequencies (11%). In Figure 4, SS SB had the highest portion of participants that selected JAR for smoothness (78%), while the highest selection of “too little” and “too much” was for sourness (33%). For 1G W/O (Figure 5), all participants selected JAR for smoothness (100%), while the highest selection of “too little” was for dairy flavor (33%), and no participants selected “too much” for any of the attributes.

Figure 1.
Just-about-right (JAR) frequencies and penalty analysis results regarding beer attributes for WT/WO. Penalty analysis was associated with overall liking scores (9-point hedonic scale). WT W/O: wild type S. cerevisiae continuously grown in YPD broth for 100 h/subculture every 20 h, without the addition of sodium butyrate.
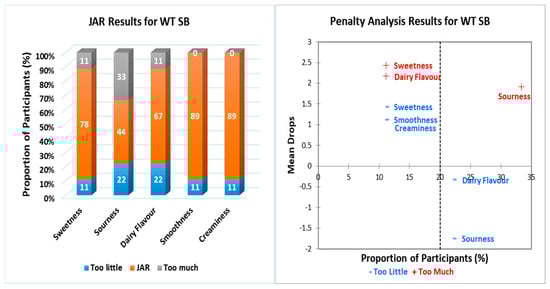
Figure 2.
Just-about-right (JAR) frequencies and penalty analysis results regarding beer attributes for WT SB. Penalty analysis was associated with overall liking scores (9-point hedonic scale). WT SB: wild type S. cerevisiae continuously grown in YPD broth for 100 h/subculture every 20 h, with 500 µM sodium butyrate addition during fermentation.

Figure 3.
Just-about-right (JAR) frequencies and penalty analysis results regarding beer attributes for SS W/O. Penalty analysis was associated with overall liking scores (9-point hedonic scale). SS W/O: S. cerevisiae continuously treated with 5 mM sodium butyrate for 100 h/subculture every 20 h, without the addition of sodium butyrate during fermentation.
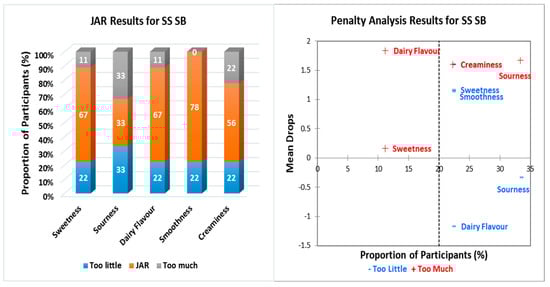
Figure 4.
Just-about-right (JAR) frequencies and penalty analysis results regarding beer attributes for SS SB. Penalty analysis was associated with overall liking scores (9-point hedonic scale). SS SB: S. cerevisiae continuously treated with 5 mM sodium butyrate for 100 h/subculture every 20 h, with 500 µM sodium butyrate addition during fermentation.

Figure 5.
Just-about-right (JAR) frequencies and penalty analysis results regarding beer attributes for 1G W/O. Penalty analysis was associated with overall liking scores (9-point hedonic scale).1G W/O: S. cerevisiae continuously treated with 5 mM sodium butyrate for 100 h/subculture every 20 h, followed by 20 h in YPD broth without sodium butyrate and without the addition of sodium butyrate during fermentation.
Penalty analysis was conducted based on both JAR frequencies and the overall liking scores of the 9-point hedonic scale. The threshold for population size was set at 20%, as shown in Figure 1, Figure 2, Figure 3, Figure 4 and Figure 5. Therefore, values below 20% were considered of no consequence, as the number of respondents was small. Figure 1 shows that the WT W/O had a positive mean drop for sweetness, meaning less people found the sweetness of the beer “too much”. The negative mean drop for sourness shows that more people found the WT W/O-treated beer to be “too sour”, although a higher respondent percentage found the sourness being “too little”. More than 20% of respondents found that the dairy flavor was “too little”. The penalty analysis, as shown in Figure 2, shows that less people found that dairy flavor JAR. Over 30% of respondents found the sourness just about right, while less than 25% of respondents thought the sourness was “too little”. The penalty analysis for SS W/O (Figure 3) shows that less people found the dairy flavor just about right, and a higher number of respondents found the sourness of the beer “too little”. Figure 4 shows that more people found that the creaminess is just about right. A similar percentage of respondents found that the sourness of the beer was “too little” and “too much”. Less people found the sweetness/smoothness “too little”, while less people found dairy flavor just about right. Figure 5 shows that, in the 1G W/O treatment, less people found the dairy flavor just about right.
In general, all treatments had a high JAR selection for smoothness (WT W/O: 78%; WT SB: 89%; SS W/O: 100%; SS SB: 78%; 1G W/O: 100%). These results aligned with the hedonic scale results. Likewise, creaminess JAR scores were of high percentage across all treatments and aligned with the results of the hedonic scale. As mentioned in Section 2.4.1, the creaminess and smoothness of the beer mainly depend on the type of wort and other fermentation parameters more than the yeast itself [15]. Hence, all treatments have high JAR scores. Attributes such as smoothness and creaminess can be deemed as positive attributes in the beer, although the JAR percentages did not have drastic differences from each other. The dairy flavor attribute is not normally considered as positive in context of beer. The JAR results and penalty analysis represent this, since the JAR scores were higher compared to the “too little” and “too much”. Moreover, the penalty analysis shows that few respondents found the beer to be JAR. The JAR and penalty analysis results, with regards to dairy flavor, could be attributed to the decision making of the respondents, where some respondents might find it difficult to compare the perceived intensity and ideal point of the attribute, estimate the ideal point of the attribute, and perceive the intensity of the attribute [17].
3.2. Ethanol and Higher Alcohol Anaysis
As shown in Table 3, there is no difference in average ethanol content (%) among the five different treatments. Even though Kong (2022) [9] showed that sodium butyrate has high HDAC inhibition, it is not a potent inhibitor and is not specific in its upregulation or downregulation [4].
Table 3.
Ethanol content * of different treatments after fermentation.
Though sodium butyrate has been shown to have some amount of gene expression, it may have been sufficient to change core metabolic pathways such as ethanol production. Hence, we do not see any changes in ethanol concentration between the five treatments.
As shown in Table 4, isoamyl alcohol had the highest concentration out of the higher alcohols detected by GC-MS analysis with a range between 44,959–55,924 µg/L. Benzaldehyde, cis-3-hexenol, and 1-heptanol were detected in trace amounts compared to the other fusel alcohols. The fusel alcohol concentrations were not significantly different between treatments; the exception is benzaldehyde, an aldehyde. The benzaldehyde results for the WT W/O and 1G W/O treatments had higher results compared to other treatments but also a larger standard deviation, which could explain the significant test difference.
Table 4.
Higher alcohol and aldehyde compounds (µg/L) * detected using GC-MS analysis in the five different treatments.
The principal component analysis (PCA) and agglomerative hierarchical clustering (AHC) results are shown in Figure 6. The PCA biplot visualizes the relationship between the five different beer treatments and variance of their higher alcohol compounds detected using GC-MS analysis. Isoamyl alcohol, 1-heptanol, and hexanol were closely aligned with each other along the PC1 axis. Isoamyl alcohol and hexanol showed positive correlation due to the small angle formed between the compounds. Isoamyl alcohol and 1-heptanol also showed positive correlation between the two higher alcohols. Additionally, cis-3-hexanol was not well correlated with isoamyl alcohol, as the two are almost perpendicular to each other, while cis-3-hexanol are not correlated to each other due to being perpendicular to each other. The five treatments could be categorized into three classes: class 1, WT W/O and SS SB; class 2, WT SB; and class 3, SS W/O and 1G W/O.
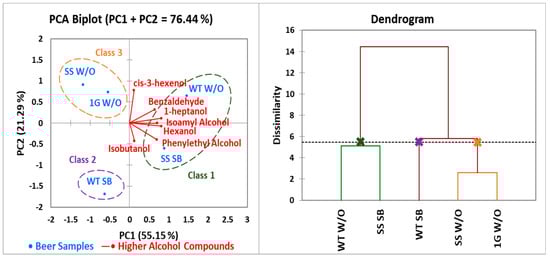
Figure 6.
Principal component analysis (PCA) biplot illustrating the relationship between beer samples fermented under different conditions and variance on their higher alcohol compounds (left); Beer samples grouped using agglomerative hierarchical clustering (HCA) according to their dissimilarity levels of GC-MS analysis (right).
The dendrogram based on AHC according to the dissimilarity levels of GC-MS analysis (Figure 6; right) shows that two main clusters were formed. The WT W/O and SS SB were similar, which was one cluster, and the second cluster consisted of SS W/O and 1G W/O treatment.
Higher alcohols are secondary metabolites that can have either a positive or negative effect on the flavor and aroma of the beer. The higher alcohols that were identified using GC-MS analysis are commonly found in beer and other alcoholic beverages. Isoamyl alcohol, which is the most abundantly found secondary metabolite in beer, showed the highest concentration throughout all five treatments. As isoamyl alcohol concentrations increase in beer, sensory analysis has shown that beer seems to have a “heavier” characteristic and influences drinkability of the beer [18], although there was no significant difference amongst the treatments for isoamyl alcohol. The isoamyl alcohol, which is detected above the threshold level in fruits such as banana, oranges, mango, and pineapple, imparts a banana characteristic in beer [19]. Isobutanol, which has similar sensory characteristics to amyl alcohols, further intensifies the sensory profile of isoamyl alcohol significantly [19]. All treatments were well below the threshold level (100 mg/L) with regards to isobutanol, while isoamyl alcohol fell within the threshold range (50–65 mg/L) [20] for all treatments except WT SB. The biosynthesis of higher alcohols is either through glycolysis, or the metabolism of amino acids present in the wort, also known as the Ehrlich pathway [21]. Therefore, a higher amount of amino acids present in the wort could have led to a higher isoamyl alcohol content throughout all treatments. There was no significant difference in isoamyl alcohol concentration between treatments; therefore, genes that encode nitrogen-sourced metabolic enzymes such as GAT1 GLN3 DAL80 and GZF3 [21] were either upregulated or downregulated. The AHC (Figure 6; right) shows that the WT W/O and SS SB were of the same cluster, which further proves that sodium butyrate did not have a substantial effect on the fusel alcohol profile of the beer.
3.3. Glycerol
Table 5 shows the glycerol content of the five different fermentation treatments. The epigenetically modified yeast did not produce higher or lower amounts of glycerol compared to the wild-type strains. Glycerol is one of the core metabolic pathways in yeast fermentation. Similar to the ethanol results, it is proposed that the sodium butyrate did not have sufficient capacity to make a significant enough regulation in gene expression that would change the core metabolic pathways. Hence, the glycerol concentration between the five treatments was not significantly different from each other.
Table 5.
Mean glycerol content of fermented wort after treatments *.
3.4. Residual Sugars
There was no significant difference in average D-glucose and D-fructose concentrations (g/L) throughout the five treatments (Table 6).
Table 6.
Mean D-glucose, D-fructose and total residual sugar concentrations (g/L) of the five different treatments *.
The WT W/O and SS SB showed similar total residual concentrations and were not significantly different from each with values of 0.086 and 0.076 g/L, respectively. Therefore, SB does not seem to have an effect on the metabolic pathway with regards to the metabolism of sugars present in the wort. Furthermore, WT SB, SS W/O and 1G W/O total residual sugar concentrations were not significantly different from each other.
4. Conclusions
This project investigated the potential effects of sodium butyrate on beer and how it affects certain sensory and biochemical characteristics of beer. Sensory results show that there was not much difference between treatments except for certain sensory attributes. SB showed a negative impact in terms of taste due to its butyric taste and was observed evidently between SS W/O and SS SB.
The ethanol concentration between different treatments did not show significant difference amongst the five treatments. Even though previous studies have shown that sodium butyrate has a high HDAC inhibition capacity, recent studies on prokaryotes have shown that, even though sodium butyrate has a high HDAC inhibition capacity compared to other epigenetic modifiers such as curcumin, genistein, and benzoic acid, sodium butyrate can regulate only a limited amount of genes compared to modifiers such as genistein [22]. The limited regulation of genes could have led to key metabolic pathways such as ethanol and glycerol production not being altered. Higher alcohols such as isobutanol and isoamyl alcohol, which are abundantly found in beer, were well detected across all treatments. The isoamyl alcohol content, which was within the threshold range, could be due to the higher amount of amino acids present in the wort more so than due to the epigenetic effect of sodium butyrate, since all treatments were within the range of the threshold.
Our pretreatment regime of 5 mM sodium butyrate in YPD broth for 100 h was selected based on studies demonstrating HDAC inhibition and histone modifications in S. cerevisiae. Kong et al. (2022) [9] reported that sodium butyrate is among the most potent dietary HDAC inhibitors, capable of altering yeast phenotypes epigenetically without DNA sequence changes, supporting our interpretation that the fermentation outcomes observed here may be mediated through epigenetic mechanisms.
Although the culture pH was ~7, above the pKa of butyric acid (~4.8) and, thus, most butyrate was in its dissociated form, sodium butyrate retained HDAC inhibitory activity under these conditions. This indicates that epigenetic modulation can still occur even when passive uptake is reduced.
The commercial ale yeast strain used is likely polyploid or aneuploid, as is common among brewing strains. Such genetic variation can buffer stress and alter transcriptional responses, which may have influenced the magnitude of sodium butyrate’s effects.
Even though sodium butyrate was not able to have a significant effect on the metabolic pathways of the yeast, other compounds can be explored to be utilized in creating epigenetically modified non-GMO yeast.
Author Contributions
Conceptualization, V.C. and L.V.; investigation; S.P. and Y.K.; writing—original draft preparation, S.P. and Y.K.; writing—review and editing, L.V. and V.C. All authors have read and agreed to the published version of the manuscript.
Funding
This research was funded by Department of Wine, Food, and Molecular Biosciences, Faculty of Agriculture and Life Sciences, Lincoln Univeristy, New Zealand.
Institutional Review Board Statement
This study was conducted according to the guidelines of the Human Ethics Committee of Lincoln University for sensory analysis. Approval number HEC2023-73. Approval date: 4 December 2023.
Informed Consent Statement
Informed consent was obtained from all subjects involved in the study.
Data Availability Statement
Not applicable.
Acknowledgments
Ralph Bungard and the Brewery Crew, Three Boys Brewery, Woolston, Christchurch, New Zealand, for providing the wort and tasting palates.
Conflicts of Interest
The authors declare no conflicts of interest.
References
- Bajbouj, K.; Al-Ali, A.; Ramakrishnan, R.K.; Saber-Ayad, M.; Hamid, Q. Histone modification in NSCLC: Molecular mechanisms and therapeutic targets. Int. J. Mol. Sci. 2021, 22, 11701. [Google Scholar] [CrossRef] [PubMed]
- Barre, P.; Vezinhet, F.; Dequin, S.; Blondin, B. Genetic improvement of wine yeasts. In Wine Microbiology and Biotechnology; Fleet, G.H., Ed.; Taylor & Francis: London, UK, 1993; Volume 1, pp. 265–288. [Google Scholar]
- Butler, L.M.; Zhou, X.; Xu, W.-S.; Scher, H.I.; Rifkind, R.A.; Marks, P.A.; Richon, V.M. The histone deacetylase inhibitor SAHA arrests cancer cell growth, up-regulates thioredoxin-binding protein-2, and down-regulates thioredoxin. Proc. Natl. Acad. Sci. USA 2002, 99, 11700–11705. [Google Scholar] [CrossRef] [PubMed]
- Carmen, A.A.; Rundlett, S.E.; Grunstein, M. HDA1 and HDA3 are components of a yeast histone deacetylase (HDA) complex. J. Biol. Chem. 1996, 271, 15837–15844. [Google Scholar] [CrossRef] [PubMed]
- González-Becerra, K.; Ramos-López, O.; Barrón-Cabrera, E.; Riezu-Boj, J.I.; Milagro, F.; Martínez-López, E.; Martínez, J. Fatty acids, epigenetic mechanisms and chronic diseases: A systematic review. Lipids Health Dis. 2019, 18, 178. [Google Scholar] [CrossRef] [PubMed]
- de Clercq, N.C.; Groen, A.K.; Romijn, J.A.; Nieuwdorp, M. Gut microbiota in obesity and undernutrition. Adv. Nutr. 2016, 7, 1080–1089. [Google Scholar] [CrossRef] [PubMed]
- Liu, H.; Wang, J.; He, T.; Becker, S.; Zhang, G.; Li, D.; Ma, X. Butyrate: A double-edged sword for health? Adv. Nutr. 2018, 9, 21–29. [Google Scholar] [CrossRef] [PubMed]
- Sanchez, H.N.; Moroney, J.B.; Gan, H.; Shen, T.; Im, J.L.; Li, T.; Taylor, J.R.; Zan, H.; Casali, P. B cell-intrinsic epigenetic modulation of antibody responses by dietary fiber-derived short-chain fatty acids. Nat. Commun. 2020, 11, 60. [Google Scholar] [CrossRef] [PubMed]
- Kong, Y.; Olejar, K.J.; On, S.L.; Winefield, C.; Wescombe, P.A.; Brennan, C.S.; Hider, R.N.; Chelikani, V. Epigenetic changes in Saccharomyces cerevisiae alters the aromatic profile in alcoholic fermentation. Appl. Environ. Microbiol. 2022, 88, e0152822. [Google Scholar] [CrossRef] [PubMed]
- Zhu, W.; Gao, J.; Liu, H.; Liu, J.; Jin, T.; Qin, N.; Ren, X. Antibiofilm effect of sodium butyrate against Vibrio parahaemolyticus. Food Control 2022, 131, 108422. [Google Scholar] [CrossRef]
- Jagannathan, R.; Abraham, P.M.; Poddar, P. Temperature-dependent spectroscopic evidences of curcumin in aqueous medium: A mechanistic study of its solubility and stability. J. Phys. Chem. B 2012, 116, 14533–14540. [Google Scholar] [CrossRef] [PubMed]
- Grand View Research. Beer Market Size, Share & Trends Analysis Report by Product (Lager, Ale, Stout), by Packaging (Bottles, Cans), by Production (Macro, Micro, Craft), by Distribution Channel (On-Trade, Off-Trade), by Region, and Segment Forecasts, 2025–2030. Available online: https://www.grandviewresearch.com/industry-analysis/beer-market (accessed on 4 July 2025).
- Tomasino, E.; Harrison, R.; Breitmeyer, J.; Sedcole, R.; Sherlock, R.; Frost, A. Aroma composition of 2-year-old New Zealand Pinot noir wine and its relationship to sensory characteristics using canonical correlation analysis and addition/omission tests. Aust. J. Grape Wine Res. 2015, 21, 376–388. [Google Scholar] [CrossRef]
- Terova, G.; Díaz, N.; Rimoldi, S.; Ceccotti, C.; Gliozheni, E.; Piferrer, F. Effects of sodium butyrate treatment on histone modifications and the expression of genes related to epigenetic regulatory mechanisms and immune response in European sea bass (Dicentrarchus labrax) fed a plant-based diet. PLoS ONE 2016, 11, e0160332. [Google Scholar] [CrossRef] [PubMed]
- Mattace Raso, G.; Simeoli, R.; Russo, R.; Iacono, A.; Santoro, A.; Paciello, O.; Ferrante, M.C.; Canani, R.B.; Calignano, A.; Meli, R. Effects of sodium butyrate and its synthetic amide derivative on liver inflammation and glucose tolerance in an animal model of steatosis induced by high fat diet. PLoS ONE 2013, 8, e68626. [Google Scholar] [CrossRef] [PubMed]
- Olaniran, A.O.; Hiralal, L.; Mokoena, M.P.; Pillay, B. Flavour-active volatile compounds in beer: Production, regulation and control. J. Inst. Brew. 2017, 123, 13–23. [Google Scholar] [CrossRef]
- Li, B.; Hayes, J.E.; Ziegler, G.R. Just-about-right and ideal scaling provide similar insights into the influence of sensory attributes on liking. Food Qual. Prefer. 2014, 37, 71–78. [Google Scholar] [CrossRef] [PubMed]
- Kucharczyk, K.; Żyła, K.; Tuszyński, T. Volatile esters and fusel alcohol concentrations in beer optimized by modulation of main fermentation parameters in an industrial plant. Processes 2020, 8, 769. [Google Scholar] [CrossRef]
- Holt, S.; Miks, M.H.; de Carvalho, B.T.; Foulquie-Moreno, M.R.; Thevelein, J.M. The molecular biology of fruity and floral aromas in beer and other alcoholic beverages. FEMS Microbiol. Rev. 2019, 43, 193–222. [Google Scholar] [CrossRef] [PubMed]
- Pires, E.J.; Teixeira, J.A.; Brányik, T.; Vicente, A.A. Yeast: The soul of beer’s aroma-a review of flavour-active esters and higher alcohols produced by the brewing yeast. Appl. Microbiol. Biotechnol. 2014, 98, 1937–1949. [Google Scholar] [CrossRef] [PubMed]
- Wang, Y.-P.; Liu, L.; Wang, X.-S.; Hong, K.-Q.; Zhang, L.-H.; Sun, Z.-G.; Xiao, D.-G. GAT1 gene, the GATA transcription activator, regulates the production of higher alcohol during Wheat beer fermentation by Saccharomyces cerevisiae. Bioengineering 2021, 8, 61. [Google Scholar] [CrossRef] [PubMed]
- Kong, Y.; Adejoro, D.O.; Wescombe, W.A.; Winefield, C.; On, S.L.W.; Mitchell, N.L.; Subbaraj, A.; Saunders, A.; Maes, E.; Chelikani, V. Dietary bioactive compounds trigger distinct epigenetic and metabolic reprogramming in Lactobacillus acidophilus. bioRxiv 2024. [Google Scholar] [CrossRef]
Disclaimer/Publisher’s Note: The statements, opinions and data contained in all publications are solely those of the individual author(s) and contributor(s) and not of MDPI and/or the editor(s). MDPI and/or the editor(s) disclaim responsibility for any injury to people or property resulting from any ideas, methods, instructions or products referred to in the content. |
© 2025 by the authors. Licensee MDPI, Basel, Switzerland. This article is an open access article distributed under the terms and conditions of the Creative Commons Attribution (CC BY) license (https://creativecommons.org/licenses/by/4.0/).