Article

Phenolic Evolution During Industrial Red Wine Fermentations with Different Sequential Air Injection Regimes

by
Paula A. Peña-Martínez
1,2,
Alvaro Peña-Neira
3 and
V. Felipe Laurie
2,*
1
Doctorado en Ciencias Agrarias, Facultad de Ciencias Agrarias, Universidad de Talca, Av. Lircay s/n, Talca 3460000, Chile
2
Departamento de Horticultura, Facultad de Ciencias Agrarias, Universidad de Talca, Av. Lircay s/n, Talca 3460000, Chile
3
Departamento de Agroindustria y Enología, Facultad de Ciencias Agronómicas, Universidad de Chile, Santa Rosa 11315, La Pintana, Santiago 8820808, Chile
*
Author to whom correspondence should be addressed.
Fermentation 2025, 11(8), 446; https://doi.org/10.3390/fermentation11080446
Submission received: 27 June 2025 / Revised: 22 July 2025 / Accepted: 29 July 2025 / Published: 31 July 2025
(This article belongs to the Special Issue Biotechnology in Winemaking)

Abstract

During red wine production, managing the pomace cap is key for a successful fermentation, allowing the extraction of phenolics and other metabolites and providing the necessary oxygen for yeast activity. In recent years, automatic cap management systems based on the injection of gases have gained popularity, despite the limited scientific information regarding the outcomes of their use. This trial aimed to evaluate the composition of wine during industrial red wine fermentations using an automatic sequential air injection system (i.e., AirMixing MITM). Fourteen lots of Cabernet Sauvignon grapes were fermented using four air injection regimes, where the intensity and daily frequency of air injections were set to either low or high. As expected, the treatment combining high-intensity and high-frequency air injection produced the largest dissolved oxygen peaks reaching up to 1.9 mg L−1 per cycle, compared to 0.1 mg L−1 in the low-intensity and low-frequency treatment. Yet, in all cases, little to no accumulation of oxygen overtime was observed. Regarding phenolics, the highest intensity and frequency of air injections led to the fastest increase in total phenolics, anthocyanins, short polymeric pigments, and tannin concentration, although compositional differences among treatments equilibrate by the end of fermentation. The main differences in phenolic compounds observed during fermentation were mediated by temperature variation among wine tanks. Based on these findings, it is advisable to keep the characterizing kinetics of phenolic extraction and expand the study to the aroma evolution of wines fermented with this technology.

1. Introduction

The phenolic content of wines is influenced by variables such as grape variety, vine growing conditions, viticultural practices, and the wine processing techniques employed during elaboration [1,2,3,4]. Conventional red wine production involves fermenting grape juice in contact with skins and seeds, in a process mainly intended to promote the extraction of compounds located within berry cells, particularly phenolics, which influence wine characteristics such as pigmentation, astringency, and biological properties [5,6,7].
As fermentation progresses, the increasing ethanol concentration lowers the matrix polarity, which along the temperature and duration of the maceration, influences the extraction of phenolic compounds, polysaccharides, and other grape constituents [8,9]. For instance, most of the anthocyanins are extracted from berry skins during the first days of fermentation, when the ethanol concentration is low [10]. Alternatively, condensed tannins (i.e., proanthocyanidins) are extracted more slowly, mainly because of their location (i.e., skins tannins are extracted earlier than seed tannins), molecular size, the influence of an increasing ethanol concentration, etc. [11,12]. In general, longer maceration times result in higher tannin concentrations, as more of these polymerized phenolics are extracted from the seeds over time [13,14,15].
The concentration of chemical substances extracted from grape berries can also be influenced by their re-adsorption onto grape or yeast cell wall materials (and their eventual partial precipitation) [16], as well as by reactions with other wine components such as proteins and acetaldehydes, among others [17,18]. The letter helps explain why the concentration of anthocyanins during fermentation typically follows a two-phase pattern, starting with a rapid increase, followed by a stabilization phase and slight decrease occurring by the end of the fermentation [19,20,21]. Instead, tannins may undergo several transformations, including their reaction with other wine compounds (e.g., anthocyanins) and hydrolytic losses such as acid hydrolysis, which modify their concentration over time [14,21].
During red wine fermentation, the carbon dioxide (CO2) produced by yeast pushes the skins and seeds towards the surface of the must, forming a pomace cap that reduces the surface area of solids in contact with the liquid fraction, thus requiring homogenization treatments (e.g., “pump overs”) to enhance extraction, minimize spoilage, dissipate heat, and introduce oxygen to the must [21,22,23]. These treatments are typically carried out at specific time intervals to favor the fermentation process [21,22,24] or achieve a given phenolic extraction yield, which is usually determined by tasting. Unfortunately, relying solely on the sensory perception of phenolics may be ineffective, as residual sugars can mask part of their contribution to the astringent and bitter taste of wine [25,26].
In addition to traditional homogenization methods such as must pump-overs and pomace punch-downs, automatic and semi-automatic processes have become increasingly common. Most notably, these include automatic pump circuits and punch-down plungers, automatic fermenters (e.g., gas pressure build and release systems), or alternatives that rely on the injection of pressurized gases near the bottom of the tanks [21,27,28]. Most of these methods help break up the pomace cap and temporarily mix the skins and seeds with the liquid fraction, but some may even prevent its formation, if enough mixing is applied [28]. Moreover, some of these systems may even ease the racking process once fermentation is complete, by creating a suspension of solids that can be pumped out of the fermentation tank through a large-diameter racking valve.
Recently, automatic cap management systems based on air injection, such as the AirMixing M.I.® system (Parsec, Florence, Italy), have become increasingly popular. The procedure involves the sequential and modulated injection of air through several nozzles placed in the lower part of the tank, creating liquid waves that can break or prevent the formation of the pomace cap [28,29,30], while potentially enhancing oxygen dissolution. Scientific papers reporting the use of AirMixing describe more uniform environments, with less temperature stratification inside the tanks, faster fermentations, and greater extraction than in pumped-over controls [28,29,30]. Although valuable, these results should be interpreted with caution due to certain experimental constraints such as the lack of industrial-scale replications in one study [29] and the differing conditions compared in others [6,8,31,32].
Consequently, while previous studies have highlighted the potential benefits of automatic air injections during wine fermentation, more research is required to characterize their outcomes on an industrial scale. Therefore, the aim of this trial was to evaluate the effects of contrasting air injections treatments on phenol extraction dynamics during industrial-scale red wine fermentations, as well as on oxygen dissolution and overall must composition.

2. Materials and Methods

2.1. Experimental Design

In this trial, 14 large-scale red wine fermentations of Cabernet Sauvignon grapes, obtained from a vineyard in Pelluhue, Chile, were conducted independently in stainless steel tanks (i.e., 300,000 L; 10 m height and 6 m diameter) equipped with the air injection system AirMixing MITM (Parsec, Italy). Cap management was carried out by injecting pressurized air from six electromagnetic valves located near the bottom of the tanks (Supplementary Figure S1a), with a sequence of valve opening and closing per cycle following the proprietary design of the company Parsec.
Each fermentation was carried out using a specific combination of one air injection intensity and one frequency level, as defined below:
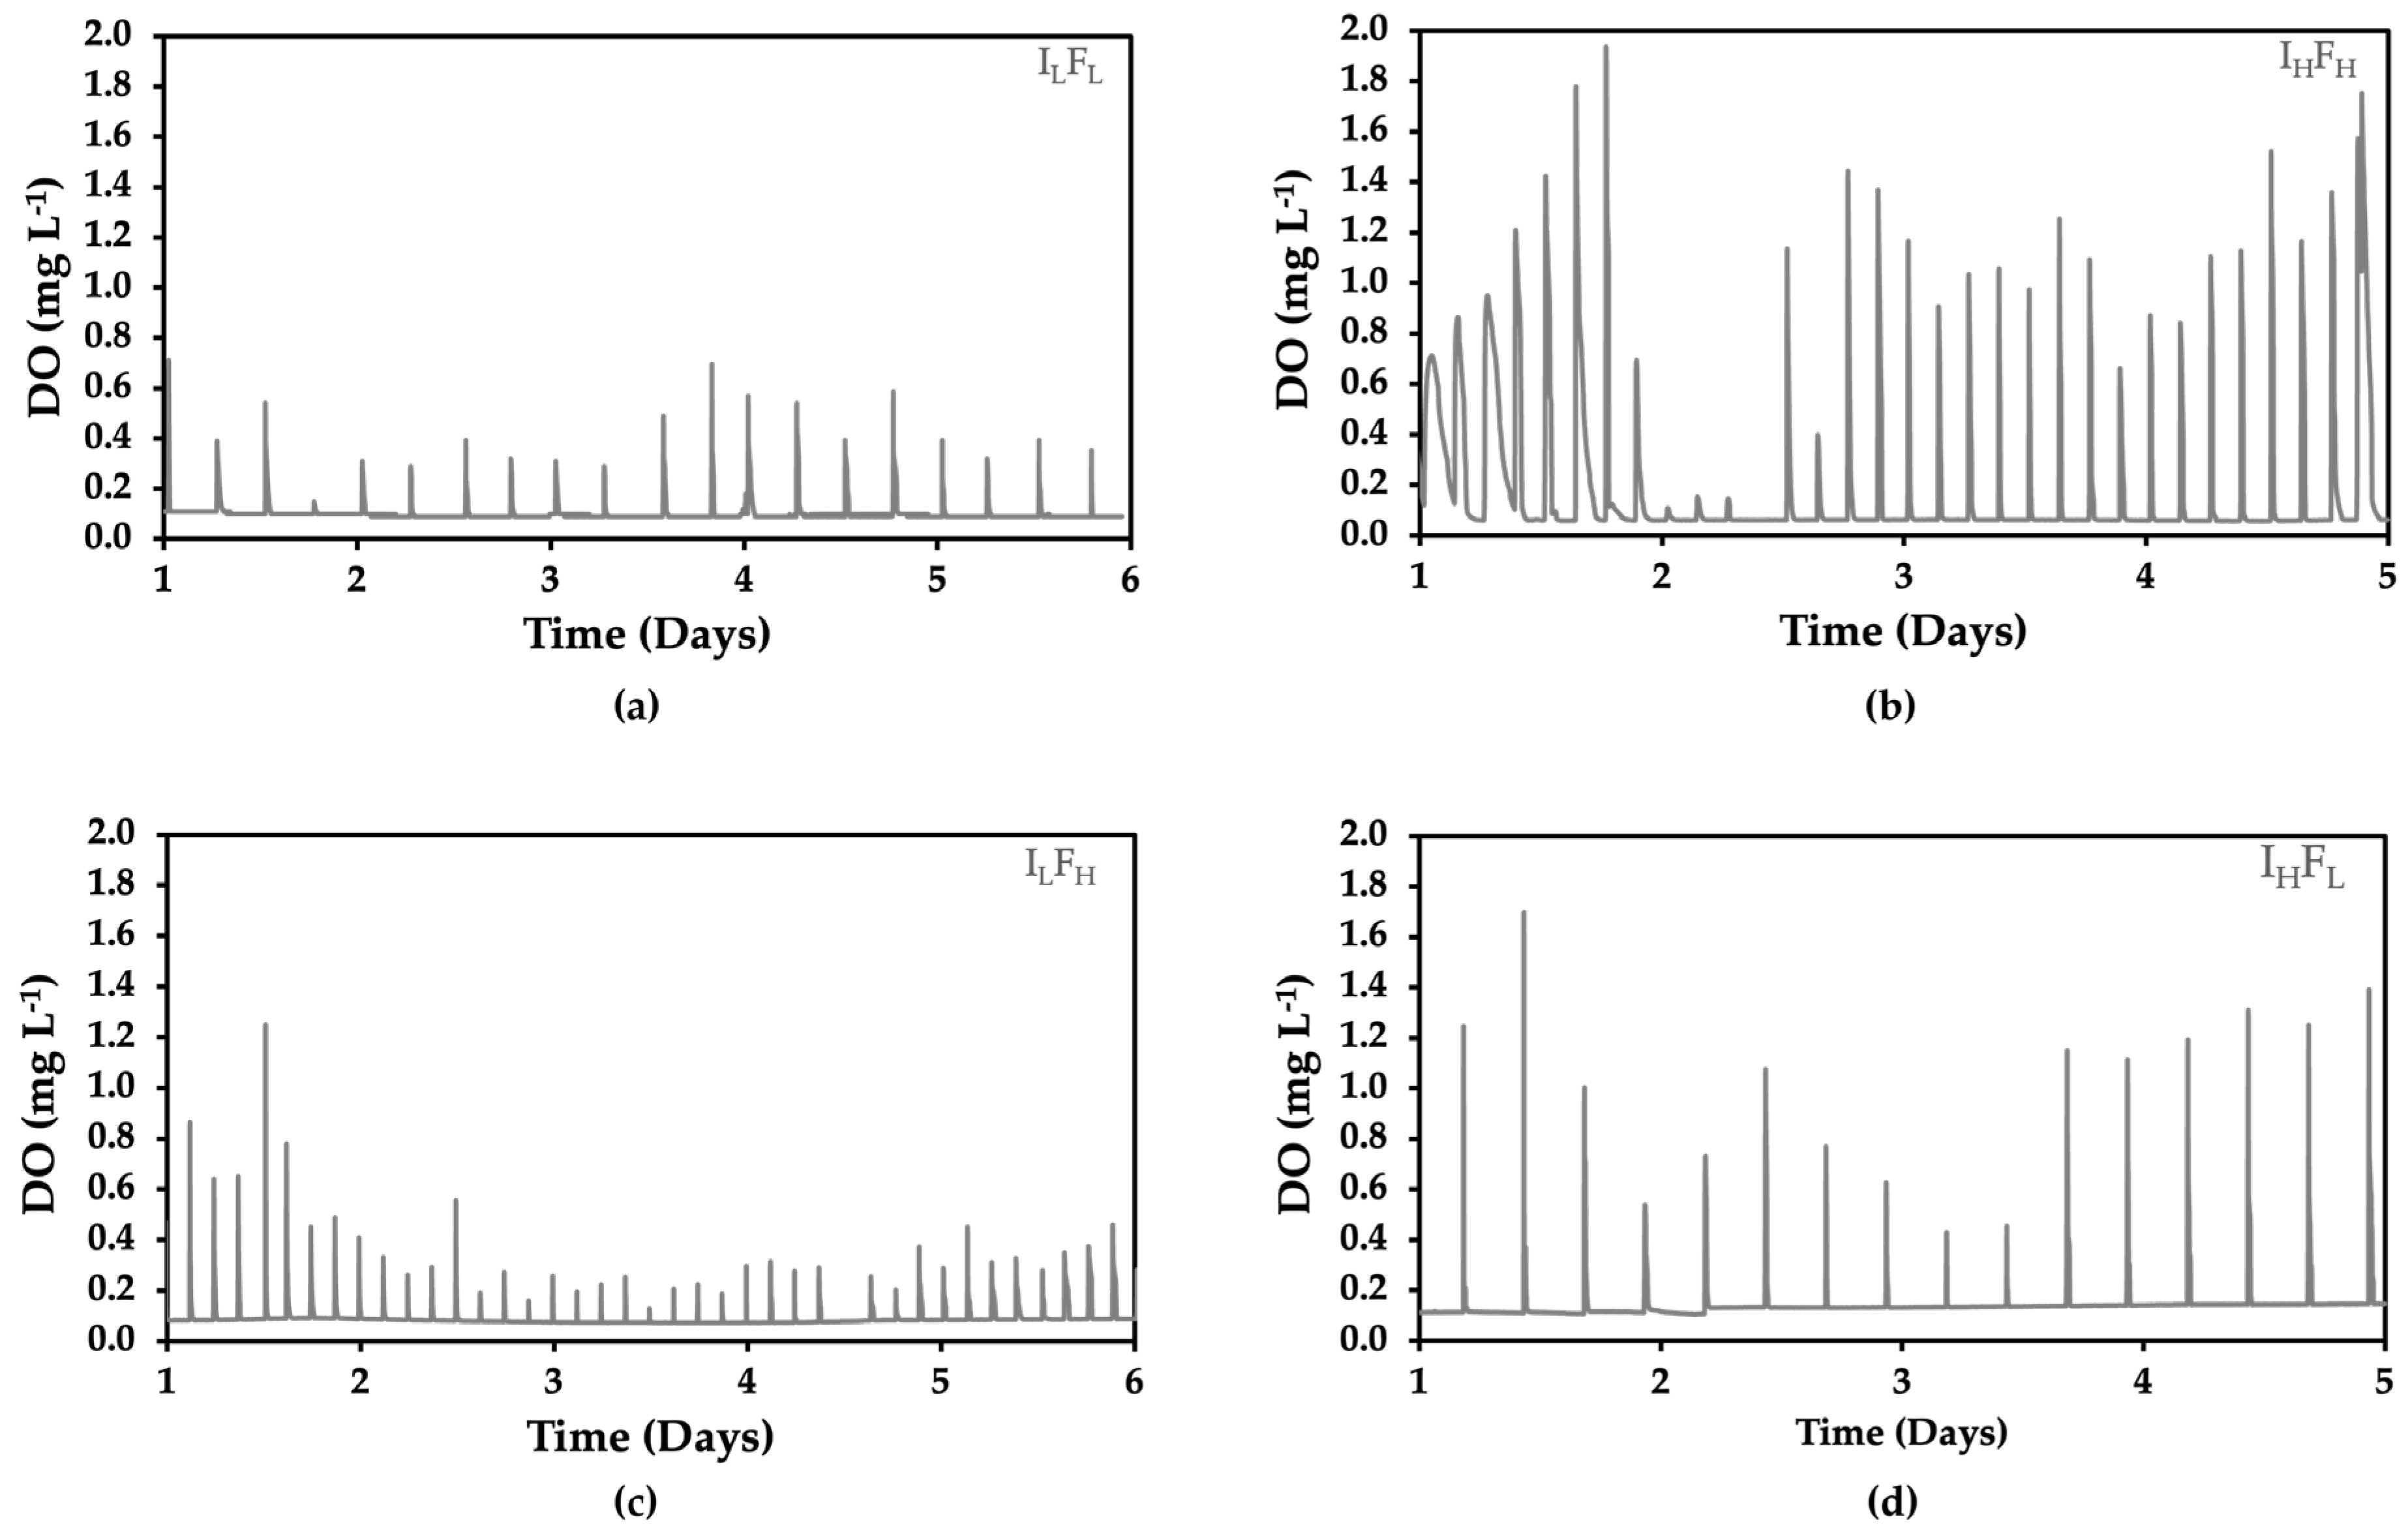
  • Intensity low (IL): Approximately 40 s of air injection per cycle.
  • Intensity high (IH): Approximately 100 s of air injection per cycle.
  • Frequency low (FL): 4 cycles of air injection per day.
  • Frequency high (FH): 8 cycles of air injection per day.
This experimental design resulted in four distinct air injection treatment combinations: IL × FL, IH × FH, IL × FH, and IH × FL. For treatments IL × FL and IH × FH, four independent fermentation replicates were conducted. For the IL × FH and IH × FL treatments, three replicates were carried out.
Other fermentation conditions were kept the same, including yeast type (i.e., Saccharomyces cerevisiae, Viniferm® PDM, Agrovin, Ciudad Real, España), nutrient addition (i.e., 20 g/hL of diammonium phosphate, Partner S.A.©, Santiago, Chile), fermentation temperature (i.e., 28 ± 0.1 °C), tank filling level (i.e., 85% of their capacity), and tannin addition (i.e., 10 g/hL of TANIN VR SUPRATM; corresponding to a combination of ellagic and proanthocyanidic tannins, from LAFFORT®, Paine, Chile [33]).

2.2. Dissolved Oxygen During Fermentation

The concentration of dissolved oxygen (DO) throughout fermentation was repeatedly measured in four tanks, with each of them representing one of the air injection regimes studied (i.e., IL x FL; IL x FH; IH x FL; IH x FH).
A submergible DO meter with a data logger (i.e., miniDOT® Logger, PME©, Vista, CA, USA), based on fluorescence extinction technology, was placed at the center of the tanks, at about a 5 m height from the bottom, and below the pomace cap. The DO meter was attached to a 12 m high stainless steel tubing placed vertically through the upper manhole of the tank, which was fixed at the center of the bottom using stainless steel wire (Supplementary Figure S1b). The meter was set to record the concentration of DO every second and placed inside the tank right before it was filled, and it remained submerged until the fermentation was complete. The DO meter was calibrated as indicated by the manufacturer’s instructions and compared against a NomaSenseTM O2 m (Vinventions, Thimister-Clermont, Belgium). Calibration involved using sodium sulfite solutions (i.e., 10 g L−1 of Na2SO3) in a hermetic glass container with a screw top to set the 0 mg L−1 DO point, and air saturation with a magnetic stirrer to achieve 7 mg L−1 DO, using the same container without the lid (Supplementary Figure S1d). DO measurements with the NomaSenseTM O2 m were performed according to the protocol described by Moenne et al. and del Alamo et al. [34,35]. To corroborate the results of the miniDOT® logger, DO was also measured using the NomaSenseTM oxygen meter (Supplementary Figure S3). PSt3 sensors were glued to the inner wall of a sight glass connected to a liquid pumping circuit between the drainage and racking valves of the tank, allowing oxygen readings from the exterior of the tanks as previously reported by Calderon et al. and Laurie et al. [36,37] (Supplementary Figure S1c). These measurements were taken on day 4 of alcoholic fermentation.

2.3. Chemical Composition

The physicochemical characteristics of the must were evaluated at 0 (i.e., tank filling and yeast inoculation time), 2, 4, and 6 days of alcoholic fermentation, as further explained below.
Juice/wine samples were collected from the sampling valve of each tank according to the following protocol: after sanitizing the sampling valve with a solution of 70% ethanol and emptying 1000 mL of musts/wine into a waste container. Samples were collected at days 0, 2, 4, and 6 of fermentation. On each sampling day, ten polypropylene conical 50 mL centrifuge tubes (VWR®, Radnor, PA, USA) were filled per tank to ensure sufficient volume for all planned analyses, including analytical replicates and counter-samples for potential reanalysis. In all cases, sampling was performed right after a cycle of air injection to ensure the collection of samples as representative as possible. Special attention was also given to avoid the presence of skin and seed inside the tubes using a stainless steel strainer of 1 mm mesh size (18 mesh number). Samples were immediately analyzed for pH, and ethanol and the remaining volume was frozen at −40 °C until the rest of the analyses indicated below were performed. Before chemical analysis, samples were gently thawed, stabilized at 19 °C, centrifuged for 5 min at 10.000 rpm (TG1650-WS Bioridge® Centrifuge, Shanghai, China), and filtered with PTFE syringe filters of 30 mm with a 0.45 µm pore size (Jet Biofil©, Guangzhou, China).

2.3.1. General Physicochemical Measurements

Must/wine pH was measured by potentiometry (Thermo OrionTM Meter 4310, Thermo Fisher ScientificTM, Waltham, MA, USA) using the methodology and calibrations indicated by the OIV (OIV-MA-AS313-15), whilst soluble solids (°Brix) were followed using a digital refractometer (MA871, Milwaukee Instruments®, Rocky Mount, NC, USA), following the OIV-MA-AS311-01 protocol. Additionally, the sum of glucose and fructose (G_F), iron, and glycerol were determined using an automatic analyzer for wine samples (Biosystems© Y15, Barcelona, España) employing chemical or enzymatic kits (Biosystems references 12800, 12817, 12814, 12812, respectively). Ethanol (% v/v) was measured using a manual ebulliometer (reference 160020, Dujardin-Salleron®, Noizay, France). Color measurements were evaluated spectrophotometrically using CIELab (L, a*, b*) space coordinates obtained from absorbance measurements at 450, 520, 570, and 630 nm using the software MSCV® (Grupo de Color, Departamento de Química, Universidad de la Rioja, Logroño, España). Additionally, intensity and hue were also measured [38].

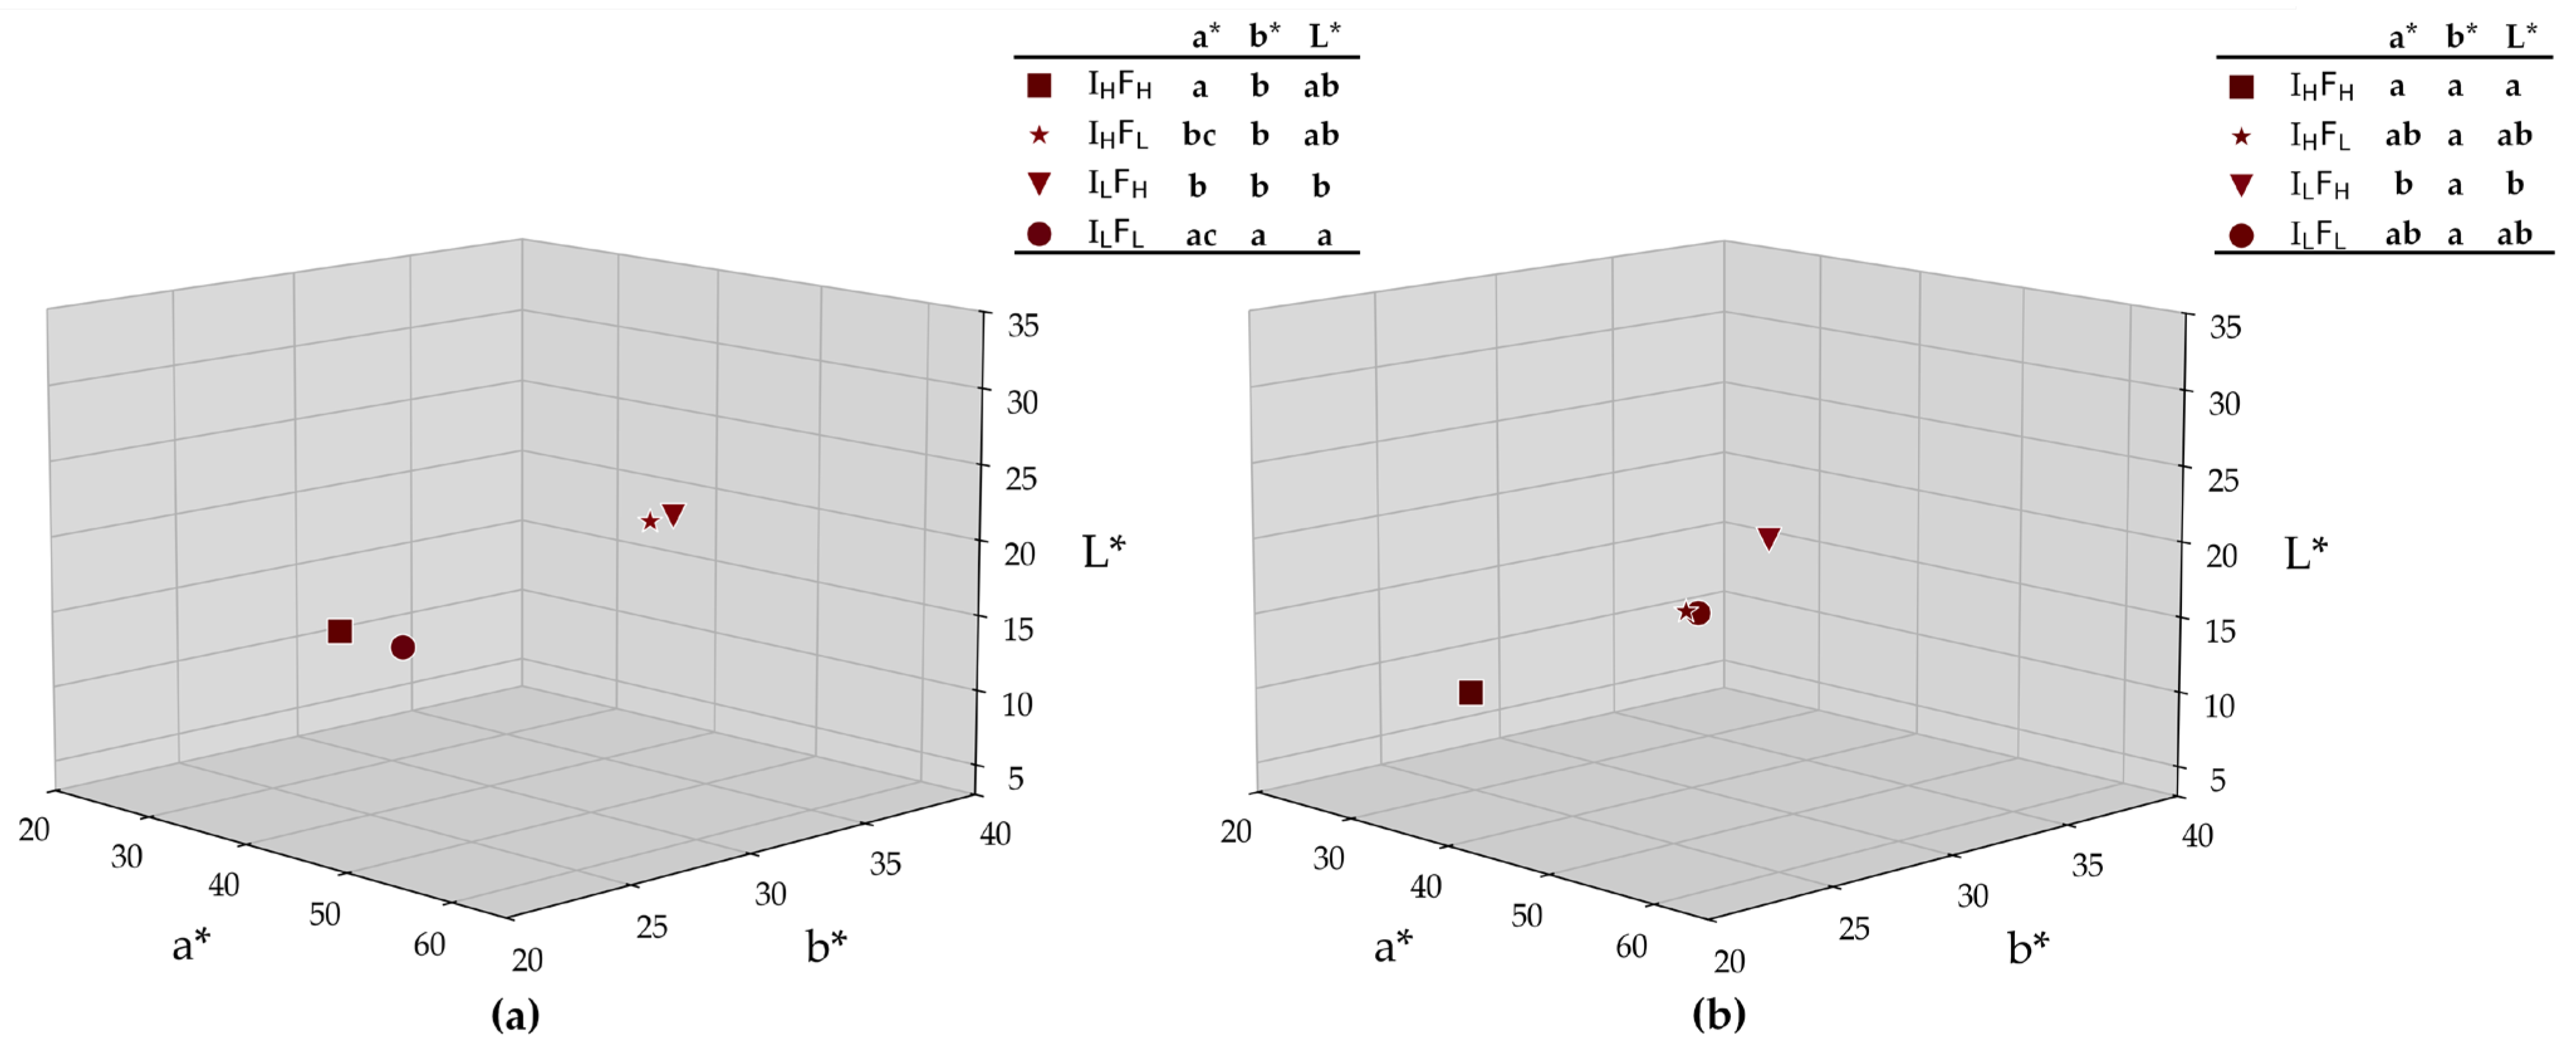
2.3.2. Phenolic Composition and Wine Color
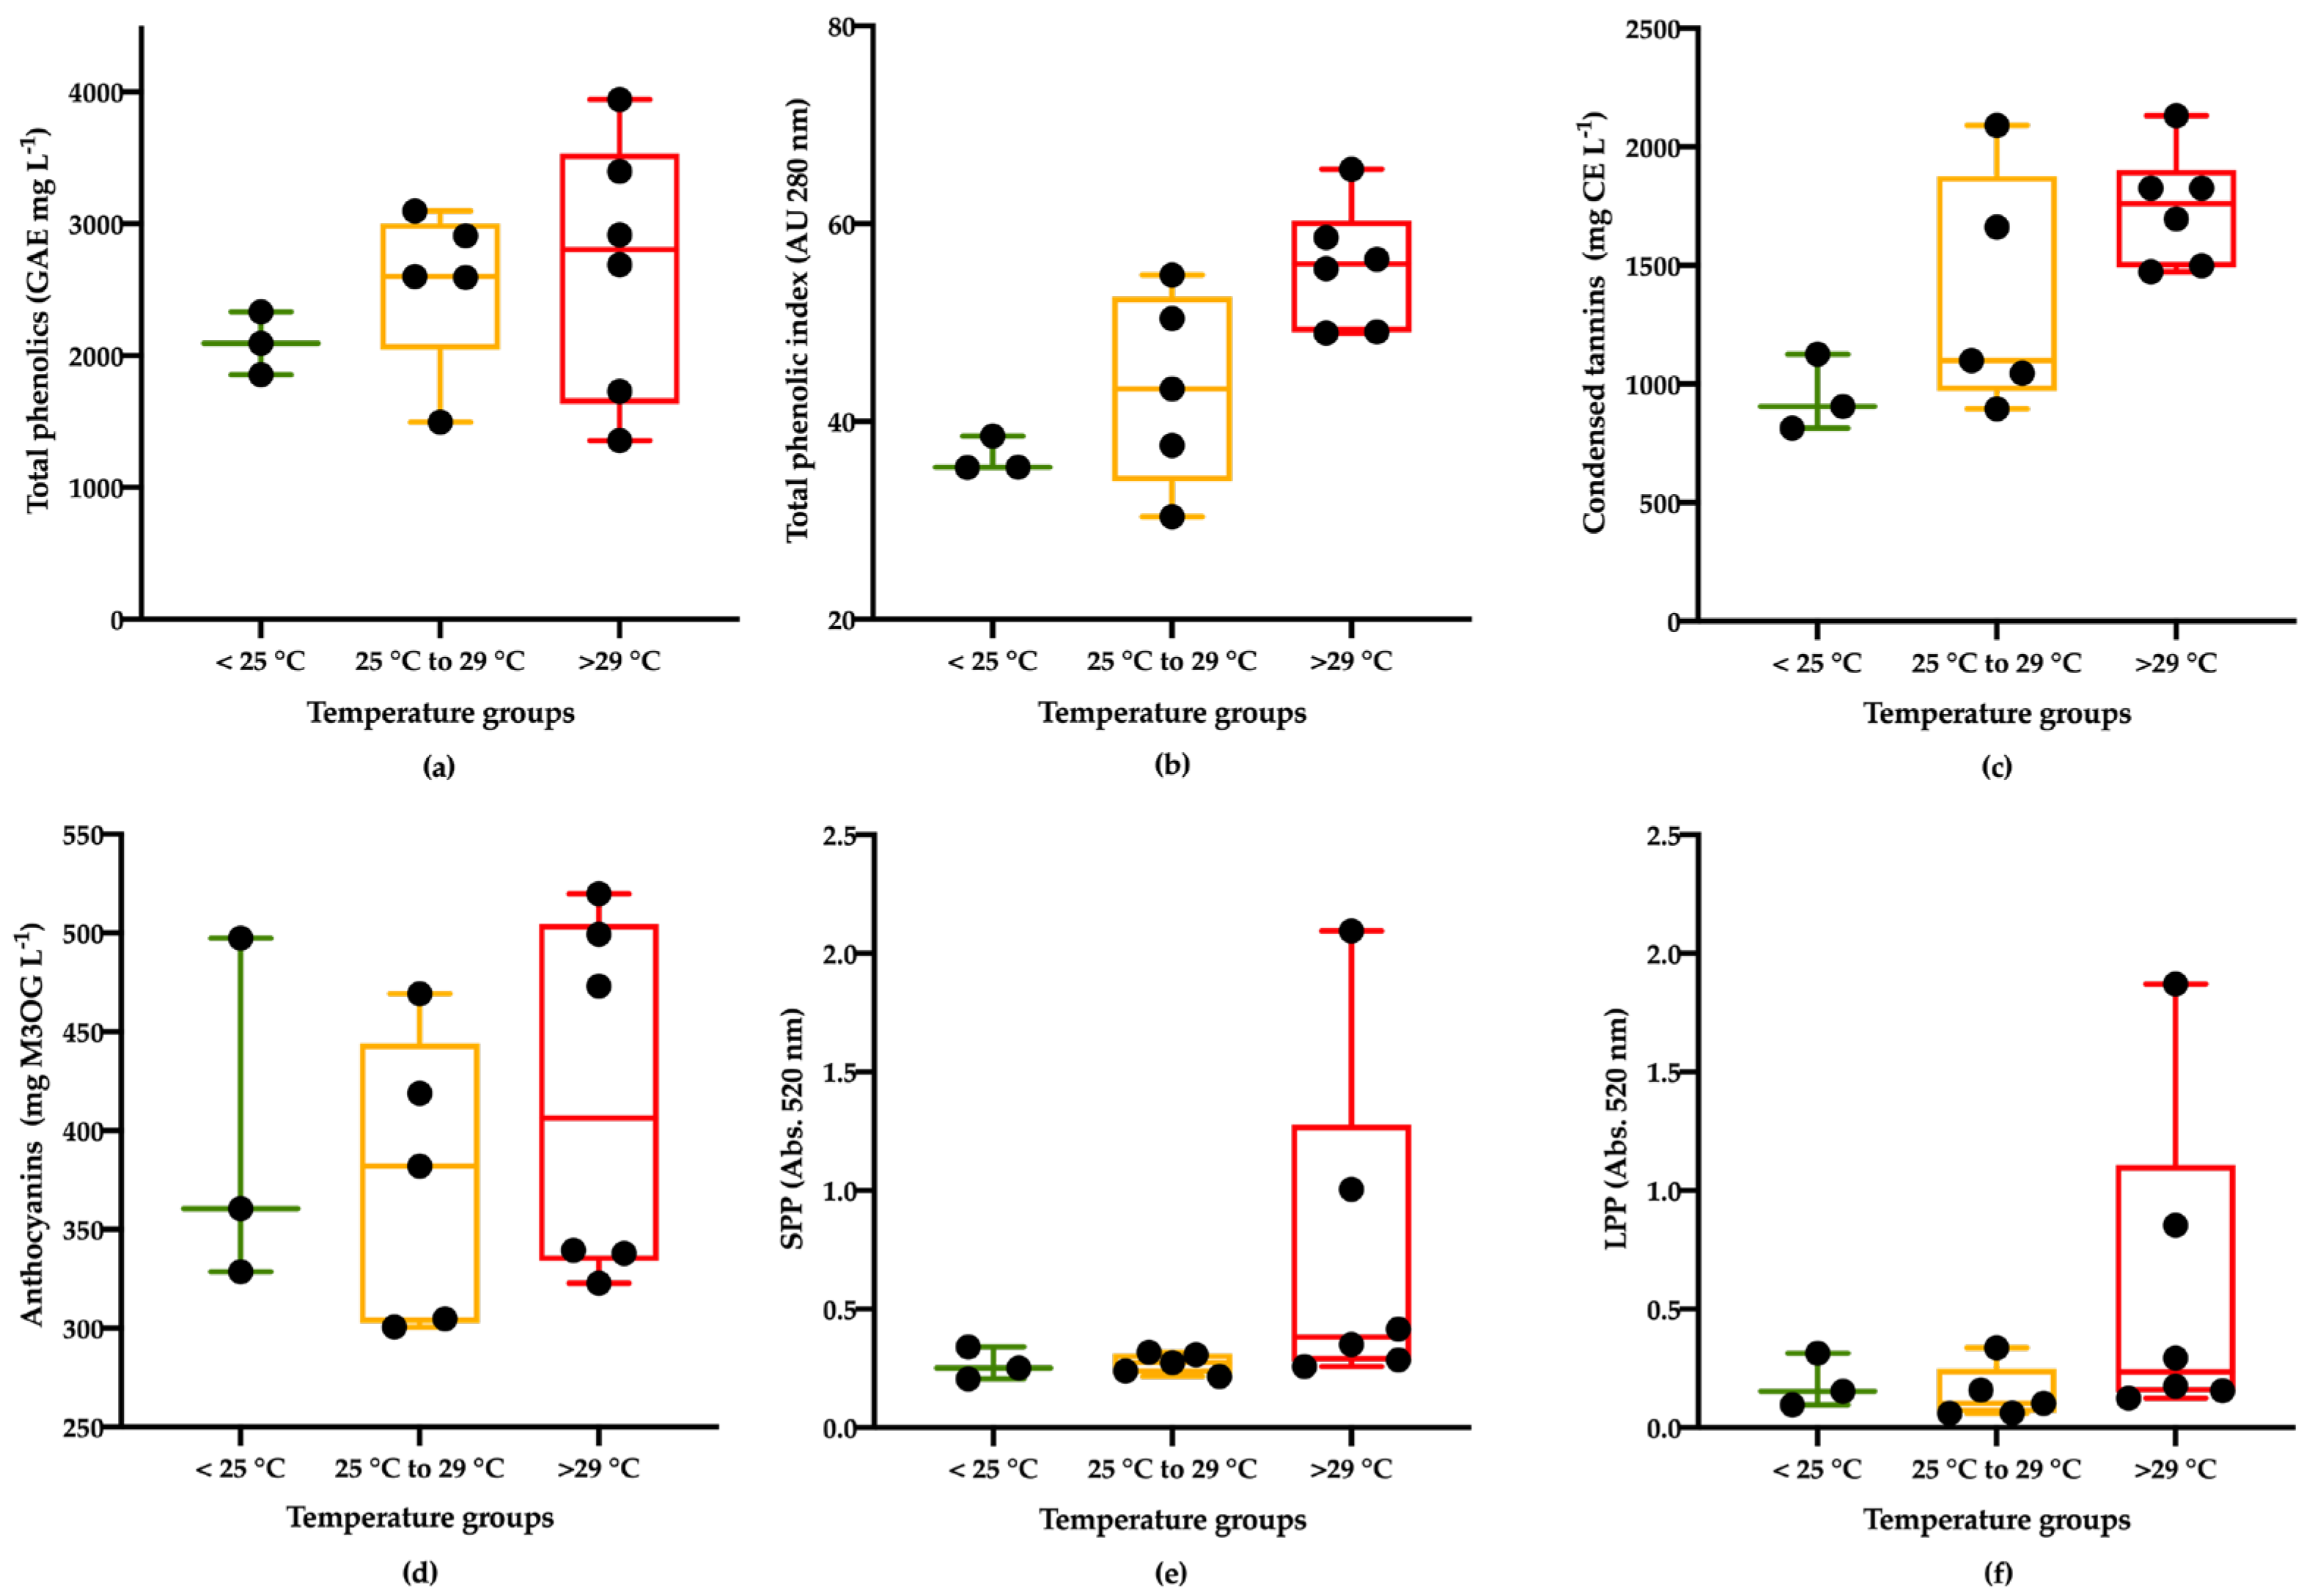
Total Phenolics
The concentration of total phenolics was measured according to the Folin–Ciocalteau micro-method [39]. In brief, 20 µL of must or wine samples (diluted 1:5 or 1:10 with water, respectively) was mixed with 1.58 mL of distilled water and 100 µL Folin–Ciocalteu reagent 2 N (Sigma-Aldrich®, Saint Louis, MO, USA). Solutions were mixed and incubated for 5 min at 20 °C, followed by the addition of 300 μL of saturated solution of sodium carbonate (Merck®, Darmstadt, Germany). The reactions were left to proceed for 30 min at 40 °C, transferred to a transparent polystyrene (PS) flat bottom microplate of 96 wells of 350 μL (reference pureGrade™ 781602, Brand®, Wertheim, Germany), and the absorbance at 765 nm was measured with a microplate spectrophotometer (EpochTM Biotek®, Agilent®, Santa Clara, USA). Results were reported in mg L−1 of gallic acid equivalents (GAE) based on a calibration curve of gallic acid prepared the same way.
Total phenolics were also determined by measuring the absorbance of diluted musts and wines at 280 nm, transferred to a transparent UV, PS flat bottom microplate of, 96 wells of 330 μL (reference pureGrade™ 781614, Brand®, Wertheim, Germany) [39].
Condensed Tannins
Condensed tannins (i.e., proanthocyanidins) were measured using the methylcellulose protocol (MCP) [40,41,42]. This analysis was conducted using the 1 mL volume format as follows: 25 μL of must or wine sample was added to a 1.5 mL centrifuge tube, followed by 300 μL of methylcellulose (0.04% w/v, 1500 cP at 2%; Sigma-Aldrich®, Saint Louis, MO, USA). Additionally, 200 μL of saturated ammonium sulfate solution (Sigma-Aldrich®, Saint Louis, MO, USA) was added to avoid resolubilizing the precipitate, and the 1 mL volume was completed with distilled water. Samples were incubated for 10 min and then centrifuged at 10,000 rpm for 7 min. The absorbance at 280 nm of the supernatants containing methylcellulose (MC) and controls without MC were measured and subtracted. Measurements were taken at 280 nm using 96-well UV, PS flat bottom microplates (reference pureGrade™ 781614, Brand®, Wertheim, Germany) with a microplate spectrophotometer (EpochTM Biotek®, Agilent®, Santa Clara, USA). The concentration of condensed tannins was expressed as mg L−1 catechin equivalents (CE).
Anthocyanins and Polymeric Pigments
Monomeric anthocyanins, and small and large polymeric pigments (SPPs and LPPs) were measured with bisulfite bleaching and the protein precipitation method [43,44]. Anthocyanins were measured in acidic media through light absorption at 520 nm. In a 96-well standard microplate, PS flat bottom (reference pureGrade™ 781602, Brand®, Wertheim, Germany), 100 μL of musts or wine was diluted (1:2 or 1:4, respectively) with buffer B (12% ethanol v/v, 5 g L−1 potassium bitartrate, pH adjusted at 3.3 with HCl 2.0 N), mixed with 200 μL buffer D (200 mM maleic acid, 170 mM NaCl, pH adjusted at 1.8 with NaOH 10%) and incubated for 10 min before reading absorbance at 520 nm (measurement D). Anthocyanin concentration was expressed in mg L−1 of malvidin-3-glucoside, as calculated by Equation (1).
Other compounds such as polymeric pigments are also capable of absorbing at 520 nm; therefore, this interference was subtracted as follows: in a centrifuge tube, 1 mL of buffer A (200 mM Acetic acid, 170 mM NaCl, pH adjusted at 4.9 with NaOH 10%) was added to 500 μL of sample, and the absorbance at 520 nm was measured after 10 min of incubation (Abs. A).
Polymeric pigments were determined by sulfite bleaching as follows: 80 μL bleaching solution (0.36 M K2S2O5) was added to 1 mL of sample after the buffer A step to determine Abs. B (LPP + SPP). Abs. B at 510 nm was measured by transferring 300 μL to a microplate reader after 10 min incubation. A total of 1 mL of bovine serum albumin (1 mg mL−1 BSA diluted in buffer A) was added to 500 μL of sample incubated for 15 min and centrifuged at 13,000 g for 5 min to precipitate LPP. A total of 300 μL of supernatant was measured at 510 nm to obtain SPP by Abs. C. The measurement of absorbances A, B, C, and D was performed with a microplate spectrophotometer (EpochTM Biotek®, Agilent®, Santa Clara, USA). LPP and SPP calculations are expressed in absorbance units as described in Equations (2) and (3).
Anthocyanin = [(Abs. D ∗ dilution factor) − (Abs. A)]/0.0102
SPP = Abs. C ∗ 1.08 ∗ 10/7 ∗ dilution factor
LPP = (Abs. B − Abs. C) ∗ 1.08 ∗ 4/3 ∗ dilution factor
Low Molecular Weight Polyphenols
Low-molecular-weight phenolics, other than anthocyanins, were evaluated with the method described by Peña-Neira et al. [45]. In brief, samples were analyzed by HPLC-DAD equipped with a Chromolith Performance RP-18 column (100 mm length and 4.6 mm I.D.). Samples were extracted three times with 20 mL of diethyl ether, followed by three extractions with 20 mL ethyl acetate. Organic fractions were mixed, concentrated under vacuum, redissolved in 2 mL of methanol/water 1:1 v/v, and filtered with PTFE 0.45 μm syringe filters prior injection. The chromatographic method encompassed a sample injection of 25 μL and a gradient as follows: solvent A, water; solvent B, water/formic acid (5% v/v); solvent C, acetonitrile. Specifically, the method required 0 to 10 min 77–50% of B and 3–30% C, and 10 to 12 min 100% of C. The flow was 3.0 mL/min. The identification and quantification of phenolics were obtained by comparing their retention time and spectra against pure standards (Sigma-Aldrich®, Saint Louis, MO, USA) from which 5-point external calibration curves were drawn.

2.4. Fermentation Progress Monitoring

During fermentation, must temperature and density were monitored twice a day as follows. Must samples were extracted from the tanks as indicated before and transferred into a 250 mL graduated glass cylinder. Density was measured with a glass hydrometer (Alla France®, range: 0.990–1.120 g mL−1), and temperature was recorded with a digital thermometer. When temperature varied from the calibration of the densimeter (15.5 °C), density readings were corrected using compensation tables [46].

2.5. Statistical Analyses

Data normality and homoscedasticity were assessed with the Shapiro and Levene tests, respectively, using R 4.3.2 Software. Given the nature of the samples analyzed, generalized linear mixed models (GLMs) with gamma or Gaussian distribution were employed. The effects of factors (i.e., air injection intensity or frequency) and cofactors (i.e., initial ripening stage [Bx_i]; maximum temperature during fermentations; and daily ethanol concentration) were included in the GLMs. The behavior of the response variables was evaluated by ANOVA (Type I test). Mean value comparisons among different regimes of air injection were evaluated through Tukey’s post hoc test of multiple comparisons. In doing so, comparisons based on fruit ripening level, maximum temperature, or ethanol concentrations reached in each fermentation were also performed. Pearson’s correlation analysis was developed to evaluate the effects of temperature or grape ripeness and ethanol concentration on the composition of the wines.

3. Results

3.1. Dissolved Oxygen During Fermentation

The injection of pressurized air into the wine tanks generates large bubbles that facilitate the mixing of grape pomace with the liquid, potentially reducing temperature and compositional gradients [30]. This process may also promote oxygen dissolution and changes in the chemical composition of the must [23,28,30].
In this study, each cycle of air injection caused a temporary increase in dissolved oxygen (DO), measured with the submerged oxygen probe, which was consistent with the intensity of the injections (i.e., IL producing smaller DO peaks vs. IH producing larger DO peaks). Each pulse of air injection caused a rise in DO, followed by a rapid decrease in concentration (Figure 1), most likely due to oxygen stripping from the CO2 produced by yeast. This pattern was followed by several new oxygen peaks of similar intensities, which varied depending on the frequency of air injections (i.e., four or eight pulses per day) and the stage of the fermentation process, during which more or less CO2 is produced [47]. Furthermore, the observed decreases in dissolved oxygen (DO) after each peak of air injection, could also be attributed to the metabolic activity of yeast, which utilizes oxygen for the synthesis of cell membrane components, such as fatty acids and sterols, that play a critical role in nutrient absorption, membrane fluidity, and overall yeast growth and cell division [48,49].
In the treatment combining low intensity and low frequency for air injection, ILFL (Figure 1a), four daily peaks of oxygen increase were observed. On average, these peaks did not exceed 0.38 mg L−1 of dissolved oxygen (DO). Conversely, in the treatment with a high intensity and frequency of air injection, IHFH (Figure 1b), eight daily peaks of oxygen increase were observed, with DO levels averaging 1.03 mg L−1. On the second day of the fermentation of this treatment, an unexpected electrical error disrupted the programming of the tank and prevented the release of the air streams during a portion of that day. This was later resolved, allowing the system to resume normal operation (Figure 1b). Figure 1c,d show the results of the ILFH and IHFL treatments, with results intermediate to those already described.
From Figure 1b–d, it appears that DO reached higher concentrations in the first couple of days, coinciding with the lower CO2 production typically observed at the onset of the fermentation. In contrast, the decrease in DO during midfermentation may be due to increased metabolic activity of yeast, resulting in higher oxygen consumption and physical displacement of oxygen caused by higher CO2 production [8,34].
In all cases, little to no apparent accumulation of oxygen overtime was observed, with basal DO values below 0.2 mg L−1 (Figure 1a–d). Moreover, the area under the curve (AUC) of DO peaks waw integrated as a way to deduce potential differences in oxygen availability (Supplementary Figure S2), suggesting that IHFH and IHFL had more oxygen available than the rest of the treatments.
In parallel, external DO measurements taken with the NomaSenseTM equipment exhibited basal DO levels between 0.16 and 0.29 mg L−1, with the IHFH treatment showing higher values (Supplementary Figure S3b), corresponding with the results of the submergible DO meter.
As previously reported elsewhere [34], large-scale air injection through different pump-over systems facilitates oxygen dissolution during fermentation, thus enhancing yeast metabolism, and potentially leading to chemical transformation based on redox reactions, including less volatile sulfur compounds, free anthocyanins, astringency, and higher hue values [3,34]. Moreover, it was observed that the concentration of total monomeric anthocyanins decreases as oxygen promotes polymerization reactions, leading to the formation of polymeric anthocyanins, thus enhancing long-term color stability and helping reduce the sensory perception of astringency [23,50]. Additionally, variations in DO may be influenced by changes in fermentation temperature [51].

3.2. Chemical Composition

3.2.1. General Physicochemical Measurements

This section characterizes the basic analytical parameters of the musts employed and the compositional variations observed during fermentation (Table 1). Brix values (Bx) ranged from 21.9 (ILFH) to 22.61 (IHFL) at day 0 (D0) and were consistent with the sum of glucose and fructose concentrations (i.e., G_F: 199.12 for ILFH and 211.67 for IHFL). In both cases, the variation in their concentrations was lower than 6%, and no statistical differences were found among treatments. However, from day 2 to 6, significant differences were found in soluble solids content, with ILFH declining faster than most of the other treatments. However, large deviations among replicates were observed in the glucose-fructose analyses (G_F) that may have hindered the trend seen for Bx results. Unlike Bx, G_F assays are more sensitive, making them more prone to revealing variations in the fermentation dynamics among replicates, or small methodological errors during analyses (e.g., pipetting). Also, the density-based trends observed throughout fermentation were consistent with Brix values, showing variations among replicates possibly related to temperature differences (Supplementary Figure S4), as will be further discussed below (e.g., Section Total Phenolics in Section 3.2.2). Also, it is worth noting that Bx reflects total soluble solids, including sugars, whilst density measurements are influenced by all dissolved substances, and not just fermentable sugars, as in the case of G_F.
It has been reported that oxygen is required for yeast metabolism, and that an adequate supply of this gas may promote shorter fermentations [49,52], as already described in other trials using conventional [23] or AirMixing fermentation systems [28,29,30]. Moreover, the Bx, G_F, and ethanol content values at D6 indicate that the fermentations had not concluded by the time of the final measurement. This is due to the winery’s practical need to rack the tanks and complete the fermentation under liquid phase before further skin breakdown occurs, as this could reduce the efficiency of the draining and pressing processes.
On the other hand, pH values did not vary among treatments in any of the time points analyzed (D0 to D6). Initial pH values ranged from 3.75 to 3.95 at D0 and were reduced to values between 3.56 and 3.74 (D2 to D6) after a standard addition of 1 g L−1 of tartaric acid to all tanks, performed to improve their acidity (Table 1).
Iron showed increasing concentrations during fermentation, starting at an average of 0.53, and reaching 1.7 mg L−1 by the end of fermentation. After fermentation, the concentration of iron was shown to remain relatively stable, as opposed to other ions like copper, which tend to decrease significantly as a result of different winemaking operations [53,54].
Glycerol concentrations reached normal values between 6 and 7 g L−1 and, coinciding with previous results, more than 90% was formed during the first days of fermentation, with the majority occurring before day 4 [55]. Statistical differences among treatments were seen at D2, suggesting variations in yeast metabolism; however, these differences disappeared after the fermentation progressed (D4 and D6). Besides yeast strain, it has been reported that moderate fermentation temperatures (e.g., 20 to 25 °C) result in more glycerol production than at lower or higher temperatures, probably due to the optimum activity of glycerol-3-phosphate dehydrogenase [55,56].
Ethanol concentration increased quickly and in line with the reduction observed in sugar concentration, but no statistical differences were observed among treatments at any of the sample points analyzed. Ebulliometry has limitations when it comes to measuring red musts/wines that may have affected these results, as the boiling point of samples containing hydroalcoholic systems and reducing sugars is lower than that of pure water. Conversely, the presence of acids, esters, and aldehydes can increase the boiling point. These phenomena, as well as the presence of phenolics introduce variability when measuring ethanol using this method [21,57].
Finally, color intensities reached values between 7 and 10, with IHFH being 11 to 31% larger than the rest of the treatments but only showing statistical differences with ILFH. Instead, hue values were smaller in IHFH, possibly signifying a larger anthocyanin extraction concurrent with the results of color intensity.
Figure 2 shows the CIELab color coordinates at days 4 and 6 of fermentation. On day 4 (Figure 2a), significant differences were found among treatments for all color coordinates (a*, b*, and L*), with IHFH having less red and more bluish tones and IHFL having higher red and yellow values. All treatments showed good lightness, with ILFH being lighter than ILFL. By day 6, the differences among treatments were lower, especially in the b* coordinate, possibly suggesting a stabilization in the yellow-blue axis by the end of the fermentation. Instead, some differences remained in the a* and L*coordinates, with IHFH having less red color but being darker than ILFH.
Part of the variability observed in these chemical results may be attributed to the influence of uncontrolled covariates (e.g., initial Bx and fermentation temperature). Although these factors were included as covariates in the GLMs, their variability across tanks may still confound the ability to assess the effects of the air treatments on the chemical parameters of the fermenting must. For instance, it has been shown that higher fermentation temperatures in red wines have positive effects on its chromatic characteristics [32], and in some cases, this results in more color intensity and less luminosity [58]. Consequently, potential variations in the results of phenolics, based on temperature differences among replicates, are analyzed more closely in the following section.

3.2.2. Phenolic Composition and Wine Color

To graphically visualize the progression in the concentration of phenolic parameters during fermentation (i.e., at 0, 2, 4, and 6 days), including total phenolics (Figure 3a,b), tannins (Figure 3c), anthocyanins (Figure 3d), and small and large polymeric pigments (Figure 3e,f), two-dimensional heat maps were plotted. In these maps, darker colors denote larger concentrations.
As expected, the analyses revealed significant increments in the concentration of phenolics over time, with variations depending on the treatment analyzed, and maximum concentrations typically occurring between 4 and 6 days of fermentation (Figure 3).
Total Phenolics
The concentration of total phenolics at the end of the fermentation ranged from 2172.33 to 2783.71 mg L−1 of gallic acid equivalents, as measured using the Folin–Ciocalteu method, with no significant differences among treatments (Figure 3a). This is in line with previous studies reporting that different cap management strategies based on pump-overs or punch-downs produced no significant differences in the content of total phenolics after fermentation, as long as the temperature of the tanks remains the same [8,22,31,59].
Instead, the total phenolic index (TPI), measuring the direct absorbance at 280 nm (Figure 3b), showed that the extreme treatments (i.e., IHFH and ILFL) had significantly higher absorbance values than the intermediate ones. This divergence between methods suggests that certain effects may be more detectable depending on the analytical approach employed, and that additional factors may have influenced phenolic extraction. One likely explanation for the prior is the occurrence of temperature differences among individual fermentation, which may have amplified phenolic extraction in certain replicates, as observed in Supplemental Figure S4.
Consequently, when individual fermentations were analyzed, a few outliers with much higher phenolic concentrations were observed between days 4 and 6 of fermentation (e.g., IHFH_R1 and ILFL_R3), possibly explained by the effect of unusual fermentation temperatures exceeding 29 °C, as it will be further discussed below.
Therefore, in addition to comparing the effects of different air injection treatments on wine composition, fermentation temperature was also studied as an attempt to clarify the impact of these variables on the results. A Pearson correlation analysis (Supplementary Figure S5) showed that the absorbance at 280 nm and high-temperature events (i.e., Tmax) had a high correlation of 0.73 (bilateral significance, p < 0.05), suggesting that higher temperatures during fermentation produced an increased concentration of total phenolics.
In this study, tanks with cooling systems were used to maintain the temperature below 28 °C. However, on some occasions, the environmental conditions and the dimensions of industrial production did not allow the temperature of the musts to be reduced, so temperatures higher than that were reached, as indicated in Figure 4 and Figure S4. The boxplot of Figure 4 represents the relationship between different phenolic measurements and the maximum temperature reached during fermentation. Fermentations were grouped into three categories based on the maximum temperatures they reached (i.e., below 25 °C, between 25 °C and 29 °C, and above 29 °C). For some of the data analyzed (e.g., Figure 4b,c), the plots suggest a tendency for higher phenolic concentrations in those fermentations that experienced elevated temperatures, thus supporting previous studies indicating that fermentation temperature plays a key role in regulating phenolic extraction [6,8,31,32].
It is also worth noting that the less intensive air injection occurring in the ILFL treatment may have contributed to less heat dissipation during cap management. In theory, air injection treatments should promote better heat dissipation and more uniform temperature distribution provided that enough mixing and a sufficient mixing frequency are included.
So far, various authors have examined the effects of fermentation temperature on phenolics and wine color [8,60,61,62], showing that high temperatures have a critical effect on promoting monomeric anthocyanin and tannin extraction, as well as on the formation of polymeric pigments. The changes in phenolic concentration at higher fermentation temperatures could be associated with the rapid dissolution of more easily extractable compounds [63], and its influence on enhancing the permeability of cell membranes of skins and seed [64]. Additionally, high fermentation temperatures could impact fermentation kinetics, potentially accelerating the rate of ethanol production [8,65]. Like so, variations in the initial composition of soluble solids may lead to accelerated ethanol production [12,13]; however, no correlation was observed with the initial sugar content in the must in this study.
Condensed Tannins
A similar trend to the TPI results was observed for condensed tannins (Figure 3c), where contrasting air injection regimes (i.e., ILFL and IHFH) resulted in higher tannin concentration than the intermediate treatments. As previously suggested, this measurement could have been influenced by increases in fermentation temperature, as suggested by their correlation level (correlation = 0.66, bilateral significance, p < 0.05, Pearson’s test). Fermentations at high temperature have been shown to produce higher tannin concentrations [8,32], and longer maceration times have often shown to produce wines with higher tannin and polymeric phenol contents [5,66,67]. Unlike what was observed in our case, Picariello et al. [68] reported no effect of aeration level on the concentration of tannins using the methylcellulose method, where temperature gradients were supposed to be minimized.
So, it has been shown that the composition and concentration of tannin extraction in red wines is affected by the presence of mesocarp and skin cell wall material [69,70], a variable that could well be influenced by the intensity of cap management treatments, possibly releasing more or less cell wall material to the ferment.
Condensed tannins are oligomers or polymers of (+)-catechin, (−)-epicatechin, (−)-epigallocatechin, and (−)-epicatechin-3-O-gallate, obtained mainly from skins or seeds [14,41] that contribute to a variety of taste sensations, including astringency and bitterness. Astringency in wines is attributed to the ability of tannins to react and precipitate saliva proteins, which would result in the sensation of dryness in the mouth characteristic of this taste sensation [25,26,71]. The ratio of skin to seed tannins may play a role in wine flavor, with higher ratios leading to smoother wines. As suggested before, the predominance of seed tannins, or treatments that promote extraction from seeds, may result in increased bitterness [21,25]. For instance, longer maceration times and higher temperatures during fermentation may enhance the extraction of seed tannins, further influencing wine bitterness and astringency. Therefore, further studies on the use of AirMixing may consider separate analysis for skin and seed tannins.
Anthocyanins and Polymeric Pigments
The concentration of anthocyanins also showed significant variations among treatments. Typically, this group of phenolics are quickly extracted during the first days of fermentation, with their stabilization and possible reductions in their concentration explained by their binding with tannins, precipitation with solid materials, or degradation [21]. The treatment with the highest intensity and frequency or air injection (IHFH) showed the largest anthocyanin concentration up to day 4. By day 6, both treatments involving a high intensity of air injection showed more anthocyanins than the low-intensity ones (Figure 3d). It may be that the greater turbulence produced by treatments with higher air injection favored the extraction of anthocyanins in a process that may also be affected by the temperatures in solution, or the number of available tannins to form polymerized pigments [60].
Treatments receiving high amounts of oxygen during fermentation have been shown to have a lower concentration of total anthocyanins and higher, non-bleachable, polymerized pigments [23]. In this case, the total anthocyanin concentration of the most aerated treatment (IHFH) was as high as that of IHFL. Instead, the treatments that were more frequently aerated (IHFH and ILFH) had significantly more small polymeric pigments, as further discussed below.
The presence of oxygen in solution may facilitate the transformation of phenolics, promoting reactions such as the polymerization between anthocyanins and tannins, resulting in the formation of polymeric anthocyanins. These structures impart color, are more stable than monomeric anthocyanins, and have been linked to reductions in the perception of astringency [25,26,71]. In this case, the concentration of short polymeric pigments (Figure 3e) was higher in the treatments in which a higher frequency of air injection was implemented, suggesting that a more periodic presence of oxygen in solution seems to enhance the formation of the polymerized pigments. It is worth noting that the tanks treated with ILFH exhibited fewer high-temperature picks than IHFH and ILFL as it is observed in Supplementary Figure S4. Similarly, the treatments that finished fermenting with the highest LPP concentration were the ones receiving the highest frequency of air injection.
The carbonyl compounds (aldehydes and/or ketones) formed during, or after fermentation, can form covalent bonds between anthocyanins and other phenolic compounds, producing the polymerization and formation of compounds that are very stable against discoloration through reaction with antioxidants such as SO2 and changes due to pH variations [5,6,17,26,43,68].
In juice/must, and later in wine, oxygen can be solubilized and consumed by enzymes (polyphenol oxidase and laccase), microorganisms (yeasts and bacteria), and phenolic compounds [68]. In musts and wines, the effect of adding small amounts of oxygen has been previously studied [37,72], reporting a decrease in the concentration of anthocyanins due to their participation in polymerization reactions, as well as a decrease in the concentration of total tannins due to precipitation or polymeric pigment formation. The prior could result in a reduction in astringency and the stabilization of pigments from an early stage during winemaking [73,74]. In a recent study using AirMixing, aeration was found to enhance the formation of pyroanthocyanins and polymeric pigments, but no effect on the concentration of tannins using the methylcellulose method was observed [58,68].
Low-Molecular-Weight Phenolics
Twenty-one low-molecular weight phenolics were measured at the end of the fermentation (i.e., D4 and D6), with all results being within normal concentration ranges [21,75]. Only eight of the molecules analyzed showed significant differences among treatments (Table 2), most likely due to the variation observed among replicates, possibly explained by the temperature variations observed (Figure 4 and Figure S4).
The variable responses of individual phenolics to different air injection treatments could be explained by their sensitivities to oxygen exposure and temperature variations. Amont these factors, temperature represents the most critical variable influencing phenolic extraction rates [58]. Moreover, it is worth noting that micro-oxygenation studies, although conducted postfermentation, have shown to significantly affect low-molecular-weight phenolic compounds through oxidative and polymerization pathways [8,37,76]. Catechin and caffeic acid readily participate in oxidative cascades in the presence of dissolved oxygen, leading to quinone formation and subsequent polymerization reactions [77]. This may possibly explain why caffeic acid showed higher concentrations in ILFL treatments compared to IHFH and ILFH [74]. Research on AirMixing systems has revealed compound-specific modifications that support these findings, producing lower total hydroxycinnamic acid concentrations, possibly due to oxidation pathways [29]. Also, high concentrations of resveratrol as a function of oxygen exposure during wine storage have been previously reported [78].
No differences were observed for most flavanols (e.g., catechin), phenolic acids (e.g., gallic acid), or flavonols (e.g., quercetin) analyzed, suggesting that by the end of fermentation, the extraction equilibrated regardless of air injection regime. This observation aligns with previous research indicating that different cap management strategies produce similar final phenolic compositions when temperature and extraction time are adequately controlled [8,22,31,59]. Moreover, no clear pattern of differences was observed for the molecules showing statistical differences. For instance, trans-resveratrol concentration at day 6 (D6) was significantly higher for IHFH than for the rest of the treatments, whilst the opposite was observed for caffeic acid, in which ILFL had a higher concentration than IHFH and ILFH.
These findings suggest a relatively small impact of the treatments on the molecular composition of the wines by the end of the fermentation, with most differences occurring during the early phases of the fermentation, before equilibrating by D6. The variability in the responses observed could be due to the effect of covariables like higher-temperature peaks, as previously discussed in Section Total Phenolics in Section 3.2.2, or the reactivity of certain compounds, which may be more or less sensitive to the specific combination of oxygenation and temperature conditions provided by each air injection treatment [5,6]. Understanding these responses is crucial for optimizing fermentation protocols at industrial level and achieving the desired phenolic profile for different wine types.
Industrial-scale experiments are inherently complex and pose several challenges that were faced during this study and require further investigation. In particular, temperature gradients can significantly influence the outcomes of the experiments [79]. Therefore, strategies to minimize and control these gradients should be carefully considered for future experiments. Additionally, the integrity of solids throughout fermentation may influence the binding of tannins to cell wall materials, thus impacting the wine’s phenolic composition. Moreover, the role of oxygen in the formation of oxidized tannins, which exhibit different reactivities and precipitation behaviors, should be further explored to better understand their effects on wine quality.

4. Conclusions

Automatic air injection treatments combining different frequencies and intensities generated peaks of dissolved oxygen that correspond to the sequence and duration of air injection employed. Our findings also suggest that the application of air injections at higher intensities and frequencies resulted in the most rapid accumulation of some phenolic compounds that influenced the measurements of total phenolics, anthocyanins, short polymeric pigments, and tannins. However, despite these early-stage variations, and as previously reported elsewhere, the overall composition of phenolic compounds across treatments appeared to stabilize towards the end of fermentation.
This study was conducted under large industrial-scale winemaking conditions, where complete control over all variables, such as uniform grape ripeness and temperature throughout fermentation, is not always feasible. These limitations can potentially influence certain analytical outcomes but offered valuable insights to understand the potential of air injection treatments on wine composition, and the inherent complexity of industrial-scale fermentations.

Supplementary Materials

The following supporting information can be downloaded at: https://www.mdpi.com/article/10.3390/fermentation11080446/s1, Figure S1: Setup and calibration of the air injection and dissolved oxygen measurement systems; Figure S2: Area under the curve (AUC) of each peak at air injection throughout the fermentation time; Figure S3: External dissolved oxygen measurement by must pump at the bottom of the tank, with utilization of Nomasense equipment; Figure S4: Temperature and density evolution for fermentations of every aeration regime; Figure S5: Pearson correlations of variables.

Author Contributions

Conceptualization, V.F.L. and P.A.P.-M.; methodology, V.F.L. and P.A.P.-M.; formal analysis, P.A.P.-M.; investigation, P.A.P.-M., A.P.-N. and V.F.L.; resources, V.F.L. and A.P.-N.; data curation, P.A.P.-M.; writing—original draft preparation, P.A.P.-M. and V.F.L.; writing—review and editing, P.A.P.-M., A.P.-N. and V.F.L.; supervision, V.F.L.; project administration, V.F.L.; funding acquisition, V.F.L. and P.A.P.-M. All authors have read and agreed to the published version of the manuscript.

Funding

This research was funded by ANID Chile through FONDECYT grant 1231484 and 1190301. V.F.L. and P.A.P.-M. also thank ANID’s National Doctoral Scholarship Program folio 21190245.

Institutional Review Board Statement

Not applicable.

Informed Consent Statement

Not applicable.

Data Availability Statement

The raw data supporting the conclusions of this article will be made available by the authors upon request.

Acknowledgments

We thank Felipe Ponce and Iván Martinovic for providing resources and allowing us to conduct the trials at Viña Santa Carolina. Also, thanks to Héctor Morales and César Gutierrez.

Conflicts of Interest

The authors declare no conflicts of interest.

References

  1. Carew, A.L.; Kerslake, F.L.; Bindon, K.A.; Smith, P.A.; Close, D.C.; Dambergs, R.G. Viticultural and Controlled Phenolic Release Treatments Affect Phenolic Concentration and Tannin Composition in Pinot Noir Wine. Am. J. Enol. Vitic. 2020, 71, 256–265. [Google Scholar] [CrossRef]
  2. Allegro, G.; Pastore, C.; Valentini, G.; Filippetti, I. The Evolution of Phenolic Compounds in Vitis vinifera L. Red Berries during Ripening: Analysis and Role on Wine Sensory—A Review. Agronomy 2021, 11, 999. [Google Scholar] [CrossRef]
  3. Day, M.P.; Espinase Nandorfy, D.; Bekker, M.Z.; Bindon, K.A.; Solomon, M.; Smith, P.A.; Schmidt, S.A. Aeration of Vitis Vinifera Shiraz Fermentation and Its Effect on Wine Chemical Composition and Sensory Attributes. Aust. J. Grape Wine Res. 2021, 27, 360–377. [Google Scholar] [CrossRef]
  4. Clodoveo, M.L.; Dipalmo, T.; Rizzello, C.G.; Corbo, F.; Crupi, P. Emerging Technology to Develop Novel Red Winemaking Practices: An Overview. Innov. Food Sci. Emerg. Technol. 2016, 38, 41–56. [Google Scholar] [CrossRef]
  5. Casassa, L.F.; Harbertson, J.F. Extraction, Evolution, and Sensory Impact of Phenolic Compounds during Red Wine Maceration. Annu. Rev. Food Sci. Technol. 2014, 5, 83–109. [Google Scholar] [CrossRef]
  6. Setford, P.C.; Jeffery, D.W.; Grbin, P.R.; Muhlack, R.A. Factors Affecting Extraction and Evolution of Phenolic Compounds during Red Wine Maceration and the Role of Process Modelling. Trends Food Sci. Technol. 2017, 69, 106–117. [Google Scholar] [CrossRef]
  7. Harrison, R. Practical Interventions That Influence the Sensory Attributes of Red Wines Related to the Phenolic Composition of Grapes: A Review. Int. J. Food Sci. Technol. 2018, 53, 3–18. [Google Scholar] [CrossRef]
  8. Lerno, L.; Reichwage, M.; Ponangi, R.; Hearne, L.; Block, D.E.; Oberholster, A. Effects of Cap and Overall Fermentation Temperature on Phenolic Extraction in Cabernet Sauvignon Fermentations. Am. J. Enol. Vitic. 2015, 66, 444–453. [Google Scholar] [CrossRef]
  9. Canals, R.; Llaudy, M.C.; Valls, J.; Canals, J.M.; Zamora, F. Influence of Ethanol Concentration on the Extraction of Color and Phenolic Compounds from the Skin and Seeds of Tempranillo Grapes at Different Stages of Ripening. J. Agric. Food Chem. 2005, 53, 4019–4025. [Google Scholar] [CrossRef]
  10. Andrich, G.; Zinnai, A.; Venturi, F.; Fiorentini, R. A Tentative Mathematical Model to Describe the Evolution of Phenolic Compounds during the Maceration of Sangiovese and Merlot Grapes. Ital. J. Food Sci. 2005, 17, 45–58. [Google Scholar]
  11. Sun, B.S.; Pinto, T.; Leandro, M.C.; Ricardo-Da-Silva, J.M.; Spranger, M.I. Transfer of Catechins and Proanthocyanidins from Solid Parts of the Grape Cluster into Wine. Am. J. Enol. Vitic. 1999, 50, 179–184. [Google Scholar] [CrossRef]
  12. Bindon, K.A.; Kassara, S.; Cynkar, W.U.; Robinson, E.M.C.; Scrimgeour, N.; Smith, P.A. Comparison of Extraction Protocols to Determine Differences in Wine-Extractable Tannin and Anthocyanin in Vitis vinifera L. Cv. Shiraz and Cabernet Sauvignon Grapes. J. Agric. Food Chem. 2014, 62, 4558–4570. [Google Scholar] [CrossRef]
  13. Harbertson, J.F.; Mireles, M.S.; Harwood, E.D.; Weller, K.M.; Ross, C.F. Chemical and Sensory Effects of Saignée, Water Addition, and Extended Maceration on High Brix Must. Am. J. Enol. Vitic. 2009, 60, 450–460. [Google Scholar] [CrossRef]
  14. Smith, P.A.; Mcrae, J.M.; Bindon, K.A. Impact of Winemaking Practices on the Concentration and Composition of Tannins in Red Wine. Aust. J. Grape Wine Res. 2015, 21, 601–614. [Google Scholar] [CrossRef]
  15. Del Llaudy, M.C.; Canals, R.; Canals, J.M.; Zamora, F. Influence of Ripening Stage and Maceration Length on the Contribution of Grape Skins, Seeds and Stems to Phenolic Composition and Astringency in Wine-Simulated Macerations. Eur. Food Res. Technol. 2008, 226, 337–344. [Google Scholar] [CrossRef]
  16. Bindon, K.A.; Smith, P.A.; Holt, H.; Kennedy, J.A. Interaction between Grape-Derived Proanthocyanidins and Cell Wall Material. 2. Implications for Vinification. J. Agric. Food Chem. 2010, 58, 10736–10746. [Google Scholar] [CrossRef] [PubMed]
  17. Singleton, V.L.; Trousdale, E.K. Anthocyanin-Tannin Interactions Explaining Differences in Polymeric Phenols Between White and Red Wines. Am. J. Enol. Vitic. 1992, 43, 63–70. [Google Scholar] [CrossRef]
  18. Springer, L.F.; Sherwood, R.W.; Sacks, G.L. Pathogenesis-Related Proteins Limit the Retention of Condensed Tannin Additions to Red Wines. J. Agric. Food Chem. 2016, 64, 1309–1317. [Google Scholar] [CrossRef]
  19. Bautista-Ortín, A.B.; Busse-Valverde, N.; Fernández-Fernández, J.I.; Gómez-Plaza, E.; Gil-Muñoz, R. The Extraction Kinetics of Anthocyanins and Proanthocyanidins from Grape to Wine in Three Different Varieties. OENO One 2016, 50, 91–100. [Google Scholar] [CrossRef]
  20. Gil, M.; Kontoudakis, N.; González, E.; Esteruelas, M.; Fort, F.; Canals, J.M.; Zamora, F. Influence of Grape Maturity and Maceration Length on Color, Polyphenolic Composition, and Polysaccharide Content of Cabernet Sauvignon and Tempranillo Wines. J. Agric. Food Chem. 2012, 60, 7988–8001. [Google Scholar] [CrossRef]
  21. Waterhouse, A.L.; Sacks, G.L.; Jeffery, D.W. Understanding Wine Chemistry; Wiley: Hoboken, NJ, USA, 2016; ISBN 9781118627808. [Google Scholar]
  22. Lerno, L.A.; Panprivech, S.; Ponangi, R.; Hearne, L.; Blair, T.; Oberholster, A.; Block, D.E. Effect of Pump-over Conditions on the Extraction of Phenolic Compounds during Cabernet Sauvignon Fermentation. Am. J. Enol. Vitic. 2018, 69, 295–301. [Google Scholar] [CrossRef]
  23. McRae, J.M.; Day, M.P.; Bindon, K.A.; Kassara, S.; Schmidt, S.A.; Schulkin, A.; Kolouchova, R.; Smith, P.A. Effect of Early Oxygen Exposure on Red Wine Colour and Tannins. Tetrahedron 2015, 71, 3131–3137. [Google Scholar] [CrossRef]
  24. Frost, S.C.; Blackman, J.W.; Ebeler, S.E.; Heymann, H. Analysis of Temporal Dominance of Sensation Data Using Correspondence Analysis on Merlot Wine with Differing Maceration and Cap Management Regimes. Food Qual. Prefer. 2018, 64, 245–252. [Google Scholar] [CrossRef]
  25. Soares, S.; Brandão, E.; Mateus, N.; de Freitas, V. Sensorial Properties of Red Wine Polyphenols: Astringency and Bitterness. Food Sci. Nutr. 2017, 57, 937–948. [Google Scholar] [CrossRef] [PubMed]
  26. Liu, J.; Xie, J.; Lin, J.; Xie, X.; Fan, S.; Han, X.; Zhang, D.; Han, L. The Material Basis of Astringency and the Deastringent Effect of Polysaccharides: A Review. Food Chem. 2023, 405, 134946. [Google Scholar] [CrossRef]
  27. Boulton, R.B.; Singleton, V.L.; Bisson, L.F.; Kunkee, R.E. Principles and Practices of Winemaking; Springer: New York, NY, USA, 1999; ISBN 978-1-4419-5190-8. [Google Scholar]
  28. Pettinelli, S.; Pardini, L.; De Angeli, G.; Bianchi, A.; Najar, B.; Cerreta, R.; Bellincontro, A.; Floridia, G.; Mencarelli, F. Innovative “Soft” Maceration Techniques in Red Grape Fermentation. Beverages 2022, 8, 62. [Google Scholar] [CrossRef]
  29. Guerrini, S.; Barbato, D.; Mangani, S.; Mari, E.; Buscioni, G.; Ganucci, D.; Galli, V.; Granchi, L. Utilization of the AIRMIXING M.I.TM System in Producing Red Wine without Added Sulphites. Fermentation 2023, 9, 812. [Google Scholar] [CrossRef]
  30. Pettinelli, S.; Alfieri, G.; Bianchi, A.; Uliva, A.; Floridia, G.; Bellincontro, A.; Mencarelli, F. Use of AirMixing M.I.® Resonance Waves to Produce Aroma Richer Sangiovese Wine without Sulphites Addition in a Sustainable Way. LWT 2024, 198, 116075. [Google Scholar] [CrossRef]
  31. Lerno, L.; Reichwage, M.; Panprivech, S.; Ponangi, R.; Hearne, L.; Oberholster, A.; Block, D.E. Chemical Gradients in Pilot-Scale Cabernet Sauvignon Fermentations and Their Effect on Phenolic Extraction. Am. J. Enol. Vitic. 2017, 68, 401–411. [Google Scholar] [CrossRef]
  32. Casassa, L.F.; Kuster, S.T.; Gannet, P.; Watrelot, A.A. Temperature and Cap Management Effects on the Chemical, Phenolic, and Chromatic Composition of Pinot Noir Wines from the Central Coast of California. Am. J. Enol. Vitic. 2023, 74, 0740031. [Google Scholar] [CrossRef]
  33. LAFFORT TANIN VR SUPRA. Available online: https://laffort.com/en/products/tanin-vr-supra/ (accessed on 14 July 2025).
  34. Moenne, M.I.; Saa, P.; Laurie, V.F.; Pérez-Correa, J.R.; Agosin, E. Oxygen Incorporation and Dissolution During Industrial-Scale Red Wine Fermentations. Food Bioproc. Technol. 2014, 7, 2627–2636. [Google Scholar] [CrossRef]
  35. Del Alamo-Sanza, M.; Laurie, F.; Nevares, I. Wine Evolution and Spatial Distribution of Oxygen during Storage in High-Density Polyethylene Tanks. J. Sci. Food Agric. 2015, 95, 1313–1320. [Google Scholar] [CrossRef] [PubMed]
  36. Calderón, J.F.; del Alamo-Sanza, M.; Nevares, I.; Laurie, V.F. The Influence of Selected Winemaking Equipment and Operations on the Concentration of Dissolved Oxygen in Wines. Cienc. Investig. Agrar. 2014, 41, 27–28. [Google Scholar] [CrossRef]
  37. Laurie, V.F.; Salazar, S.; Campos, M.I.; Cáceres-Mella, A.; Peña-Neira, Á. Periodic Aeration of Red Wine Compared to Microoxygenation at Production Scale. Am. J. Enol. Vitic. 2014, 65, 254–260. [Google Scholar] [CrossRef]
  38. Pérez-Caballero, V.; Ayala, F.; Echávarri, J.F.; Negueruela, A.I. Proposal for a New Standard OIV Method for Determination of Chromatic Characteristics of Wine. Am. J. Enol. Vitic. 2003, 54, 59–62. [Google Scholar] [CrossRef]
  39. Waterhouse, A.L. Determination of Total Phenolics. In Current Protocols in Food Analytical Chemistry; John Wiley & Sons, Inc.: Hoboken, NJ, USA, 2003. [Google Scholar]
  40. Mercurio, M.D.; Dambergs, R.G.; Herderich, M.J.; Smith, P.A. High Throughput Analysis of Red Wine and Grape PhenolicsAdaptation and Validation of Methyl Cellulose Precipitable Tannin Assay and Modified Somers Color Assay to a Rapid 96 Well Plate Format. J. Agric. Food Chem. 2007, 55, 4651–4657. [Google Scholar] [CrossRef]
  41. Sarneckis, C.J.; Dambergs, R.G.; Jones, P.; Mercurio, M.; Herderich, M.J.; Smith, P.A. Quantification of Condensed Tannins by Precipitation with Methyl Cellulose: Development and Validation of an Optimised Tool for Grape and Wine Analysis. Aust. J. Grape Wine Res. 2006, 12, 39–49. [Google Scholar] [CrossRef]
  42. Dambergs, R.G.; Mercurio, M.D.; Kassara, S.; Cozzolino, D.; Smith, P.A. Rapid Measurement of Methyl Cellulose Precipitable Tannins Using Ultraviolet Spectroscopy with Chemometrics: Application to Red Wine and Inter-Laboratory Calibration Transfer. Appl. Spectrosc. 2012, 66, 656–664. [Google Scholar] [CrossRef]
  43. Harbertson, J.F.; Picciotto, E.A.; Adams, D.O. Measurement of Polymeric Pigments in Grape Berry Extracts and Wines Using a Protein Precipitation Assay Combined with Bisulfite Bleaching. Am. J. Enol. Vitic 2003, 54, 301–306. [Google Scholar] [CrossRef]
  44. Heredia, T.M.; Adams, D.O.; Fields, K.C.; Held, P.G.; Harbertson, J.F. Evaluation of a Comprehensive Red Wine Phenolics Assay Using a Microplate Reader. Am. J. Enol. Vitic. 2006, 57, 497–502. [Google Scholar] [CrossRef]
  45. Peña-Neira, A.; Cáceres, A.; Pastenes, C. Low Molecular Weight Phenolic and Anthocyanin Composition of Grape Skins from Cv. Syrah (Vitis vinifera L.) in the Maipo Valley (Chile): Effect of Clusters Thinning and Vineyard Yield. Food Sci. Technol. Int. 2007, 13, 153–158. [Google Scholar] [CrossRef]
  46. Simmonds, C. Alcohol: Its Production, Properties, Chemistry, and Industrial Applications. With Chapters on Methyl Alcohol, Fusel Oil, and Spirituous Beverages. Nature 1920, 104, 431–432. [Google Scholar] [CrossRef]
  47. Devatine, A.; Chiciuc, I.; Poupot, C.; Mietton-Peuchot, M. Micro-Oxygenation of Wine in Presence of Dissolved Carbon Dioxide. Chem. Eng. Sci. 2007, 62, 4579–4588. [Google Scholar] [CrossRef]
  48. Day, M.P.; Schmidt, S.A.; Smith, P.A.; Wilkes, E.N. Use and Impact of Oxygen during Winemaking. Aust. J. Grape Wine Res. 2015, 21, 693–704. [Google Scholar] [CrossRef]
  49. Rosenfeld, E.; Beauvoit, B.; Blondin, B.; Salmon, J.-M. Oxygen Consumption by Anaerobic Saccharomyces Cerevisiae under Enological Conditions: Effect on Fermentation Kinetics. Appl. Environ. Microbiol. 2003, 69, 113–121. [Google Scholar] [CrossRef]
  50. Asenstorfer, R.E.; Markides, A.J.; Iland, P.G.; Jones, G.P. Formation of Vitisin A during Red Wine Fermentation and Maturation. Aust. J. Grape Wine Res. 2003, 9, 40–46. [Google Scholar] [CrossRef]
  51. Schneider, V.; Müller, J.; Schmidt, D. Oxygen Consumption by Postfermentation Wine Yeast Lees: Factors Affecting Its Rate and Extent under Oenological Conditions. Food Technol. Biotechnol. 2016, 54, 395–402. [Google Scholar] [CrossRef]
  52. Sablayrolles, J.-M.; Dubois, C.; Manginot, C.; Roustan, J.-L.; Barre, P. Effectiveness of Combined Ammoniacal Nitrogen and Oxygen Additions for Completion of Sluggish and Stuck Wine Fermentations. J. Ferment. Bioeng. 1996, 82, 377–381. [Google Scholar] [CrossRef]
  53. Volpe, M.G.; La Cara, F.; Volpe, F.; De Mattia, A.; Serino, V.; Petitto, F.; Zavalloni, C.; Limone, F.; Pellecchia, R.; De Prisco, P.P.; et al. Heavy Metal Uptake in the Enological Food Chain. Food Chem. 2009, 117, 553–560. [Google Scholar] [CrossRef]
  54. del Mar Castiñeira, M.; Brandt, R.; Jakubowski, N.; Andersson, J.T. Changes of the Metal Composition in German White Wines through the Winemaking Process. A Study of 63 Elements by Inductively Coupled Plasma−Mass Spectrometry. J. Agric. Food Chem. 2004, 52, 2953–2961. [Google Scholar] [CrossRef]
  55. Du, G.; Zhan, J.; Li, J.; You, Y.; Zhao, Y.; Huang, W. Effect of Fermentation Temperature and Culture Medium on Glycerol and Ethanol during Wine Fermentation. Am. J. Enol. Vitic. 2012, 63, 132–138. [Google Scholar] [CrossRef]
  56. Gao, Y.; Zhang, Y.; Wen, X.; Song, X.; Meng, D.; Li, B.; Wang, M.; Tao, Y.; Zhao, H.; Guan, W.; et al. The Glycerol and Ethanol Production Kinetics in Low-temperature Wine Fermentation Using Saccharomyces Cerevisiae Yeast Strains. Int. J. Food Sci. Technol. 2019, 54, 102–110. [Google Scholar] [CrossRef]
  57. Zoecklein, B.W.; Fugelsang, K.C.; Gump, B.H.; Nury, F.S. Wine Analysis and Production; Springer: Boston, MA, USA, 1999; ISBN 978-1-4757-6969-2. [Google Scholar]
  58. Pérez-Navarro, J.; García Romero, E.; Gómez-Alonso, S.; Izquierdo Cañas, P.M. Comparison between the Phenolic Composition of Petit Verdot Wines Elaborated at Different Maceration/Fermentation Temperatures. Int. J. Food Prop. 2018, 21, 996–1007. [Google Scholar] [CrossRef]
  59. Casassa, L.F.; LoMonaco, I.; Velasco, M.; Papageorgas, D.D. Effect of Cap Management Frequency on the Phenolic, Chromatic, and Sensory Composition of Cabernet Sauvignon Wines from the Central Coast of California over Two Vintages. Molecules 2024, 29, 2509. [Google Scholar] [CrossRef] [PubMed]
  60. Gao, L.; Girard, B.; Mazza, G.; Reynolds, A.G. Changes in Anthocyanins and Color Characteristics of Pinot Noir Wines during Different Vinification Processes. J. Agric. Food Chem. 1997, 45, 2003–2008. [Google Scholar] [CrossRef]
  61. Girard, B.; Yuksel, D.; Cliff, M.; Delaquis, P.; Reynolds, A. Vinifcation Efects on the Sensory, Colour and GC Profles of Pinot Noir Wines from British Columbia. Food Res. Int. 2001, 34, 483–499. [Google Scholar] [CrossRef]
  62. Ruiz-Rodríguez, A.; Palma, M.; Barroso, C.G. Influence of Temperature during Pre-Fermentative Maceration and Alcoholic Fermentation on the Phenolic Composition of ‘Cabernet Sauvignon’ Wines. Foods 2021, 10, 1053. [Google Scholar] [CrossRef]
  63. Cacace, J.E.; Mazza, G. Optimization of Extraction of Anthocyanins from Black Currants with Aqueous Ethanol. J. Food Sci. 2003, 68, 240–248. [Google Scholar] [CrossRef]
  64. Koyama, K.; Goto-Yamamoto, N.; Hashizume, K. Influence of Maceration Temperature in Red Wine Vinification on Extraction of Phenolics from Berry Skins and Seeds of Grape (Vitis vinifera). Biosci. Biotechnol. Biochem. 2007, 71, 958–965. [Google Scholar] [CrossRef]
  65. Coleman, M.C.; Fish, R.; Block, D.E. Temperature-Dependent Kinetic Model for Nitrogen-Limited Wine Fermentations. Appl. Environ. Microbiol. 2007, 73, 5875–5884. [Google Scholar] [CrossRef]
  66. Gomez-Plaza, E.; Gil, R.; Cutillas Adrian, M.; Ignacio Fernández, J. Phenolic Compounds and Color Stability of Red Wines: Effect of Skin Maceration Time. Am. J. Enol. Vitic. 2001, 52, 266–270. [Google Scholar] [CrossRef]
  67. Fourie, E.; Aleixandre-Tudo, J.L.; Mihnea, M.; du Toit, W. Partial Least Squares Calibrations and Batch Statistical Process Control to Monitor Phenolic Extraction in Red Wine Fermentations under Different Maceration Conditions. Food Control 2020, 115, 107303. [Google Scholar] [CrossRef]
  68. Picariello, L.; Gambuti, A.; Picariello, B.; Moio, L. Evolution of Pigments, Tannins and Acetaldehyde during Forced Oxidation of Red Wine: Effect of Tannins Addition. LWT Food Sci. Technol. 2017, 77, 370–375. [Google Scholar] [CrossRef]
  69. Sparrow, A.M.; Dambergs, R.G.; Bindon, K.A.; Smith, P.A.; Close, D.C. Interactions of Grape Skin, Seed, and Pulp on Tannin and Anthocyanin Extraction in Pinot Noir Wines. Am. J. Enol. Vitic. 2015, 66, 472–481. [Google Scholar] [CrossRef]
  70. Bindon, K.A.; Kassara, S.; Smith, P.A. Towards a Model of Grape Tannin Extraction under Wine-like Conditions: The Role of Suspended Mesocarp Material and Anthocyanin Concentration. Aust. J. Grape Wine Res. 2017, 23, 22–32. [Google Scholar] [CrossRef]
  71. Pavez, C.; González-Muñoz, B.; O’Brien, J.A.; Laurie, V.F.; Osorio, F.; Núñez, E.; Vega, R.E.; Bordeu, E.; Brossard, N. Red Wine Astringency: Correlations between Chemical and Sensory Features. LWT 2022, 154, 112656. [Google Scholar] [CrossRef]
  72. Laurie, V.F.; Law, R.; Joslin, W.S.; Waterhouse, A.L. In Situ Measurements of Dissolved Oxygen during Low-Level Oxygenation in Red Wines. Am. J. Enol. Vitic. 2008, 59, 215–219. [Google Scholar] [CrossRef]
  73. Sánchez-Gómez, R.; Nevares, I.; Martínez-Gil, A.; del Alamo-Sanza, M. Oxygen Consumption by Red Wines under Different Micro-Oxygenation Strategies and Q. Pyrenaica Chips. Effects on Color and Phenolic Characteristics. Beverages 2018, 4, 69. [Google Scholar] [CrossRef]
  74. Singleton, V.L. Oxygen with Phenols and Related Reactions in Musts, Wines, and Model Systems: Observations and Practical Implications. Am. J. Enol. Vitic. 1987, 38, 69–77. [Google Scholar] [CrossRef]
  75. Flanzy, C. Oenologie: Fondements Scientifiques et Technologiques; Tec Et Doc: Hobart, Australia, 1998; Volume 6, ISBN 2743002433. [Google Scholar]
  76. Cano-López, M.; Pardo-Mínguez, F.; Schmauch, G.; Saucier, C.; Teissedre, P.-L.; López-Roca, J.M.; Gómez-Plaza, E. Effect of Micro-Oxygenation on Color and Anthocyanin-Related Compounds of Wines with Different Phenolic Contents. J. Agric. Food Chem. 2008, 56, 5932–5941. [Google Scholar] [CrossRef]
  77. Waterhouse, A.L.; Laurie, V.F. Oxidation of Wine Phenolics: A Critical Evaluation and Hypotheses. Am. J. Enol. Vitic. 2006, 57, 306–313. [Google Scholar] [CrossRef]
  78. Castellari, M.; Matricardi, L.; Arfelli, G.; Galassi, S.; Amati, A. Level of Single Bioactive Phenolics in Red Wine as a Function of the Oxygen Supplied during Storage. Food Chem. 2000, 69, 61–67. [Google Scholar] [CrossRef]
  79. Schmid, F.; Schadt, J.; Jiranek, V.; Block, D.E. Formation of Temperature Gradients in Large- and Small-Scale Red Wine Fermentations during Cap Management. Aust. J. Grape Wine Res. 2009, 15, 249–255. [Google Scholar] [CrossRef]
Figure 1. Concentration of dissolved oxygen in four representative fermentations combining low (L) and high (H) intensities (I) and frequencies (F) of air injection: (a) ILFL; (b) IHFH; (c) ILFH; (d) IHFL.
Fermentation 11 00446 g001
Figure 2. Color in CIELab parameters of all fermentations per cap management regimes. High (H) and low (L) intensities (I) and frequencies (F) of air injection. Evaluated on sampling days D4 (a) and D6 (b).
Fermentation 11 00446 g002
Figure 3. Phenolic measurements during fermentation under different cap management regimes combining high (H) and low (L) intensities (I) and frequencies (F) of air injection across sampling days (i.e., D0, D2, D4, D6). (a) Total phenolics, (b) total phenolic index, (c) condensed tannins, (d) anthocyanins, (e) short polymeric pigments, and (f) large polymeric pigments. Different vertical letters represent statistical differences, p ≤ 0.05 (Tukey’s test).
Fermentation 11 00446 g003
Figure 4. Temperature relation with phenolic composition at sampling day D6. (a) Total phenolics, (b) total phenolic index, (c) condensed tannins, (d) anthocyanins, (e) short polymeric pigments, and (f) large polymeric pigments. The boxes show the interquartile range (IQR), the horizontal line within each box indicates the median, and the whiskers extend to 1.5 × IQR.
Fermentation 11 00446 g004
Table 1. Physicochemical composition of must fermented under different air injection treatments recorded on days 0, 2, 4, and 6 of fermentation: (a) ILFL; (b) IHFH; (c) ILFH; (d) IHFL.
Treatment/TimeBxG_FpHIronGlycerolEthanolColor
Intensity
Color
Tonality/Hue
D0
IHFH22.22 ± 1.14 a201.21 ± 11.35 a3.93 ± 0.36 a0.44 ± 0.17 a0.51 ± 0.32 a0.37 ± 0.68 ab2.26 ± 0.53 a0.89 ± 0.17 a
IHFL22.61 ± 2.01 a211.67 ± 15.35 a3.95 ± 0.23 a0.73 ± 0.05 b0.81 ± 0.44 aNF4.32 ± 1.38 b0.87 ± 0.17 a
ILFH21.90 ± 1.75 a199.12 ± 15.08 a3.83 ± 0.07 a0.50 ± 0.15 a0.78 ± 0.18 aNF1.99 ± 0.77 a0.75 ± 0.22 a
ILFL22.45 ± 0.86 a207.14 ± 13.27 a3.75 ± 0.14 a0.57 ± 0.16 ab0.75 ± 0.50 a0.62 ± 0.57 a2.57 ± 0.54 a0.7 ± 0.25 a
D2
IHFH18.23 ± 1.72 b131.66 ± 23.70 ab3.65 ± 0.23 a0.90 ± 0.33 ab3.06 ± 1.66 a4.81 ± 3.25 a4.83 ± 2.15 ab0.99 ± 0.49 a
IHFL17.13 ± 0.91 b129.26 ± 30.89 ab3.58 ± 0.18 a1.15 ± 0.39 b4.84 ± 0.30 b5.67 ± 2.46 a5.54 ± 1.87 ab0.64 ± 0.15 a
ILFH14.72 ± 1.90 a105.2 ± 32.84 a3.58 ± 0.14 a0.92 ± 0.08 ab5.68 ± 0.49 b5.00 ± 1.98 a4.65 ± 0.91 ab0.53 ± 0.09 a
ILFL17.88 ± 0.81 b156.36 ± 7.49 b3.56 ± 0.17 a0.80 ± 0.20 a3.32 ± 0.40 a3.52 ± 3.37 a3.59 ± 0.46 a0.90 ± 1.04 a
D4
IHFH9.11 ± 1.66 ab28.23 ± 19.07 a3.59 ± 0.14 a1.12 ± 0.57 a6.05 ± 0.79 a10.06 ± 1.28 a8.64 ± 2.67 ab0.48 ± 0.03 a
IHFL11.84 ± 1.02 c70.87 ± 14.38 b3.60 ± 0.16 a1.25 ± 0.12 a6.36 ± 0.59 a9.33 ± 1.75 a7.18 ± 1.87 a0.59 ± 0.07 b
ILFH8.37 ± 0.58 a23.31 ± 10.43 ab3.58 ± 0.11 a1.46 ± 0.26 ab6.95 ± 0.77 a10.67 ± 1.09 a7.03 ± 0.47 a0.49 ± 0.04 a
ILFL10.57 ± 1.87 bc48.73 ± 23.84 a3.63 ± 0.16 a1.45 ± 0.23 b6.34 ± 1.15 a9.44 ± 0.28 a9.29 ± 1.28 b0.48 ± 0.04 a
D6
IHFH7.73 ± 1.00 b4.11 ± 6.38 a3.64 ± 0.14 a1.3 ± 0.35 a6.13 ± 0.49 a11.56 ± 0.79 a10.15 ± 2.26 b0.47 ± 0.04 a
IHFL7.61 ± 0.96 ab8.10 ± 8.03 a3.65 ± 0.11 a1.85 ± 0.55 bc7.07 ± 1.19 a11.67 ± 0.50 a8.44 ± 1.25 ab0.5 ± 0.03 ab
ILFH6.76 ± 0.21 a1.87 ± 1.14 a3.69 ± 0.16 a1.51 ± 0.54 ab7.08 ± 0.98 a11.33 ± 0.66 a7.03 ± 1.43 a0.49 ± 0.02 ab
ILFL7.52 ± 0.54 ab4.21 ± 5.97 a3.74 ± 0.27 a2.14 ± 0.48 c6.37 ± 0.76 a11.50 ± 0.64 a9.03 ± 1.68 b0.53 ± 0.04 b
Results expressed as mean ± standard deviation (n = 3). In each column, statistically significant differences among treatments per time point (D0 to D6) are indicated by lowercase letters as a result of the Tukey test (p < 0.05). D0: initial day of fermentation; D2: second day of fermentation; D4: fourth day of fermentation; D6: final day of fermentation. ILFL: low injection intensity, low frequency; IHFH: high intensity, high frequency; ILFH: low intensity, high frequency; IHFL: high intensity, low frequency. °Bx: soluble solids; G_F: glucose + fructose (g L−1); pH: real acidity; iron (mg L−1), copper (mg L−1), glycerol (g L−1), ethanol (% v/v mL ethanol/100 mL musts–wines). NF: Not found.
Table 2. Low-molecular-weight-phenolic composition of wines.
IHFHIHFLILFHILFL
CD4129.95 ± 39.2 a105.91 ± 117.84 a137.55 ± 17.75 a198.36 ± 204.96 a
D6243.02 ± 84.39 a234.38 ± 110.78 a115.38 ± 32.11 a238.33 ± 116.78 a
ECD463.51 ± 19.31 a46.11 ± 40.77 a70.32 ± 13.22 a111.97 ± 127.41 a
D652.7 ± 22.38 a113.98 ± 74.27 a65.68 ± 20.67 a128.44 ± 60.48 a
PB3D414.3 ± 2.23 a81.21 ± 36.58 a95.94 ± 27.29 a82.83 ± 63.32 a
D674.45 ± 24.18 a128.37 ± 89.97 a79.45 ± 18.4 a178.12 ± 85.94 a
GAD441.77 ± 11.35 a39.46 ± 28.57 a51.3 ± 0.58 a48.75 ± 30.8 a
D676.88 ± 7.44 a81.77 ± 27.28 a55.26 ± 10.77 a55.26 ± 30.97 a
PCAD46.25 ± 1.14 a7.92 ± 7.14 a9.06 ± 3.25 a7.68 ± 3.62 a
D610.33 ± 2.51 a10.16 ± 1.87 a6.7 ± 0.34 a12.74 ± 5.16 a
CfAD42.08 ± 0.43 a7.44 ± 2.67 a7.06 ± 3.91 a5.27 ± 1.85 a
D64.03 ± 1.34 a8.03 ± 1.34 ab3.87 ± 0.9 a10.08 ± 4.11 b
p-cuAD43.63 ± 0.97 a5.49 ± 3.78 a5.13 ± 0.86 a4.75 ± 2.94 a
D611.34 ± 2.16 a11.02 ± 5.28 a3.09 ± 1.27 a9.3 ± 2.96 a
VllAD423.52 ± 15.57 a34.25 ± 32.92 a9.93 ± 2.75 a8.23 ± 1.55 a
D635.87 ± 1.63 b23.13 ± 6.54 ab6.56 ± 1.17 a20.27 ± 13.33 b
CAcD47.08 ± 0.06 a9.21 ± 7.76 a9 ± 2.35 a8.72 ± 4.02 a
D611.88 ± 1.14 a9.39 ± 3.19 a6.55 ± 2.39 a11.71 ± 3.53 a
CAt D44.81 ± 2.49 a8.7 ± 9.28 a12.7 ± 4.81 a17.59 ± 15.19 a
D66.42 ± 4.68 a7.27 ± 3.24 a9.79 ± 4.02 a18.12 ± 6.51 a
CaftAD43.91 ± 1.55 a2.24 ± 2.76 a2.69 ± 1.28 a2.15 ± 1.54 a
D64.1 ± 2.92 a2.35 ± 0.31 a13.19 ± 21.45 a2.32 ± 1.5 a
RsvD48.48 ± 4.99 a10.83 ± 10.37 a3.8 ± 0.68 a4.22 ± 2.43 a
D615.3 ± 4.45 b7.92 ± 4.33 a2.84 ± 0.24 a3.93 ± 0.86 a
QD417.9 ± 4.08 a15.51 ± 6.67 a26.67 ± 19.04 a17.13 ± 2.38 a
D615.27 ± 3.51 a19.5 ± 3.53 a36.55 ± 23.94 a31.27 ± 5.44 a
TrD496.27 ± 14.16 a165.06 ± 136.48 a128.12 ± 8.86 a130.44 ± 50.44 a
D6202.05 ± 65.89 a180.13 ± 30.69 a101.33 ± 14.84 a165.47 ± 63.93 a
Mr3GluD417 ± 4.26 a16.85 ± 7.23 a18.2 ± 5.52 a15.84 ± 5.45 a
D620.89 ± 15.31 a11.83 ± 8.16 a13.67 ± 2.12 a19.36 ± 5.1 a
Q3GalD433.19 ± 4.54 a15.04 ± 7.69 a25.09 ± 11.89 a29.08 ± 9.38 a
D632.19 ± 7.82 b18.72 ± 2.46 ab13.93 ± 6.48 a20.93 ± 0.01 ab
PG1 D49.68 ± 0.16 a10.36 ± 2.4 a10.17 ± 0.57 a9.45 ± 1.2 a
D610.62 ± 0.46 a11.91 ± 0.92 a10.18 ± 0.21 a10.82 ± 0.97 a
PG2D417.68 ± 2.13 a20.65 ± 9.96 a22.32 ± 1.79 a19.41 ± 7.1 a
D614.41 ± 4.36 a31.66 ± 4.7 b22.03 ± 3.41 ab29.92 ± 7.83 b
PG3D413.08 ± 0.0 b9.73 ± 1.68 a12.27 ± 0.58 ab10.18 ± 1.75 ab
D631.11 ± 19.67 a21.81 ± 3.28 a14.33 ± 2.26 a18.51 ± 4.34 a
Results expressed as mean (mg·L−1) ± standard deviation (n = 3). ILFL: low injection intensity, low frequency; IHFH: high intensity, high frequency; ILFH: low intensity, high frequency; IHFL: high intensity, low frequency. C: Catechin; EC: Epicatechin; PB3: procyanidin B3; GA: Gallic acid; PCA: Protocatechuic acid; CfA: Caffeic acid; p-cuA: p-Coumaric acid; VllA: Vanillic acid; CAc: cis-Coutaric acid; CAt: trans-Coutaric acid; Rsv: trans-Resveratrol; Q: Quercetin; Tr: Tyrosol; Mr3Glu: Myricetin-3-O-glucoside; Q3Gal: Quercetin-3-O-galactoside; PG1: Procyanidin gallate; PG2: Procyanidin gallate; PG: Procyanidin gallate. Statistical comparisons were done by days of sampling (day 4 or 6 of fermentation), and mean separation was represented by lowercase letters, p ≤ 0.05 (Tukey’s test).
Disclaimer/Publisher’s Note: The statements, opinions and data contained in all publications are solely those of the individual author(s) and contributor(s) and not of MDPI and/or the editor(s). MDPI and/or the editor(s) disclaim responsibility for any injury to people or property resulting from any ideas, methods, instructions or products referred to in the content.

