Article

Comparison of Lactic Acid Production from Different Agro-Industrial Waste Materials

1
Institute of Chemical Engineering, Bulgarian Academy of Sciences, 103 Acad. G. Bontchev Str., 1113 Sofia, Bulgaria
2
The Stephan Angeloff Institute of Microbiology, Bulgarian Academy of Sciences, 26 Acad. G. Bontchev Str., 1113 Sofia, Bulgaria
*
Author to whom correspondence should be addressed.
Fermentation 2025, 11(8), 437; https://doi.org/10.3390/fermentation11080437
Submission received: 20 June 2025 / Revised: 23 July 2025 / Accepted: 29 July 2025 / Published: 30 July 2025

Abstract

In recent years, great attention has been paid to second-generation (from agricultural and industrial wastes) lactic acid (LA) production. In the present study, the possibility of two Lactiplantibacillus plantarum strains, namely 53 and 2HS, to produce LA from waste materials was investigated. Distiller’s dried grains with solubles (DDGS), spent coffee grounds (SCG), wood chips, and cheese whey were used as substrates after pretreatment, and the results were compared with those with lactose as a carbon source. Both strains were capable of assimilating sugars from all waste materials. Nearly 20 g/L LA from 23 g/L reducing sugars (RS) obtained from DDGS, 22 g/L LA from 21 g/L RS from SCG, and 22 g/L LA from 21 g/L whey lactose were produced compared to 22 g/L LA obtained from 22 g/L lactose monohydrate in the fermentation broth. The wood chip hydrolysate (WH) contains only 10 g/L RS, and its fermentation resulted in the production of 5 g/L LA. This amount is twice as low as that produced from 11 g/L lactose monohydrate. A mathematical model was constructed based on the Compertz and Luedeking–Piret equations.

1. Introduction

The declining availability of fossil fuels and worsening environmental conditions have spurred interest in utilizing renewable natural resources, like renewable biomass, to produce key industrial chemicals. Lactic acid (2-hydroxypropanoic acid) is a naturally occurring organic acid found in a variety of biological and environmental contexts. A notable feature of lactic acid (LA) is its chiral carbon atom, which makes it a stereochemically significant molecule. This chirality gives rise to two distinct enantiomers, or mirror-image forms, known as L-(+)-lactic acid (L-LA) and D-(−)-lactic acid (D-LA).
The bifunctional nature of lactic acid—owing to the coexistence of the hydroxyl and carboxyl groups—endows it with remarkable chemical versatility. This dual functionality allows lactic acid to participate in various reactions, including esterification, polymerization, and condensation, making it a valuable precursor in producing biodegradable plastics and other industrial materials. Lastly, the asymmetric optical activity associated with the chiral centre at the second carbon atom (C2) is a defining characteristic of lactic acid. This property means that the molecule can rotate plane-polarized light, a feature that has significant implications in stereoselective chemical synthesis and biochemical applications.
Growing environmental concerns have sparked significant public interest in the development of sustainable materials derived from renewable resources. Recently, the focus has shifted toward microbial-based production of various substances, utilizing renewable feedstocks as raw materials. This method offers several advantages over traditional chemical synthesis that relies on fossil fuels. It is more cost-effective, is highly adaptable to different production needs, and minimizes environmental harm. These benefits make microbial-based production a promising alternative for reducing reliance on non-renewable resources and addressing ecological challenges [1,2,3].
Lactic acid (LA) and polylactic acid (PLA) serve as an excellent example as alternatives to petroleum-based plastics due to their biodegradability, biocompatibility, and zero-pollution properties, making them suitable for applications in bioplastics, textiles, cosmetics, pharmaceuticals, probiotics, and more [4]. The global demand for lactic acid is projected to reach 1960.1 kilotons by 2025, equating to an estimated USD 9.8 billion in the international market [5,6,7]. In summary, lactic acid is a highly versatile and widely distributed organic compound with distinctive acidic, bifunctional, and stereochemical properties that make it important in both natural and industrial applications.
To compete effectively with the petrochemical industry, it is essential to lower the production costs of lactic acid. One promising approach is using second-generation sugars derived from lignocellulosic biomass, which are considered an ideal source for LA production.
Lignocellulosic biomass is one of the most abundant and promising renewable sources globally. Despite its potential, less than 100 million tons of this biomass are currently utilized for bioenergy production. The majority is either burned to generate heat or left to decompose, which not only wastes its energy potential but also contributes to rising greenhouse gas emissions.
The conversion of lignocellulosic biomass into energy fuels, such as liquid bioethanol, begins with a crucial step known as hydrolysis. During hydrolysis, the complex cellulose and hemicellulose components are broken down into simpler sugars, primarily glucose and xylose. These sugars can further convert into derivatives such as 5-hydroxymethylfurfural (HMF), furfural, and levulinic acid, depending on the specific hydrolysis conditions. This step is crucial for converting lignocellulosic biomass into viable fuel options and maximizing its potential as a renewable energy source [8]. On the other hand, these derivatives are often inhibitors of fermentation.
From our point of view, some agricultural and industrial wastes have great potential as a source of fermentable sugars for LA production. Distillers’ dried grains with solubles (DDGS) are a by-product generated during the production of first-generation bioethanol. In 2024, only in the USA, 16,100 million gallons (more than 60,945 million liters) of ethanol were produced [9]. Considering that for every gallon of ethanol produced, 5 pounds (about 2.27 kg) of DDGS are released [9], we can realize what an enormous source of fermentable sugars we have. The chemical composition of DDGS can vary widely due to multiple factors, such as the type of grain used, the specific ethanol production process and its operational parameters, and the type of yeast employed during fermentation [10]. In a review paper, Iram et al. [11] summarized the composition of various types of DDGS, their current use, and pretreatment methods for the production of value-added chemicals via fermentation. Lamsal et al. [12] investigated the microbial growth of the bacteria Pediococcus acidilactici and Lactobacillus plantarum and the yeast Saccharomyces boulardii using three types of DDGS. They found that L. plantarum grown on unmodified DDGS exhibited the highest cell count, while the same strain grown on both unmodified and enzyme-modified DDGS produced the highest volumetric productivity and lactic acid yield.
The spent coffee grounds (SCG) are also not well explored waste. Over the past 150 years, the demand for coffee has grown significantly, surpassing levels seen in earlier periods. Beyond the demographic and lifestyle changes, coffee is one of the most widely consumed beverages worldwide. Today, the coffee trade holds a significant position in the global economy and ranks second only to petroleum in terms of trade value. This significant standing highlights coffee’s broad appeal, its pivotal role in supporting the economies of coffee-producing countries, and its ongoing influence on global markets [13]. In 2024, about 10.5 million tons of coffee were produced worldwide [14]. Spent coffee grounds are a common by-product, resting during coffee brewing [15]. SCG represent another abundant source of fermentable sugars because about 650 kg of SCG is generated from each ton of coffee [16]. According to Ballesteros et al. [17], SCG contain sugars in the following amounts: about 37% mannose, 32% galactose, 24% glucose, and 7% arabinose, while xylose is not present. SCG are rich in carbohydrates, lipids, proteins, and minerals. SCG polysaccharides can be valorized to produce energy, biofuel, biopolymer precursors, lactic acid, and composite production [18]. Montemurro et al. [19] applied different approaches for treating SCG—cryo-milling, microwave-assisted extraction (MAE), and enzyme-assisted extraction (EAE). They reported up to an 8-fold increase in soluble matter. MAE led to the highest amount of soluble fiber and oligosaccharides, while EAE increased the sugar content and promoted the release of nutrients from SCG.
Whey is the liquid portion that remains after milk coagulates during cheese making and contains several nutrients crucial for microbial growth. In 2024, global cheese production continued its upward trajectory, reaching approximately 22.52 million tons [20]. Among whey’s most abundant components, lactose is the dominant carbohydrate, accounting for 46–54 g/L. This high lactose content is a key factor that makes whey a valuable substrate for fermentation, as lactose is an energy source for many microorganisms. Besides lactose, whey contains soluble proteins (6–10 g/L), fats (0.2–0.5 g/L), and mineral salts (2.5–4.7 g/L) [21]. These components are vital to whey’s overall nutritional profile, aiding various metabolic processes in microorganisms and enhancing their growth and activity during fermentation. For example, proteins are significant, as they support microorganisms’ growth using amino acids and peptides for nutrition. Due to its high lactose content, whey was frequently used as a substrate for lactic acid (LA) production. In their review paper, Panesar et al. [22] summarized information about whey types, their composition, the microorganisms involved in LA production from lactose using free or immobilized cells, the type of process, and the bioreactor design.
The production of cellulose from wood involves several technological steps to separate cellulose fibers from other wood components, such as lignin, hemicellulose, and extractives. The most common process is the so-called Kraft process. In recent years, global wood cellulose (pulp) production has been approximately 190–200 million metric tons annually, with 150 million coming from the Kraft process [23]. The main by-product of the Kraft pulping process is black liquor (BL), which consists of dissolved hemicellulose, lignin, spent cooking chemicals, and other organic residues. Typically, 7–10 tons of black liquor per ton of pulp is generated, containing about 15–20% solids. Approximately 50% of the dry solids consist of lignin, while 30% are hemicellulose.
All the renewable sources have been utilized for lactic acid (LA) production. L-LA is the more common form and has been widely produced on an industrial scale through microbial fermentation. In contrast, D-LA is much rarer and has not been extensively explored for large-scale production.
Lactic acid bacteria (LAB) are a diverse group of taxonomically distinct microorganisms, united by their ability to form lactic acid during the fermentation of various carbon sources. They can be categorized into three main groups based on their metabolic pathways for LA synthesis: homofermentative, heterofermentative, and facultative heterofermentative LAB. Each group utilizes distinct biochemical mechanisms to convert sugars into LA, resulting in varying by-products and energy yields.
Homofermentative LAB primarily produce LA from hexose sugars through the Embden–Meyerhof–Parnas pathway (EMP-P). This process is highly efficient, converting most hexoses directly into LA without generating significant by-products. In contrast, heterofermentative LAB use the phosphoketolase pathway (PK-P) to metabolize hexoses and pentoses. This pathway yields LA and by-products such as carbon dioxide, acetate, or ethanol. The ability to produce multiple by-products reflects a more diverse metabolic capability but often comes at the expense of LA yield.
Facultative heterofermentative LAB represent a unique and versatile subgroup. These bacteria can switch between the EMP-P and PK-P depending on the type of sugars available. Hexoses are metabolized via the EMP-P, while pentoses are processed through the PK-P [24]. This flexibility provides facultative heterofermentative LAB with a significant advantage in adapting to diverse environmental conditions. The PK-P offers additional benefits, such as the generation of adenosine triphosphate (ATP) and sufficient nicotinamide adenine dinucleotide (NAD+), which helps the bacteria navigate low-energy states. This temporary metabolic adjustment allows the cells to re-enter the EMP-P and produce more ATP during their metabolic processes, ensuring survival and growth in challenging conditions.
The adaptability and robustness of LAB have made them indispensable in various industries, particularly in food fermentation, where their acid-producing capabilities play a central role in flavor development, preservation, and safety. Their metabolic versatility and ability to thrive under harsh conditions make LAB important subjects of scientific research, especially in exploring their potential in biotechnology and health-related applications.
The purpose of the present investigation was to select LAB strains capable of assimilating the sugars present in some waste materials, to study the kinetics, and to model the process of lactic acid production. The waste streams were dilute acid and enzyme hydrolysates from DDGS and SCG, cheese whey, and a by-product stream from the Kraft process of cellulose production from wood.

2. Materials and Methods

2.1. Raw Materials and Pretreatment

Corn Distiller’s dried grains with solubles (DDGS) were kindly supplied by the distillery Almagest Ltd., Verinsko village, Bulgaria. According to the supplier’s specifications, the DDGS provided contained 28.4% protein, 12.2% fat, and 8.4% starch and 6.3% fibers.
Beyond the basic composition provided by the supplier, further analysis of other components was conducted using established Standard Biomass Analytical Methods. These methods, developed by the National Renewable Energy Laboratory (NREL) in Golden, Colorado, USA, are widely recognized for their accuracy in characterizing biomass materials. The detailed results of this analysis, which offer a deeper insight into the chemical and nutritional profile of the DDGS sample, are summarized in Table 1.
Spent coffee grounds were sourced from a local coffee shop. Before further use, the coffee grounds were oven-dried at 105 °C until they reached a constant mass. After drying, the grounds were stored in a freezer. The SCG were also analyzed according to NREL protocols, and the results are presented in Table 1.
Another essential material included in this study was wood hydrolysate (WH), obtained from the Faculty of Chemical Technologies, University of Chemical Technology and Metallurgy, Sofia. Chips from Black Locust (Robinia pseudoacacia L.) were subject to steam explosion (time 10 min, hydro module 1:10, temperature 200 °C, and pressure 1.55 MPa). Before that, chips were debarked, cut, and sorted (the average size was 20 × 5 × 5 mm). The liquid fraction was then treated with enzymes to a final content of D-cellobiose 0.149 g/L, D(+)-glucose 0.879 g/L, D(+)-xylose 3.870 g/L, D(+)-mannose 0.091 g/L, hydroxymethyl furfural 0.056 g/L, and furfural 0.007 g/L.
The whey used was obtained as a by-product from sheep’s milk cheese production. Preliminary analyses were conducted to assess the whey lactose content, and it was found that the whey had a lactose concentration exceeding 40 g/L. Given the high lactose content, the whey was diluted with distilled water in a 1:1 ratio for the fermentation experiments.
The preparation of hydrolysates from DDGS and SCG involved several sequential steps to ensure their suitability for fermentation. A 500 mL stock solution containing 10% w/v dry material was prepared. This mixture was hydrolyzed in an autoclave with 1% sulfuric acid at a pressure of 1 atm for one hour. After that, the hydrolysates underwent enzymatic treatment to enhance their conversion efficiency. The enzyme cellulase “Onozuka R-10”, produced by Yakult Pharmaceutical Industries Co., Ltd., Tokio, Japan, was used. This enzyme treatment was conducted at a pH of 4.5 and a temperature of 45 °C for 24 h, with an enzyme activity of 20 units per gram of substrate. For removing inhibitory compounds from hydrolysates, activated carbon (10% w/v) was added. The mixture was then shaken at room temperature for one hour and filtered.
To further purify and detoxify the hydrolysates, Carrez solutions (potassium ferrocyanide, K4[Fe(CN)6], and zinc sulfate, ZnSO4) were used to precipitate proteins. After filtering out the precipitated proteins, calcium hydroxide was added to the hydrolysate to adjust the pH to approximately 10. This step also facilitated the partial removal of inhibitors and neutralized excess sulfate ions introduced during the initial acid hydrolysis. The pH of the resulting solution was then adjusted to 5.5 using dilute H2SO4.
For further stabilization of the hydrolysates, sodium sulfite (Na2SO3) at a concentration of 0.1% was added. The solution was boiled for three hours, and distilled water was added to restore it to its original volume.
This comprehensive preparation ensured that the hydrolysates from spent grains and coffee grounds were adequately purified, detoxified, and optimized for fermentation media preparation, making them suitable substrates for biotechnological applications. and the resulting liquid was used for fermentation media preparation, with aliquots taken and adjusted to the desired reducing sugar concentration.
The wood hydrolysate was included in the detoxification and purification steps to separate fermentation inhibitors and for consistency.

2.2. Microorganisms and Culture Conditions

In this study, 7 Lactobacillus strains with human or dairy origin (Table 2) from the microbial collection (IMicB) of the laboratory “Lactic acid bacteria and Probiotics” of the Stefan Angeloff Institute of Microbiology (IMicB), BAS, were preselected. All strains were stored at −20 °C in MRS (De Man, Rogosa, Sharp) medium, pH 6.5, supplemented with 20% v/v glycerol (Difco, Heidelberg, Germany). Before the assay, all strains were pre-cultured twice in MRS broth (HiMedia, Mumbai, India) for 24 and 48 h, respectively, with 2% v/v inoculum. Activated exponential-phase cultures of both strains were used as the 10% v/v inoculum for the fermentation process.

2.3. Waste Substrate Fermentation

Once the strain had been pre-cultured and was in the desired exponential phase, it was used as the inoculum for the fermentation process. The inoculum was added to the fermentation broth at a concentration of 10%, ensuring enough viable cells to initiate and sustain fermentation. The MRS medium used in this study was carefully prepared with a specific composition to support the growth of lactic acid bacteria. The medium contained several key ingredients, each contributing to the overall nutritional profile required for optimal bacterial growth. The composition per liter (g/L) was as follows: lactose monohydrate: 11 g, yeast extract: 5.5 g, peptone: 12.5 g, potassium dihydrogen phosphate (KH2PO4): 0.25 g, dipotassium hydrogen phosphate (K2HPO4): 0.25 g, sodium acetate (CH3COONa): 10.0 g, magnesium sulfate heptahydrate (MgSO4·7H2O): 0.1 g, manganese sulfate tetrahydrate (MnSO4·4H2O): 0.05 g, iron sulfate heptahydrate (FeSO4·7H2O): 0.05 g, and distilled water: 1000 mL. The final pH of the medium was adjusted to 6.5. In experiments with different waste hydrolysates, lactose was substituted with the corresponding carbon source. Fermentations were carried out without pH control. All fermentation experiments were duplicated. Each sample was analyzed in triplicate, and the results, presented in the figures, were expressed as the mean value.

2.4. Analysis

An HPLC (High-Performance Liquid Chromatography) system was utilized for the analysis in this study, consisting of several key components. The system included a Smartline S-100 pump from Knauer GmbH (Berlin, Germany), which provided the necessary pressure for the liquid chromatography process. A refractometric detector, the Perkin-Elmer LC-25RI (PerkinElmer, Waltham, MA, USA), was used to measure the changes in the refractive index of the eluting compounds, allowing the detection of various substances in the sample. The system was controlled and operated using EuroChrom software v. 3.05, which enabled precise data acquisition and analysis.
Two columns sourced from Bio-Rad (Hercules, CA, USA), namely Aminex HPX-87H for lactic acid and Aminex HPX-87C for sugars, were used. The analysis was carried out in isocratic mode at 70 °C. The mobile phase consisted of a 0.01 N H2SO4 solution, at a flow rate of 0.6 mL/min. Before injection, the samples were filtered through a 0.22 μm filter (Millipore, Burlington, MA, USA).
To determine the biomass concentration, optical density (OD) was measured at 620 nm using a VWR UV-1600 PC spectrophotometer (VWR International, San Francisco, CA, USA). Biomass suspensions with known precise concentration (g/L) were used for the preparation of a calibration curve.
A modified Bertrand’s method [25] was applied for determining the concentrations of reducing sugars in the hydrolysates. This method is typically used to measure the concentration of reducing sugars in various samples, providing an important metric for understanding the sugar content in the hydrolysates.
The moisture content of the DDGS and SCG was determined through precise measurements using a thermogravimetric balance (Kern MRS 120-3, KERN & SOHN GmbH, Balingen, Germany). Based on three separate measurements, the mean final moisture content was calculated. A pH meter HI2211 (HANNA instruments, Bedfordshire, UK) was used for pH measurement.

2.5. Mathematical Modeling

The large number of parameters in the mathematical description is a specific feature in the modeling of biotechnological processes. Model parameter identification is challenging because the least squares function is multi-extremal, or some minima have a ravine structure. For the minimization procedure, very good initial parameter values (in the global minimum area) are required for the solution of this problem.
The main objective of the fermentation process is maximum product yield with full utilization of the substrate. Developing a reliable mathematical model and accurately determining its kinetic parameters are critical for understanding processes, predicting, optimizing, and scaling up fermentation.
Modeling the fermentation process involves simulating the biological, chemical, and physical changes that occur during the fermentation process. The goal of such models can range from optimizing production to better understanding microbial behavior under different conditions.
A mathematical model of the fermentation process includes a set of coupled differential equations describing cell growth, substrate consumption, and product formation.
For the description of microbial growth, the modified Gompertz model [26] is used:
X t = X 0 + A 1 + e x p 4 μ m a x A λ t + 2
where X0 is the initial biomass concentration, g/L; t is time, h; A is the asymptotic level of biomass, g/L; λ is the duration of the lag phase, h; and µmax is the maximum specific growth rate, h−1.
The Luedeking–Piret equation was used to describe the formation of lactic acid [27]. It takes into consideration that the rate of product accumulation dP/dt is a function of the bacterial growth rate dX/dt as well as the bacterial density X:
d P d t = α d X d t + β X t = 0 , P = P 0
α and β are coefficients related to growth and non-growth product formation.
The rate of substrate consumption is closely related to the cell’s growth rate and the rate of product formation. The following equation is usually given to describe this relationship:
d S d t = 1 Y X / S d X d t 1 Y P / S d P d t m s X t = 0 , S = S 0
where YX/S and YP/S are yield coefficients for biomass on substrate and product on substrate, respectively, g/g, while mS is the biomass maintenance energy coefficient, g/g.h. Because of the very low value of mS, it is usually neglected. The utilization of substrate is closely related to the cell’s growth rate and the rate of product formation.

3. Results and Discussion

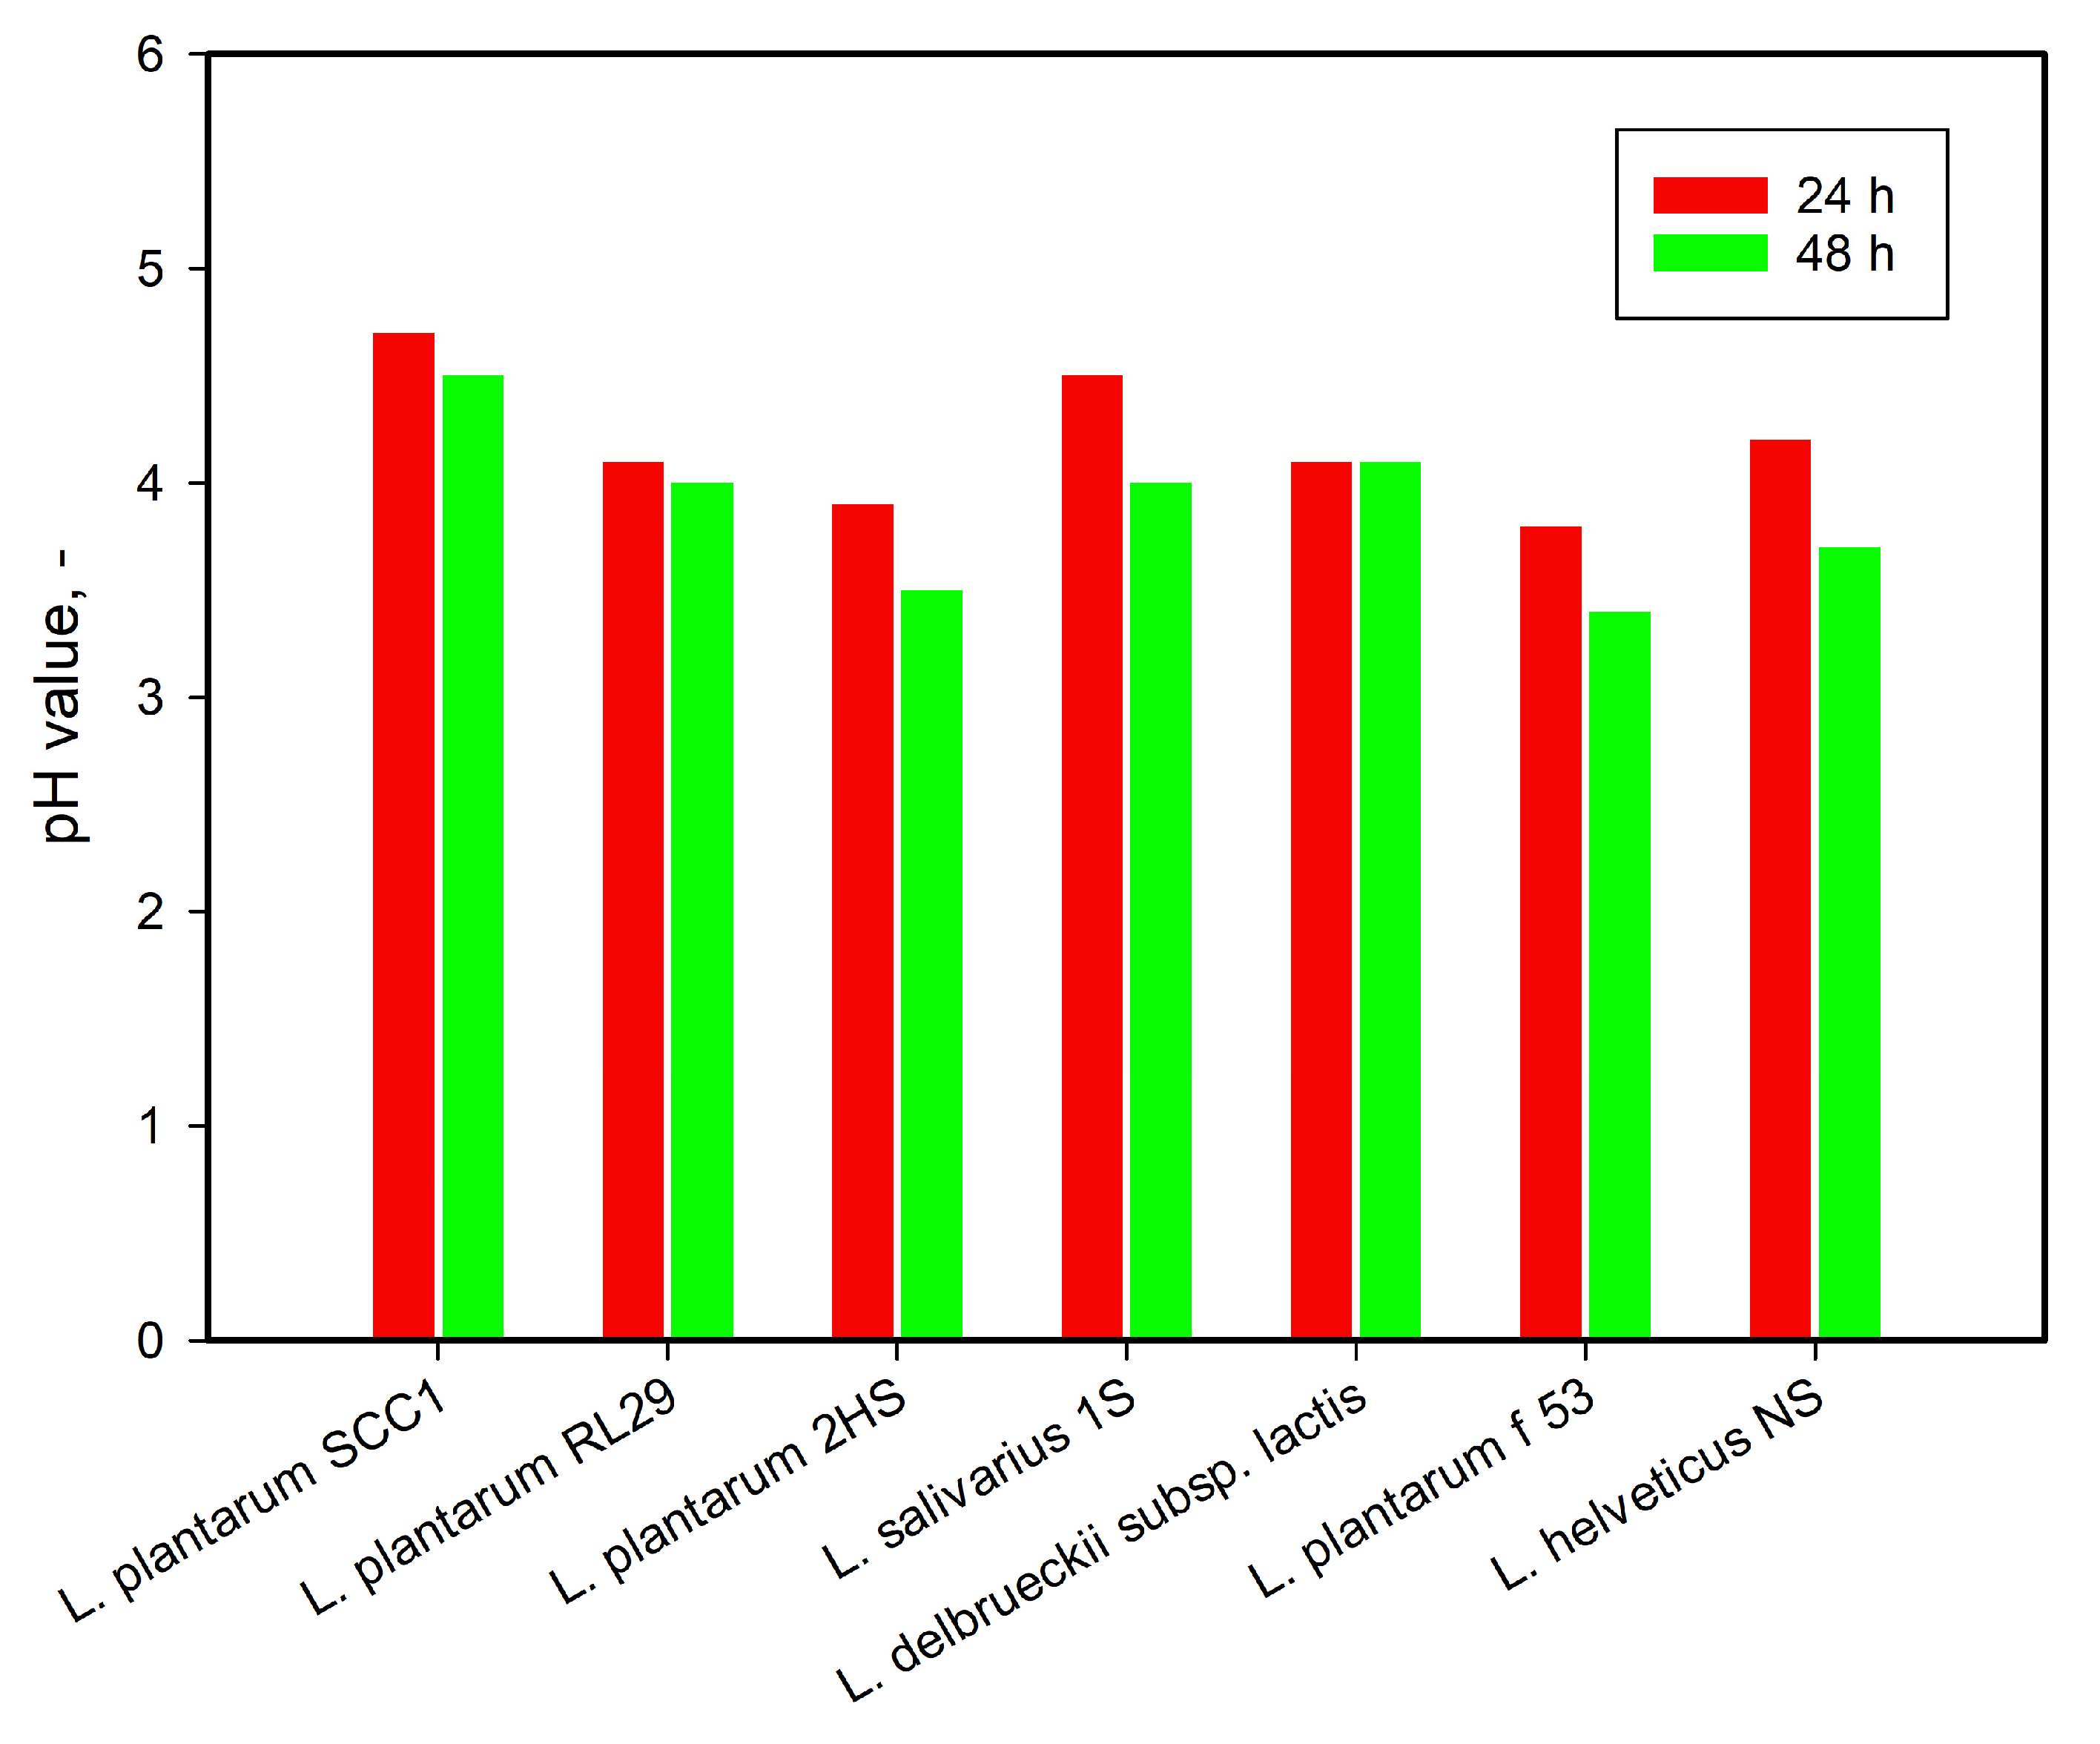
3.1. Strain Selection and Identification

The lactobacilli strains were selected based on their ability to rapidly acidify the fermentation broth. All seven strains were grown on MRS broth with lactose as the substrate, and the pH was measured. The results are presented in Figure 1. Two Lactiplantibacillus plantarum strains, namely 2HS and f53, were preselected on this basis for further investigation, and both have human origins. Lactobacillus strains, which are good acid formers, must also have defense mechanisms that allow them to survive the acid stress they create. Therefore, its ability to survive pH conditions of 2.0 to 3.0 was assessed. Both L. plantarum strains 2HS and f53 remained viable but did not grow at this low pH. After reconditioning in MRS broth at pH 6.5, both strains recovered their capacity for LA production. The optimal growth for them was reported at an initial pH of 6.5–5 under laboratory conditions.
The isolates 2HS and f53 have been characterized according to a polyphasic taxonomy approach, combining classical phenotypic and molecular methods, and were identified as Lactiplantibacillus plantarum species (unpublished data). This places them within the newly formed Lactiplantibacillus genus, well known for its various health benefits and industrial applications. L. plantarum strains are commonly found in the human microbiome as well as in fermented foods such as yogurt, sauerkraut, and pickles. These strains are known for their ability to survive in harsh environments and for their probiotic properties, including promoting gut health and contributing to the balance of the intestinal microbiota.
Their QPS status, as confirmed by EFSA, underscores their safety and suitability for use in various food and biotechnological applications, ensuring they are both beneficial and secure for human consumption. These strains represent a valuable resource for further studies and potential industrial uses, particularly in the field of probiotics and fermentation.

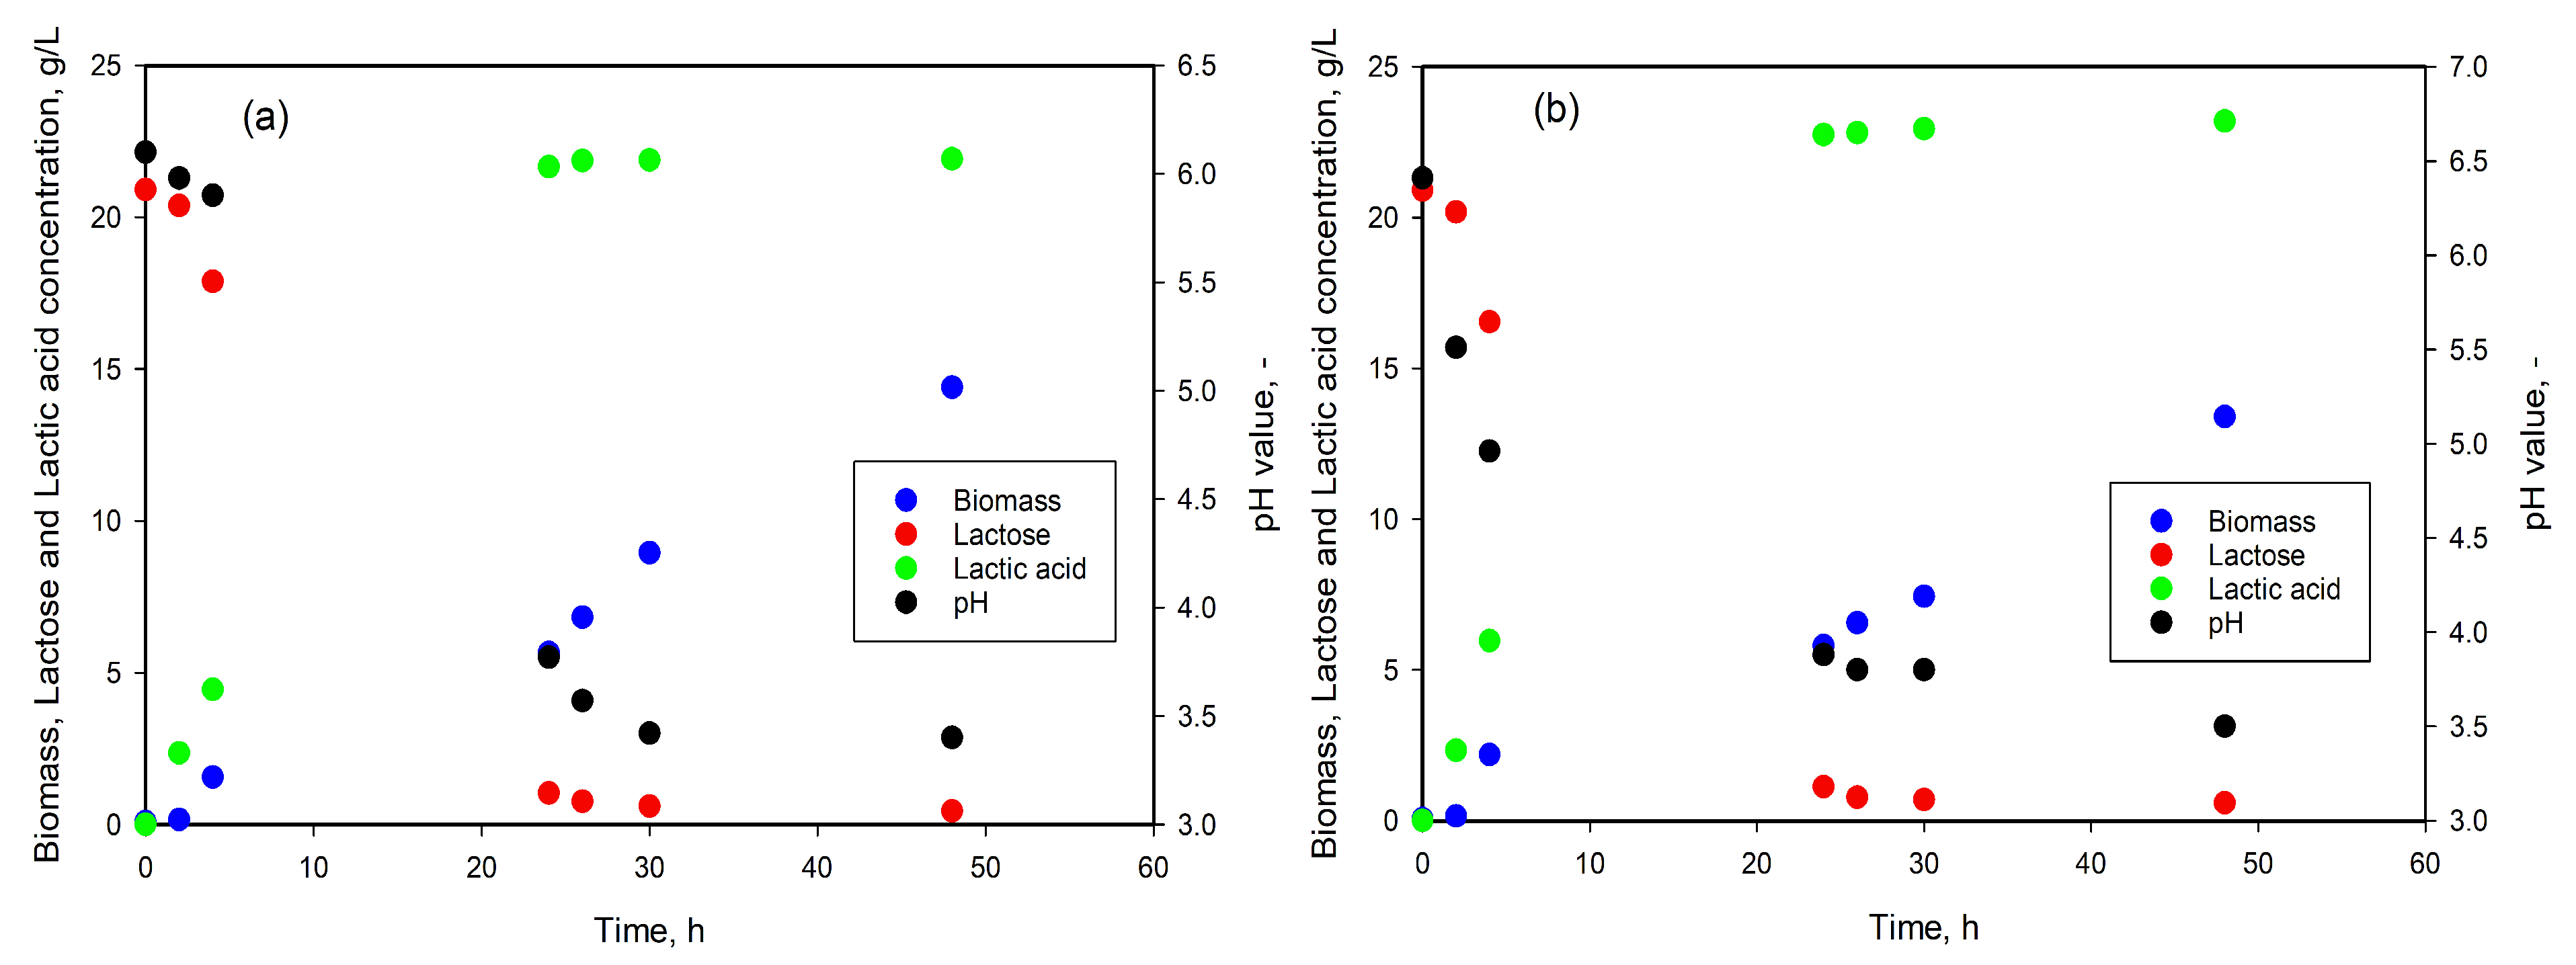
3.2. LA Production from Lactose

The experiments started with MRS broth containing 22 g/L lactose monohydrate as a carbon source. The results from fermentation without pH control are shown in Figure 2. Both strains are capable of fully converting the lactose in 24 h, and about 95% of the lactose was consumed in 24 h. The 2HS strain produced a slightly higher quantity of LA, 23.1 g/L, compared to 21.9 g/L for f53. The productivity was 0.95 g/L/h and 0.9 g/L/h within 24 h. The produced LA represents 100% from the theoretical yield for 2HS and 99.5% for f53.

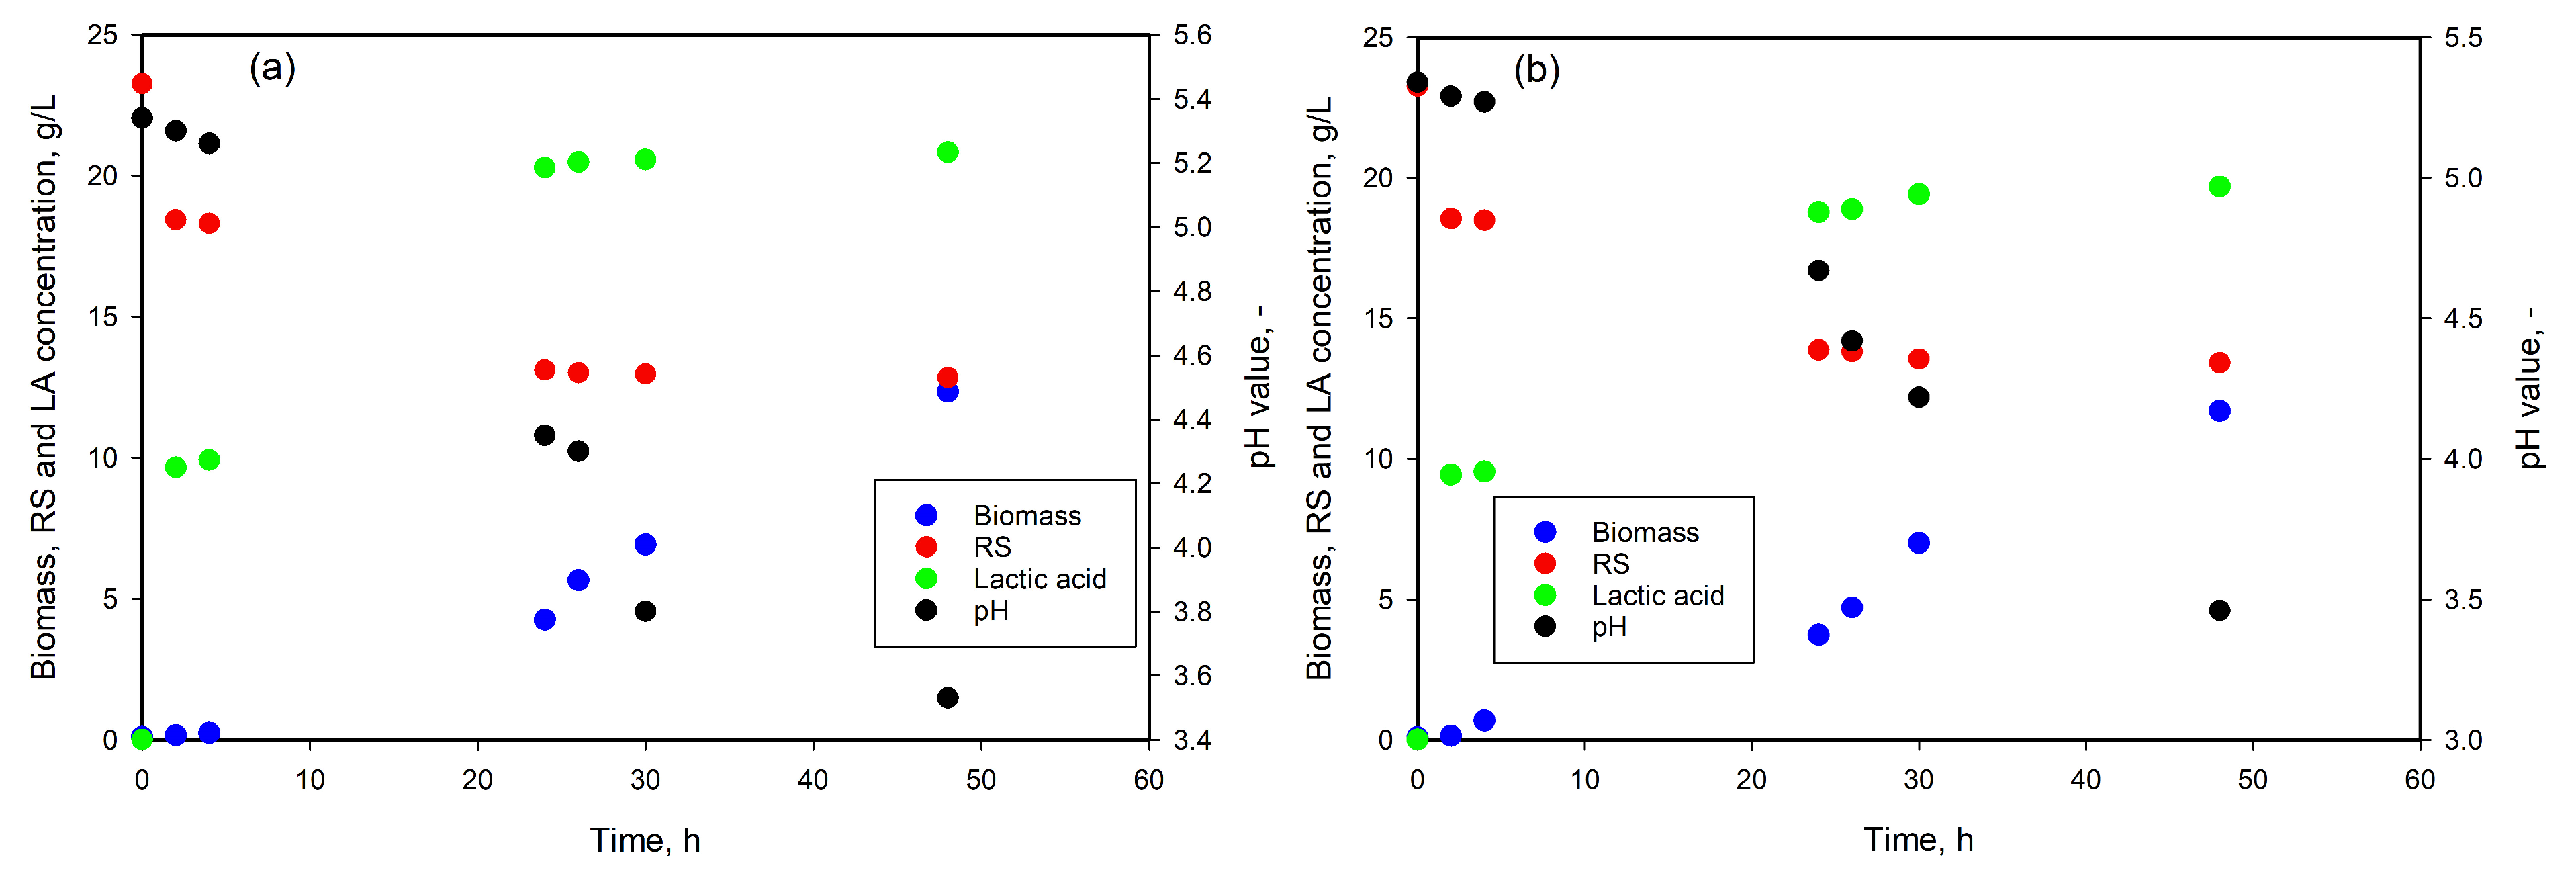
3.3. LA Production from DDGS Hydrolysates

For the preparation of the fermentation broth, a purified and detoxified aliquot of 100 mL with 23.85 g/L reducing sugars was used as a carbon source. The solution was supplemented with all necessary components of MRS. The results from fermentation are presented in Figure 3. Both L. plantarum strains produced about 20 g/L LA, with f53 strain reaching this value earlier, at the 24th hour, while the 2HS strain at 30th hour. Within 24 h, the productivity was 0.85 g/L/h and 0.78 g/L/h, respectively, 0.1 g/L/h lower than that with lactose.
These results are like those reported in the literature. For example, Zaini et al. [28] studied LA production from DDGS hydrolysate (alkaline and enzyme) via the co-fermentation of Lactobacillus pentosus and Lactobacillus coryniformis. The authors reported a yield of 28.5 g/L LA after 18 h, corresponding to 83.3% in the simultaneous co-fermentation of both strains. In another paper, the authors examined D-lactic acid production from treated DDGS via separate hydrolysis and fermentation (SHF) and simultaneous saccharification and fermentation (SSF) by Lactobacillus coryniformis subsp. torquens [29]. The SSF process resulted in higher LA production (27.9 g/L) and a conversion yield of 84.5%. By applying a fed-batch SSF approach, the D-lactic acid production increased to 38.1 g/L; however, the conversion yield decreased to 70%. Wang et al. [30] investigated the consecutive solid-state fermentation of corn and rice DDGS with Bacillus subtilis and Lactobacillus plantarum, observing disruption of lignocellulose and macromolecular proteins along with an increase in monosaccharides and small peptides. The quantity of organic acids (lactic, formic, and butyric) also increased significantly after fermentation. Naydenova et al. [16] compared the amount of reducing sugars obtained from different types of DDGS pretreatment (alkali, dilute acid, and enzyme). They assessed various factors (acid concentration, time, pressure, solid-to-liquid ratio). The LA production from hydrolysates by Lactobacillus plantarum with and without pH control was monitored and compared with lactose as a substrate. A mathematical model was proposed, showing a very good agreement with the experimental data.

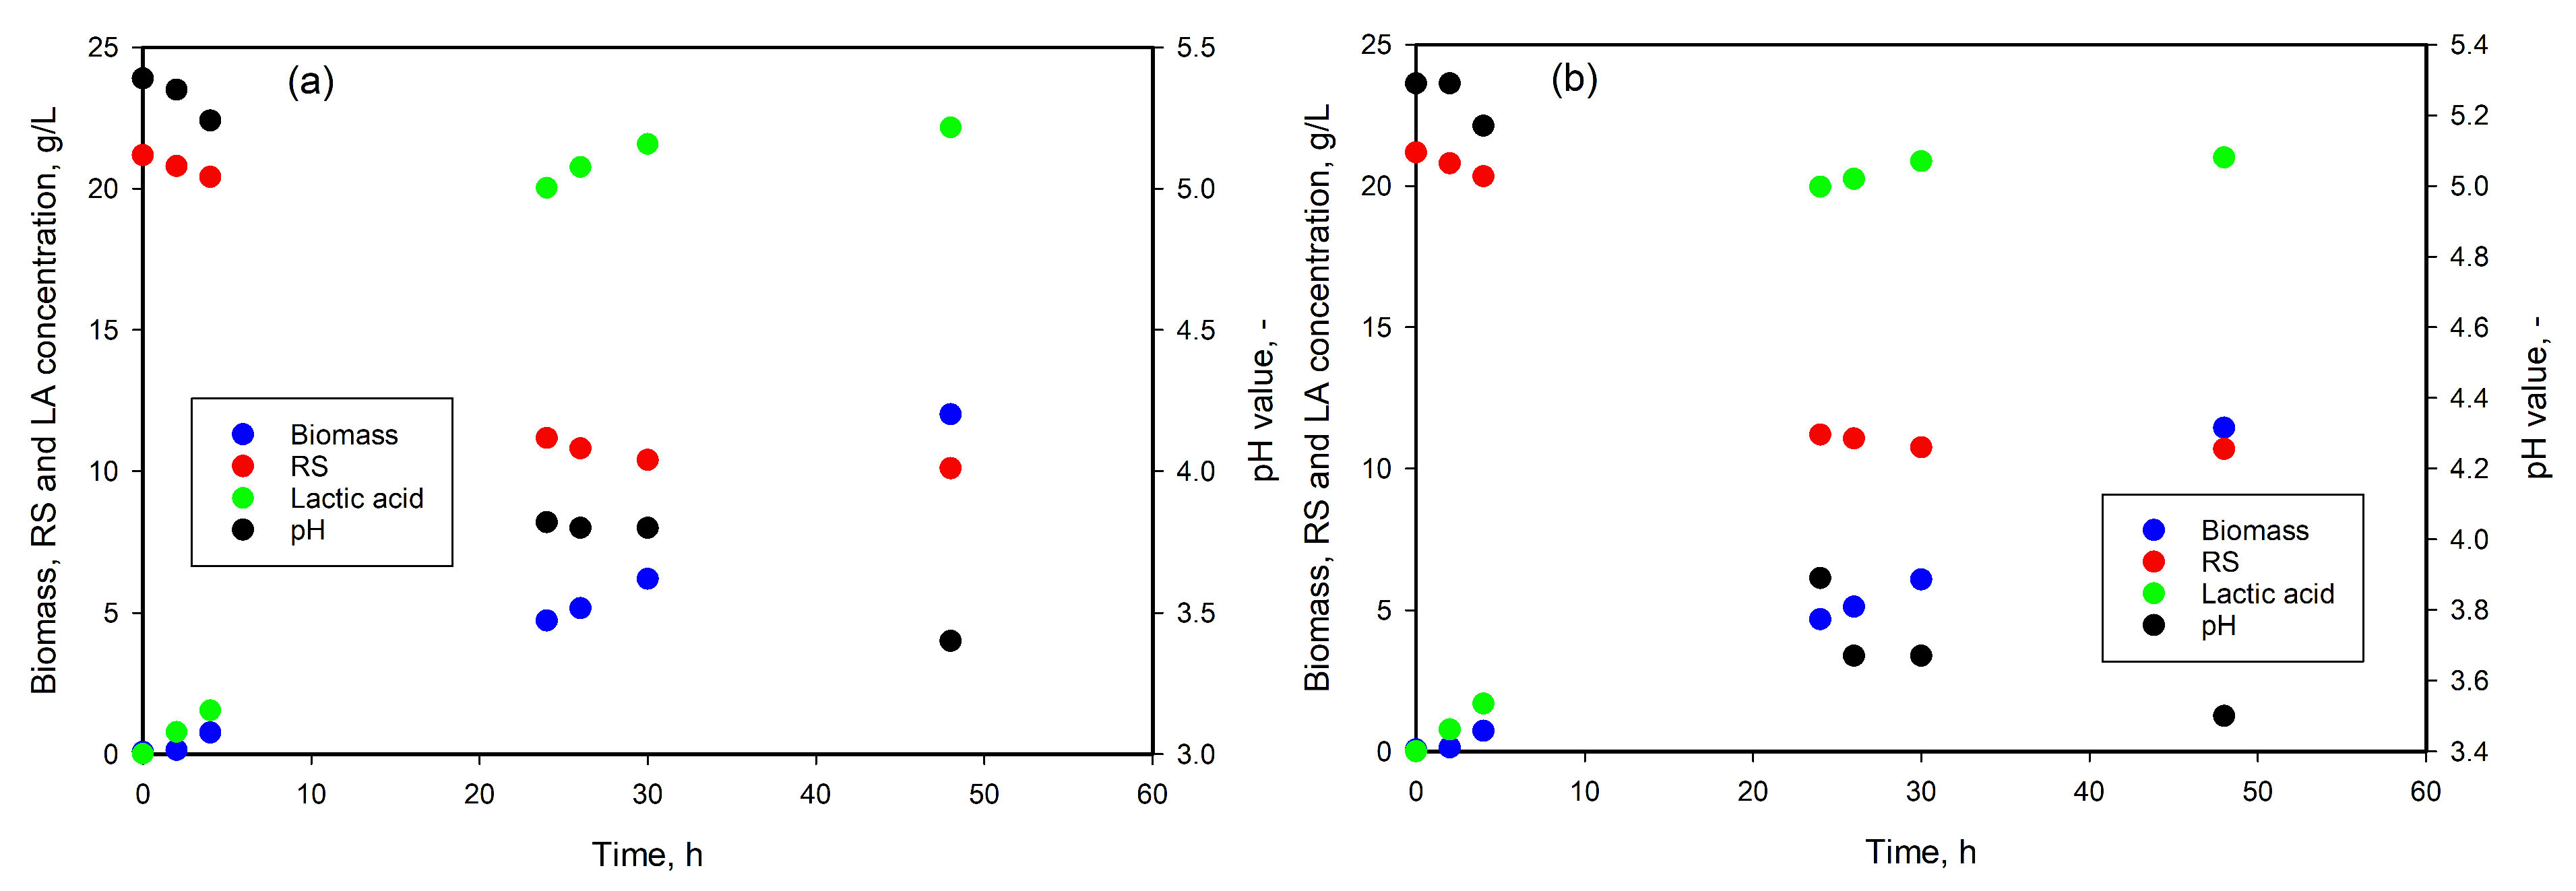
3.4. LA Production from SCG Hydrolysates

For LA production from SCG hydrolysates, a solution containing 21.18 g/L RS was used. After supplementation with nitrogen sources and minerals, the solution was seeded with 10% strains in the exponential phase. The results from 48 h fermentation are shown in Figure 4.
Both strains produced about 20 g/L LA in 24 h and 22.16 g/L for the f53 compared to 21.0 g/L for 2HS at the end of the process. The productivity in both cases was 0.83 g/L/h.
Many authors investigated biotechnological LA production from spent coffee grounds. Hudeckova et al. [31] used a combination of dilute acid hydrolysis and enzymatic saccharification to prepare substrates for different LA producers. Lactobacillus rhamnosus, strain CCM 1825, was found to be the most promising producer of LA. Relatively high lactic acid concentrations (25.69 ± 1.45 g/L) from 35 g/L initial RS concentration and yield (98%) were reported. Kim et al. [32] used SCG pretreated by different methods (acid, alkali, acetic acid–sodium chlorite (AASC), and hydrogen peroxide plus acetic acid (HPAC)), followed by an enzyme hydrolysis with a combination of three enzymes. The maximum quantity of fermentable sugars was obtained in the cases of AASC and HPAC pretreatment. The highest LA production of 22.8 g/L (99.6% of the theoretical maximum yield) was achieved from HPAC hydrolysates by a Lactiplantibacillus plantarum in SHF mode. Lee et al. [33] optimized the conditions of alkali SCG pretreatment for LA production. The optimum conditions for the alkali pretreatment of SCG were determined (75 °C, 3% KOH, and 2.8 h hydrolysis). The optimum conditions for subsequent enzyme hydrolysis were determined: 15-unit cellobiase, 30-unit cellulase, and 50-unit mannanase per gram of biomass. The optimum reaction time was found to be 96 h. Lactobacillus strains L. brevis ATCC 8287 and L. parabuchneri ATCC 49374 were used for the LA production from the obtained hydrolysates, with the conversion of 40.1% and 55.8%, respectively. The maximum lactic acid production obtained by L. parabuchneri was 101.2 g/1000 g of SCG. An interesting approach for converting SCG hydrolysates to LA was described in the paper of Kopp et al. [34]. Mannose from dilute acid SCG hydrolysates was converted to lactic acid using a cell-free enzyme extract from Thermoplasma acidophilum. As a result, 4.4 ± 0.1 mM LA was produced from 14.57 ± 0.7 mM SCG-derived mannose (about 30% conversion).

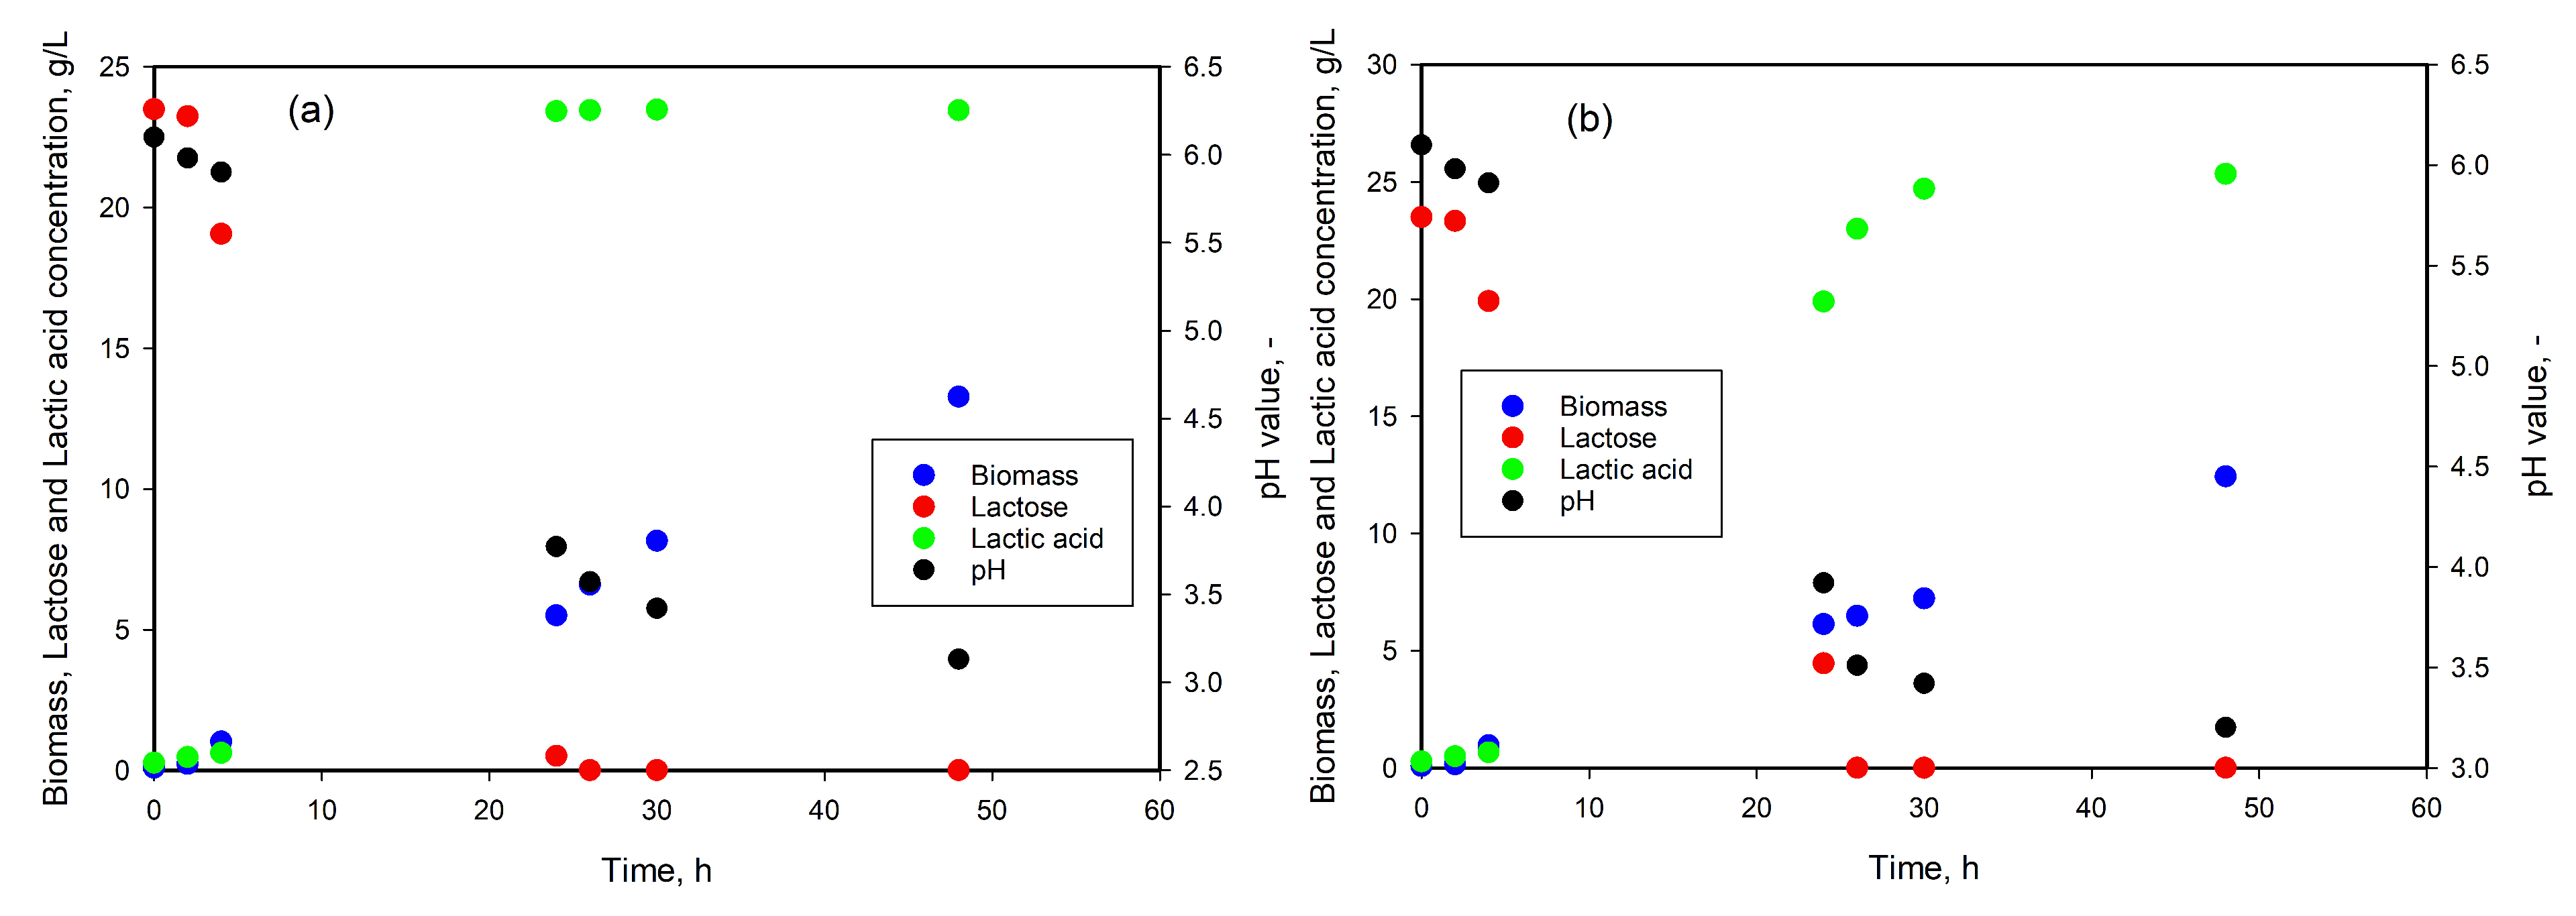
3.5. LA Production from Whey

Because of the high lactose content in available milk whey (about 47 g/L), it was diluted at a 1:1 ratio and then supplemented with the necessary MRS components. The results from whey fermentation by both strains are given in Figure 5. All the lactose was consumed within 24–26 h, and 23.45 and 25.33 g/L LA (productivity of 0.98 g/L/h and 1.06 g/L/h, respectively) were produced by f53 and 2HS strains. These results (91.1% from theoretical yield for f53 and 100% for 2HS) were the best among all substrates used except lactose.
Turner et al. [35] utilized an engineered yeast Saccharomyces cerevisiae strain to convert whey lactose into lactic acid, achieving a production of 0.358 g of lactic acid per g of lactose. Alonso et al. [36] examined the use of yogurt whey for LA production by Lactobacillus casei, highlighting the significance of pH control and yeast extract supplementation in the fermentation process. They reported a successful utilization of whey sugars (around 60 g/L), with an LA production of 14.5 g/L in pH-uncontrolled and 25.9 g/L in pH-controlled fermentation for 34 h. The effects of different process parameters on LA production from whey were investigated by Taleghani et al. [37]. The authors studied the influence of temperature, inoculum volume, initial lactose concentration, and amount of yeast extract on LA production from cheese whey by Lactobacillus bulgaricus. The optimal conditions for maximal LA production were 42 °C, 5%, 90 g/L, and 1%. Under these conditions, a substrate conversion of about 70% and LA production of 32.1 g/L were obtained. A similar study was conducted by Panesar et al. [38], who used Lactobacillus casei to convert whey powder to LA. They varied pH value, temperature, inoculum size and age, agitation speed, and incubation time to enhance lactose consumption and LA production from whey. The optimized process conditions led to a significant increase in lactose conversion to lactic acid and a reduction in fermentation time, achieving a lactose conversion of 95.62% and L(+) lactic acid production of 33.73 g/L from a 4% lactose solution after 36 h.

3.6. LA Production from Wood Hydrolysate

The solution from wood hydrolysate (WH) contained 10 g/L RS, mainly pentoses. This is presumably the reason for lower LA production, only 5 g/L, and low productivity, −0.19 g/L/h for f53 and 0.17 g/L/h for 2 HS.
Lactic acid can be produced from different wood hydrolysates. For example, Byuondo and Liu [39] used the maple wood chip hydrolysate for LA production. Production of LA from waste plywood chips’ hydrolysates was described [40,41], while Eom et al. [42] used the whole slurry of oil palm trunk.
Usually, black liquor (a by-product stream from the Kraft process of cellulose production from wood) is discarded as waste or burned for energy recovery. The first step in the valorization of BL is lignin separation by precipitation followed by treatment of the delignified BL to obtain different value-added products. Niemela et al. [43] investigated the impact of Kraft pulping conditions on black liquor composition from pine wood chips. Pola et al. [44] have summarized and discussed the information about alternative ways of valorizing Kraft black liquor. The existing methods have been classified as direct use and physical, chemical, thermochemical, electrochemical, or biochemical treatments. Recent research on the bioconversion of black liquor into bioplastics, biohydrogen, biogas, and chemicals was discussed by Morya et al. [45]. Brown et al. [46] optimized black liquor-containing media for growth and lactic acid production by Paenibacillus glucanolyticus.

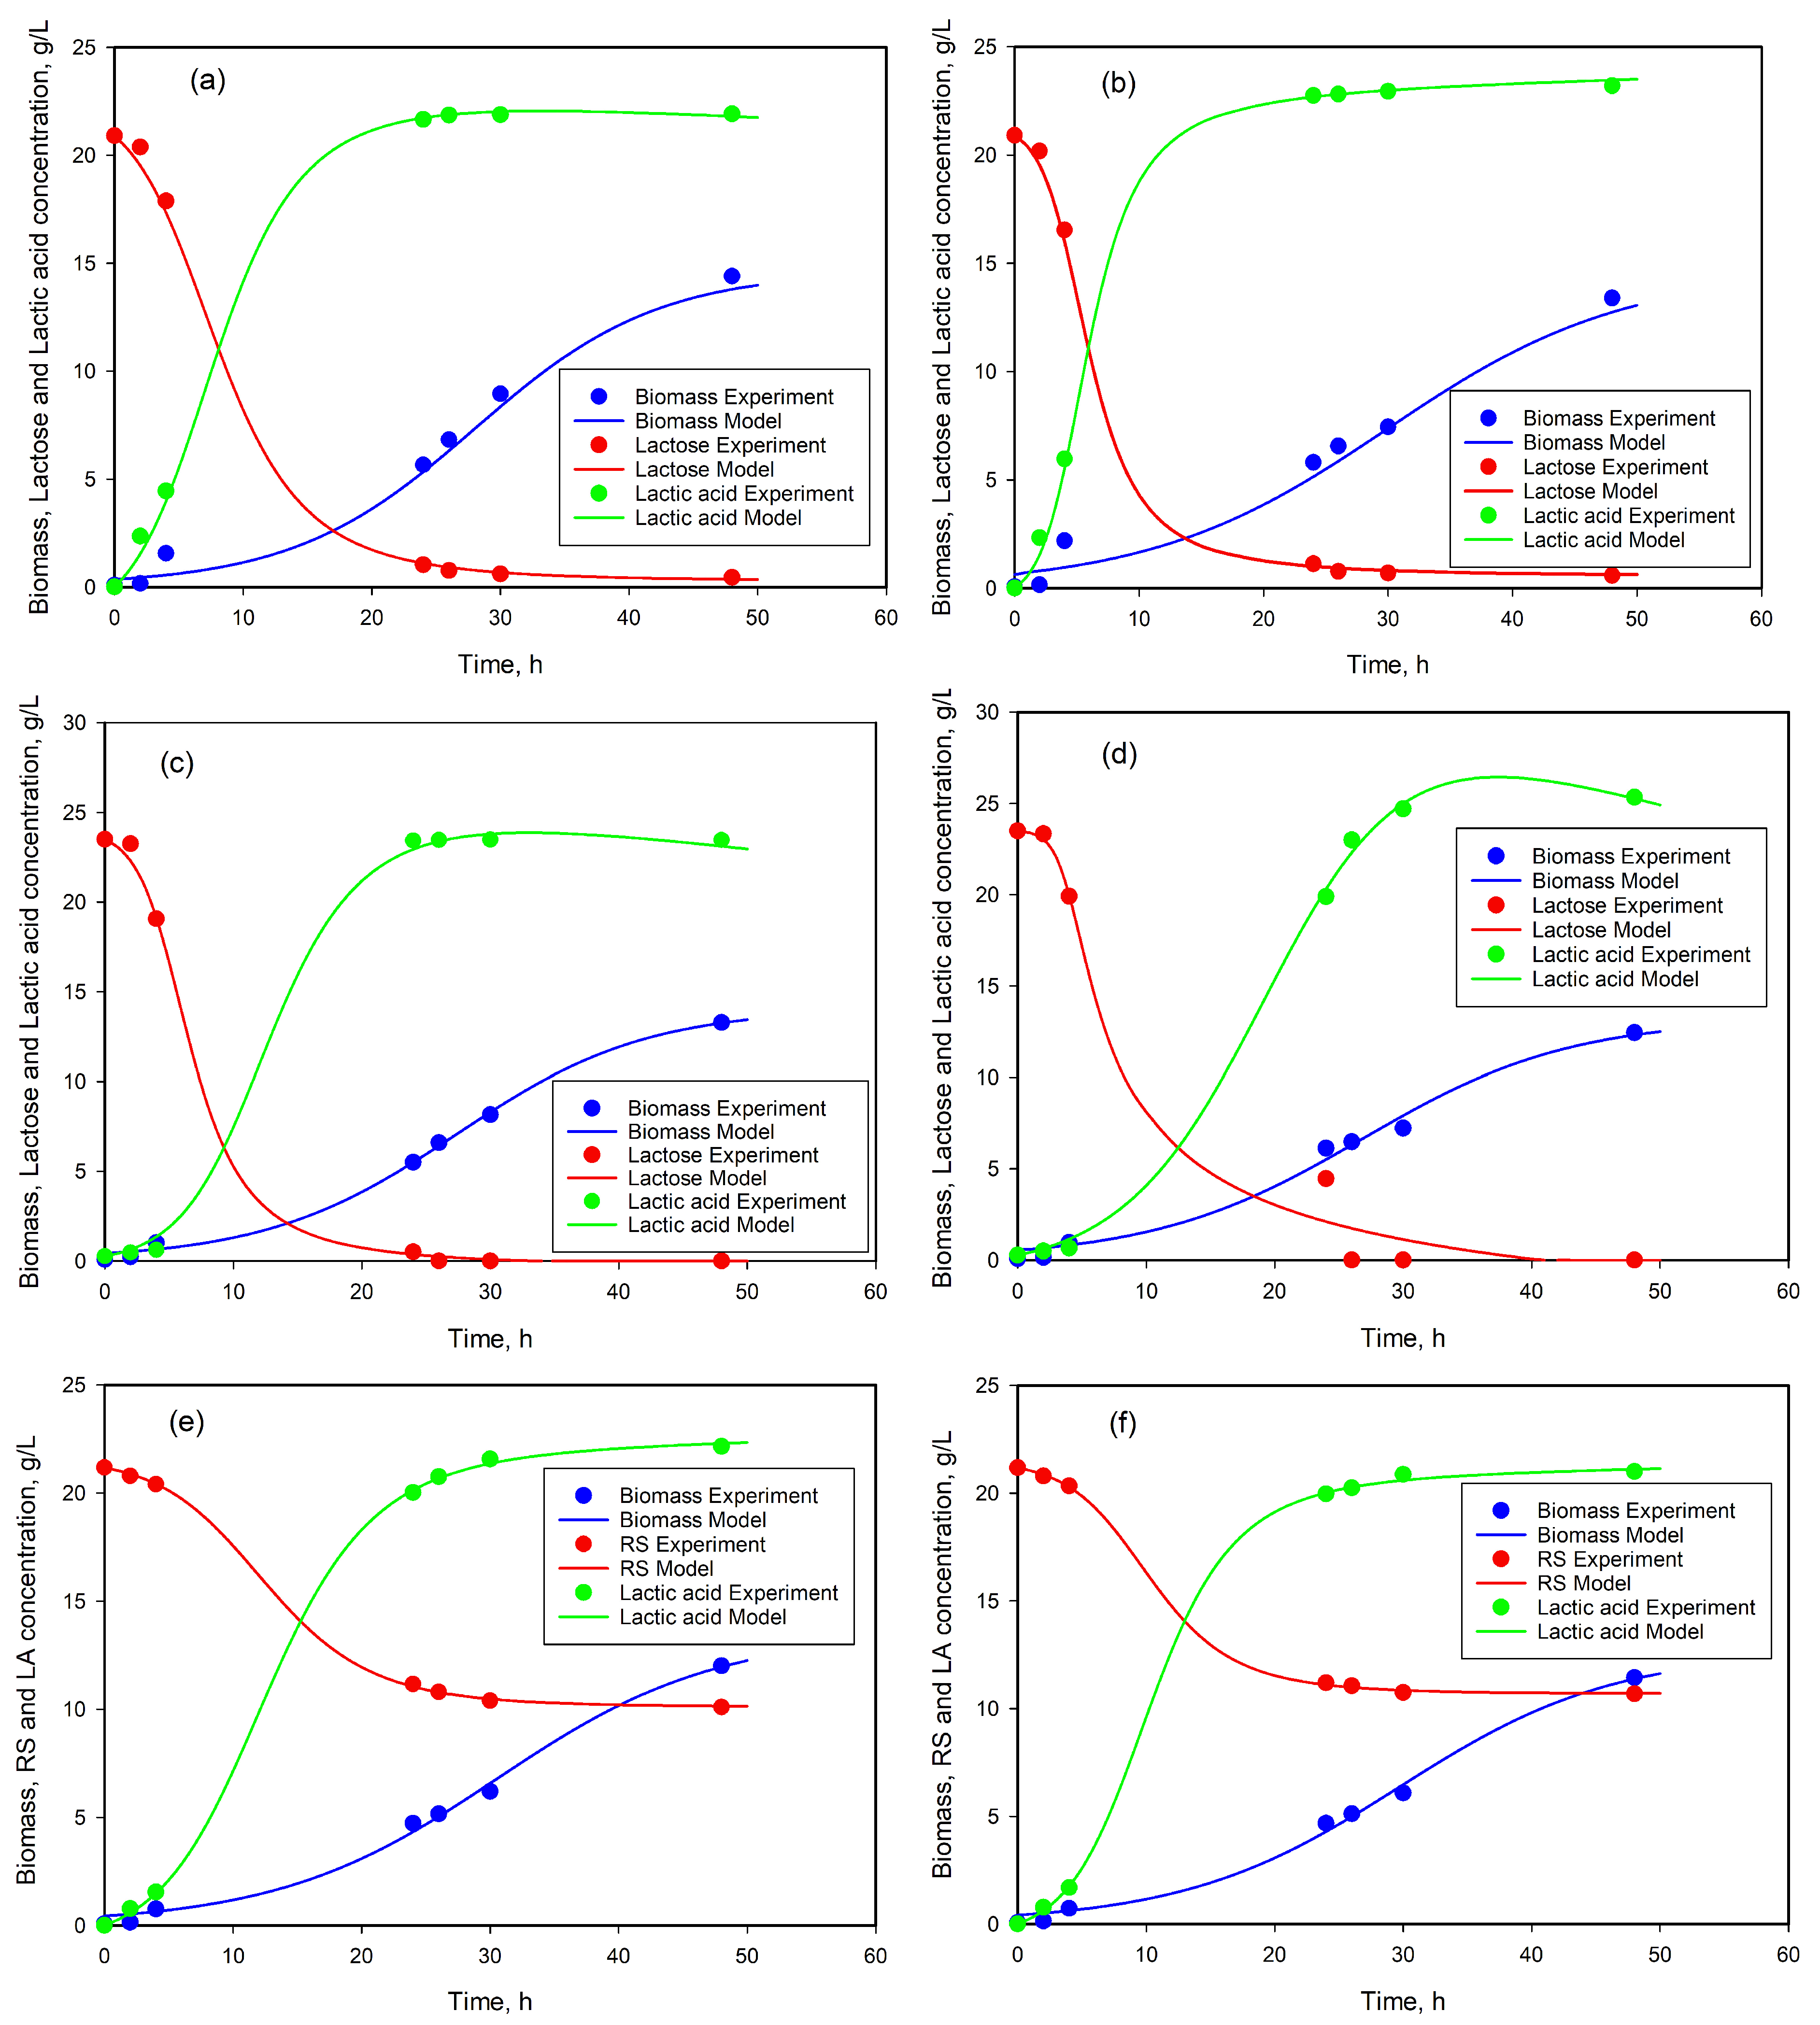
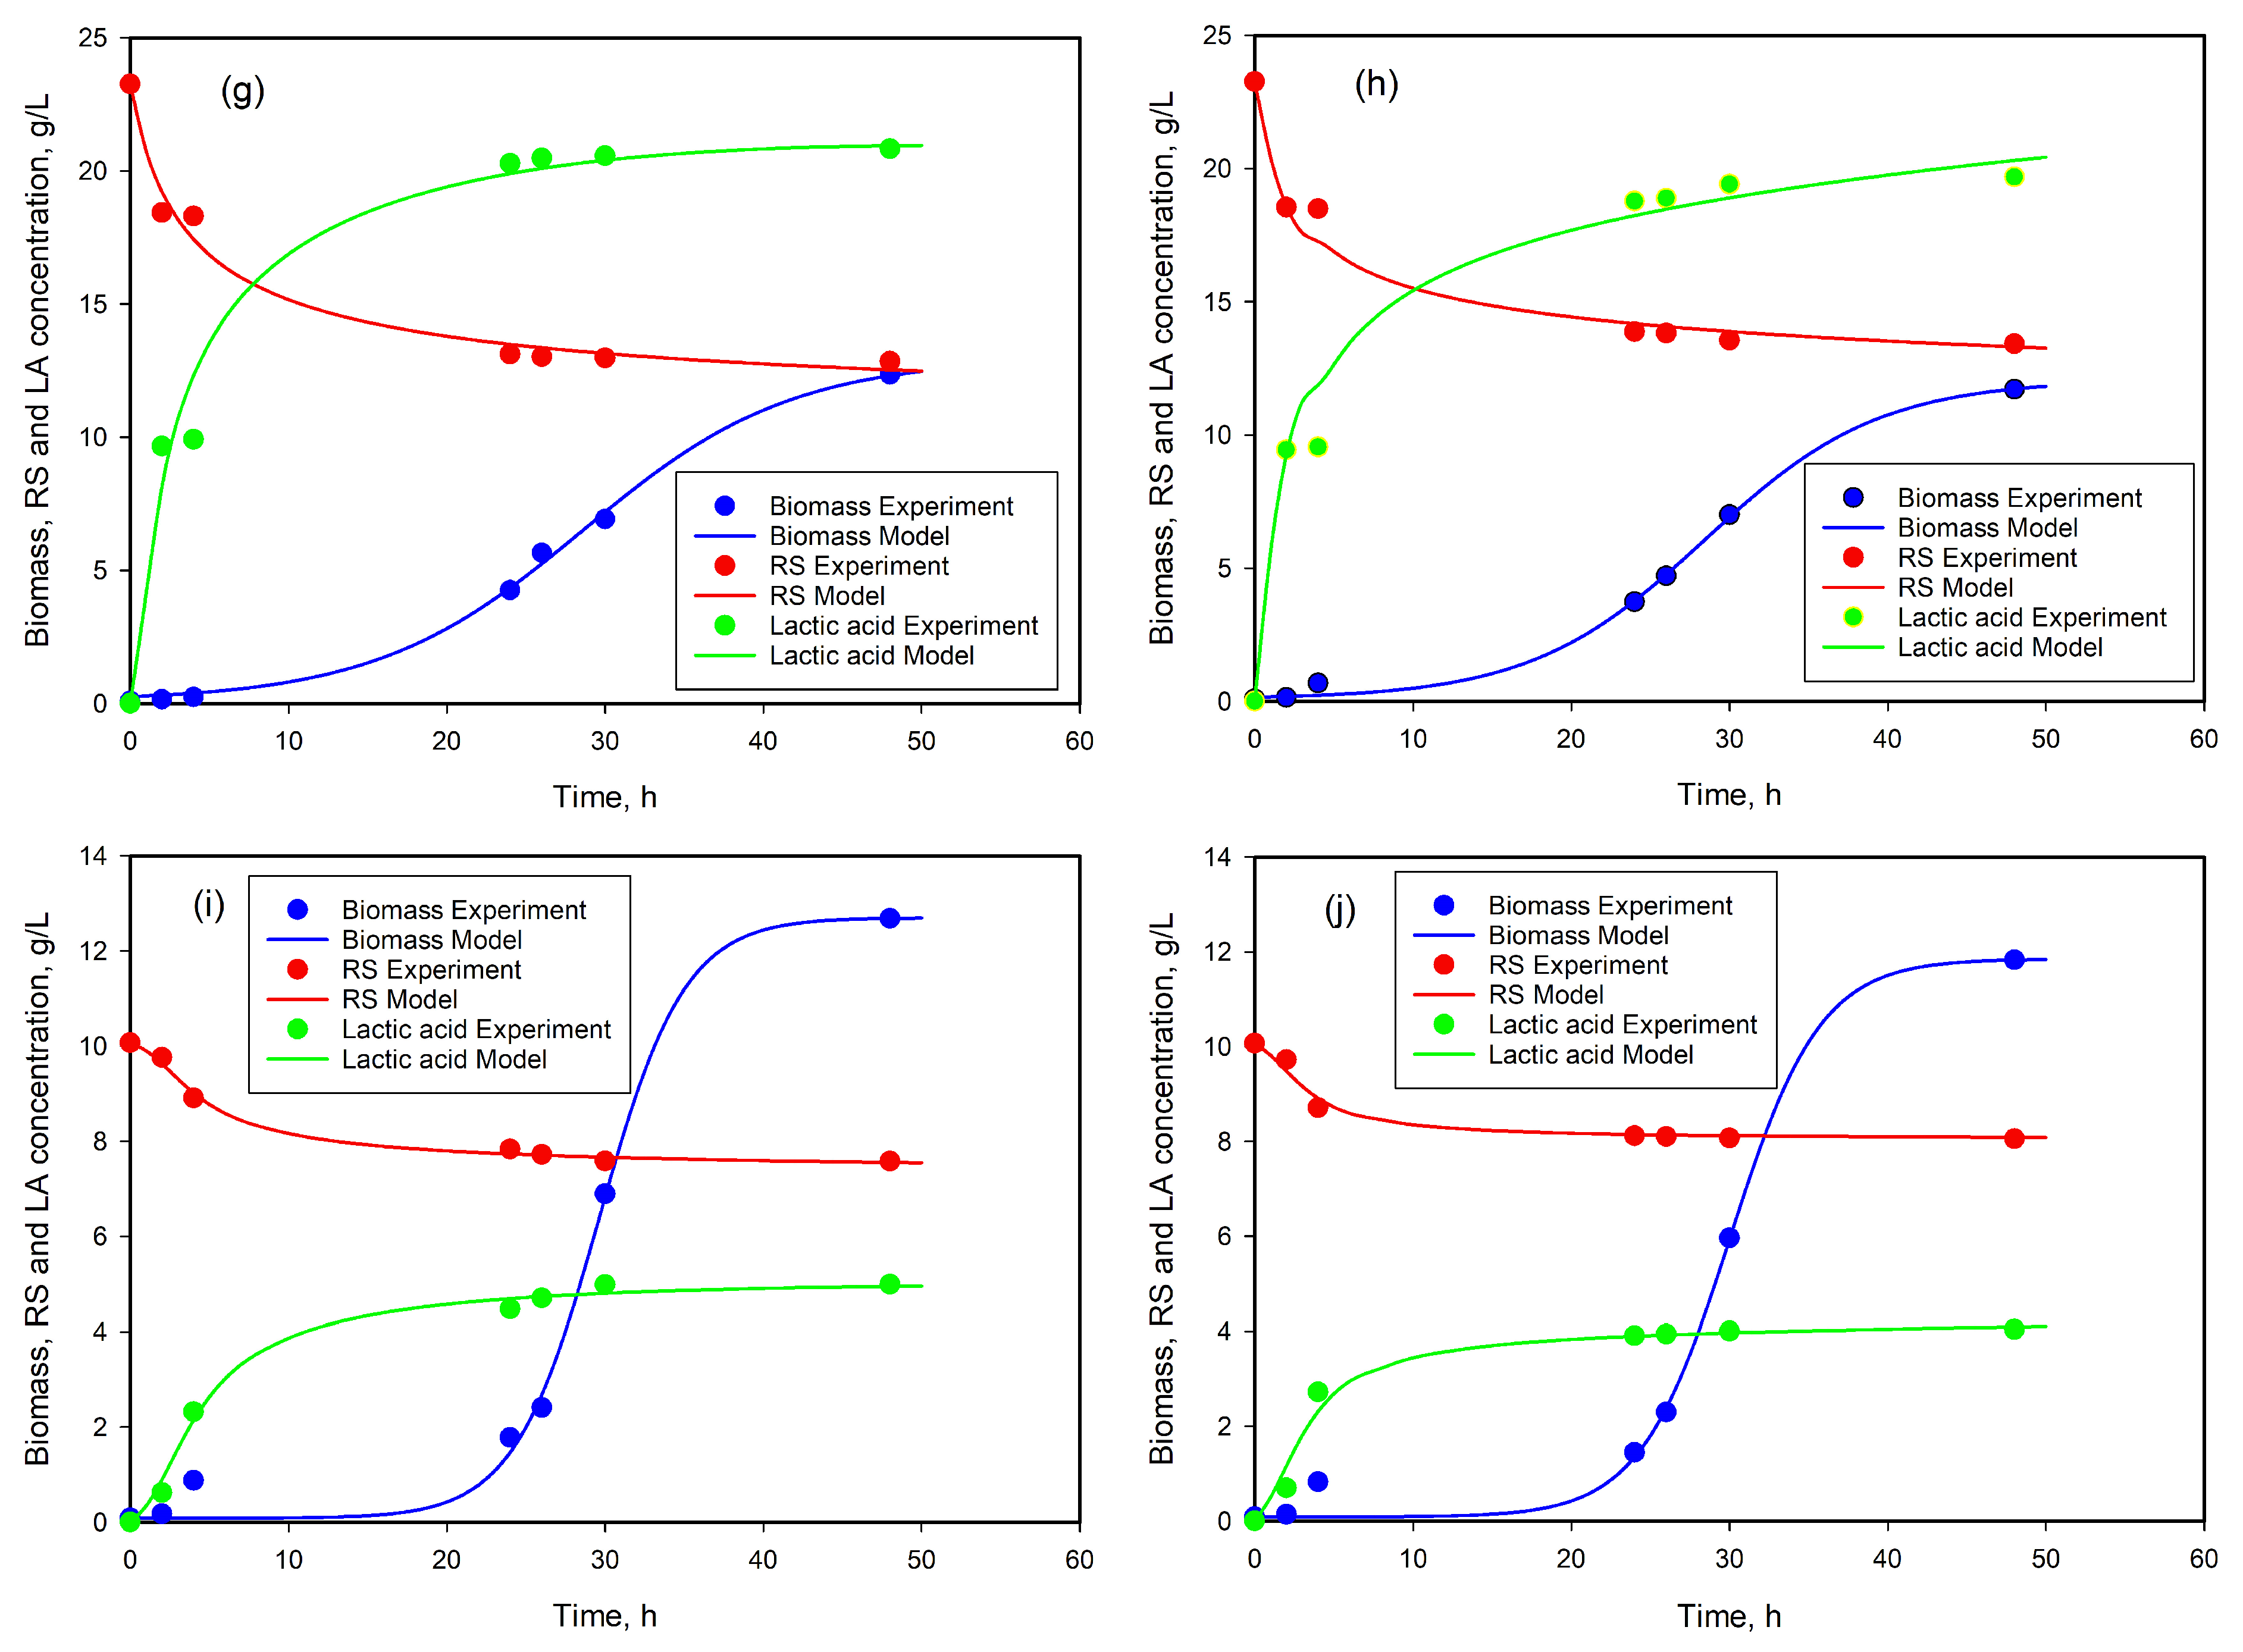
3.7. Modeling of Cell Growth, Substrate Consumption, and Product Accumulation

MATLAB 2013A software was used to solve the model equations describing the fermentation process. Initially, the parameters in the modified Gompertz model (µmax, A, λ) are determined using experimental data for cell concentration and minimizing the least squares function Q1, representing the sum of the squares of the differences between the biomass calculated by the model and that measured experimentally.
Q 1 μ m a x , A , λ = 1 N j = 1 N X j X j e x p 2   m i n
The next step is to solve the model equations describing lactic acid formation and substrate consumption. To calculate the parameter values (YX/S, α, β, YP/S), our experimental data were used, minimizing the least squares function Q2, which is the sum of the squares of the differences between the calculated concentrations by the model and measured substrate and lactic acid concentrations.
Q 2 Y X / S , Y P / S , α , β = 1 N j = 1 N S j S j e x p 2 + j = 1 N P j P j e x p 2 m i n
In both functions, Q1 and Q2 j are the experimental point numbers; X, S, and P are values of the biomass, substrate, and product concentration calculated by the model; Xexp, Sexp, and Pexp are experimental values; N is the experimental data number; and tj (j = 1, …, N) are the times in which the X, S, and P concentrations are measured.
To find the minimum of the target function of several variables on an unbounded domain, a derivative-free method (fminsearch) was used. It uses the Nelder–Mead simplex search method of Lagarias et al. [47]. The fminsearch is a direct search method that does not use analytic or numerical gradients.
The results of mathematical modeling for all substrates with two L. plantarum strains are illustrated in Figure 6, and the parameters’ values are given in Table 3.
The parameter values of the asymptotic level of biomass (A), calculated by the model for all cases, are of the same order of magnitude as the values of the yield coefficients YX/S and YP/S. The values of A in all cases are between 11.769 and 14.583 g/L, as the values of 2HS are slightly lower. The values of lag phase duration (λ) are relatively high, from nearly 10.5 to more than 24 h. The largest lag phase was obtained with wood hydrolysate. This was not surprising because of the predominant content of pentose sugars in WH. It takes a longer time for microorganisms to adapt to assimilating pentoses. On the other hand, after a long lag phase, the maximum specific growth rate (µ) had higher values. This means that WH is a better substrate among those investigated for LA production, and two lactobacilli strains had faster metabolism. This fact can be attributed to relatively low RS concentration (10 g/L). In a previous study [48], it was demonstrated that substrate inhibition started at 15 g/L. All other µmax values were between 0.376 and 0.544 h−1, close to those reported in the literature for other lactobacilli.
Concerning the modeling of LA production from different substrates, data for lactose and whey are available, while these for DDGS are scarce and for SCG are missing. Some data are summarized in Table 4.
The ratio between the values of the parameters α and β is also high, which confirms that product formation is growth-related in this concentration range.
The values of the Q functions show an excellent agreement between the model and the experimental data. The high determination coefficients (R2 from 0.98 to 0.99) proved the goodness of fit of the model.

4. Conclusions

The possibility of using waste materials for lactic acid production was tested in the present study. Different raw materials were used—DDGS, SCG, wood hydrolysate, and whey. Starting materials (except whey) were pretreated using dilute acid and enzyme, except wood chips, which underwent steam explosion and enzyme treatment. Sugar solutions were diluted to approximately 22 g/L, reducing sugar content, and supplemented with the necessary components of MRS medium. Two Lactiplantibacillus plantarum strains, namely f53 and 2HS, were used for the fermentation of the resulting sugar solutions without pH control. The results obtained were compared with those with lactose as a substrate at the same concentration. Nearly the same quantity of lactic acid was obtained with all substrates, 20–25 g/L, except WH, 5 g/L. The lactic acid productivity varied from 0.78 to 1.02 g/L/h depending on the strain and carbon source. Once again, the results with WH were lower, 0.17–0.19 g/L/h. Lactose from whey was fully converted to LA, while half of RS from DDGS and SCG and nearly 80% from the wood hydrolysate were unconsumed. A mathematical model based on the modified Gompertz equation and the Luedeking–Piret equations was used to model experimental data, with excellent agreement. The parameter values calculated by the model for all cases were of the same magnitude.

Author Contributions

Conceptualization, D.Y. and S.D.; methodology, D.Y. and S.D.; software, G.N. and P.P.-K.; validation, D.Y. and S.D.; formal analysis, L.D. and G.N.; resources, D.Y.; data curation, L.D. and G.N.; writing—original draft preparation, G.N. and D.Y.; writing—review and editing, D.Y. and S.D.; visualization, P.P.-K. and D.Y.; supervision, D.Y.; project administration, S.D.; funding acquisition, D.Y. and S.D. All authors have read and agreed to the published version of the manuscript.

Funding

The authors express their gratitude to Bulgarian Academy of Sciences for the financial support of the Project PVU–63/16.12.2024, BG-RRP-2.017-0047-C01.

Institutional Review Board Statement

Not applicable.

Informed Consent Statement

Not applicable.

Data Availability Statement

Data are contained within the article.

Acknowledgments

The authors are very grateful to Ivo Valchev from the Faculty of Chemical Technologies, University of Chemical Technology and Metallurgy, Sofia, for kindly providing and characterizing the wood hydrolysate.

Conflicts of Interest

The authors declare no conflicts of interest.

References

  1. Swetha, T.A.; Ananthi, V.; Bora, A.; Sengottuvelan, N.; Ponnuchamy, K.; Muthusamy, G.; Arun, A. A Review on Biodegradable Polylactic Acid (PLA) Production from Fermentative Food Waste-Its Applications and Degradation. Int. J. Biol. Macromol. 2023, 234, 123703. [Google Scholar] [CrossRef]
  2. Naser, A.Z.; Deiab, I.; Darras, B.M. Poly(Lactic Acid) (PLA) and Polyhydroxyalkanoates (PHAs), Green Alternatives to Petroleum-Based Plastics: A Review. RSC Adv. 2021, 11, 17151–17196. [Google Scholar] [CrossRef]
  3. Adsul, M.G.; Varma, A.J.; Gokhale, D.V. Lactic Acid Production from Waste Sugarcane Bagasse Derived Cellulose. Green Chem. 2007, 9, 58–62. [Google Scholar] [CrossRef]
  4. Huang, Y.; Wang, Y.; Shang, N.; Li, P. Microbial Fermentation Processes of Lactic Acid: Challenges, Solutions, and Future Prospects. Foods 2023, 12, 2311. [Google Scholar] [CrossRef]
  5. Nwamba, M.C.; Song, G.; Sun, F.; Mukasekuru, M.R.; Ren, H.; Zhang, Q.; Cao, T.; Wang, H.; Sun, H.; Hong, J. Efficiency Enhancement of a New Cellulase Cocktail at Low Enzyme Loading for High Solid Digestion of Alkali Catalyzed Atmospheric Glycerol Organosolvent Pre-Treated Sugarcane Bagasse. Bioresour. Technol. 2021, 338, 125505. [Google Scholar] [CrossRef]
  6. Nwamba, M.C.; Sun, F.; Mukasekuru, M.R.; Song, G.; Harindintwali, J.D.; Boyi, S.A.; Sun, H. Trends and Hassles in the Microbial Production of Lactic Acid from Lignocellulosic Biomass. Environ. Technol. Innov. 2021, 21, 101337. [Google Scholar] [CrossRef]
  7. Rombouts, J.L.; Kranendonk, E.M.M.; Regueira, A.; Weissbrodt, D.G.; Kleerebezem, R.; Van Loosdrecht, M.C.M. Selecting for Lactic Acid Producing and Utilising Bacteria in Anaerobic Enrichment Cultures. Biotechnol. Bioeng. 2020, 117, 1281–1293. [Google Scholar] [CrossRef] [PubMed]
  8. Feng, Y.; Long, S.; Tang, X.; Sun, Y.; Luque, R.; Zeng, X.; Lin, L. Earth-Abundant 3d-Transition-Metal Catalysts for Lignocellulosic Biomass Conversion. Chem. Soc. Rev. 2021, 50, 6042–6093. [Google Scholar] [CrossRef]
  9. 2025 Ethanol Industry Outlook. Available online: https://ethanolrfa.org/file/2912/2025%20Outlook.pdf (accessed on 1 April 2025).
  10. Naydenova, G.; Popova-Krumova, P.; Danova, S.; Yankov, D. Lactic Acid Production from Distiller’s Dried Grains Dilute Acid Hydrolysates. Fermentation 2024, 10, 581. [Google Scholar] [CrossRef]
  11. Iram, A.; Cekmecelioglu, D.; Demirci, A. Distillers’ Dried Grains with Solubles (DDGS) and Its Potential as Fermentation Feedstock. Appl. Microbiol. Biotechnol. 2020, 104, 6115–6128. [Google Scholar] [CrossRef]
  12. Lamsal, B.P.; Pathirapong, P.; Rakshit, S. Microbial Growth and Modification of Corn Distillers Dried Grains with Solubles during Fermentation. Ind. Crops Prod. 2012, 37, 553–559. [Google Scholar] [CrossRef]
  13. Murthy, P.S.; Madhava Naidu, M. Sustainable Management of Coffee Industry By-Products and Value Addition—A Review. Resour. Conserv. Recycl. 2012, 66, 45–58. [Google Scholar] [CrossRef]
  14. Bhutada, G. Visualizing Global Coffee Production in 2024. Available online: https://www.visualcapitalist.com/visualizing-global-coffee-production-in-2024/ (accessed on 1 April 2025).
  15. Alves, R.C.; Rodrigues, F.; Antónia Nunes, M.; Vinha, A.F.; Oliveira, M.B.P.P. State of the Art in Coffee Processing By-Products. In Handbook of Coffee Processing By-Products; Elsevier: Amsterdam, The Netherlands, 2017; pp. 1–26. ISBN 978-0-12-811290-8. [Google Scholar]
  16. Mussatto, S.I.; Machado, E.M.S.; Martins, S.; Teixeira, J.A. Production, Composition, and Application of Coffee and Its Industrial Residues. Food Bioprocess Technol. 2011, 4, 661–672. [Google Scholar] [CrossRef]
  17. Ballesteros, L.F.; Teixeira, J.A.; Mussatto, S.I. Chemical, Functional, and Structural Properties of Spent Coffee Grounds and Coffee Silverskin. Food Bioprocess Technol. 2014, 7, 3493–3503. [Google Scholar] [CrossRef]
  18. Bomfim, A.; Oliveira, D.; Voorwald, H.; Benini, K.; Dumont, M.-J.; Rodrigue, D. Valorization of Spent Coffee Grounds as Precursors for Biopolymers and Composite Production. Polymers 2022, 14, 437. [Google Scholar] [CrossRef]
  19. Montemurro, M.; Casertano, M.; Vilas-Franquesa, A.; Rizzello, C.G.; Fogliano, V. Exploitation of Spent Coffee Ground (SCG) as a Source of Functional Compounds and Growth Substrate for Probiotic Lactic Acid Bacteria. LWT 2024, 198, 115974. [Google Scholar] [CrossRef]
  20. Cheese|USDA Foreign Agricultural Service. Available online: https://www.fas.usda.gov/data/production/commodity/0240000 (accessed on 30 April 2025).
  21. Malos, I.G.; Ghizdareanu, A.-I.; Vidu, L.; Matei, C.B.; Pasarin, D. The Role of Whey in Functional Microorganism Growth and Metabolite Generation: A Biotechnological Perspective. Foods 2025, 14, 1488. [Google Scholar] [CrossRef]
  22. Panesar, P.; Kennedy, J.; Gandhi, D.; Bunko, K. Bioutilisation of Whey for Lactic Acid Production. Food Chem. 2007, 105, 1–14. [Google Scholar] [CrossRef]
  23. Global Wood Pulp Production 2022|Statista. Available online: https://www.statista.com/statistics/240570/consumption-and-production-of-fibrous-material-worldwide/ (accessed on 2 May 2025).
  24. Mayo, B.; Flórez, A.B. Lactic Acid Bacteria: Lactobacillus Plantarum. In Encyclopedia of Dairy Sciences; Elsevier: Amsterdam, The Netherlands, 2022; pp. 206–217. ISBN 978-0-12-818767-8. [Google Scholar]
  25. BDS ISO 7169:1989; Products from Processed Fruits and Vegetables. Determination of Sugar’s Content. Bulgarian Institute for Standardization: Sofia, Bulgaria, 2025.
  26. Zwietering, M.H.; Jongenburger, I.; Rombouts, F.M.; Van ’T Riet, K. Modeling of the Bacterial Growth Curve. Appl. Env. Microbiol. 1990, 56, 1875–1881. [Google Scholar] [CrossRef] [PubMed]
  27. Luedeking, R.; Piret, E.L. A Kinetic Study of the Lactic Acid Fermentation. Batch Process at Controlled pH. J. Biochem. Microbiol. Technol. Eng. 1959, 1, 393–412. [Google Scholar] [CrossRef]
  28. Zaini, N.A.M.; Charalampopoulos, D.; Chatzifragkou, A.A. Lactic Acid Production from Dried Distiller’s Grains with Solubles Hydrolysate via Co-Fermentation of Lactobacillus Pentosus and Lactobacillus Coryniformis. Malays. Appl. Biol. 2018, 47, 173–179. [Google Scholar]
  29. Zaini, N.A.B.M.; Chatzifragkou, A.; Charalampopoulos, D. Microbial Production of D-lactic Acid from Dried Distiller’s Grains with Solubles. Eng. Life Sci. 2019, 19, 21–30. [Google Scholar] [CrossRef]
  30. Wang, C.; Su, W.; Zhang, Y.; Hao, L.; Wang, F.; Lu, Z.; Zhao, J.; Liu, X.; Wang, Y. Solid-State Fermentation of Distilled Dried Grain with Solubles with Probiotics for Degrading Lignocellulose and Upgrading Nutrient Utilization. AMB Express 2018, 8, 188. [Google Scholar] [CrossRef]
  31. Hudeckova, H.; Neureiter, M.; Obruca, S.; Frühauf, S.; Marova, I. Biotechnological Conversion of Spent Coffee Grounds into Lactic Acid. Lett. Appl. Microbiol. 2018, 66, 306–312. [Google Scholar] [CrossRef] [PubMed]
  32. Kim, S.; Kim, J.-C.; Kim, Y.Y.; Yang, J.E.; Lee, H.M.; Hwang, I.M.; Park, H.W.; Kim, H.M. Utilization of Coffee Waste as a Sustainable Feedstock for High-Yield Lactic Acid Production through Microbial Fermentation. Sci. Total Environ. 2024, 912, 169521. [Google Scholar] [CrossRef] [PubMed]
  33. Lee, K.H.; Jang, Y.W.; Lee, J.; Kim, S.; Park, C.; Yoo, H.Y. Statistical Optimization of Alkali Pretreatment to Improve Sugars Recovery from Spent Coffee Grounds and Utilization in Lactic Acid Fermentation. Processes 2021, 9, 494. [Google Scholar] [CrossRef]
  34. Kopp, D.; Willows, R.D.; Sunna, A. Cell-Free Enzymatic Conversion of Spent Coffee Grounds Into the Platform Chemical Lactic Acid. Front. Bioeng. Biotechnol. 2019, 7, 389. [Google Scholar] [CrossRef]
  35. Turner, T.L.; Kim, E.; Hwang, C.; Zhang, G.-C.; Liu, J.-J.; Jin, Y.-S. Conversion of Lactose and Whey into Lactic Acid by Engineered Yeast. J. Dairy Sci. 2017, 100, 124–128. [Google Scholar] [CrossRef]
  36. Alonso, S.; Herrero, M.; Rendueles, M.; Díaz, M. Residual Yoghurt Whey for Lactic Acid Production. Biomass Bioenergy 2010, 34, 931–938. [Google Scholar] [CrossRef]
  37. Taleghani, H.G.; Najafpour, G.D.; Ghoreyshi, A.A. A Study on the Effect of Parameters on Lactic Acid Production from Whey. Pol. J. Chem. Technol. 2016, 18, 58–63. [Google Scholar] [CrossRef]
  38. Panesar, P.S.; Kennedy, J.F.; Knill, C.J.; Kosseva, M. Production of L(+) Lactic Acid Using Lactobacillus casei from Whey. Braz. Arch. Biol. Technol. 2010, 53, 219–226. [Google Scholar] [CrossRef]
  39. Buyondo, J.P.; Liu, S. Lactic Acid Production by Lactobacillus Pentosus from Wood Extract Hydrolysates. J. Sci. Technol. For. Prod. Process. 2011, 1, 38–47. [Google Scholar]
  40. Kuo, Y.-C.; Yuan, S.-F.; Wang, C.-A.; Huang, Y.-J.; Guo, G.-L.; Hwang, W.-S. Production of Optically Pure l -Lactic Acid from Lignocellulosic Hydrolysate by Using a Newly Isolated and d -Lactate Dehydrogenase Gene-Deficient Lactobacillus Paracasei Strain. Bioresour. Technol. 2015, 198, 651–657. [Google Scholar] [CrossRef]
  41. Yuan, S.-F.; Hsu, T.-C.; Wang, C.-A.; Jang, M.-F.; Kuo, Y.-C.; Alper, H.S.; Guo, G.-L.; Hwang, W.-S. Production of Optically Pure l(+)-Lactic Acid from Waste Plywood Chips Using an Isolated Thermotolerant Enterococcus Faecalis SI at a Pilot Scale. J. Ind. Microbiol. Biotechnol. 2018, 45, 961–970. [Google Scholar] [CrossRef]
  42. Eom, I.-Y.; Oh, Y.-H.; Park, S.J.; Lee, S.-H.; Yu, J.-H. Fermentative L-Lactic Acid Production from Pretreated Whole Slurry of Oil Palm Trunk Treated by Hydrothermolysis and Subsequent Enzymatic Hydrolysis. Bioresour. Technol. 2015, 185, 143–149. [Google Scholar] [CrossRef]
  43. Niemelä, K.; Tamminen, T.; Ohra-aho, T. Black Liquor Components as Potential Raw Materials. In Proceedings of the 14th International Symposium on Wood, Fibre, and Pulping Chemistry, Durban, South Africa, 25–28 June 2007. [Google Scholar]
  44. Pola, L.; Collado, S.; Oulego, P.; Díaz, M. Kraft Black Liquor as a Renewable Source of Value-Added Chemicals. Chem. Eng. J. 2022, 448, 137728. [Google Scholar] [CrossRef]
  45. Morya, R.; Kumar, M.; Tyagi, I.; Kumar Pandey, A.; Park, J.; Raj, T.; Sirohi, R.; Kumar, V.; Kim, S.-H. Recent Advances in Black Liquor Valorization. Bioresour. Technol. 2022, 350, 126916. [Google Scholar] [CrossRef]
  46. Brown, D.M.; Grunden, A.M.; Pawlak, J.J. Statistical Optimization of Black Liquor-Containing Media for Growth and Lactic Acid Production by Paenibacillus Glucanolyticus SLM1. Bioresour. Technol. Rep. 2021, 13, 100629. [Google Scholar] [CrossRef]
  47. Lagarias, J.C.; Reeds, J.A.; Wright, M.H.; Wright, P.E. Convergence Properties of the Nelder--Mead Simplex Method in Low Dimensions. SIAM J. Optim. 1998, 9, 112–147. [Google Scholar] [CrossRef]
  48. Popova-Krumova, P.; Danova, S.; Atanasova, N.; Yankov, D. Lactic Acid Production by Lactiplantibacillus Plantarum AC 11S—Kinetics and Modeling. Microorganisms 2024, 12, 739. [Google Scholar] [CrossRef] [PubMed]
  49. Kostov, G.; Angelov, M.; Denkova, Z.; Dobrev, I.; Goranov, B. Lactic Acid Production with Lactobacillus casei ssp. Rhamnosus NBIMCC 1013: Modeling and Optimization of the Nutrient Medium. Eng. Life Sci. 2011, 11, 517–527. [Google Scholar] [CrossRef]
  50. Fu, W.; Mathews, A.P. Lactic Acid Production from Lactose by Lactobacillus Plantarum: Kinetic Model and Effects of pH, Substrate, and Oxygen. Biochem. Eng. J. 1999, 3, 163–170. [Google Scholar] [CrossRef]
  51. Biazar, J.; Tango, M.; Babolian, E.; Islam, R. Solution of the Kinetic Modeling of Lactic Acid Fermentation Using Adomian Decomposition Method. Appl. Math. Comput. 2003, 144, 433–439. [Google Scholar] [CrossRef]
  52. Amrane, A.; Prigent, Y. Mathematical Model for Lactic Acid Production from Lactose in Batch Culture: Model Development and Simulation. J. Chem. Technol. Biotechnol. 1994, 60, 241–246. [Google Scholar] [CrossRef]
  53. Altıok, D.; Tokatlı, F.; Harsa, Ş. Kinetic Modelling of Lactic Acid Production from Whey by Lactobacillus casei (NRRL B-441). J. Chem. Technol. Biotechnol. 2006, 81, 1190–1197. [Google Scholar] [CrossRef]
  54. Balannec, B.; Bouguettoucha, A.; Amrane, A. Unstructured Model for Batch Cultures without pH Control of Lactobacillus Helveticus—Inhibitory Effect of the Undissociated Lactic Acid. Biochem. Eng. J. 2007, 35, 289–294. [Google Scholar] [CrossRef]
  55. Naomi David, A.; Sewsynker-Sukai, Y.; Gueguim Kana, E.B. Co-Valorization of Corn Cobs and Dairy Wastewater for Simultaneous Saccharification and Lactic Acid Production: Process Optimization and Kinetic Assessment. Bioresour. Technol. 2022, 348, 126815. [Google Scholar] [CrossRef] [PubMed]
Figure 1. Pre-selection of strains based on pH drop during lactose fermentation. pH values at 24 and 48 h of fermentation.
Fermentation 11 00437 g001
Figure 2. Time course of substrate consumption, biomass growth, LA accumulation, and pH drop from lactose with L. plantarum f53 (a) and L. plantarum 2HS (b).
Fermentation 11 00437 g002
Figure 3. Time course of substrate consumption, biomass growth, LA accumulation, and pH drop from DDGS hydrolysate with L. plantarum f53 (a) and L. plantarum 2HS (b).
Fermentation 11 00437 g003
Figure 4. Time course of substrate consumption, biomass growth, LA accumulation, and pH drop from SCG hydrolysate with L. plantarum f53 (a) and L. plantarum 2HS (b).
Fermentation 11 00437 g004
Figure 5. Time course of substrate consumption, biomass growth, LA accumulation, and pH drop from whey with L. plantarum f53 (a) and L. plantarum 2HS (b).
Fermentation 11 00437 g005
Figure 6. Experimental and model results for microbial growth, substrate consumption, and lactic acid production from different carbon sources: lactose (a,b), whey (c,d) SCG (e,f), DDGS (g,h), and WH (i,j) by L. plantarum f53 (a,c,e,g,i) and L. plantarum 2HS (b,d,f,h,j).
Fermentation 11 00437 g006aFermentation 11 00437 g006b
Table 1. DDGS and SCG composition.
ComponentPercentageMethod
DDGSSCG
Moisture5.4 ± 0.46.7 ± 0.3LAP-001
Total solids94.6 ± 0.493.3 ± 0.3LAP-001
Total carbohydrates49.2 ± 1.652.9 ± 1.6LAP-002
Lignin30.5 ± 0.431.5 ± 0.6LAP-003
Extractives20.3 ± 1.215.6 ± 1.0LAP-010
Ash4.7 ± 0.51.4 ± 0.2LAP-005
Table 2. Microorganisms studied and culture conditions.
NoStrainsCollectionOriginMedia and T °C
1Lactiplantibacillus plantarum SCC1IMicB Artisanal white brained cheeseMRS at 37 °C
2Lactiplantibacillus plantarum RL29IMicB/Artisanal white brained cheeseMRS at 37 °C
3Lactiplantibacillus plantarum 2HSIMicBHuman originMRS at 37 °C
4Ligilactobacillus salivarius 1SIMicB/Human originMRS at 37 °C
5Lactiplantibacillus plantarum f53IMicBHuman originMRS at 37 °C
6Lactobacillus delbrueckii subsp. lactisIMicBHome-made yogurtMRS at 37 °C
7Lactobacillus helveticus NSIMicBHome-made yogurtMRS at 37 °C
Table 3. Model parameters determined by solving the model for different substrates.
Strain Model Parameters
µmaxAλYX/SYP/SαβQ1Q2R12R22
L. plantarum f5310.51314.53113.8660.2762.5737.0220.0090.18950.28370.99500.9986
20.47213.98512.5690.1562.3615.1420.0100.06960.54670.99840.9984
30.39413.42713.4920.1575.40712.5640.0090.03090.02190.98850.9998
41.17412.62324.2490.5804.4933.4700.0290.10130.03350.99140.9986
50.49012.86415.5040.3132.3127.1560.0080.12311.24100.99500.9861
L. plantarum 2HS10.38314.58310.9220.2502.3937.0250.0110.2150.23470.99730.9989
20.40513.12910.5800.4553.5417.7010.0180.15050.94570.99890.9920
30.37612.59012.9750.1914.90510.3490.0060.13260.02120.99120.9998
41.03311.76924.3320.3494.7315.7120.0160.04210.07060.98660.9963
50.54411.97817.4480.24881.1227.9920.0060.08741.20250.99200.9844
1—Lactose; 2—whey; 3—SCG; 4—WH; 5—DDGS; µmax—maximum growth rate, h−1; A—the asymptotic level of biomass, g/L; λ—duration of the lag phase, h; YX/S and YP/S—yield coefficients for biomass on substrate and product on substrate, respectively, g/g; α [-] and β [h−1]—growth associated constants for product formation and the non-growth-associated constant for product formation, h−1; Q—target function, R2—coefficient of determination.
Table 4. Values of the maximal growth rate determined by other authors.
MicroorganismSubstrateGrowth Modelμmax (h−1)Reference
L. caseiLactose 20 g/L μ = μ m a x   1 X X m a x 0.511[49]
L. plantarumLactose 40 g/L μ = μ m a x S / K S + S 0.364 (pH 6.0)[50]
L. helveticusLactose 50 g/L μ = μ m a x S / K S + S e S / K I n 1 e P / K P n 2 0.25[51]
L. helveticusWhey ultrafiltrate powder μ = μ m a x 1 / 1 + c e d t / μ m c 0.56[52]
L. caseiWhey lactose μ = μ m a x   S / K S + S 1 X X m a x 0.265[53]
L. helveticusWhey lactose μ = μ m a x   1 X X m a x 0.64[54]
L. plantarumDairy wastewater μ = μ m a x   1 X X m a x 0.35[55]
L. plantarumLactose μ = μ m a x   1 X X m a x 0.24[10]
L. plantarumDDGS μ = μ m a x   1 X X m a x 0.23[10]
Disclaimer/Publisher’s Note: The statements, opinions and data contained in all publications are solely those of the individual author(s) and contributor(s) and not of MDPI and/or the editor(s). MDPI and/or the editor(s) disclaim responsibility for any injury to people or property resulting from any ideas, methods, instructions or products referred to in the content.

