
Influence of Pediococcus acidilactici and Bacillus coagulans on In Vitro Ruminal Greenhouse Gas Production of Fermented Devilfish in Livestock Rumen Contents

 ,
,  and
and 
Abstract
1. Introduction
2. Materials and Methods
2.1. Experimental Diets
2.2. Chemical Composition of Silage and Diets
2.3. In Vitro Incubations
2.4. Gases Measurement
2.5. Calculations
2.6. Statistical Analysis
× SF)ijk + εijk
3. Results
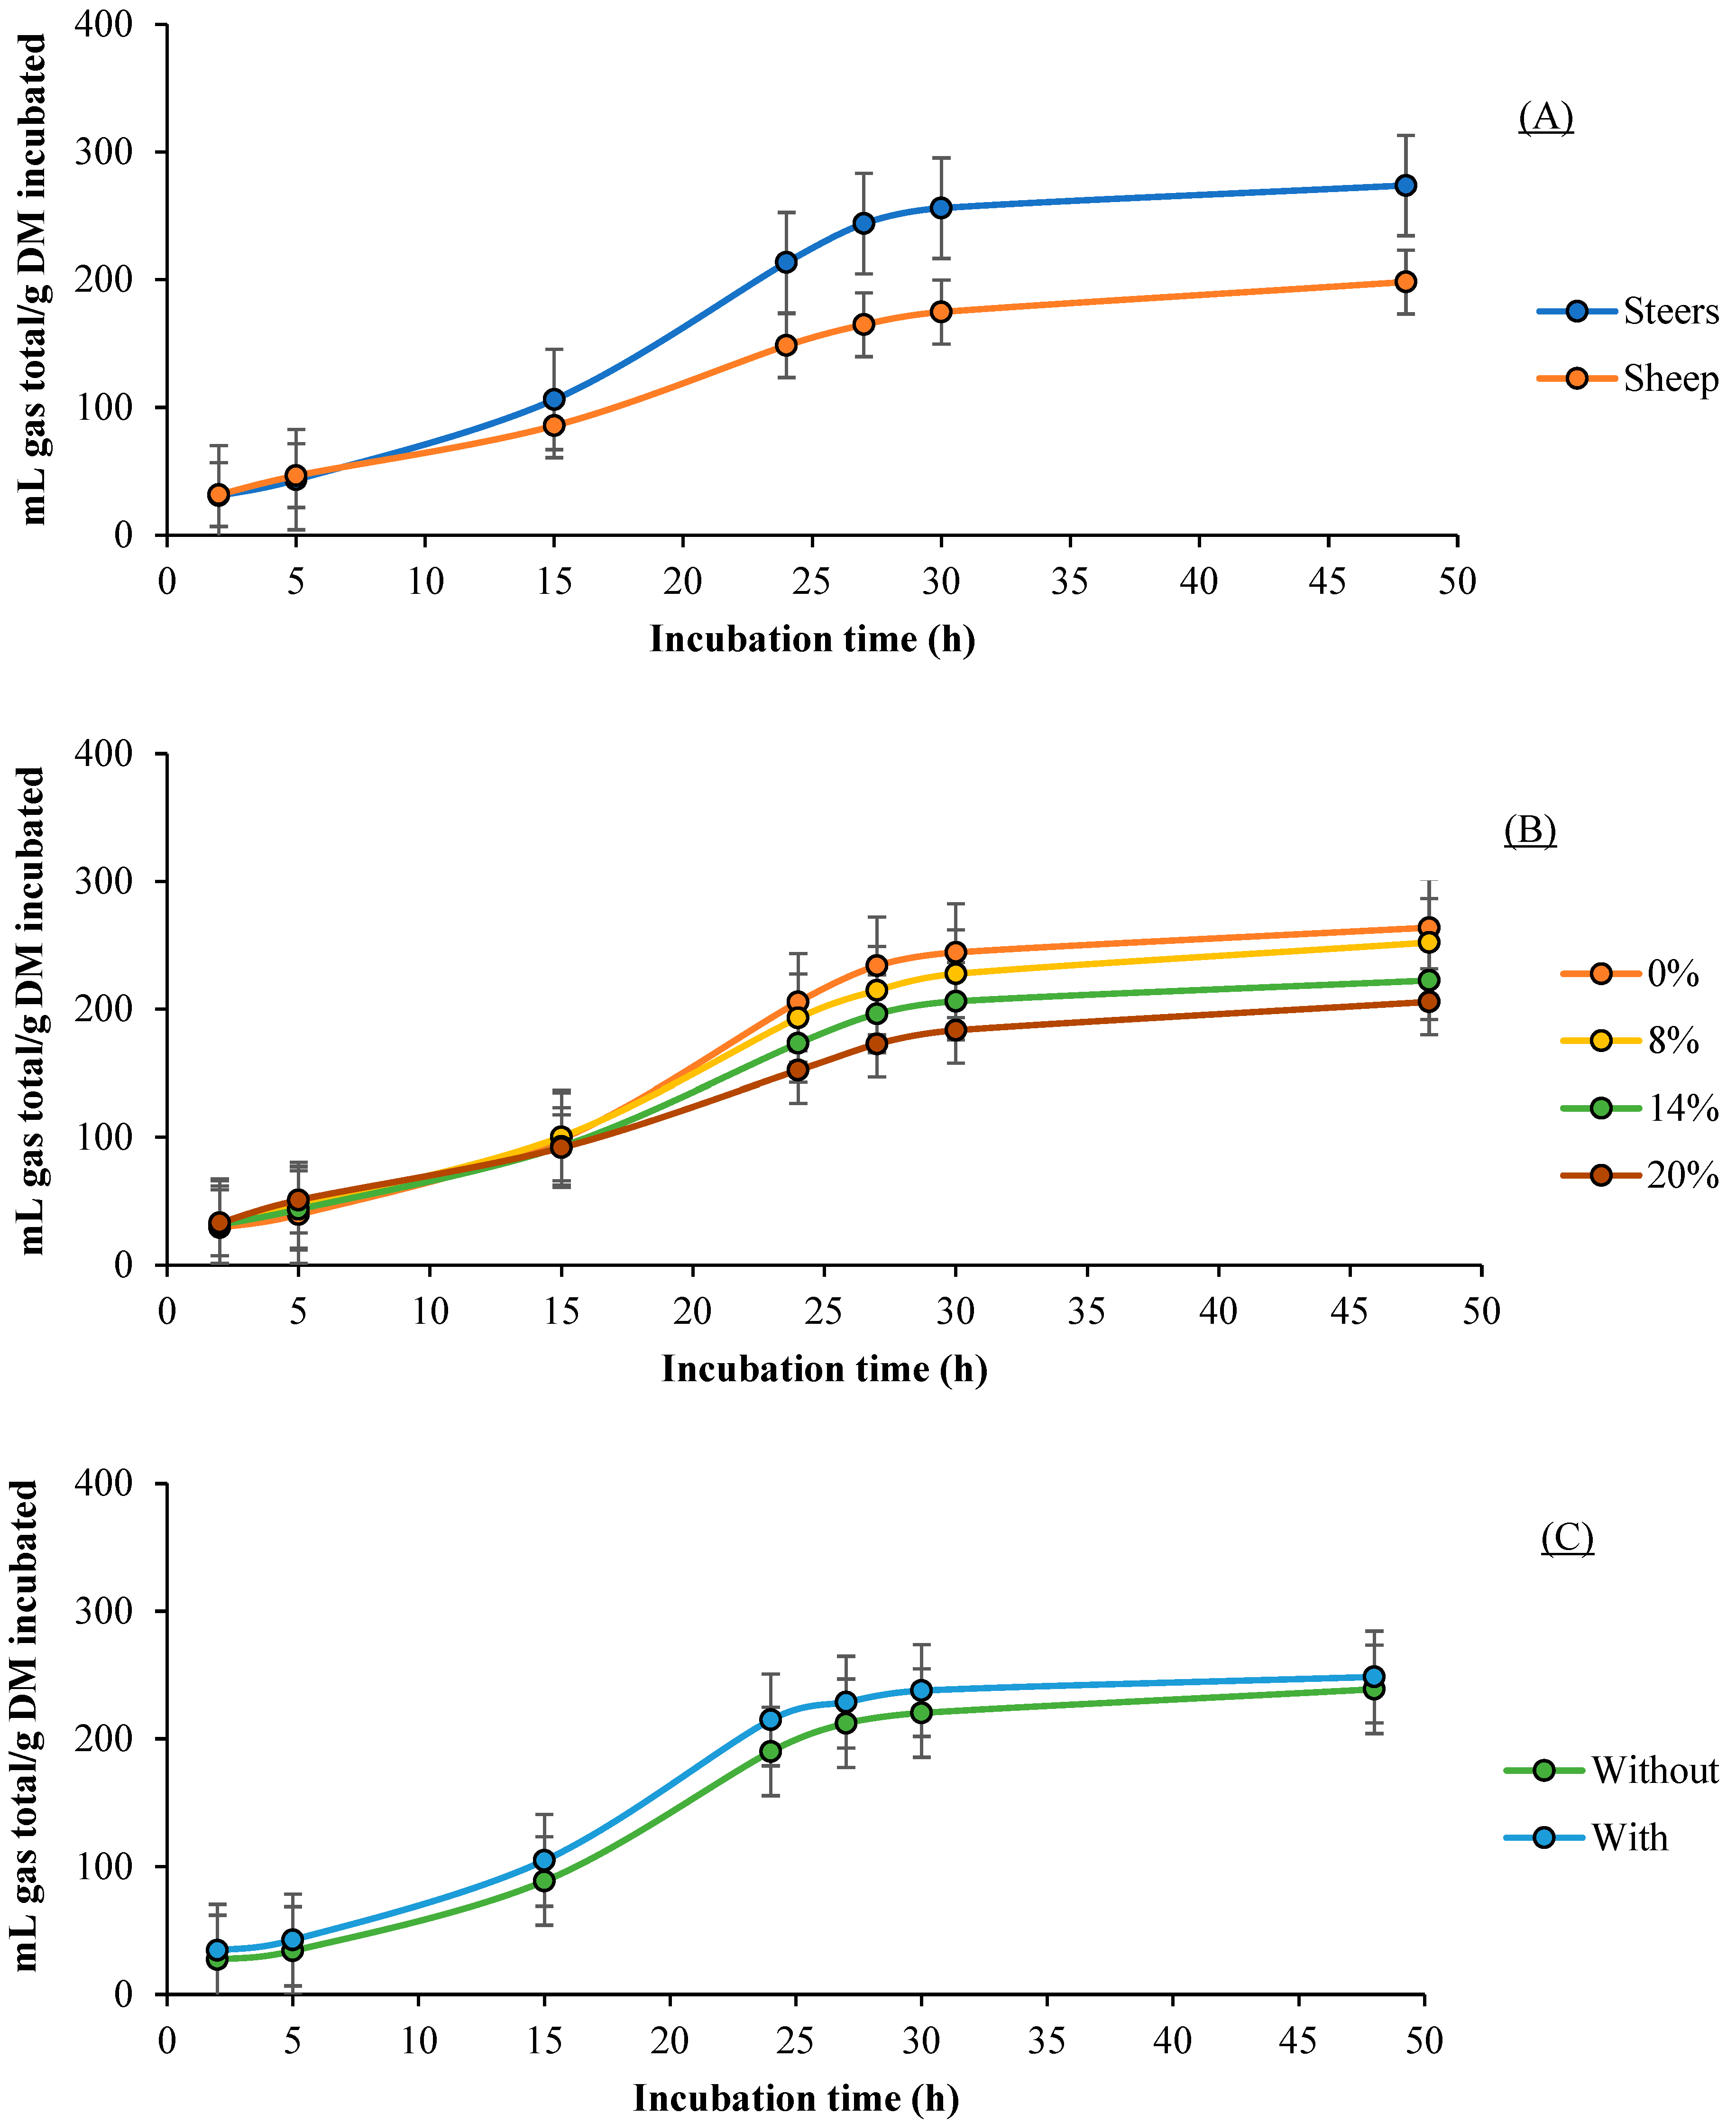
3.1. Gas Production
3.2. CH4 Production
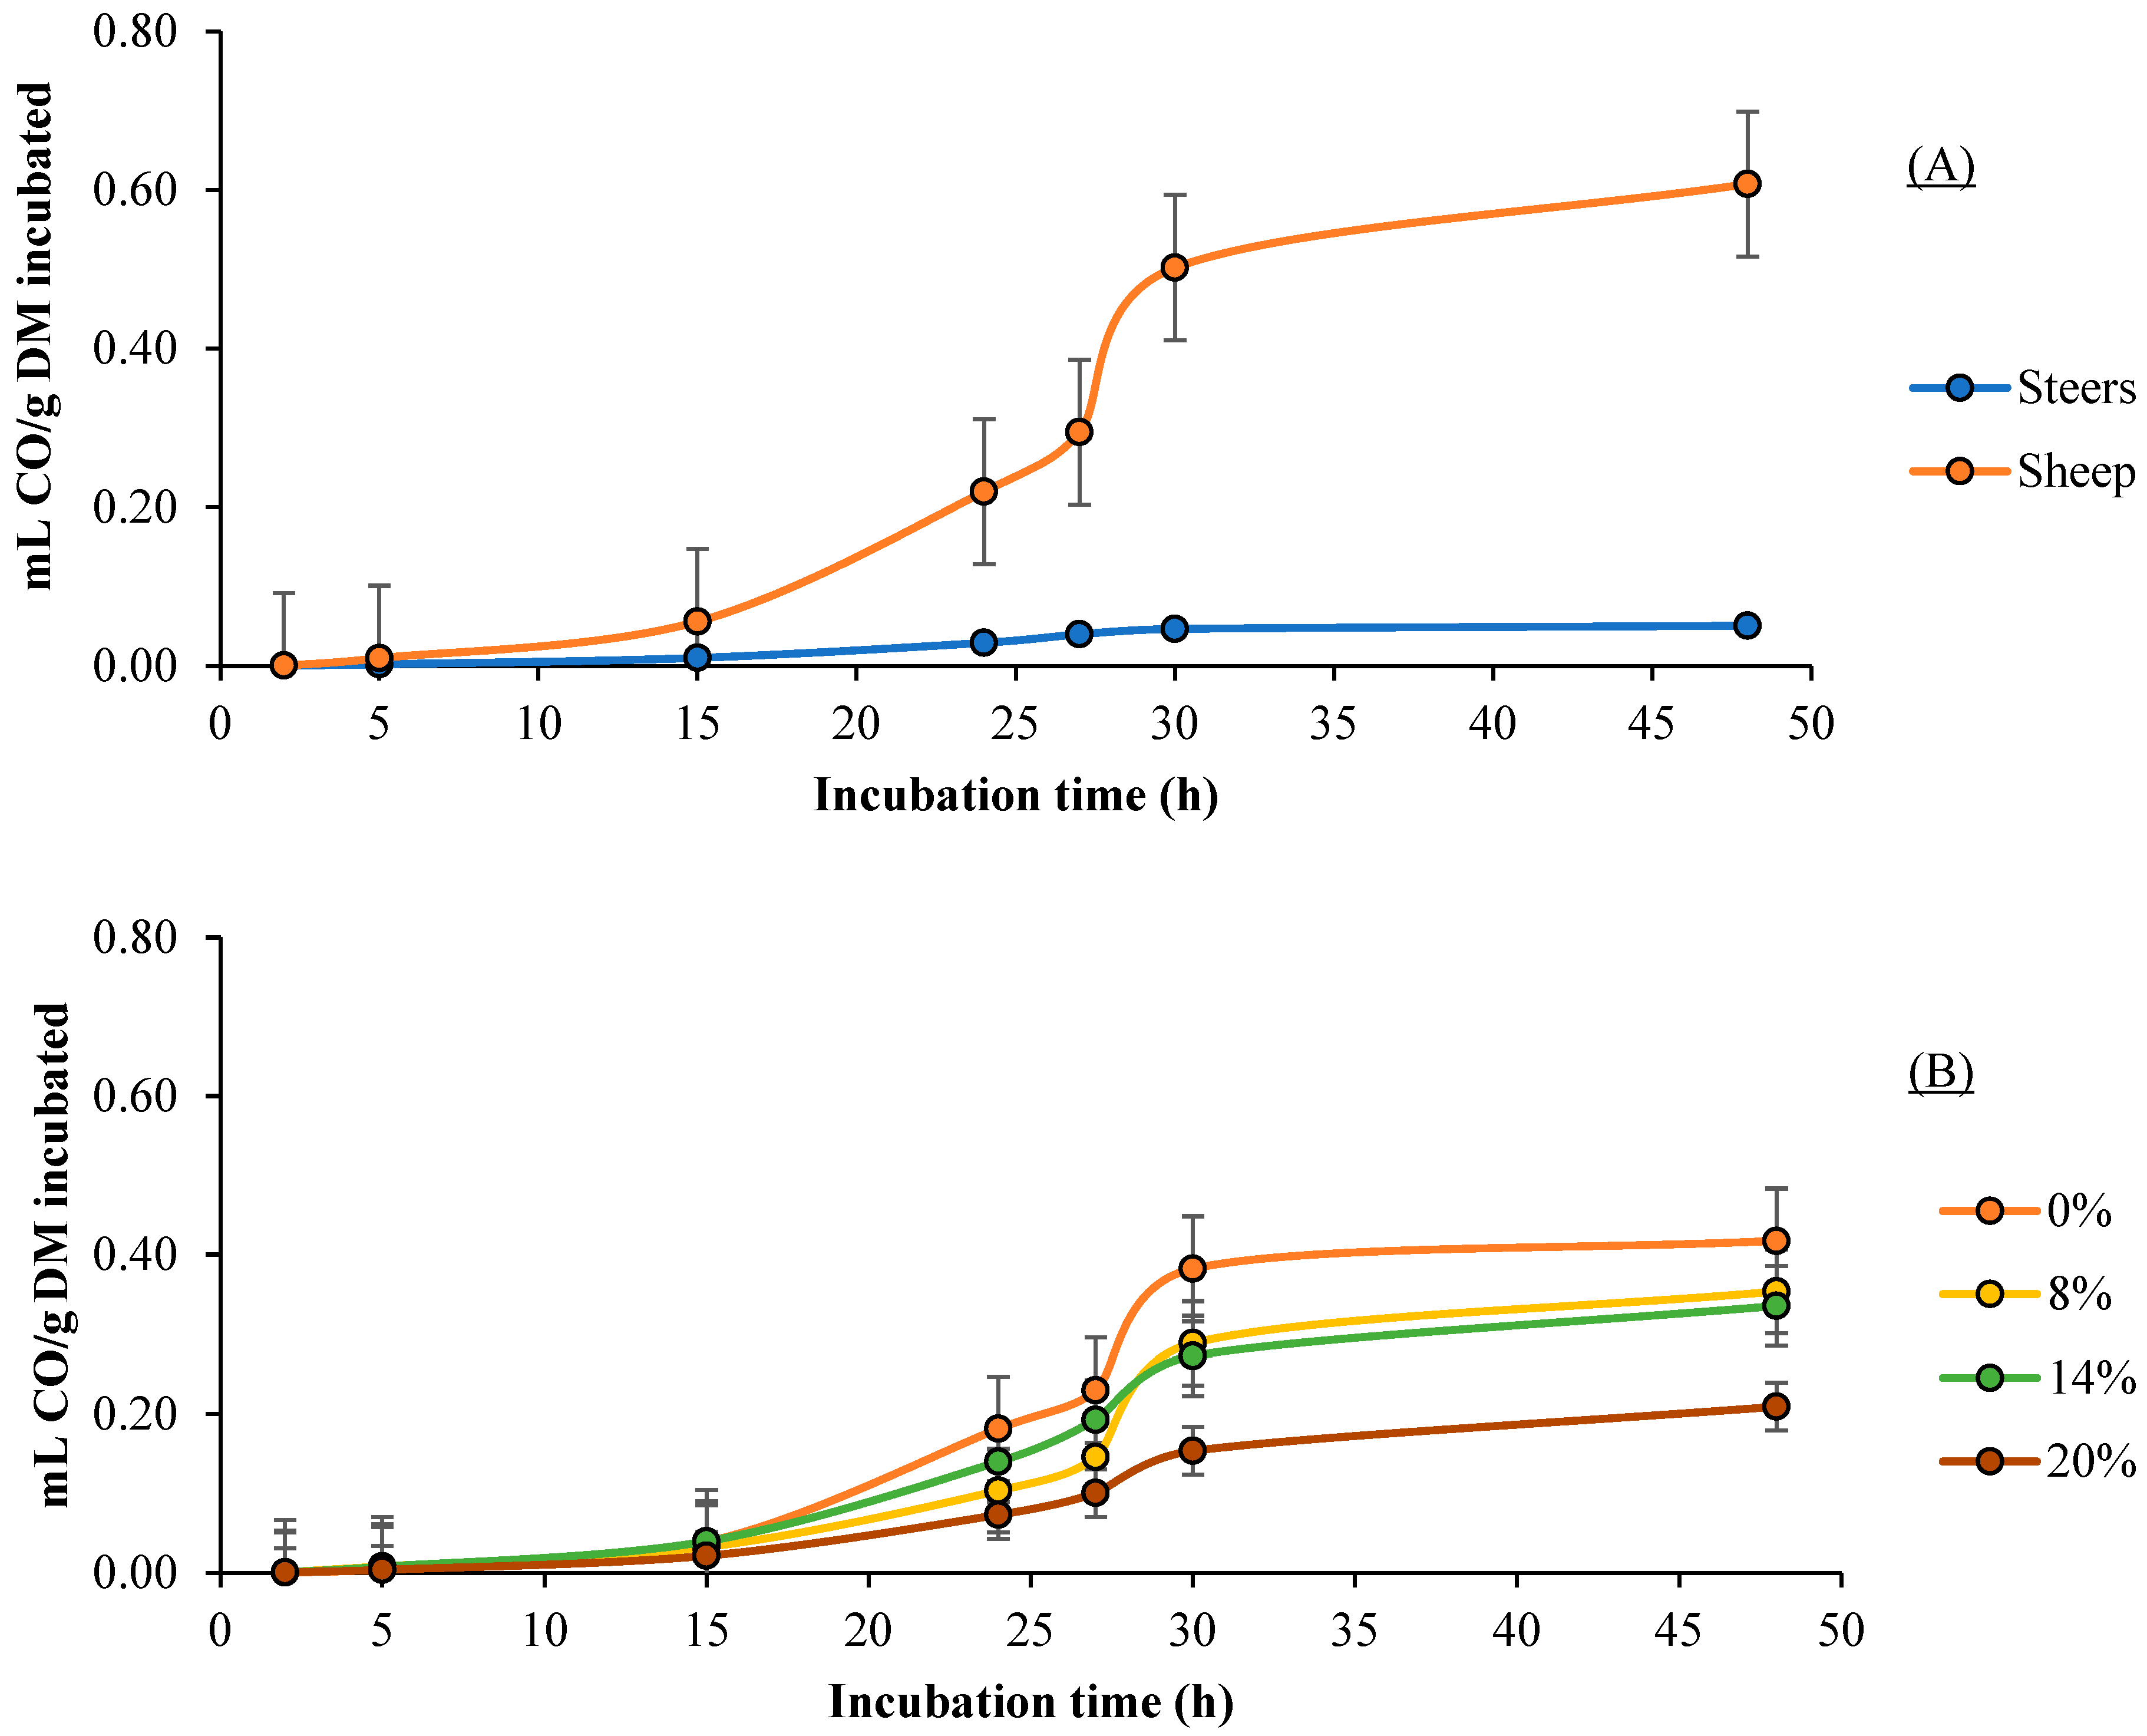
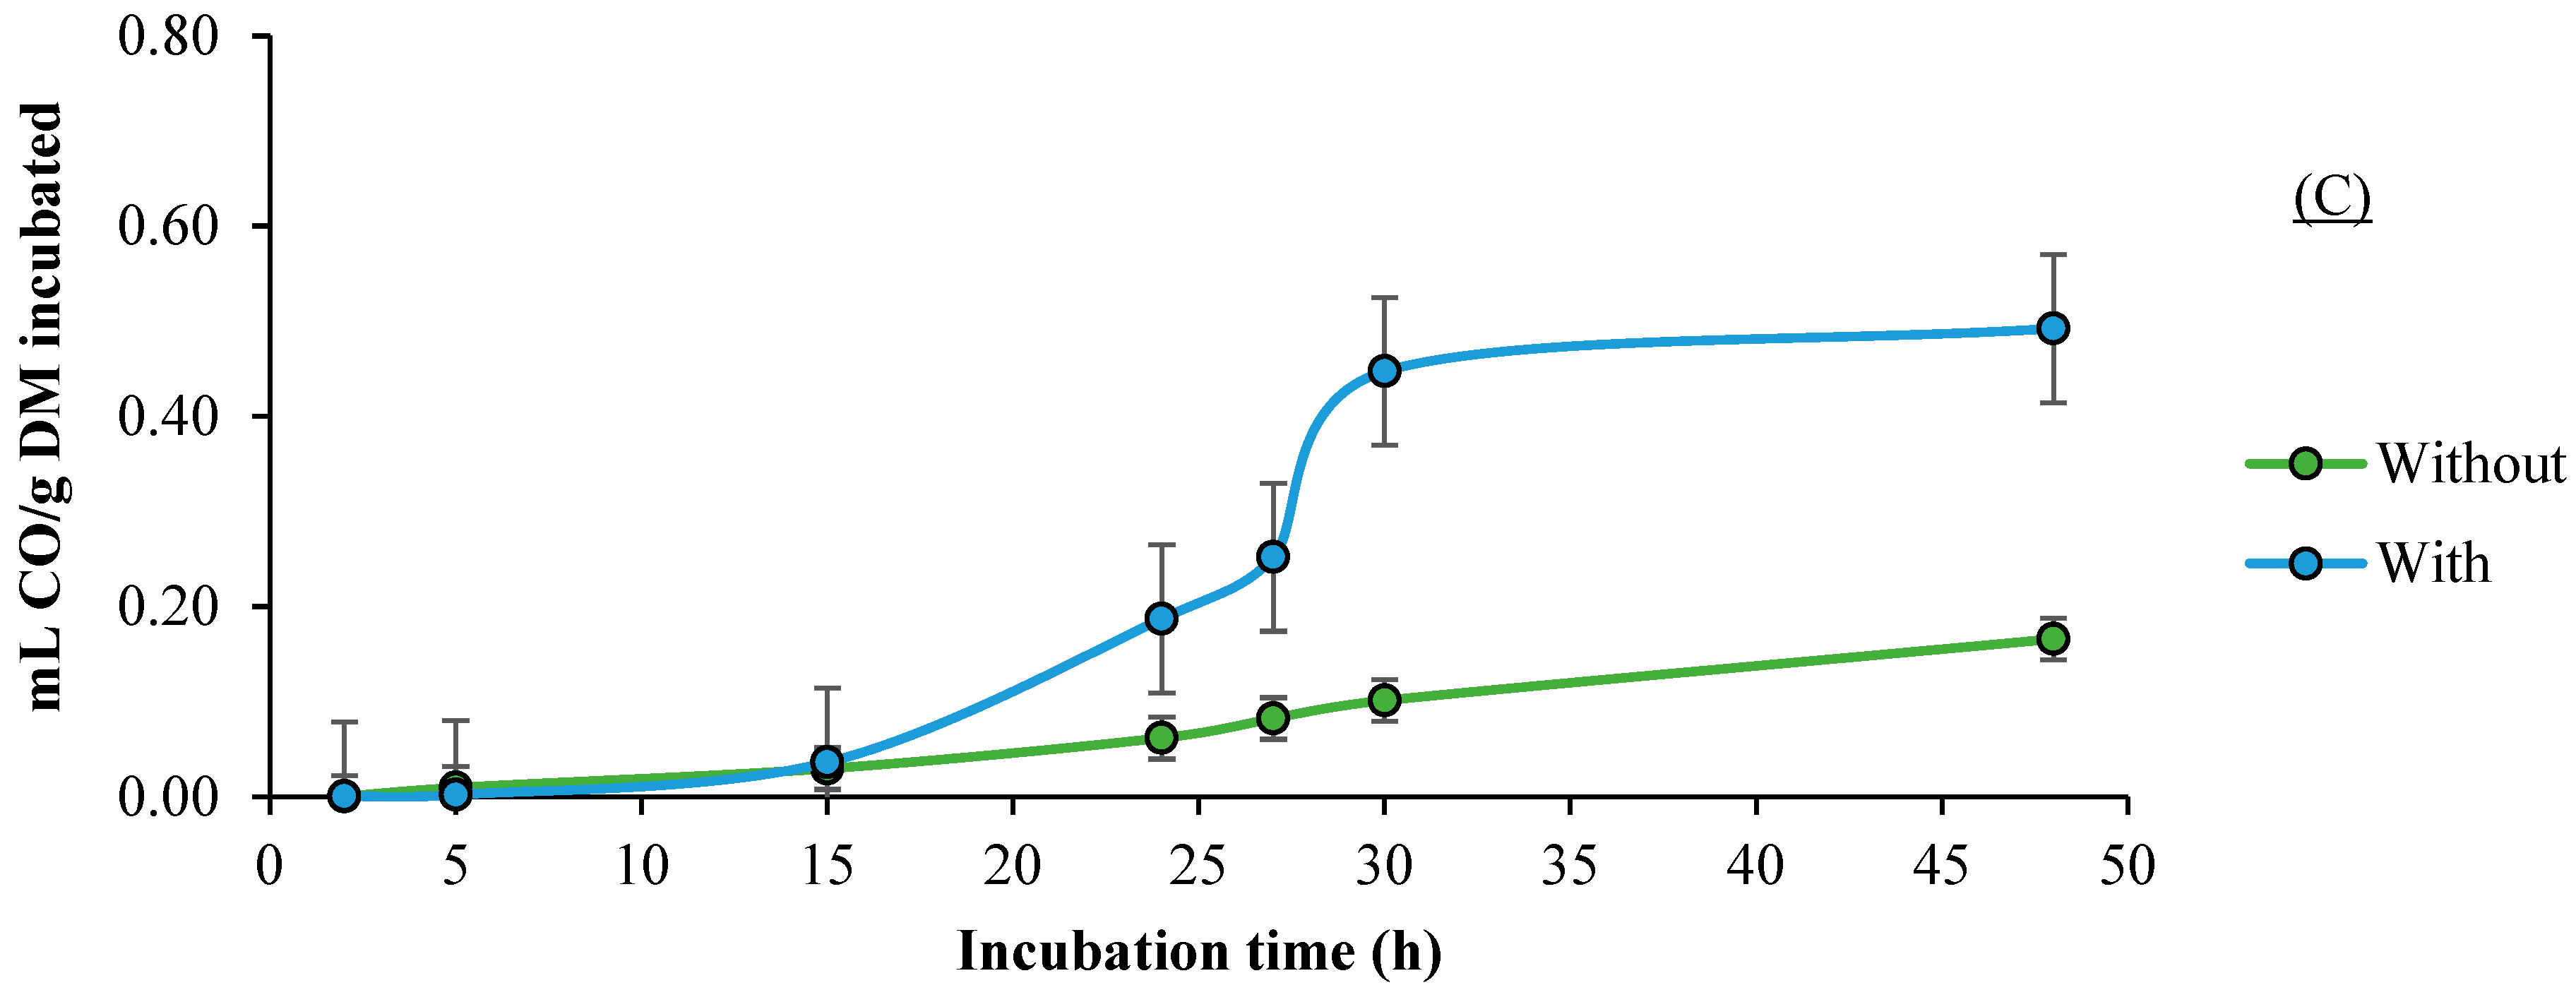
3.3. CO Production
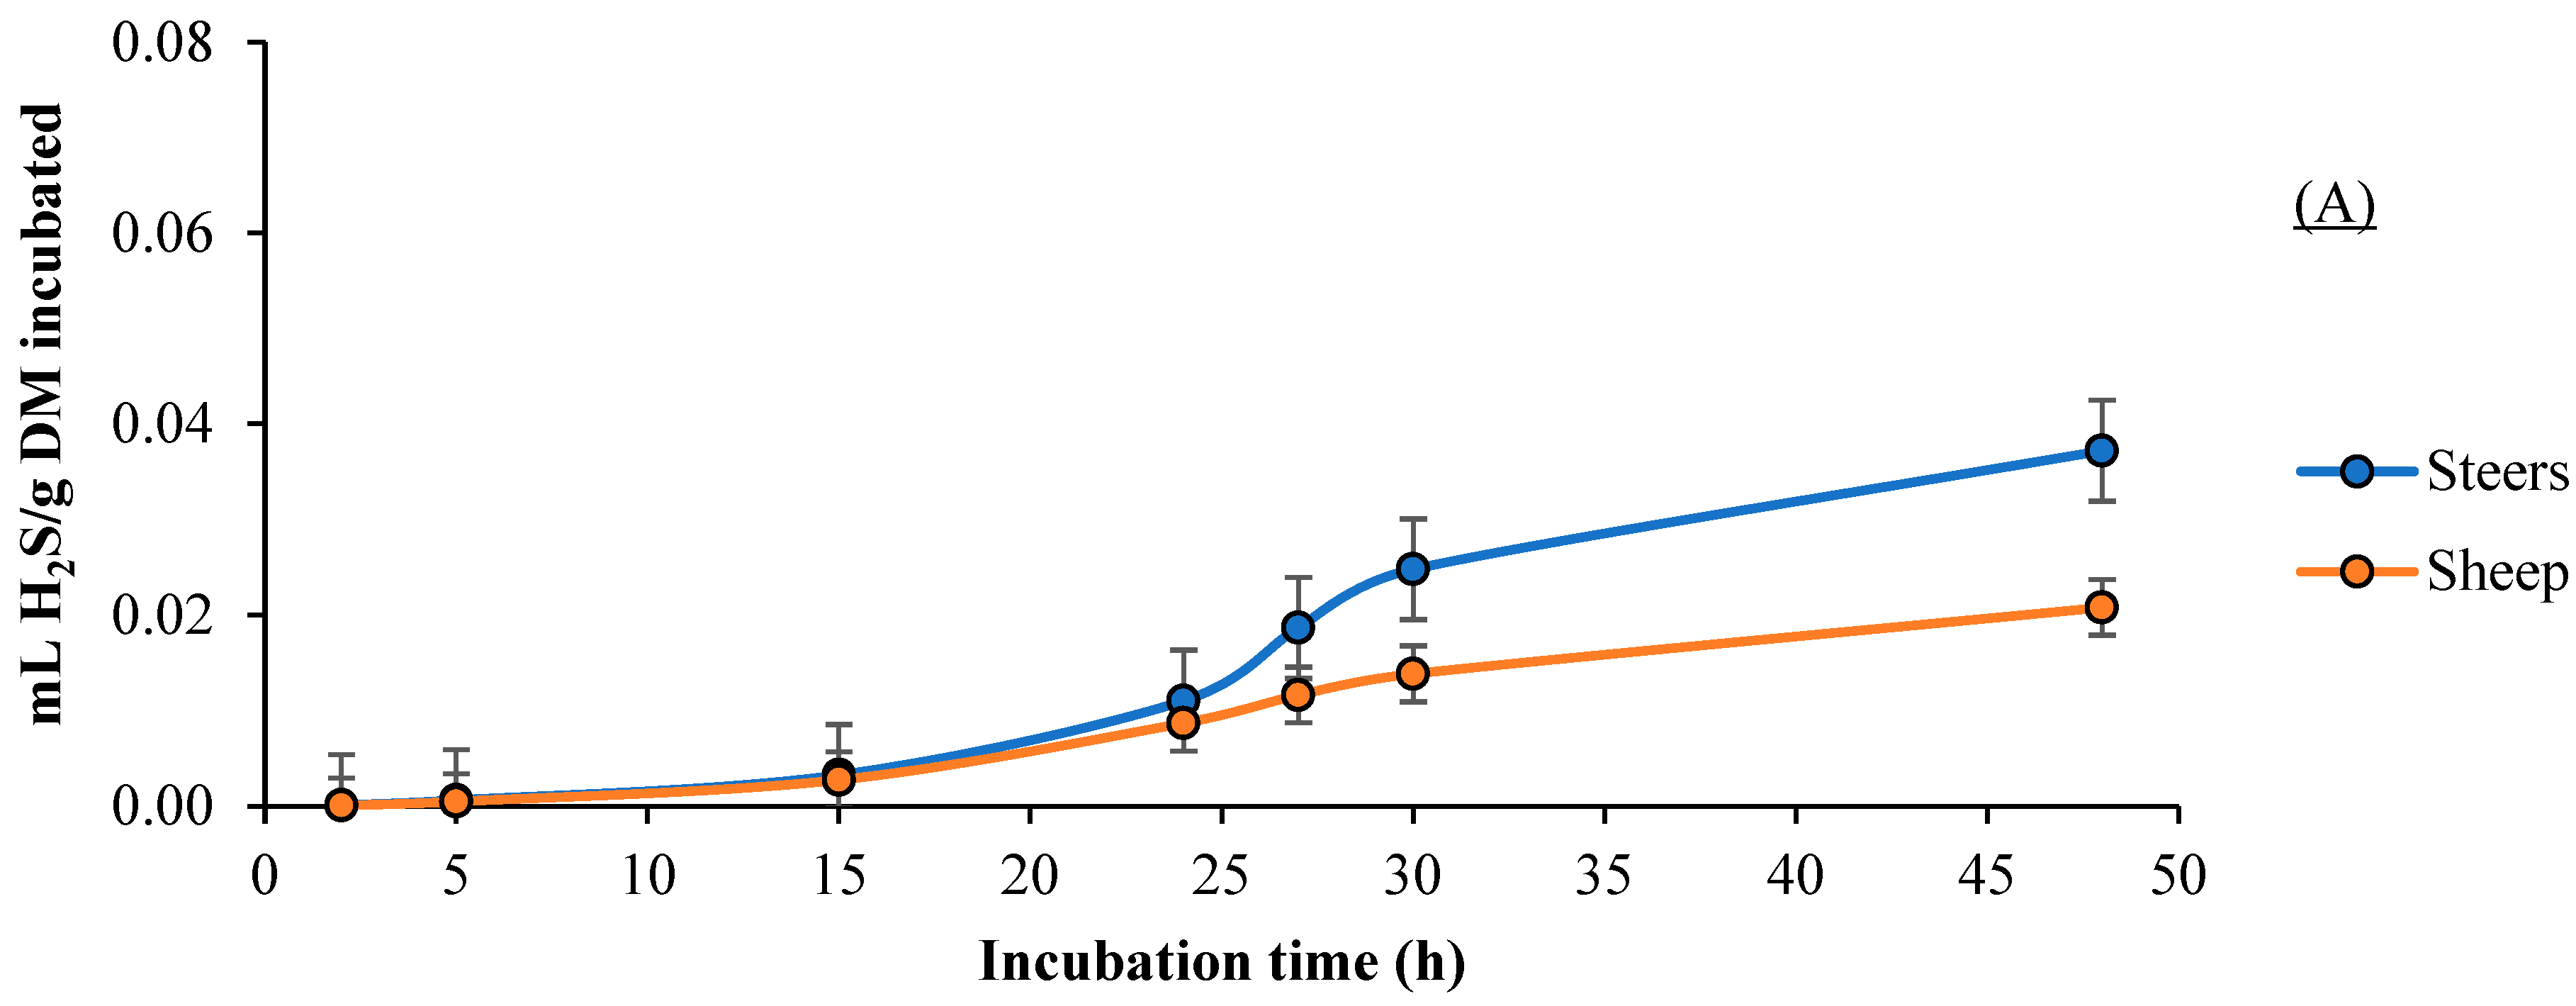
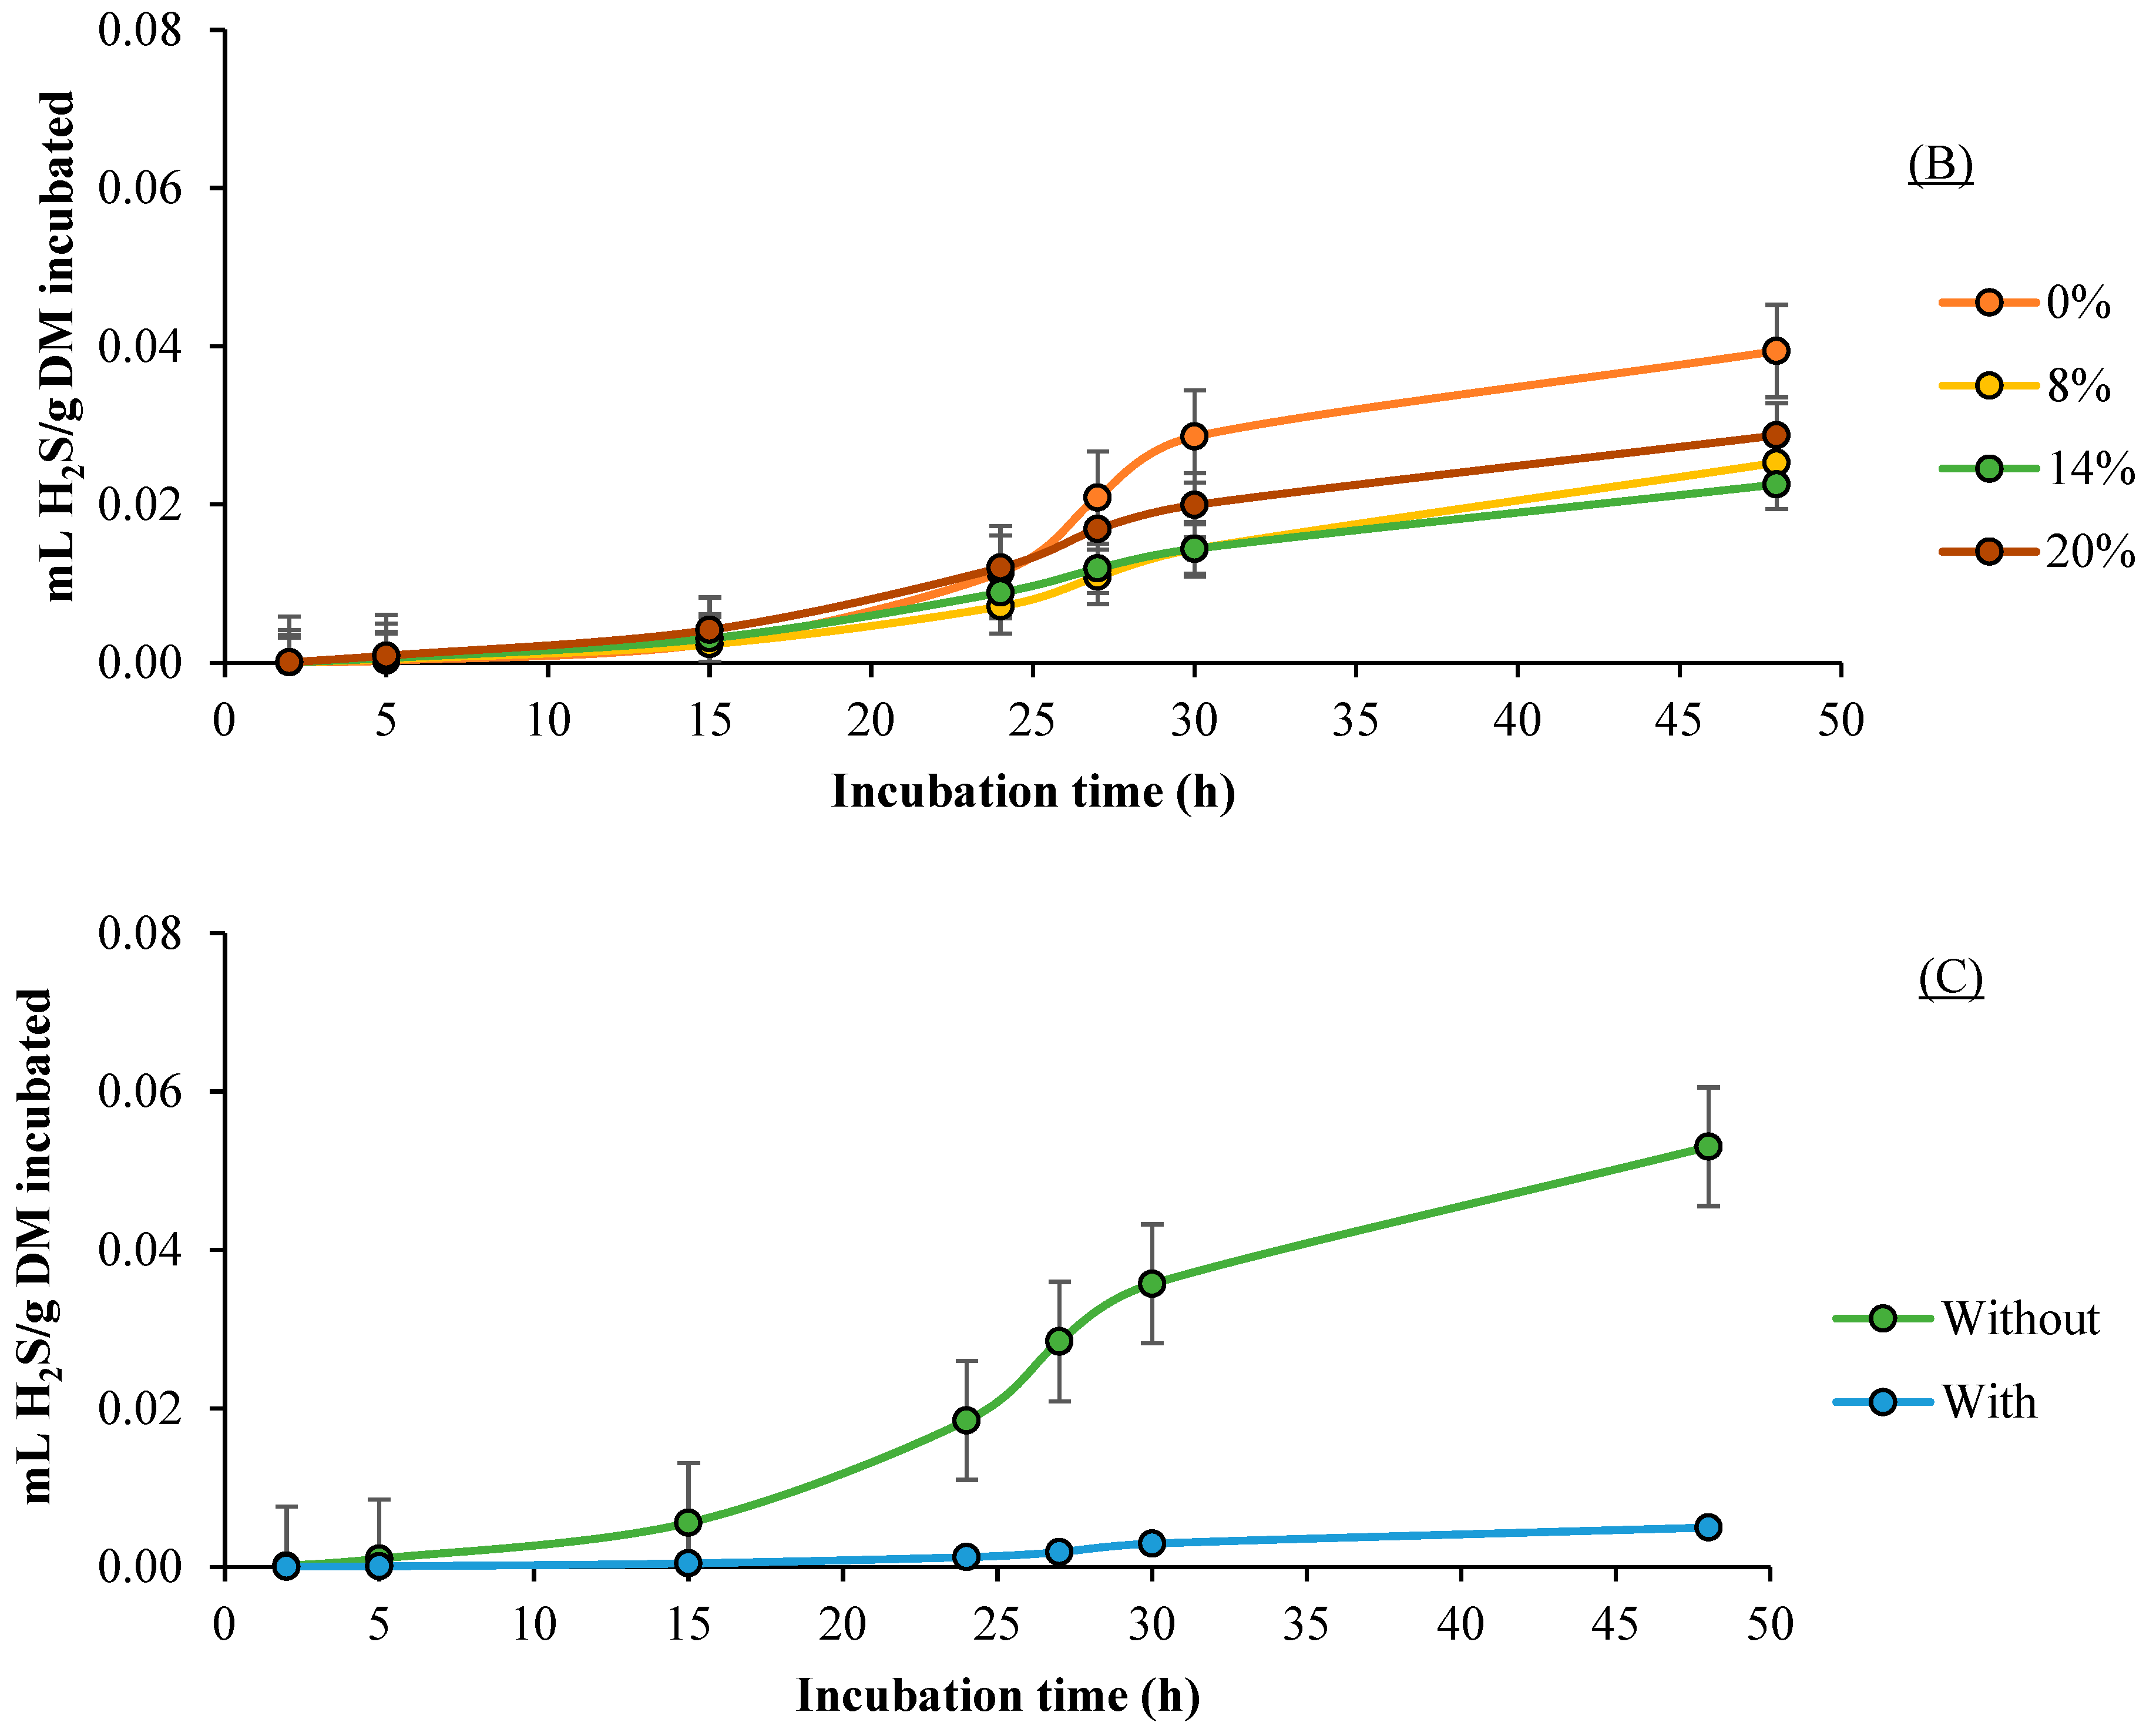
3.4. H2S Production
3.5. Rumen pH and Dry Matter Degradability
4. Discussion
4.1. Total Gas, CH4, CO, and H2S Production
4.2. Rumen pH and Dry Matter Degradability
Summarized Discussion
5. Conclusions
Author Contributions
Funding
Institutional Review Board Statement
Informed Consent Statement
Data Availability Statement
Acknowledgments
Conflicts of Interest
References
- Jungbluth, T.; Hartung, E.; Brose, G. Greenhouse gas emissions from animal houses and manure stores. Nutr. Cycl. Agroecosyst. 2001, 60, 133–145. [Google Scholar] [CrossRef]
- Gerber, P.J.; Steinfeld, H.; Henderson, B.; Mottet, A.; Opio, C.; Dijkman, J.; Falcucci, A.; Tempio, G. Tackling Climate Change Through Livestock—A Global Assessment of Emissions and Mitigation Opportunities; Food and Agriculture Organization of the United Nations (FAO): Rome, Italy, 2013. [Google Scholar]
- IPCC. Climate Change 2013. In The Physical Science Basis, Working Group I Contribution to the Fifth Assessment Report of the Intergovernmental Panel on Climate Change; WMO/UNEP: Cambridge, UK, 2013. [Google Scholar]
- Bruinsma, J. World Agriculture: Towards 2015/2030, an FAO Perspective; Earthscan: London, UK, 2003. [Google Scholar]
- Allen, M.R.; Peters, G.P.; Shine, K.P.; Azar, C.; Balcombe, P.; Boucher, O.; Cain, M.; Ciais, P.; Collins, W.; Forster, P.M.; et al. Indicate separate contributions of long-lived and short-lived greenhouse gases in emission targets. NPJ Clim. Atmos. Sci. 2022, 5, 5. [Google Scholar] [CrossRef] [PubMed]
- Thornton, P.K.; Herrero, M. Potential for reduced methane and carbon dioxide emissions from livestock and pasture management in the tropics. Proc. Natl. Acad. Sci. USA 2010, 107, 19667–19672. [Google Scholar] [CrossRef] [PubMed]
- Tejeda-Arroyo, E.; Cipriano-Salazar, M.; Camacho-Díaz, L.M.; Salem, A.Z.M.; Kholif, A.E.; Elghandour, M.M.M.Y.; DiLorenzo, N.; Cruz-Lagunas, B. Diet inclusion of Devil fish (Plecostomus spp.) silage and its impacts on ruminal fermentation and growth performance of growing lambs in hot regions of Mexico. Trop. Anim. Health Prod. 2015, 47, 861–866. [Google Scholar] [CrossRef] [PubMed]
- Cipriano-Salazar, M.; Abrego-Salgado, N.P.; Cruz-Lagunas, B.; Rojas-Hernández, S.; Olivares-Pérez, J.; Ávila-Morales, B.; Salem, A.Z.M.; Camacho-Díaz, L.M. Elaboration and characterization of biological devil fish silage (Plecostomus spp.) with Lactobacillus spp. and molasses as an additive in the Lower Basin of the Balsas River in the State of Guerrero, Mexico. Life Sci. J. 2015, 12, 68. [Google Scholar]
- Ward, W.J.; Parrott, G.A.; Iredale, D.G. Fish waste as silage for use as a feed supplement. Can. Ind. Rep. Fish. Aquat. Sci. 1985, 158, iv–10. [Google Scholar]
- Salas, G.; Gutiérrez, E.; Juárez, A.; Flores, J.P.; Perea, M. Use of the Devil Fish in animal feed as an alternative to productive diversification and mitigation of environmental damage in the south and west of México. J. Agric. Sci. Technol. A 2011, 1, 1232–1234. [Google Scholar]
- Asnawi, A.; Sjofjan, O.; Sudjarwo, E.; Suyadi, S. Potency of Sapu-Sapu fish (Hypostomus plecostomus) as feed supplement for local ducks. Int. J. Poult. Sci. 2015, 14, 240–244. [Google Scholar] [CrossRef]
- Garcia, E.D.A.; Khusro, A.; Figuero, P.E.B.; Adegbeye, M.J.; Barbabosa-Pliego, A.; Lagunas, B.C.; Salas, J.M.C.; Mateos, R.J.; Aarti, C.; Elghandour, M.M.Y. Influence of dietary supplementation of ensiled devil fish and Staphylococcus saprophyticus on equine fecal greenhouse gases production. J. Equine Vet. Sci. 2019, 79, 105–112. [Google Scholar] [CrossRef] [PubMed]
- Lambo, M.T.; Chang, X.; Liu, D. The recent trend in the use of multistrain probiotics in livestock production: An overview. Animals 2021, 11, 2805. [Google Scholar] [CrossRef] [PubMed]
- Retta, K.S. Role of probiotics in rumen fermentation and animal performance: A review. Int. J. Livest. Prod. 2016, 7, 24–32. [Google Scholar] [CrossRef]
- Farokh, K.; Shahab, P.; Pilar, G.; Darab, G.; Achille, S.; Andres, L.M.M. Effects of probiotic supplementation on milk production, blood metabolite profile and enzyme activities of ewes during lactation. Ital. J. Anim. Sci. 2019, 18, 134–139. [Google Scholar]
- Copani, G. Exploration of the potential of a novel Pediococcus acidilactici strain as a direct-fed microbial in ruminants. In Proceedings of the International Symposium on the Nutrition of Herbivores, Clermond-Ferrant, France, 2–6 September 2018. [Google Scholar]
- Ripamonti, B.; Agazzi, A.; Baldi, A.; Balzaretti, C.; Bersani, C.; Pirani, S.; Rebucci, R.; Savoini, G.; Stella, S.; Stenico, A.; et al. Administration of Bacillus coagulans in calves: Recovery from fecal samples and evaluation of functional aspects of spores. Vet. Res. Commun. 2009, 33, 991–1001. [Google Scholar] [CrossRef] [PubMed]
- Teclu, D.; Tivchev, G.; Laing, M.; Wallis, M. Determination of the elemental composition of molasses and its suitability as carbon source for growth of sulfate-reducing bacteria. J. Hazard. Mater. 2009, 161, 1157–1165. [Google Scholar] [CrossRef] [PubMed]
- Cherney, J.H.; Cherney, D.J.R. Assessing silage quality. In Silage Science and Technology; Buxton, D.R., Muck, R.E., Harrison, J.H., Eds.; American Society of Agronomy Inc.: Madison, WI, USA, 2003; pp. 141–198. [Google Scholar] [CrossRef]
- Elghandour, M.M.Y.; Maggiolino, A.; Alvarado-Ramírez, E.R.; Hernández-Meléndez, J.; Rivas-Caceres, R.R.; Hernández-Ruiz, P.E.; Khusro, A.; De Palo, P.; Salem, A.Z.M. Marine microalgae as a nutritive tool to mitigate ruminal greenhouse gas production: In vitro fermentation characteristics of fresh and ensiled maize (Zea mays L.) forage. Vet. Sci. 2023, 10, 556. [Google Scholar] [CrossRef] [PubMed]
- AOAC. Association of Official Analytical Chemists, 16th ed.; Association of Official Analytical Chemists International: Arlington, VA, USA, 1997. [Google Scholar]
- Van Soest, P.J.; Robertson, J.B.; Lewis, B.A. Methods for dietary fiber, neutral detergent fiber, and nonstarch polysaccharides in relation to animal nutrition. J. Dairy Sci. 1991, 74, 3583–3597. [Google Scholar] [CrossRef] [PubMed]
- Novriadi, R.; Roigé, O.; Segarra, S. Effects of dietary nucleotide supplementation on performance, profitability, and disease resistance of Litopenaeus vannamei cultured in Indonesia under intensive outdoor pond conditions. Animals 2022, 12, 2036. [Google Scholar] [CrossRef] [PubMed]
- Goering, M.K.; Van Soest, P.J. Forage Fibre Analysis (Apparatus, Reagents, Procedures and Some Applications); US Agricultural Research Service: Washington, DC, USA, 1970; Volume 1, pp. 1–24.
- Theodorou, M.K.; Williams, B.A.; Dhanoa, M.S.; McAllan, A.B.; France, J. Simple gas production method using a pressure transducer to determine the fermentation kinetics of ruminant feeds. Anim. Feed Sci. Technol. 1994, 48, 185–197. [Google Scholar] [CrossRef]
- SAS (Statistical Analysis System). User’s Guide: Statistics, Version 9.0; SAS Institute: Cary, NC, USA, 2002. Available online: https://support.sas.com/documentation/onlinedoc/stat/930/nlin.pdf (accessed on 10 July 2011).
- France, J.; Dijkstra, J.; Dhanoa, M.S.; Lopez, S.; Bannink, A. Estimating the extent of degradation of ruminant feeds from a description of their gas production profiles observed in vitro: Derivation of models and other mathematical considerations. Br. J. Nutr. 2000, 83, 143–150. [Google Scholar] [CrossRef] [PubMed]
- Vallejo-Hernandez, L.H.; Elghandour, M.Y.; Greiner, R.; Anele, U.Y.; Rivas-Caceres, R.R.; Barros-Rodríguez, M.; Salem, A.Z.M. Environmental impact of yeast and exogenous xylanase on mitigating carbon dioxide and enteric methane production in ruminants. J. Cleaner Prod. 2018, 189, 40–46. [Google Scholar] [CrossRef]
- Henderson, G.; Cox, F.; Ganesh, S.; Jonker, A.; Young, W.; Collaborators, G.R.C.; Janssen, P.H. Rumen microbial community composition varies with diet and host, but a core microbiome is found across a wide geographical range. Sci. Rep. 2016, 6, 19175. [Google Scholar] [CrossRef] [PubMed]
- Xing, B.S.; Cao, S.; Han, Y.; Wang, X.C.; Wen, J.; Zhang, K. A comparative study of artificial cow and sheep rumen fermentation of corn straw and food waste: Batch and continuous operation. Sci. Total Environ. 2020, 745, 140731. [Google Scholar] [CrossRef] [PubMed]
- Makkar, H.P.S.; Blümmel, M.; Becker, K. Formation of complexes between polyvinyl pyrrolidones or polyethylene glycols and tannins and their implications in gas production and true digestibility in in vitro techniques. Br. J. Nutr. 1995, 73, 897–933. [Google Scholar] [CrossRef] [PubMed]
- Astuti, W.D.; Wiryawan, K.G.; Wina, E.; Widyastuti, Y.; Suharti, S.; Ridwan, R. Effect of selected Lactobacillus plantarum as probiotic on in vitro ruminal fermentation and microbial population. Pak. J. Nutr. 2018, 17, 131–139. [Google Scholar] [CrossRef]
- Chen, L.; Jie, H.; Ren, A.; Zhou, C.; Tan, Z.; Li, B.; El-Hack, M.E.A.; Abdel-Latif, M.; Samak, D.H. In-vitro evaluation of the fermentation characters of maize stover and rice straw with different levels from Bacillus coagulans. Kafkas Univ. Vet. Fak. Derg. 2018, 24, 265–272. [Google Scholar] [CrossRef]
- Forabosco, F.; Chitchyan, Z.; Mantovani, R. Methane, nitrous oxide emissions and mitigation strategies for livestock in developing countries: A review. S. Afr. J. Anim. Sci. 2017, 47, 268–280. [Google Scholar] [CrossRef]
- Doyle, N.; Mbandlwa, P.; Kelly, W.J.; Attwood, G.; Li, Y.; Ross, R.P.; Stanton, C.; Leahy, S. Use of lactic acid bacteria to reduce methane production in ruminants: A critical review. Front. Microbiol. 2019, 10, 2207. [Google Scholar] [CrossRef] [PubMed]
- Won, M.; Lee, D.; Han, B.-H.; Hong, S.-B.; Kwon, S.-W.; Heo, J. Complete genome sequence of Pediococcus acidilactici BB2-4M isolated from cattle feces. Korean J. Microbiol. 2022, 47, 188–190. [Google Scholar] [CrossRef]
- Vazquez-Mendoza, O.V.; Elghandour, M.M.M.Y.; Berasai, M.A.M.; Inyang, U.A.; Jack, A.; Lackner, M.; Salem, A.Z.M. Guanidinoacetic acid effects on ruminal fermentation, digestibility and methane production in sheep liquor: Dose-response analysis. J. Agric. Food Res. 2024, 18, 101540. [Google Scholar] [CrossRef]
- Zhao, Y.; Wexler, A.S.; Hase, F.; Pan, Y.; Mitloehner, F.M. Carbon monoxide emissions from corn silage. J. Environ. Protect. 2021, 12, 438–453. [Google Scholar] [CrossRef]
- Haarstad, K.; Bergersen, O.; Sørheim, R. Occurrence of carbon monoxide during organic waste degradation. J. Air Waste Manag. Assoc. 2006, 56, 575–580. [Google Scholar] [CrossRef] [PubMed]
- Techtmann, S.M.; Colman, A.S.; Robb, F.T. That which does not kill us only makes us stronger: The role of carbon monoxide in thermophilic microbial consortia. Environ. Microbiol. 2009, 11, 1027–1037. [Google Scholar] [CrossRef] [PubMed]
- Alvarado-Ramírez, E.R.; Maggiolino, A.; Elghandour, M.M.M.Y.; Rivas-Jacobo, M.A.; Ballesteros-Rodea, G.; De Palo, P.; Salem, A.Z.M. Impact of co-ensiling of maize with Moringa oleifera on the production of greenhouse gases and the characteristics of fermentation in ruminants. Animals 2023, 13, 764. [Google Scholar] [CrossRef] [PubMed]
- Wang, S.; Giller, K.; Kreuzer, M.; Ulbrich, S.E.; Braun, U.; Schwarm, A. Contribution of ruminal fungi, archaea, protozoa, and bacteria to the methane suppression caused by oilseed supplemented diets. Front. Microbiol. 2017, 8, 1864. [Google Scholar] [CrossRef] [PubMed]
- Azar, M.S.; Doust-Nober, R.S.; Maheri, S.N. Effects of Zataria multiflora extract as rumen modifier using in vitro gas production technique. Curr. Res. J. Biol. Sci. 2012, 4, 350–354. [Google Scholar]
- Field, D.; de Ullivarri, M.F.; Ross, R.P.; Hill, C. After a century of nisin research—where are we now? FEMS Microbiol. Rev. 2023, 47, fuad023. [Google Scholar] [CrossRef] [PubMed]
- Callaway, T.; Martin, S.; Wampler, J.; Hill, N.; Hill, G. Malate content of forage varieties commonly fed to cattle. J. Dairy Sci. 1997, 80, 1651–1655. [Google Scholar] [CrossRef] [PubMed]
- Krunglevičiute, V.; Zelvyte, R.; Monkeviciene, I.; Kantautaite, J.; Stankevicius, R.; Ruzauskas, M.; Bartkiene, E. Applicability of Pediococcus strains for fermentation of cereal bran and its influence on the milk yield of dairy cattle. Zemdirb.-Agric. 2017, 104, 63–70. [Google Scholar] [CrossRef]


| Ingredient | % |
|---|---|
| Molasses | |
| Sucrose | 320 |
| Water | 18 |
| Glucose | 10 |
| Ash | 12 |
| Potassium | 7 |
| Calcium | 8 |
| Magnesium | 6 |
| Sodium | 3 |
| Protein | 2 |
| Sulphates | 6 |
| Amino acids | 0.7 |
| Non-nitrogenous acids | 3 |
| Wax, sterols, and phosphatides | 0.1 |
| Biotin, ppm | 0.9 |
| Riboflavin, ppm | 4.0 |
| Sucrose | 27 |
| Yogurt | |
| Total proteins | 3.4 |
| Total fats | 1.8 |
| Saturated fats | 1.1 |
| Trans fats | 0 |
| Carbohydrates | 12.8 |
| Total sugars | 11.5 |
| Added sugars | 7 |
| Dietary fiber | 0 |
| Na (mg) | 50 |
| Ca (mg) | 230 |
| Energy content (kcal) | 800 |
| Devilfish waste (DF) | |
| Dry matter | 9.54 |
| Crude protein | 31.91 |
| Ether extract | 2.93 |
| Ash | 26.75 |
| Organic matter | 73.25 |
| Mixed DF–molasses–yogurt silage | |
| Dry matter | 8.47 |
| Crude protein | 16.29 |
| Ether extract | 4.97 |
| Ash | 15.95 |
| Organic matter | 84.05 |
| ME (MJ/kg DM) | 13.36 |
| Level of Devilfish Silage, % | ||||
|---|---|---|---|---|
| 0 | 8 | 14 | 20 | |
| Ingredients, g/kg diet | ||||
| Maize grain | 735 | 675 | 615 | 555 |
| Maize stubble | 150 | 150 | 150 | 150 |
| Soybean grain | 90 | 70 | 70 | 70 |
| Devilfish silage 1 | 0 | 80 | 140 | 200 |
| Mineral salts 2 | 25 | 25 | 25 | 25 |
| Chemical composition, g/kg Dry matter | ||||
| Organic matter | 910 | 910 | 910 | 905 |
| Crude protein | 120 | 140 | 140 | 140 |
| Neutral detergent fiber | 400 | 420 | 420 | 520 |
| Acid detergent fiber | 220 | 220 | 230 | 350 |
| Metabolizable energy | 11.95 | 11.96 | 11.95 | 12.97 |
| Rumen Liquor (RL) | Level of Devilfish Silage, % (SF) | Probiotic (PB) | Total Gas Production | |||||
|---|---|---|---|---|---|---|---|---|
| Parameters 1 | mL Gas Total/g DM Incubated | |||||||
| b | c | Lag | 2 h | 24 h | 48 h | |||
| Steers | 0 | − | 294.8 b | 0.040 b | 6.9 | 23.9 | 182.6 d | 284.8 ab |
| + | 235.5 d | 0.042 b | 3.4 | 30.2 | 203.6 c | 228.7 a | ||
| 8 | − | 299.0 b | 0.039 b | 5.5 | 26.9 | 199.6 bc | 288.8 ab | |
| + | 304.0 b | 0.048 a | 6.0 | 32.6 | 257.1 b | 294.8 ab | ||
| 14 | − | 276.1 c | 0.037 b | 3.8 | 29.7 | 191.6 bc | 266.2 b | |
| + | 231.5 d | 0.040 b | 5.2 | 34.4 | 246.5 b | 278.0 ab | ||
| 20 | − | 298.4 ab | 0.036 ab | 3.4 | 33.8 | 203.6 bc | 286.5 ab | |
| + | 283.6 c | 0.057 a | 7.3 | 35.6 | 222.9 c | 262.2 c | ||
| SEM 2 | 20.71 | 0.0016 | 2.19 | 0.71 | 8.75 | 9.46 | ||
| SF | 0.0036 | 0.0092 | 0.0328 | <0.0001 | 0.0070 | 0.0166 | ||
| Linear | 0.0008 | 0.0152 | 0.9357 | <0.0001 | 0.0355 | 0.0813 | ||
| Quadratic | 0.3782 | 0.7143 | 0.0709 | 0.0824 | 0.0520 | 0.4327 | ||
| PB | <0.0001 | 0.0450 | 0.3027 | <0.0001 | <0.0001 | 0.0326 | ||
| SF × PB | 0.0168 | 0.0497 | 0.1263 | 0.0266 | 0.0707 | 0.0088 | ||
| Sheep | 0 | − | 229.9 d | 0.038 b | 4.7 | 25.4 | 162.1 d | 223.4 c |
| + | 326.3 a | 0.046 ab | 5.7 | 37.6 | 273.6 a | 318.0 a | ||
| 8 | − | 177.9 e | 0.016 c | 7.6 | 28.0 | 75.9 f | 147.4 d | |
| + | 285.6 d | 0.041 ab | 3.9 | 38.5 | 239.3 ab | 277.7 ab | ||
| 14 | − | 155.0 f | 0.017 c | 10.4 | 27.8 | 80.1 f | 133.0 e | |
| + | 224.1 d | 0.038 ab | 2.2 | 34.4 | 174.7 d | 212.2 c | ||
| 20 | − | 197.1 e | 0.016 c | 6.8 | 29.3 | 80.7 f | 157.1 d | |
| + | 122.1 g | 0.029 c | 7.8 | 32.9 | 101.6 e | 116.8 e | ||
| SEM 2 | 9.56 | 0.003 | 0.94 | 1.58 | 11.42 | 17.71 | ||
| SF | <0.0001 | <0.0001 | 0.3159 | 0.4879 | <0.0001 | <0.0001 | ||
| Linear | 0.1559 | 0.0018 | 0.5903 | 0.8088 | <0.0001 | <0.0001 | ||
| Quadratic | <0.0001 | <0.0001 | 0.6689 | 0.8937 | 0.0145 | 0.0587 | ||
| PB | 0.0192 | <0.0001 | 0.6175 | <0.0001 | <0.0001 | <0.0001 | ||
| SF × PB | 0.0233 | <0.0001 | 0.1850 | 0.0626 | 0.0001 | 0.0012 | ||
| Pooled SEM 2 | 16.13 | 0.0027 | 1.69 | 1.22 | 10.13 | 14.20 | ||
| p-value | ||||||||
| RL | <0.0001 | <0.0001 | 0.2699 | 0.1723 | <0.0001 | <0.0001 | ||
| SF | <0.0001 | <0.0001 | 0.5909 | 0.0022 | <0.0001 | <0.0001 | ||
| Linear | 0.0042 | 0.0003 | 0.6393 | 0.0002 | <0.0001 | <0.0001 | ||
| Quadratic | <0.0001 | <0.0001 | 0.2546 | 0.5267 | 0.3758 | 0.1663 | ||
| PB | 0.9328 | 0.1408 | 0.3819 | <0.0001 | <0.0001 | 0.0012 | ||
| RL × SF | <0.0001 | 0.0002 | 0.0644 | 0.0001 | <0.0001 | <0.0001 | ||
| RL × PB | <0.0001 | <0.0001 | 0.9601 | 0.0061 | <0.0001 | <0.0001 | ||
| SF × PB | 0.0404 | 0.0018 | 0.1327 | 0.0032 | <0.0001 | 0.0001 | ||
| RL × SF × PB | 0.0041 | 0.0062 | 0.1775 | 0.5735 | 0.0036 | 0.0012 | ||
| Rumen Liquor (RL) | Level of Devilfish Silage, % (SF) | Probiotic (PB) | CH4 Production | ||||||||
|---|---|---|---|---|---|---|---|---|---|---|---|
| Parameters 1 | mL CH4/g DM Incubated | mL CH4/100 mL Gas Total | |||||||||
| b | c | Lag | 2 h | 24 h | 48 h | 2 h | 24 h | 48 h | |||
| Steers | 0 | − | 53.58 | 0.0604 | 15.83 | 0.46 c | 23.84 a | 53.10 | 1.92 a | 13.02 a | 18.68 |
| + | 19.85 | 0.0409 | 16.86 | 0.08 f | 5.60 c | 18.78 | 0.25 b | 2.69 c | 8.19 | ||
| 8 | − | 51.82 | 0.0558 | 14.48 | 0.61 a | 25.10 a | 51.12 | 2.25 a | 12.63 a | 17.96 | |
| + | 25.52 | 0.0328 | 19.95 | 0.00 g | 4.32 c | 21.17 | 0.00 b | 1.69 d | 7.44 | ||
| 14 | − | 25.38 | 0.0505 | 14.72 | 0.50 b | 11.26 b | 25.01 | 1.67 a | 5.88 b | 9.38 | |
| + | 19.04 | 0.0400 | 12.55 | 0.00 g | 8.68 b | 18.46 | 0.00 b | 3.56 c | 6.94 | ||
| 20 | − | 36.13 | 0.0519 | 16.24 | 0.34 d | 13.35 b | 35.63 | 1.00 ab | 6.50 b | 12.42 | |
| + | 10.56 | 0.0529 | 14.29 | 0.00 g | 4.30 c | 10.20 | 0.00 b | 1.88 d | 4.00 | ||
| SEM 2 | 9.238 | 0.018 | 3.069 | 0.034 | 3.191 | 5.363 | 0.110 | 1.613 | 2.069 | ||
| SF | <0.0001 | 0.008 | 0.0025 | 0.0086 | 0.1711 | 0.0197 | 0.0001 | 0.0980 | 0.0324 | ||
| Linear | <0.0001 | 0.0442 | 0.1269 | 0.0109 | 0.0833 | 0.0273 | <0.0001 | 0.0372 | 0.0225 | ||
| Quadratic | 0.0321 | 0.0041 | 0.0004 | 0.3197 | 0.5230 | 0.1171 | 0.6684 | 0.3655 | 0.1563 | ||
| PB | 0.6931 | 0.9203 | 0.1189 | <0.0001 | <0.0001 | <0.0001 | <0.0001 | <0.0001 | <0.0001 | ||
| SF × PB | 0.3416 | 0.2549 | 0.2498 | 0.0053 | 0.0414 | 0.0881 | 0.0004 | 0.0410 | 0.2069 | ||
| Sheep | 0 | − | 32.02 | 0.0741 | 20.64 | 0.15 e | 2.84 c | 30.40 | 0.50 b | 1.75 d | 12.38 |
| + | 52.09 | 0.1007 | 23.00 | 0.00 g | 9.68 b | 51.70 | 0.00 b | 3.56 b | 17.69 | ||
| 8 | − | 16.89 | 0.0363 | 17.00 | 0.09 f | 3.47 c | 14.58 | 0.33 b | 4.46 b | 9.54 | |
| + | 50.93 | 0.1337 | 23.52 | 0.00 g | 9.99 b | 50.67 | 0.00 b | 3.75 b | 20.75 | ||
| 14 | − | 15.00 | 0.0473 | 13.19 | 0.14 e | 4.14 c | 13.75 | 0.50 b | 5.13 b | 9.96 | |
| + | 34.75 | 0.0982 | 21.64 | 0.00 g | 8.23 b | 34.76 | 0.00 b | 4.69 b | 16.44 | ||
| 20 | − | 20.27 | 0.0593 | 19.07 | 0.10 f | 2.89 c | 17.93 | 0.33 b | 3.58 b | 11.25 | |
| + | 18.38 | 0.1015 | 20.94 | 0.00 g | 5.04 c | 18.46 | 0.00 b | 4.50 b | 16.38 | ||
| SEM 2 | 5.440 | 0.005 | 1.074 | 0.024 | 1.602 | 8.722 | 0.083 | 0.906 | 3.464 | ||
| SF | 0.0111 | 0.0059 | 0.1509 | 0.6083 | 0.3435 | 0.0875 | 0.5847 | 0.1373 | 0.9281 | ||
| Linear | 0.8225 | 0.0277 | 0.4324 | 0.3411 | 0.1713 | 0.0186 | 0.3322 | 0.1460 | 0.7295 | ||
| Quadratic | 0.005 | 0.0247 | 0.2455 | 0.7079 | 0.4500 | 0.4873 | 0.5717 | 0.0647 | 0.6887 | ||
| PB | 0.3102 | 0.8421 | 0.8154 | <0.0001 | 0.0005 | 0.0056 | <0.0001 | 0.5455 | 0.0111 | ||
| SF × PB | 0.5875 | 0.3106 | 0.4921 | 0.6083 | 0.4411 | 0.2785 | 0.5847 | 0.4866 | 0.7980 | ||
| Pooled SEM 2 | 7.581 | 0.014 | 2.299 | 0.029 | 2.525 | 7.240 | 0.098 | 1.308 | 2.853 | ||
| p-value | |||||||||||
| RL | 0.9598 | <0.0001 | 0.0008 | <0.0001 | <0.0001 | 0.9665 | <0.0001 | 0.0037 | 0.0149 | ||
| SF | 0.0031 | 0.0364 | 0.0256 | 0.0138 | 0.0636 | 0.0029 | 0.0001 | 0.4095 | 0.1805 | ||
| Linear | 0.0021 | 0.0953 | 0.8210 | 0.0065 | 0.0285 | 0.0014 | <0.0001 | 0.2270 | 0.1199 | ||
| Quadratic | 0.1174 | 0.1561 | 0.0140 | 0.2981 | 0.8148 | 0.1504 | 0.4913 | 0.8739 | 0.2739 | ||
| PB | 0.4895 | 0.8252 | 0.4479 | <0.0001 | 0.0043 | 0.5543 | <0.0001 | <0.0001 | 0.7449 | ||
| RL × SF | <0.0001 | 0.0002 | 0.1892 | 0.0241 | 0.4865 | 0.7355 | 0.0004 | 0.0194 | 0.7069 | ||
| RL × PB | 0.2766 | 0.8690 | 0.7508 | <0.0001 | <0.0001 | <0.0001 | <0.0001 | <0.0001 | <0.0001 | ||
| SF × PB | 0.2211 | 0.2995 | 0.2978 | 0.0191 | 0.1568 | 0.2260 | 0.0008 | 0.0734 | 0.6701 | ||
| RL × SF × PB | 0.9839 | 0.2777 | 0.6555 | 0.0069 | 0.0150 | 0.1441 | 0.0010 | 0.0388 | 0.4663 | ||
| Rumen Liquor (RL) | Level of Devilfish Silage, % (SF) | Probiotic (PB) | CO Production | |||||
|---|---|---|---|---|---|---|---|---|
| Parameters 1 | mL CO/g DM Incubated | |||||||
| b | c | Lag | 2 h | 24 h | 48 h | |||
| Steers | 0 | − | 0.0183 c | 0.00001 | 0.0017 | 0.00007 c | 0.00843 | 0.01814 b |
| + | 0.0748 a | 0.00006 | 0.0124 | 0.00042 c | 0.04358 | 0.07280 ab | ||
| 8 | − | 0.0141 c | 0.00001 | 0.0014 | 0.00010 c | 0.00778 | 0.01398 b | |
| + | 0.0784 a | 0.00006 | 0.0143 | 0.00119 a | 0.04309 | 0.07533 ab | ||
| 14 | − | 0.0150 c | 0.00001 | 0.0013 | 0.00010 c | 0.00890 | 0.01490 b | |
| + | 0.0993 a | 0.00007 | 0.0149 | 0.00141 a | 0.05558 | 0.09618 ab | ||
| 20 | − | 0.0165 c | 0.00001 | 0.0015 | 0.00009 c | 0.00817 | 0.01626 b | |
| + | 0.0995 a | 0.00005 | 0.0108 | 0.00134 a | 0.05868 | 0.09799 ab | ||
| SEM 2 | 0.09020 | 0.000036 | 0.00183 | 0.000074 | 0.003984 | 0.00508 | ||
| SF | <0.0001 | <0.0001 | <0.0001 | <0.0001 | 0.1324 | 0.0466 | ||
| Linear | <0.0001 | <0.0001 | <0.0001 | <0.0001 | 0.0811 | 0.0357 | ||
| Quadratic | 0.0008 | <0.0001 | <0.0001 | 0.0006 | 0.4741 | 0.3494 | ||
| PB | 0.9445 | 0.1150 | 0.3031 | <0.0001 | <0.0001 | <0.0001 | ||
| SF × PB | 0.8969 | 0.0111 | 0.0093 | <0.0001 | 0.1618 | 0.0336 | ||
| Sheep | 0 | − | 0.2209 b | 0.00005 | 0.0112 | 0.00053 c | 0.14134 | 0.21699 ab |
| + | 1.4006 a | 0.00009 | 0.0203 | 0.00013 c | 0.53225 | 1.36220 a | ||
| 8 | − | 0.5294 b | 0.00003 | 0.0149 | 0.00083 a | 0.13430 | 0.45366 ab | |
| + | 0.8927 a | 0.00020 | 0.0227 | 0.00012 c | 0.22860 | 0.87301 a | ||
| 14 | − | 0.3426 b | 0.00003 | 0.0099 | 0.00120 a | 0.13970 | 0.31584 ab | |
| + | 0.9287 a | 0.00008 | 0.0192 | 0.00010 c | 0.35595 | 0.91568 a | ||
| 20 | − | 0.3447 b | 0.00004 | 0.0205 | 0.00086 a | 0.04616 | 0.27726 ab | |
| + | 0.4585 b | 0.00009 | 0.0198 | 0.00008 c | 0.17935 | 0.44540 ab | ||
| SEM 2 | 0.00529 | 0.000004 | 0.00077 | 0.000227 | 0.056396 | 0.080357 | ||
| SF | <0.0001 | 0.0262 | 0.0011 | 0.5903 | 0.0073 | 0.0006 | ||
| Linear | 0.0028 | 0.243 | 0.003 | 0.5484 | 0.0011 | <0.0001 | ||
| Quadratic | <0.0001 | 0.0179 | 0.0047 | 0.2251 | 0.6433 | 0.5706 | ||
| PB | 0.0187 | 0.3071 | 0.0042 | 0.0003 | <0.0001 | <0.0001 | ||
| SF × PB | 0.0008 | 0.2551 | 0.0718 | 0.5215 | 0.0785 | 0.0001 | ||
| Pooled SEM 2 | 0.06389 | 0.000025 | 0.00141 | 0.000169 | 0.039977 | 0.056935 | ||
| p-value | ||||||||
| RL | <0.0001 | 0.0014 | <0.0001 | 0.2091 | <0.0001 | <0.0001 | ||
| SF | <0.0001 | 0.0002 | <0.0001 | 0.0117 | 0.0037 | 0.0001 | ||
| Linear | <0.0001 | 0.0157 | <0.0001 | 0.0161 | 0.0006 | <0.0001 | ||
| Quadratic | <0.0001 | 0.0018 | <0.0001 | 0.0170 | 0.6050 | 0.5275 | ||
| PB | 0.0137 | 0.3823 | 0.0120 | 0.1415 | <0.0001 | <0.0001 | ||
| RL × SF | <0.0001 | 0.2827 | 0.0043 | 0.5604 | 0.0024 | <0.0001 | ||
| RL × PB | 0.0135 | 0.2337 | 0.0014 | <0.0001 | 0.0002 | <0.0001 | ||
| SF × PB | 0.0001 | 0.1653 | 0.0118 | 0.7110 | 0.0685 | <0.0001 | ||
| RL × SF × PB | 0.0001 | 0.3110 | 0.1162 | 0.0108 | 0.0536 | <0.0001 | ||
| Rumen Liquor (RL) | Level of Devilfish Silage, % (SF) | Probiotic (PB) | H2S Production | |||||
|---|---|---|---|---|---|---|---|---|
| Parameters 1 | mL H2S/g DM Incubated | |||||||
| b | c | Lag | 2 h | 24 h | 48 h | |||
| Steers | 0 | − | 0.0945 | 0.00010 a | 0.0228 | 0.00010 | 0.01615 a | 0.09454 |
| + | 0.0601 | 0.00005 b | 0.0209 | 0.00000 | 0.00135 b | 0.00603 | ||
| 8 | − | 0.0481 | 0.00004 b | 0.0163 | 0.00013 | 0.01390 a | 0.05698 | |
| + | 0.0733 | 0.00005 b | 0.0146 | 0.00002 | 0.00123 b | 0.00656 | ||
| 14 | − | 0.0060 | 0.00001 c | 0.0021 | 0.00018 | 0.01613 a | 0.04569 | |
| + | 0.0066 | 0.00001 c | 0.0022 | 0.00002 | 0.00539 b | 0.01102 | ||
| 20 | − | 0.0112 | 0.00000 d | 0.0014 | 0.00019 | 0.03313 a | 0.07238 | |
| + | 0.0044 | 0.00001 c | 0.0022 | 0.00002 | 0.00100 b | 0.00437 | ||
| SEM 2 | 0.00287 | 0.000003 | 0.00040 | 0.000027 | 0.004645 | 0.008641 | ||
| SF | <0.0001 | <0.0001 | <0.0001 | 0.2401 | 0.2160 | 0.0963 | ||
| Linear | <0.0001 | <0.0001 | <0.0001 | 0.0741 | 0.0925 | 0.1870 | ||
| Quadratic | 0.0001 | <0.0001 | <0.0001 | 0.3687 | 0.6012 | 0.0486 | ||
| PB | 0.5234 | 0.0628 | 0.2975 | <0.0001 | <0.0001 | <0.0001 | ||
| SF × PB | 0.0202 | <0.0001 | 0.3860 | 0.5259 | 0.1228 | 0.0371 | ||
| Sheep | 0 | − | 0.0521 | 0.00006 b | 0.0150 | 0.00010 | 0.02794 a | 0.05227 |
| + | 0.0048 | 0.00002 c | 0.0026 | 0.00000 | 0.00031 b | 0.00477 | ||
| 8 | − | 0.0364 | 0.00004 b | 0.0141 | 0.00011 | 0.01309 a | 0.03449 | |
| + | 0.0031 | 0.00001 c | 0.0026 | 0.00000 | 0.00025 b | 0.00313 | ||
| 14 | − | 0.0320 | 0.00004 b | 0.0130 | 0.00011 | 0.01381 a | 0.03112 | |
| + | 0.0025 | 0.00001 c | 0.0027 | 0.00000 | 0.00016 b | 0.00240 | ||
| 20 | − | 0.0392 | 0.00004 b | 0.0142 | 0.00012 | 0.01392 a | 0.03677 | |
| + | 0.0016 | 0.00001 c | 0.0026 | 0.00000 | 0.00010 b | 0.00139 | ||
| SEM 2 | 0.00833 | 0.000005 | 0.00087 | 0.000006 | 0.000446 | 0.002686 | ||
| SF | <0.0001 | <0.0001 | <0.0001 | 0.6171 | <0.0001 | 0.0021 | ||
| Linear | <0.0001 | <0.0001 | <0.0001 | 0.2027 | <0.0001 | 0.0029 | ||
| Quadratic | <0.0001 | <0.0001 | <0.0001 | 0.8693 | <0.0001 | 0.0080 | ||
| PB | 0.1898 | <0.0001 | 0.8954 | <0.0001 | <0.0001 | <0.0001 | ||
| SF × PB | 0.0089 | 0.0010 | 0.1235 | 0.6171 | <0.0001 | 0.0145 | ||
| Pooled SEM 2 | 0.0062 | 0.00001 | 0.0007 | 0.00002 | 0.0033 | 0.0064 | ||
| p-value | ||||||||
| RL | <0.0001 | 0.0045 | <0.0001 | 0.0128 | 0.1661 | <0.0001 | ||
| SF | <0.0001 | <0.0001 | <0.0001 | 0.1536 | 0.1457 | 0.0043 | ||
| Linear | <0.0001 | <0.0001 | <0.0001 | 0.0389 | 0.7993 | 0.0245 | ||
| Quadratic | <0.0001 | <0.0001 | <0.0001 | 0.3547 | 0.1661 | 0.0061 | ||
| PB | 0.2955 | 0.0001 | 0.3621 | <0.0001 | <0.0001 | <0.0001 | ||
| RL × SF | 0.0031 | <0.0001 | <0.0001 | 0.3487 | 0.0201 | 0.6283 | ||
| RL × PB | 0.8662 | 0.3892 | 0.3083 | 0.3061 | 0.8573 | 0.0005 | ||
| SF × PB | 0.0007 | <0.0001 | 0.3470 | 0.4168 | 0.0508 | 0.0024 | ||
| RL × SF × PB | 0.0002 | 0.0030 | 0.2566 | 0.6478 | 0.0179 | 0.2468 | ||
| Rumen Liquor (RL) | Level of Devilfish Silage, % (SF) | Probiotic (PB) | pH 1 | DMD 1, % |
|---|---|---|---|---|
| Steers | 0 | − | 6.57 | 83.79 a |
| + | 5.91 | 66.57 b | ||
| 8 | − | 6.99 | 85.38 a | |
| + | 5.90 | 62.10 b | ||
| 14 | − | 6.88 | 85.42 a | |
| + | 5.85 | 53.50 b | ||
| 20 | − | 7.07 | 86.13 a | |
| + | 5.98 | 55.86 b | ||
| SEM 2 | 0.072 | 1.933 | ||
| SF | 0.0078 | 0.0370 | ||
| Linear | 0.0012 | 0.0457 | ||
| Quadratic | 0.8036 | 0.0456 | ||
| PB | <0.0001 | <0.0001 | ||
| SF × PB | 0.0243 | 0.0056 | ||
| Sheep | 0 | − | 6.81 | 83.47 a |
| + | 6.60 | 73.35 ab | ||
| 8 | − | 6.92 | 71.21 ab | |
| + | 6.42 | 73.80 ab | ||
| 14 | − | 6.94 | 72.65 ab | |
| + | 6.51 | 73.77 ab | ||
| 20 | − | 6.95 | 72.92 ab | |
| + | 6.46 | 68.35 b | ||
| SEM 2 | 0.053 | 1.080 | ||
| SF | 0.7351 | <0.0001 | ||
| Linear | 0.9753 | <0.0001 | ||
| Quadratic | 0.6815 | 0.1794 | ||
| PB | <0.0001 | 0.0024 | ||
| SF × PB | 0.0494 | <0.0001 | ||
| Pooled SEM 2 | 0.063 | 1.565 | ||
| p-value | ||||
| RL | <0.0001 | 0.0952 | ||
| SF | 0.0306 | <0.0001 | ||
| Linear | 0.0034 | <0.0001 | ||
| Quadratic | 0.9660 | 0.0148 | ||
| PB | <0.0001 | <0.0001 | ||
| RL × SF | 0.0120 | 0.0718 | ||
| RL × PB | <0.0001 | <0.0001 | ||
| SF × PB | 0.0007 | 0.0224 | ||
| RL × SF × PB | 0.7914 | <0.0001 |
Disclaimer/Publisher’s Note: The statements, opinions and data contained in all publications are solely those of the individual author(s) and contributor(s) and not of MDPI and/or the editor(s). MDPI and/or the editor(s) disclaim responsibility for any injury to people or property resulting from any ideas, methods, instructions or products referred to in the content. |
© 2025 by the authors. Licensee MDPI, Basel, Switzerland. This article is an open access article distributed under the terms and conditions of the Creative Commons Attribution (CC BY) license (https://creativecommons.org/licenses/by/4.0/).
Share and Cite
Ponce-Covarrubias, J.L.; Elghandour, M.M.M.Y.; Rodríguez, G.B.; Adegbeye, M.J.; Lackner, M.; Salem, A.Z.M. Influence of Pediococcus acidilactici and Bacillus coagulans on In Vitro Ruminal Greenhouse Gas Production of Fermented Devilfish in Livestock Rumen Contents. Fermentation 2025, 11, 416. https://doi.org/10.3390/fermentation11070416
Ponce-Covarrubias JL, Elghandour MMMY, Rodríguez GB, Adegbeye MJ, Lackner M, Salem AZM. Influence of Pediococcus acidilactici and Bacillus coagulans on In Vitro Ruminal Greenhouse Gas Production of Fermented Devilfish in Livestock Rumen Contents. Fermentation. 2025; 11(7):416. https://doi.org/10.3390/fermentation11070416
Chicago/Turabian StylePonce-Covarrubias, José Luis, Mona M. M. Y. Elghandour, Germán Buendía Rodríguez, Moyosore Joseph Adegbeye, Maximilian Lackner, and Abdelfattah Z. M. Salem. 2025. "Influence of Pediococcus acidilactici and Bacillus coagulans on In Vitro Ruminal Greenhouse Gas Production of Fermented Devilfish in Livestock Rumen Contents" Fermentation 11, no. 7: 416. https://doi.org/10.3390/fermentation11070416
APA StylePonce-Covarrubias, J. L., Elghandour, M. M. M. Y., Rodríguez, G. B., Adegbeye, M. J., Lackner, M., & Salem, A. Z. M. (2025). Influence of Pediococcus acidilactici and Bacillus coagulans on In Vitro Ruminal Greenhouse Gas Production of Fermented Devilfish in Livestock Rumen Contents. Fermentation, 11(7), 416. https://doi.org/10.3390/fermentation11070416