Article

The Effect of ESTAAN on Must Browning Induced by Fungal Disease (Botrytis cinerea) That Affects Grapes

Department of Viticulture and Enology, Faculty of Horticulture, Mendel University in Brno, Valticka 337, 69144 Lednice, Czech Republic
*
Author to whom correspondence should be addressed.
Fermentation 2025, 11(7), 360; https://doi.org/10.3390/fermentation11070360
Submission received: 21 May 2025 / Revised: 13 June 2025 / Accepted: 17 June 2025 / Published: 20 June 2025
(This article belongs to the Special Issue Biotechnology in Winemaking)

Abstract

Laccase, produced by the fungus Botrytis cinerea, is a key enzyme that catalyzes the oxidation of phenolic compounds, leading to a deterioration in the sensory quality of the must. This study investigates the comparative efficacy of the plant-based preparation ESTAAN and sulfur dioxide (SO2) in inhibiting enzymatic oxidation caused by laccase in the must of botrytized Riesling grapes (Vitis vinifera L.). Our aim was to assess the potential to reduce the added level of SO2 while maintaining technological stability. Laccase activity was evaluated through spectrophotometric analysis. In addition, HPLC was used to determine the acetaldehyde content and the content of selected organic acids, whereas GC-MS was used to analyze geraniol and Fatty Acid Ester. The results demonstrated that ESTAAN significantly reduces laccase activity and limits phenolic oxidation. The combination of ESTAAN and SO2 demonstrated a synergistic effect, allowing for a reduction in the dosage of sulfite. These findings support the use of ESTAAN as a promising alternative or as a supplement with sulfur dioxide.

1. Introduction

Must browning represents a major technological issue in winemaking, particularly when processing grapes infected by the Botrytis cinerea fungus. This is the result of oxidative reactions of phenolic compounds, which cause a deterioration of the visual and sensory quality of the wine, including the loss of aromatic freshness and overall product appeal [1,2]. Must discoloration produces a shift from yellow–brown to dark brown hues, negatively affecting both the aesthetics and palatability of the wine [3].
Oxidative changes can be classified as enzymatic or non-enzymatic, with phenolic substances playing a central role in both cases, as they serve as substrates for oxidative reactions and contribute to the formation of undesirable pigments [4]. Enzymatic browning is caused by polyphenol oxidases, primarily tyrosinase and laccase, with the latter being specific to grapes infected with Botrytis cinerea [5]. These enzymes oxidize phenolic compounds into quinones, which polymerize into melanins that are responsible for the dark coloration and degradation of the sensory properties of the must [5,6].
Sulfur dioxide (SO2) is a key compound used in winemaking for its antimicrobial and antioxidant properties [7]. It effectively inhibits enzymatic oxidation, catalyzed by polyphenol oxidases such as tyrosinase and laccase. The latter is more resistant to SO2 inhibition, which complicates process control [8]. Although SO2 is effective in protecting must and wine, its use is associated with potential health risks, including allergic reactions in sensitive individuals [9]. Therefore, alternative methods are increasingly sought in winemaking to reduce SO2 levels without compromising the stability and quality of the wine.
With rising pressure to limit the use of sulfur dioxide in winemaking, alternative substances with antioxidant and antimicrobial effects are gaining attention. Ascorbic acid and tannins exhibit antioxidant activity; however, their antimicrobial efficacy is limited [10]. Lysozyme is effective against lactic acid bacteria but inactive against yeasts and may raise allergenic concerns [11]. Chitosan shows significant potential due to its broad antimicrobial spectrum, including activity against undesirable non-Saccharomyces yeasts [12]. Glutathione and inactivated yeasts rich in chitosan have also proven effective in preventing enzymatic browning [6,13], whereas the application of Metschnikowia pulcherrima, which actively consumes oxygen, represents a viable bioprotective alternative [2,6]. In practice, these agents are often combined to achieve synergistic effects [10].
Another alternative is the ESTAAN preparation, developed in 2015 by the Dutch company Biolethics Europe. It is a plant-based alternative to sulfur dioxide with comparable antioxidant and antimicrobial properties [14]. It is a tannin complex derived from extracts of ten botanical species: Rosmarinus officinalis, Vaccinium myrtillus, Morus alba, Melissa officinalis, Ananas comosus, Mangifera indica, Punica granatum, Prunus domestica, Lycium chinense fructus, and Ruta graveolens [15].

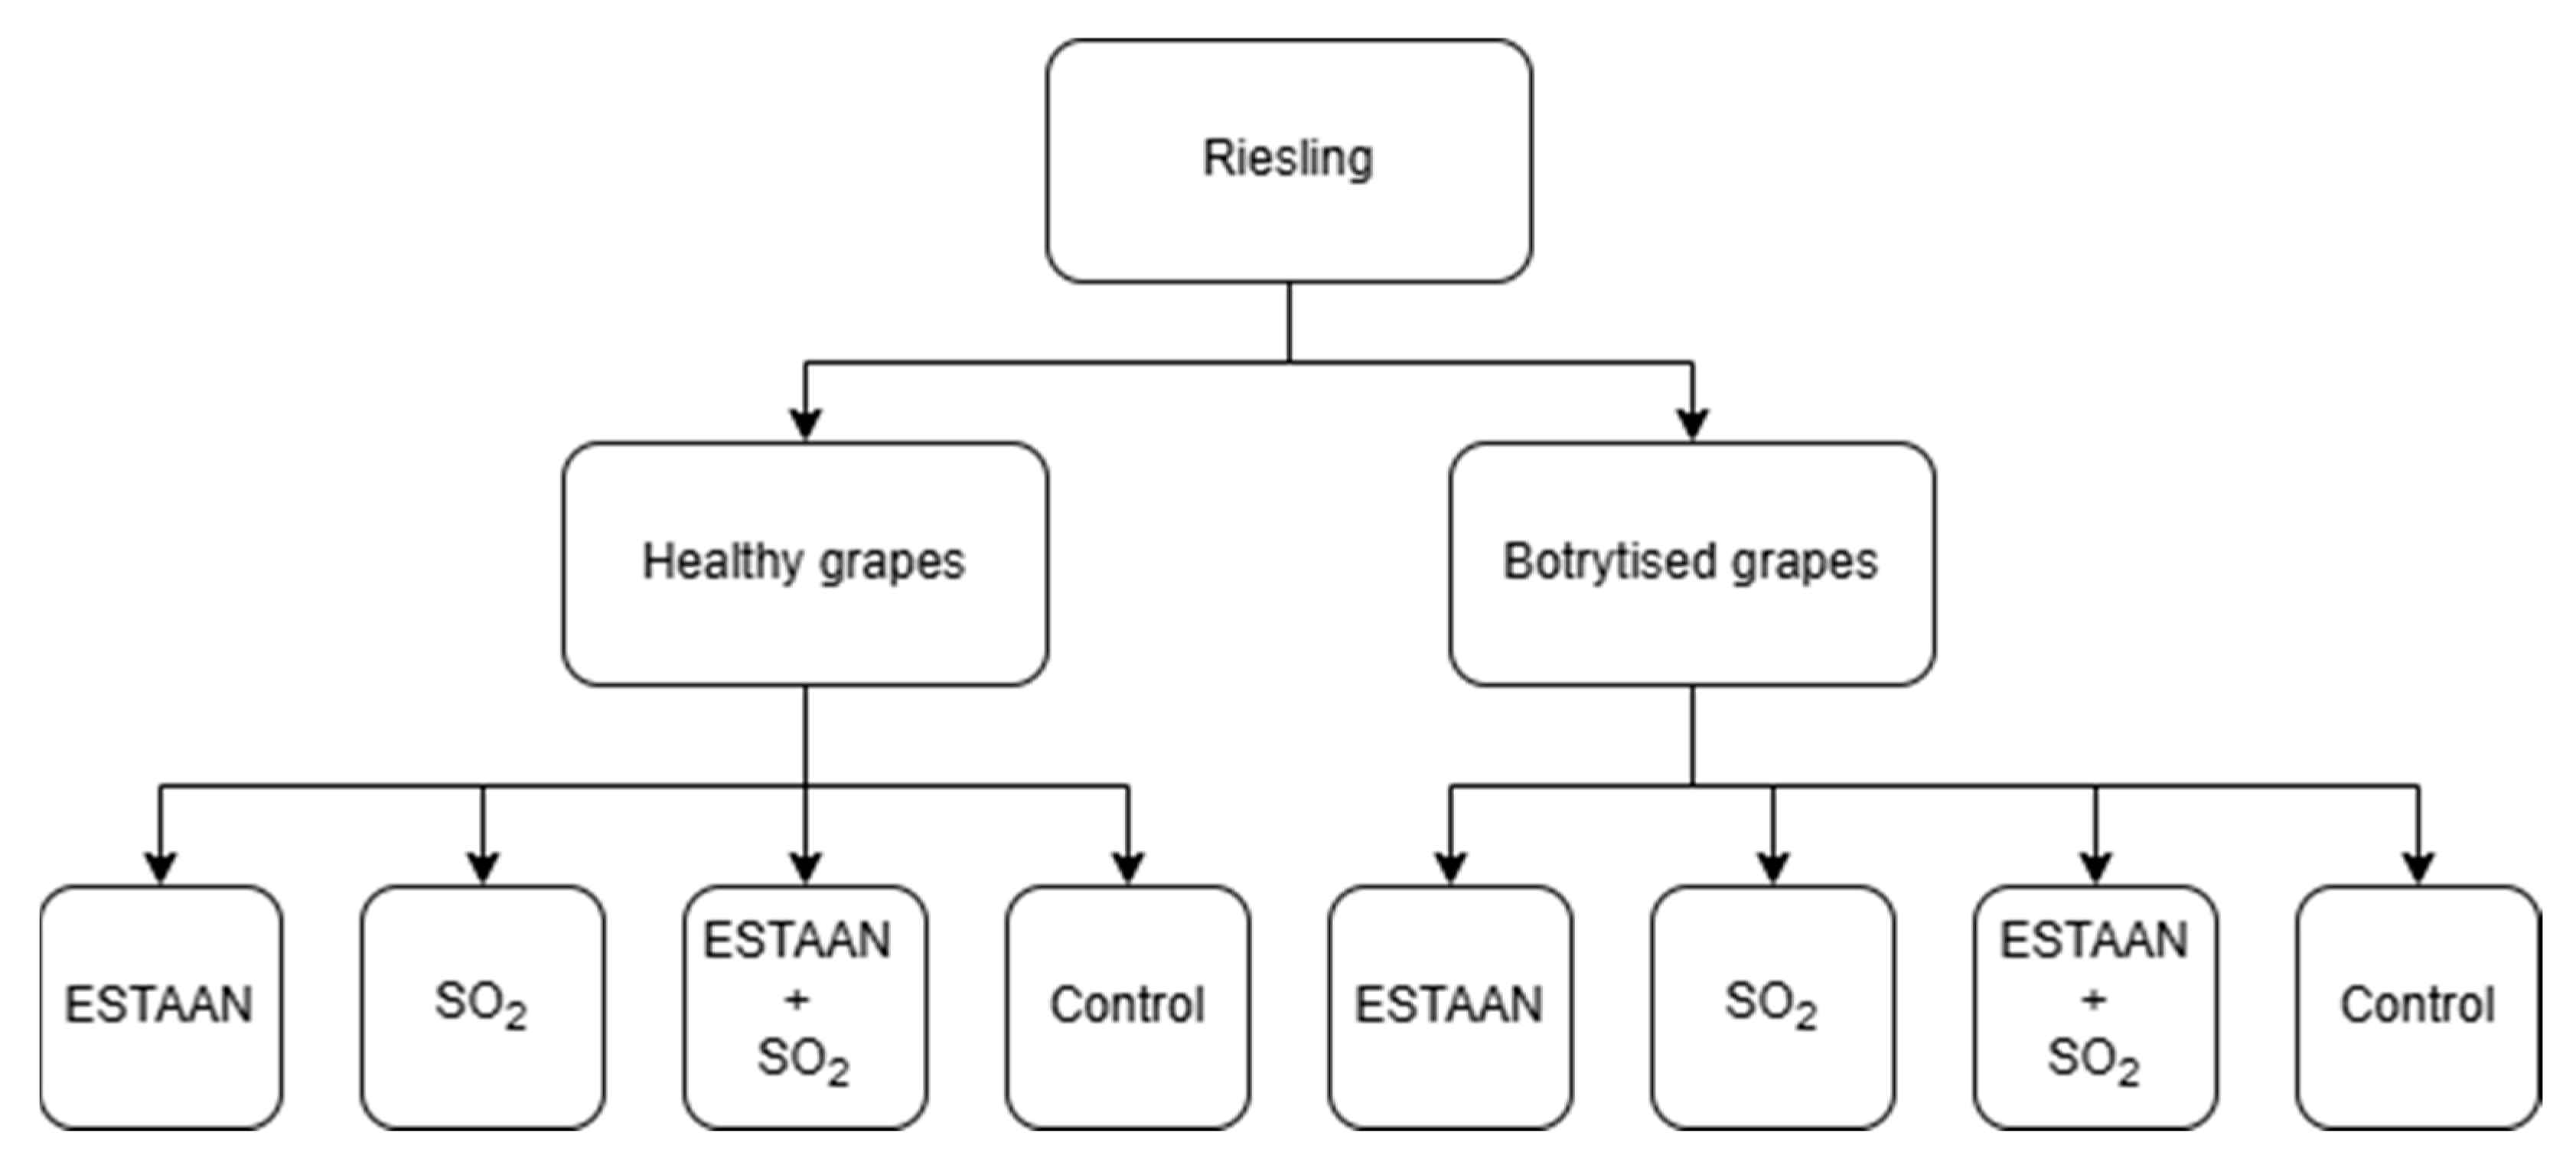
2. Materials and Methods

The experiment was conducted under real winery conditions to mimic standard practice. The vineyard is located in the Czech Republic, in the municipality of Novosedly. It lies at an altitude of 200–210 m above sea level on a south-facing slope. The vineyard is managed using conventional agricultural practices. The soil is loamy, which provides suitable conditions for grapevine cultivation. Riesling is the grape variety grown at this site.
Two variants of Riesling grapes were used, one healthy and the other naturally infected by Botrytis cinerea. They were processed separately, and the resulting musts were divided and treated in four ways: with sulfur dioxide, with ESTAAN, with a combination of both, and untreated (control), as shown in Scheme 1. Each treatment was performed in triplicate, resulting in eight experimental groups:
  • Variant (1) Healthy grapes: (1a) 2 mL·L−1 ESTAAN; (1b) 40 mg·L−1 SO2; (1c) 1 mL·L−1 ESTAAN + 20 mg·L−1 SO2; (1d) CONTROL (no additives), all in triplicate.
  • Variant (2) Infected grapes: (2a) 2 mL·L-1 ESTAAN; (2b) 40 mg·L−1 SO2; (2c) 1 mL·L−1 ESTAAN + 20 mg·L−1 SO2; (2d) CONTROL (no additives), all in triplicate.
After 24 h from the inclusion of the additive, the must was gently racked off as coarse lees and transferred to clean fermentation vessels. Fermentation was carried out using a neutral Saccharomyces cerevisiae strain to ensure the authentic interpretation of the impact of the raw material without interference from specific aromatic metabolites.
Alcoholic fermentation lasted 10–14 days and was regularly monitored. After completion, the wines were racked off as yeast lees and stabilized with 40 mg·L−1 of free SO2 to protect against oxidation and microbial contamination. They were then left to mature for three months, with regular sensory supervision, after which the wines were prepared for final sensory evaluation to assess the impact of each treatment on their organoleptic properties.

2.1. Determination of Glucose, Fructose, and Organic Acids by HPLC

The concentrations of glucose, fructose, organic acids, and glycerol were determined using high-performance liquid chromatography (HPLC) with isocratic elution. The samples were centrifuged (3000× g for 6 min) and then diluted tenfold with demineralized water. A 20 μL aliquot of the diluted sample was manually injected. Separation was performed on a Watrex Polymer IEX H (Watrex Praha, Prag, Czech Republic) form column (250 × 8 mm, 10 μm) with a guard column (10 × 8 mm), using 4.5 mM sulfuric acid as the mobile phase. The flow rate was 0.75 mL·min−1 at 60 °C. Carbohydrates were detected at 190 nm, and organic acids at 210 nm.
The analysis was performed using a Shimadzu LC-10A binary high-pressure chromatography system with two LC-10ADvp pumps, an SPD-M10Avp DAD detector, CTO-10ACvp column oven, and an SCL-10Avp controller (Shimadzu, Kyoto, Japan). The data were processed using the LCsolution software, version 1.25 SP2. Quantification was based on external calibration.

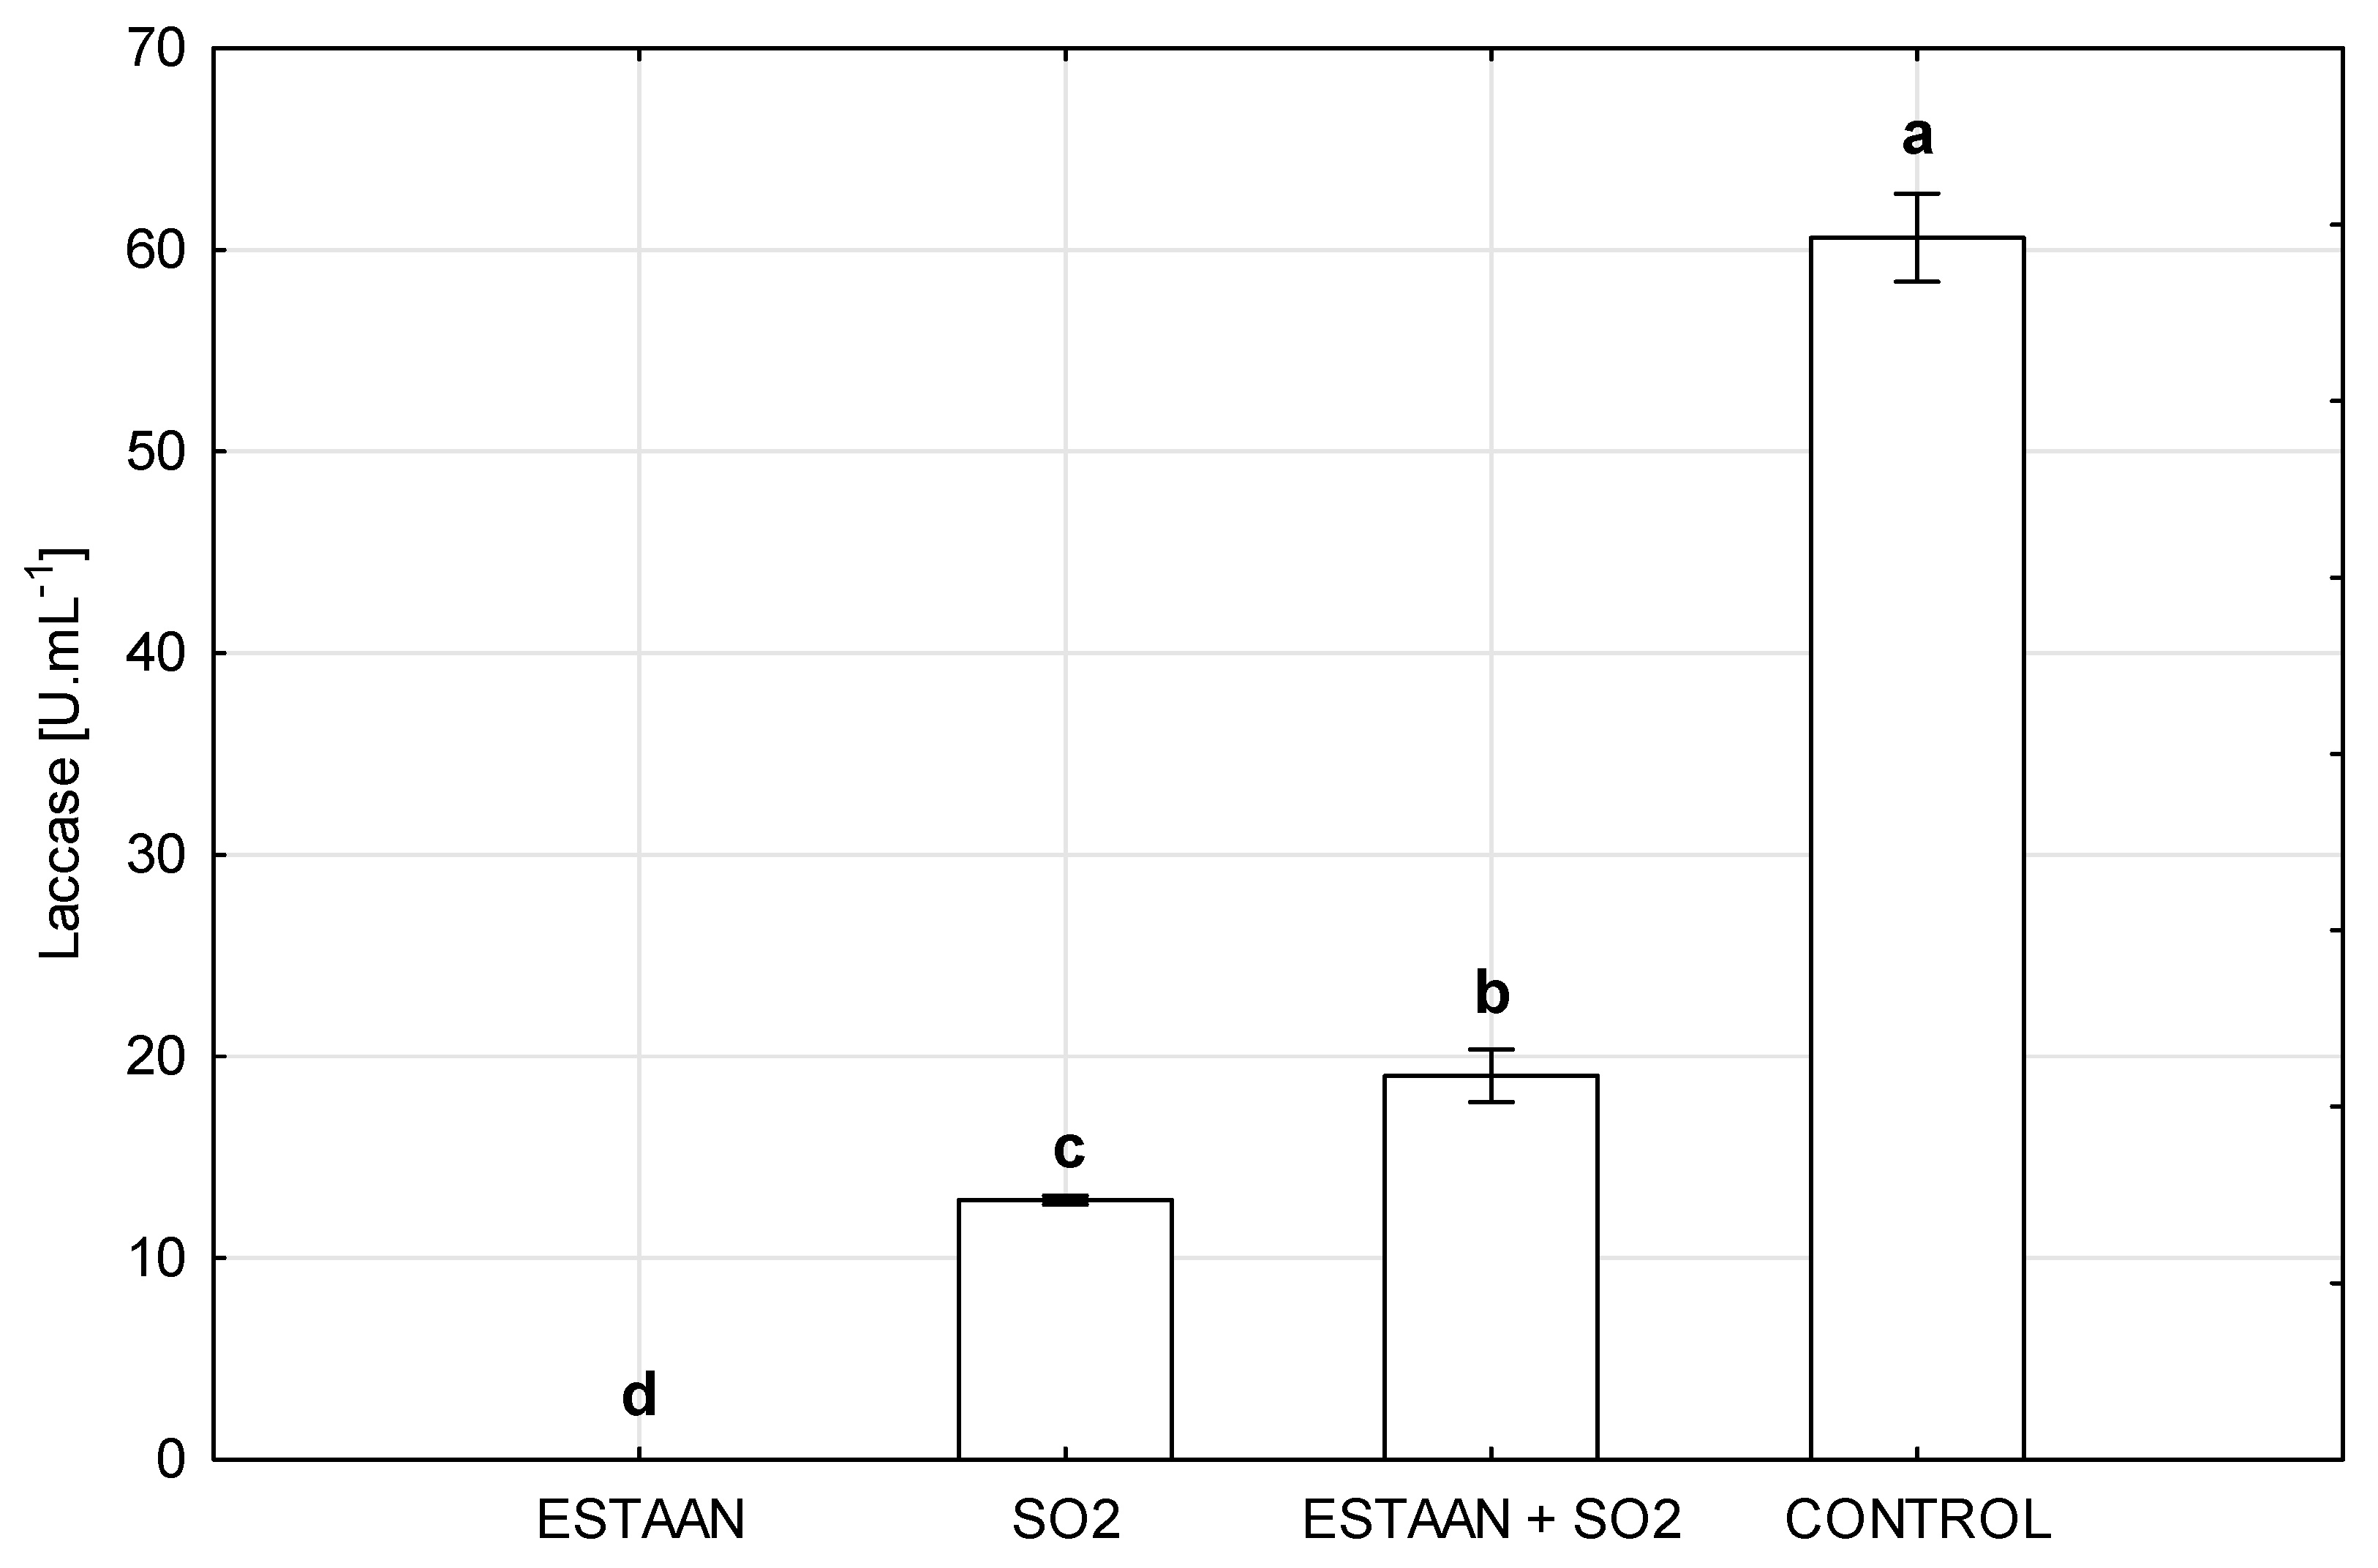
2.2. Determination of Laccase Activity

Laccase activity was determined with spectrophotometry, using syringaldazine (SGZ, 4-hydroxy-3,5-dimethoxybenzaldehyde-azine) as the substrate. In the catalytic reaction, laccase oxidizes syringaldazine to a colored product measurable at 530 nm [16].
For analysis, 466 μL of acetate buffer (200 mM, pH 5.0) was pipetted into a 1.5 mL Eppendorf tube, followed by 200 μL of syringaldazine solution (0.1 mM in ethanol) and 333 μL of the must sample. The mixture was mixed and incubated at 20 °C for 8 min.
Absorbance was measured at 530 nm against a blank. Enzymatic activity was expressed as the change in absorbance per minute (ΔA/min), converted to enzyme units (U/mL), where 1 U is the amount of enzyme required to oxidize 1 μmol of syringaldazine per minute, using a molar absorption coefficient of 6500 M−1·cm−1 [17].

2.3. Determination of Total Phenolic Compounds

The total phenolic content was determined using a modified Folin–Ciocalteu method. For analysis, 980 μL of 3% sodium carbonate decahydrate solution was pipetted into a 1.5 mL Eppendorf tube, followed by 20 μL of the wine/must sample and 50 μL of the Folin–Ciocalteu reagent. The mixture was thoroughly mixed and incubated in the dark at room temperature for 120 min [18].
Absorbance was measured at 750 nm against a blank. The phenolic concentration was calculated from a calibration curve constructed with gallic acid standards (range: 25–1000 mg·L−1) and expressed as mg/L gallic acid equivalents [18].

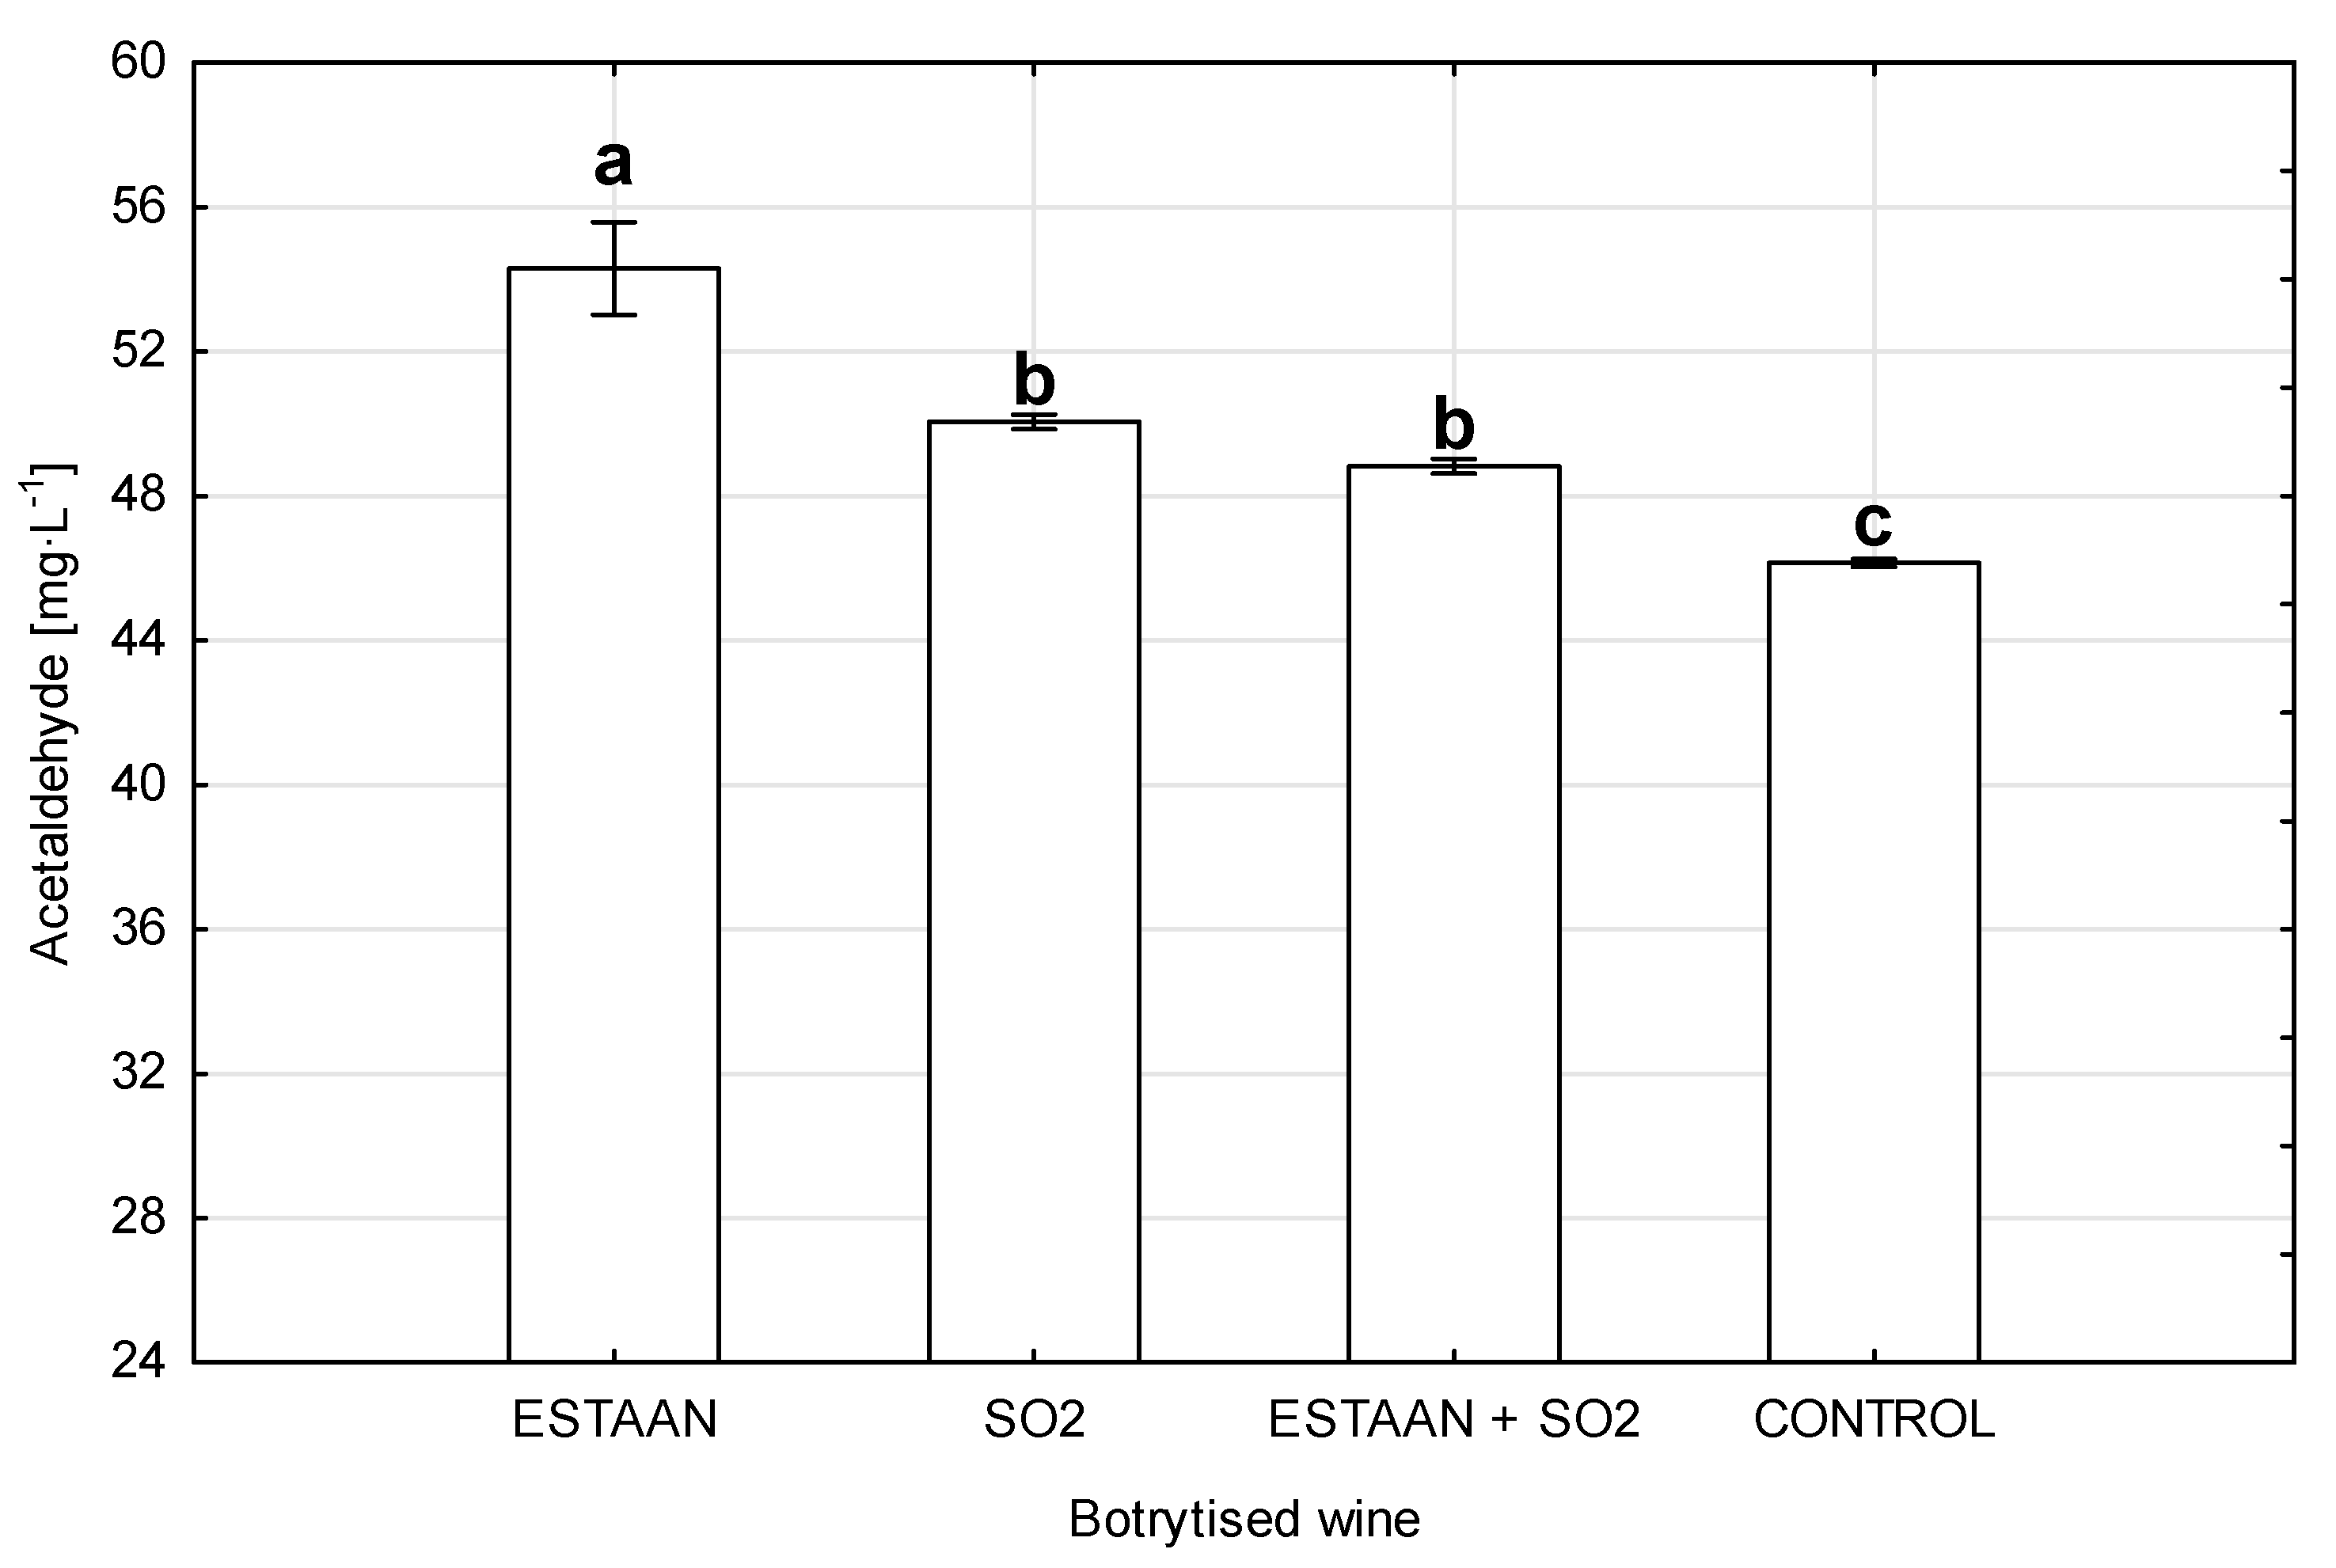
2.4. Determination of Acetaldehyde by HPLC

Carbonyl compounds were analyzed following derivatization with dinitrophenylhydrazine (DNPH). A volume of 20 μL of 2 M NaOH containing 10 mM Idranal was added to 50 μL of the wine/must sample, which was then incubated for 7 min. A volume of 120 μL of 20 mM DNPH in acetonitrile with 1 M H2SO4 was then added. After a 2-min reaction, 1010 μL of 20% acetonitrile was added, and 20 μL was injected into the HPLC system.
Analysis was conducted using a Shimadzu LC-10A chromatography system with an SPD-M10Avp DAD detector and LCsolution software. Separation was performed on a MN Nucleoshell RP 18 column (100 × 3 mm, 2.7 μm) with a guard column using mobile phase A (15 mM HClO4) and B (15 mM, 80% ACN) at 1.0 mL·min−1 and 60 °C. Gradient elution began at 25% B, was increased to 100% B over 6 min, and then returned. Acetaldehyde, pyruvate, 2-oxoglutarate, diacetyl, and acetoin were detected.

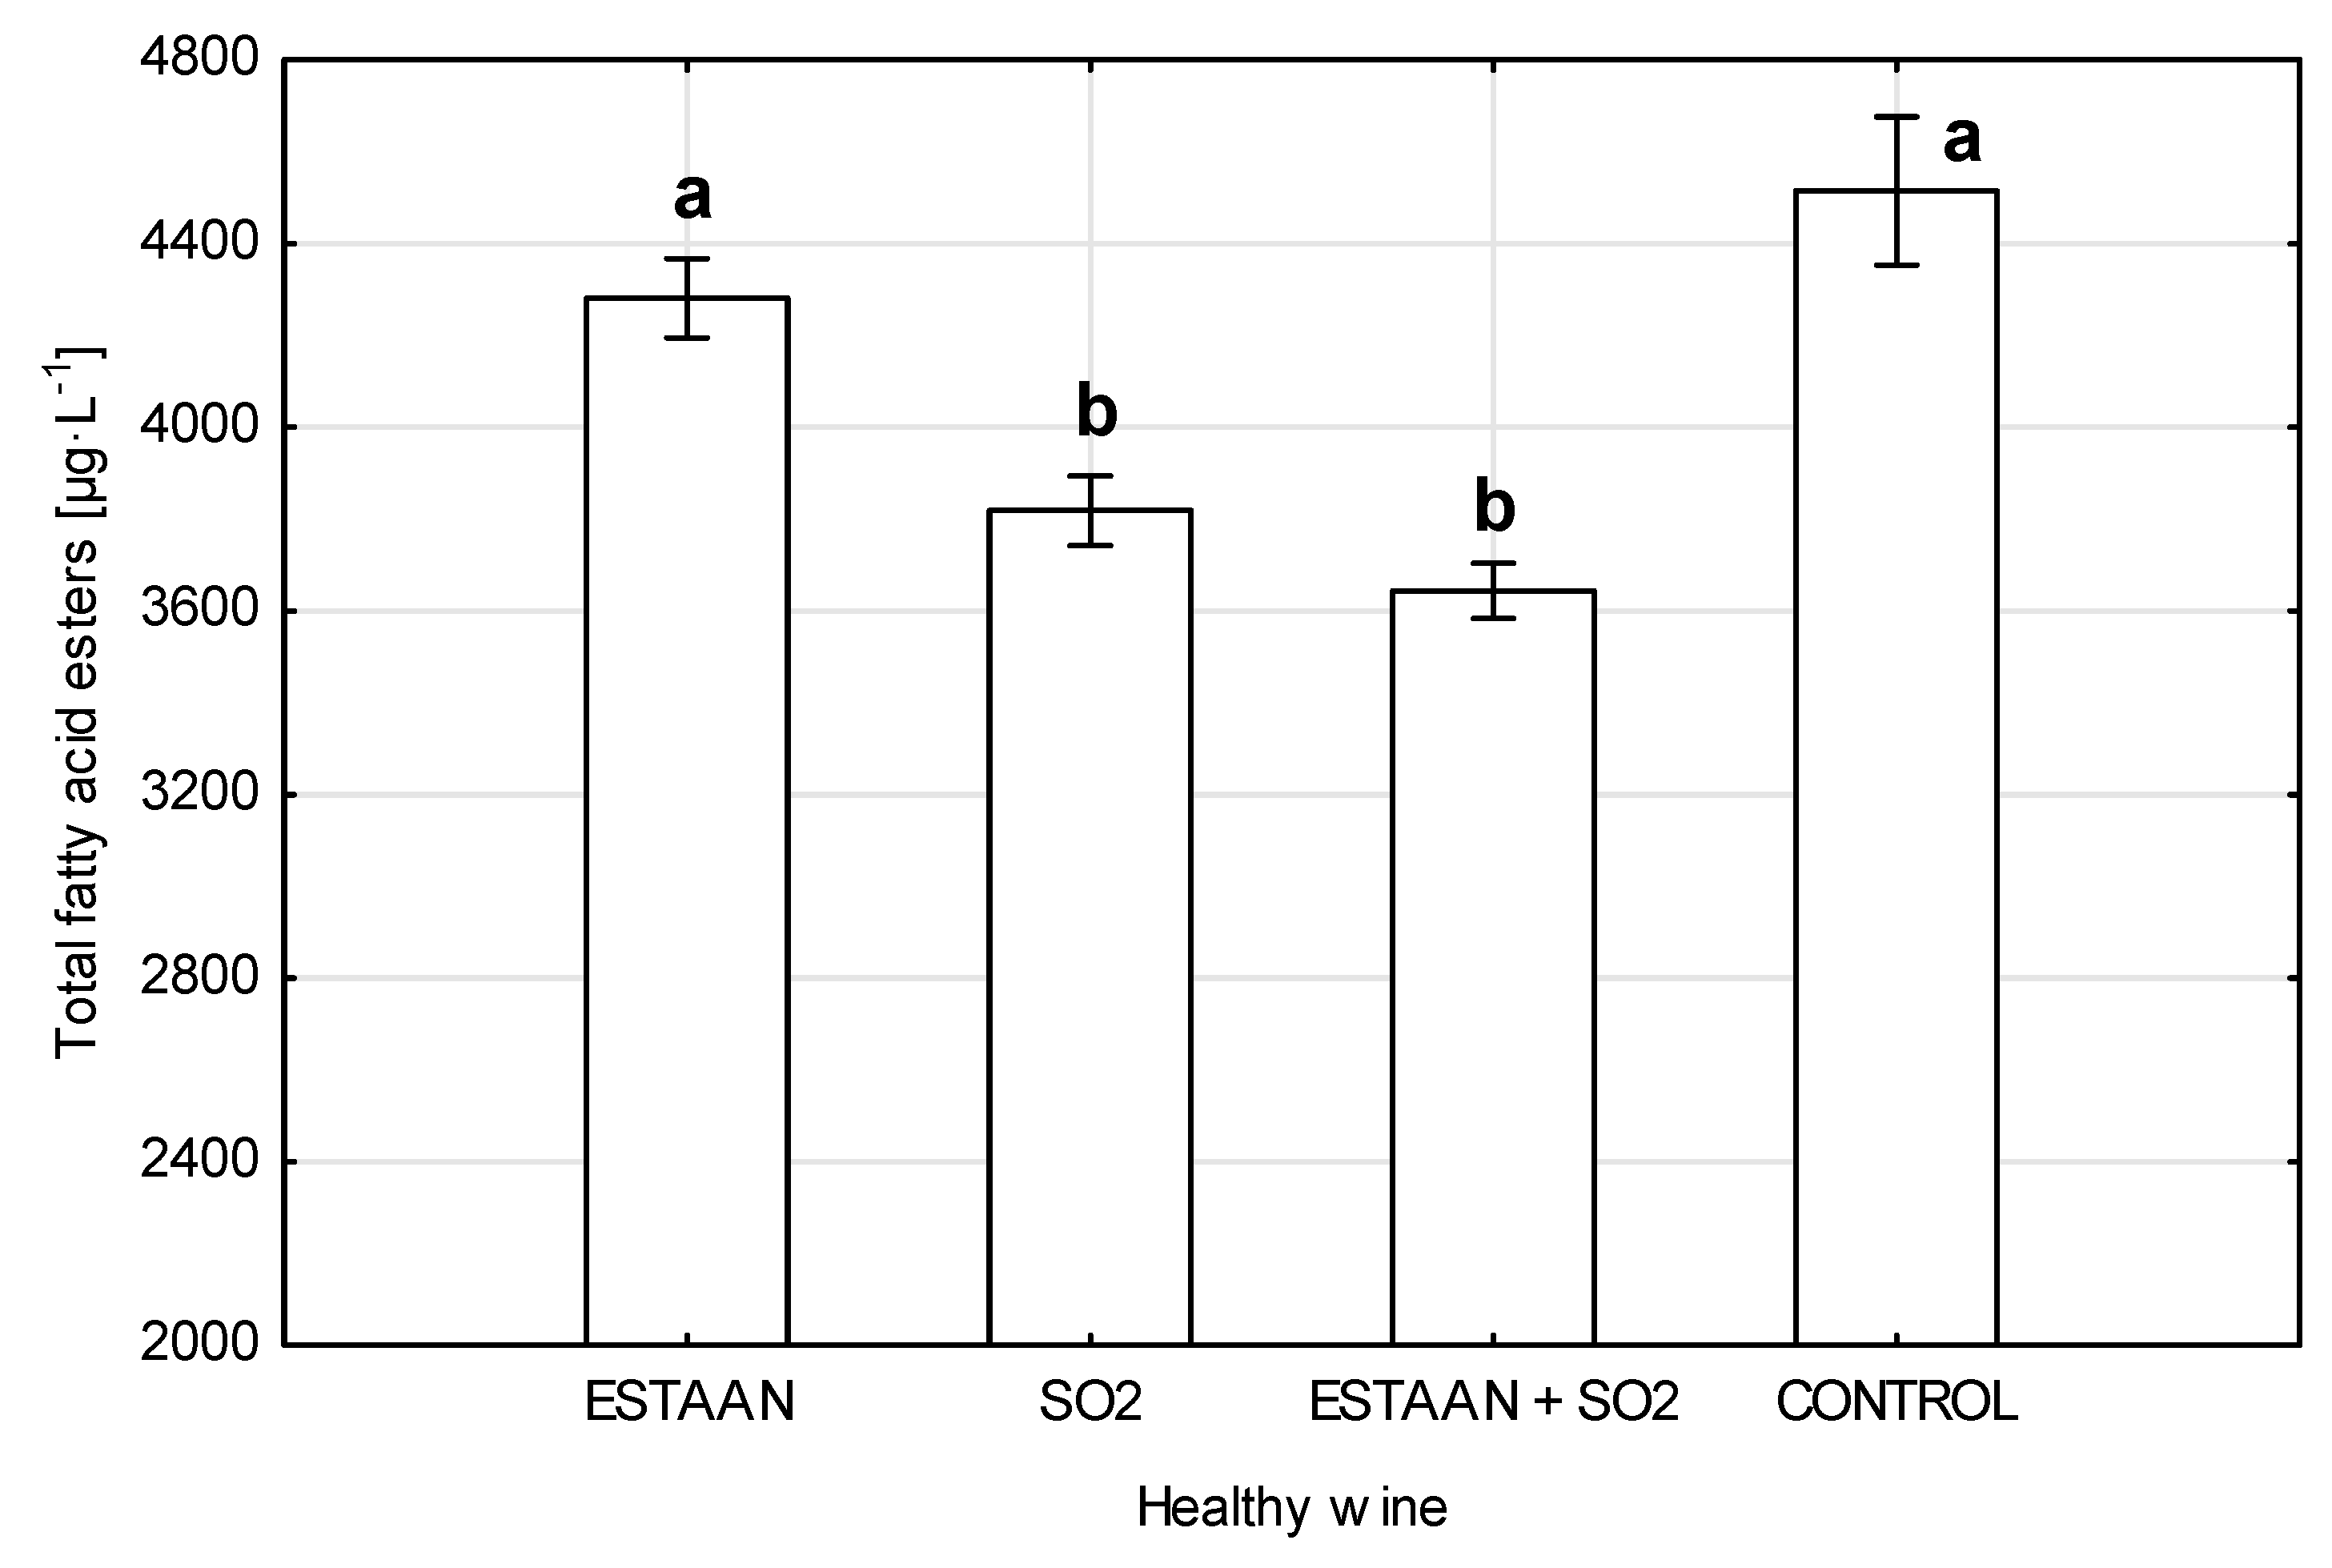
2.5. Determination of Geraniol and Fatty Acid Esters by GC-MS

Geraniol and Fatty acid esters were analyzed using gas chromatography mass spectrometry (GC-MS) after liquid–liquid extraction using methyl-tert-butyl ether (MTBE) containing 10% hexane. Internal standard 2-nonanol (400 mg·L−1) was added to 20 mL of the wine/must sample, along with 5 mL of saturated ammonium sulfate solution. After mixing and phase separation, the extract was dried over anhydrous magnesium sulfate and analyzed. Separation was performed on a DB-WAX column (30 m × 0.25 mm, 0.25 μm), with a polyethylene glycol stationary phase. Helium was used as the carrier gas at 1 mL·min−1. The temperature program started at 45 °C and increased linearly to 250 °C, where it was held for 6.5 min. Detection took place in SCAN mode (14–264 m/z), with a 0.25 s data collection interval. Compounds were identified by comparing spectra and retention times with the NIST 107 database. Analysis was performed using a Shimadzu GC-17A chromatography system with an AOC-5000 autosampler and QP-5050A quadrupole detector, and the data were processed using GCsolution software (version 1.20).

2.6. Determination of Total Sulfur Dioxide Content (Iodometric Titration)

A 25 mL aliquot of 1 mol/L NaOH solution was pipetted into a stoppered Erlenmeyer flask, followed by layering with 50 mL of the wine/must sample. After mixing and allowing it to stand at room temperature for 15 min, 15 mL of 20% sulfuric acid and 5 mL of starch indicator were added. The solution was titrated with standard sodium thiosulfate until a stable blue color indicated the presence of free iodine.

2.7. Sensory Analysis

A single sensory evaluation was conducted by an eight-member expert panel from the Institute of Viticulture and Enology. The evaluation included eight Riesling wine samples (Vitis vinifera L.), including four variants from healthy grapes and four from botrytized grapes (Botrytis cinerea). The samples were presented anonymously, in a random order and at a controlled temperature, in standard ISO tasting glasses. The overall sensory assessment used the 100-point OIV scale, covering appearance, aroma, taste, and overall impression [19]. The aromatic profile was also evaluated using two descriptive sets: (i) the varietal markers for Riesling and (ii) the aromatic components associated with botrytization [20]. The panelists rated the intensity of the aromas (e.g., peach, candied fruit, mushrooms, and petroleum) on a numerical scale of 1–10. The data was recorded on pre-prepared printed evaluation sheets. The post-analysis included calculation of the average scores and visualization of the differences in aromatic expression using radar charts.

2.8. Statistical Evaluation

The statistical analysis was conducted using TIBCO Statistica software (version 14.0.0.15) and Microsoft Excel. One-way analysis of variance (ANOVA) followed by a Least Significant Difference (LSD) test was used to determine the statistically significant differences between variants. Weighted averages and standard deviations were calculated. The results of the chemical analyses were illustrated on bar graphs, including standard deviation markers. Excel was used to create summary tables and to produce a visualization of the sensory data using radar charts.

3. Results

This section presents the results of the analytical and sensory measurements performed on the Riesling musts and wines, obtained from the healthy and botrytized grapes. For the must, basic analytical parameters, laccase activity, and total phenolic content were evaluated. For the final wine, sensory analysis and the determination of selected aromatic compounds and acetaldehyde levels were performed.
The values presented in Table 1 were analyzed in must samples before the addition of the treatments. Laccase activity and total polyphenol content were analyzed 24 h after the treatments were applied. Acetaldehyde, geraniol, and fatty acid esters were analyzed after the completion of alcoholic fermentation. Total sulfur dioxide and sensory analysis were measured three months after the end of alcoholic fermentation.
Statistical analysis of the chemical data was conducted using Statistica (version 14.0.0.15), whereas the sensory evaluation results were processed using Microsoft Excel.

3.1. Activity of Laccase in Botrytized Must

Figure 1 shows the laccase activity (in U·mL−1) in musts from botrytized grapes following the application of various additives. One-way ANOVA (p = 0.000000) confirmed there were highly significant differences between the treatments. The lowest laccase activity was observed in the ESTAAN-treated variant (0 U·mL−1), which significantly differed from all the other variants. Higher activity was found in the SO2 variant (12.9 U·mL−1) and the combination of ESTAAN + SO2 (19.0 U·mL−1), whereas the highest value was measured in the control group (60.6 U·mL−1). These results confirm the strong inhibitory effect of ESTAAN on laccase activity induced by Botrytis cinerea.

3.2. Total Polyphenol Content in Musts from Healthy and Botrytized Grapes

Figure 2 shows the total phenolic content (mg·L−1) in must from healthy grapes treated with different additives. The statistical analysis revealed highly significant differences between the variants (ANOVA, p = 0.000001). The highest phenolic content was observed in the ESTAAN + SO2 variant (428.8 mg·L−1), followed by ESTAAN alone (415.0 mg·L−1). Both were significantly different from the control (389.0 mg·L−1) and SO2 alone (373.5 mg·L−1). This data suggests that ESTAAN, both alone and in combination with SO2, contributes to better stabilization of phenolic compounds compared to SO2 alone or the untreated control.
Figure 3 illustrates the total phenolic content (mg·L−1) in must from botrytized grapes after various treatments. Significant differences (ANOVA, p = 0.000509) were found, with the highest concentration in the ESTAAN-treated variant (536.8 mg·L−1), which significantly differed from all the other groups. The SO2 (457.1 mg·L−1) and ESTAAN + SO2 (453.5 mg·L−1) variants showed lower values, with the untreated control showing the lowest (414.9 mg·L−1). This confirms ESTAAN has a pronounced protective effect against oxidative losses of phenolic compounds in Botrytis-infected must.

3.3. Acetaldehyde Content in Wines from Healthy and Botrytized Grapes

Figure 4 shows the acetaldehyde concentrations (mg·L−1) in the wines from healthy grapes after the use of different additives. One-way ANOVA (p = 0.000000) confirmed that there were significant differences. The highest level was found in the ESTAAN + SO2 variant (38.4 mg·L−1), which differed from all the other treatments. The lowest value was found in the SO2-only variant (25.4 mg·L−1), followed by ESTAAN (29.0 mg·L−1) and the control (29.7 mg·L−1), which were also statistically distinct. These results suggest increased acetaldehyde formation occurs with the combined ESTAAN and SO2 treatment.
Figure 5 displays the acetaldehyde content (mg·L−1) of the wines from botrytized grapes. ANOVA (p = 0.000166) showed the highest level in the ESTAAN variant (54.3 mg·L−1), which significantly differed from the other treatments. SO2 (50.1 mg·L−1) and ESTAAN + SO2 (48.8 mg·L−1) produced similar values, whereas the lowest was found in the control (46.1 mg·L−1). These results suggest there is elevated acetaldehyde formation in response to the use of ESTAAN with Botrytis-infected grapes.

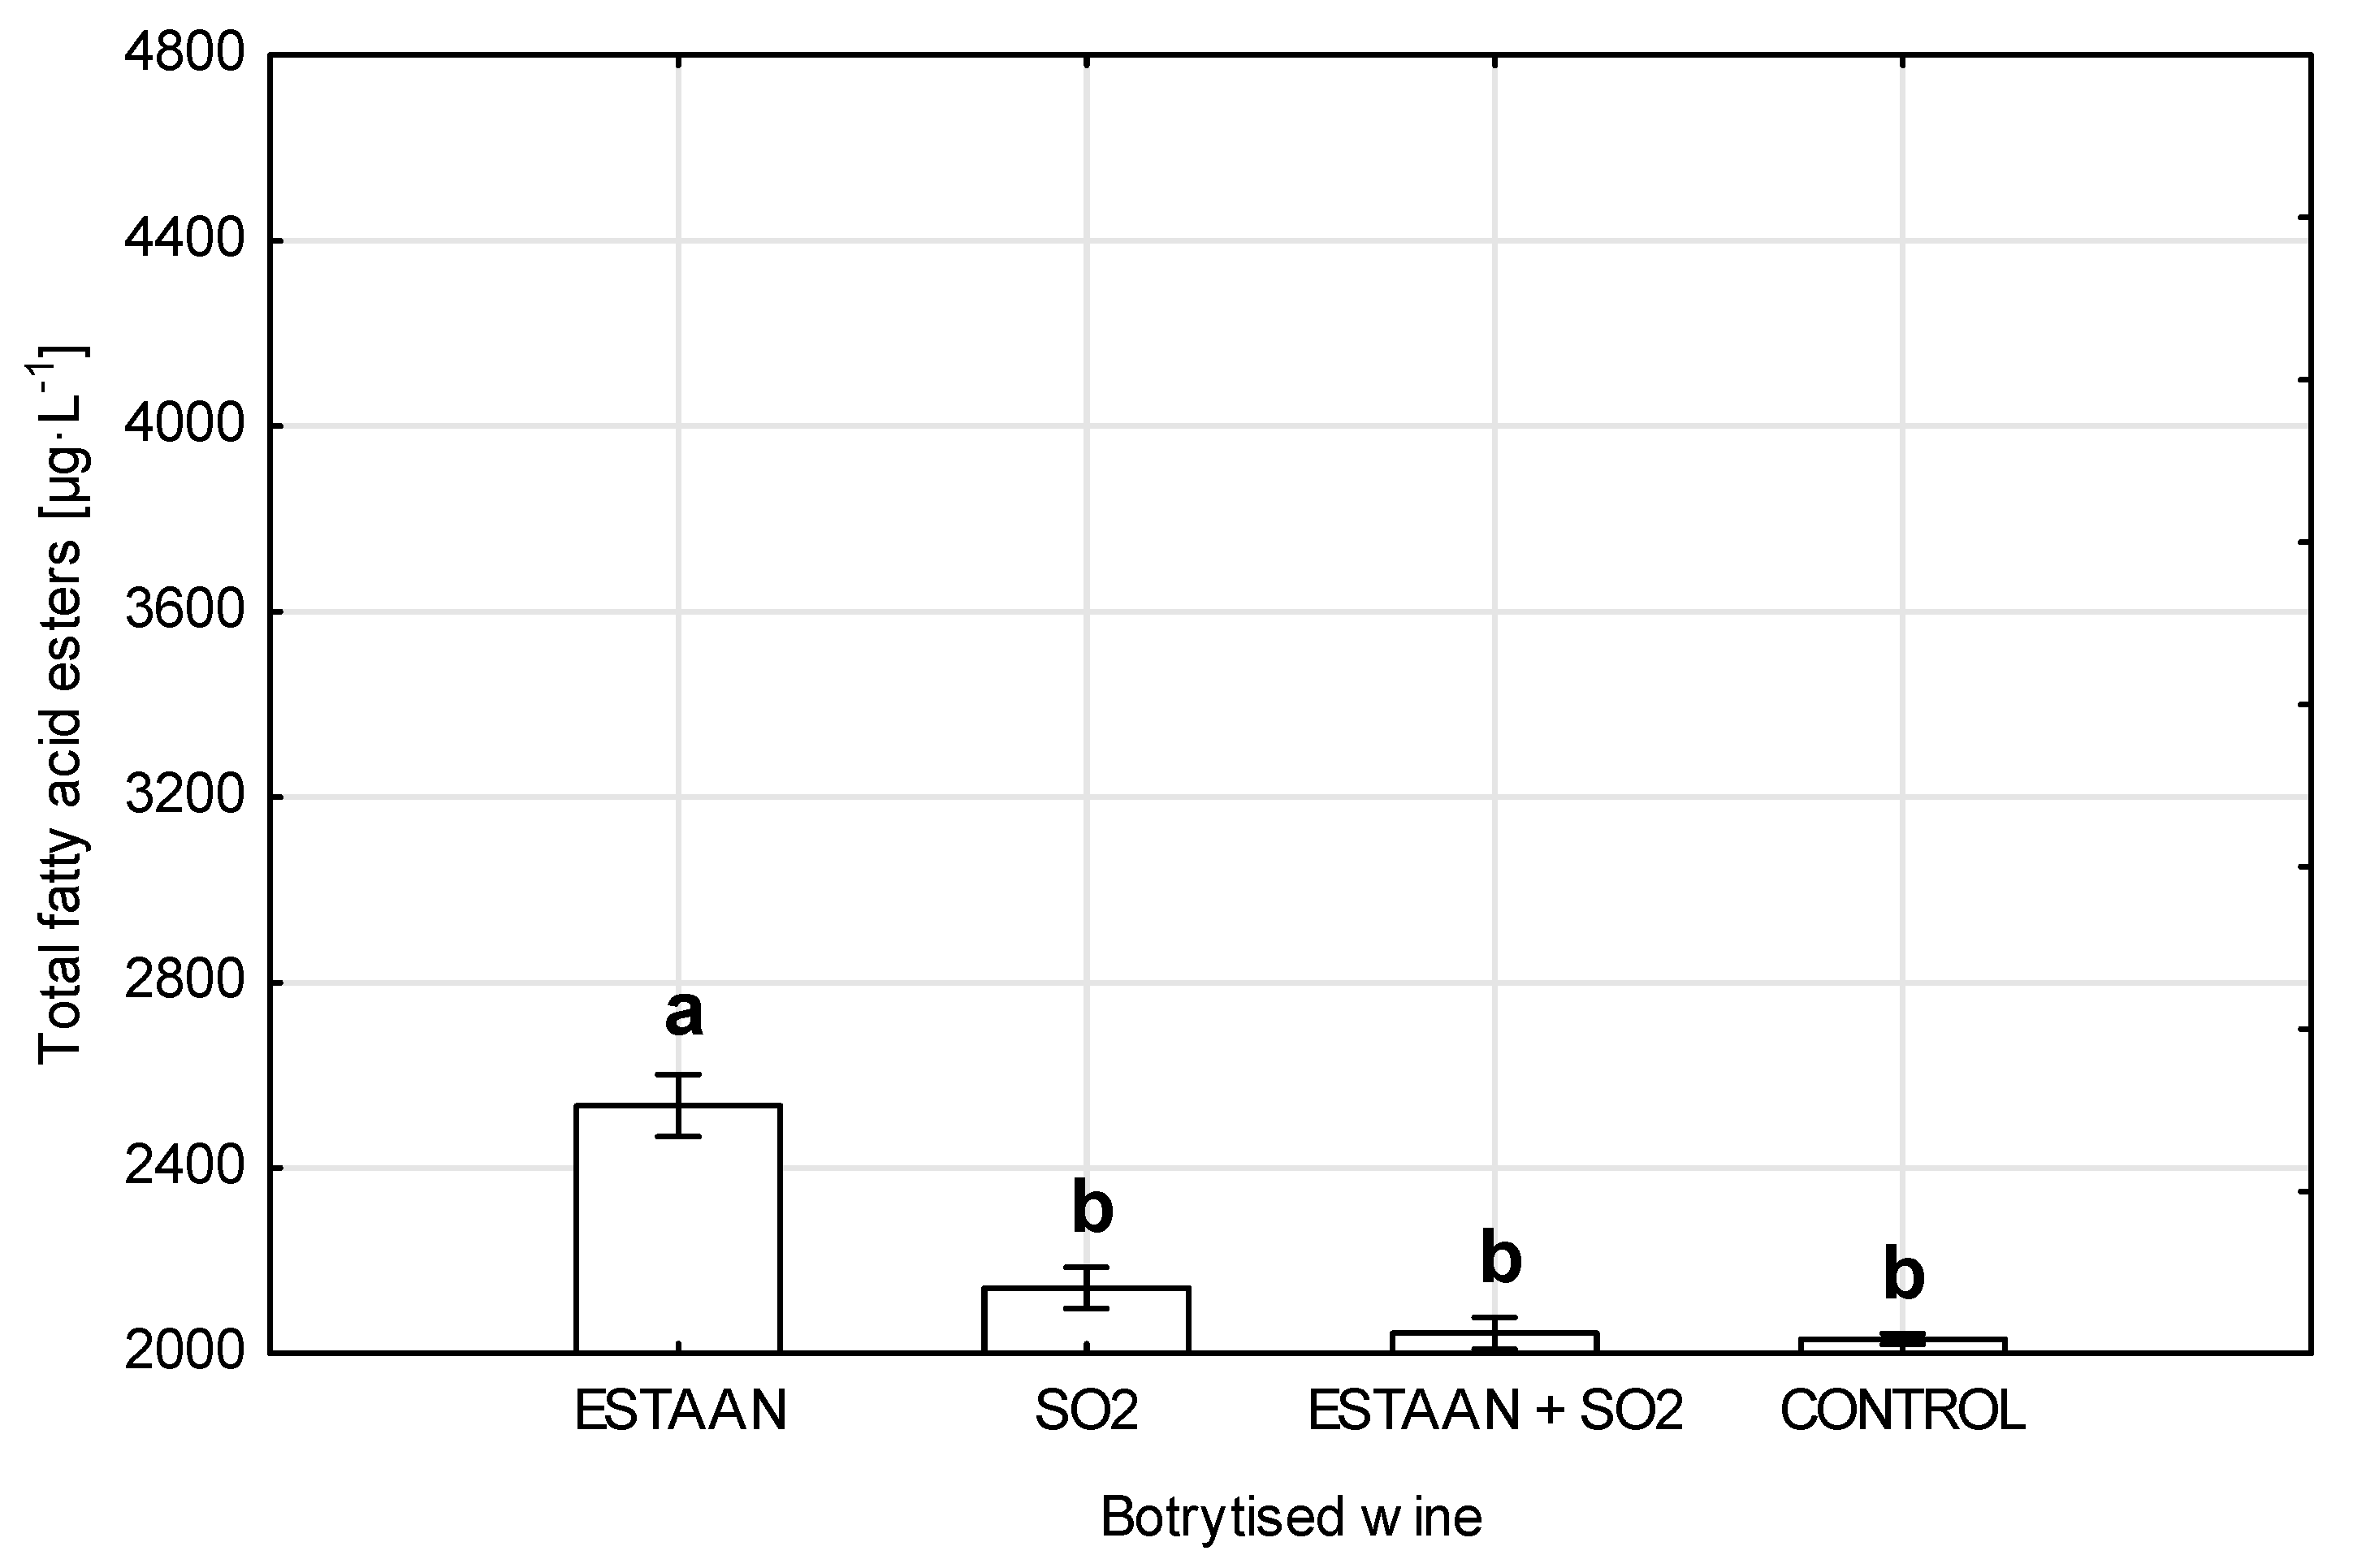
3.4. Fatty Acid Ester Content in Wine from Healthy and Botrytized Grapes

Fatty acid esters are volatile aromatic compounds formed during alcoholic fermentation through reactions between fatty acids and alcohols. Ethyl esters of medium-chain fatty acids, such as ethyl hexanoate, ethyl octanoate, and ethyl decanoate, are major contributors to fruity and floral notes [21].
Figure 6 presents the concentrations of fatty acid esters (μg·L−1) in wines made from healthy grapes. ANOVA (p = 0.001153) showed the highest levels in the control (4514 μg ·L−1) and ESTAAN (4281 μg·L−1) variants, with no significant difference between them. In contrast, the SO2 (3819 μg·L−1) and ESTAAN + SO2 (3644 μg·L−1) variants had significantly lower levels, indicating that SO2 may reduce the ester content, whereas ESTAAN maintains them at higher levels.
Figure 7 shows the ester concentrations (μg·L−1) in the wines from botrytized grapes. ANOVA (p = 0.000123) showed that ESTAAN (2535 μg·L−1) exhibited the highest level, significantly higher than SO2 (2142 μg·L−1), ESTAAN + SO2 (2044 μg·L−1), and the control (2032 μg·L−1), all of which were statistically comparable. These results confirm the positive effect of ESTAAN on the preservation of esters, even under pressure from Botrytis.

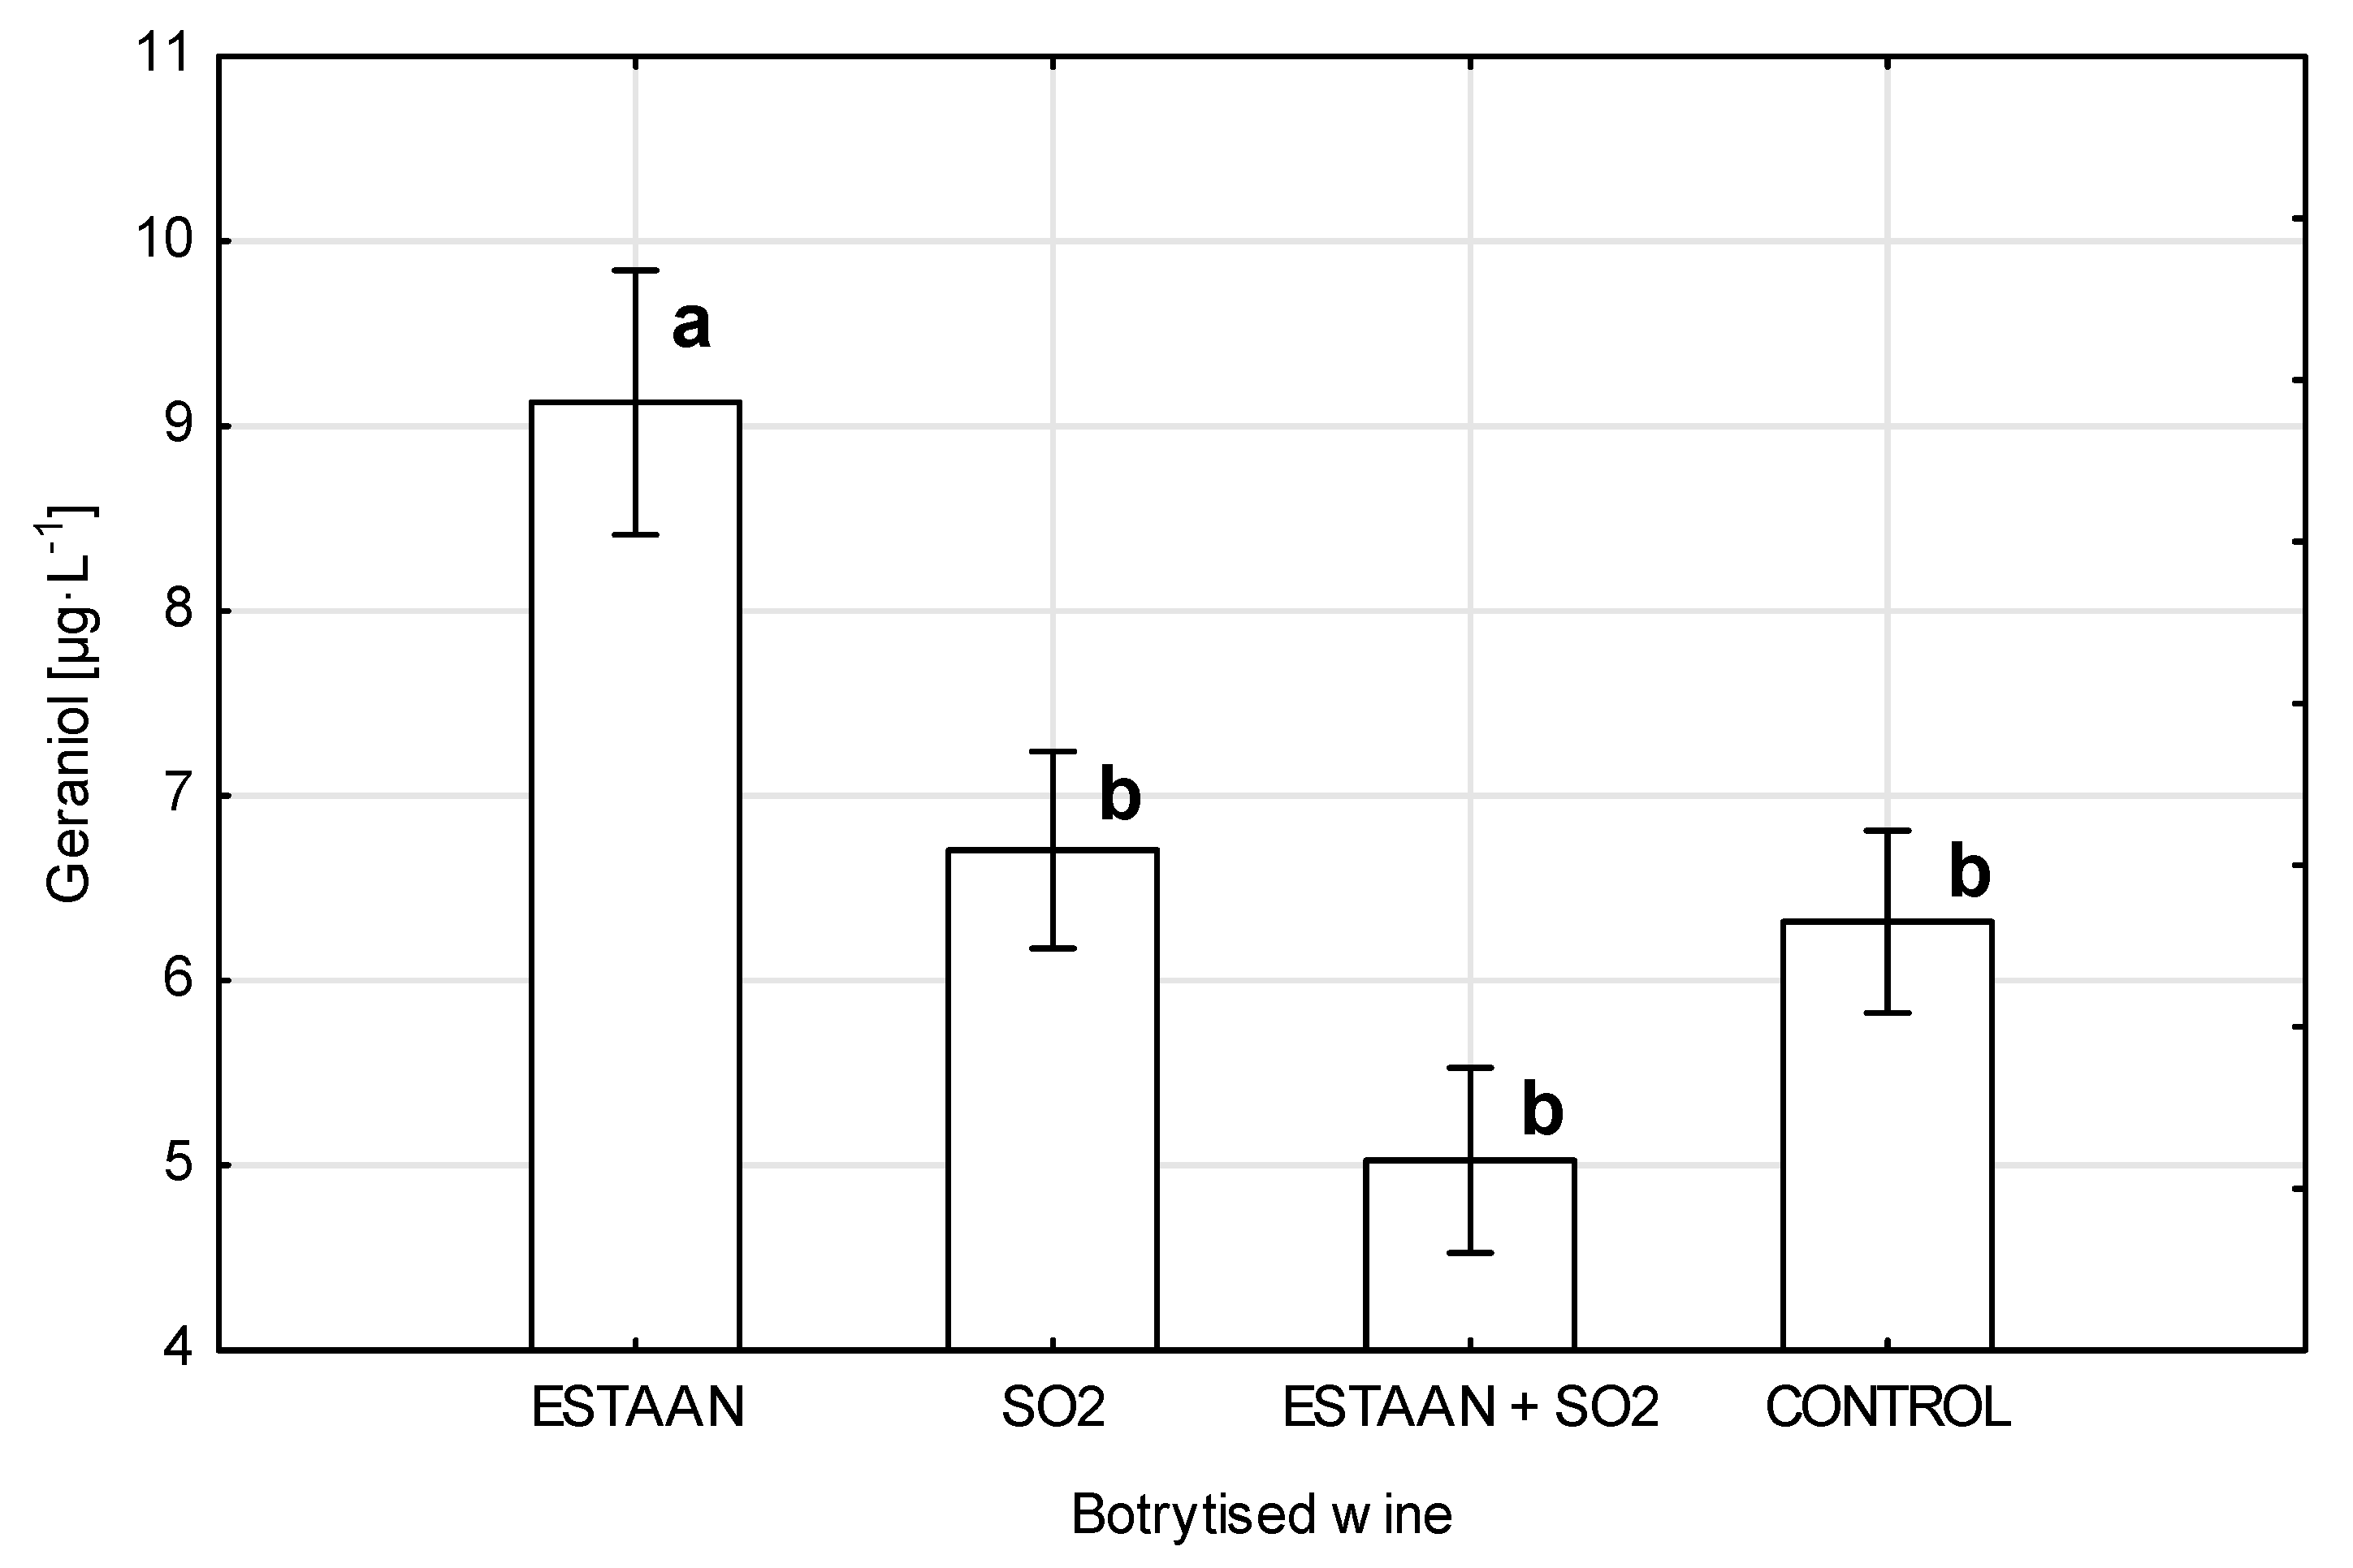
3.5. Geraniol Content in Wine from Healthy and Botrytized Grapes

Geraniol (3,7-dimethylocta-trans-2,6-dien-1-ol) is an acyclic monoterpene with a floral and citrus aroma, primarily bound in grapes as glycosides and released during winemaking [22,23,24,25].
Figure 8 shows the geraniol concentrations (μg·L−1) in wines from healthy grapes. ANOVA (p = 0.003542) found the highest values in the ESTAAN (9.5 μg·L−1) variant, significantly higher than the SO2 (7.9 μg·L−1) and control (6.7 μg·L−1) variants. The ESTAAN + SO2 (8.4 μg·L−1) variant was similar to ESTAAN but differed from the SO2 and control variants. These results confirm the ability of ESTAAN to preserve terpenes, such as geraniol.
Figure 9 presents the geraniol levels of the wines from botrytized grapes. ANOVA (p = 0.005889) showed that the ESTAAN (9.1 μg·L−1) variant was the highest, significantly exceeding that of the SO2 (6.7 μg·L−1), ESTAAN + SO2 (5.0 μg·L−1), and control (6.3 μg·L−1) variants, which showed no significant differences between them. This underscores ESTAAN’s protective effect on terpenes, even under pressure from a fungal infection.

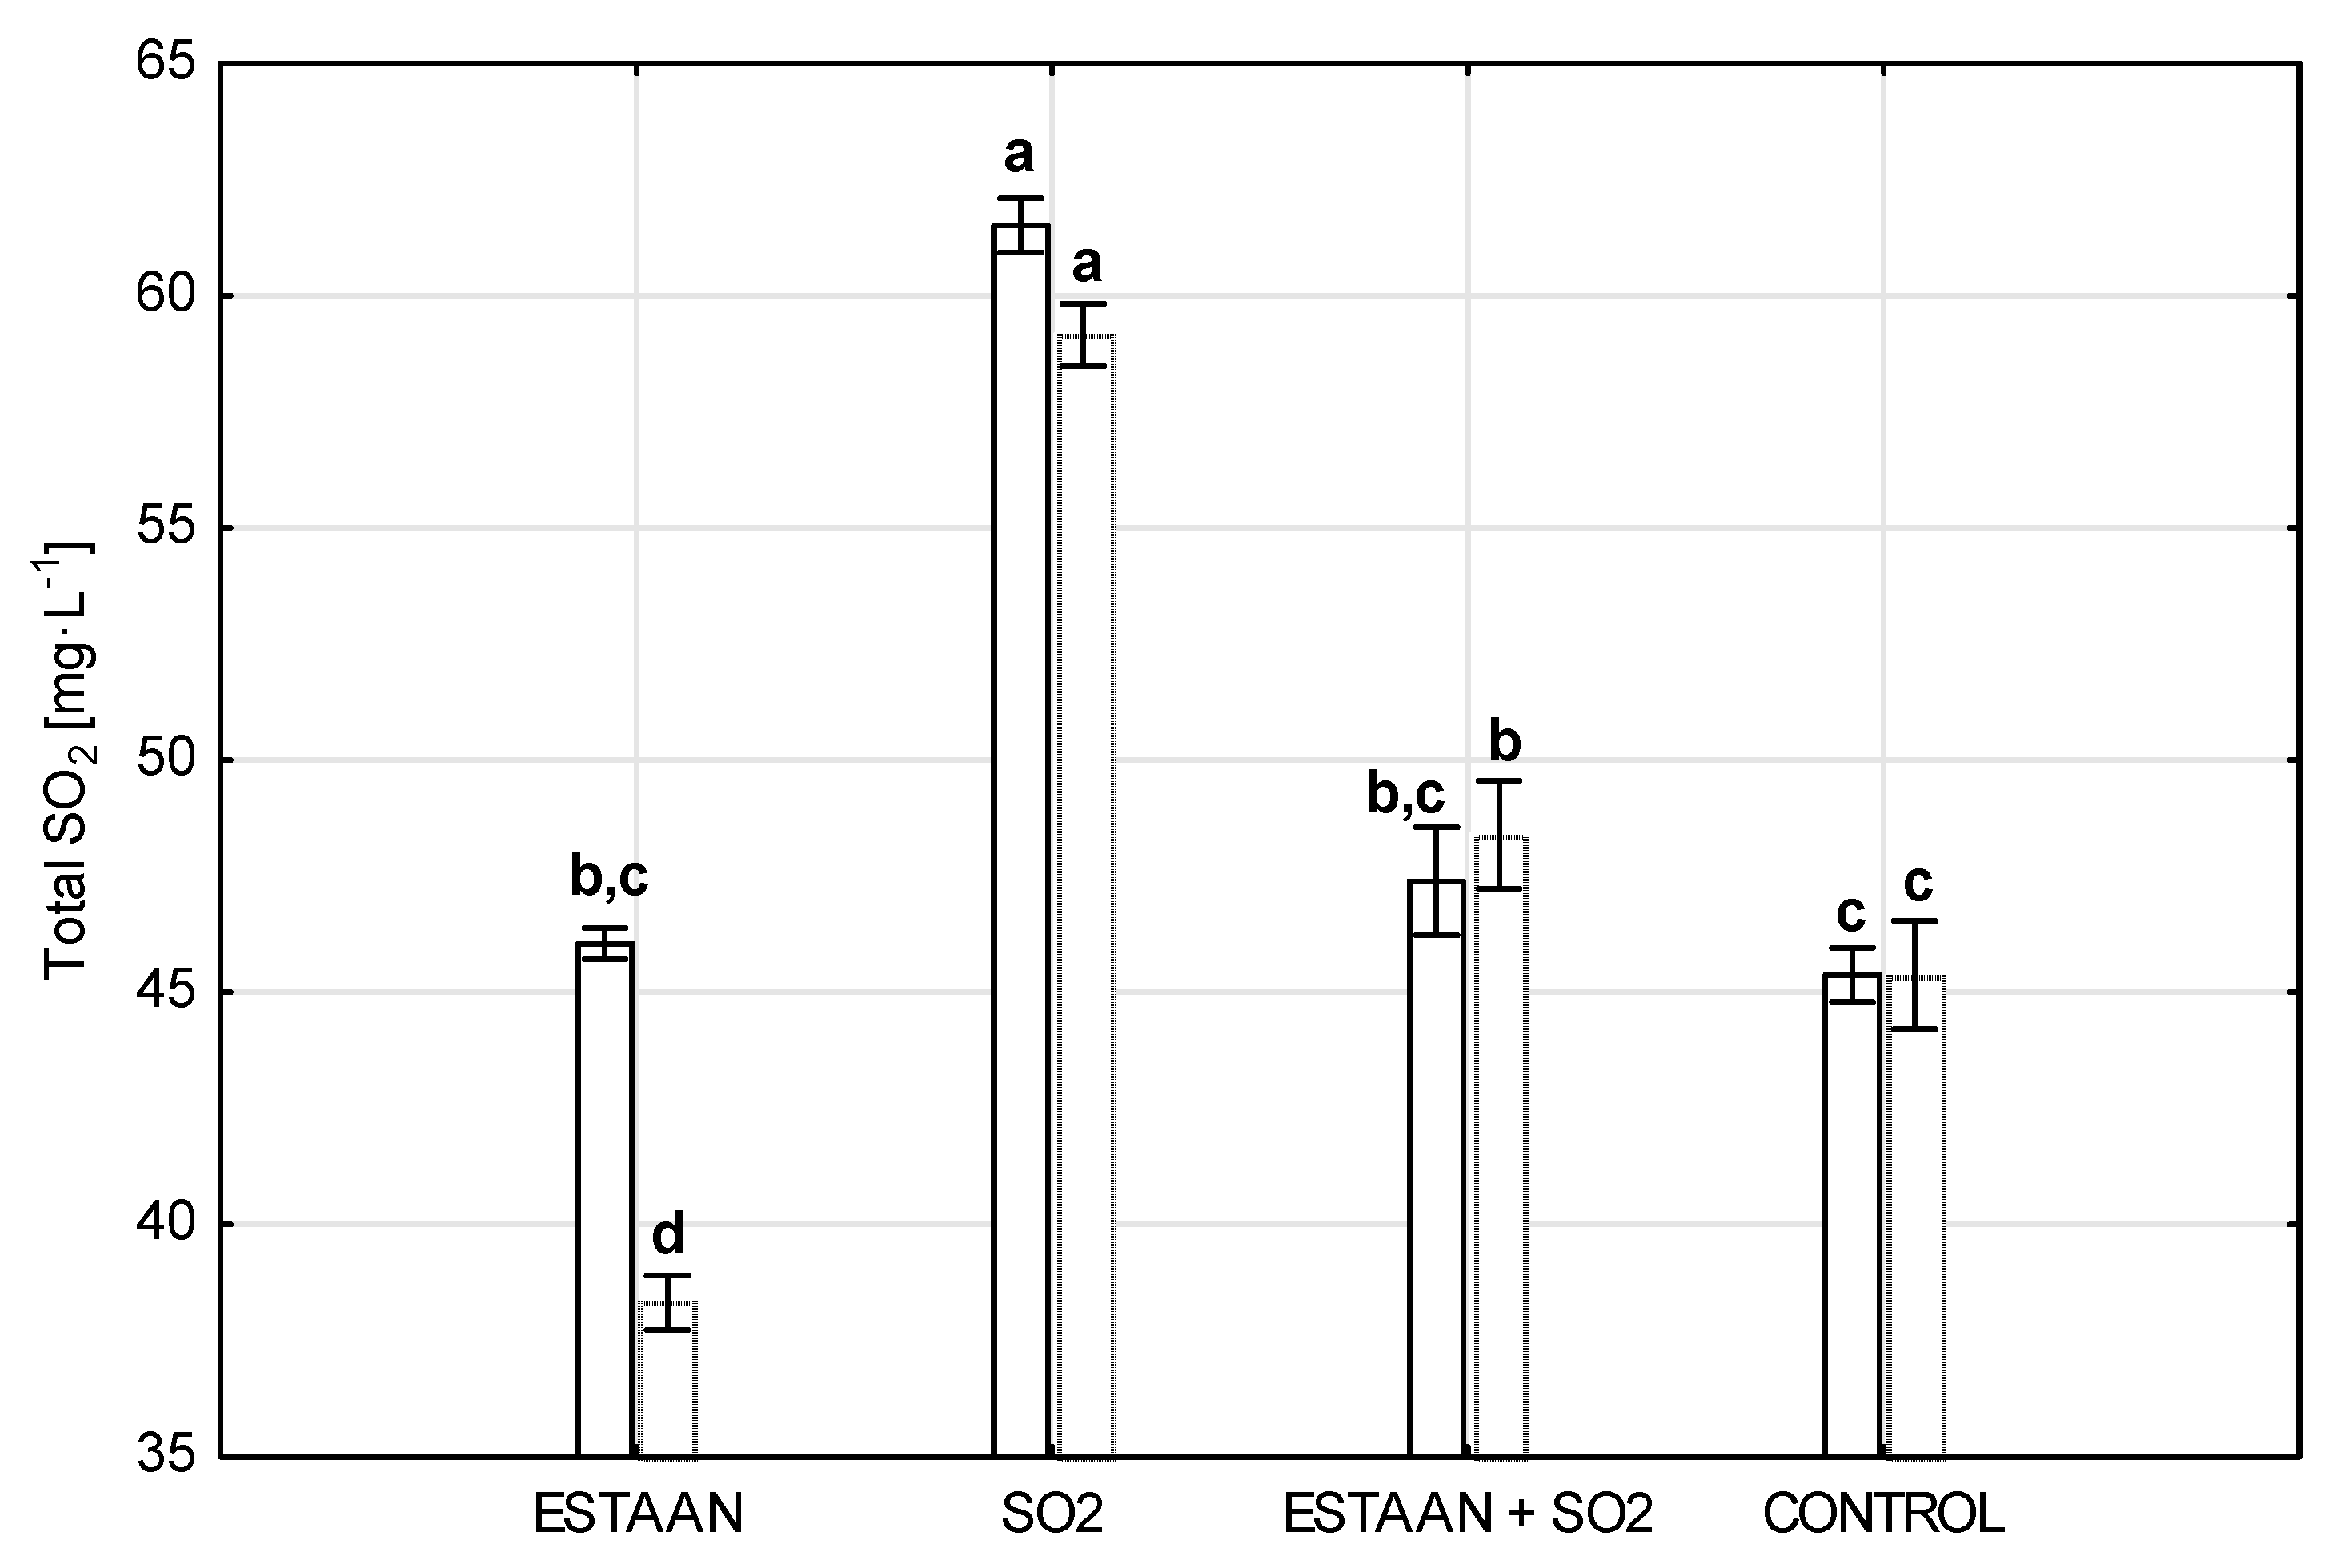
3.6. Total SO2 Content in Wine from Healthy and Botrytised Grapes

During winemaking, specific amounts of SO2 (20–40 mg·L−1) were added to the musts. After fermentation, 40 mg·L−1 of SO2 was universally added.
Figure 10 shows the total SO2 in wines made from healthy and botrytised grapes. The highest total concentration of SO2 was found in the SO2-only variants (40 mg·L−1 to must), at a level of 61 mg·L−1 (healthy grapes) and 59 mg·L−1 (botrytized grapes). The ESTAAN + SO2 variant (20 mg·L−1 to must) yielded a level of 47 mg·L−1 (healthy) and 48 mg·L−1 (botrytized), showing the efficient use of a lower SO2 dose and potential synergy with ESTAAN. The ESTAAN-only variants (no SO2 in must) resulted in a concentration of 46 mg·L−1 (healthy) and 38 mg·L−1 (botrytized) post-fermentation, which matches the standard addition of 40 mg·L−1. These results indicate that ESTAAN provides similar protection to SO2 but without adverse effects on wine quality.

3.7. Sensory Analysis of Wine from Healthy and Botrytised Grapes

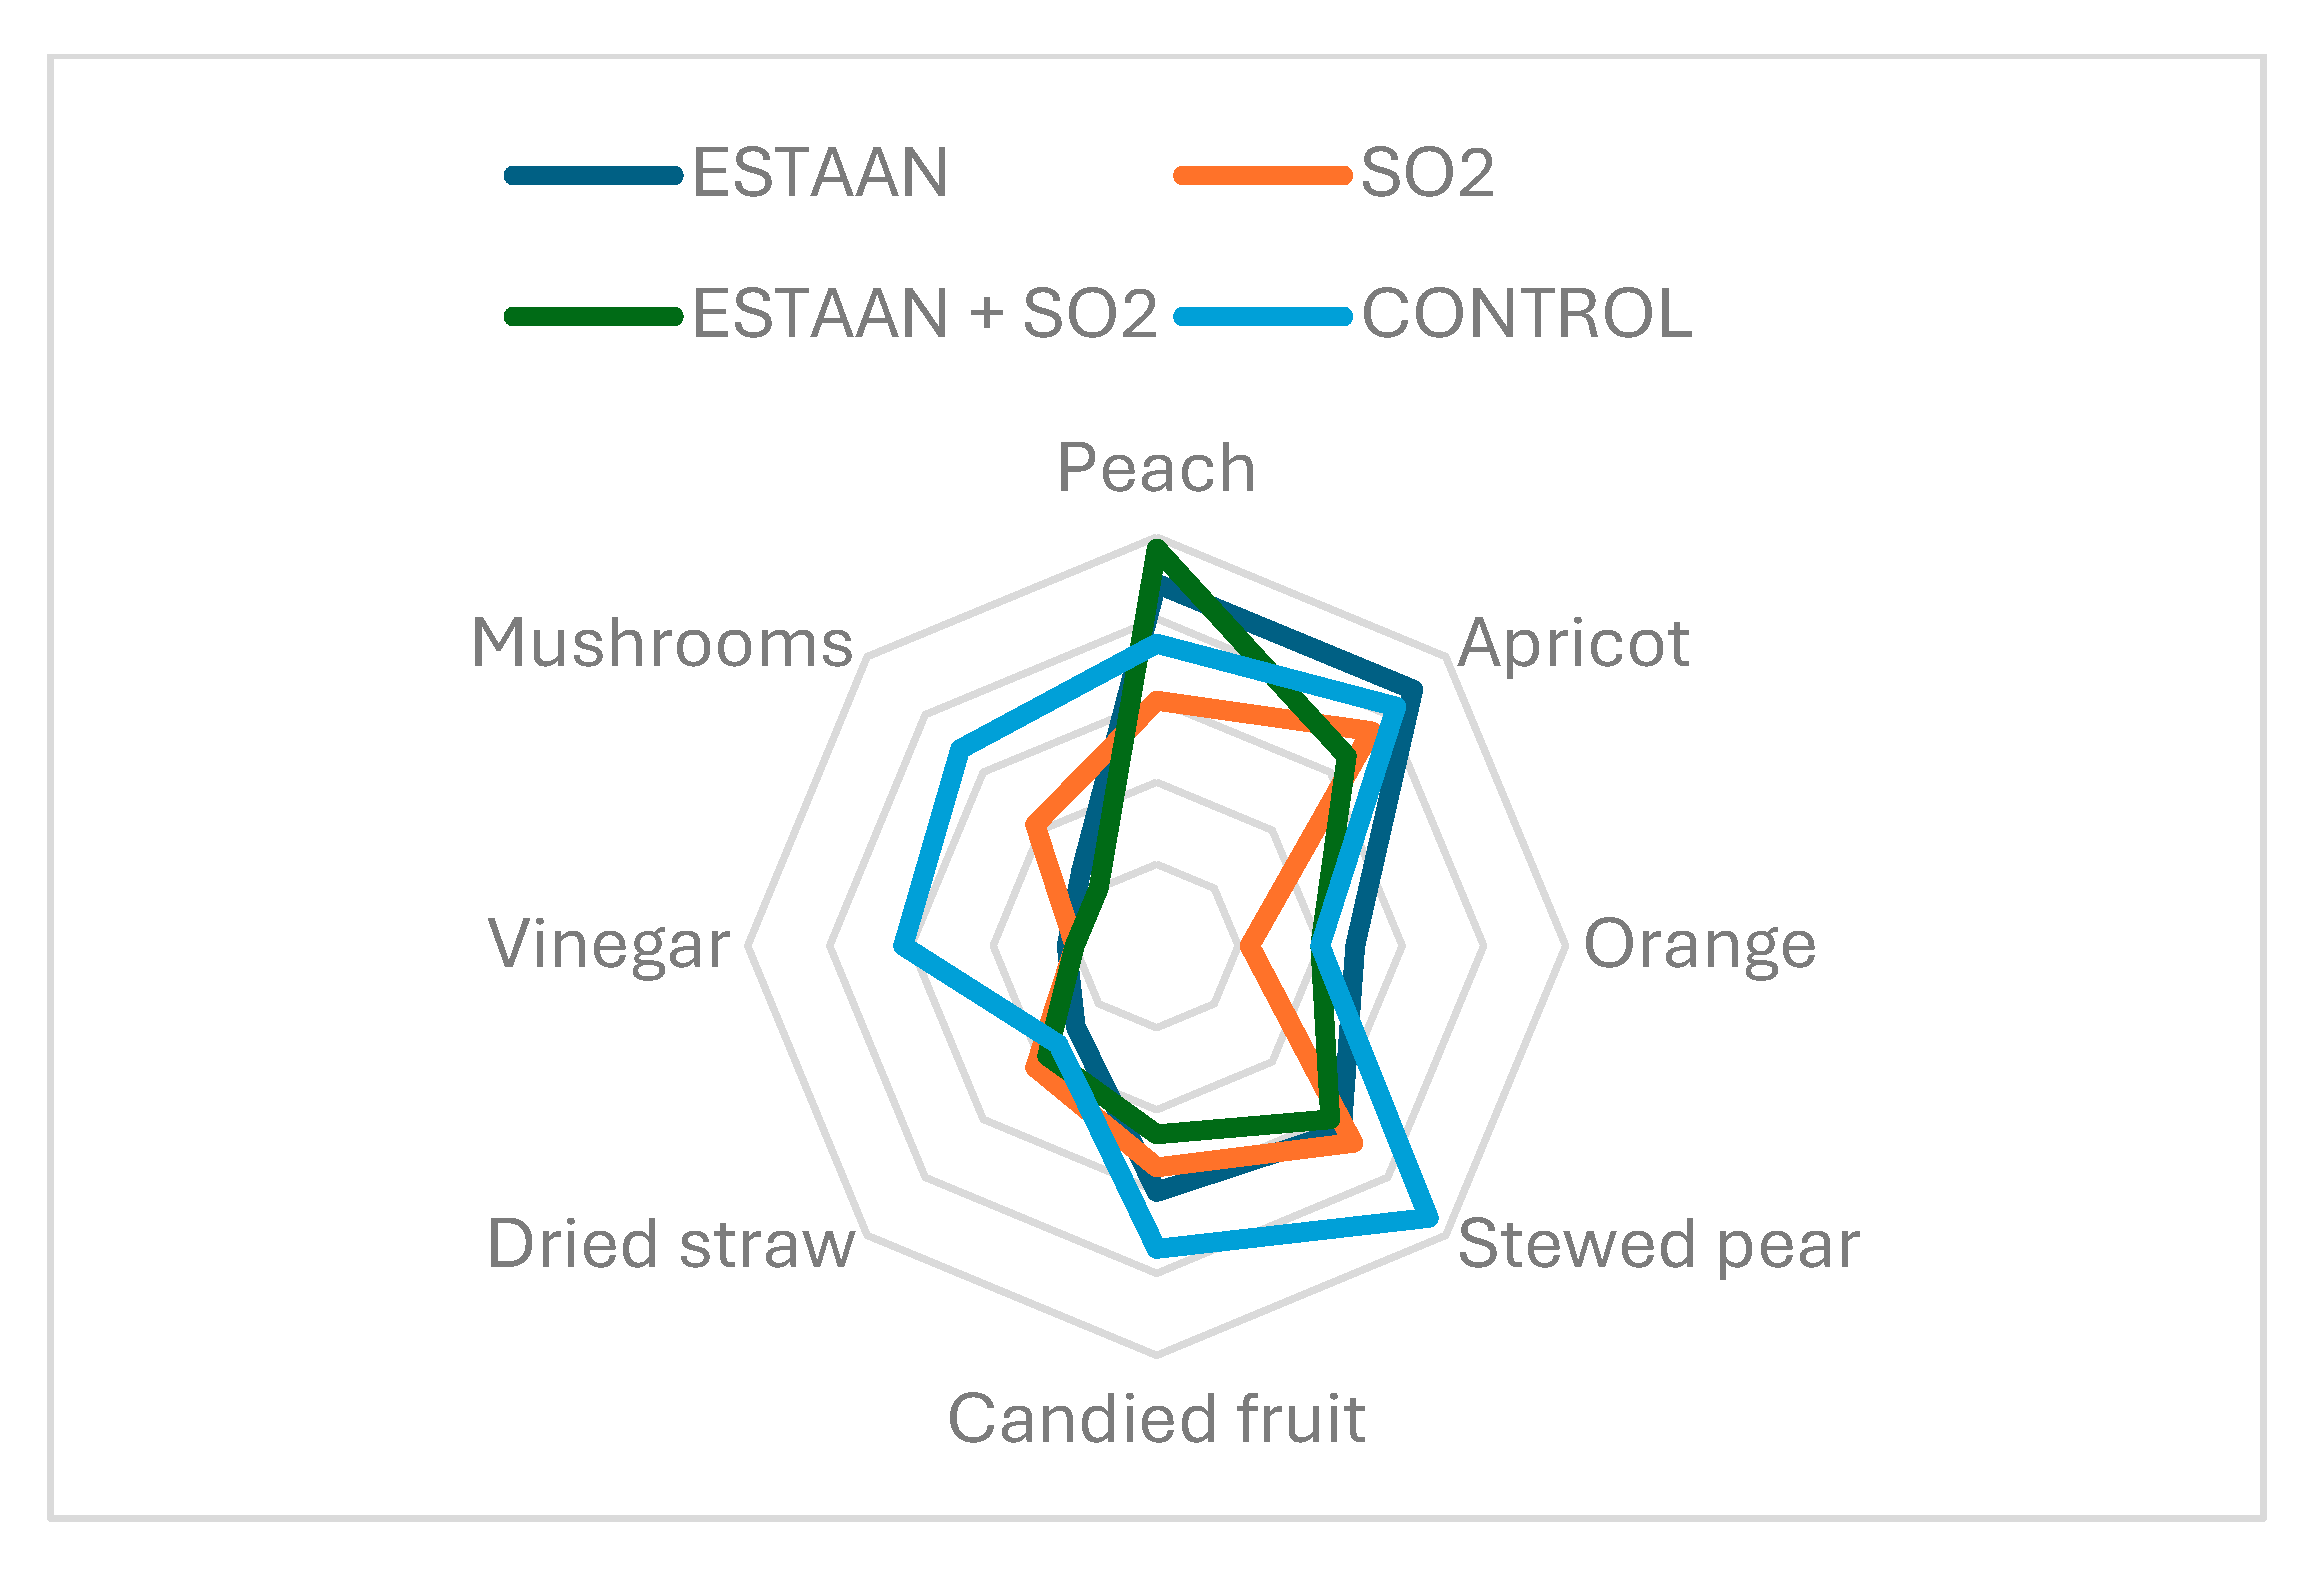
3.7.1. The Varietal Aroma of Riesling

Figure 11 shows the varietal aroma profile of wine from healthy grapes. The ESTAAN + SO2 variant exhibited the highest complexity in fruity (pome and stone fruit) and citrus notes while maintaining very low levels of caramelized, lactic, or mineral components. ESTAAN alone showed a similar aromatic profile, emphasizing tropical and floral aromas, indicating its ability to enhance the primary varietal character. The control variant retained a balanced profile, with greater floral expression but a slightly higher presence of secondary notes (e.g., petrol and herbal). SO2 alone resulted in the least developed aromatic profile, with reduced fruitiness and elevated sharp notes (mineral and spice).
Figure 12 shows the varietal aroma profile of wine from botrytised grapes. The most balanced and sensory-rich aromatic profile of Riesling from botrytized grapes came from the ESTAAN + SO2 variant, which was marked by dominant citrus, floral, and tropical tones. ESTAAN alone enhanced the fruitiness and reduced the defective notes, suggesting that it has the capacity to preserve freshness even with the use of degraded raw materials. Conversely, the variant with SO2 alone led to stronger mineral and petrol notes and lower fruit expression, whereas the untreated control variant exhibited elevated lactic and oxidative components. These findings confirm that ESTAAN, especially when combined with SO2, contributes to the preservation of varietal aromatic identity, even with compromised grape quality.
Comparing the varietal aromatic profile of Riesling made from healthy and botrytized grapes demonstrated that a Botrytis cinerea infection shifts the aromatic balance toward a less expressive display of primary varietal features. Wines from healthy grapes showed a high level of intensity of citrus, floral, and tropical aromas, whereas the botrytized variants were characterized by muted expression and enhanced secondary and tertiary nuances (e.g., caramelized, lactic, and herbal). The strongest preservation of the fruit character in the botrytized wines was observed in the ESTAAN + SO2 variant, whereas in wines from healthy grapes, this was more evident in the variant with ESTAAN alone. In contrast, the addition of SO2 alone led to a less complex and varietally distinct profile in both variants. These results suggest that although botrytis infection has a negative effect on aromatic potential, suitable technological intervention, particularly combinations of antioxidants, can help to significantly retain it.

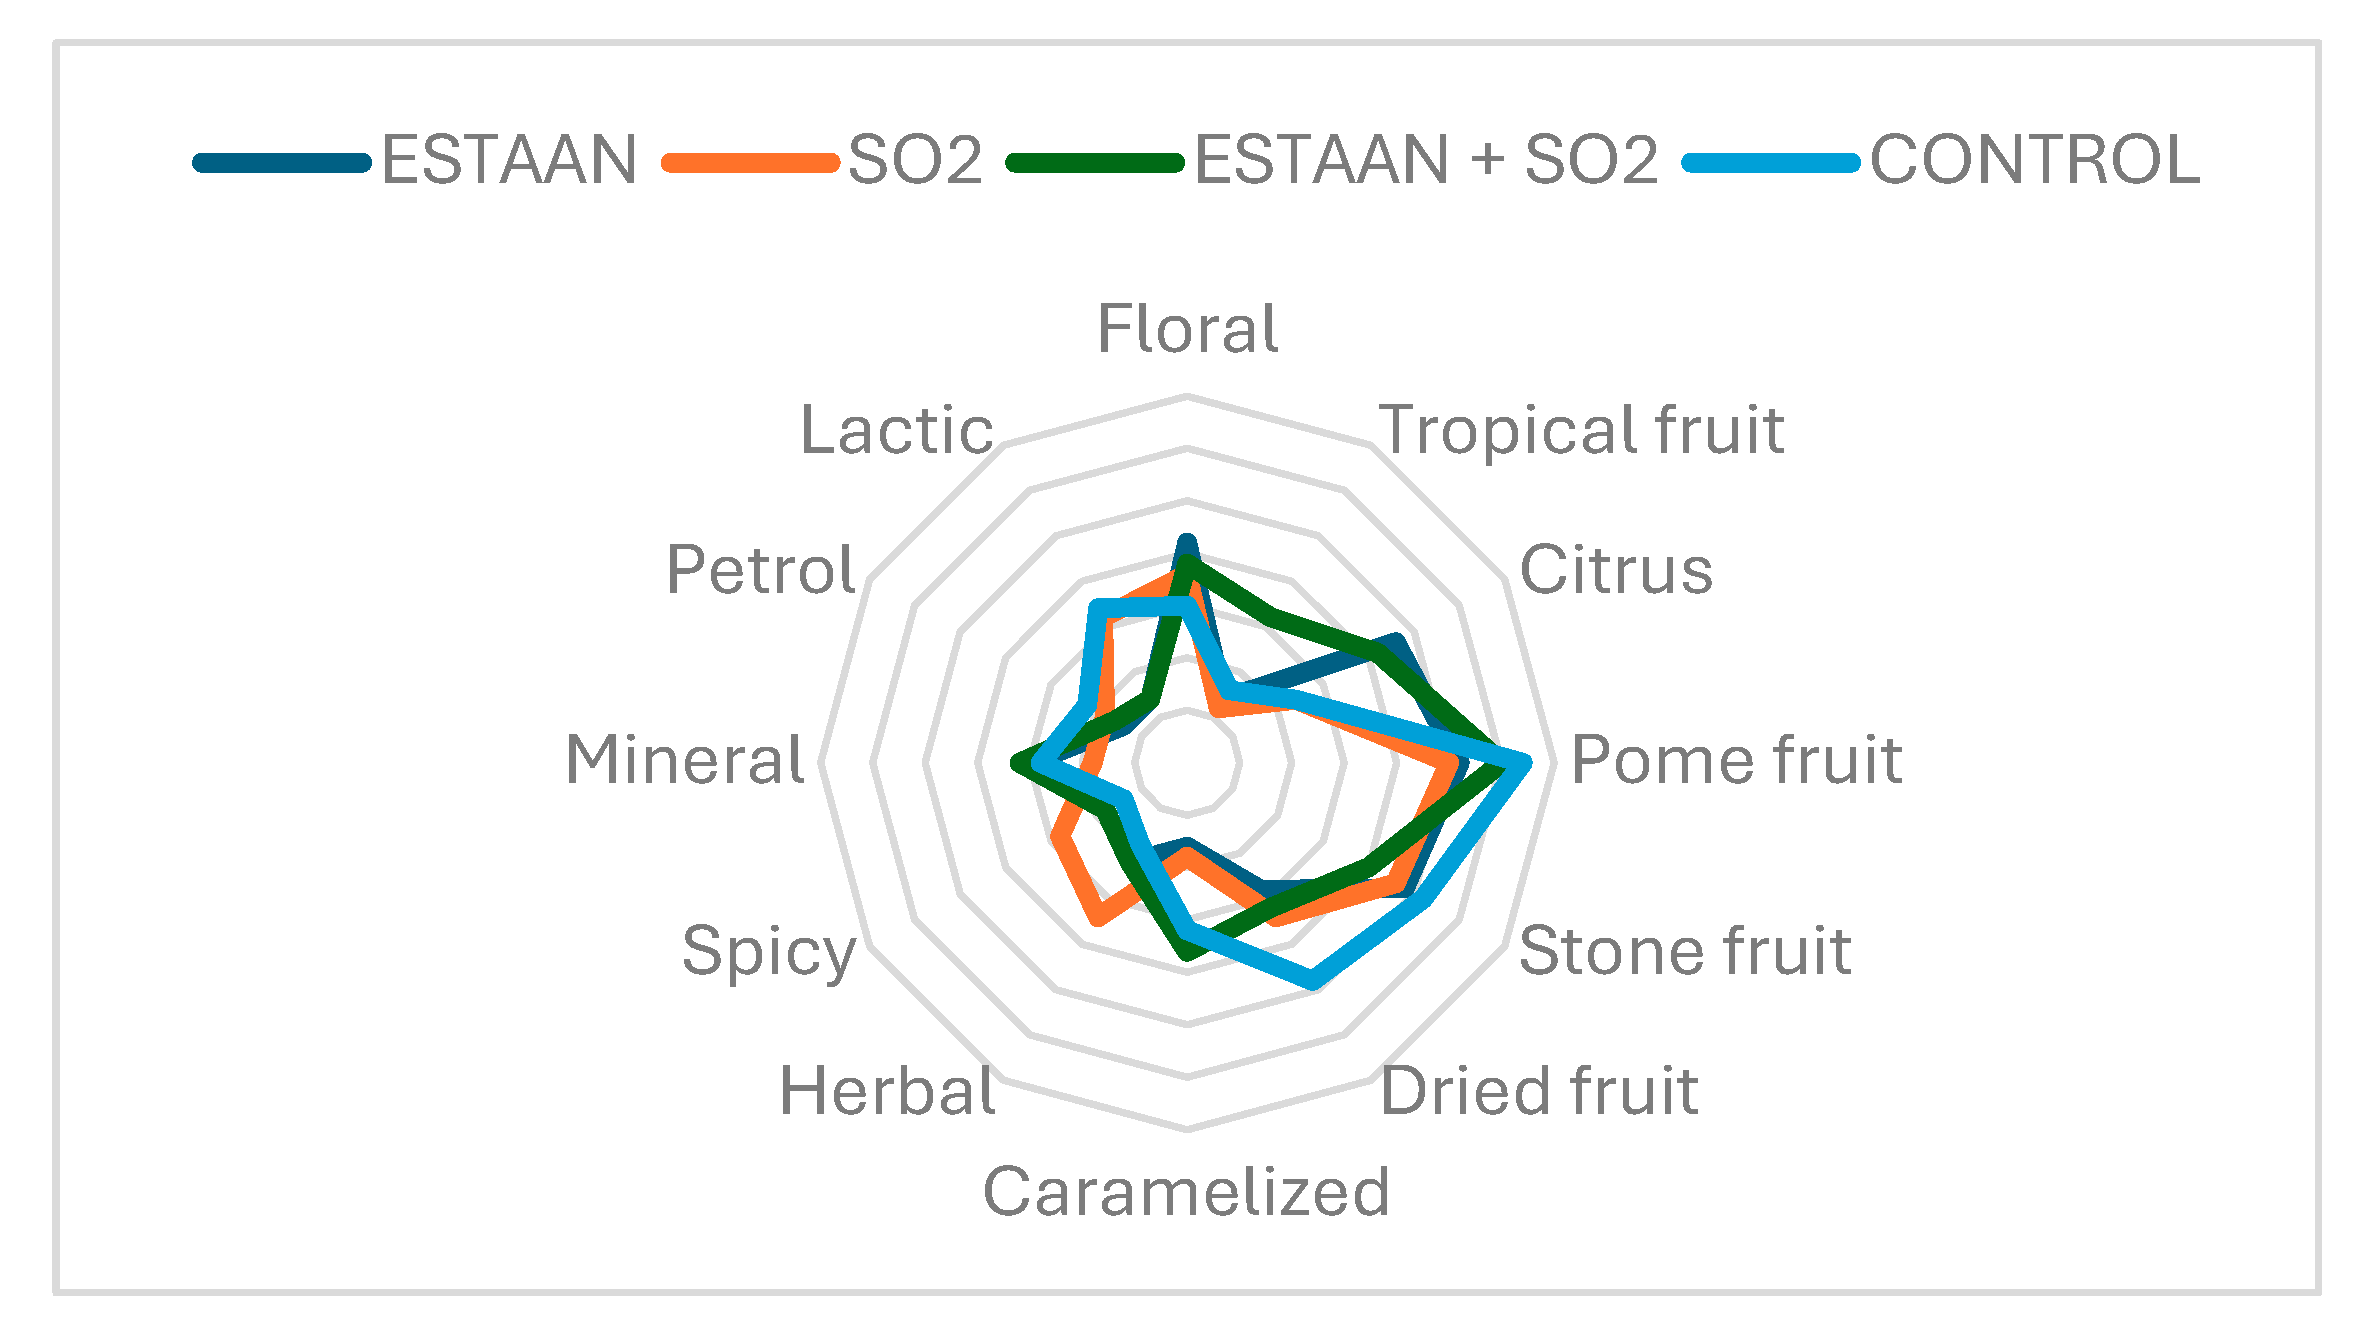
3.7.2. Botrytized Wine Profile

Figure 13 shows the aromatic profile of wine from botrytised grapes. The highest intensity of desirable fruit aromas, especially those of peach, apricot, and stewed pear, was recorded for the ESTAAN + SO2 variant, confirming its ability to enhance aromatic expressiveness, even in wines from Botrytis-infected grapes. ESTAAN alone also provided a strong fruity character, with fewer sensory defects. In contrast, the untreated control variant exhibited the highest intensity of negative notes, such as vinegar and mushroom, indicating its lesser oxidative stability. SO2 alone showed moderate levels of all components, but in comparison to the ESTAAN variants, it exhibited lower fruit intensity. These findings confirm that the combination of ESTAAN and SO2 positively influences aromatic quality, even with compromised raw material.

3.7.3. 100-Point Scale Wine Evaluation

Based on the 100-point sensory evaluation of wine from botrytized grapes, the highest average score came from the ESTAAN-treated wine (86 points), closely followed by the ESTAAN + SO2 variant (85 points). Both significantly outperformed the control, demonstrating the positive impact of ESTAAN on final wine quality. SO2 alone received an average of 84 points, which was slightly lower, though still within the favorable range. The untreated control scored only 73 points, underscoring the adverse effects of a lack of protective additives on overall sensory integrity. These results highlight that the use of ESTAAN, both on its own or in combination with SO2, makes a significant contribution to improvements in the sensory profile of wine made from botrytized grapes.

4. Discussion

ESTAAN is currently approved by the International Organisation of Vine and Wine (OIV) under OIV-OENO 624-2022 and OIV-OENO 675 A,B,C,D-2022, and its use is permitted under EU Commission Regulation No. 2019/934, confirming its safety and suitability for enological use [14]. It is also approved for use in organic wine production under EU Regulation No. 203/2012 and Council Regulation (EC) No. 834/2007, Annex VIIIa, which define the enological agents permissible for use in organic production [26]. Initial trials with ESTAAN have shown positive results, demonstrating efficacy against Brettanomyces yeasts, lactic acid bacteria, and laccase enzymatic activity. In all studies conducted, it has shown comparable efficacy to SO2, affirming its potential as an alternative enological agent [15,27].
Botrytized grapes exhibit significant chemical changes in must composition that directly affect wine quality. These include increased acetic acid levels due to secondary microbial infections [28], as well as elevated glycerol, which is typical of Botrytis cinerea metabolism [29]. The infected raw material also contains higher amounts of phenolic and carbonyl compounds, including acetaldehyde, in comparison to healthy grapes [30,31]. These metabolites influence fermentation and the formation of aromatic compounds, such as higher alcohols [23]. In the experiment, ESTAAN was shown to reduce carbonyl compound levels in must; however, this effect did not carry through to the final wine, where levels increased.
Fatty acid ester content was generally lower in the botrytized variants in comparison with the variants from healthy grapes. The levels of esters in wines treated with ESTAAN, such as ethyl octanoate, ethyl decanoate, and ethyl hexanoate, most closely resembled the controls made from healthy grapes. This indicates that it can help to preserve a favorable aromatic profile, even with degraded raw material [32].
Wines treated with ESTAAN exhibited stronger fruity and floral characteristics, dominated by citrus and floral tones (e.g., geraniol). This provides further evidence of its beneficial role in preserving aromatic freshness [23]. Overall, a notable difference in the volatile compound composition was observed between healthy and botrytized vinifications, with the botrytized samples showing specific aromatic deviations [29,33]. Among the tested treatments, ESTAAN-treated wines most closely resembled the healthy controls, indicating its ability to restore aromatic quality in Botrytis-affected wines.
Sensory evaluation showed stronger botrytis-related aromas in samples treated with SO2 alone or samples that were left untreated [20]. In contrast, wines treated with ESTAAN alone, or in combination with SO2, exhibited suppressed botrytized expression. This suggests that ESTAAN may reduce the sensory impact of Botrytis cinerea, likely due to its inhibitory properties.
Wine treated with ESTAAN received higher scores on the 100-point evaluation scale in comparison to SO2-stabilized wine, suggesting that ESTAAN can have a positive influence on organoleptic characteristics and can serve as a suitable alternative [26]. The enzymatic browning of must, induced by laccase, can be partially suppressed by glutathione addition [6,34], although fully effective suppression would require doses that exceed regulatory limits [35]. Must treated with ESTAAN had a visually equivalent color to SO2-treated samples and a much better color than the untreated controls.
The use of ESTAAN in wine production led to a reduction in total SO2 content without compromising sensory quality, further supporting its potential as an alternative additive [26].

5. Conclusions

The results of this study demonstrate that the plant-based preparation ESTAAN has a strong inhibitory effect on laccase activity in must from Botrytis cinerea-infected Riesling grapes. In several of the measured parameters, it outperformed sulfur dioxide, particularly in the stabilization of laccase activity and preservation of the aromatic integrity of the must. Overall, it showed superior effectiveness in laccase inhibition and the sensory evaluation confirmed that it had better aromatic complexity and purity when compared to SO2-treated wine. Its advantages also include its plant origin and lack of allergenic potential. When combined with sulfur dioxide, synergistic effects were observed, which allowed a significant reduction in sulfite dosage without compromising technological stability. These results suggest that ESTAAN is a promising enological tool that may replace or reduce the use of sulfur dioxide, especially when processing compromised grapes. Integrating this preparation into winemaking practice may support the production of wines with a lower sulfite content and a higher degree of consumer acceptance.

Author Contributions

Conceptualization, M.N. and J.S.; methodology, M.B.; software, M.N. and J.L.; formal analysis, M.K. and M.N.; writing—original draft preparation, M.N. and M.B.; writing—review and editing, J.S.; visualization, M.N. and J.L.; supervision, J.L.; All authors have read and agreed to the published version of the manuscript.

Funding

This work was supported by the Internal Grant Agency of MENDELU Faculty of Horticulture under project no. IGA-ZF/2025-SI1-006: Effect of ESTAAN preparation on must browning caused by fungal disease (Botrytis cinerea) affecting grapes.

Institutional Review Board Statement

Not applicable.

Informed Consent Statement

Not applicable.

Data Availability Statement

All related data and methods are presented in this paper. Additional inquiries should be addressed to the corresponding author.

Conflicts of Interest

The authors declare no conflicts of interest.

References

  1. Zimdars, S.; Hitschler, J.; Schieber, A.; Weber, F. Oxidation of Wine Polyphenols by Secretomes of Wild Botrytis cinerea Strains from White and Red Grape Varieties and Determination of Their Specific Laccase Activity. J. Agric. Food Chem. 2017, 65, 10582–10590. [Google Scholar] [CrossRef] [PubMed]
  2. Bustamante, M.; Giménez, P.; Just-Borràs, A.; Solé-Clua, I.; Gombau, J.; Heras, J.M.; Sieczkowski, N.; Gil, M.; Canals, J.M.; Zamora, F. Inoculation with a selected strain of Metschnikowia pulcherrima as a bioprotective alternative to sulphites for preventing browning of white grape must. OENO One 2024, 58. [Google Scholar] [CrossRef]
  3. Giménez, P.; Just-Borràs, A.; Gombau, J.; Canals, J.M.; Zamora, F. Effects of laccase from Botrytis cinerea on the oxidative degradation of anthocyanins. OENO One 2023, 57, 243–253. [Google Scholar] [CrossRef]
  4. Li, H.; Guo, A.; Wang, H. Mechanisms of oxidative browning of wine. Food Chem. 2008, 108, 1–13. [Google Scholar] [CrossRef]
  5. García-Roldán, A.; Canalda-Sabaté, A.; Gombau-Roigé, J.; Bustamante-Quiñones, M.; Just-Borras, A.; Heras, J.M.; Sieczkowski, N.; Canals, J.M.; Zamora, F. Development of a model to study browning caused by tyrosinase in grape must. Food Chem. 2025, 463, 141457. [Google Scholar] [CrossRef]
  6. Giménez, P.; Just-Borras, A.; Pons, P.; Gombau, J.; Heras, J.M.; Sieczkowski, N.; Canals, J.M.; Zamora, F. Biotechnological tools for reducing the use of sulfur dioxide in white grape must and preventing enzymatic browning: Glutathione; inactivated dry yeasts rich in glutathione; and bioprotection with Metschnikowia pulcherrima. Eur. Food Res. Technol. 2023, 249, 1491–1501. [Google Scholar] [CrossRef]
  7. Guerrero, R.F.; Cantos-Villar, E. Demonstrating the efficiency of sulphur dioxide replacements in wine: A parameter review. Trends Food Sci. Technol. 2015, 42, 27–43. [Google Scholar] [CrossRef]
  8. Giménez, P.; Anguela, S.; Just-Borras, A.; Pons-Mercadé, P.; Vignault, A.; Canals, J.M.; Teissedre, P.-L.; Zamora, F. Development of a synthetic model to study browning caused by laccase activity from Botrytis cinerea. LWT 2022, 154, 112871. [Google Scholar] [CrossRef]
  9. Stockley, C.; Paschke-Kratzin, A.; Teissedre, P.-L.; Restani, P.; Tejedor, N.G.; Quini, C. SO2 and Wine: A Review; International Organisation of Vine and Wine (OIV): Paris, France, 2021. [Google Scholar]
  10. Lisanti, M.T.; Blaiotta, G.; Nioi, C.; Moio, L. Alternative Methods to SO2 for Microbiological Stabilization of Wine. Compr. Rev. Food Sci. Food Saf. 2019, 18, 455–479. [Google Scholar] [CrossRef]
  11. EFSA Panel on Dietetic Products; Nutrition and Allergies (NDA). Scientific Opinion related to a notification from the Oenological Products and Practices International Association (OENOPPIA) on lysozyme from hen’s egg to be used in the manufacture of wine as an anti-microbial stabilizer/additive pursuant to Article 6, paragraph 11 of Directive 2000/13/EC—For permanent exemption from labelling. EFSA J. 2011, 9, 2386. [Google Scholar]
  12. Tedesco, F.; Pietrafesa, R.; Siesto, G.; Scieuzo, C.; Salvia, R.; Falabella, P.; Capece, A. Antimicrobial Activity of Chitosan from Different Sources Against Non-Saccharomyces Wine Yeasts as a Tool for Producing Low-Sulphite Wine. Beverages 2024, 10, 105. [Google Scholar] [CrossRef]
  13. Bustamante, M.; Giménez, P.; Just-Borràs, A.; Solé-Clua, I.; Gombau, J.; Heras, J.M.; Sieczkowski, N.; Gil, M.; Pérez-Navarro, J.; Gómez-Alonso, S.; et al. Use of Glutathione, Pure or as a Specific Inactivated Yeast, as an Alternative to Sulphur Dioxide for Protecting White Grape Must from Browning. Foods 2024, 13, 310. [Google Scholar] [CrossRef]
  14. Europe, B. Estaan®—Plant-Based Sulphite Replacement for Wine. 2021. Available online: https://biolethics.com/estaan/ (accessed on 15 March 2025).
  15. Bonich, F.S.; Freund, M.; Tarasov, A.; Bollinetti, M.; Ovadenko, O.; Christmann, M. Evaluation of plant phenolic extracts as an alternative to sulfur dioxide for the control of Oenococcus oeni and Brettanomyces bruxellensis. BIO Web Conf. 2023, 68, 02027. [Google Scholar]
  16. Dubourdieu, D.; Grassin, C.; Deruche, C.; Ribéreau-Gayon, P. Mise au point d’une mesure rapide de l’activité laccase dans les moûts et dans les vins par la méthode a la syringaldazine. Application à l’appréciation de l’état sanitaire des vendanges. OENO One 1984, 18, 237. [Google Scholar] [CrossRef]
  17. Grassin, C.; Dubourdieu, D. Optimisation de la méthode de dosage de l’activité laccase de Botrytis cinerea par la syringaldazine. OENO One 1986, 20, 125. [Google Scholar] [CrossRef]
  18. Waterman, P.G.; Mole, S. Analysis of Phenolic Plant Metabolites; Wiley-Blackwell Scientific Publications: Oxford, UK, 1994. [Google Scholar]
  19. International Organisation of Vine and Wine. OIV Standard for International Wine and Spirituous Beverages of Vitivinicultural Origin Competitions; International Organisation of Vine and Wine: Dijon, France, 2021. [Google Scholar]
  20. Magyar, I.; Soós, J. Botrytized Wines—Current Perspectives. Int. J. Wine Res. 2016, 8, 29–39. [Google Scholar] [CrossRef]
  21. Sun, Q.; Cui, R.; Zhao, Y. Regional aroma characteristics of spontaneously fermented Cabernet Sauvignon wines produced from seven sub-regions in Shangri-La of China. Sci. Rep. 2024, 14, 24566. [Google Scholar] [CrossRef]
  22. Stevenson, T. Riesling’s Character and ‘Petrol’ Aromas. 2008. Available online: https://wine-pages.com/columnist-articles/tom-stevenson-ponders-on-rieslings-character-and-petrol-aromas/ (accessed on 27 March 2025).
  23. Styger, G.; Prior, B.; Bauer, F. Wine flavor and aroma. J. Ind. Microbiol. Biotechnol. 2011, 38, 1145–1159. [Google Scholar] [CrossRef]
  24. Steyer, D.; Erny, C.; Claudel, P.; Riveill, G.; Karst, F.; Legras, J.-L. Genetic analysis of geraniol metabolism during fermentation. Food Microbiol. 2013, 33, 228–234. [Google Scholar] [CrossRef]
  25. Mikami, N.; Konya, M.; Enoki, S.; Suzuki, S. Geraniol as a Potential Stimulant for Improving Anthocyanin Accumulation in Grape Berry Skin through ABA Membrane Transport. Plants 2022, 11, 1694. [Google Scholar] [CrossRef]
  26. Karampatea, A.; Skendi, A.; Irakli, M.; Bouloumpasi, E. Replacement of Sulfur Dioxide in White, Rosé, and Red Wines by a Blend of Tannins Extracted from Multiple Plant Materials. Beverages 2024, 10, 110. [Google Scholar] [CrossRef]
  27. Prusova, B.; Licek, J.; Kumsta, M.; Baron, M.; Sochor, J. Effect of New Methods for Inhibiting Malolactic Fermentation on the Analytical and Sensory Parameters of Wines. Fermentation 2024, 10, 122. [Google Scholar] [CrossRef]
  28. Kelly, M. Botrytis Bunch Rot: Winemaking Implications and Considerations. 2018. Available online: https://psuwineandgrapes.wordpress.com/2018/06/01/botrytis-bunch-rot-winemaking-implications-and-considerations/ (accessed on 27 March 2025).
  29. Tosi, E.; Fedrizzi, B.; Azzolini, M.; Finato, F.; Simonato, B.; Zapparoli, G. Effects of noble rot on must composition and aroma profile of Amarone wine produced by the traditional grape withering protocol. Food Chem. 2012, 130, 370–375. [Google Scholar] [CrossRef]
  30. Claus, H.; Sabel, A.; König, H. Wine Phenols and Laccase: An Ambivalent Relationship. In Wine—Phenolic Composition, Classification and Health Benefits; Nova Science Publishers Inc.: Hauppauge, NY, USA, 2014; pp. 155–185. [Google Scholar]
  31. Kelly, J.; Inglis, D.; Dowling, L.; Pickering, G. Impact of Botrytis cinerea-infected grapes on quality parameters of red wine made from withered grapes. Aust. J. Grape Wine Res. 2022, 28, 439–449. [Google Scholar] [CrossRef]
  32. Santos, H.; Augusto, C.; Reis, P.; Rego, C.; Figueiredo, A.C.; Fortes, A.M. Volatile Metabolism of Wine Grape Trincadeira: Impact of Infection with Botrytis cinerea. Plants 2022, 11, 141. [Google Scholar] [CrossRef]
  33. Wang, X.-J.; Tao, Y.-S.; Wu, Y.; An, R.-Y.; Yue, Z.-Y. Aroma compounds and characteristics of noble-rot wines of Chardonnay grapes artificially botrytized in the vineyard. Food Chem. 2017, 226, 41–50. [Google Scholar] [CrossRef]
  34. Canals, J.M.; Giménez, P.; Anguela, S.; Just-Borras, A.; Pons-Mercadé, P.; Gombau, J.; Vignault, A.; Teissedre, J.M.C.P.-L.; Zamora, F. Inhibitory effect of sulfur dioxide, ascorbic acid and glutathione on browning caused by laccase activity. In Proceedings of the Macrowine 2021, Virtual, 23–30 June 2021. [Google Scholar]
  35. (OIV), International organization of vine and wine. International Oenological Codex; OIV: Paris, France, 2025. [Google Scholar]
Scheme 1. Scheme of the experimental design.
Fermentation 11 00360 sch001
Figure 1. Laccase activity in must from botrytised grapes (ANOVA, Fisher LSD test, p < 0.05; means ± SD; n = 3). Different letters (a–d) indicate significant differences, where ‘a’ = the highest value and ‘d’ = the lowest value.
Fermentation 11 00360 g001
Figure 2. Total phenolic content in must from healthy grapes after the use of different additives (ANOVA, Fisher LSD test, p < 0.05; means ± SD; n = 3). Different letters (a–c) indicate significant differences, where ‘a’ = the highest value and ‘c’ = the lowest value.
Fermentation 11 00360 g002
Figure 3. Total phenolic content in botrytised must after the use of different additives (ANOVA, Fisher LSD test, p < 0.05; means ± SD; n = 3). Different letters (a–c) indicate significant differences, where ‘a’ = the highest value and ‘c’ = the lowest value.
Fermentation 11 00360 g003
Figure 4. Acetaldehyde content in the wines from healthy grapes (ANOVA, Fisher LSD test, p < 0.05; means ± SD; n = 3). Different letters (a–d) indicate significant differences, where ‘a’ = the highest value and ‘d’ = the lowest value.
Fermentation 11 00360 g004
Figure 5. Acetaldehyde content in the wines from botrytised grapes (ANOVA, Fisher LSD test, p < 0.05; means ± SD; n = 3). Different letters (a–c) indicate significant differences, where ‘a’ = the highest value and ‘c’ = the lowest value.
Fermentation 11 00360 g005
Figure 6. Total fatty acid ethyl esters in wine from healthy grapes (ANOVA, Fisher LSD test, p < 0.05; means ± SD; n = 3). Different letters (a, b) indicate significant differences, where ‘a’ = the highest value and ‘b’ = the lowest value.
Fermentation 11 00360 g006
Figure 7. Total fatty acid ethyl esters in wine from botrytised grapes (ANOVA, Fisher LSD test, p < 0.05; means ± SD; n = 3). Different letters (a, b) indicate significant differences, where ‘a’ = the highest value and ‘b’ = the lowest value.
Fermentation 11 00360 g007
Figure 8. Geraniol content in wine from healthy grapes (ANOVA, Fisher LSD test, p < 0.05; means ± SD; n = 3). Different letters (a–c) indicate significant differences, where ‘a’ = the highest value and ‘c’ = the lowest value.
Fermentation 11 00360 g008
Figure 9. Geraniol content in wine from botrytised grapes (ANOVA, Fisher LSD test, p < 0.05; means ± SD; n = 3). Different letters (a, b) indicate significant differences, where ‘a’ = the highest value and ‘b’ = the lowest value.
Fermentation 11 00360 g009
Figure 10. Total SO2 in wines made from healthy and botrytised grapes (ANOVA, Fisher LSD test, p < 0.05; means ± SD; n = 3). Different letters (a–d) indicate significant differences, where ‘a’ = the highest value and ‘d’ = the lowest value.
Fermentation 11 00360 g010
Figure 11. The varietal aroma profile of wine from healthy grapes (n = 8). The mean intensity values (scale 1–10) of selected aroma descriptors were based on the evaluation of the expert panel.
Fermentation 11 00360 g011
Figure 12. The varietal aroma profile of wine from botrytised grapes (n = 8). The mean intensity values (scale 1–10) of selected aroma descriptors were based on the evaluation of the expert panel.
Fermentation 11 00360 g012
Figure 13. The aromatic profile of wine from botrytised grapes (n = 8). The mean intensity values (scale 1–10) of selected aroma descriptors were based on the evaluation of the expert panel.
Fermentation 11 00360 g013
Table 1. Basic parameters of the musts (all in g·L−1).
VariantGlucoseFructoseTartaric AcidMalic AcidAcetic Acid
Healthy must89.690.74.152.130.05
Botrytised must87.197.73.544.150.46
Disclaimer/Publisher’s Note: The statements, opinions and data contained in all publications are solely those of the individual author(s) and contributor(s) and not of MDPI and/or the editor(s). MDPI and/or the editor(s) disclaim responsibility for any injury to people or property resulting from any ideas, methods, instructions or products referred to in the content.

