Article

Application of Commercial Pectinase as a Biocatalyst During Self-Induced Anaerobic Fermentation of Coffee (Coffea arabica L. var. Typica)

by
Marcelo Edvan dos Santos Silva
1,
Rodrigo Lira de Oliveira
2,
Marcilio Martins de Moraes
3,
Claudio Augusto Gomes da Camara
3,
Suzana Pedroza da Silva
4 and
Tatiana Souza Porto
1,5,*
1
Northeast Biotechnology Network, Federal Rural University of Pernambuco (UFRPE), Av. Dom Manoel de Medeiros, s/n, Dois Irmãos, Recife 52171-900, PE, Brazil
2
Multi-User Food Science and Technology Laboratory, Federal University of the Agreste of Pernambuco (UFAPE), Av. Bom Pastor, Boa Vista, s/n, Garanhuns 55292-270, PE, Brazil
3
Department of Chemistry, Federal Rural University of Pernambuco (UFRPE), Av. Dom Manoel de Medeiros, s/n, Dois Irmãos, Recife 52171-900, PE, Brazil
4
Postgraduate Program in Environmental Sciences, Federal University of the Agreste of Pernambuco (UFAPE), Av. Bom Pastor, Boa Vista, s/n, Garanhuns 55292-270, PE, Brazil
5
Department of Morphology and Animal Physiology, Federal University of Pernambuco (UFRPE), Recife 52171-900, PE, Brazil
*
Author to whom correspondence should be addressed.
Fermentation 2025, 11(7), 361; https://doi.org/10.3390/fermentation11070361
Submission received: 29 May 2025 / Revised: 13 June 2025 / Accepted: 20 June 2025 / Published: 22 June 2025
(This article belongs to the Special Issue Microbiota and Metabolite Changes in Fermented Foods)

Abstract

This study investigated the impact of enzyme treatment on the physicochemical parameters and volatile and bioactive composition of Arabica coffee beans during self-induced anaerobic fermentation (SIAF). The physicochemical parameters of the beans treated with the enzyme solution were monitored over a 120 h fermentation period. The results showed that increasing enzyme concentration reduced the levels of reducing sugars and phenolic compounds, leading to decrease in antioxidant activity. Pectin lyase activity was highest in beans treated with 10 U.·mL−1, while polygalacturonase activity fluctuated throughout fermentation. The highest caffeine content (722.09 ± 3.7 mg·100g−1) was found in beans treated with 5 U.mL−1 after 72 h of fermentation. In contrast, trigonelline (1028.75 ± 31.4 mg·100g−1) and 5-O-caffeoylquinic acid (5CQA) (423.46 ± 40.3 mg·100g−1) were more prominent in unfermented beans. Volatile formation showed a positive correlation with enzyme concentration, with beans treated with 10 U·mL−1 exhibiting a more diverse volatile profile in the first 24 h. These findings suggest that enzymatic treatment modulates coffee’s volatile and bioactive composition, enhancing levels of aromatic compounds that are directly linked to the sensory quality of the coffee beverage.

1. Introduction

Pectin is a heteropolysaccharide composed of monomeric units of galacturonic acid, rhamnose, arabinose, and galactose, linked to structural proteins found in the cell walls of fruits and vegetables [1]. In coffee, it is present in the mucilage (1–3%) as a complex polysaccharide and serves as a substrate for fermentation processes [2]. During fermentation, pectin degradation occurs through the action of microbial pectinases, particularly polygalacturonase and pectin lyase, which are essential for coffee fermentation and are often used as key parameters for selecting starter cultures [3].
Polygalacturonase catalyzes the hydrolysis of α1-4 glycosidic bonds in D-galacturonic acid, leading to pectin depolymerization and the softening of plant tissue [4]. Additionally, pectin lyase cleaves these α1-4 glycosidic bonds via β-elimination [5]. The action of these enzymes during coffee fermentation serves the functional purpose of removing the mucilage layer and reducing bean moisture by inhibiting fungal growth [6]. Furthermore, enzymatic hydrolysis releases aromatic compounds such as methoxypyrazines and terpenes, key contributors to primary aromas [3].
In this context, coffee fermentation is based on the action of enzymes responsible for physical and chemical changes so that enzyme treatment can contribute to bioprocessing development. Thus, coffee fermentation can be improved by changing processing conditions and has aroused the interest of producers due to its commercial value in the international market [7]. Therefore, several technologies improving coffee fermentation have been studied, yielding promising results. While the selection of starter cultures remains a widely explored avenue, it is still evolving. Other approaches, such as carbon supplementation, pH and temperature adjustments, oxygen demand control, and sugar addition, have been mentioned but remain underexplored [3].
Simultaneously, the use of exogeneous enzymes in the fermentation medium is an emerging technology. Tai et al. [8] assessed the impact of adding polygalacturonase and feruloyl esterase, derived from Aspergillus tubingensis, on the quality of Robusta coffee beans subjected to submerged fermentation. Their study found that enzyme addition reduced fermentation time and improved flavor. Similarly, Elhalis et al. [9] observed that fermentation of pectinases in wet coffee significantly shortened the mucilage degradation time due to the action of polygalacturonase and pectin lyase. According to Febrianto and Zhu [10], adding enzymes to the coffee fermentation process modifies the chemical composition and sensory quality, particularly through enhanced volatile profiles. Thus, with coffee mucilage being a matrix rich in pectin, treatment with pectinases reduces fermentation time, favors the synthesis of volatile compounds, and improves the quality of the coffee beverage.
Currently, no studies are present in the literature on the addition of enzymes as a catalyst for the solid-state fermentation of coffee. However, this technology has advantages such as the possibility of using the whole fruit, dispensing with the pulping step, and adding by spraying, which significantly reduces the amount of water required for the process. Based on this background, this study aims to explore the effects of commercial pectinase on the solid-state fermentation of Arabica coffee, focusing on its impact on the volatile and bioactive composition of the beans.

2. Materials and Methods

2.1. Coffee Sample

Coffee fruits (Coffea arabica L.), of the variety ‘Typica’, were harvested at an altitude of 850 m above sea level from the Varzea Grande and Florentina family farms in Taquaritinga do Norte (7°54′56.2″ S, 36°20′59.2″ W), Pernambuco (PE), Brazil. Harvesting was performed manually, followed by a washing stage in which the fruits were submerged in water. During this process, impurities and floating fruits remained on the surface, facilitating their removal, while the denser green and ripe fruits settled at the bottom of the container. Afterward, immature fruits were removed by manual selection, and only the ripe fruits, with an average of 17 °Brix, were directed to the fermentation process.

2.2. Coffee Fermentation Processing

Approximately 100 g of pre-selected coffee cherries (coffee fruits with similar stages of maturity and sizes) was used for each treatment, including fermented coffee without enzyme application. In the enzymatic treatment, the samples were sprayed with 10 mL of a commercial enzyme preparation derived from Aspergillus aculeatus at concentrations of 1, 5, and 10 U·mL−1 (Pectinex Ultra SP-L (P2611), Sigma-Aldrich, St. Louis, MO, USA). The samples were manually shaken to ensure uniform contact between the enzymatic solution and the entire surface of the cherries. A volume of 10 mL of enzymatic solution was sufficient to avoid liquid accumulation inside the container, thus maintaining the characteristics of solid-state fermentation. Coffee cherries with and without enzyme treatment were packed into cylindrical polyethylene containers with a capacity of 0.5 L (diameter: 8 cm; height: 17 cm), resulting in the cherries occupying approximately 10 cm in height, leaving a headspace of 7 cm. The containers were carefully sealed and equipped with an airlock valve to release CO2 and a thermo-hygrometer to monitor the temperature and moisture levels of the fermentation environment. The process was evaluated every 24 h over 120 h of fermentation.

2.3. Drying, Roasting, and Grinding Coffee

The fermented coffee beans were dried in an oven with air circulation at 40 °C until they reached 11% moisture content, followed by removing the husks and remaining pulp to obtain green beans (dry, pulped, and unroasted endosperm). Roasting was conducted at temperatures between 180 and 190 °C for 8 min to achieve a medium roast, following the method proposed by Ribeiro et al. [11]. After roasting, the beans were ground using an electric grinder (Di Grano MDR302, JCS Brazil Home Appliances Ltd. Feira de Santana, BA, Brazil) to a medium/fine granulometry with a 32-mesh standard (0.50 mm). The beans were previously frozen to facilitate the grinding of the green beans and prevent residues from adhering to the equipment.

2.4. Obtaining Extracts from the Pulp, Green, and Roasted Beans

The pulp extract was obtained using the methodology proposed by the Adolfo Lutz Institute [12], with minor modifications. Two grams of coffee (3 coffee cherries) from each treatment was added to 10 mL of distilled water. The fruit peel was broken using a glass rod, and the pulp attached to the endosperm was manually removed, followed by filtration through Whatman No. 2 filter paper. To obtain extracts of green and roasted beans by solid–liquid extraction, 1 g of each coffee sample (dry, milled and green, or roasted coffee) was extracted with 100 mL of distilled water at 90 °C and left to stand at room temperature (27 °C ± 0.5 °C) for 20 min, followed by filtration through Whatman No. 2 filter paper, as described by Kim et al. [13].
Extracts were obtained for chromatographic analysis using a modified methodology from Perrone et al. [14]. A total of 0.5 g of ground coffee (green and roasted beans) was suspended in 60 mL of boiling water and stirred at room temperature (25 °C) for 15 min. The mixture was filtered through Whatman No. 2 filter paper and washed with approximately 30 mL of water. The final volume was adjusted to 100 mL with water. The extract was filtered through a 0.45 μm cellulose ester membrane (MilliporeSigma, São Paulo, SP, Brazil).

2.5. Monitoring Mass Loss (ML), pH, Total Soluble Solids (TSSs), Instrumental Color, and Total Reducing Sugar

Mass loss (ML) during the fermentation period was determined by the difference between the coffee samples’ initial and final mass (g). The pH was measured using a digital pH meter (PA200, Marconi Laboratory Equipment Ltd., Piracicaba, SP, Brazil) in extracts obtained from the coffee pulp. Total soluble solids (TSSs) were determined by measuring the refractive index with a portable refractometer (OXD336-1010K, Oxford Precision Plc., London, UK), using the coffee pulp, and were expressed in °Brix. The methods for determining ML, pH, and TSSs followed the AOAC [15] guidelines. The color parameters L* (brightness), a* (red/green intensity), and b* (yellow/blue intensity) of the fermented coffee were measured using a digital colorimeter (CR-10, Konica Minolta Inc., Osaka, FU, Japan) equipped with a C illuminant, an 8 mm aperture, and a standard 10° observer.
The total reducing sugar content in the pulp extract was determined using the DNSA (3,5-dinitrosalicylic acid) method [16], using glucose as a standard. To perform the assay, 100 µL of the pulp extract was added to 1 mL of DNSA reagent. The mixture was homogenized and then subjected to a water bath at 100 °C for 5 min, which was cooled in an ice bath. Absorbance was measured at a wavelength of 540 nm.

2.6. Enzymatic Activity

2.6.1. Polygalacturonase Activity

Polygalacturonase activity was determined by measuring the release of reducing groups. A 1.0% (w/v) citrus pectin solution (Sigma-Aldrich, St. Louis, MO, USA) prepared in 0.1 M acetate buffer (pH 4.5) was incubated at 40 °C for 15 min to stabilize the temperature. Next, 500 µL of enzymatic extract was added to the substrate, and the reaction was incubated at 40 °C for 40 min. After this incubation, 100 µL of the reaction mixture was added to 1 mL of DNSA solution and boiled for 5 min. It was then cooled in an ice bath, and 5.0 mL of distilled water was added. Absorbance was measured at 540 nm using a spectrophotometer, using the method initially proposed by Miller [16]. One unit of activity was defined as the amount of enzyme required to release 1 μmol of galacturonic acid per minute, based on a standard curve established with α-D-galacturonic acid (Molecular mass 212.16, Fluka Chemie AG., Buchs, St. Gallen, Switzerland) as the reducing sugar.

2.6.2. Pectin Lyase Activity

Pectin lyase activity was determined by measuring the increase in absorbance resulting from the formation of 4,5-unsaturated uronic products, as proposed by Albersheim [17]. The reaction mixture consisted of 1.0 mL of a 0.5% (w/v) citrus pectin solution (Sigma-Aldrich, USA) in 0.2 M acetate buffer (pH 4.5) and 1.0 mL of enzyme extract. The mixture was incubated at 40 °C for 1 h. The reaction was stopped by adding 3.5 mL of 0.5 M HCl. One enzyme unit (U) was defined as the amount of enzyme that released one µmol of unsaturated uronic products per minute.

2.7. Determination of Phenolic Content and Antioxidant Capacity Assays

Phenolic compounds in green and roasted coffee beans were quantified using the Folin–Ciocalteu method [18], with gallic acid as the standard. A 0.2 mL aliquot of the sample was added to 1.0 mL of Folin–Ciocalteu reagent and 0.8 mL of sodium carbonate solution (75 g·L−1). The mixture was incubated in a water bath at 37 °C for 30 min. Absorbance was measured at 765 nm. Results were expressed as gallic acid equivalents (mg GAE·g−1).
Antioxidant activity was determined using the DPPH assay, according to the methodology described by Rufino et al. [19]. A 0.1 mL aliquot of the sample was mixed with 3.9 mL of 60 μM DPPH solution, kept at room temperature (25 °C), and protected from light for 30 min. Absorbance was measured at 515 nm. A standard curve was prepared with a Trolox solution, and results were expressed as μM Trolox·g−1.
The ABTS radical cation scavenging assay was performed according to the methodology described by Re et al. [20]. A 50 μL aliquot of the diluted sample was mixed with 950 μL of the diluted ABTS solution (1:90 ABTS: ethanol). The reaction mixture was incubated for 6 min at room temperature (23 °C). Absorbance was measured at 734 nm, and the results were expressed as μM Trolox·g−1.

2.8. Bioactive Compound Assay

The identification and quantification of caffeine, trigonelline, and chlorogenic acid (5-O-caffeoylquinic acid, 5-CQA) were performed by high-performance liquid chromatography (HPLC) with a UV/Vis molecular absorption detector and an Acclaim® 120 Dionex C-18 analytical column (250 nm × 4.6 mm, 5 µm). The mobile phase consisted of 0.3% aqueous formic acid (eluent A) and methanol (eluent B), delivered at a flow rate of 1.0 mL·min−1. The mobile phase composition was 30% B until the end of the run at 15 min. The column was maintained at 40 °C, and the detection wavelengths were 272 nm for caffeine and trigonelline and 325 nm for chlorogenic acid and caffeic acid [14].

2.9. Volatile Compounds by GC-MS-HS

Roasted coffee beans were subjected to gas chromatography–mass spectrometry (GC-MS) to determine their volatile constituents. The analysis was performed using a Shimadzu GC-MS QP2010 SE system with a mass-selective detector, operating at an electron impact of 70 eV, a scan interval of 0.5 s, and fragment ions ranging from m/z 40 to 550 Da. The system was equipped with a Shimadzu OAC 6000 Headspace automatic injector for direct injection of the headspace, and a nonpolar DB-5 fused silica capillary column (30 m × 0.25 mm × 0.25 μm) (J&W Scientific, Folsom, CA, USA). Helium gas was used as the mobile phase, with a flow rate of 1.0 mL.min−1.
The injection system was set with the following parameters: incubation time of 5 min at 80 °C, 250 rpm, syringe pre-purge time of 60 s, injection flow rate of 25 mL.min−1, and a post-injection residence time of 60 s. The temperature was programmed from 40 to 60 °C at a rate of 5 °C.min−1, held at 60 °C for 2 min, and then increased to 230 °C at a rate of 20 °C.min−1, with a final hold at 230 °C for 10 min. The injector and detector temperatures were set to 250 °C. The amounts of each compound were calculated from the GC peak areas in the order of elution from the DB-5 column and expressed as a relative percentage of the total chromatogram area.
The volatile components were identified by comparing the linear retention indices (LRI) calculated relative to a homologous series of C8-C40 n-alkanes using the equation of Van Den Dool and Kratz [21], along with mass spectra. Additionally, the obtained mass spectra were computerized compared with those in the GC-MS data system’s mass spectral library (WILEY 21). The area percentages were obtained from the GC-FID response.

2.10. Statistical Analysis

A two-way ANOVA was applied to evaluate the effect of the interaction between fermentation time and enzyme solution concentration. Means were compared using the Tukey test, with a significance level set at 95% (p < 0.05). Statistical analyses were performed using the SPSS software (v. 21.0), and significance was determined at the 0.05 level. All analyses were conducted in triplicate, and results are expressed as mean ± standard error. Additionally, principal component analysis (PCA) was performed to identify similarities in the bioactive and volatile composition and assess the correlation of physicochemical parameters across different fermentation times and enzyme solution concentrations.

3. Results

3.1. Physicochemical Monitoring During Coffee Fermentation

Monitoring of the fermentation environment revealed a significant increase in the moisture content of the medium as a function of enzyme treatment. The average moisture percentages 60.6 ± 1.29%, 70.6 ± 0.24%, 72.4 ± 0.24%, and 73.6 ± 0.40% for enzyme concentrations of 0, 1, 5, and 10 U·mL−1, respectively, corroborate the gradual mass loss observed over the fermentation period, primarily due to water release. Accordingly, fermented coffee beans without enzyme treatment exhibited the least mass reduction (8.8 ± 0.2%), while those treated with 1, 5, and 10 U·mL−1 of the enzyme solution showed significantly higher losses of 9.11 ± 0.73%, 9.38 ± 0.76%, and 9.40 ± 0.97%, respectively. The internal temperature did not differ significantly between the fermented coffee samples, presenting an average of 27.2 ± 0.8 °C. However, an average increase of 0.9 ± 0.04 °C was observed when comparing the temperature of the fermentation medium with the external environment (approximately 26.5 °C).
Fruit coloration was significantly affected (p < 0.05) by both fermentation time and enzyme solution concentration (Table 1). Coffee fermented without enzyme addition and samples treated with 1 U·mL−1 of enzyme solution exhibited significant fluctuations in the L* parameter (lightness) throughout the fermentation process. In contrast, coffee treated with enzyme concentrations of 5 and 10 U·mL−1 showed a reduction in lightness after 24 h of fermentation, which then remained stable, resulting in a darker appearance early in the process. These samples also exhibited similar trends in the a* parameter (green/red), showing the lowest a* values (indicating a reduction in red coloration) that remained stable throughout fermentation. All samples differed significantly depending on enzyme concentration regarding the b* parameter (yellow/blue). Once again, coffee fermented without enzyme treatment showed considerable fluctuations over time, whereas treated samples demonstrated stable behavior, with a direct correlation between increasing enzyme concentration and decreasing b* values.

3.2. Reducing Sugar and Enzyme Activity

Enzyme treatment strongly impacted the reduction in total soluble solids (TSSs) levels. Fermented coffee cherries without enzyme treatment showed a gradual decrease in TSSs, and those treated with 1 U·mL−1 of enzyme solution exhibited similar reductions. In contrast, samples treated with 5 U·mL−1 experienced a significant decrease (p < 0.05) in TSSs within the first 24 h of fermentation, followed by stability until 96 h and a further significant reduction at 120 h. Samples receiving 10 U·mL−1 of enzyme reached the lowest TSSs levels within the first 24 h and remained stable thereafter. Fermentation time had a stronger influence on pH reduction, with all treatments showing significant decreases (p < 0.05) over the 120 h. However, fruits treated with 5 and 10 U·mL−1 of enzyme solution exhibited more pronounced pH reductions within the first 24 h. Complete TSSs and pH data throughout the coffee fermentation process are presented in Supplementary Table S1.
Reductions in reducing sugar concentrations were proportional to the increase in enzyme solution concentration (Figure 1A). Non-treated coffee exhibited less pronounced reductions, decreasing from 7.05 ± 0.08 to 5.57 ± 0.02 mg glucose·mL−1 between the beginning and end of fermentation. Treatment with 1 U·mL−1 of enzyme solution reduced from 5.60 ± 0.09 to 1.57 ± 0.03 mg glucose·mL−1, with more marked declines observed at 72 h (2.60 ± 0.04 mg glucose·mL−1). In contrast, fruits treated with 5 and 10 U·mL−1 of enzyme solution showed significant reductions within the first 24 h, reaching 3.81 ± 0.14 and 3.78 ± 0.03 mg glucose·mL−1, respectively. These samples did not differ statistically at the end of fermentation, with final concentrations of 1.22 ± 0.05 and 1.16 ± 0.03 mg glucose·mL−1, respectively.
All samples showed significant reductions (p < 0.05) in polygalacturonase activity throughout fermentation (Figure 1B). The highest activity was observed in coffee fermented for 24 h without enzyme treatment (1.47 ± 0.15 U·mL−1), while the lowest activity was recorded after 120 h of fermentation (0.30 ± 0.02 U·mL−1) in fruits treated with 1 U·mL−1 of enzyme solution. At the end of 120 h, no significant differences were observed between treatments. In contrast, pectin lyase activity increased throughout fermentation (Figure 1C), particularly in samples with higher enzyme concentrations. The peaks of pectin lyase activity were 6.02 ± 0.02 and 5.88 ± 0.01 U·mL−1 for the 5 and 10 U·mL−1 concentrations, respectively, and were reached after 120 h of fermentation. The complete data for reducing sugar, polygalacturonase, and pectin lyase activities are presented in Supplementary Table S1.

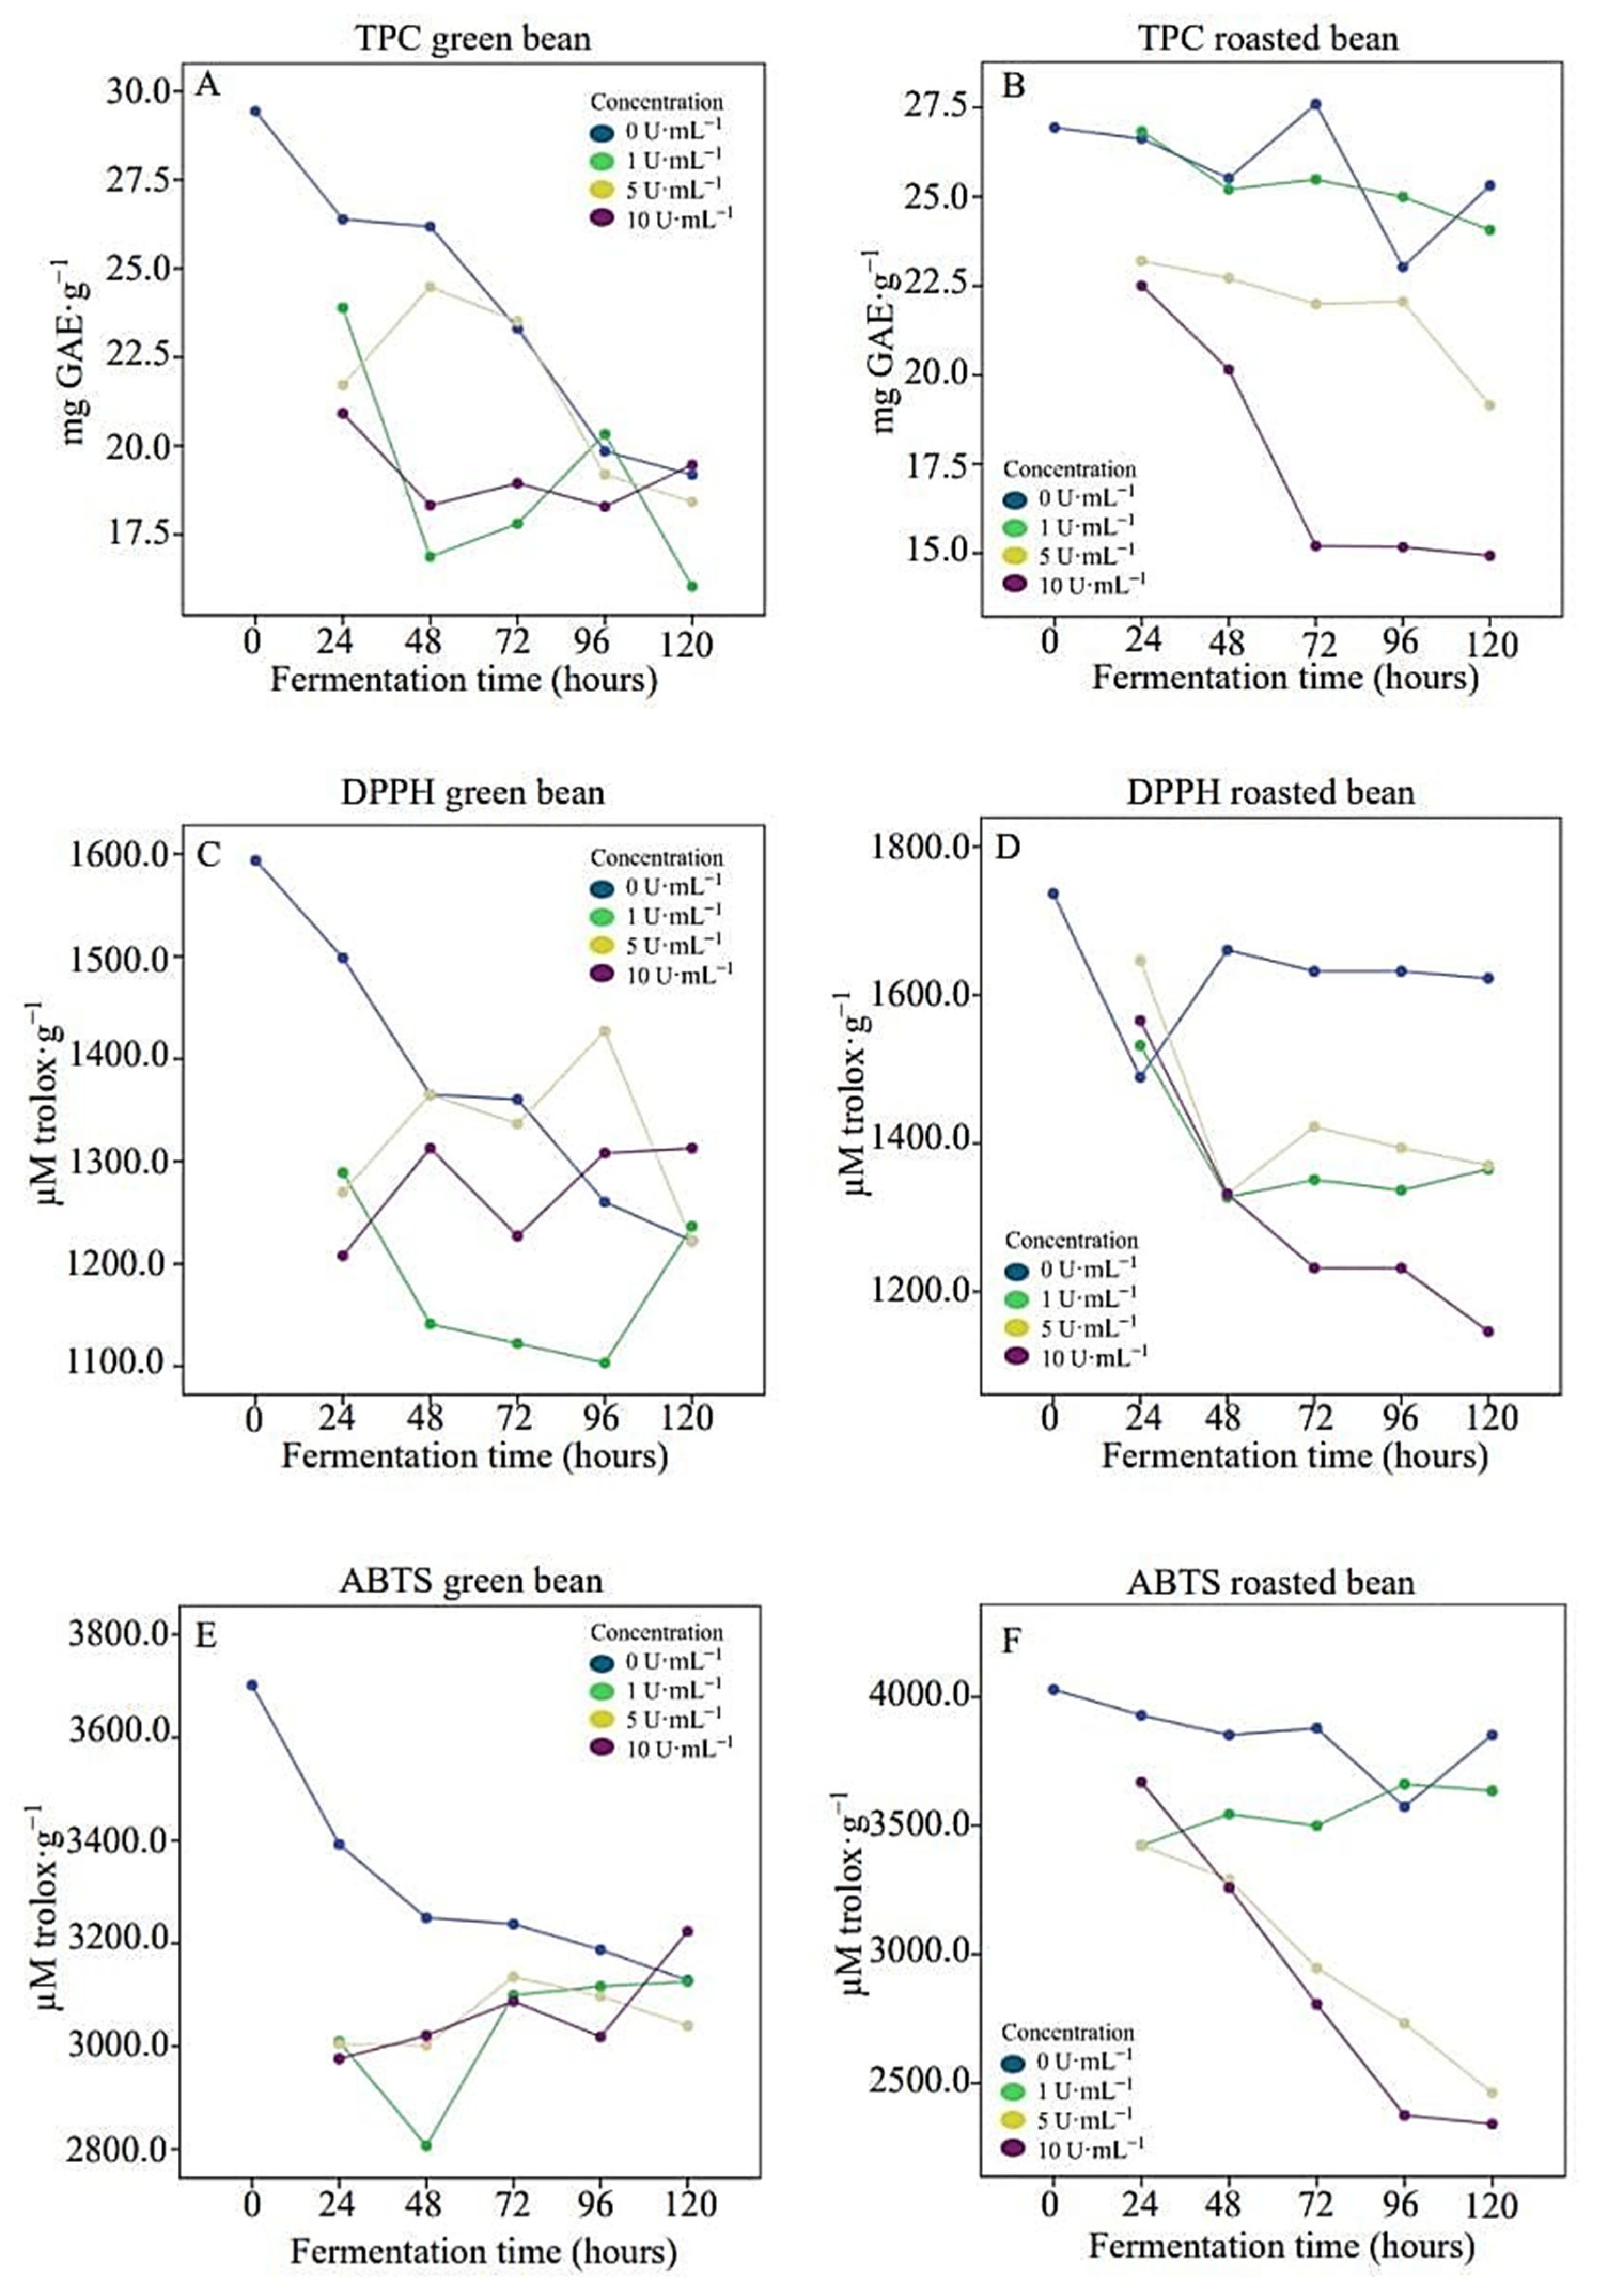
3.3. Phenolic Compounds and Antioxidant Activity

Unfermented green beans had the highest total phenolic content (TPC) of 29.43 ± 0.15 mg GAE·g−1, while fermentation resulted in significant reductions in TPC (p < 0.05) for all treatments (Figure 2A). For roasted beans (Figure 2B), an inversely proportional relationship was observed between enzyme solution concentration and phenolic compound content at the end of 120 h of fermentation, with values of 25.31 ± 0.09, 24.07 ± 0.07, 19.15 ± 0.03, and 14.93 ± 0.07 mg GAE·g−1 for concentrations of 0, 1, 5, and 10 U·mL−1, respectively. In parallel, the highest antioxidant activity values were observed in non-fermented beans, with DPPH values of 1593.81 ± 19.22 and 1736.67 ± 12.60 µM trolox·g−1 for green and roasted beans, respectively (Figure 2C,D). The highest ABTS values were 3701.90 ± 6.30 and 4028.10 ± 8.25 µM trolox·g−1 for green and roasted beans, respectively (Figure 2E,F). Consistent with TPC values, fermentation also reduced the antioxidant potential of the samples, with the lowest values observed for roasted beans treated with 10 U·mL−1 and fermented for 120 h: DPPH (1146.19 ± 20.25 µM trolox·g−1) and ABTS (2342.38 ± 12.16 µM trolox·g−1) radicals. Complete data for TPC and antioxidant activity can be found in Supplementary Table S2.

3.4. Bioactive Compounds by HPLC

The bioactive compounds caffeine, trigonelline, and chlorogenic acid (5-O-caffeoylquinic acid, 5CQA) were influenced by fermentation time, enzyme concentration, and roasting (Table 2). The highest caffeine content in green beans was observed in samples treated with 5 U·mL−1 after 24 h of fermentation (742.51 ± 16.7 mg·100g−1). Enzyme treatment at a concentration of 10 U·mL−1 resulted in the lowest caffeine content among green beans (487.83 ± 21.5 mg·100g−1) after 120 h of fermentation. In contrast, roasting positively affected caffeine levels, with roasted beans showing higher values than green beans across all treatments. For roasted beans, the highest caffeine levels were reached within the first 24 h of fermentation, with no significant differences (p > 0.05) observed among samples treated with enzyme concentrations of 0, 1, and 5 U.mL−1, yielding values of 894.40 ± 52.4, 902.38 ± 10.3, and 890.18 ± 19.1 mg·100g−1, respectively.
Trigonelline decreased significantly with fermentation time, with the highest trigonelline concentration in green beans observed in unfermented coffee (1028.75 ± 31.4 mg·100g−1). Treatment with an enzyme solution at a concentration of 10 U·mL−1 resulted in the greatest reduction in trigonelline concentration throughout fermentation, reaching the lowest level after 120 h (614.45 ± 12.7 mg·100g−1). Depending on the enzyme concentration, roasting influenced trigonelline levels either positively or negatively. For roasted beans, the highest trigonelline values were obtained in beans fermented for 24 and 48 h without enzyme treatment (1047.48 ± 35.2 and 1069.03 ± 38.8 mg·100g−1, respectively).
The 5CQA levels decreased significantly (p < 0.05) with fermentation time, with the highest values observed in unfermented green beans (423.46 ± 40.3 mg·100g−1). The influence of enzyme treatment showed dynamic behavior in green beans, with the lowest 5CQA values found in beans treated with 10 U·mL−1 throughout the 120 h of fermentation. However, beans with enzyme treatment at 5 U·mL−1 exhibited higher 5CQA concentrations than those treated with 1 U·mL−1. Additionally, a direct relationship was observed for roasted beans between increasing enzyme solution concentration and a reduction in 5CQA levels. Thus, the combination of roasting and enzyme treatment at concentrations of 5 and 10 U·mL−1 reduced 5CQA levels to undetectable levels after 120 h of fermentation.

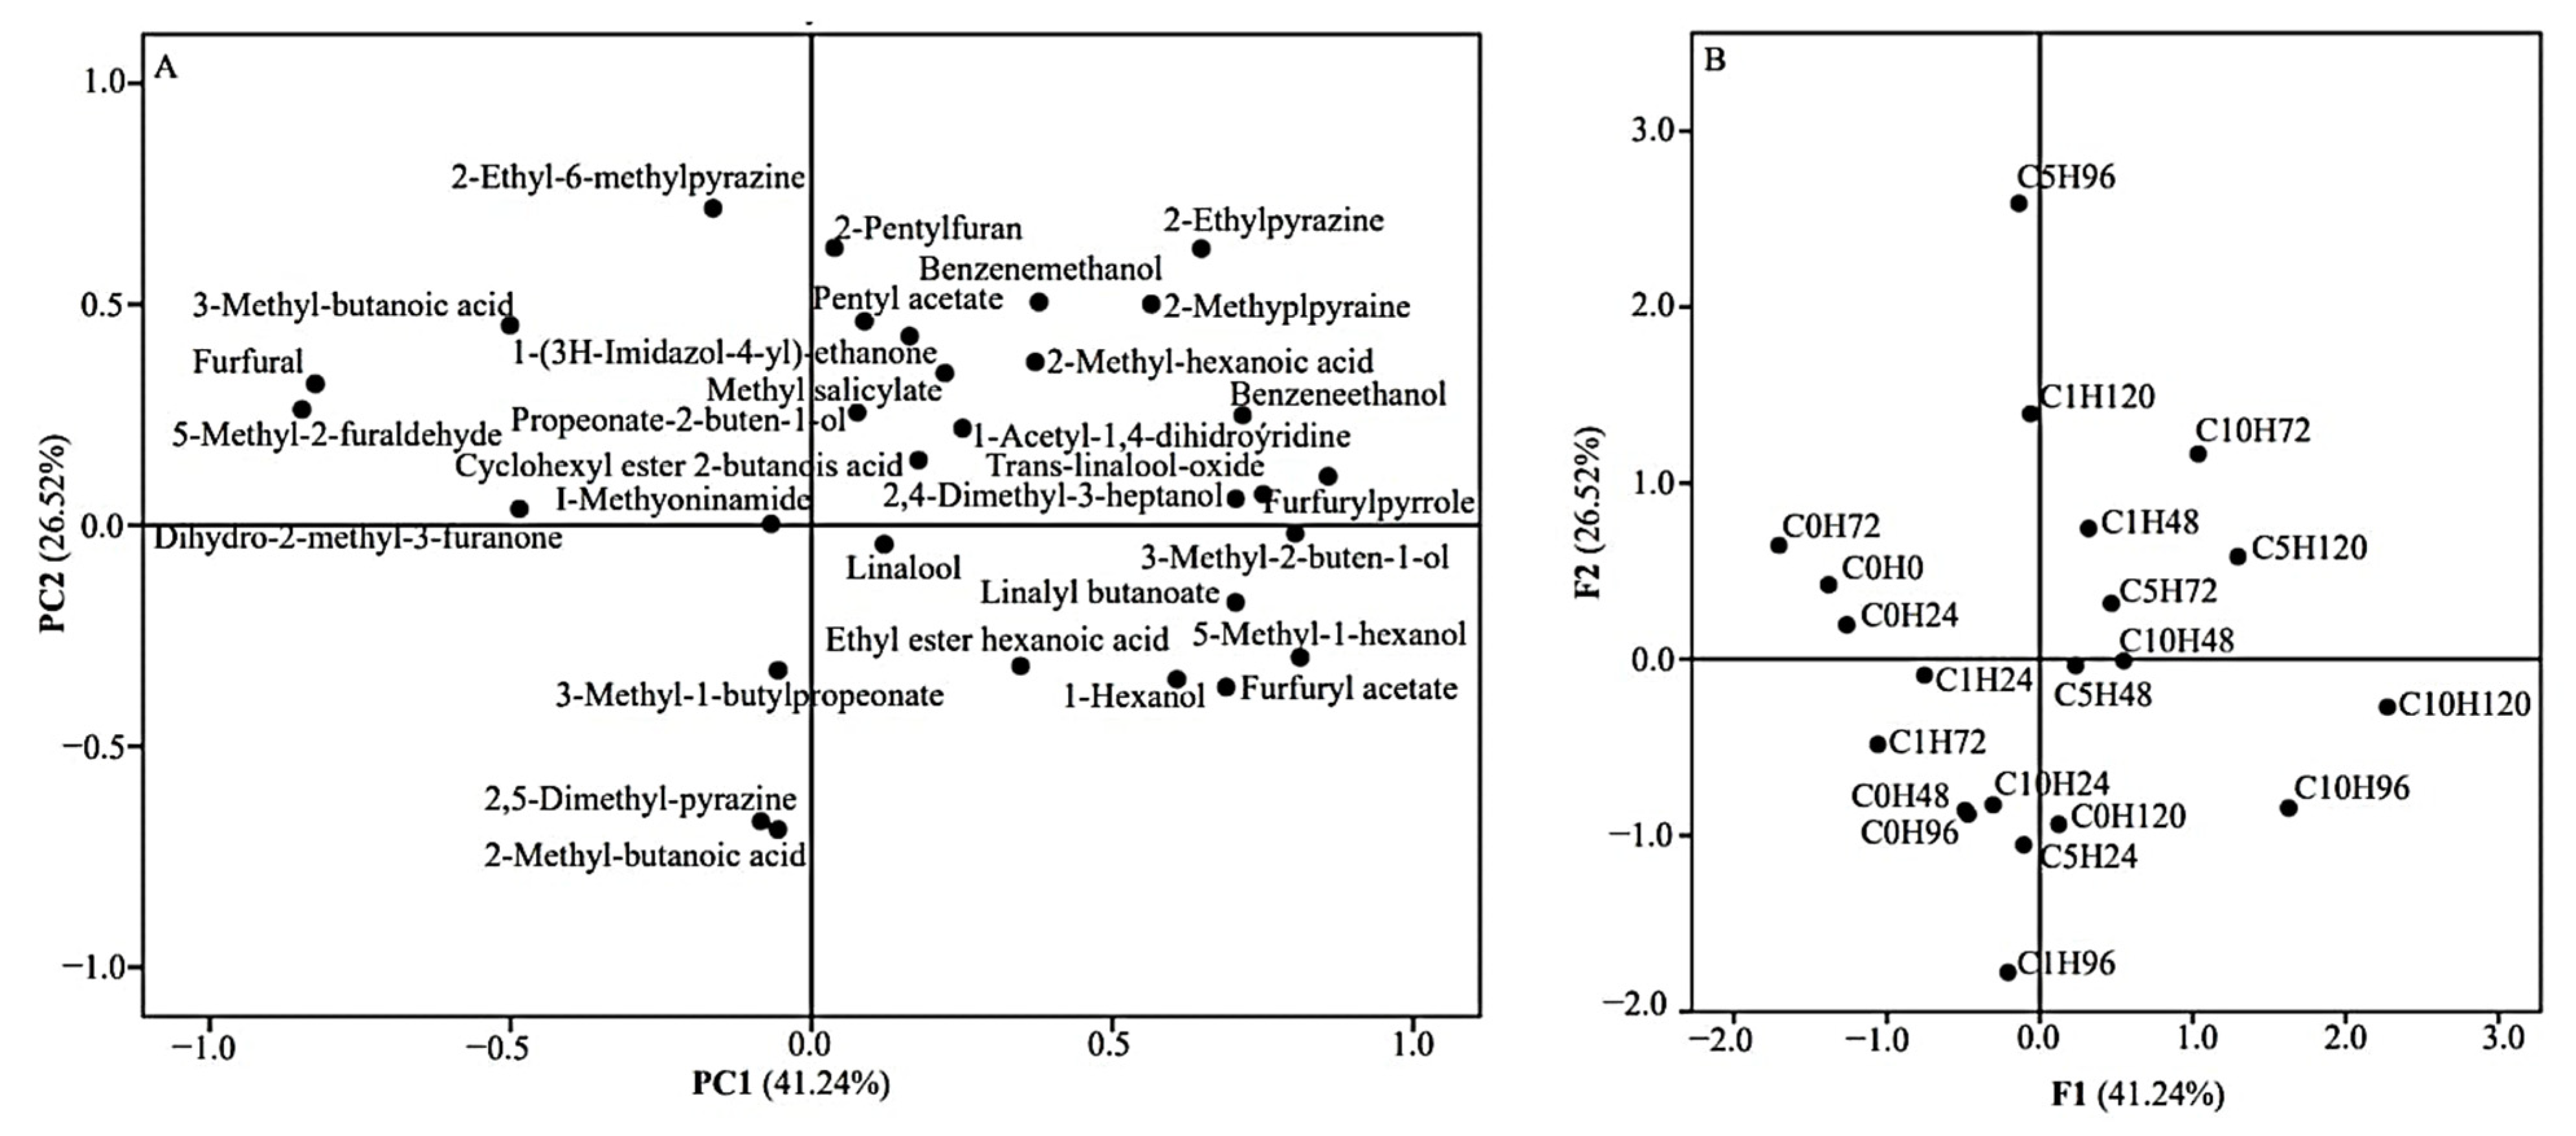
3.5. Volatile Composition

Considering the impact of the Maillard reaction on the formation of volatile compounds, the volatile composition of roasted beans was studied. Thirty-one compounds were identified in both fermented and unfermented coffee beans, primarily distributed across the pyrazine, furan, acid, alcohol, terpene, and ester groups. Enzymatic treatment positively influenced the formation of the volatile profile, with coffee treated at a concentration of 10 U·mL−1 exhibiting the greatest variety of compounds (Table 3). Notably, treatments C10H48 (enzymatic concentration of 10 U·mL−1 and 48 h of fermentation), C10H72 (enzymatic concentration of 10 U·mL−1 and 78 h of fermentation), and C10H96 (enzymatic concentration of 10 U·mL−1 and 96 h of fermentation) presented 26, 27, and 26 volatile compounds, respectively. The volatile profile of the fermented beans treated with 10 U·mL−1 was enriched with the alcohols benzeneethanol, benzenemethanol, 3-methyl-2-buten-1-ol, propanoate-2-buten-1-ol, and 2,4-dimethyl-3-heptanol; the terpene trans-linalool oxide; and the furan 2-pentylfuran.
For the beans treated with enzyme solution at a concentration of 5 U.mL−1 (Table 4), the treatments C5H72 (enzymatic concentration of 5 U·mL−1 and 72 h of fermentation) and C5H120 (enzymatic concentration of 5 U·mL−1 and 120 h of fermentation) stood out, each exhibiting 23 volatile compounds. In contrast, for beans treated with enzyme solution at a concentration of 1 U·mL−1 (Table 5), the treatments C1H48 (enzyme concentration of 1 U·mL−1 and 48 h of fermentation) and C1H120 (enzyme concentration of 1 U·mL−1 and 120 h of fermentation) stood out, with a volatile profile composed of 21 and 22 compounds, respectively. These results demonstrated an increase in the diversity of volatile compounds as the enzyme solution concentration increased.
Unfermented beans (C0H0) and beans fermented without enzyme treatment (Table 6) presented a less diverse volatile profile, with 18 compounds for the C0H0 and C0H72 treatments (enzyme concentration of 0 U·mL−1 and 72 h of fermentation) and 19 compounds for the C0H96 treatment (enzyme concentration of 0 U·mL−1 and 96 h of fermentation), representing the best results for untreated beans. Additionally, principal component analysis (PCA), explaining 67.76% of the total data variation, revealed a correlation between the distribution of volatile compounds (Figure 3A) and the different treatments applied (Figure 3B). The overlapping of the graphs places the samples C1H48, C1H120, C5H72, C5H120, C10H48, and C10H72 in the regions of highest compound density, reinforcing the greater impact of these treatments on the formation of volatile compounds in fermented coffee.

4. Discussion

The increase in moisture within the fermentation medium is closely related to the degradation of the water and pectin-rich mucilage [22]. In this context, the depolymerization of pectin in the cell wall leads to the release of water and softening of the plant tissue [4]. Treatment with pectinases, therefore, favored the degradation of pectin, resulting in a greater release of water and a higher mass loss as the enzyme solution concentration increased, with average percentages of 8.8, 9.1, 9.3, and 9.4% for beans treated with 0, 1, 5, and 10 U·mL−1 of enzymatic solution, respectively. Additionally, the microbial metabolism of CO2 [2] further contributed to the mass loss of the beans. According to Haile and Kang [23], mucilage degradation helps reduce the drying time required for coffee beans. In previous studies evaluating the influence of fermentation time using the SIAF method, an average percentage reduction of 6.1% was observed in the mass of coffee fermented for 20 days [24]. Thus, enzyme treatment presents technological improvements with the potential to reduce processing time.
Small increases in the temperature of the fermentation medium can be attributed to enzymatic activity and microbial metabolism, which promote exothermic reactions responsible for the temperature rise during the bioprocess [25]. However, the temperature of the fermentation medium did not exceed 28.5 °C, remaining within the growth range of mesophilic microorganisms, characteristic of spontaneous coffee fermentation. Similar results were obtained by Cassimiro et al. [26]. Evaluating coffee, the authors observed variations of up to 2 °C, with the maximum temperature reaching 26 °C. Additionally, the observed temperatures were within the activity range of pectin lyase and polygalacturonase. According to Yadav et al. [5], pectin lyase from Aspergillus sp. is stable in the 10–50 °C range. Similarly, Souza et al. [27] also observed stability in the range of 10–50 °C when evaluating the stability of fungal polygalacturonase.
In general, coffee fruits darken during fermentation. Pigment degradation is a natural process resulting from fruit metabolism and the action of endogenous enzymes, with enzymatic darkening primarily caused by polyphenol oxidases, leading to melanoidin formation [28]. Moreover, the loss of the red and yellow hues of ripe coffee, resulting from pigments such as anthocyanins, carotenoids, and flavonoids, may indicate the action of pectinases on these compounds. Pectinolytic enzymes can be used for clarification due to pigment degradation [4]; in this context, the degradation of anthocyanins, flavonoids, and carotenoids may occur alongside the formation of dark pigmentation. This behavior seems to be promoted by increasing enzyme concentration.
A positive correlation was observed between the increase in enzyme solution concentration and the reduction in TSSs levels. These results suggest the degradation of sugars by enzyme treatment and the action of the epiphytic microbiota involved in mixed fermentation. The synergistic action between the endogenous pectinases of the fruit, enzymes from the mixed microbiota, and enzyme treatment may enhance sugar degradation, reducing the levels of total soluble solids. Significant variations in soluble solids contents were also observed by Cassimiro et al. [26] with reductions from 16 to 8 °Brix as a function of coffee fermentation. Consequently, the breakdown of sugars leads to the production of organic acids, which lower the pH of the fermentation medium. Additionally, consistent with the pH and TSSs results, reducing sugar levels decreased during fermentation. The action of pectinases releases galacturonic acid residues, which should increase sugar concentrations throughout fermentation. However, according to Elhalis et al. [29], during coffee bioprocessing, reducing sugars are consumed by microorganisms, producing organic acids and reducing pH. Corroborating the results of this study, Elhalis et al. [9] observed significant reductions in the pH of wet-fermented coffees added with pectinase.
Although the temperature and pH conditions of the fermentation medium allow the stability of the enzymes studied, they are not optimal for enzymatic activity. Aspergillus aculeatus pectinases show optimal activity at 50 °C and pH 5 [30]. Additionally, polygalacturonase has an optimal temperature range of 30–50 °C, with a near-neutral pH, while pectin lyase functions optimally between 40 and 50 °C at a pH of 5.5 [31]. Thus, combined with the competitive characteristics of bioprocess, this may explain the reductions in polygalacturonase activity. At the time of enzyme treatment, the pH of the fruit was 5.23 ± 0.03, a value close to the optimal pH for pectin lyase (Figure 1). As a result, pectin lyase activity was significantly higher compared to polygalacturonase activity. Consequently, the high activity of pectin lyase may reduce substrate availability, contributing to the inhibition of polygalacturonase activity.
The analysis of phenolic compounds demonstrated dynamic synthesis and degradation reactions throughout the fermentation of coffee subjected to enzymatic treatment, directly influencing the antioxidant potential. The action of pectinases on polysaccharides breaks down the cell wall matrix, releasing polyphenols and increasing antioxidant activity [32]. In this context, the higher TPC values observed in unfermented beans and in those fermented for 24 h corroborate the higher polygalacturonase activity observed in the early stages of fermentation. However, subsequent reductions in TPC levels may be associated with the oxidation of phenolic substances due to microbial metabolism [33]. Evaluating the influence of different microbial strains on coffee fermentation, Abduh et al. [34] reported a similar behavior, with higher phenolic compound levels in the first moments of fermentation, followed by consecutive reductions. The authors attribute this behavior to different species presenting different optimal fermentation times.
Furthermore, the availability of phenolic compounds may be limited by their interaction with pectin fragments released by the action of pectinases during fermentation [32]. Given the direct correlation between phenolic content and antioxidant activity, the oscillatory behavior observed for the DPPH and ABTS variables can be understood. The action of pectinases alters the structure of phenolics, which can exist in free or bound forms, influencing the antioxidant potential [35]. Also, the thermolabile nature of some phenolic compounds may result in lower antioxidant activity after coffee roasting. According to Silva et al. [36], some phenolic compounds are unstable under processing conditions, such as increased temperature. Furthermore, the metabolism of specific crops may reduce the total phenolic content but increase the concentration of volatile phenolics [35], which would be lost during roasting.
Analysis of bioactive compounds revealed that enzyme treatment can contribute to an increase or decrease in caffeine concentration, depending on the fermentation time and the concentration of the enzyme solution. Pectinase acts extracellularly in plant tissue by breaking down cell wall structures, while caffeine synthesis occurs intracellularly as part of a secondary metabolic pathway [37], so there is no evidence that pectinases interfere with caffeine synthesis. Thus, a possible indirect influence could be a metabolic response to stress caused by the action of exogenous pectinases.
During fermentation, reductions in caffeine concentrations occur due to the action of bacteria capable of converting caffeine into xanthines and dimethylxanthines [38]. On the other hand, the mechanisms of caffeine biosynthesis during fermentation remain unclear in the scientific literature [26]. However, possible pathways include the possibility that some microorganisms possess the genetic information necessary for caffeine biosynthesis or that enzymes secreted by the fermentative microbiota act as catalysts for caffeine production [39]. Additionally, roasted coffee presented higher levels of caffeine, which agrees with the results obtained by Cassimiro et al. [26] and Bressani et al. [40]. According to these authors, the thermostable nature of caffeine is responsible for its high levels after roasting. Thus, roasting results in mass loss without caffeine degradation, so that caffeine is more concentrated in roasted beans. The presence of caffeine is associated with one of the primary flavor descriptors of coffee and may be responsible for up to 30% of the bitterness of the beverage [41].
Reductions in the concentrations of non-volatile bioactive compounds, such as trigonelline and chlorogenic acid, showed a strong relationship with the increase in the enzyme concentration. Thus, the results suggest that the enzymatic treatment favors the degradation of these compounds, corroborating the results obtained by Tai et al. [8], where the authors observed that the addition of a crude pectinase extract during coffee fermentation significantly reduced the concentrations of 5CQA. However, the mechanism of action of pectinase on chlorogenic acid has not yet been elucidated. However, the action of pectinases can accelerate the degradation processes of the plant cell wall, favor the release of water, and cause losses of soluble compounds such as caffeine and trigonelline. In addition, the degradation of the cell wall can facilitate the action of oxidative enzymes capable of partially degrading phenolic compounds such as 5CQA.
Additionally, the presence of different yeasts promotes reductions in the concentrations of trigonelline and chlorogenic acid [42]. These compounds are crucial for the formation of the sensory profile of coffee, as they act as precursors of several volatile compounds [43]. Therefore, the influence of enzymatic treatment in the reduction in trigonelline and chlorogenic acid concentrations represents a promising result with potential benefits for the sensory quality of coffee. According to Borém et al. [43], lower levels of trigonelline and chlorogenic acids correlate with higher sensory scores in coffee analysis. During coffee roasting, several reactions simultaneously co-occur with the Maillard reaction, including the degradation of bioactive compounds such as trigonelline and chlorogenic acids. As the temperature increases, trigonelline can be converted into vitamin B3 and volatile compounds, while chlorogenic acids can be converted into lactones or incorporated into melanoidins [38].
Thus, the sum of factors such as enzymatic action, fermentation time with the action of various microbial strains, and the influence of temperature on thermolabile compounds can explain the reduction to non-detectable levels in chlorogenic acids in roasted beans treated with 10 U·mL−1 and fermented for 96 and 120 h. Corroborating these results, Tai et al. [8] obtained more significant reductions in 5CQA concentrations in wet-fermented coffees with added enzymatic extract when compared to fermentation without enzymatic treatment over 24 h of fermentation.
Enzyme treatment at a concentration of 10 U·mL−1 proved promising in enriching the volatile compound profile, mainly contributing to the formation of alcohols. Alcohol synthesis during fermentation is associated with yeast metabolism, which degrades sugars or triggers reactions favored by the activity of FAD+ [44]. The presence of benzoic alcohols (benzeneethanol and benzenemethanol) in beans treated with an enzyme solution at 10 U·mL−1 contributes to the development of fruity, sweet, floral, and chocolate aromas [44]. The correlation between samples C10H48 and C10H72 and the region of highest volatile density, observed in the PCA, also indicates the importance of pyrazine group compounds (2-ethylpyrazine and 2-methylpyrazine) in the volatile composition of these samples. Pyrazines, primarily formed during the Maillard reaction and Strecker degradation, contribute to aromas such as green grass, raw vegetables, potatoes, or pineapple [45]. The diversified volatile composition in coffees treated with an enzyme solution at 10 U·mL−1 corroborates the results for bioactive compounds such as trigonelline and chlorogenic acid (5CQA), where higher degradation rates favor the formation of volatiles.
The overlay of the PCA graphs (Figure 3) also shows that the samples C5H72 and C5H120 are highly correlated with the region of most significant clustering of volatile compounds. Similarly, samples treated with enzyme solutions at a concentration of 5 U·mL−1 showed significant degradation of trigonelline and chlorogenic acid, influencing the volatile composition. These samples differed from beans fermented without enzyme treatment by the presence of volatile compounds such as 2-ethylpyrazine, which imparts nutty, buttery, and woody aromas [46], and trans-linalool oxide, which contributes to floral aromas [47]. Compared to beans treated with an enzyme solution at 1 U·mL−1, the 5 U·mL−1 treatment presented 2-pentylfuran, a compound associated with floral, spicy, cereal, nutty, and vegetable aromas [48].
For the beans treated with 1 U·mL−1, alcohols such as benzeneethanol, benzenemethanol, and propanoate-2-buten-1-ol, along with compounds like 2-methyl hexanoic acid and ethyl-pyrazine, were identified. These were not present in the beans fermented without enzyme treatment. These results suggest that the use of exogenous pectinases, even at the lowest concentrations tested, promotes the formation of compounds of interest for the volatile composition of coffee. In contrast, unfermented beans (C0H0) and beans fermented for 24 h without enzyme treatment (C0H24) had higher levels of furfural, associated with sweet, caramel, and nutty aromas [49], and 5-Methyl-2-furaldehyde, which is linked to spicy and sweet aromas [50]. Additionally, all samples exhibited high levels of 2-methyl-Butanoic acid, a volatile compound that contributes to fruity, acidic, and fermented aromas [51].
Several studies have reported the influence of fermentation on the modulation of volatile composition. Mota et al. [7] observed that the SIAF method modified the concentration of volatiles, and the sensory score was strongly related to the presence of aldehydes. Tang et al. [52] observed that solid-state fermentation can modulate the volatile composition, favoring the formation of pyrazines, pyrroles, furan, and pyridines. These results corroborate the impact of the SIAF method on the volatile composition of coffee beans. However, the unprecedented findings presented in this study point to a positive contribution due to the enzymatic treatment. Therefore, the different fermentation times and various enzymatic treatments applied in this study have the potential to enhance the sensory quality of coffee, enriching the volatile composition directly related to the sensory attributes of the beverage.

5. Conclusions

Enzymatic treatment effectively accelerated changes in the fermentation medium, catalyzing the breakdown of reducing sugars, water release, acidification of the medium, and degradation of coffee fruit pigments. Simultaneously, it influenced the antioxidant potential of the beans, promoting the degradation of phenolic compounds and, consequently, reducing their antioxidant activity. In addition, supplementation with more concentrated enzymatic solutions favored the degradation of bioactive compounds, such as trigonelline and chlorogenic acid (5CQA).
The different treatments resulted in several volatile compound profiles as a result of supplementation with higher concentrations of enzymatic solutions. The variable volatile profiles suggest that enzymatic treatment with different concentrations allows modulation of the chemical composition of the beans, offering potential for coffee fermentation processes that aim to obtain specific volatile profiles that meet diverse consumer preferences. Furthermore, the application of enzymes through spraying has shown promise, allowing the action of endogenous enzymes as a catalyst for coffee bioprocessing.

Supplementary Materials

The following supporting information can be downloaded at: https://www.mdpi.com/article/10.3390/fermentation11070361/s1, Table S1: Physical–chemical parameters of fermented coffee at different times and with enzymatic treatment; Table S2: Total phenolic compounds (TPCs) and antioxidant activity by DPPH and ABTS radicals for green and roasted beans throughout fermentation.

Author Contributions

Conceptualization, M.E.d.S.S., S.P.d.S. and T.S.P.; methodology, M.E.d.S.S., R.L.d.O., S.P.d.S., M.M.d.M. and C.A.G.d.C.; software, M.E.d.S.S., M.M.d.M. and C.A.G.d.C.; validation, T.S.P., S.P.d.S. and M.E.d.S.S.; formal analysis, M.E.d.S.S., M.M.d.M. and C.A.G.d.C.; investigation, M.E.d.S.S., S.P.d.S. and T.S.P.; resource, T.S.P.; data curation, M.E.d.S.S., S.P.d.S. and T.S.P.; writing—original draft preparation, M.E.d.S.S.; writing—reviewing and editing, M.E.d.S.S., R.L.d.O., S.P.d.S. and T.S.P.; visualization, R.L.d.O., S.P.d.S. and T.S.P.; supervision, T.S.P.; project administration, T.S.P.; funding acquisition, T.S.P. All authors have read and agreed to the published version of the manuscript.

Funding

The authors acknowledge the “Fundação de Amparo à Ciência e Tecnologia do Estado de Pernambuco” (FACEPE, Pernambuco, Brazil) for financial support (APQ-1137-5.07/22 and APQ-0726-5.07/21) with scholarships to the first author and for the financial support through the project (grant IBPG-1544-2.00/21). Tatiana Porto is grateful to the Brazilian National Council for Scientific and Technological Development (CNPq, Brazil) for the financial support (405327/2021-8) and Research Productivity Scholarship (315249/2021–8). The authors are grateful to the Coordination for the Improvement of Higher Education Personnel (CAPES, Brazil; 001) for the fellowship and financial support that made this research possible.

Institutional Review Board Statement

Not applicable.

Informed Consent Statement

Not applicable.

Data Availability Statement

The original contributions presented in this study are included in the article and Supplementary Materials. Further inquiries can be directed to the corresponding authors.

Acknowledgments

The first author would like to thank the FACEPE (Foundation for Science and Technology Support of the State of Pernambuco, Brazil) for the doctoral scholarship and financial support that made this research possible. All authors thank the Federal University of Agreste de Pernambuco (UFAPE) and the Federal Rural University of Pernambuco for the research infrastructure.

Conflicts of Interest

The authors declare no conflicts of interest.

Abbreviations

The following abbreviations are used in this manuscript:
SIAFSelf-induced anaerobic fermentation
5CQA5-O-caffeoylquinic acid
MSMass loss
TSSsTotal soluble solids
DNSADinitrosalicylic acid
TPCTotal phenolic content
PCAPrincipal component analysis
C0H0Enzymatic concentration of 0 U·mL−1 and 0 h of fermentation
C0H24Enzymatic concentration of 0 U·mL−1 and 24 h of fermentation
C0H48Enzymatic concentration of 0 U·mL−1 and 48 h of fermentation
C0H72Enzymatic concentration of 0 U·mL−1 and 72 h of fermentation
C0H96Enzymatic concentration of 0 U·mL−1 and 96 h of fermentation
C0H120Enzymatic concentration of 0 U·mL−1 and 120 h of fermentation
C1H24Enzymatic concentration of 1 U·mL−1 and 24 h of fermentation
C1H48Enzymatic concentration of 1 U·mL−1 and 48 h of fermentation
C1H72Enzymatic concentration of 1 U·mL−1 and 72 h of fermentation
C1H96Enzymatic concentration of 1 U·mL−1 and 96 h of fermentation
C1H120Enzymatic concentration of 1 U·mL−1 and 120 h of fermentation
C5H24Enzymatic concentration of 5 U·mL−1 and 24 h of fermentation
C5H48Enzymatic concentration of 5 U·mL−1 and 48 h of fermentation
C5H72Enzymatic concentration of 5 U·mL−1 and 72 h of fermentation
C5H96Enzymatic concentration of 5 U·mL−1 and h96 h of fermentation
C5H120Enzymatic concentration of 5 U·mL−1 and 120 h of fermentation
C10H24Enzymatic concentration of 10 U·mL−1 and 24 h of fermentation
C10H48Enzymatic concentration of 10 U·mL−1 and 48 h of fermentation
C10H72Enzymatic concentration of 10 U·mL−1 and 72 h of fermentation
C10H96Enzymatic concentration of 10 U·mL−1 and 96 h of fermentation
C10H120Enzymatic concentration of 10 U·mL−1 and 120 h of fermentation

References

  1. Molet-Rodríguez, A.; Méndez, D.A.; López-Rubio, A.; Fabra, M.A.; Martínez-Sanz, M.; Salvia-Trujillo, L.; Martín-Belloso, O. Emulsification capacity of pectin extracts from persimmon waste: Effect of structural characteristics and pectin-polyphenol interactions. Food Hydrocoll. 2025, 158, 110553. [Google Scholar] [CrossRef]
  2. Ferreira, L.J.C.; Gomes, M.S.; Oliveira, L.M.; Santos, L.D. Coffee fermentation process: A review. Food Res. Int. 2023, 169, 112793. [Google Scholar] [CrossRef] [PubMed]
  3. Pereira, G.V.M.; Sampaio, V.M.; Wiele, N.; Vale, A.S.; Neto, D.P.C.; Souza, A.F.D.; Santos, D.V.N.; Ruiz, I.R.; Rogez, H.; Soccol, C.R. How yeast has transformed the coffee market by creating new flavors and aromas through modern post-harvest fermentation systems. Trends Food Sci. Technol. 2024, 151, 104641. [Google Scholar] [CrossRef]
  4. Zafar, T.; Hadri, S.H.; Imram, M.; Asad, M.J.; Saba; Athar, I.; Mahmood, T. Production, purification and characterization of endo-polygalacturonase using novel strain of Bacillus pumillus through RSM. Process Biochem. 2024, 146, 188–194. [Google Scholar] [CrossRef]
  5. Yadav, K.; Dwivedi, S.; Gupta, S.; Tanveer, A.; Yadav, S.; Yadav, P.K.; Anand, G.; Yadav, D. Recent insights into microbial pectin lyases: A review. Process Biochem. 2023, 134, 199–217. [Google Scholar] [CrossRef]
  6. Sánchez-Riaño, A.M.; Vega-Oliveros, C.; Ladino-Garzón, W.L.; Orozco-Blanco, D.A.; Bahamón-Monje, A.F.; Gutiérrez-Guzmán, N.; Amorocho-Cruz, C.M. Effects of cherries sanitization methods and fermentation times on quality parameters of coffee beans. Heliyon 2024, 10, e33508. [Google Scholar] [CrossRef] [PubMed]
  7. Mota, M.C.B.; Batista, N.N.; Dias, D.R.; Schwan, R.F. Impact of microbial self-induced anaerobiosis fermentation (SIAF) on coffee quality. Food Biosci. 2022, 47, 101640. [Google Scholar] [CrossRef]
  8. Tai, E.S.; Hsieh, P.C.; Sheu, S.C. Effect of polygalacturonase and feruloyl esterase from Aspergillus tubingensis on demucilage and quality of coffee beans. Process Biochem. 2014, 49, 1274–1280. [Google Scholar] [CrossRef]
  9. Elhalis, H.; Cox, J.; Zhao, J. Yeasts are essential for mucilage degradation of coffee beans during wet fermentation. Yeast 2023, 40, 425–436. [Google Scholar] [CrossRef]
  10. Febrianto, N.A.; Zhu, F. Coffee bean processing: Emerging methods and their effects on chemical, biological and sensory properties. Food Chem. 2023, 412, 135489. [Google Scholar] [CrossRef]
  11. Ribeiro, L.S.; Miguel, M.G.C.P.; Evangelista, S.R.; Martins, P.M.M.; Mullem, J.V.; Belizario, M.H.; Schwan, R.F. Behavior of yeast inoculated during semi-dry coffee fermentation and the effect on chemical and sensorial properties of the final beverage. Food Res. Int. 2017, 92, 26–32. [Google Scholar] [CrossRef]
  12. Adolfo Lutz Institute. Analytical Standards of the Adolfo Lutz Institute, 4th ed.; Adolfo Lutz Institute: São Paulo, Brazil, 2008. [Google Scholar]
  13. Kim, W.; Kim, S.Y.; Kim, D.O.; Kim, B.Y.; Baik, M.Y. Puffing, a novel coffee bean processing technique for the enhancement of extract yield and antioxidant capacity. Food Chem. 2018, 240, 594–600. [Google Scholar] [CrossRef] [PubMed]
  14. Perrone, D.; Donangelo, C.; Farah, A. Fast simultaneous analysis of Caffeine, Trigonelline, nicotinic acid and sucrose in coffee by liquid chromatography-mass spectrometry. Food Chem. 2008, 110, 1030–1035. [Google Scholar] [CrossRef] [PubMed]
  15. AOAC. Official Methods of Analysis of AOAC International, 20th ed.; AOAC International: Gaithersburg, MD, USA, 2016. [Google Scholar]
  16. Miller, G.L. Use of dinitrosalicylic acid reagent for determination of reducing sugar. Anal. Chem. 1959, 31, 426–428. [Google Scholar] [CrossRef]
  17. Albersheim, P. Pectin lyase from fungi. Meth. Enzymol. 1966, 8, 628–631. [Google Scholar] [CrossRef]
  18. Singleton, V.L.; Orthofer, R.; Raventos, R.M.L. Analysis of total phenols and other oxidation substrates and antioxidants by means of Folin-Ciocalteau reagent. Sci. Hortic. 1999, 299, 152–178. [Google Scholar] [CrossRef]
  19. Rufino, M.S.M.; Alves, R.E.; Brito, E.S.; Moraes, S.M.; Sampaio, C.G.; Jimenez, J.P.; Saura-Calixto, F.D. Scientific Methodology: Determination of Total Antioxidant Activity in Fruits by DPPH Free Radical Capture. 2007. Available online: https://ainfo.cnptia.embrapa.br/digital/bitstream/CNPAT/10224/1/Cot_127.pdf (accessed on 5 November 2024).
  20. Re, R.; Pellegrini, N.; Proteggente, A.; Pannala, A.; Yang, M.; Rice-Evans, C. Antioxidant activity applying an improved ABTS radical cation decolorization assay. Free Radic. Biol. Medic. 1999, 26, 1231–1237. [Google Scholar] [CrossRef]
  21. Vandendool, H.; Kratz, P.D. A generalization of the retention index system including linear temperature programmed gas-liquid partition chromatography. J. Chromatogr. 1963, 11, 463–471. [Google Scholar] [CrossRef]
  22. Ferrreira, L.J.C.; Casé, I.N.; Bertarini, P.L.L.; Oliveira, L.M.; Santos, L.D. Impact of immature coffee fruit and water addition during spontaneous fermentation process: Chemical composition and sensory profile. Electron. J. Biotechnol. 2024, 69, 21–29. [Google Scholar] [CrossRef]
  23. Haile, M.; Kang, W.H. Antioxidant Activity, Total Polyphenol, Flavonoid and Tannin Contents of Fermented Green Coffee Beans with Selected Yeasts. Fermentation 2019, 5, 29. [Google Scholar] [CrossRef]
  24. Silva, M.E.S.; Oliveira, R.L.; Moraes, M.M.; Camara, C.A.G.; Arruda, L.L.A.L.; Silva, S.P.; Porto, T.S. Impact of fermentation time on the bioactive and volatile composition of coffee: Insights for producers and researchers. Food Chem. 2025, 490, 145067. [Google Scholar] [CrossRef] [PubMed]
  25. Martins, P.M.M.; Batista, N.N.; Naves, J.A.O.; Dias, D.R.; Schwan, R.F. Use of microencapsulated starter cultures by spray drying on coffee under self-induced anaerobiosis fermentation (SIAF). Food Res. Int. 2023, 172, 113189. [Google Scholar] [CrossRef] [PubMed]
  26. Cassimiro, D.M.J.; Batista, N.N.; Fonseca, H.C.; Naves, J.A.O.; Coelho, J.M.; Bernardes, P.C.; Dias, D.R.; Schwan, R.F. Wet fermentation of Coffea canephora by lactic acid bacteris and yeasts using the self-induced Anaerobic fermentation (SIAF) method enhances the coffee quality. Food Microbiol. 2023, 110, 104161. [Google Scholar] [CrossRef] [PubMed]
  27. Souza, R.L.A.; Oliveira, L.S.C.; Silva, F.L.H.; Amorim, B.C. Caracterização da poligalacturonase produzida por fermentação semi-sólida utilizando resíduo do maracujá como substrato. Rev. Bras. Eng. Agríc. Ambient. 2010, 14, 987–992. [Google Scholar] [CrossRef]
  28. Navina, B.; Huthaash, K.K.; Velmurugan, N.K.; Korumili, T. Insights into recent innovations in anti-browning strategies for fruit and vegetable preservation. Trends Food Sci. Technol. 2023, 139, 104128. [Google Scholar] [CrossRef]
  29. Elhalis, H.; Cox, J.; Frank, D.; Zhao, J. Microbiological and biochemical performances of six yeast species as potential starter culture for wet fermentation of coffee beans. LWT 2021, 137, 110430. [Google Scholar] [CrossRef]
  30. Oliveira, R.L.; Dias, J.L.; Silva, O.S.; Porto, T.S. Immobilization of pectinase from Aspergillus aculeatus in alginate beads and clarification of apple and umbu juices in a packed bed reactor. Food Bioprod. Process. 2018, 109, 9–18. [Google Scholar] [CrossRef]
  31. Uenojo, M.; Pastore, G.M. Pectinolytic enzymes: Industrial application and future perspectives. Quím. Nova 2007, 30, 388–394. [Google Scholar] [CrossRef]
  32. Luo, P.; Ai, J.; Wang, Q.; Luo, Y.; Liao, Z.; Giampieri, F.; Battino, M.; Sieniawska, E.; Bai, W.; Tian, L. Enzymatic treatment shapes in vitro digestion pattern of phenolic compounds in mulberry juice. Food Chem. 2025, 469, 142555. [Google Scholar] [CrossRef]
  33. Wei, X.; Hao, J.; Xiong, K.; Guo, H.; Xue, S.; Dai, Y.; Zhang, Y.; Chen, Y.; Zhang, S. Effect of pectinase produced by Bacillus velezensis w17-6 on methanol content and overall quality of kiwifruit wine. Food Biosci. 2024, 59, 104180. [Google Scholar] [CrossRef]
  34. Abduh, M.Y.; Merari, G.; Angkasa, M.D.; Pangastuti, W.I.R.; Rahmawati, A.; Taufik, I.; Tan, M.I.; Rosmiati, M. Effects of fermentation using Aspergillus spp. Towards extractions yield and bioactivity of coffee pulp extract. Biomass Conserv. Biorefinery 2025, 15, 15087–15099. [Google Scholar] [CrossRef]
  35. Therdtatha, P.; Jareontanahum, N.; Chaisuwan, W.; Yakul, K.; Paemanee, A.; Manassa, A.; Moukamnerd, W.; Phimolsiripol, Y.; Sommano, S.R.; Seesuriyachan, P. Production of functional Arabica and Robusta green coffee beans: Optimization of fermentation with microbial cocktails to improve antioxidant activity and metabolomic profiles. Biocatal. Agric. Biotechnol. 2023, 53, 102869. [Google Scholar] [CrossRef]
  36. Silva, M.E.S.; Oliveira, R.L.; Sousa, T.C.A.; Grisi, C.V.; Ferreira, V.C.S.; Porto, T.S.; Madruga, M.S.; Silva, S.P.; Silva, F.A.P. Microencapsulated phenolic-rich extract from juice processing grape pomace (Vittis labrusca. Isabela Var): Effects on oxidative stability of raw and pre-cooked bovine burger. Food Biosci. 2022, 50, 102212. [Google Scholar] [CrossRef]
  37. Zhou, M.-Z.; Yan, C.-Y.; Zeng, Z.; Luo, L.; Zeng, W.; Huang, Y.-H. N-Methyltransferases of caffeine biosynthetic pathway in plant. J. Agric. Food. Chem. 2020, 68, 15359–15372. [Google Scholar] [CrossRef] [PubMed]
  38. Maia Júnior, C.R.L.; Batista, N.N.; Martinez, S.J.; Bressani, A.P.P.; Dias, D.R.; Schwan, R.F. Impact of scaling up on coffee fermentation using starter cultures. Appl. Food Res. 2024, 4, 100611. [Google Scholar] [CrossRef]
  39. Wang, X.; Hu, S.; Wan, X.; Pan, C. Effect of microbial fermentation on caffeine content of tea leaves. J. Agric. Food Chem. 2005, 53, 7238–7242. [Google Scholar] [CrossRef]
  40. Bressani, A.P.P.; Batista, N.N.; Ferreira, G.; Martinez, S.J.; Simão, J.B.P.; Dias, D.R.; Schwan, R.F. Characterization of bioactive, chemical, and sensory compounds from fermented coffees with different yeasts species. Food Res. Int. 2021, 150, 110755. [Google Scholar] [CrossRef]
  41. Ban, Y.; Park, H.; Hong, S.J.; Yu, S.Y.; Moon, H.S.; Shin, E.-C. Sensomics and chemometrics approaches of differential brewed and roasted coffee (Coffea arabica) from Ethiopia using biomimetic sensory-based machine perception techniques: Effect of caffeine on bitter taste and the generation of volatiles. Food Chem. 2025, 476, 143407. [Google Scholar] [CrossRef]
  42. Shen, X.; Wang, Q.; Wang, H.; Fang, G.; Li, Y.; Zhang, J.; Liu, K. Microbial characteristics and functions in coffee fermentation: A review. Fermentation 2025, 11, 5. [Google Scholar] [CrossRef]
  43. Borém, F.M.; Rabelo, M.H.S.; Alves, A.P.C.; Santos, C.M.; Pieroni, R.S.; Nakajima, M.; Sugino, R. Fermentation of coffee fruit sequential inoculation of Lactiplantibacillus plantarum and Saccharomyces cerevisiae: Effect in sensory attributes and chemical composition of the beans. Food Chem. 2024, 446, 138820. [Google Scholar] [CrossRef]
  44. Matinez, S.J.; Batista, N.N.; Bressani, A.P.P.; Leite, S.; Naves, J.A.O.; Dias, D.R.; Schwan, R.F. Volatile and sensory mapping of SIAF fermentation with selected coffee yeasts from different Brazilian regions. Food Biosci. 2024, 62, 105551. [Google Scholar] [CrossRef]
  45. Debona, D.G.; Lyrio, M.V.V.; Luz, J.M.R.; Frinhani, R.Q.; Araújo, B.Q.; Oliveira, E.C.S.; Agnoletti, B.Z.; Coura, M.R.; Pereira, L.L.; Castro, E.V.R. Comprehensive evaluation of Volatile compounds and sensory profiles of coffee throughout the roasting process. Food Chem. 2025, 478, 143586. [Google Scholar] [CrossRef]
  46. Rosário, D.K.A.; Mutz, Y.S.; Vieira, K.M.; Schwan, R.F.; Bernardes, P.C. Effect os self-induced anaerobiosis fermentation (SIAF) in the volatile compounds and sensory quality of coffee. Eur. Food Res. Technol. 2024, 250, 667–675. [Google Scholar] [CrossRef]
  47. Lopes, A.C.A.; Andrade, R.P.; Casagrande, M.R.; Santiago, W.D.; Resende, M.L.V.; Cardoso, M.G.; Vilanova, M.; Duarte, W.F. Production and characterization of a new distilled beverage from green coffee seed residue. Food Chem. 2022, 377, 131960. [Google Scholar] [CrossRef] [PubMed]
  48. Wibowo, N.A.; Mangunwardoyo, W.; Santoso, T.J.; Yasman. Investigation of Volatile compounds of Liberica coffee beans fermented at varying degrees of roasting. Food Res. 2024, 8, 43–53. [Google Scholar]
  49. Rivera, A.M.P.; Silva, J.L.; Torres-Valenzuela, L.; Plaza-Dorado, J.L. From waste to taste: Coffee by-products as starter cultures for sustainable fermentation and improved coffee quality. Sustainability 2024, 16, 10763. [Google Scholar] [CrossRef]
  50. Galarza, G.; Figueroa, J.G. Volatile compound characterization of coffee (Coffea arabica) Processed at different fermentation times using SPME-GC-MS. Molecules 2022, 27, 2004. [Google Scholar] [CrossRef]
  51. Várady, M.; Tauchen, J.; Franková, A.; Kloucek, P.; Popelka, P. Effect of method of processing specialty coffee beans (natural, washed, honey, fermentation, maceration) on bioactive and volatile compounds. LWT 2022, 172, 114245. [Google Scholar] [CrossRef]
  52. Tang, V.C.Y.; Sun, J.; Cornuz, M.; Yu, B.; Lassabliere, B. Effect of solid-state fungal fermentation on the non-volatiles content and volatiles composition of Coffea canephora (Robusta) coffee beans. Food Chem. 2021, 337, 128023. [Google Scholar] [CrossRef]
Figure 1. Total reducing sugar (A), polygalacturonase (B), and pectin lyase activity (C) in green coffee during fermentation and treatment of coffee fruit with pectinase.
Fermentation 11 00361 g001
Figure 2. Phenolic compounds and antioxidant activity through coffee fermentation. (A): Reducing sugars in green beans; (B): reducing sugars in roasted beans; (C): DPPH in green beans; (D): DPPH in roasted beans; (E): ABTS in green beans; (F): ABTS in roasted beans.
Fermentation 11 00361 g002
Figure 3. Principal component analysis for volatile composition (A) and correlation with enzyme treatment (B) during coffee fermentation.
Fermentation 11 00361 g003
Table 1. Variations in the colorimetric and physical–chemical parameters of fermented coffee cherries as a function of time and concentration of the enzyme solution.
Physical–Chemical ParameterTime (h)Enzyme Solution Concentration (U·ML−1)
01510
Colorimetric
parameter
L
010.17 ± 0.07E---
2412.17 ± 0.43DAB13.43 ± 1.44AA11.60 ± 0.26AAB10.97 ± 0.12AB
4818.40 ± 1.15BA13.60 ± 0.83AB11.27 ± 0.15ABC11.07 ± 0.09AC
7221.10 ± 2.40AA10.63 ± 0.18BB11.27 ± 0.19AB11.00 ± 0.06AB
9611.30 ± 0.35DA12.57 ± 0.80ABA11.50 ± 0.38AA11.17 ± 0.18AA
12014.40 ± 1.11CA11.43 ± 0.03ABB11.97 ± 0.94AB11.30 ± 0.95AB
Colorimetric
parameter
a*
03.17 ± 0.81C---
243.30 ± 0.23CAB5.07 ± 0.42AA3.23 ± 0.34AAB2.50 ± 0.40AB
485.80 ± 1.56BCA5.07 ± 1.41AA2.20 ± 0.21AB0.67 ± 0.32AB
7211.07 ± 1.66AA6.30 ± 0.21AB2.07 ± 0.41AC0.40 ± 0.15AC
964.17 ± 0.97CB6.90 ± 0.52AA3.57 ±0.60ABC1.67 ± 0.29AC
1207.23 ± 0.52BA4.80 ± 0.78AB2.73 ± 0.58ABC1.13 ± 0.37AC
Colorimetric
parameter
b*
01.47 ± 0.66B---
24−4.50 ± 0.67DD2.47 ± 0.37BA1.93 ± 0.95ABB0.87 ± 0.41ACC
485.57 ± 0.50AA4.47 ± 0.72AA2.83 ± 0.19AB−1.23 ± 0.07DC
726.77 ± 0.54AA2.77 ± 0.17BB1.17 ± 0.66BC−1.47 ± 0.07DD
961.07 ± 0.34BCB4.03 ± 0.38ABA1.10 ± 0.97BB−0.17 ± 0.09CDB
120−0.47 ± 0.52CC3.83 ± 0.24ABA0.60 ± 0.70BC0.97 ± 0.07AB
TSSs (°Brix)015.20 ± 0.15A---
2414.53 ± 0.26ABA13.40 ± 0.21ABB11.00 ± 0.29AC10.13 ± 0.19AD
4813.97 ± 0.50BCA13.43 ± 0.07AA10.53 ± 0.48ABB10.00 ± 0.06AB
7213.33 ± 0.67CDA12.67 ± 0.17ABA10.50 ± 0.29ABB10.13 ± 0.15AB
9613.00 ± 0.06DA12.60 ± 0.15BA10.33 ± 0.17ABCB9.67 ± 0.34AB
12012.00 ± 0.29EA12.67 ± 0.18ABA9.67 ± 0.09CB9.63 ± 0.22AB
pH05.23 ± 0.03A---
244.49 ± 0.01BA4.58 ± 0.05AA4.28 ± 0.08AB4.19 ± 0.07AB
484.11 ± 0.02CA4.16 ± 0.01BA4.13 ± 0.04BA4.20 ± 0.01AA
724.13 ± 0.02CAB4.07 ± 0.01BB4.15 ± 0.02BAB4.17 ± 0.04AA
963.98 ± 0.01DB4.07 ± 0.02BAB4.10 ± 0.06BA4.04 ± 0.02BAB
1203.99 ± 0.01DAB3.95 ± 0.01CB4.06 ± 0.03BA3.90 ± 0.05CB
Different capital letters in the same column indicate statistical differences as a function of fermentation time. Different lowercase letters in the same row indicate statistical differences as a function of the concentration of the enzyme solution. TSSs: Total soluble solids.
Table 2. Concentration of caffeine, trigonelline and chlorogenic acid (5CQA) in non-fermented and fermented coffee samples before and after roasting. * U·mL−1. Different capital letters in the same column denote significant differences between different enzyme concentrations, fixing the fermentation time. Different lowercase letters in the same column denote significant differences between different fermentation times, fixing the enzyme concentration. nd: not detected.
Fermentation Time (Hours)Enzymatic Concentration *Caffeine (mg·100g−1)Trigonelline (mg·100g−1)Chlorogenic Acid (5CQA) (mg·100g−1)
GreenRoastedGreenRoastedGreenRoasted
00592.93 ± 27.2a873.63 ± 32.5a1028.75 ± 31.4a914.79 ± 44.0bc423.46 ± 40.3a185.85 ± 2.5a
240506.98 ± 36.1Cb894.40 ± 52.4Aa859.25 ± 8.4Bb1047.48 ± 35.2Aa374.24 ± 15.9Ab196.19 ± 16.1Aa
1645.07 ± 24.0Bab902.38 ± 10.3Aa910.88 ± 11.9Aa911.75 ± 37.7Ba262.97 ± 7.9Ca95.55 ± 7.9Ba
5742.51 ± 16.7Aa890.18 ± 19.1Aa847.97 ±11.2Ba790.36 ± 37.8Ca302.38 ± 4.7Ba63.81 ± 1.3BCa
10648.60 ± 9.2Ba795.68 ± 12.1Ba716.84 ± 9.8Ca687.30 ± 32.5Dab168.96 ± 5.6Da55.96 ± 15.0Ca
480593.25 ± 13.6Ba866.01 ± 46.2Aab857.71 ± 8.9Ab1069.03 ± 38.8Aa335.80 ± 2.1Ac189.08 ± 14.4Aa
1568.26 ± 19.3Bc826.88 ± 7.6Ab820.93 ± 4.9Ab897.84 ± 15.7Ba220.28 ± 1.4Bc92.84 ± 7.6Bab
5685.36 ± 25.8Aab857.57 ± 3.0Ab768.28 ± 29.6Bb769.96 ± 4.3Cab310.80 ± 9.5Aa69.38 ± 0.2Ba
10595.80 ± 2.1Bab693.24 ± 21.8Bb686.66 ± 0.1Ca737.90 ± 11.2Ca156.54 ± 7.3Cab26.83 ± 11.4Ca
720546.88 ± 8.9Bab832.24 ± 13.0Aab844.96 ± 2.1Ab993.97 ± 5.9Aab364.41 ± 0.7Abc181.43 ± 12.5Aa
1694.90 ± 6.2Aa792.92 ± 2.5Ab808.48 ± 20.0Abc847.72 ± 9.7Bab256.71 ± 11.3Cab81.18 ± 1.7Bab
5722.09 ± 3.7Aa773.55 ± 5.5Ab801.71 ± 21.9Aab691.26 ± 38.0Cbc312.83 ± 4.8Ba49.87 ± 11.BCab
10592.95 ±14.7Bab683.22 ± 9.0Bb676.15 ± 8.6Ba738.86 ± 42.9Ca148.20 ± 5.0Dabc42.77 ± 9.9Ca
960540.69 ± 19.3Bab808.61 ± 24.3Ab742.48 ± 9.6Ac936.50 ± 3.3Abc236.88 ± 1.4Ad145.33 ± 23.2Ab
1627.60 ± 40.3Ab806.52 ± 7.6Ab767.68 ± 26.5Ac813.87 ± 11.0Bb226.75 ± 8.1Abc65.75 ± 7.5Bab
5642.11 ± 10.2Abc786.39 ± 14.7Ab787.81 ± 5.2Ab716.09 ± 29.5Cabc259.23 ± 7.8Ab47.87 ± 7.1Bab
10556.41 ± 11.3Bb635.56 ± 20.4Bbc625.58 ± 1.5Bb564.26 ± 54.6Dc125.58 ± 11.2Bbcnd
1200557.99 ± 5.6Bab856.90 ± 20.9Aab752.06 ± 4.3Ac871.57 ± 15.4Ac243.91 ± 1.8Ad105.58 ± 1.0Ac
1643.91 ± 32.9Aab808. 46 ± 18.3Bb783.03 ± 27.8Abc770.99 ± 21.1Bb228.25 ± 13.3Abc62.89 ± 6.7Bb
5616.28 ± 2.9Ac701.59 ± 16.3Cc691.76 ± 17.8Bc644.68 ± 1.3Cc213.22 ± 6.7Ac30.53 ± 2.6Bb
10487.83 ± 21.5Cc605.49 ± 21.9Dc614.45 ± 12.7Cb609.95 ± 5.5Cbc121.76 ± 6.5Bcnd
Table 3. Volatile compounds in fermented coffee beans treated with 10 U·mL−1 of pectinase solution.
Volatile CompoundsTreatment (RPA *)
C10H24C10H48C10H72C10H96C10H120
Amide
l-Methioninamidend1.110.590.45nd
Pyrazines
2-Methylpyrazine3.705.045.506.005.36
2,5-Dimethyl-Pyrazine2.75ndnd1.491.13
2-Ethyl-6-methylpyrazine0.150.220.760.710.67
2-Ethylpyrazinend1.892.391.862.03
Pyrroles
1-furfuryl-Pyrrole0.390.550.941.111.39
Furans
Furfural17.3615.1915.6810.1512.17
5-Methyl-2-furaldehyde8.448.207.483.835.54
2-Pentylfuran0.290.400.460.37nd
Furfuryl acetate5.196.776.419.988.53
Dihydro-2-methyl-3-furanone1.681.551.060.74nd
Esters
Pentyl acetatendnd0.72ndnd
3-Methyl-1-butyl propanoatendndnd0.690.73
Methyl salicylate0.200.350.450.440.55
Acids
3-methyl-Butanoic acid2.201.932.762.111.55
2-methyl-Hexanoic acidndnd0.62nd0.43
2-methyl-Butanoic acid43.6040.6240.0445.3141.06
Ethyl ester Hexanoic acid1.061.351.791.661.82
Cyclohexyl ester 2-Butenoic acid0.260.610.600.540.40
Pyridine
1-Acetyl-1,4-dihydropyridine0.750.860.980.640.57
Alcohol
Benzeneethanol0.360.370.660.550.92
Benzenemethanol0.18nd0.31nd0.28
3-Methyl-2-buten-1-ol0.540.560.961.671.74
Propanoate-2-Buten-1-ol0.420.55ndndnd
1-Hexanol1.511.721.551.712.04
5-methyl-1-Hexanol0.901.200.781.451.38
2,4-Dimethyl-3-heptanolnd0.330.290.340.67
Terpenes
Linalool0.180.85ndndnd
Trans-Linalool oxide0.180.210.240.240.34
Linalyl butanoate0.210.240.620.931.04
Imidazole
1-(3H-Imidazol-4-yl)-ethanone3.725.484.453.874.03
* RPA (%) = (Peak area/total) × 100%; RPA shown is calculated based on all identified compounds. nd: Not detected. C10H24 (enzymatic concentration of 10 U·mL−1 and 24 h of fermentation); C10H48 (enzymatic concentration of 10 U·mL−1 and 48 h of fermentation); C10H72 (enzymatic concentration of 10 U·mL−1 and 72 h of fermentation); C10H96 (enzymatic concentration of 10 U·mL−1 and 96 h of fermentation); C10H120 (enzymatic concentration of 10 U·mL−1 and 120 h of fermentation).
Table 4. Volatile compounds in fermented coffee beans treated with 5 U·mL−1 of pectinase solution.
Volatile CompoundsTreatment (RPA *)
C5H24C5H48C5H72C5H96C5H120
Amide
l-Methioninamide1.080.891.030.960.51
Pyrazines
2-Methylpyrazine4.946.666.246.227.84
2,5-Dimethyl-Pyrazine2.3ndndndnd
2-Ethyl-6-methylpyrazine0.650.880.841.951.08
2-Ethylpyrazinend2.092.193.083.72
Pyrroles
1-furfuryl-Pyrrole0.260.430.550.600.75
Furans
Furfural13.9413.6714.4117.6411.26
5-Methyl-2-furaldehyde8.017.418.008.905.39
2-Pentylfurannd0.330.365.250.55
Furfuryl acetate5.717.148.751.028.49
Dihydro-2-methyl-3-furanone1.861.951.741.781.18
Esters
Pentyl acetatendnd0.58ndnd
3-Methyl-1-butyl propanoate0.77ndndnd0.65
Methyl salicylate0.18nd0.330.460.61
Acids
3-methyl-Butanoic acid2.022.282.532.912.71
2-methyl-Hexanoic acidndndndndnd
2-methyl-Butanoic acid45.5142.7338.9237.0737.47
Ethyl ester Hexanoic acid1.691.991.99nd2.71
Cyclohexyl ester 2-Butenoic acid0.410.180.430.560.85
Pyridine
1-Acetyl-1,4-dihydropyridine0.570.890.630.550.64
Alcohol
Benzeneethanol0.300.280.370.60nd
Benzenemethanolndndnd0.36nd
3-Methyl-2-buten-1-olndndndnd1.68
Propanoate-2-Buten-1-ol0.33ndnd0.57nd
1-Hexanol1.831.761.821.611.37
5-methyl- 1-Hexanol1.080.971.140.661.12
2,4-Dimethyl-3-heptanolndndndndnd
Terpenes
Linaloolnd0.20ndndnd
Trans-Linalool oxide0.220.190.230.250.35
Linalyl butanoate0.450.510.61nd1.26
Imidazole
1-(3H-Imidazol-4-yl)-ethanone4.925.595.465.695.85
* RPA (%) = (Peak area/total) × 100%. nd: Not detected. C5H24 (enzymatic concentration of 5 U·mL−1 and 24 h of fermentation); C5H48 (enzymatic concentration of 5 U·mL−1 and 48 h of fermentation); C5H72 (enzymatic concentration of 5 U·mL−1 and 72 h of fermentation); C5H96 (enzymatic concentration of 5 U·mL−1 and 96 h of fermentation); C5H120 (enzymatic concentration of 5 U·mL−1 and 120 h of fermentation).
Table 5. Volatile compounds in fermented coffee beans treated with 1 U·mL−1 of pectinase solution.
Volatile CompoundsTreatment (RPA *)
C1H24C1H48C1H72C1H96C1H120
Amide
l-Methioninamide0.940.930.820.940.89
Pyrazines
2-Methylpyrazine4.925.724.514.436.72
2,5-Dimethyl-Pyrazine1.63nd0.931.86nd
2-Ethyl-6-methylpyrazine0.690.990.680.711.07
2-Ethylpyrazinend3.131.06nd2.18
Pyrroles
1-furfuryl-Pyrrole0.330.43nd0.350.42
Furans
Furfural19.4914.1818.0612.4719.19
5-Methyl-2-furaldehyde10.018.478.717.9610.39
2-Pentylfuranndndndndnd
Furfuryl acetate4.266.763.216.906.94
Dihydro-2-methyl-3-furanone2.11nd1.741.302.29
Esters
Pentyl acetatendndndnd1.06
3-Methyl-1-butyl propanoatendnd0.500.81nd
Methyl salicylate0.490.34nd0.240.50
Acids
3-methyl-Butanoic acid3.012.652.81nd2.55
2-methyl-Hexanoic acidndndndnd0.69
2-methyl-Butanoic acid40.2040.3447.8151.7232.09
Ethyl ester Hexanoic acid1.552.211.051.661.85
Cyclohexyl ester 2-Butenoic acid0.380.670.460.330.26
Pyridine
1-Acetyl-1,4-dihydropyridine0.580.520.54nd0.37
Alcohol
Benzeneethanolnd0.40ndndnd
Benzenemethanolnd0.23ndndnd
3-Methyl-2-buten-1-olndndndndnd
Propanoate-2-Buten-1-olnd1.69ndndnd
1-Hexanol1.661.781.521.991.59
5-methyl- 1-Hexanol0.860.760.570.750.82
2,4-Dimethyl-3-heptanolndndndnd0.25
Terpenes
Linaloolndndndndnd
Trans-Linalool oxidendndndndnd
Linalyl butanoate0.420.50nd0.560.54
Imidazole
1-(3H-Imidazol-4-yl)-ethanone6.195.654.634.556.26
* RPA (%) = (Peak area/total) × 100%. nd: Not detected. C1H24 (enzymatic concentration of 1 U·mL−1 and 24 h of fermentation); C1H48 (enzymatic concentration of 1 U·mL−1 and 48 h of fermentation); C1H72 (enzymatic concentration of 1 U·mL−1 and 72 h of fermentation); C1H96 (enzymatic concentration of 1 U·mL−1 and 96 h of fermentation); C1H120 (enzymatic concentration of 1 U·mL−1 and 120 h of fermentation).
Table 6. Volatile compounds in fermented coffee beans treated with 0 U·mL−1 of pectinase solution.
Volatile CompoundsTreatment (RPA *)
C0H0C0H24C0H48C0H72C0H96C0H120
Amide
l-Methioninamide0.24nd0.880.580.871.02
Pyrazines
2-Methylpyrazine4.454.605.074.213.964.69
2,5-Dimethyl-Pyrazinendndnd1.152.511.74
2-Ethyl-6-methylpyrazine0.801.460.611.40ndnd
2-Ethylpyrazinendndndndndnd
Pyrroles
1-furfuryl-Pyrrole0.260.260.240.280.710.42
Furans
Furfural24.2422.5214.2825.3919.7514.16
5-Methyl-2-furaldehyde12.1710.636.8111.310.188.35
2-Pentylfuran0.43ndndndndnd
Furfuryl acetate3.672.384.302.336.2412.77
Dihydro-2-methyl-3-furanone2.55nd1.902.011.491.90
Esters
Pentyl acetatendndndndndnd
3-Methyl-1-butyl propanoatend1.76nd0.391.02nd
Methyl salicylate0.410.30nd0.610.60.56
Acids
3-methyl-Butanoic acid3.324.112.413.943.402.90
2-methyl-Hexanoic acidndndndndndnd
2-methyl-Butanoic acid38.1641.8951.4838.4438.5437.43
Ethyl ester Hexanoic acid1.261.411.751.581.923.00
Cyclohexyl ester 2-Butenoic acid0.430.540.370.550.680.84
Pyridine
1-Acetyl-1,4-dihydropyridine0.540.470.940.380.47nd
Alcohol
Benzeneethanolndndndndndnd
Benzenemethanolndndndndndnd
3-Methyl-2-buten-1-olndndndndndnd
Propanoate-2-Buten-1-olndndndndndnd
1-Hexanol1.291.161.611.081.531.80
5-methyl-1-Hexanol0.700.630.82nd0.801.09
2,4-Dimethyl-3-heptanolndndndndndnd
Terpenes
Linaloolndndndndndnd
Trans-Linalool oxidendndndndnd0.35
Linalyl butanoatendnd0.49nd1.10nd
Imidazole
1-(3H-Imidazol-4-yl)-ethanone4.393.883.864.364.195.40
* RPA (%) = (Peak area/total) × 100%. nd: Not detected. C0H0 (enzymatic concentration of 0 U·mL−1 and 0 h of fermentation); C0H24 (enzymatic concentration of 0 U·mL−1 and 24 h of fermentation); C0H48 (enzymatic concentration of 0 U·mL−1 and 48 h of fermentation); C0H72 (enzymatic concentration of 0 U·mL−1 and 72 h of fermentation); C0H96 (enzymatic concentration of 0 U·mL−1 and 96 h of fermentation); C0H120 (enzymatic concentration of 0 U·mL−1 and 120 h of fermentation).
Disclaimer/Publisher’s Note: The statements, opinions and data contained in all publications are solely those of the individual author(s) and contributor(s) and not of MDPI and/or the editor(s). MDPI and/or the editor(s) disclaim responsibility for any injury to people or property resulting from any ideas, methods, instructions or products referred to in the content.

