Article

Anaerobic Digestion of Food Waste and Granular Inoculum: Study on Temperature Effect and Substrate-to-Inoculum Ratio on Biogas Production

by
Madalina Ivanovici
1,2,
Gabriela-Alina Dumitrel
1,*,
Vasile Daniel Gherman
1,
Teodor Todinca
1,
Ana-Maria Pana
1 and
Valentin Laurentiu Ordodi
1,3,4
1
Faculty of Chemical Engineering, Biotechnologies and Environmental Protection, Politehnica University of Timisoara, Bv. Vasile Parvan No. 6, 300223 Timisoara, Romania
2
National Institute of Research and Development for Electrochemistry and Condensed Matter, Dr. A. P. Podeanu 144, 300569 Timişoara, Romania
3
Center of Immuno-Physiology and Biotechnologies, Department of Functional Sciences, “Victor Babes” University of Medicine and Pharmacy, Eftimie Murgu Sq. 2, 300041 Timisoara, Romania
4
Research Center for Gene and Cellular Therapies in the Treatment of Cancer—OncoGen, Timis County Emergency Clinical Hospital “Pius Brinzeu”, No. 156 Liviu Rebreanu, 300723 Timisoara, Romania
*
Author to whom correspondence should be addressed.
Fermentation 2025, 11(6), 348; https://doi.org/10.3390/fermentation11060348
Submission received: 14 April 2025 / Revised: 29 May 2025 / Accepted: 5 June 2025 / Published: 15 June 2025

Abstract

The development of food waste anaerobic digestion (AD) is a contemporary research topic addressed in the scientific community to meet the requirements of food waste valorization and proper substrate configuration for an efficient AD process. In this study, multiple AD experiments were performed on food waste together with industrial inoculum using laboratory-scale bioreactors. Food waste consisted mainly of fruits and vegetables (80.9%) and boiled rice (19.1%). The effect of operating temperature (33 °C, 37 °C, 41 °C, 45 °C) and the ratio between food waste mixture and inoculum-FIR (1:1, 3:2 and 2:1, w/w) on the production and composition of biogas, and the conversion yield for CH4 and organic carbon, were investigated. The best results were obtained at an FIR of 2:1 and a temperature of 37 °C, with a total biogas production of 468.59 NL h−1 kg−1VSadded (51% v/v CH4 conc.) and a conversion yield of 36.42% for CH4. A modified Gompertz model was applied on the accumulated CH4 and biogas to evaluate the process performance. The model parameters were investigated in conjunction with the physico-chemical characteristics of the substrate, inoculum taxonomic profile, pH measurements, and TG-DTA analysis. The conducted analyses emphasized the susceptibility of the selected substrate towards easy degradation and improved biotransformation reactions when temperature and FIR were increased.

1. Introduction

The continuous need to increase energy production, in the present geopolitical and economical context, emphasizes the importance of alternative renewable energy resources [1]. Biogas remains an attractive renewable energy resource due to the diversified biomass feedstock that can be processed through the AD process and due to the environmental and economic advantages that come with the technology. The biogas production process is a waste-to-renewable energy (WTRE) technology that can be adapted to rural and urban settings in order to meet the energy requirement gaps for these environments [2,3,4]. The types of urban waste that can be used as feedstock in biogas production include municipal sludge produced by municipal treatment plants, food waste, municipal waste (such as household waste, commercial waste, garden waste, waste from cleaning), and industrial organic waste, including wastewater (provided from sectors such as food and beverage industries) [5,6,7].
AD of food waste (FW) is an attractive research topic in the energy field since FW is easily biodegraded in AD, is a good substrate for microbial growth, and the AD of FW has less environmental bad effects compared to other disposal methods and treatment technologies (landfill disposal, composting, incineration) of FW [4,8]. The estimated total food waste generated in the EU for the year 2022 is 127 kg per inhabitant of fresh mass, of which 9.4% comes from primary food production (agriculture, fishing and aquaculture), 18.1% is from the manufacture of food products and beverages, 7.9% is from retail and other food distribution, 11% is from restaurants and food services, and 53.5% is from household activities (Eurostat, 2025) [9]. Greenhouse gas emissions associated with food waste are produced mostly in the food production stage (73%), followed by food manufacture and consumption (8%), retail and distribution (7%), food processing (6%), and disposal of food (6%) [10]. Also, food waste counts for 20–70% of the municipal solid waste and 60% of municipal bio-waste [9,11,12]. From the point of view of the food waste hierarchy, established in the EU guiding waste policies, AD of food waste is included in the recycling stage, the third preferred option after prevention and re-use [10].
The interest in food waste valorization by AD is emphasized in the scientific community by the increasing number of published research articles in the last twenty years. The bibliometric analysis carried out by Rodríguez-Jiménez et al. through database searches estimated that over 200 articles related to AD of food waste were published in the period 2001–2021 [12]. The main research objectives were the investigation of various variables in the process, such as the effect of the substrate and environmental variables, the operating parameters, and the effect given by the inoculum [12]. Concerning the composition of food waste, it is important to mention that food waste contains a significant amount of fruit and vegetable waste, which counts for around 40%, and for this reason, the AD of fruit and vegetables can be approached as a separate research topic [12,13,14].
The inherent properties of fruit and vegetables pose some challenges in the AD process. These properties refer to a lower C/N ratio, usually around 20:1 or less than 27:1; total solids (TS) of 10%; volatile solids (VSs), which account for more than 90% of TS; a high moisture content, above 80%; pH values between 4 and 5; low protein content, and an increased percentage, of more than 75%, of the organic fraction consisting of easily biodegradable carbohydrates (hemicellulose, fructose) [15,16,17]. The low pH values and high amounts of VSs are associated with unfavorable biochemical transformation in the AD process: increases in the formation of volatile acids and inhibition of methanogenesis [16,18]. Therefore, when the VS content is high and the cellulose content is low, the hydrolytic stage is enhanced, leading to a reduction in CH4 and a decrease in pH. Low pH values do not provide the optimal conditions for the AD process because the beneficial pH value must be higher than 6.6 to promote the development of fermentative and methanogen bacteria [16,17,18]. When C/N is low, nitrogen leads to the accumulation of ammonium, causing toxicity to some microbes, and the low content of carbon decreases acid formation [19,20].
The inoculum plays an important role because it incorporates the necessary microbial community for the AD process to occur and remain stable, so many studies have investigated the effect of the inoculum on the AD of fruit and waste. Fruit and vegetable waste has been studied in anaerobic co-digestion in conjunction with various types of co-substrates and inoculums, of which the most popular inoculums are animal manure and sewage sludge [15,21,22,23,24,25,26]. Other co-substrates can be food waste, waste from slaughterhouses and wastewater [15,27,28]. Granular sludge is another type of inoculum widely used in the wastewater treatment industry but adapted also to other substrates for biogas production through AD. The advantages of granular inoculums in anaerobic processes are given by their inherent biological and physiochemical properties. Therefore, it has been documented that anaerobic granules contain various microbial communities that enhance the hydrolysis, acidogenesis, and methanogenesis steps. They have good settleability properties and high density, which prevents biomass washout and can resist extreme conditions regarding the temperature, pH, and salinity of the environment. The morphology of granules (internal pores and channels) supports mass transport and the formation of biogas bubbles [29,30,31]. Various results related to the AD of fruits and vegetables with granular inoculums have been published in the scientific literature. Most of the investigations were performed in batch operations using small lab reactors and mesophilic conditions. Therefore, Yazidi et al. conducted a batch experiment of the AD of fruits (grape and orange) and vegetables (potato, carrot, and spinach) with granular sludge in a 6 L-volume bioreactor using 600–700 g of granular sludge at 1 to 3 g of VS L−1 OLR (organic loading rate) and an operating temperature of 35 °C [32]. Maximum biogas production of 9.91 L and 11.68 L was achieved in an OLR of 3 g VS L−1 in 126 h for vegetables and in 75 h for fruits [32]. A lower-capacity reactor of 1 L volume was used in the study carried out by Miramontes-Martínez et al., 60% of which was filled in with 300 mL of granular activated sludge, equivalent to 61.6 g of VS L−1, and with 300 mL of fruit and vegetable waste that contained 20 g VS L−1. The process was carried out for 64 days at 35 °C. The co-digestion process resulted in a total accumulated CH4 of 776.3 mL per g VS added [15]. Gaur et al. investigated the AD of acclimatized anaerobic granular sludge with food waste as follows: cooked food, peel of raw material, and stale food items using an inoculum-to-substrate volume ratio of 3 to 1. The total volume of the reactor was 500 mL, with a 90% working volume. The process was carried out for 30 days at 35 °C. Under these conditions, the total CH4 production was 1200 mL [33]. In the research study carried out by Mu et al., the effect of various substrate-to-inoculum ratios (VS-based) on the production of biogas was investigated [31]. Waste of fruits and vegetables (cabbage, Chinese cabbage, carrot, lettuce, tomato, cauliflower, etc., cut into small pieces and mixed with apple pomace) was used as the substrate and anaerobic granular sludge as the inoculum. The process was carried out at 37 °C in a 2 L-volume reactor with a 75% working volume. The substrate-to-inoculum ratio ranged between 4:1 and 1:5 (VS basis), wherein the yield in biogas increased as the substrate-to-inoculum ratio decreased. The authors reported that the optimal substrate-to-inoculum ratio was 1:1 because it was observed that the lower ratios (1:2 and 1:5) did not significantly improve the biogas production. For an optimal ratio of 1:1, the biogas yield was 417 mL g−1 VS, with 53.6% CH4 content [31]. In another experimental investigation performed by Santos et al., different fruit waste (orange bagasse, passion fruit peel, and cashew bagasse) were individually co-digested together with industrial granular anaerobic sludge in very small reactors of 250 mL volume, of which 80% was used as the working volume in order to assay biochemical CH4 potential [34]. The process was operated at 37 °C for a period of 60 days. For each experiment, the reactor was filled with 2.1 g of substrate, 26 g of inoculum, and 171 mL of water. The obtained potential of biogas and CH4 was 348 and 128 Nml g−1 VS for orange bagasse, 264 and 115 Nml g−1 VS for passion fruit peel, and 173 and 62 Nml g−1 VS for cashew bagasse. Most of the gas was accumulated in the first 30 days [34].
The discussion concerning the impact of the inoculum on the AD process can be extended to other types of inoculums and substrates. Herein, we can highlight the importance of multiple inoculum-related aspects (substrate-to-inoculum ratio, the type of inoculum, and the treatment that can be applied to the inoculum) that can significantly impact the process performance [35,36,37,38,39]. For example, Li et al. tested three types of inoculums (anaerobic granular sludge, liquid AD effluent, and waste-activated sludge) and different substrate-to-inoculum (S/I) ratios (2, 4, and 6 on VS-based) on the efficiency of solid-state AD for a mixture of tomato waste with dairy manure and corn stover [35]. When analyzing the effect given by the inoculum type, the highest accumulated CH4 production was obtained for waste-activated sludge at an S/I of 2. The overall findings indicated that liquid AD effluent was considered the most effective inoculum [35]. The effect of inoculum type was also investigated by De la Rubia et al. on the AD of liquid fraction, which resulted in the hydrothermal carbonization of dewatered sewage sludge [36]. Among the three inoculum sources (industrial granular biomass from two different industries: brewery and sugar beet wastewater treatment, and a flocculent biomass from a municipal sewage sludge digester at two initial inoculum concentrations), the granular inoculum from the brewery wastewater treatment was indicated to be the most efficient in terms of CH4 production [36]. In the study of crop residue (rice straw) AD, even a higher number of inoculum sources were studied: three different types of manure (digested dairy manure, digested swine manure, and digested chicken manure) and three different types of sludge: digested municipal sludge, anaerobic granular sludge, and paper mill sludge [37]. The manure-type inoculums were more efficient than the sludge types [37]. The adaptation of inoculum by, for example, incubation or acclimation is another factor that affects AD. It is attested that incubation can affect the process or not depending on the experimental configuration [38,39]. For example, Demichelis et al. found in their study that 10 days of incubation of mesophilic digestate from cow agriculture led to the highest biogas production and CH4 content at the highest substrate-to-inoculum ratio of 2 in the AD of an organic fraction of municipal solid waste. Three incubation times (0, 5, and 10 days) and three substrate-to-inoculum ratios (1:2, 1:1, 2:1, w/w) were assessed [39].
In our study, anaerobic digestion experiments were performed using a granular inoculum from industry together with food waste consisting mainly of fruits and vegetables in medium-scale laboratory reactors. The process implied short operation times (from 4 to up to 10 days), temperature, and stirring control. The aim of the present research was to analyze the effect of operating temperature and the substrate-to-inoculum ratio on the efficiency assessed in terms of biogas production, composition, and conversion yields. Mathematical modeling (Gompertz model—Zwietering modification [40]), inoculum and substrate characterization, and in-time measured parameters were integrated into the study to provide additional information about process characteristics and kinetics. When compared to the results documented in the aforementioned studies [15,31,32,33,34], we can attest that the novelty of this study resides in the unique combination of food waste mixture that was subjected to the AD process, the higher scale of the bioreactors with temperature and stirring control, and the extended domain of operating temperature (33 °C, 37 °C, 41 °C, 45 °C). Another characteristic of our experimental configurations is the high load of water, which suggests the potential application for AD of food waste with wastewaters and granular inoculum in wet AD systems. For the obtained results, a modified Gompertz model was applied to predict the cumulative biogas and CH4, for which the optimized parameters were calculated using the Matlab algorithm. The conversion yield was calculated based on the maximum theoretical gases, and the taxonomic profile of the industrial inoculum was provided.

2. Materials and Methods

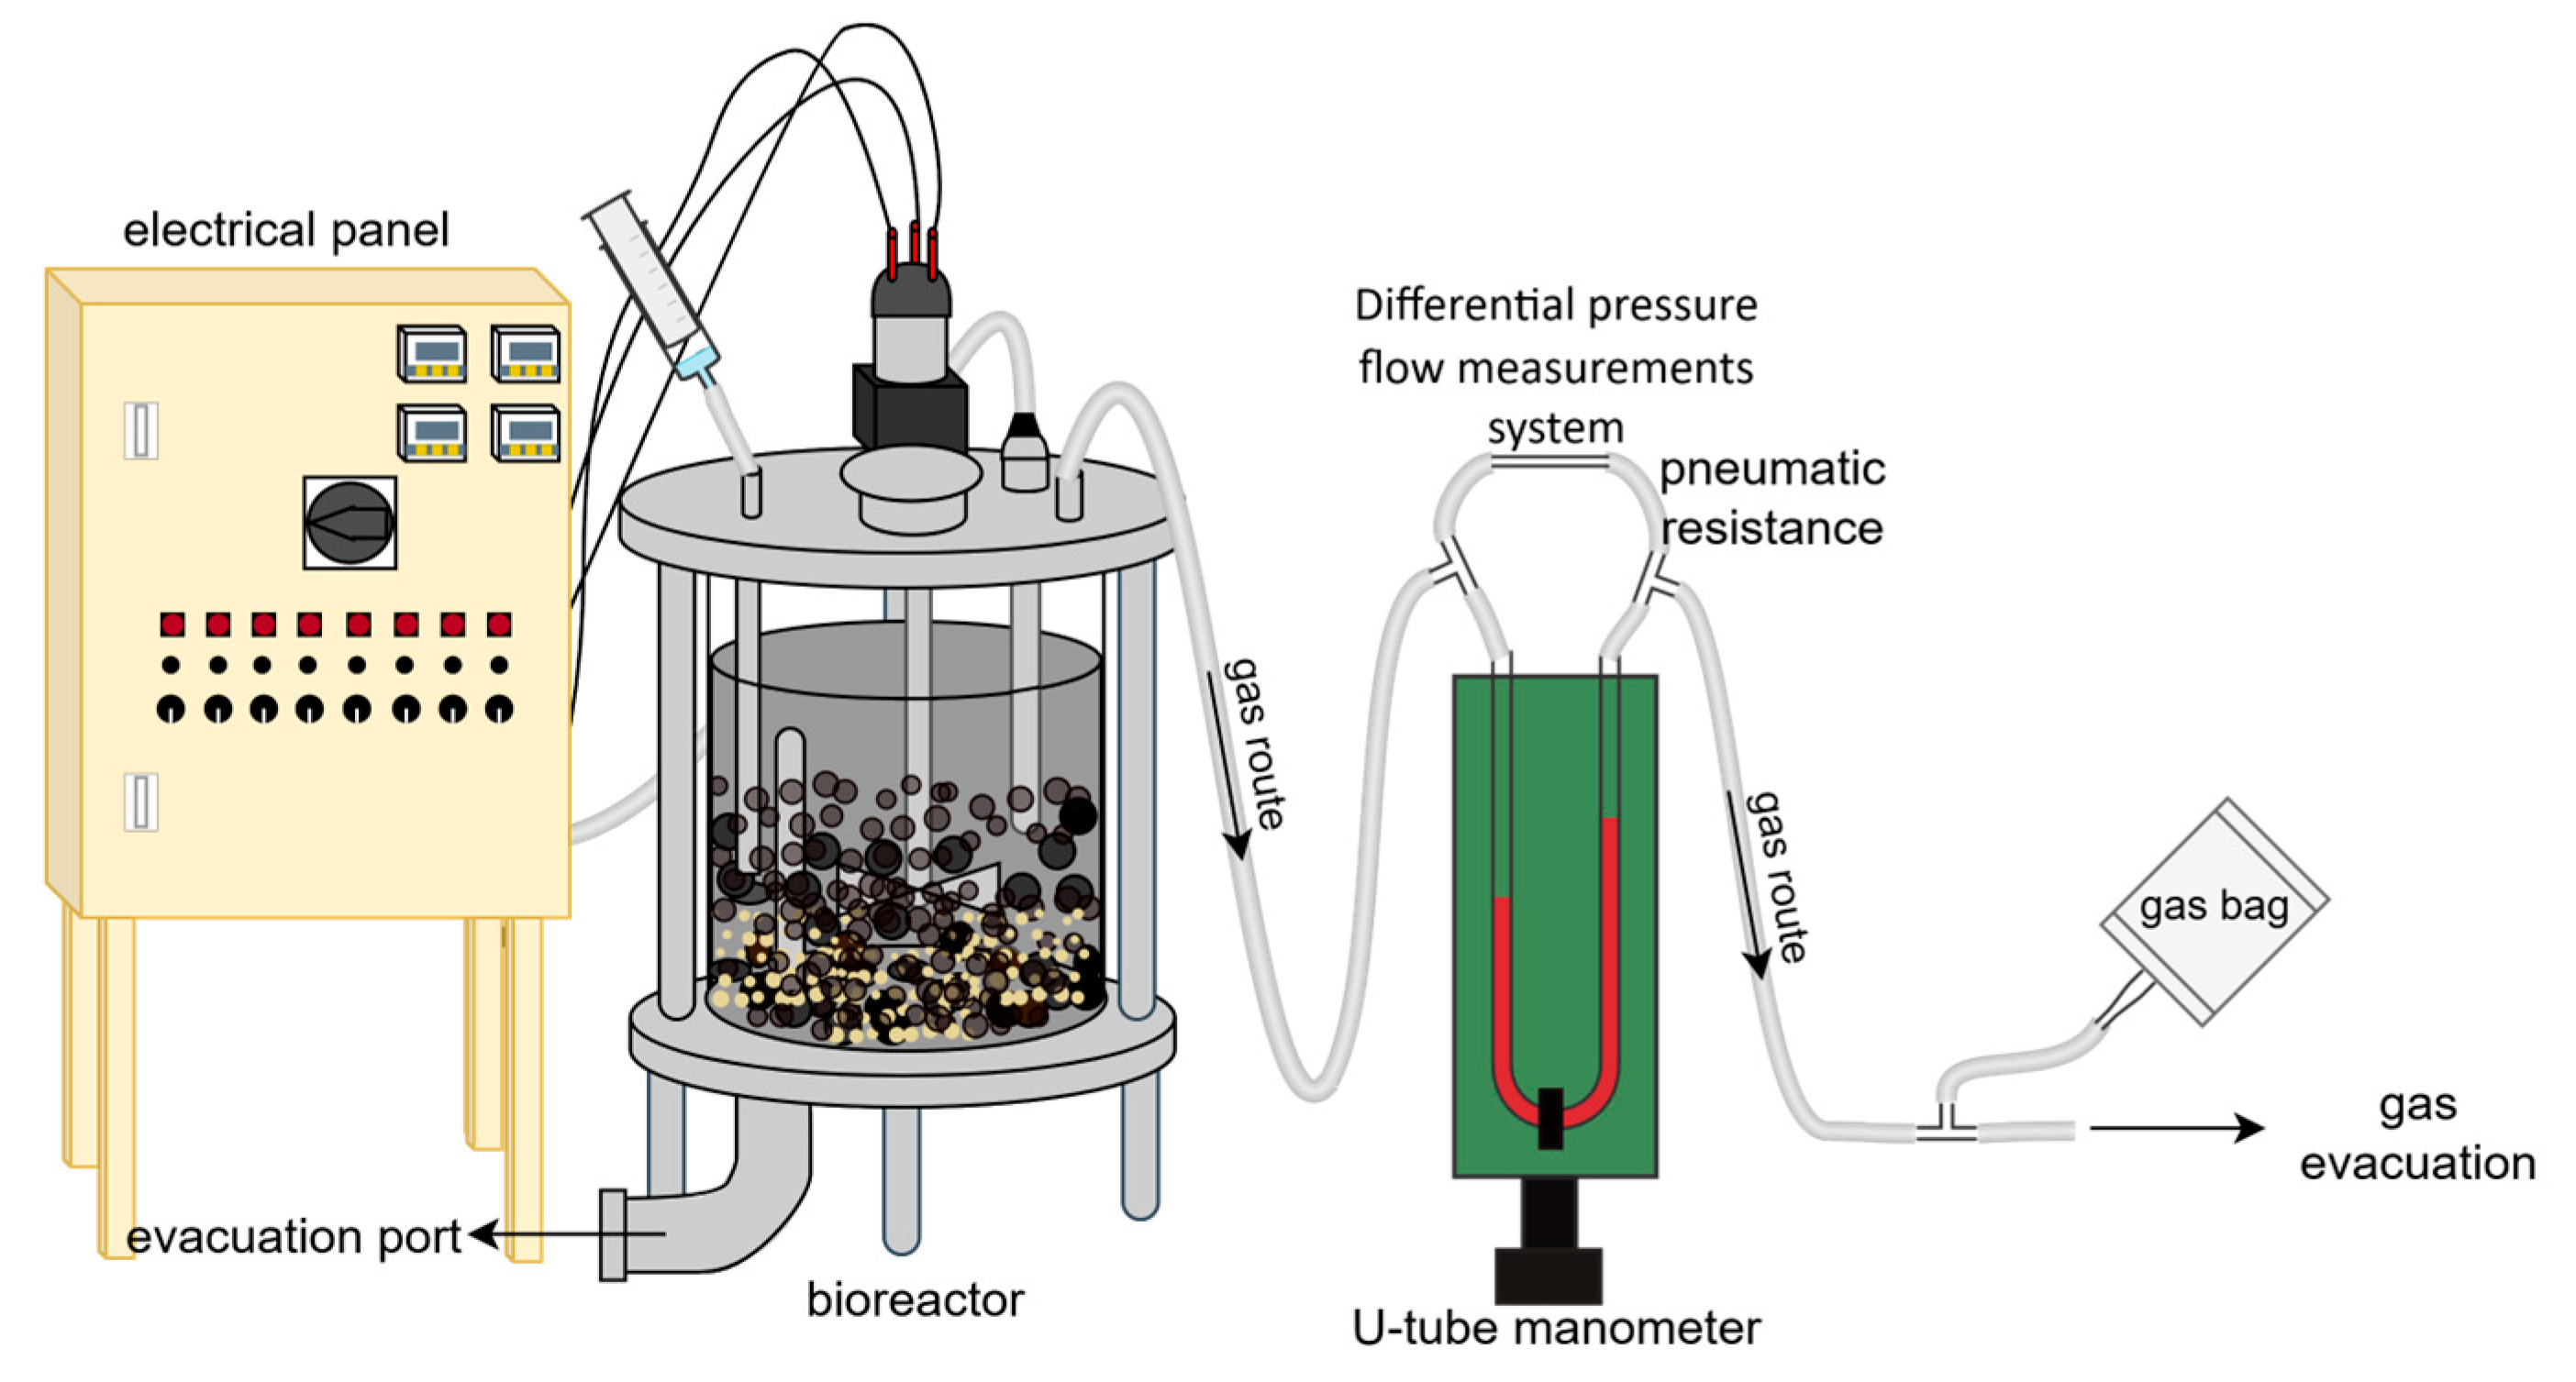
2.1. Lab-Scale Installation

The anaerobic digestion process was studied in batch experiments using two laboratory, medium-scale reactors with controlled stirring and heating systems of the same configuration. The experimental setup consisted of three main components (Figure 1): the reactors wherein the digestion of the substrate and gas production was carried out, the electrical panel used to control the operating temperature and mixing of the reactor, and the differential pressure flow measurement system used for the gas flowrate readings.
The capacity of each reactor was 15 L, and the reactor vessel is made of glass, which allowed for real-time visual observation of the process. From the point of view of the bio-chemical process, glass vessels have the advantages of being chemically and biologically inert and of reducing the matter deposition. The bottom and the upper parts of the reactor are made of stainless steel. The bottom part is supported on stainless steel footholds and connected to an evacuation port. The constant temperature of the suspension contained in the reactor is maintained and controlled with electrical resistance together with a temperature sensor. The electrical resistance–heat generation component is placed on the bottom part of the reactor, and the temperature sensor is situated inside the reactor vessel and connected to the upper part of the reactor. In Figure S1 (from the supplementary information file), the connections and components of the reactor are illustrated: mixture sampling port, feeding port, gas exit port, controlled mechanical agitation system, and temperature sensor. The evacuation and feeding ports were used for feeding and evacuation of the suspensions involved in the anaerobic fermentation studies and also for cleaning and preparing the reactors for the next batch experiments. The sampling port was used for adding substances or extracting samples for analysis, while the gas exit port was connected to the differential pressure flow measurement system (composed of U-tube differential pressure manometers filled with column liquid and pneumatic resistance) in order to measure the flow rate of the biogas resulting from the reactor. Two U-tube manometers were filled with two commercial manometric fluids (one with a density of 1 kg/dm3, procured from Wieninger GmbH, Augsburg, Germany, and the other with a density of 0.78 kg/dm3, procured from Aerofiltri S.R.L, Milan, Italy). Each differential pressure flow measurement system was calibrated with a programmable syringe pump, resulting in two linear calibration curves obtained by linear fitting of the distance between the liquid position in the tube column versus the air flow rate. The flow measurement system was further connected to gas sample bags that were used for gas collection and gas composition measurements (Figure 1) [41,42]. The collected gas was analyzed with a portable biogas analyzer (Biogas 5000 Gas Analyzer provided by Geotech, Leamington Spa, UK). The gaseous components that were determined were CH4, CO2, and H2S.
Additionally, for the temperature and mechanical stirring control, pH and electrical conductivity measurements of the mixture were conducted with a portable meter (Portable Waterproof pH/EC/TDS/Temperature meter-HI991301 from Hanna Instruments, Woonsocket, RI, USA).

2.2. Process Description and Material Characteristics

2.2.1. Process Description

The anaerobic digestion batch experiments were performed using the experimental installation that was previously presented in subchapter 2.1. Two aspects were mainly investigated: the influence of operating temperature and the influence of substrate-to-inoculum ratio on the process efficiency. Before starting the experiments, the reactors were purged with 25 L of N2 in order to create an oxygen-free environment. The food mixture consisted of fruits—13.48% (banana—6.74%, apple—6.74%), vegetables—67.4% (tomato—13.48%, potato—13.48%, pumpkin—13.48%, cucumber—13.48%, carrot—13.48%), and cereal food—19.14% (boiled rice), and were added to the reactor together with inoculum (325 g) and water (11 L), which were the same for all batch experiments. The working volume of the reactor was between 80% and 85% of the total volume. In Table 1, the operating temperature and food mixture-to-inoculum ratio are presented for each batch experiment.
Electrical conductivity and pH measurements were carried out over the entire period of the anaerobic digestion experiments. The pH control of the mixture was achieved using a NaOH solution in a concentration of 2 M (99.7% purity provided from Estelina Construct Building S.R.L., Bascov, Romania). Food and fruit fermentation led to low pH values of the mixture; hence, NaOH solution was added through the sampling port in certain amounts to maintain the pH above 6.5. Once the gas production started, the gas flowrate was continuously measured with a flow measurement system twice a day. After passing through the flow measurement system, the gas was accumulated in gas bags and the composition analysis of the collected gas was determined. Each batch experiment was ended after the production of gas stopped.

2.2.2. Food Mixture Characteristics

Based on data from the literature, in Table 2, the main characteristics of the selected food mixture for this study are summarized. Given the current state of research, the elemental composition for Cucurbita pepo, cucumber, apple, banana, and rice was not found in the literature. For this reason, the elemental composition (carbon (%), hydrogen (%), nitrogen (%), sulfur (%), oxygen (%)) was calculated from the amount of carbohydrates, proteins, and lipids for each food component based on the empirical corresponding molecular formula.
Therefore, Table 3 presents the content of carbohydrates, fats, and proteins together with their molecular formula and coefficients used for elemental composition calculation.

2.2.3. Biological and Morphological Characterization of Inoculum

The granular inoculum provided by local industry was characterized using a 16S rRNA molecular microbiology tool in order to classify the bacteria, archaea, and eukaryotes and the distribution between main organism categories. Hence, a high resolution and very detailed analysis of the taxonomic profile was obtained by the metagenomic sequencing technique. Total deoxyribonucleic acid (DNA) extraction and isolation were conducted after standard methods, with some changes. Firstly, 0.5 g of the samples were treated with 1.3 mL of extraction buffer solution. After intense mixing, 7 µL of proteinase K (20.2 mg ml−1) was added, followed by the addition of 160 µL of 20% v/v sodium dodecyl sulfate (SDS) solution. The steps followed thereafter were shaking by inversion and incubation of the samples at 60 °C for one hour and shaking the samples at 15 min intervals. Then, the samples were separated by centrifugation at 13,000 rpm for 5 min and the resulting supernatant was transferred to new Eppendorf tubes. The solid deposit was treated three times with 400 µL of extraction buffer solution and 60 µL of SDS solution (20%). The samples were incubated for 15 min at 60 °C with intermittent shaking at intervals of 5 min. The collected supernatant was homogenized with a mixture of phenol, chloroform, and isoamyl alcohol (25:24:1, v/v/v). The aqueous layer was separated and precipitated with a 0.7 volume of isopropanol (99.8% purity). Finally, after 15 min of centrifugation at 13,000 rpm, a brown precipitate was obtained. The precipitate was washed with 70% v/v ethanol solution followed by room-temperature drying and dissolution in TE solution (10 mM Tris Cl, 1 mM EDTA, pH 8.0).
The primers used for bacteria and archaea identification in the 16S rRNA method were 63F 5′-CAGGCCTAACACATGCAAGTC-3′, 1542R 5′ AAGGAGGTGATCCAGCCGCA-3′, and UA571F 5′-GCYTAAAGSRICCGTAGC-3′ UA1204R 5′-TTMGGGGCATRCIKACCT-3′.
These analyses were carried out both at the level of colonies isolated from the analyzed samples and at the level of total DNA extracted from these samples. Capillary sequencing was involved to determine the sequences of the amplified 16S rRNA fragments. Finally, the microbial communities were identified by homologous associations using the online BLAST database (http://blast.ncbi.nlm.nih.gov/ (accessed on 4 March 2025)).
The morphology was evaluated by measuring the size of the granules and the size distribution of the granules. This was accomplished by taking multiple pictures of the granules with the indicated scale, which were afterwards processed using ImageJ software (Java version 8).

2.2.4. TG-DTA of Food Mixture and Inoculum

Thermal gravimetric analysis of the food mixture and inoculum was carried out with a Thermogravimetric/Differential Thermal Analyzer (TG/DTA Diamond). Each sample was placed in an alumina crucible and heated from room temperature to 1000 °C with a flowrate of 5 °C min−1 in an air atmosphere. The technique was conducted on rice, the fruit and vegetable mixture, and the inoculum as a tool to analyze the compositional fraction of the substrates based on the mass loss during the thermal treatment.

2.3. Analysis of Process Performances

2.3.1. Theoretical Production of CH4 and CO2

The maximum theoretical production of biogas and its components (CH4, CO2, NH3, and H2S) can be calculated based on the stoichiometric AD reaction equation determined by Boyle (1976), starting from the chemical formula of substrate, expressed as CaHbOcNdS (Equation (1)) [51]:
CaHbOcNdSe + (a − b/4 − c/2 + 3d/4 + e/2) H2O → (a/2 + b/8 − c/4 − 3d/8 − e/4) CH4 + (a/2 − b/8 + c/4 + 3d/8 + e/4) CO2 + dNH3 + e H2S
where a, b, c, d, and e are the stoichiometric coefficients of C, H, O, N, and S, respectively
The maximum theoretical CH4 and CO2 were calculated at normal conditions of 25 °C and 1 atm using Equations (2) and (3) and were formulated based on the scientific literature review [52,53,54]:
C H 4 t h m 3 k g = 24.45 × a 2 + b 8 c 4 3 d 8 e 4 m v s
C O 2 t h m 3 k g = 24.45 × a 2 b 8 + c 4 + 3 d 8 + e 4 m v s
where a, b, c, d, and e are the moles corresponding to C, H, O, N, and S calculated from the mass of each element knowing the elemental composition and the mass of VSs for the substrates involved in the experiments. The carbon element represents the organic carbon that is contained in the biodegradable fraction (volatile matter) of the substrates.

2.3.2. Evaluation of Experimental Biogas Production and Its Chemical Composition

In this study, the amount of biogas produced and its composition were determined by following several steps. The main components of biogas were CH4, CO2, H2S, H2O, and N2, where N2 resulted mostly from the N2 purging of the bioreactor headspace. Other possible gases, such as O2, CO, and volatile compounds, were considered to be insignificant due to the lack of available analysis and the small amount reported in the literature [55,56]. Firstly, the experimental data (the flowrate of biogas and in-time concentration of CH4, CO2, and H2S) were determined with the flow measurements system and biogas analyzer. Calibration curves were used to convert the measured liquid distance between the two sides of the manometer into the flowrate of gas (L h−1). Secondly, the water concentration was calculated with the Antoine formula from the water vapor pressure at the operating temperature [57]. Finally, N2 was calculated as the difference between the biogas and the sum of CH4, CO2, H2S, and H2O. The experimental data were processed through calculation and regression fitting based on the Levenberg–Marquardt iteration algorithms and interpolation using software such as Excel, Origin, and Matlab, and the variation in gas amount and the cumulative amount of total gas and CH4, CO2, H2S, H2O, and N2 were determined and graphically represented. The steps navigated for cumulative gas calculation are described in the supplementary file information (Figures S2–S5).

2.3.3. CH4 and Organic Carbon Yield Conversion

The efficiency of the AD process was also evaluated by calculating the conversion of CH4 and the yield conversion of organic carbon, defined as the ratio between the experimental and theoretical amount of CH4, and of the sum between CH4 and CO2, respectively, as presented in the equations below:
η C H 4 = C H 4 e x p C H 4 t h × 100
η o r g a n i c   c a r b o n = C H 4 e x p + C O 2 e x p C H 4 t h + C O 2 t h × 100 ,
where
  • CH4exp and CO2exp is the amount of CH4 and CO2 produced in the digestion anaerobic batch experiments, determined as described in Section 2.3.2;
  • CH4th and CO2th is the maximum theoretical amount of CH4 and CO2, calculated as presented in Section 2.3.1.

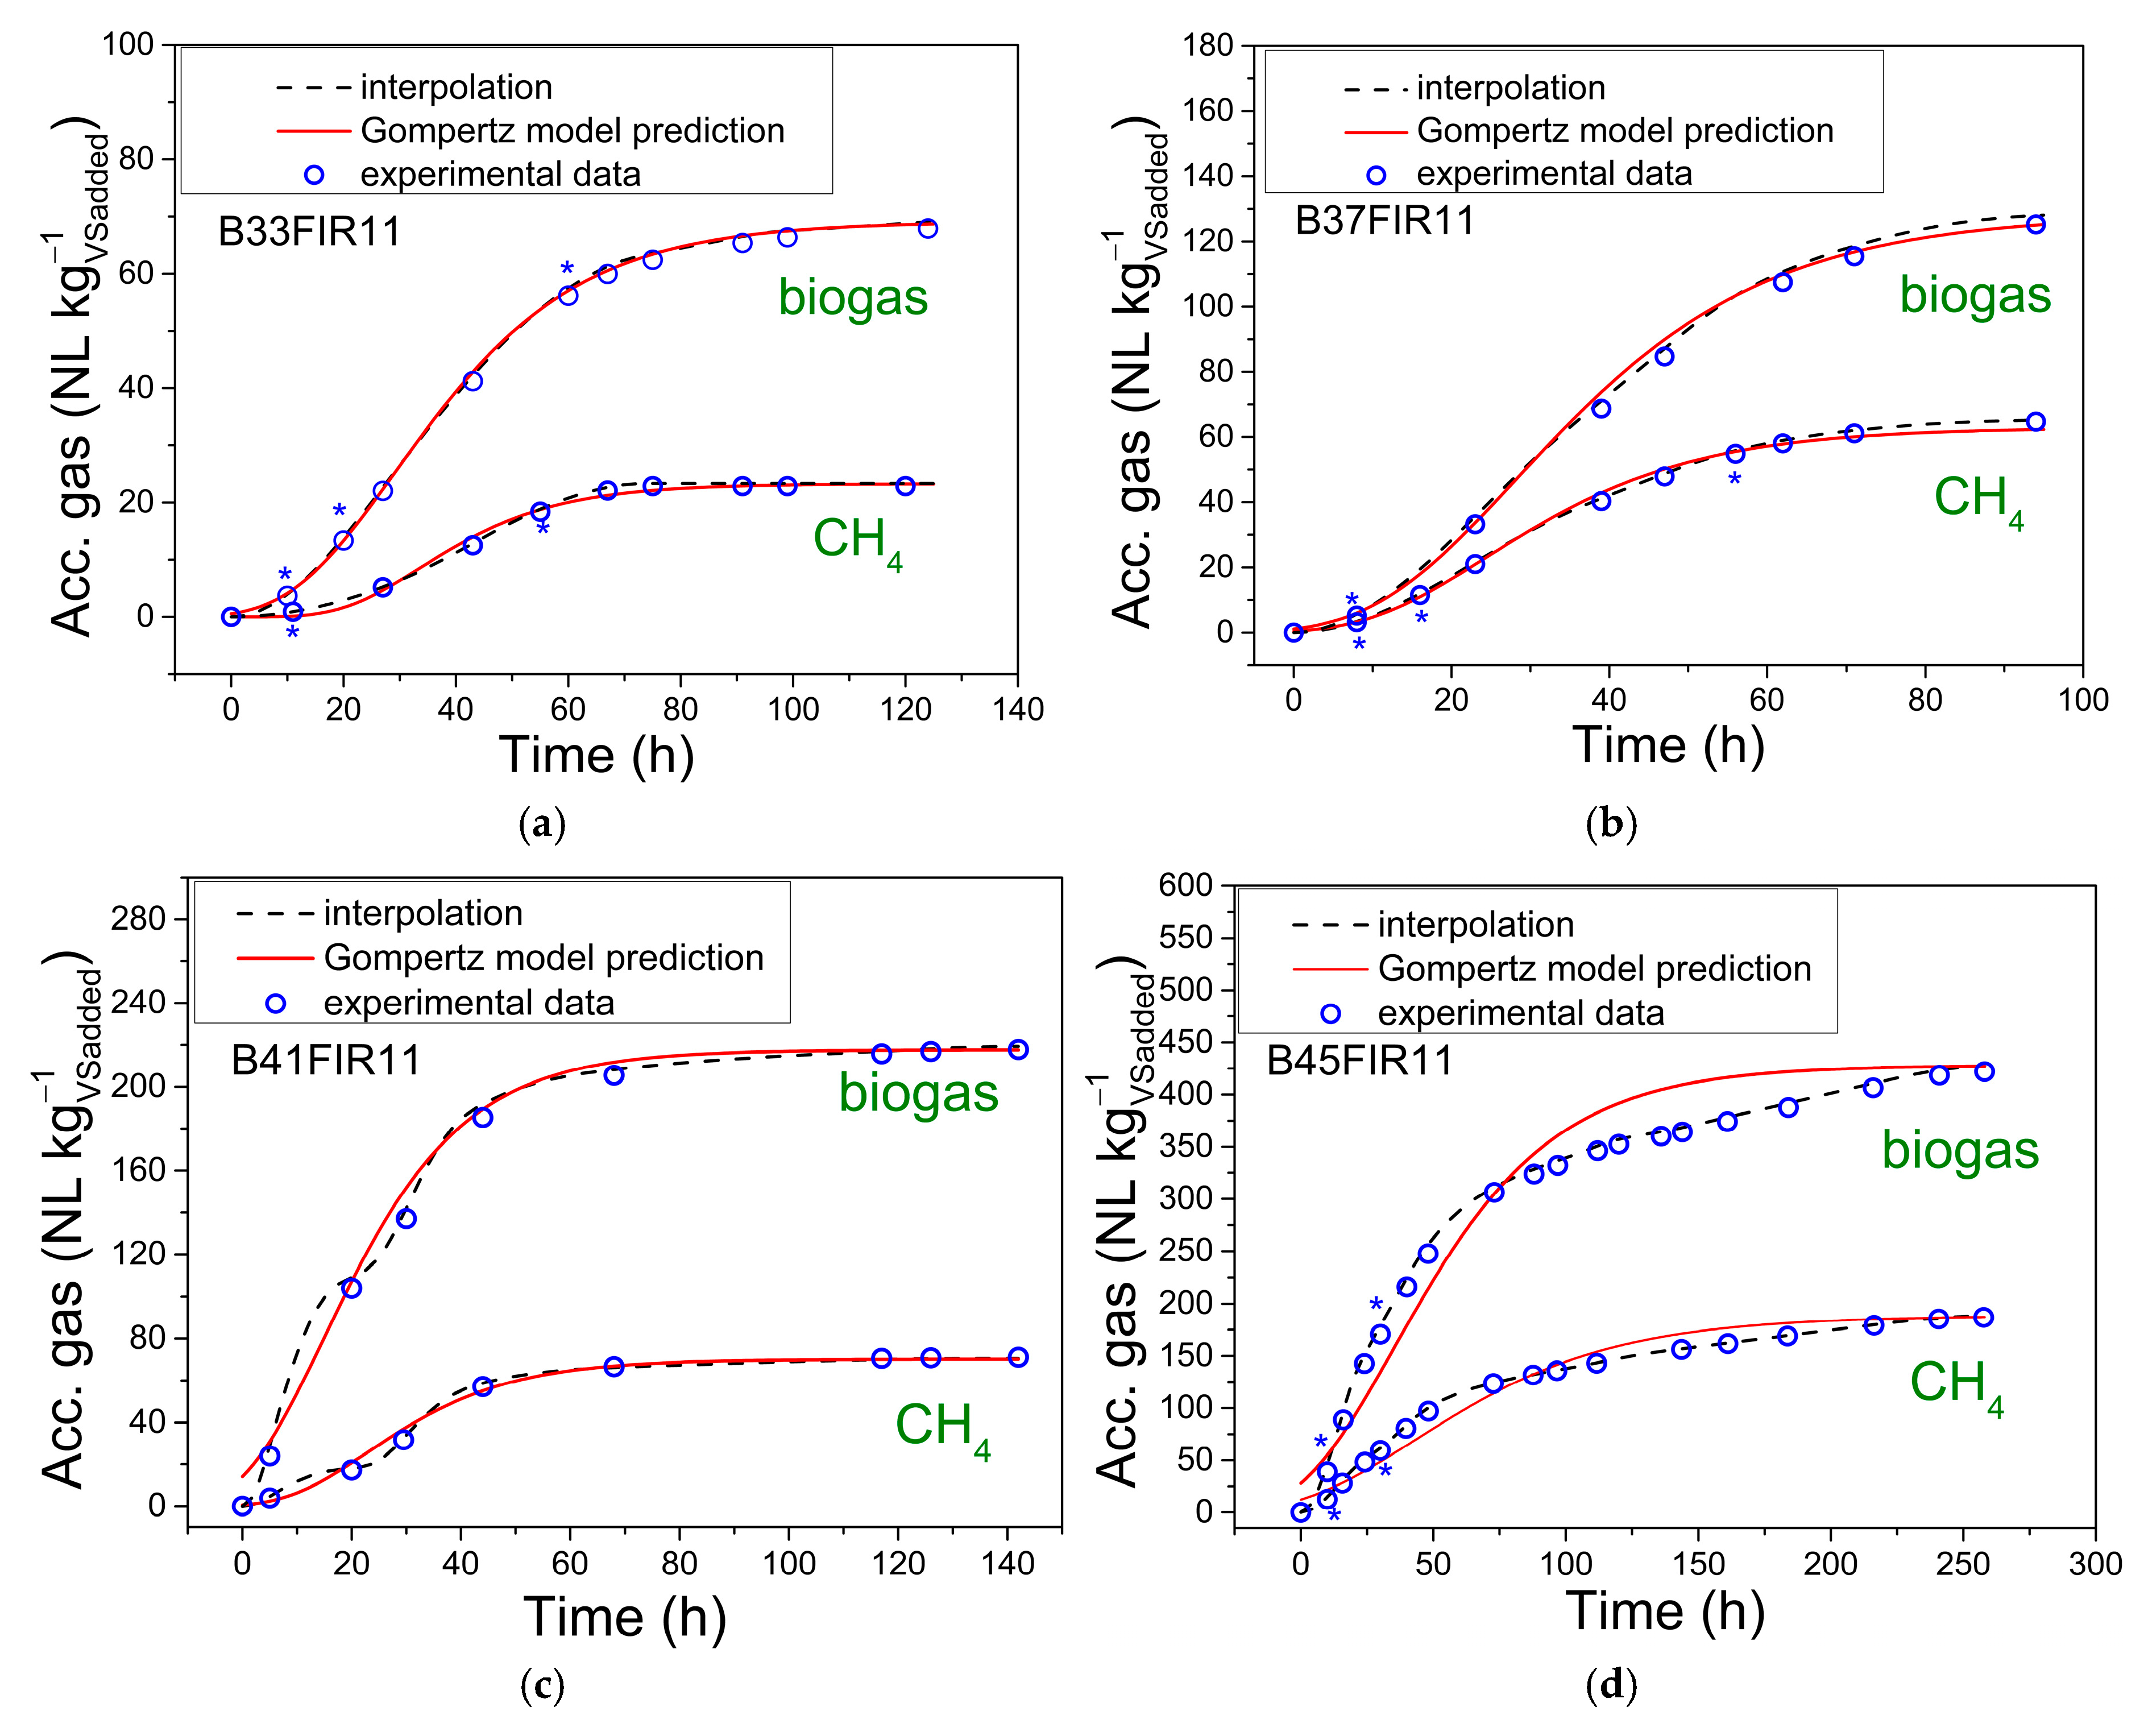
2.3.4. Gompertz Model Prediction—Kinetic Study of Accumulated Gas Production

The experimental accumulated biogas and CH4 were analyzed with a mathematical algorithm to predict their in-time dependence and extract kinetic parameters of accumulated gas evolution. For this, a modified U-Gompertz model was selected, noted as the Zwietering modification, as documented in the study conducted by Tjørve et al. [40] with the following equation:
P g a s t = M d e x p e x p e R m M d t l a g t + 1 ,
where
  • Pgas(t) is the production of accumulated gas in time;
  • Md is the value on the y axis of the upper asymptote and represents the maximum accumulated gas.
  • Rm is the kinetic parameter, the absolute growth rate, which affects the slope of the tangent to the curve.
  • tlag is the value of time when the process starts to generate gas, obtained at the intersection of the tangent to the curve with the x axis. This value can be located at 6.6% of the upper asymptote on the y axis [40].
This model is a three-parameter Gompertz model that was developed to be applied for biological processes involving bacterial growth. Herein, the kinetic parameter is the absolute growth rate, calculated from the tangent of the curve, and the model comes with the advantage that the absolute growth rate is not influenced by the upper asymptote parameter [40]. The coefficient of determination (R2) was calculated for each prediction and used for assessing the precision of the model. Matlab, Origin, and Excel software were used for data fitting, optimization, and calculation. Matlab algorithms based on the least-square calculation were implied to determine optimized parameters of modified Gompertz prediction and the coefficient of determination.

3. Results

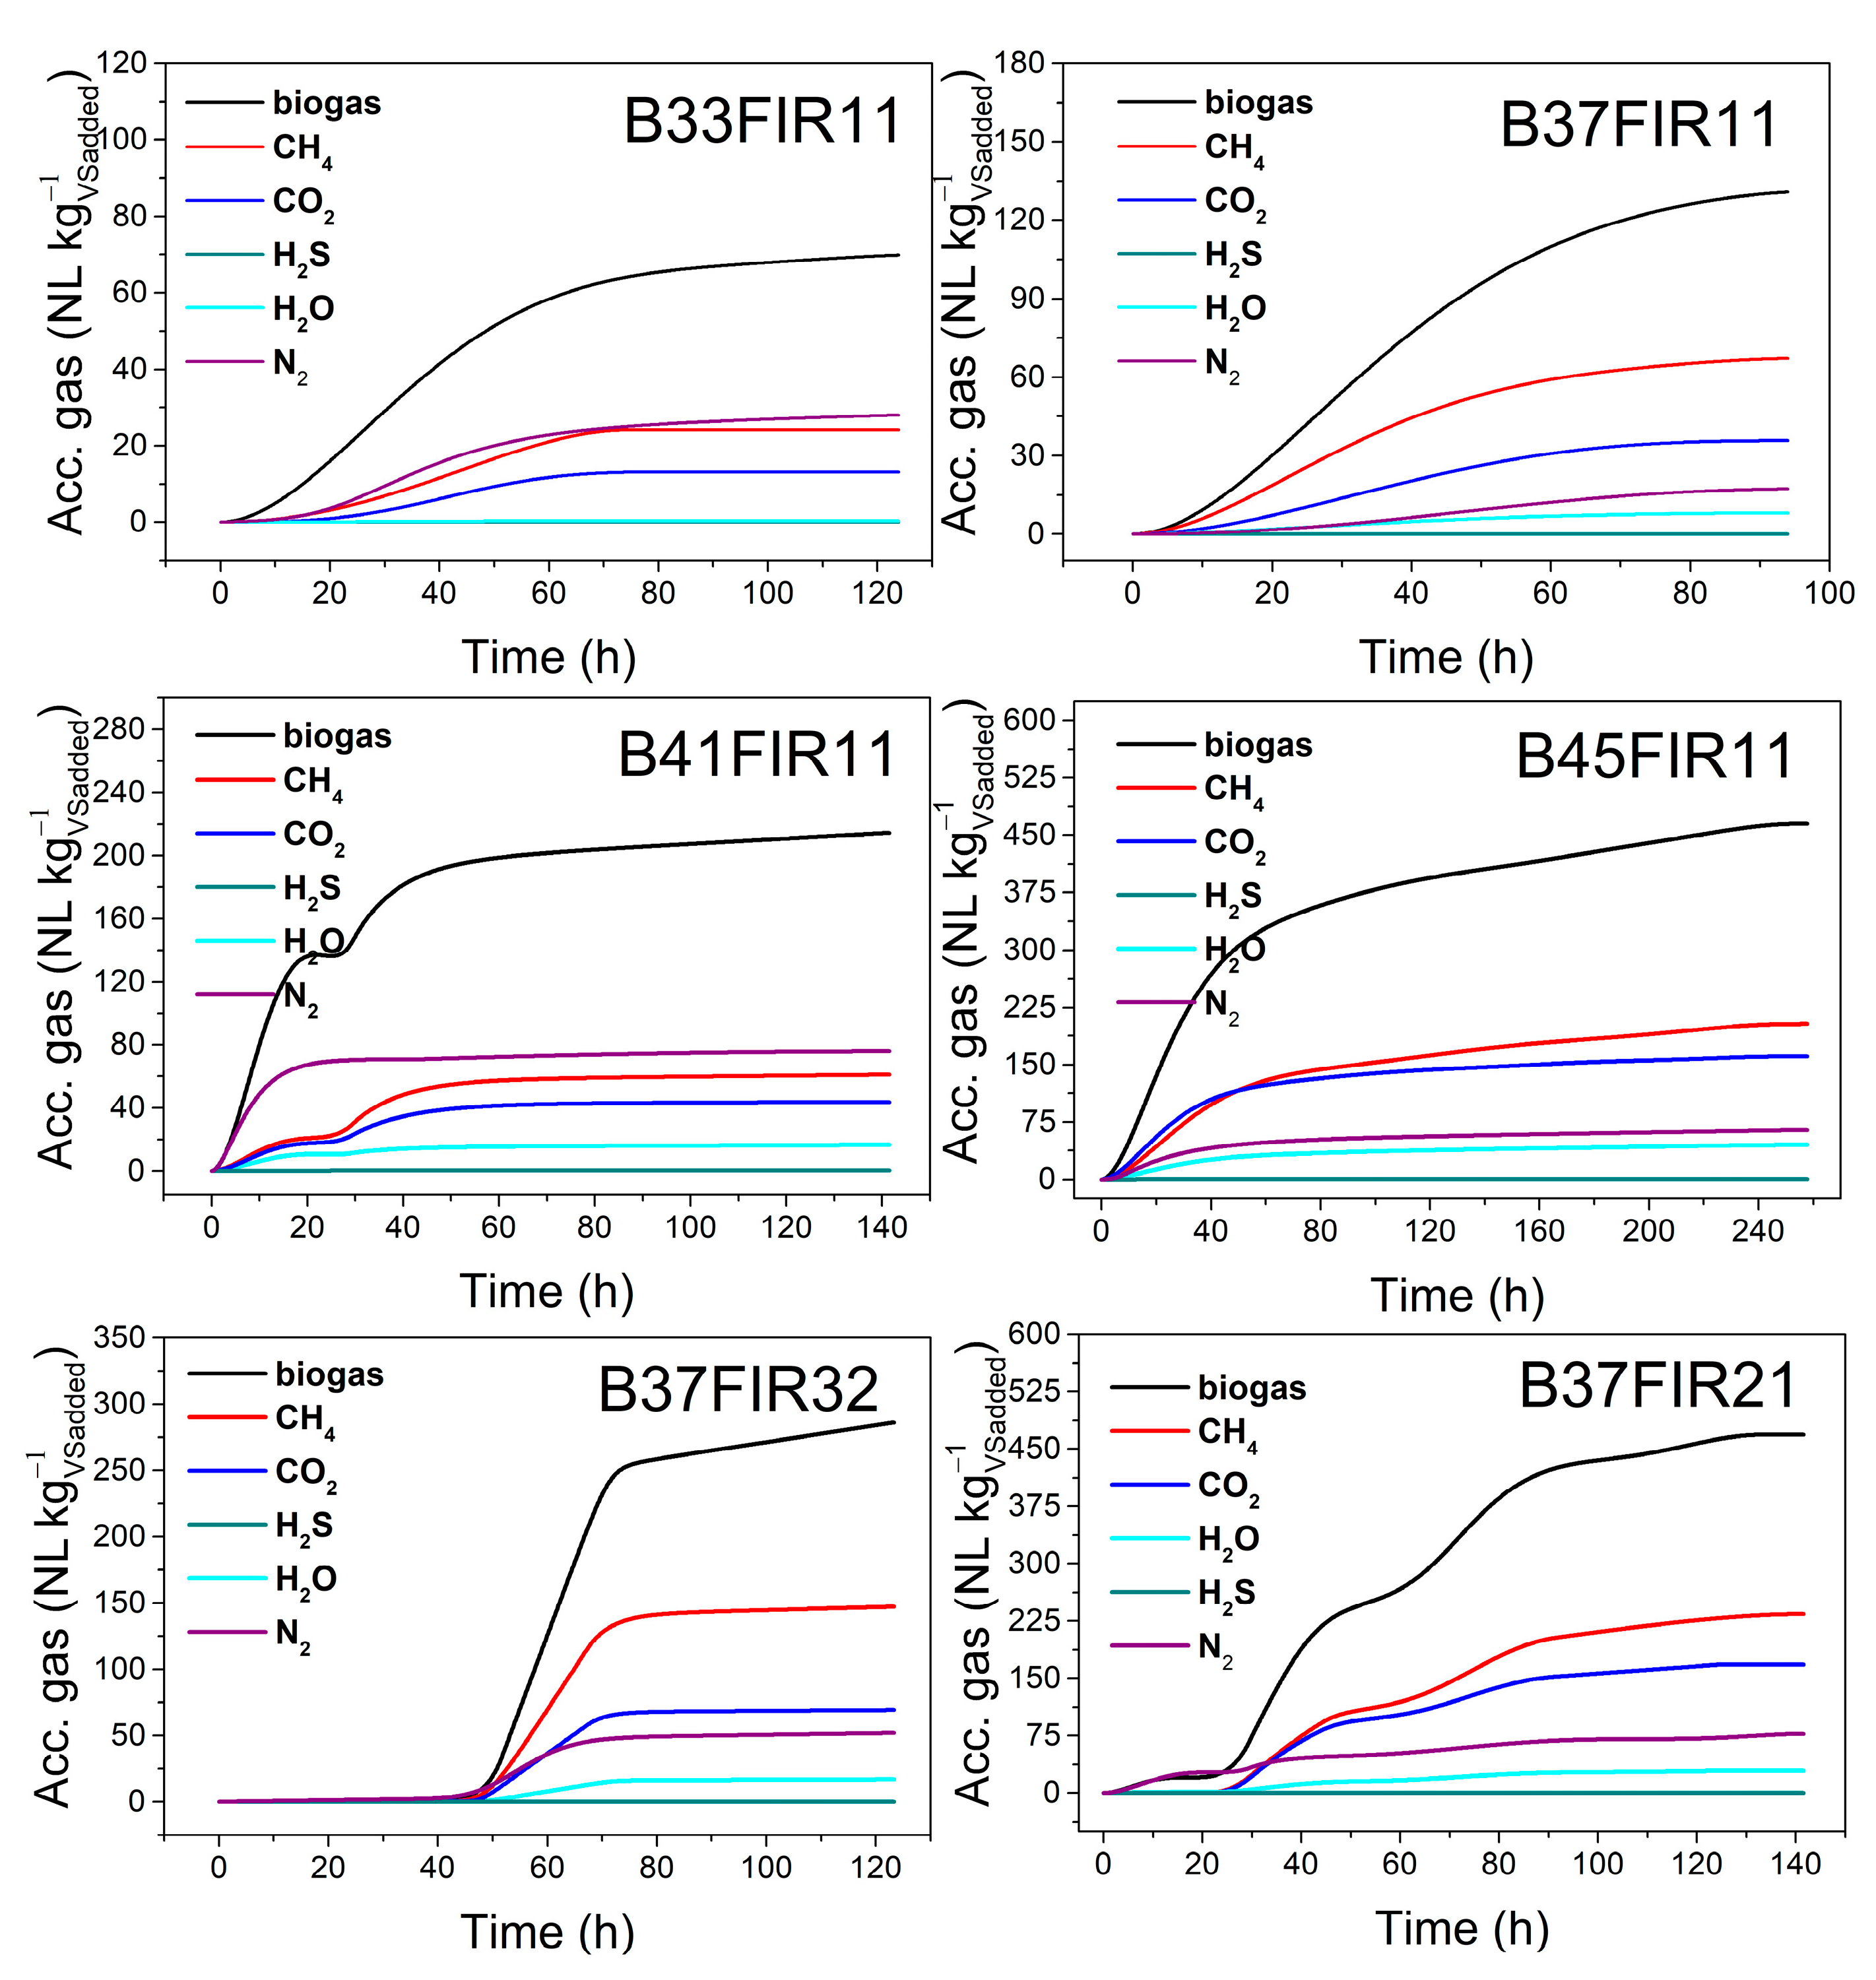
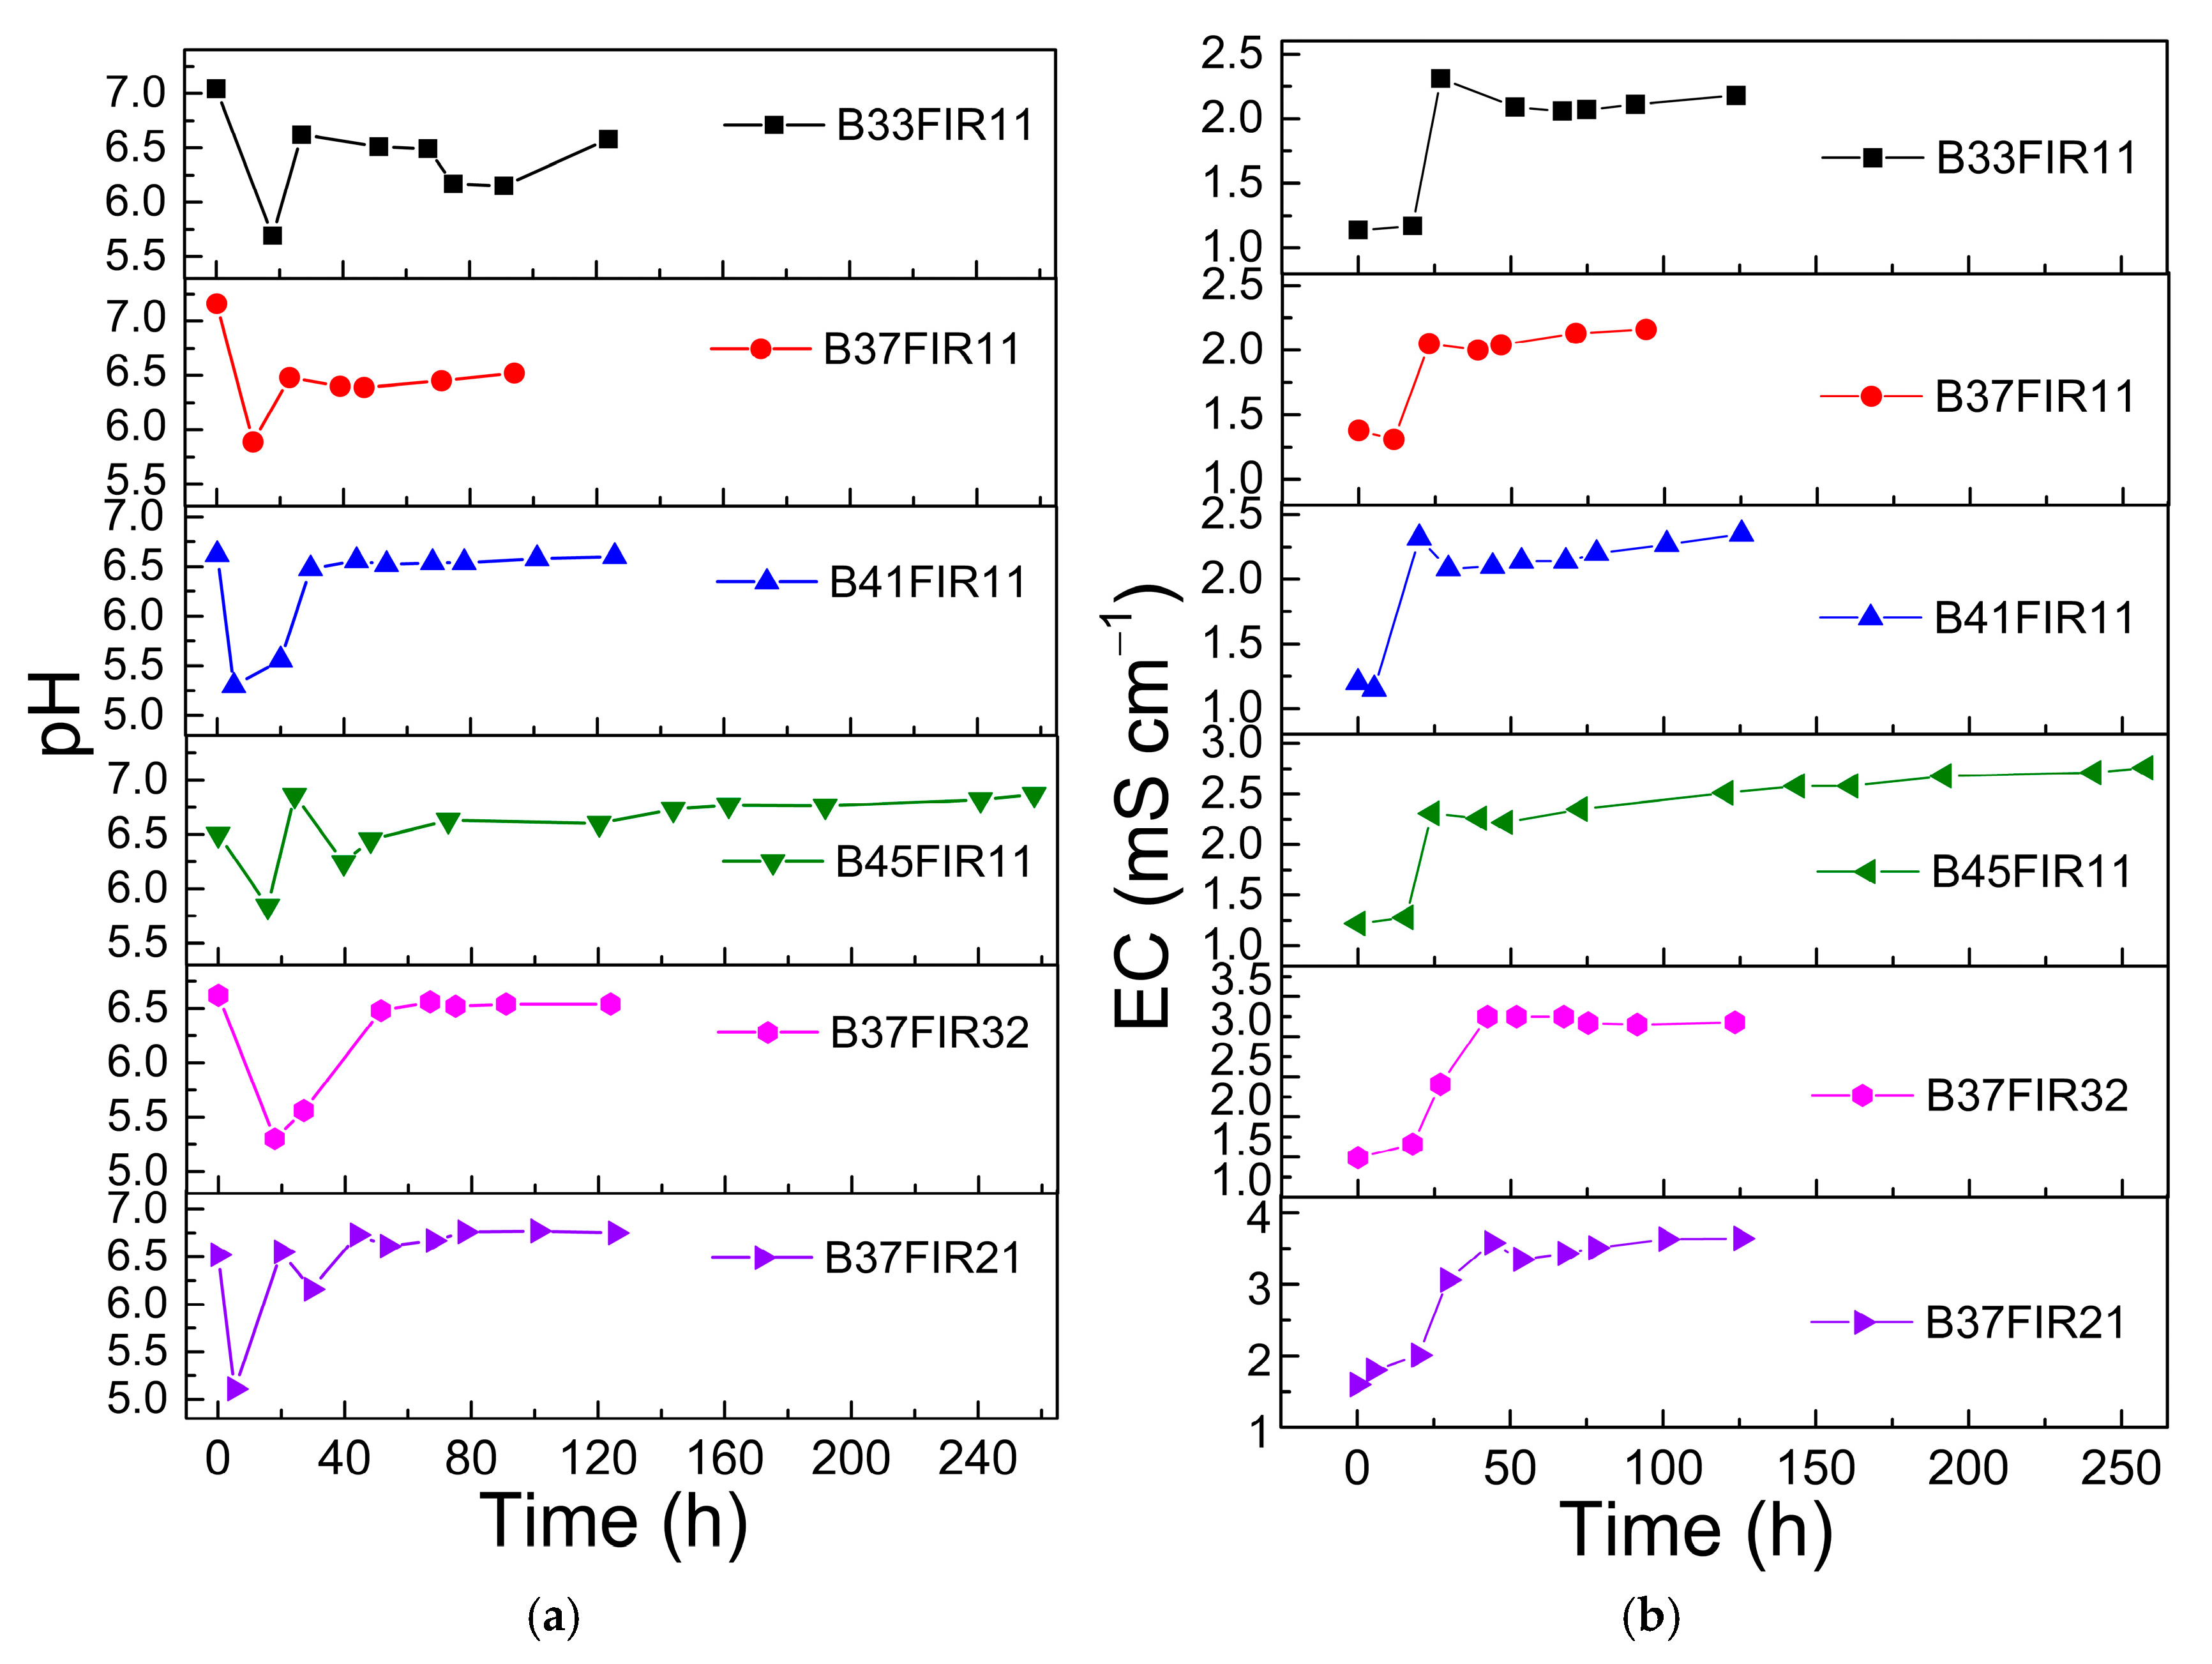
3.1. Evaluation of Process Performances: Biogas Production and Conversion Yield of CH4 and Organic Carbon

The real-time variation in biogas production and composition (CH4, CO2, H2S, H2O, and N2) expressed as accumulated gas (in NL kg−1VSadded, at normal laboratory condition of 25 °C and 1 atm, where VSadded represents VSs of the substrate–food mixture) is represented in Figure 2.
By analyzing Figure 2, it is noticed that the period of biogas production ranged between 3 days and 21 h (B37FIR11) and 10 days and 18 h (B45FIR11) and was different for each experiment. This points out that the operating temperature and substrate-to-inoculum ratio had a direct impact on the biogas production. Except for the B37FIR32 batch experiment, the biogas started to be produced from the beginning, and most of the gas was generated in the period up to 40–80 h.
The representation of the pH variation monitoring (Figure 3a) points out that there was a rapid decrease in the pH of the suspension from the initial value in the range of 6.82 ÷ 7.16 to the value in the range of 5.56 ÷ 5.89 after 12 h of the process. The pH correction was immediately attained after pH decrease and after correction; the pH of the mixture was kept constant at around 6.5 without other adjustments. The rapid variations in electrical conductivity (illustrated in Figure 3b) appeared in the same time range as the pH, with a rapid increase in the values. The increase in EC at the beginning of the experiments can be correlated with the increase in ionic concentration caused by the addition of NaOH for pH regulation. It can be noticed that the EC values in the batch experiments B37FIR32 and B37FIR21 increased compared to the other experiments, which indicates that the EC was influenced also by the composition of food mixture subjected to AD. The increased mass of food mixture implies that a higher amount was converted into volatile fatty acids, which increased the ionic strength of the solution [58].
The total amount of biogas and of its components (CH4, CO2, H2S, H2O, and N2) obtained in each experiment are shown in Table 4 and Table 5.
Biogas production can be evaluated according to two criteria: based on the effect of operating temperature on the process (B33FIR11, B37FIR11, B41FIR11, and B45FIR11 experiments) and based on the effect given by the inoculum-to-substrate ratio (B37FIR11, B37FIR32, and B37FIR21 experiments). Hence, analyzing the effect of operating temperature, the production of biogas increased with temperature; the highest biogas production of 465.37NL kg−1VSadded was obtained for the B45FIR11 experiment. While the biogas and CH4 amount were significantly higher for B45FIR11 compared to B33FIR11 and B41FIR11, the highest CH4 percentage was obtained in the B37FIR11 anaerobic process (51.32%), followed by the B45FIR11 experiment (43.64%). Also, B37FIR11 showed the lowest H2S concentration.
Assessing the second set of experiments, the increase in substrate-to-inoculum ratio (from 1:1 to 3:2 and 2:1) led to a very significant volume of biogas produced, from 130.7 NL kg−1VSadded to 286.25 NL kg−1VSadded and 486.59 NL kg−1VSadded of biogas and from 67.19 NL kg−1VSadded to 147.2 NL kg−1VSadded and 233.95 NL kg−1VSadded of CH4. The production of gas improved as the substrate-to-inoculum ratio increased, whereas the biogas composition was more similar for B37FIR11, B37FIR32, and B37FIR21 compared to the composition obtained in the first set of experiments (B33FIR11–B45FIR11). In the second set of experiments, the advancement in gas production as the FIR was boosted indicates that the inoculum did not reach its maximum capacity of consuming the substrate and converting it into biogas.
CH4 is the component of biogas that is of interest from an energetic point of view and, in this way, the CH4 yield conversion was used as a tool to assess the process efficiency towards CH4 formation, while the organic carbon yield conversion was used as a tool to analyze the conversion of easily degradable fraction of the substrate (Table 6). The maximum CH4 yield conversion was attained at thermophilic conditions ( η C H 4 = 33.57%) in the B33FIR11, B37FIR11, B41FIR11, and B45FIR11 set experiments and for the highest substrate-to-inoculum ratio, with η C H 4 = 36.42% for the B37FIR11, B37FIR32, and B37FIR21 set experiments. The yield conversion of CH4 and organic carbon were very similar, but there was a considerable difference between η C H 4 and η o r g a n i c   c a r b o n for the B45FIR11 and B37FIR21 experimental studies. This may be indicative that as the temperature and the amount of substrate increased, the ability of the inoculum to catalyze substrate fermentation reached its maximum potential.

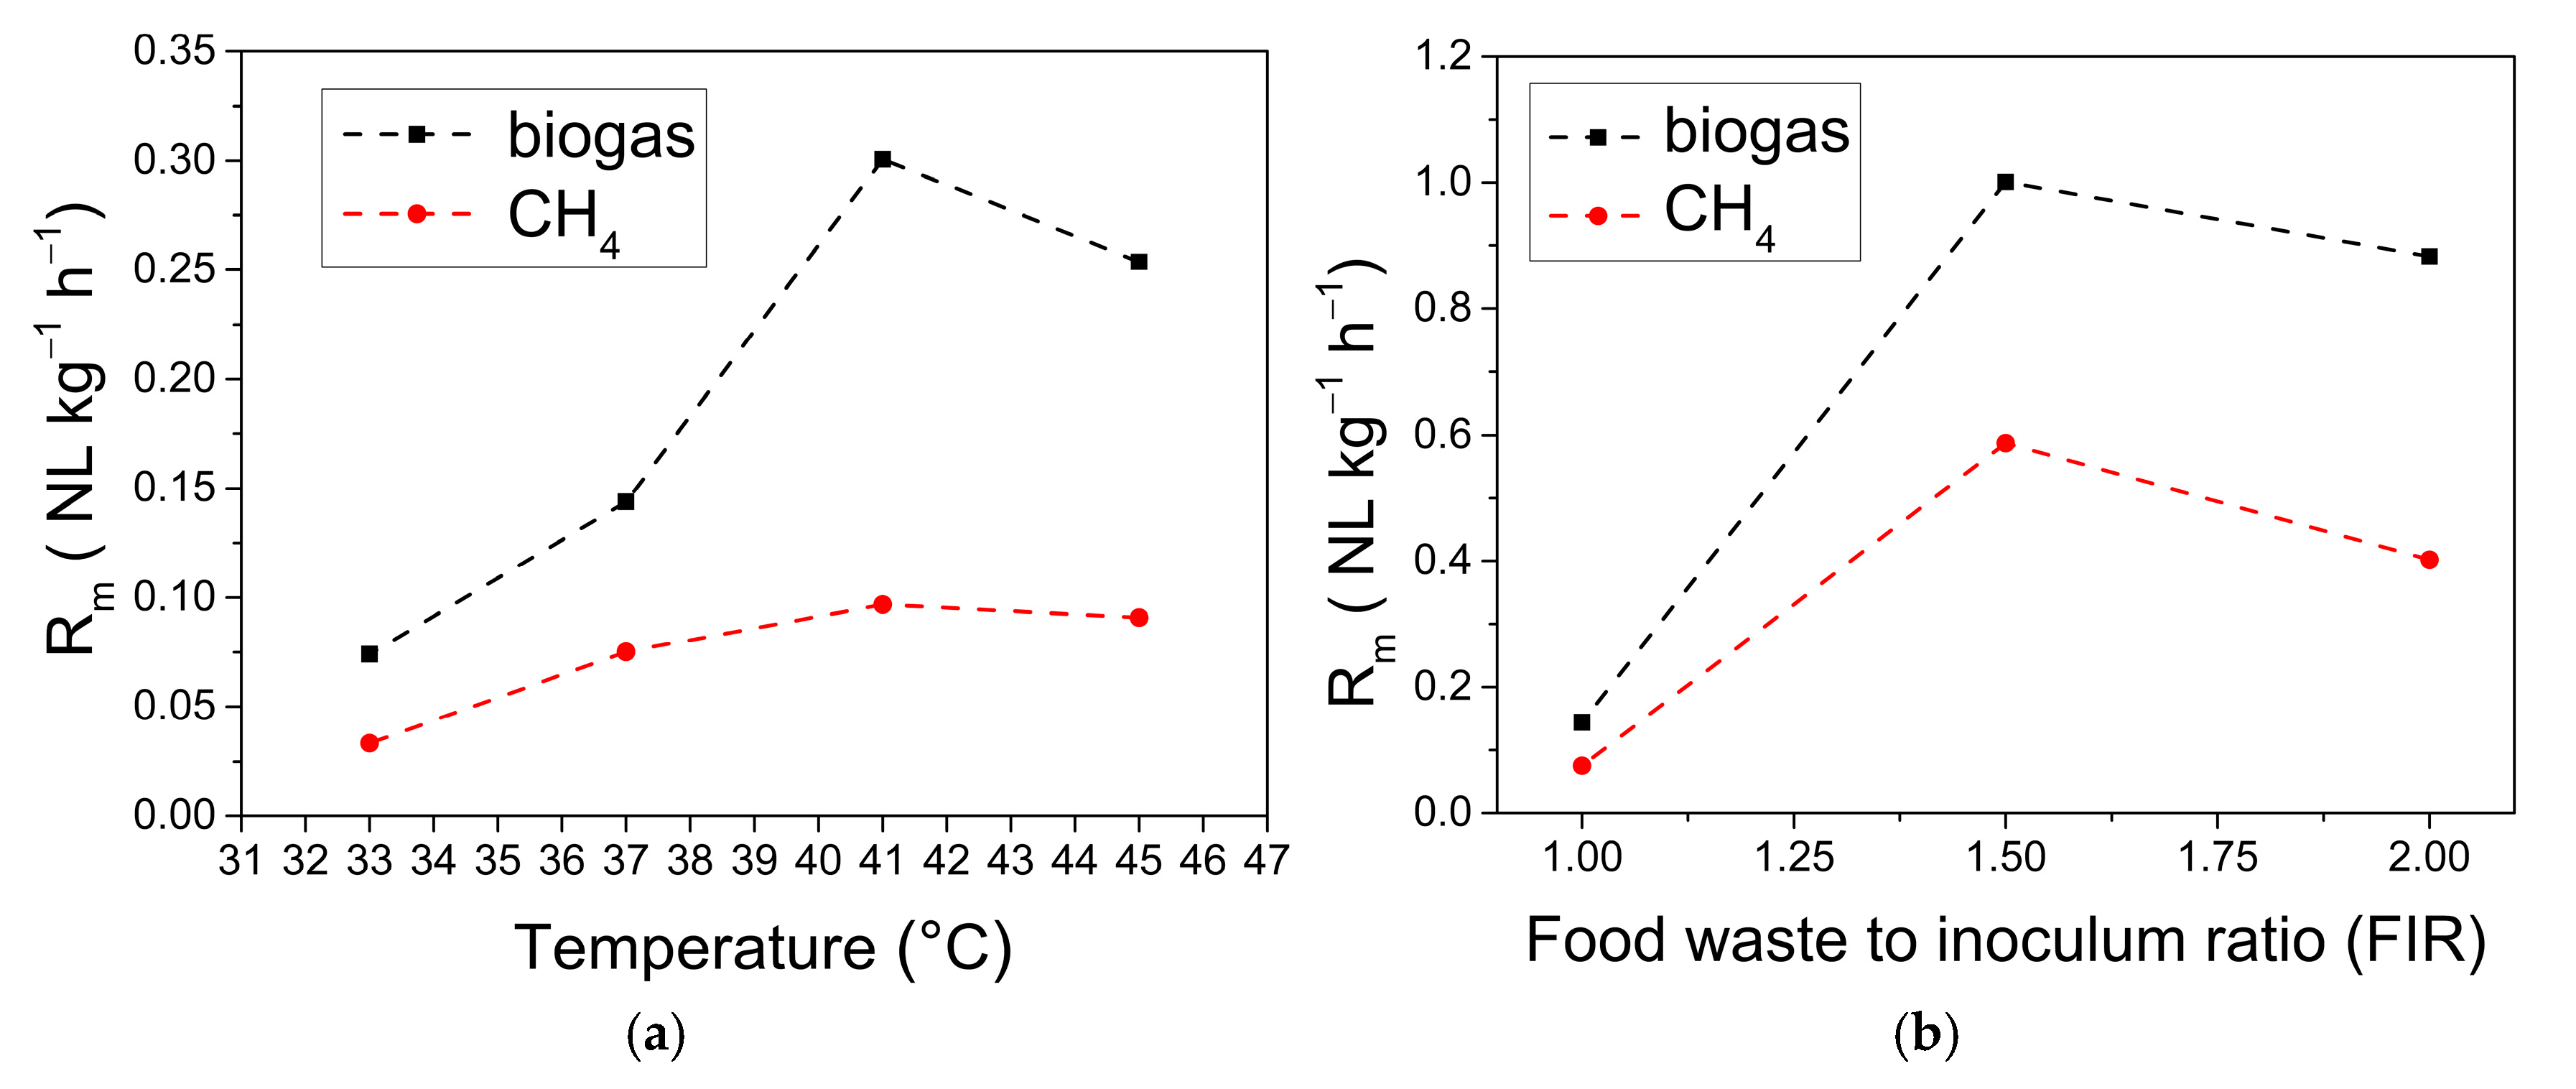
3.2. Gompertz Model Prediction

The Gompertz model (U-modified version, Zwietering modification [40]) was applied to predict the cumulative production of biogas and CH4 and is represented in Figure 4.
The parameters of the Gompertz equation (Md, Rm, and tlag) were calculated and are shown in Table 7. The coefficient of determination (R2) was also calculated for each case and used to appreciate the accuracy of the prediction model compared to the real data (calculated by interpolation), and are exhibited in Table 7. Hence, the R2 coefficient was higher than 0.98 for all experiments, except for B45FIR11, where the R2 was 0.92 for biogas and 0.94 for CH4. With regard to these results, we can attest that U-modified Gompertz model (the Zwietering modification) can be deemed an appropriate prediction algorithm to simulate the gas accumulation for biogas and CH4 of these particular experiments, conducted as previously described.
The data can be interpreted as for the other results: considering the effect of operating temperature and the effect of food mixture-to-inoculum ratio. The Md coefficient, which is equivalent to the total accumulated gas studied in the previous chapter (Figure 2), progressed as the temperature and FIR increased. When it comes to the process kinetics, the absolute growth rate parameter (Rm) was boosted when the temperature ranged from 33 °C to 41 °C, as is illustrated in Figure 5a. For the temperature of 45 °C, the rate of CH4 production was similar to the precedent one and lower for the biogas. When FIR fluctuated from 1:1 to 3:2, as shown in Figure 5b, Rm increased, followed by a decrease when FIR was modified to 2:1 (for both biogas and CH4). This variation can be connected to the tlag values; for B37FIR32, the higher value of tlag, which signifies a prolonged period for anaerobic fermentation to take place and biogas to be produced, may have caused a sharp increase in gas production once the process started, recovering the delayed tlag. For B37FIR11 and B37FIR21, the production of gas (evaluated as accumulated gas) progressed with a lower rate than in the case of B37FIR32. The comparison between B37FIR11 and B37FIR21 indicates the following relation: a lower tlag implied a lower Rm, and a higher tlag implied a higher Rm.

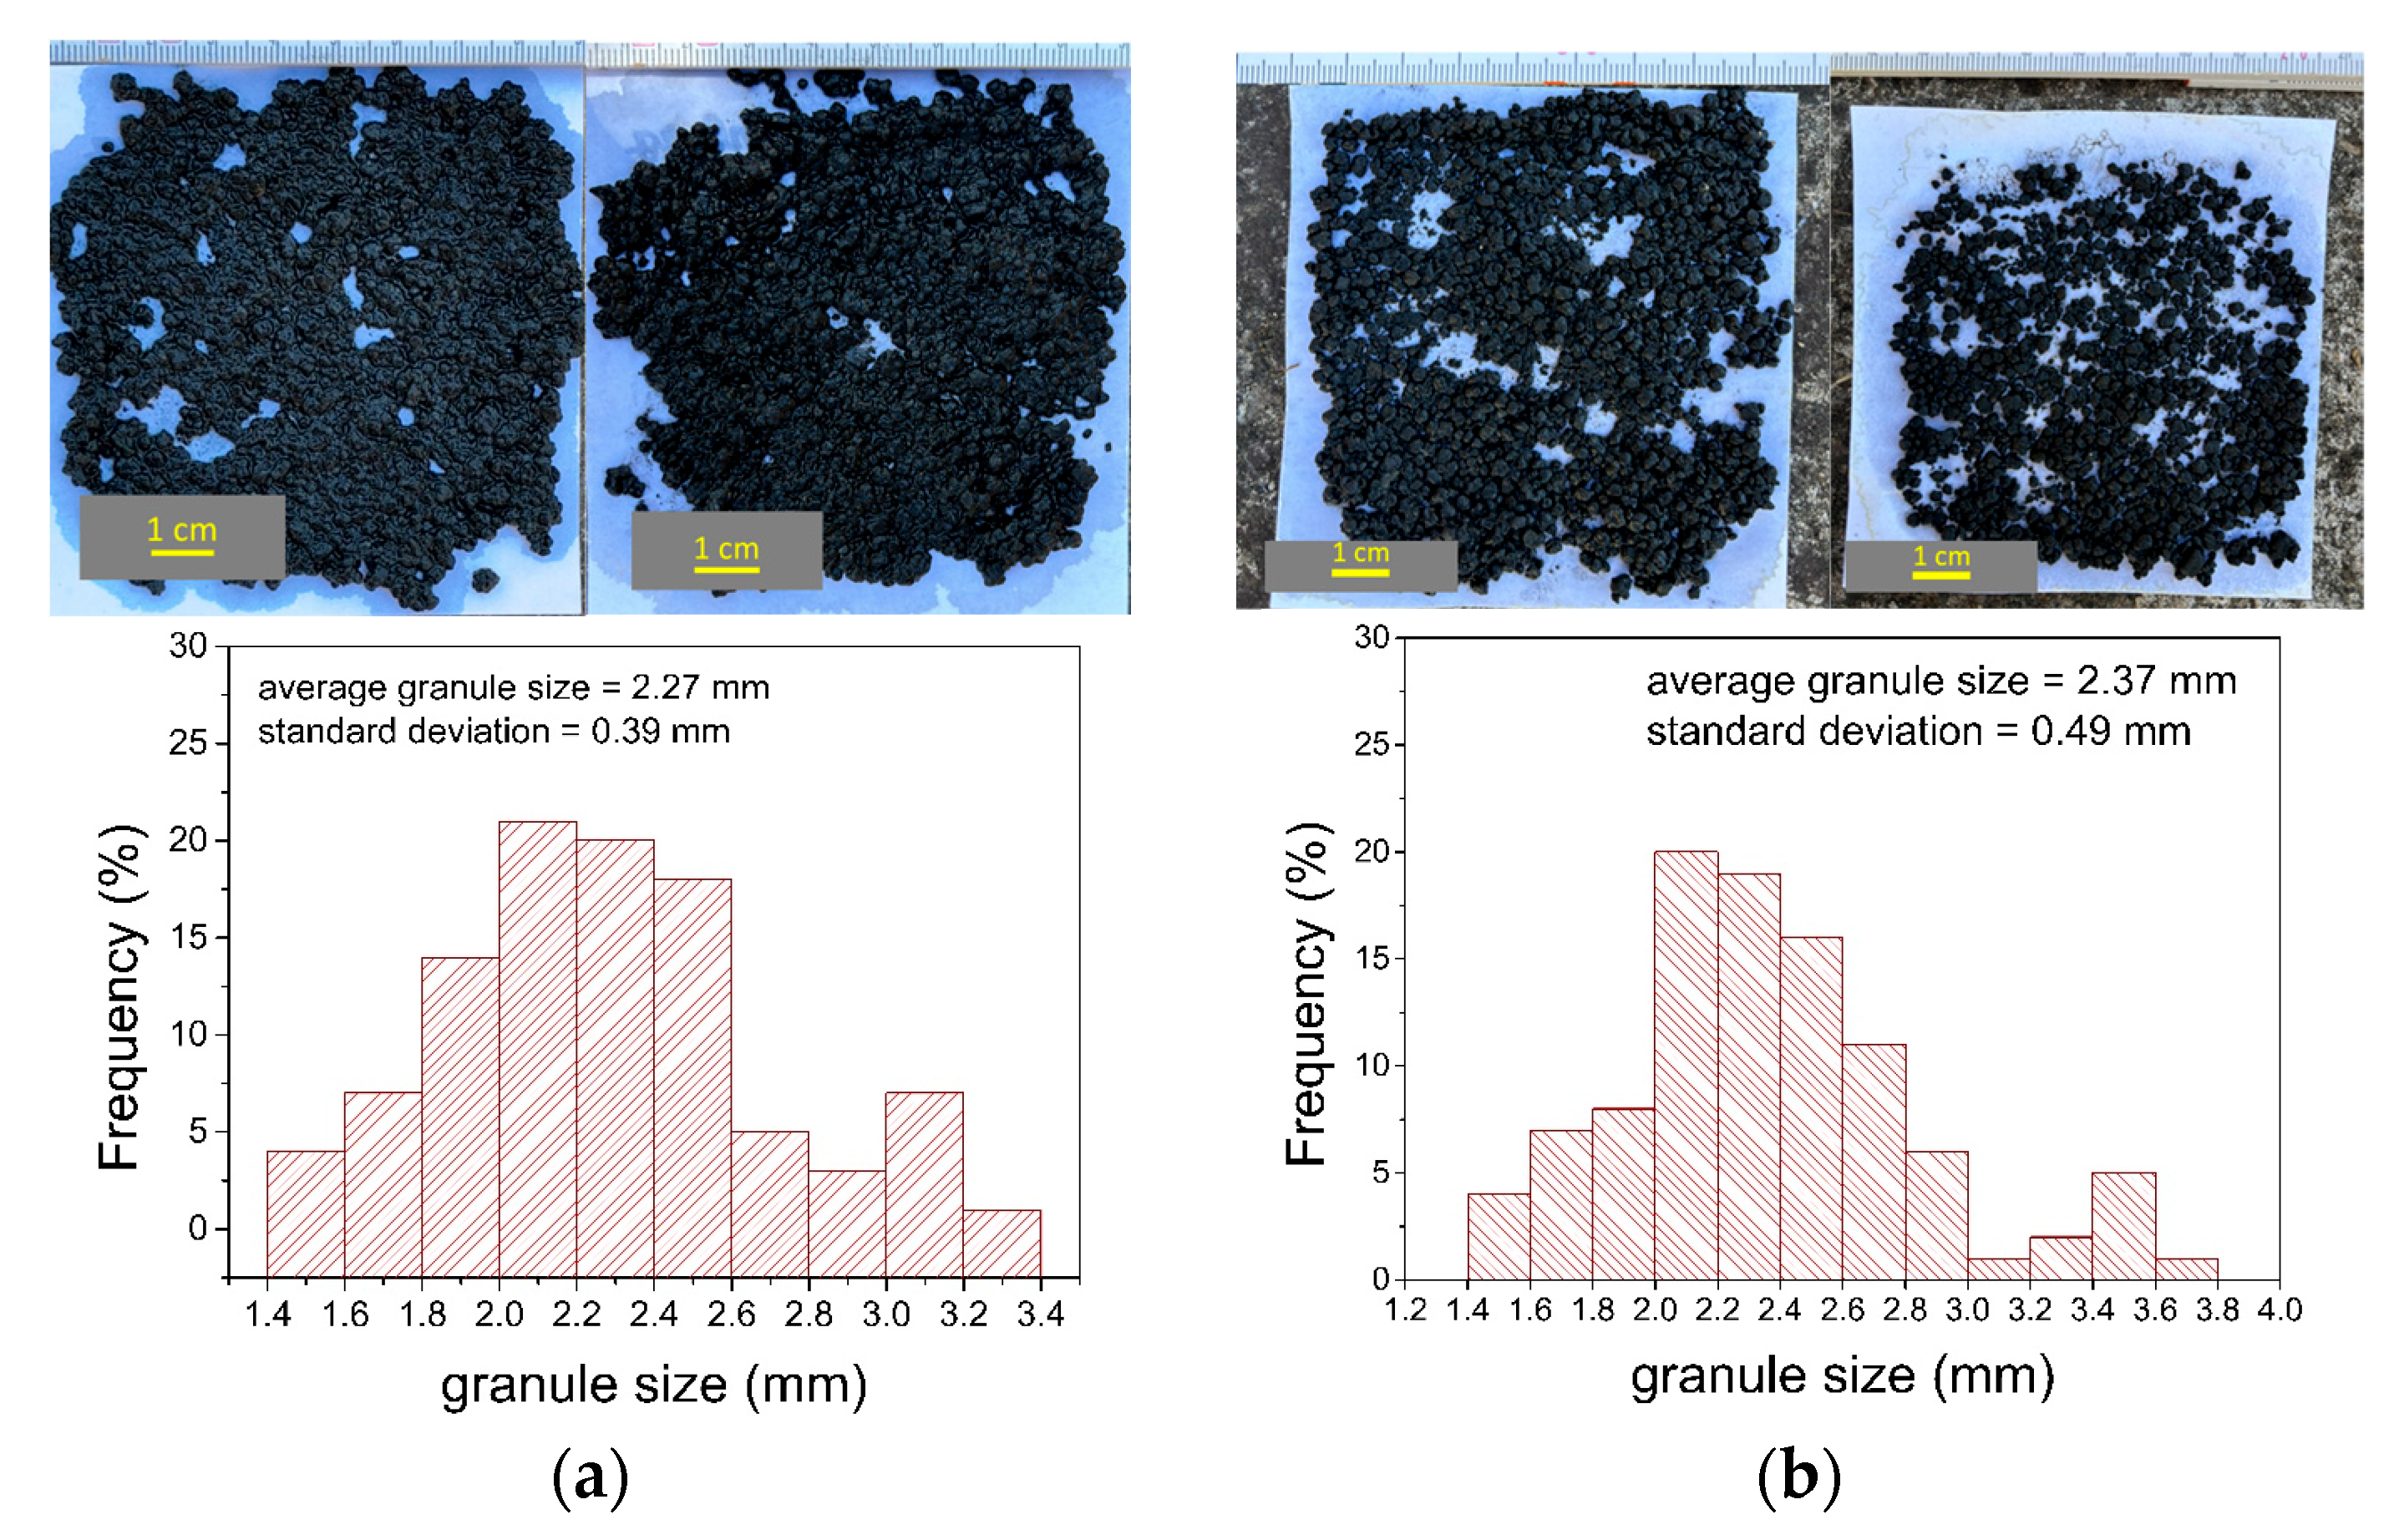
3.3. Morphological and Biological Characterization of the Inoculum

The microbial consortia of the inoculum were contained in black round-shaped industrial granules (Figure 6). The distribution of granule size is represented with histograms, and the calculation shows that the average size of the granules was 2.3 mm.
The composition of the microbial population is exhibited in Figure 7, wherein the main bacteria phylum and classes are categorized.
Hence, non-methane microorganisms accounted for 92% in the domain Bacteria, with the main phyla being Proteobacteria (44%), Bacteriodetes (17%), and Firmicutes (16%), and the methane-forming microorganism accounted for 6% in the domain Archaea, with the main classes being Methanomicrobia (3%) and Methanobacteria (1%). In this study, within the phyla Proteobacteria, Betaproteobacteria was the dominant class, with 21% and responsible for consuming propionate, butyrate, and acetate, followed by Gamma-, Alpha-, and Deltaproteobacteria, with 11%, 6%, and 5%. Phyla proteobacteria are bacteria that consume glucose, propionate, butyrate, and acetate and mediate the acetogenesis step in AD [59,60]. Clostridia (10%) and Bacteroida (13%) represented the main classes in the Firmicutes and Bacteroidetes phylum. Archaea were representative of the methanogenesis step, and the abundant methanogens identified based on the taxonomic profile were Methanomicrobiales (3%) and Methanobacteriales (1%).

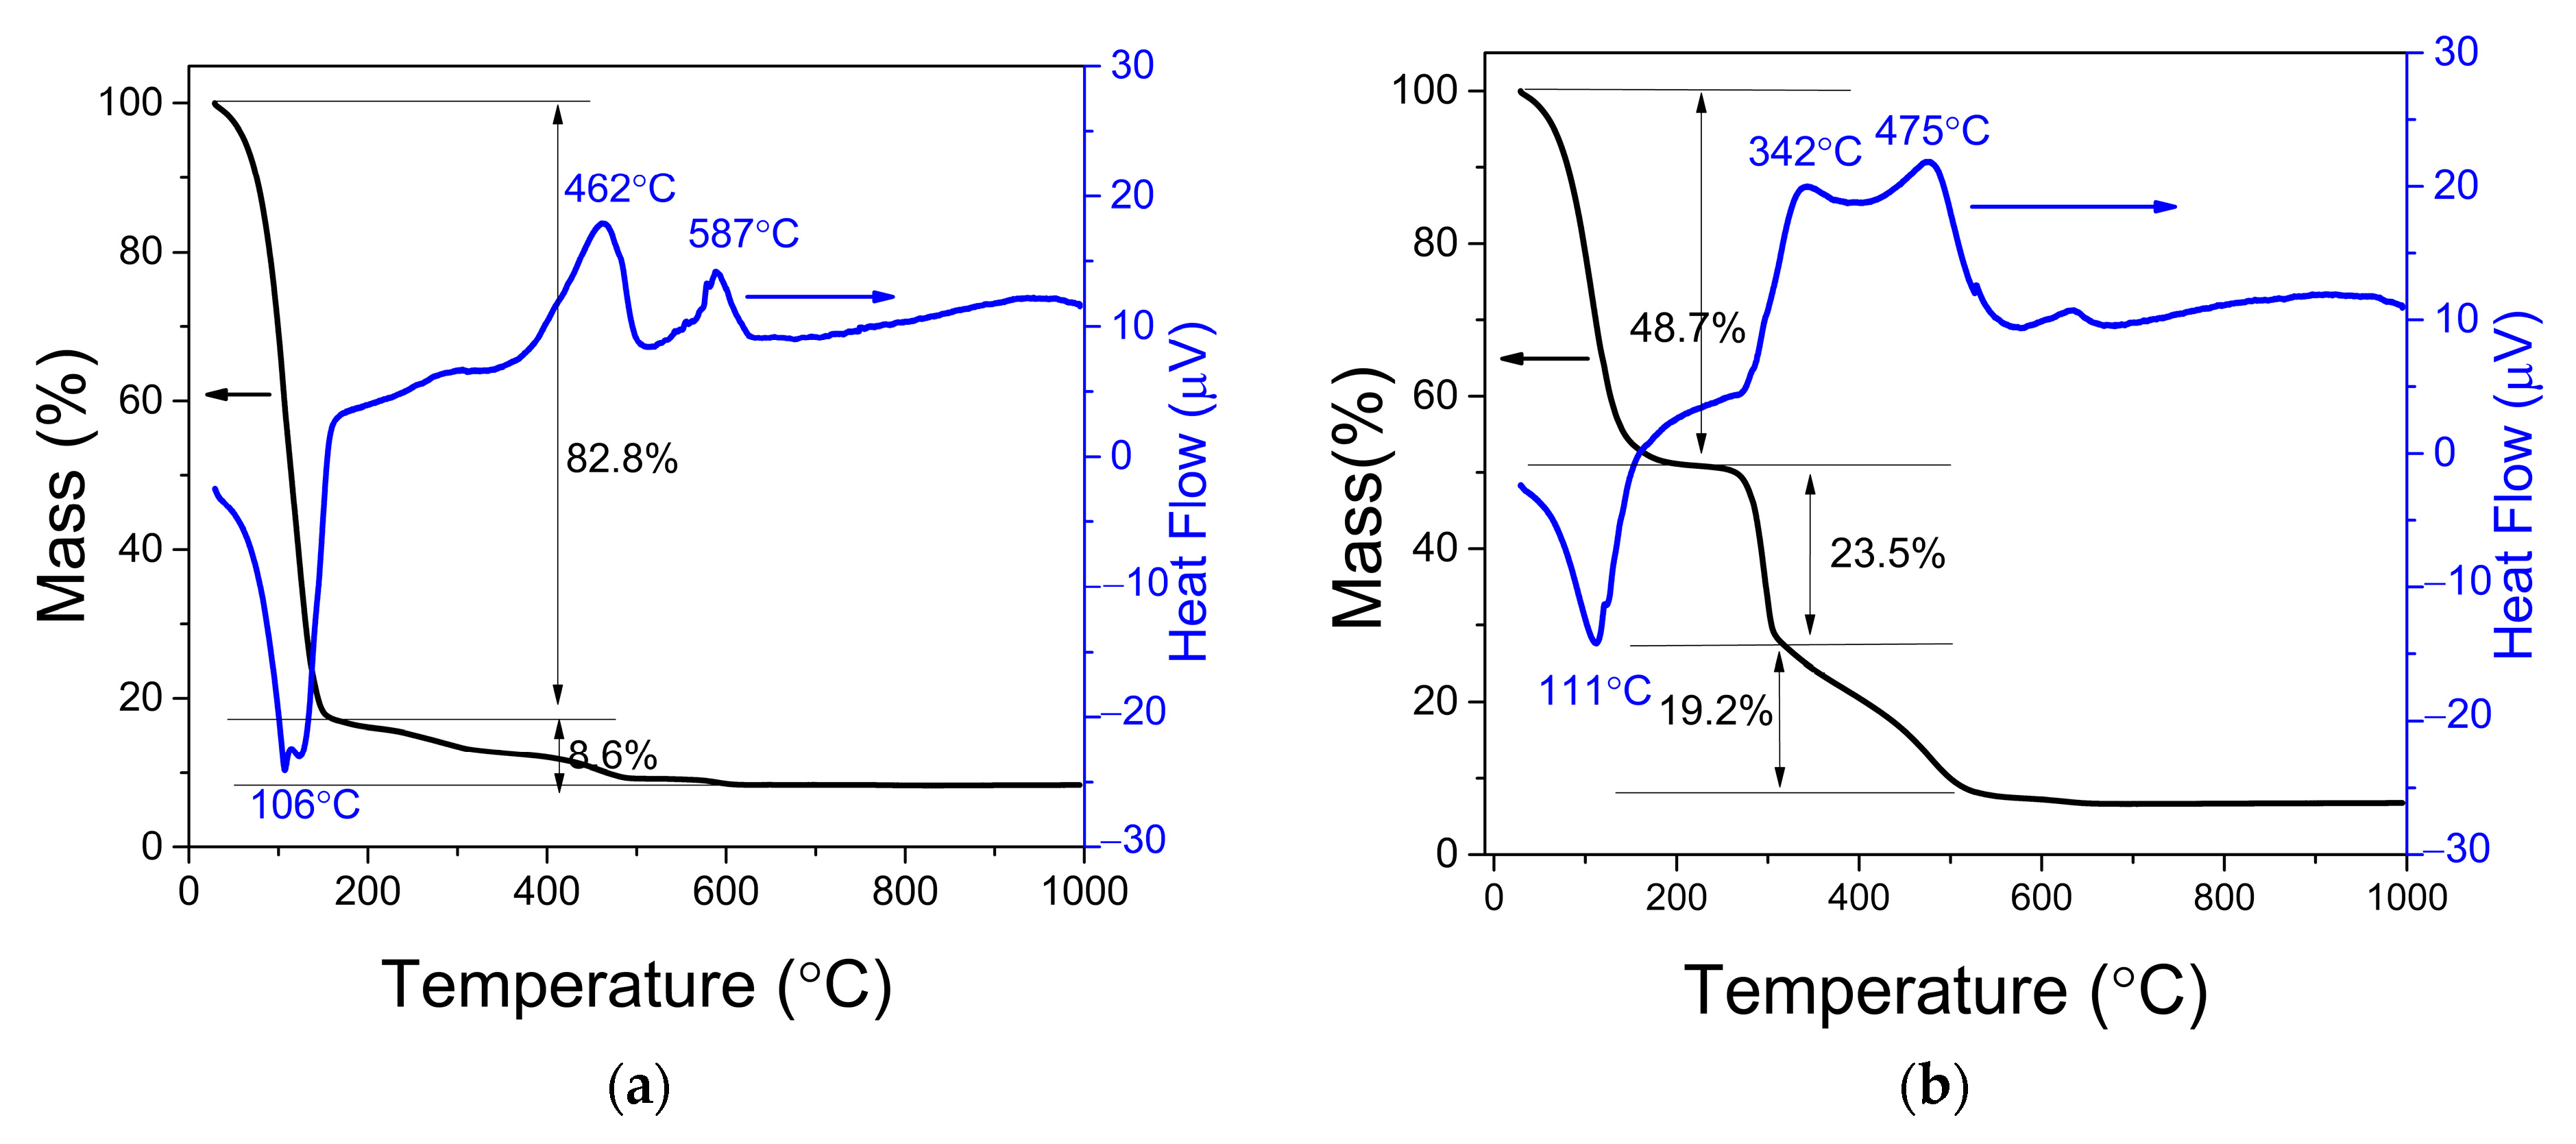
3.4. TG-DTA of Food Mixture and Inoculum

The thermogravimetric and differential thermal analyses of the AD mixture were carried out separately for the fruit and vegetable mixture (Figure 8a), boiled rice (Figure 8b), and the industrial granular inoculum (Figure 9).
The analyses exhibited weight loss and the corresponding processes (endothermic or exothermic) at different temperature ranges, which are indicative of substrate stability and the availability of organic fraction in the substrate. By analyzing Figure 8 and Figure 9, a significant weight loss for all components between 0 and 150 °C can be seen, which is ascribed to the water evaporation indicated by the endothermic peak (~110 °C) in the DTA profile.
For the boiled rice, the TG and DTA curves showed two stages: the first one between 270 and 300 °C, which corresponds to the degradation of carbohydrates and semivolatile compounds, and the second one between 300 °C and 530 °C, attributed to the decomposition of polymers and more complex organic material (proteins, cellulose, lipids). The two exothermic peaks (at 342 °C and at 475 °C) are consistent with the two aforementioned decomposition processes [61,62,63]. In the case of the fruit and vegetable mixture, after water evaporation, a weight loss occurred between 150 °C and 620 °C. As previously mentioned, this stage marks the decomposition stage: first the carbohydrates and volatile compounds, and afterwards the complex molecules. The exothermic peaks at 462 °C and 587 °C correspond to lignin and cellulosic compounds. Similarly, the inoculum TG-DTA curve shows weight loss in the range of 150–520 °C, with an exothermic peak at 493 °C [64,65,66].

4. Discussion

Starting with the results disclosed previously in subchapter 3.1., the short operation time intervals (between 3 and 10 days) are pointed out, which were lower compared to the typical retention time of the AD process found in the range of 15 to 30 days under mesophilic conditions [4,8]. This short operation time implied a fast starting process, which was assessed with the tlag parameter of the Gompertz model prediction and also indicated by the obvious variation in pH and EC at the beginning of the process (Figure 3). The pH decrease was given mainly by the fermentation of fruits and vegetables, wherein glucose and fructose and other compounds such as cellulose and hemicellulose are converted into organic acids (butyric, lactic, and acetic acids) and afterwards into ethanol, H2, and CO2 [67,68]. The TG-DTA analysis (Figure 8) showed, as documented in the literature regarding the physico-chemical of the substrate (Table 2), the high content of water and organic matter (sugar and hemicellulose, cellulose and lignin), which are highly prone to biodegradation [63,65,66]. All these corroborated results serve as an explanation for the quick conversion reactions of the volatile matter into gas. The easily degradable volatile matter of the substrate and the inoculum might have had a synergetic effect on the biochemical transformation. Moreover, fast biochemical reactions at the beginning also indicate the high reaction rate of the hydrolysis step, which is commonly a rate-limiting step in the AD process. For this reason, substrate–microorganism adaptations were not needed in this study to overcome the slow hydrolysis stage, as is frequently encountered in other AD investigations [69]. According to other studies, electrical conductivity can be considered a parameter to assess and monitor the AD process. The ionic concentration of the mixture can be influenced by pH, volatile fatty acids (VFAs), and CH4 production, but it can be also measured in combination with other properties, such as total dissolved solids, total suspended solids, COD, BOD, nitrates, and phosphates in AD for wastewater treatment [70,71,72,73]. The variation in EC values was ascribed in this study to the possible ionic strength variation caused by pH regulation and the concentration of substrate [58].
Based on the disclosed results concerning the process performances, the production of CH4 was in the range of 24.08 NL kg−1VSadded to 233.95 NL kg−1VSadded, with the highest production of 233.95 NL kg−1VSadded at an FIR of 2:1 and 37 °C, followed by 203.03 NL kg−1VSadded of CH4 at an FIR of 1:1 and 45 °C. The amount of produced CH4 in our work falls within the spectrum documented in other similar existing studies concerning the AD of fruit and vegetable waste with various types of granular inoculums [15,31,32,33,34]. The summarized results on CH4 production for the aforementioned studies and our work are presented in Table 8. Still, the findings reported by Miramontes-Martínez et al. indicate by far the highest CH4 production, of 776.3 L kg−1VSadded [15].
When evaluating the effect of the two studied parameters (operating temperature and FIR) on the overall performances, it can be concluded that the improved process efficiency obtained when the substrate-to-inoculum ratio increased is attributed to more substrate being available for degradation concomitantly with the microbial consortia potential to mediate the substrate biodegradation. High temperature favors high rates of biochemical reactions, which is consistent with the chemistry thermodynamics considering that the operating temperature was selected in a range that can accommodate the activation of microorganisms. As stated in the studies conducted by Fernandez et al. and Gavala et al., it is concluded that hydrolysis and acidogenesis are strongly affected by temperature [68,74]. This can be further correlated with microbial consortia of the inoculum. Therefore, Proteobacteria and the Firmicutes phylum, which were contained in the inoculum used in this study, as revealed in the taxonomic profile (Figure 7), encompass both mesophilic and thermophilic bacteria, which were involved in the hydrolysis and acidogenesis step [75,76]. The temperature domain wherein microorganisms are active is associated with higher gas production at increasing temperature. High temperature is linked also to improved viscosity of the mixture, substrate diffusion, and its accessibility for bacteria-assisted degradation [76]. Furthermore, the loading of more substrate while maintaining the same operating temperature suggests that more time was needed for the substrate to be digested and indicates that the growth rate increased with the amount of substrate. Herein, the tlag values suggest that the microorganism required a longer acclimatization period when the FIR was increased and that CH4 formation was initiated subsequently to biogas production, which aligns with the theory of the four-stage mechanism of the AD process [69]. Contrary to this trend, when the composition of the substrate was the same and the operating temperature was increasing, the time required for the process to start decreased, indicating that higher temperatures stimulate the production of gas sustained by the course of both the tlag and the Rm values, calculated with regard to the temperature effect. From the perspective of accumulated data simulation, it was noticed that the coefficient of determination of the applied modified Gompertz model was lower in the case of B45FIR11 (R2 = 0.9234 for biogas and R2 = 0.9440 for CH4). Also, differences between the curve shapes of the applied Gompertz model and the interpolated data (Figure 4) were seen for B41FIR11, B45FIR11, and B37FIR21, despite the high values of R2 for B41FIR11 and B37FIR21. These observations introduce the necessity of testing different prediction models in future research that will target improved accuracy of data prediction.
Referring again to the hydrolysis and acidogenesis stages, it can be mentioned that Gamma-proteobacteria, the second most abundant proteobacteria contained in the inoculum of this study, is also commonly associated with the hydrolysis step, wherein complex organic compounds are converted into soluble products by cleaving different types of bonds, such as peptide bonds, ester bonds, and glycoside bonds [59,60]. Different studies have documented Proteobacteria, Bacteriodetes, Firmicutes, and Archaea to be the main phyla in anaerobic inoculums, representing 27% for Proteobacteria, above 18% for Firmicutes, 12% for Bacteriodetes, and 2–5% for Archaea [56,59].
Clostridia and Bacteroida, the major classes in the Firmicutes and Bacteroidetes phylum, are hydrolysis- and acidogenesis-mediating bacteria and can be associated with the quickly starting the fermenting process and quickly decreasing the pH, as described above [60,77,78,79]. Methanomicrobiales (3%) and Methanobacteriales (1%) of the Archaea domain are responsible for catalyzing the formation of CH4 from CO2 and H2; therefore, the presence of these methanogens suggests a hydrogenothrophic pathway for CH4 production. It is known that methanogens are working syntrophically with acetogens, as, for example, acetate is a direct substrate for CH4 formation and for methanogenesis [59]. Methanogenesis is the final stage of AD whereby CH4 results in anaerobic conditions from complex biochemical reactions through the metabolic action of methanogens. The precursors that drive the reactions are H2 and CO2, formate and methanol for the hydrogenotrophic pathway, acetate for the acetoclastic pathway, and methylated compounds for methylotrophic metabolism. Methanogenesis is strongly affected by pH and temperature, but as methanogenesis can be hardly separated from the other AD stages, a broader range of factors is attested to impact CH4 production. Herein, we can mention feedstock type and organic matter loading, volatile fatty acids, ammonia, and inorganic elements. Higher operating temperature and increased concentration of total ammonia nitrogen are favorable to hydrogenotrophic CH4 formation. Moreover, carbohydrates, acidic pH, and a high content of volatile fatty acids are also linked to improved hydrogenotrophic CH4 formation over the acetoclastic pathway [80,81].
On the other hand, lowered pH values favor the abundance of proteobacteria but hinder the activity of methanogens, which can also explain the behavior related to the short time of the AD batch operation [79]. It is widely acknowledged that AD is strongly affected by pH, which is explained by the sensitivity of the fermentation microorganisms to pH. The variation in the pH environment outside of the optimal range causes imbalances to the bacteria activities and the biotransformation-supported reaction at different stages of AD. For example, highly acidic conditions are beneficial for hydrolytic, acidogenic, and acetogenic bacteria such as Firmicutes or Proteobacteria and inhibit methanogenic bacteria [79]. This aspect suggests that future improvements with regard to the close substrate–bacteria dependency can be explored.

5. Conclusions

The biogas production in relation to the specific operational parameters is the central idea of this study, bringing new insights about the AD of food waste, mainly fruits and vegetables, with granular inoculum. To the best of our knowledge, this topic has not been extensively investigated in the literature. This research highlighted that both operating temperature and substrate-to-inoculum ratio had a significant impact on the biogas production and AD process. According to the calculations as exhibited in the work, the biogas production increased by ~7 times with the increase in temperature from 33 °C to 45 °C and with the increase in the inoculum-to-substrate ratio from 1:1 to 2:1. The substrate mixture composition was selected to overcome the limitative properties of fruit and vegetable substrate, mainly referring to the instability caused by low pH and C/N ratio values and the increased content of volatile acids. To this end, boiled rice was added to the fruit and vegetable mixture to obtain a C/N between 20 and 30 (23.49), as recommended, and the industrial granular inoculum was selected as a rich bacterial environment for the process. Increased acidity was still obtained, the fast hydrolysis step was indicated, and the AD process occurred between 3 and 10 days. The Gompertz model emphasized the improvement in the biochemical conversion reaction, as indicated by the increased constant growth parameter when the temperature and FIR were increased. For the experiments in which a higher amount of substrate was loaded, the higher values for the tlag parameter suggest that more time was needed to start the process, which implies that the capacity of the same amount of inoculum did not reach its maximum potential to degrade the substrate but also that the contact between the substrate and inoculum can be improved. TG-DTA analysis and physico-chemical characteristics of food waste mixture pointed out the high content of water and the volatile fraction of the substrate. Based on the taxonomic profile analysis of the inoculum, it was identified that the microorganisms responsible for mediating the reactions of the acetogenesis, acidogenesis, and hydrolysis steps represented a major proportion of the totality of the inoculum bacteria. While anaerobic digestion of food waste, as studied in this work, maintained some expected challenges, as documented in the literature, the results associated with higher biogas production and higher conversion of CH4 in the B45FIR11, B37FIR32, and B37FIR21 experiments disclose the potential of the AD process to be further optimized and that the fast conversion of the substrate can be turned into an advantage depending on the final application. Herein, for future perspectives, the food waste mixture–inoculum configurations can be extended to other types of co-substrate of municipal or industrial sources, such as wastewaters. High-buffering feedstock can also be considered as a co-substrate in future work. Given the current results, the potential application of this study can be correlated with the valorization of food waste in combination with industrial waste through the AD process for energy production.

Supplementary Materials

The following supporting information can be downloaded at: https://www.mdpi.com/article/10.3390/fermentation11060348/s1, Figure S1: (a) Picture of experimental set-up components; (b) Picture of the bioreactor sub-components; Figure S2: (a) first step: representation of CH4 flowrate experimental values (the asterisk symbol marks added experimental data obtained by interpolation) and of fitting model of the experimental data points (interpolation and 4th grade polynomial fit); (b) second step: cumulative gas representation calculated from the fitting values extracted from (a); Figure S3: Corresponding graphics for cumulative biogas calculation for B33FIR11: (a) representation of the biogas flowrate variation over time; (b) The fitting (by interpolation) of the plotted experimental data-biogas flowrate; (c) representation of the cumulative gas calculated based on the fitted data from (b); Figure S4: Corresponding graphics of the cumulative CH4 calculation for B33FIR11: (a) representation of the CH4 flowrate variation over time; (b) The fitting (by interpolation) of the plotted experimental data-CH4 flowrate; (c) representation of the cumulative gas calculated based on the fitted data from (b); Figure S5: Corresponding graphics of the cumulative CO2 calculation for B33FIR11: (a) representation of the CO2 flowrate variation over time; (b) The fitting (by interpolation) of the plotted experimental data-CO2 flowrate; (c) representation of the cumulative gas calculated based on the fitted data from (b).

Author Contributions

Conceptualization, M.I., T.T., G.-A.D. and V.D.G.; methodology, T.T. and M.I.; software, T.T., M.I. and A.-M.P.; validation, G.-A.D., V.L.O. and T.T.; formal analysis, M.I. and T.T.; investigation, M.I. and V.D.G.; resources, G.-A.D., V.L.O., V.D.G. and T.T.; data curation, T.T. and M.I.; writing—original draft preparation, M.I.; writing—review and editing, M.I. and G.-A.D.; visualization, G.-A.D., A.-M.P. and T.T. supervision, G.-A.D. and V.L.O. All authors have read and agreed to the published version of the manuscript.

Funding

This research received no external funding.

Institutional Review Board Statement

Not applicable.

Informed Consent Statement

Not applicable.

Data Availability Statement

All data can be provided upon request.

Acknowledgments

The research was conducted using technical resources from The Politehnica University of Timisoara. The authors thank Maria Poienar from West University Timisoara for the TG-DTA analysis.

Conflicts of Interest

The authors declare no conflicts of interest.

References

  1. EUR-Lex: EU Law. European Commission, Secretariat-General. Communication from the Commission to the European Parlia-ment, the European Council, the Council, the European Economic and Social Committee and the Committee of the Regions REPowerEU Plan. 2022. Available online: https://eur-lex.europa.eu/legal-content/EN/ALL/?uri=CELEX%3A52012DC0673 (accessed on 2 April 2025).
  2. Atchike, D.W.; Irfan, M.; Ahmad, M.; Rehman, M.A. Waste-to-Renewable Energy Transition: Biogas Generation for Sustainable Development. Front. Environ. Sci. 2022, 10, 840588. [Google Scholar] [CrossRef]
  3. Chowdhury, T.H. Technical-economical analysis of anaerobic digestion process to produce clean energy. Energy Rep. 2021, 7, 247–253. [Google Scholar] [CrossRef]
  4. Mirmohamadsadeghi, S.; Karimi, K.; Tabatabaei, M.; Aghbashlo, M. Biogas production from food wastes: A review on recent developments and future perspectives. Bioresour. Technol. Rep. 2019, 7, 100202. [Google Scholar] [CrossRef]
  5. Zupančič, M.; Možic, V.; Može, M.; Cimerman, F.; Golobič, I. Current Status and Review of Waste-to-Biogas Conversion for Selected European Countries and Worldwide. Sustainability 2022, 14, 1823. [Google Scholar] [CrossRef]
  6. Patel, C.; Kumar, G.; Upadhyay, A.K. Production of bio-gas (In urban areas using different types of wastes). Recent. Res. Sci. Technol. 2014, 6, 126–127. [Google Scholar]
  7. Morales-Polo, C.; Del Mar Cledera-Castro, M.; Moratilla Soria, B.Y. Reviewing the Anaerobic Digestion of Food Waste: From Waste Generation and Anaerobic Process to Its Perspectives. Appl. Sci. 2018, 8, 1804. [Google Scholar] [CrossRef]
  8. Chew, K.R.; Leong, H.Y.; Khoo, K.S.; Vo, D.V.N.; Anjum, H.; Chang, C.K.; Show, P.L. Effects of anaerobic digestion of food waste on biogas production and environmental impacts: A review. Environ. Chem. Lett. 2021, 19, 2921–2939. [Google Scholar] [CrossRef]
  9. Eurostat. Food Waste and Food Waste Prevention by NACE Rev. 2 Activity—Tonnes of Fresh Mass. Eurostat, 2023. Available online: https://ec.europa.eu/eurostat/databrowser/product/page/ENV_WASFW (accessed on 2 April 2025).
  10. European Environment Agency. Bio-Waste in Europe: Turning Challenges into Opportunities; Publications Office: Luxembourg, 2020; Available online: https://www.eea.europa.eu/en/analysis/publications/bio-waste-in-europe (accessed on 2 April 2025).
  11. Yasin, N.H.M.; Mumtaz, T.; Hassan, M.A.; Abd Rahman, N. Food waste and food processing waste for biohydrogen production: A review. J. Environ. Manag. 2013, 130, 375–385. [Google Scholar] [CrossRef]
  12. Rodríguez-Jiménez, L.M.; Pérez-Vidal, A.; Torres-Lozada, P. Research trends and strategies for the improvement of anaerobic digestion of food waste in psychrophilic temperatures conditions. Heliyon 2022, 8, 11174. [Google Scholar] [CrossRef]
  13. Conrad, Z.; Niles, M.T.; Neher, D.A.; Roy, E.D.; Tichenor, N.E.; Jahns, L. Relationship between food waste, diet quality, and environmental sustainability. PLoS ONE 2018, 13, 0195405. [Google Scholar] [CrossRef]
  14. Lau, K.Q.; Sabran, M.R.; Shafie, S.R. Utilization of Vegetable and Fruit By-products as Functional Ingredient and Food. Front. Nutr. 2021, 8, 661693. [Google Scholar] [CrossRef]
  15. Miramontes-Martínez, L.R.; Rivas-García, P.; Albalate-Ramírez, A.; Botello-Álvarez, J.E.; Escamilla-Alvarado, C.; Gomez-Gonzalez, R.; Alcalá-Rodríguez, M.M.; Valencia-Vázquez, R.; Santos-López, I.A. Anaerobic co-digestion of fruit and vegetable waste: Synergy and process stability analysis. J. Air Waste Manag. Assoc. 2021, 71, 620–632. [Google Scholar] [CrossRef]
  16. Ji, C.; Kong, C.X.; Mei, Z.L.; Li, J. A Review of the Anaerobic Digestion of Fruit and Vegetable Waste. Appl. Biochem. Biotechnol. 2017, 183, 906–922. [Google Scholar] [CrossRef]
  17. Tratsch, M.V.M.; Ceretta, C.A.; Silva, L.S.D.; Ferreira, P.A.A.; Brunetto, G. Composition and mineralization of organic compost derived from composting of fruit and vegetable waste. Rev. Ceres. 2019, 66, 307–315. [Google Scholar] [CrossRef]
  18. Latif, M.A.; Mehta, C.M.; Batstone, D.J. Influence of low pH on continuous anaerobic digestion of waste activated sludge. Water Res. 2017, 113, 42–49. [Google Scholar] [CrossRef]
  19. Salangsang, M.C.D.; Sekine, M.; Akizuki, S.; Sakai, H.D.; Kurosawa, N.; Toda, T. Effect of carbon to nitrogen ratio of food waste and short resting period on microbial accumulation during anaerobic digestion. Biomass Bioenergy 2022, 162, 106481. [Google Scholar] [CrossRef]
  20. Choi, Y.; Ryu, J.; Lee, S.R. Influence of carbon type and carbon to nitrogen ratio on the biochemical methane potential, pH, and ammonia nitrogen in anaerobic digestion. J. Anim. Sci. Technol. 2020, 62, 74–83. [Google Scholar] [CrossRef]
  21. Ambaye, T.G.; Rene, E.R.; Dupont, C.; Wongrod, S.; Van Hullebusch, E.D. Anaerobic Digestion of Fruit Waste Mixed With Sewage Sludge Digestate Biochar: Influence on Biomethane Production. Front. Energy Res. 2020, 8, 31. [Google Scholar] [CrossRef]
  22. Deressa, L.; Libsu, S.; Chavan, R.B.; Manaye, D.; Dabassa, A. Production of Biogas from Fruit and Vegetable Wastes Mixed with Different Wastes. Environ. Ecol. Res. 2015, 3, 65–71. [Google Scholar] [CrossRef]
  23. Yen, S.; Preston, T.R.; Thi Thuy, N. Biogas production from fruit wastes combined with manure from pigs or buffaloes in an in vitro biodigester system. Livest. Res. Rural Dev. 2017, 29, 151. [Google Scholar]
  24. Alvarez, R.; Lidén, G. Semi-continuous co-digestion of solid slaughterhouse waste, manure, and fruit and vegetable waste. Renew. Energy 2008, 33, 726–734. [Google Scholar] [CrossRef]
  25. Park, N.D.; Thring, R.W.; Garton, R.P.; Rutherford, M.P.; Helle, S.S. Increased biogas production in a wastewater treatment plant by anaerobic co-digestion of fruit and vegetable waste and sewer sludge—A full scale study. Water Sci. Technol. 2011, 64, 1851–1856. [Google Scholar] [CrossRef] [PubMed]
  26. Arhoun, B.; Villen-Guzman, M.D.; Vereda-Alonso, C.; Rodriguez-Maroto, J.M.; Garcia-Herruzo, F.; Gómez-Lahoz, C. Anaerobic co-digestion of municipal sewage sludge and fruit/vegetable waste: Effect of different mixtures on digester stability and methane yield. J. Environ. Sci. Health Part A 2019, 54, 628–634. [Google Scholar] [CrossRef] [PubMed]
  27. Mkhize, N.; Mjoli, N.S.; Khumalo, S.M.; Tettteh, E.K.; Mahlangu, T.P.; Rathilal, S. Enhanced Biogas Production through Anaerobic Co-Digestion of Agricultural Wastes and Wastewater: A Case Study in South Africa. Int. J. Energy Prod. Manag. 2023, 8, 123–131. [Google Scholar] [CrossRef]
  28. Chaurasia, A.K.; Siwach, P.; Shankar, R.; Mondal, P. Effect of pre-treatment on mesophilic anaerobic co-digestion of fruit, food and vegetable waste. Clean Technol. Environ. Policy 2021, 25, 603–616. [Google Scholar] [CrossRef]
  29. Zainudin Siti, F.; Anuar Aznah, N.; Yuzir Ali, M.; Sharani Noor, A.; Aris Alijah, M.; Khor Bee, C. The Granular Sludge Properties and Performance Evaluation of Upflow Anaerobic Sludge Blanket Reactor as a Pre-Treatment for Domestic Wastewater. Chem. Eng. Trans. 2023, 106, 1189–1194. [Google Scholar]
  30. Owusu-Agyeman, I.; Eyice, Ö.; Cetecioglu, Z.; Plaza, E. The study of structure of anaerobic granules and methane producing pathways of pilot-scale UASB reactors treating municipal wastewater under sub-mesophilic conditions. Bioresour. Technol. 2019, 290, 121733. [Google Scholar] [CrossRef]
  31. Mu, H.; Li, Y.; Zhao, Y.; Zhang, X.; Hua, D.; Xu, H.; Jin, F. Microbial and nutritional regulation of high-solids anaerobic mono-digestion of fruit and vegetable wastes. Environ. Technol. 2018, 39, 405–413. [Google Scholar] [CrossRef]
  32. Yazidi, H.; Thanikal, J.V. Non-linear kinetic modelling of anaerobic biodegradation of fruit and vegetable waste together with cooked oil. Int. J. Adv. Res. Biol. Sci. 2016, 3, 109–121. [Google Scholar]
  33. Gaur, R.Z.; Suthar, S. Anaerobic digestion of activated sludge, anaerobic granular sludge and cow dung with food waste for enhanced methane production. J. Clean. Prod. 2017, 164, 557–566. [Google Scholar] [CrossRef]
  34. Santos, L.A.D.; Valença, R.B.; Silva, L.C.S.D.; Holanda, S.H.D.B.; Silva, A.F.V.D.; Jucá, J.F.T.; Santos, A.F.M.S. Methane generation potential through anaerobic digestion of fruit waste. J. Clean. Prod. 2020, 256, 120389. [Google Scholar] [CrossRef]
  35. Li, Y.; Wang, Y.; Yu, Z.; Lu, J.; Li, D.; Wang, G.; Li, Y.; Wu, Y.; Li, S.; Xu, F.; et al. Effect of inoculum and substrate/inoculum ratio on the performance and methanogenic archaeal community structure in solid state anaerobic co-digestion of tomato residues with dairy manure and corn stover. Waste Manag. 2018, 81, 117–127. [Google Scholar] [CrossRef] [PubMed]
  36. De La Rubia, M.A.; Villamil, J.A.; Rodriguez, J.J.; Mohedano, A.F. Effect of inoculum source and initial concentration on the anaerobic digestion of the liquid fraction from hydrothermal carbonisation of sewage sludge. Renew. Energy 2018, 127, 697–704. [Google Scholar] [CrossRef]
  37. Gu, Y.; Chen, X.; Liu, Z.; Zhou, X.; Zhang, Y. Effect of inoculum sources on the anaerobic digestion of rice straw. Bioresour. Technol. 2018, 158, 149–155. [Google Scholar] [CrossRef]
  38. Li, Y.; Feng, L.; Zhang, R.; He, Y.; Liu, X.; Xiao, X.; Ma, X.; Chen, C.; Liu, G. Influence of Inoculum Source and Pre-incubation on Bio-Methane Potential of Chicken Manure and Corn Stover. Appl. Biochem. Biotechnol. 2013, 171, 117–127. [Google Scholar] [CrossRef]
  39. Demichelis, F.; Tommasi, T.; Deorsola, F.A.; Marchisio, D.; Fino, D. Effect of inoculum origin and substrate-inoculum ratio to enhance the anaerobic digestion of organic fraction municipal solid waste (OFMSW). J. Clean. Prod. 2022, 351, 131539. [Google Scholar] [CrossRef]
  40. Tjørve, K.M.C.; Tjørve, E. The use of Gompertz models in growth analyses, and new Gompertz-model approach: An addition to the Unified-Richards family. PLoS ONE 2017, 12, e0178691. [Google Scholar] [CrossRef]
  41. Siren, K.; Rosén, G.; Vad, J.; Nielsen, P.V. EXPERIMENTAL TECHNIQUES. In Industrial Ventilation Design Guidebook; Goodfellow, H., Tahti, E., Eds.; Academic Press: Cambridge, MA, USA, 2001; pp. 1105–1195. [Google Scholar]
  42. Doğu, D.; Demir, V. Investigation of pressure drop in main air line of pipeline milking system. Ege Üniversitesi Ziraat Fakültesi Derg. 2025, 62, 49–62. [Google Scholar] [CrossRef]
  43. Martinez-Fernandez, J.S.; Seker, A.; Davaritouchaee, M.; Gu, X.; Chen, S. Recovering Valuable Bioactive Compounds from Potato Peels with Sequential Hydrothermal Extraction. Waste Biomass Valoriz. 2021, 12, 1465–1481. [Google Scholar] [CrossRef]
  44. Bakshi, M.P.S.; Wadhwa, M.; Makkar, H.P.S. Waste to worth: Vegetable wastes as animal feed. CABI Rev. 2016, 6, 1–26. [Google Scholar] [CrossRef]
  45. Bugatti, V.; Brachi, P.; Viscusi, G.; Gorrasi, G. Valorization of Tomato Processing Residues Through the Production of Active Bio-Composites for Packaging Applications. Front Mater. 2019, 6, 34. [Google Scholar] [CrossRef]
  46. Achilonu, M.C.; Nwafor, I.C.; Umesiobi, D.O.; Sedibe, M.M. Biochemical proximates of pumpkin (Cucurbitaeae spp.) and their beneficial effects on the general well-being of poultry species. J. Anim. Physiol. Anim. Nutr. 2018, 102, 5–16. [Google Scholar] [CrossRef]
  47. Uzuazokaro, M.M.A.; Okwesili, F.C.N.; Chioma, A.A. Phytochemical and proximate composition of cucumber (Cucumis sativus) fruit from Nsukka, Nigeria. Afr. J. Biotechnol. 2018, 17, 1215–1219. [Google Scholar] [CrossRef]
  48. OECD. Safety Assessment of Foods and Feeds Derived from Transgenic Crops, Volume 3: Common Bean, Rice, Cowpea and Apple Compositional Considerations; Novel Food and Feed Safety; OECD Publishing: Paris, France, 2019; Available online: https://www.oecd-ilibrary.org/environment/safety-assessment-of-foods-and-feeds-derived-from-transgenic-crops-volume-3_f04f3c98-en (accessed on 2 April 2025).
  49. Omulo, G. Harnessing of banana ripening process for banana juice extraction in Uganda. Afr. J. Food Sci. Technol. 2015, 6, 108–117. [Google Scholar] [CrossRef]
  50. Verma, D.K.; Srivastav, P.P. Proximate Composition, Mineral Content and Fatty Acids Analyses of Aromatic and Non-Aromatic Indian Rice. Rice Sci. 2017, 24, 21–31. [Google Scholar] [CrossRef]
  51. Achinas, S.; Euverink, G.J.W. Theoretical analysis of biogas potential prediction from agricultural waste. Resour.-Effic. Technol. 2016, 2, 143–147. [Google Scholar]
  52. Roati, C.; Fiore, S.; Ruffino, B.; Marchese, F.; Novarino, D.; Zanetti, M.C. Preliminary Evaluation of the Potential Biogas Production of Food-Processing Industrial Wastes. Am. J. Environ. Sci. 2012, 8, 291–296. [Google Scholar]
  53. Ugwu, S.N.; Enweremadu, C.C. Biodegradability and kinetic studies on biomethane production from okra (Abelmoschus esculentus) waste. S. Afr. J. Sci. 2019, 115. [Google Scholar] [CrossRef]
  54. Jingura, R.M.; Kamusoko, R. Methods for determination of biomethane potential of feedstocks: A review. Biofuel Res. J. 2017, 4, 573–586. [Google Scholar] [CrossRef]
  55. Li, Y.; Alaimo, C.P.; Kim, M.; Kado, N.Y.; Peppers, J.; Xue, J.; Wan, C.; Green, P.G.; Zhang, R.; Jenkins, B.M.; et al. Composition and Toxicity of Biogas Produced from Different Feedstocks in California. Environ. Sci. Technol. 2019, 53, 11569–11579. [Google Scholar] [CrossRef]
  56. Chen, X.Y.; Vinh-Thang, H.; Ramirez, A.A.; Rodrigue, D.; Kaliaguine, S. Membrane gas separation technologies for biogas upgrading. RSC Adv. 2015, 5, 24399–24448. [Google Scholar] [CrossRef]
  57. Kujawa, J.; Kujawski, W. Driving force and activation energy in air-gap membrane distillation process. Chem. Pap. 2015, 69, 1438–1444. [Google Scholar] [CrossRef]
  58. Aceves-Lara, C.A.; Latrille, E.; Conte, T.; Steyer, J.P. Online estimation of VFA, alkalinity and bicarbonate concentrations by electrical conductivity measurement during anaerobic fermentation. Water Sci. Technol. 2012, 65, 1281–1289. [Google Scholar] [CrossRef] [PubMed]
  59. Sikora, A.; Detman, A.; Chojnacka, A.; Blaszczyk, M.K. Anaerobic Digestion: I. A Common Process Ensuring Energy Flow and the Circulation of Matter in Ecosystems. II. A Tool for the Production of Gaseous Biofuels. In Fermentation Processes; Jozala, A.F., Ed.; InTech Open: London, UK, 2017; pp. 272–301. [Google Scholar]
  60. Khan, M.A.; Ashar, N.N.; Ganesh, A.G.; Rais, N.; Faheem, S.M.; Khan, S.T. Bacterial Community Structure in Anaerobic Digesters of a Full Scale Municipal Wastewater Treatment Plant—Case Study of Dubai, United Arab Emirates. J. Sustain. Dev. Energy Water Environ. Syst. 2019, 7, 385–398. [Google Scholar] [CrossRef]
  61. Mota-Panizio, R.; Hermoso-Orzáez, M.J.; Carmo-Calado, L.; Lourinho, G.; Brito, P.S.D.D. Biochemical Methane Potential of Cork Boiling Wastewater at Different Inoculum to Substrate Ratios. Appl. Sci. 2021, 11, 3064. [Google Scholar] [CrossRef]
  62. Syguła, E.; Świechowski, K.; Hejna, M.; Kunaszyk, I.; Białowiec, A. Municipal Solid Waste Thermal Analysis—Pyrolysis Kinetics and Decomposition Reactions. Energies 2021, 14, 4510. [Google Scholar] [CrossRef]
  63. Yao, C.; Wang, X.; Zhou, Y.; Jin, X.; Song, L.; Hu, Y.; Zeng, W. Thermogravimetric analysis and kinetics characteristics of typical grains. J. Therm. Anal. Calorim. 2021, 143, 647–659. [Google Scholar] [CrossRef]
  64. Font, R. Decomposition of Organic Wastes: Thermal Analysis and Evolution of Volatiles. In Handbook of Thermal Analysis and Calorimetry, 2nd ed.; Vyazovkin, S., Koga, N., Schick, C., Eds.; Elsevier: Amsterdam, The Netherlands, 2018; Volume 6, pp. 339–397. [Google Scholar]
  65. Vakalis, S.; Sotiropoulos, A.; Moustakas, K.; Malamis, D.; Vekkos, K.; Baratieri, M. Characterization of Hotel Bio-waste by Means of Simultaneous Thermal Analysis. Waste Biomass Valoriz. 2016, 7, 649–657. [Google Scholar] [CrossRef]
  66. Kalogiannis, A.; Diamantis, V.; Eftaxias, A.; Stamatelatou, K. Long-Term Anaerobic Digestion of Seasonal Fruit and Vegetable Waste Using a Leach-Bed Reactor Coupled to an Upflow Anaerobic Sludge Bed Reactor. Sustainability 2023, 16, 50. [Google Scholar] [CrossRef]
  67. Zhu, Y.; Luan, Y.; Zhao, Y.; Liu, J.; Duan, Z.; Ruan, R. Current Technologies and Uses for Fruit and Vegetable Wastes in a Sustainable System: A Review. Foods 2023, 12, 1949. [Google Scholar] [CrossRef]
  68. Fernández, F.J.; Villaseñor, J.; Infantes, D. Kinetic and stoichiometric modelling of acidogenic fermentation of glucose and fructose. Biomass Bioenergy 2011, 35, 3877–3883. [Google Scholar] [CrossRef]
  69. Ali, S.; Dar, M.A.; Liaqat, F.; Sethupathy, S.; Rani, A.; Khan, M.I.; Rehan, M.; Zhu, D. Optimization of biomethane production from lignocellulosic biomass by a developed microbial consortium. Process Saf. Environ. Prot. 2024, 184, 1106–1118. [Google Scholar] [CrossRef]
  70. Charnier, C.; Latrille, E.; Lardon, L.; Miroux, J.; Steyer, J.P. Combining pH and electrical conductivity measurements to improve titrimetric methods to determine ammonia nitrogen, volatile fatty acids and inorganic carbon concentrations. Water Res. 2016, 95, 268–279. [Google Scholar] [CrossRef] [PubMed]
  71. Tanko, S.F.; Ajibola, V.O.; Agbaji, E.A.; Mukailu, A.S.; Putshaka, J.D.; Amana, B.S. Effect of anaerobic treatment on sulphide concentration, TSS, TDS and electrical conductivity parameters of sulphide-lime unhairing wastewater. Bayero J. Pure Appl. Sci. 2019, 11, 260. [Google Scholar] [CrossRef]
  72. Robles, A.; Latrille, E.; Ribes, J.; Bernet, N.; Steyer, J.P. Electrical conductivity as a state indicator for the start-up period of anaerobic fixed-bed reactors. Water Sci. Technol. 2016, 73, 2294–2300. [Google Scholar] [CrossRef]
  73. Marín-Peña, O.; Alvarado-Lassman, A.; Vallejo-Cantú, N.A.; Juárez-Barojas, I.; Rodríguez-Jarquín, J.P.; Martínez-Sibaja, A. Electrical Conductivity for Monitoring the Expansion of the Support Material in an Anaerobic Biofilm Reactor. Processes 2020, 8, 77. [Google Scholar] [CrossRef]
  74. Gavala, H.N.; Yenal, U.; Skiadas, I.V.; Westermann, P.; Ahring, B.K. Mesophilic and thermophilic anaerobic digestion of primary and secondary sludge. Effect of pre-treatment at elevated temperature. Water Res. 2003, 37, 4561–4572. [Google Scholar] [CrossRef]
  75. Biyada, S.; Merzouki, M.; Dėmčėnko, T.; Vasiliauskienė, D.; Ivanec-Goranina, R.; Urbonavičius, J.; Marčiulaitienė, E.; Vasarevičius, S.; Benlemlih, M. Microbial community dynamics in the mesophilic and thermophilic phases of textile waste composting identified through next-generation sequencing. Sci. Rep. 2021, 11, 23624. [Google Scholar] [CrossRef]
  76. Steiniger, B.; Hupfauf, S.; Insam, H.; Schaum, C. Exploring Anaerobic Digestion from Mesophilic to Thermophilic Temperatures—Operational and Microbial Aspects. Fermentation 2023, 9, 798. [Google Scholar] [CrossRef]
  77. Rivière, D.; Desvignes, V.; Pelletier, E.; Chaussonnerie, S.; Guermazi, S.; Weissenbach, J.; Li, T.; Camacho, P.; Sghir, A. Towards the definition of a core of microorganisms involved in anaerobic digestion of sludge. ISME J. 2009, 3, 700–714. [Google Scholar] [CrossRef]
  78. Guo, J.; Peng, Y.; Ni, B.J.; Han, X.; Fan, L.; Yuan, Z. Dissecting microbial community structure and methane-producing pathways of a full-scale anaerobic reactor digesting activated sludge from wastewater treatment by metagenomic sequencing. Microb. Cell Factories 2015, 14, 33. [Google Scholar] [CrossRef] [PubMed]
  79. Xu, R.-z.; Fang, S.; Zhang, L.; Huang, W.; Shao, Q.; Fang, F.; Feng, Q.; Cao, J.; Luo, J. Distribution patterns of functional microbial community in anaerobic digesters under different operational circumstances: A review. Bioresour. Technol. 2021, 341, 125823. [Google Scholar] [CrossRef] [PubMed]
  80. Oliveira, H.R.; Anacleto, T.M.; Abreu, F.; Enrich-Prast, A. New insights into the factors influencing methanogenic pathways in anaerobic digesters. Anaerobe 2025, 91, 102925. [Google Scholar] [CrossRef] [PubMed]
  81. Fu, S.; Angelidaki, I.; Zhang, Y. In situ Biogas Upgrading by CO2-to-CH4 Bioconversion. Trends Biotechnol. 2021, 39, 336–347. [Google Scholar] [CrossRef]
Figure 1. Schematic representation of experimental setup for anaerobic digestion experiments.
Fermentation 11 00348 g001
Figure 2. Cumulative gas (NL kg−1VSadded) for each batch experiment of the total gas and each component of the gas: CH4, CO2, H2S, H2O vapor, N2.
Fermentation 11 00348 g002
Figure 3. (a) pH and (b) EC values of suspension extracted from the reactor at certain times for batch experiments (from B33FIR11 to B37FIR21).
Fermentation 11 00348 g003
Figure 4. Gompertz model curve vs experimental data represented for biogas and CH4 accumulated gas for (a) B33FIR11, (b) B37FIR11, (c) B41FIR11, (d) B45FIR11, (e) B37FIR32, and (f) B37FIR21 (the asterisk symbol marks added experimental data obtained by interpolation).
Fermentation 11 00348 g004aFermentation 11 00348 g004b
Figure 5. Representation of absolute growth rate, Rm, and variation versus (a) the operating temperature obtained for an FIR of 1:1 and (b) the substrate (referred to as the food waste mixture)-to-industrial granular inoculum ratio obtained at an operating temperature of 37 °C.
Fermentation 11 00348 g005
Figure 6. Images of industrial granular inoculum and distribution of granule size represented with histograms for (a) wet granules and (b) dry granules.
Fermentation 11 00348 g006
Figure 7. The taxonomic profile of the industrial granular inoculum.
Fermentation 11 00348 g007
Figure 8. TG and DTA curve for (a) fruit and vegetable waste, and (b) boiled rice.
Fermentation 11 00348 g008
Figure 9. TG and DTA curve for the industrial granular inoculum.
Fermentation 11 00348 g009
Table 1. The experimental conditions of the anaerobic digestion process studies.
No.Batch Experiment CodeTemperature [°C]Food Mixture to Inoculum Ratio (FIR) (w/w)
1B33FIR11331:1
2B37FIR11371:1
3B41FIR11411:1
4B45FIR11451:1
5B37FIR32373:2
6B37FIR21372:1
Table 2. The physico-chemical properties of the food components involved in the process.
Food ComponentElemental Composition (%)C/N RatioTS (%)VS (%)Water Content (%)Ash Content (%)Source
CHNSO
Potato52.66.62.80.237.818.7816.715.183.31.6[43]
Carrot13.121.43.50623.749.58.7990.50.07[44]
Tomato58.387.721.49030.639.187.366.9492.640.42[45]
Curcubita pepo *45.96.690.930.7153.2449.356.45.7793.60.63[46]
Cucumber *45.066.673.062.3348.9714.725.84.8694.20.94[47]
Apple *44.536.220.210.1658.46212.0514.4414.2685.560.18[48]
Banana *44.496.240.510.3957.6687.2325.0924.2674.910.83[49]
Boiled rice *44.336.251.120.8556.2539.5831.6531.4868.340.17[50]
Food mixture43.468.651.850.6449.9423.4914.8914.2185.110.59Calculated
* The elemental composition is calculated using the content of carbohydrates, lipids, and proteins.
Table 3. The composition of Cucurbita pepo, cucumber, apple, banana, and rice in terms of protein, carbohydrate, and lipid contents.
Molecular FormulaC, H, N, S, O CoefficientsCarbohydrate, Lipid, and Protein Content (%) for [46,47,48,49,50]:
CHNSOCucurbita PepoCucumberAppleBananaRice
CarbohydratesC6H10O66106--75.8161.9396.9294.1589.37
LipidsC12H24O612246--16.0211.311.191.360.8
ProteinsC13H25O7N3S13257318.1626.751.824.499.82
Table 4. The amount of gas (cumulated volume, NL kg−1VSadded) calculated for all experiments from B33FIR11 to B37FIR21.
No.Batch ExperimentsCumulated Volume (NL kg−1VSadded)
BiogasCH4CO2H2SH2ON2
1B33FIR1169.8824.0813.0843.23 × 10−30.35028
2B37FIR11130.767.1935.8562.01 × 10−38.1817.31
3B41FIR11214.4360.9743.83193.56 × 10−316.6475.91
4B45FIR11465.37203.03160.44698.36 × 10−344.964.62
5B37FIR32286.25147.269.2993.03 × 10−316.9251.93
6B37FIR21468.59233.95168.37298.41 × 10−329.8477.4
Table 5. The composition of biogas (vol % for CH4, CO2, H2O, and N2, and ppm for H2S) calculated based on the data displayed in Table 4.
No.Batch ExperimentsBiogas
(NL kg−1VSadded)
CH4 (%)CO2(%)H2S (ppm)H2O (%)N2 (%)
1.B33FIR1169.8834.3918.73619.055.0339.95
2.B37FIR11130.751.3227.34474.26.2613.25
3.B41FIR11214.4328.4920.42907.567.7735.46
4.B45FIR11465.3743.6434.471500.969.6313.87
5.B37FIR32286.2549.9335.93636.806.2616.52
6.B37FIR21486.5951.4224.21324.985.9118.14
Table 6. The maximum theoretical CH4 and CO2 based on the stoichiometric AD reaction (at 25 °C and 1 atm) and the yield conversion of CH4 and organic carbon.
No.Batch ExperimentsCH4th
(NL kg−1VSadded)
CO2th
(NL kg−1VSadded)
η C H 4 (%) η o r g a n i c   c a r b o n (%)
1.B33FIR11604.82291.223.984.15
2.B37FIR1111.1111.5
3.B41FIR1110.0811.69
4.B45FIR1133.5740.56
5.B37FIR32642.38253.8922.9124.15
6.B37FIR21655.47240.7836.4244.89
Table 7. The Gompertz model parameters and the coefficient of determination calculated for all batch experiments.
No.Batch
Experiment
Md (NL kg−1VSadded)Rm (NL kg−1 h−1)tlag (h)R2
BiogasCH4BiogasCH4BiogasCH4BiogasCH4
1B33FIR1168.7323.280.07390.033310.633019.670.99970.9927
2B37FIR11128.0365.110.14280.083610.14339.280.99800.9949
3B41FIR11217.6970.220.30070.09680.18.1330.98620.9875
4B45FIR11427.05188.460.25290.09080.10.10.92340.9440
5B37FIR32308.9156.141.00100.587447.411249.44660.99940.9991
6B37FIR21519.03237.220.88250.401917.499722.78620.99350.9935
Table 8. The amount of CH4 in the AD studies of fruit and vegetable feedstock with granular inoculum.
SubstrateInoculum TypeTemperature and Substrate-to-Inoculum (S/I) RatioCH4 ProductionSource
Fruit and vegetable wasteGranular activated sludge35 °C;
1:3 (kg/kg on VS basis)
776.3 L kg−1VSadded[15]
Fruit and vegetable waste (cabbage, lettuce, Chinese cabbage, tomato, carrot, cauliflower, etc.)Anaerobic granular sludge37 °C;
4:1, 2:1, 1:1, 1:2, 1:5 (VS based)
73.5 ÷ 262 L kg−1VSadded[31]
Food waste: food from cooking (i.e., rice, breads, boiled egg yolks, potato, cabbage, cauliflower, noodles, lentils, etc.), peels of raw vegetables (carrot, cucumber, tomato, etc.), and stale foodAcclimatized anaerobic granular sludge35 °C; 1:3 (v/v)15.65 L kg−1VSadded[33]
Passion fruit peelIndustrial granular anaerobic sludge37 °C; 5.4:1 (kg/kg on VS basis)115 NL kg−1VSadded[34]
Orange bagasse37 °C; 5:1 (kg/kg on VS basis)128 NL kg−1VSadded[34]
Cashew bagasse37 °C; 4.13:1 (kg/kg on VS basis)62 NL kg−1VSadded[34]
Food waste (fruits and vegetables: banana, apple, tomato, potato, pumpkin, cucumber, carrot) and cereal food (boiled rice)Industrial granular inoculum33 °C, 37 °C, 41 °C, 45 °C (at 1:1 w/w); 1:1, 2:1, 3:2 (w/w) at 37 °C 24.08 ÷ 233.95 NL kg−1VSaddedthis study
Disclaimer/Publisher’s Note: The statements, opinions and data contained in all publications are solely those of the individual author(s) and contributor(s) and not of MDPI and/or the editor(s). MDPI and/or the editor(s) disclaim responsibility for any injury to people or property resulting from any ideas, methods, instructions or products referred to in the content.

