Article

Optimizing Caproic Acid Biosynthesis in Anaerobic Fermentation of Ethanol and Butanoic Acid: The Effects of C/N Ratio

School of Agricultural Engineering and Food Science, Shandong University of Technology, Zibo 255049, China
*
Author to whom correspondence should be addressed.
Fermentation 2025, 11(6), 316; https://doi.org/10.3390/fermentation11060316
Submission received: 17 April 2025 / Revised: 25 May 2025 / Accepted: 30 May 2025 / Published: 2 June 2025

Abstract

:
The carbon-to-nitrogen (C/N) ratio is a critical player in microbial growth and metabolism. This study explored the effects of this ratio on caproic acid yield, electron efficiency, and microbial community composition in an anaerobic fermentation system wherein ethanol and butanoic acid were used as electron donors and acceptors, respectively. With a C/N ratio of 3–25, the system maintained a reducing environment conducive to carbon chain elongation, which led to a high caproic acid yield. The highest caproic acid concentration of 6175.9 mg/L was attained at a C/N ratio of 3, with an electron efficiency of 72.9% and a selectivity of 60.8%. At C/N ratios of 58, 75, and 100, the highest concentration of caproic acid decreased by 26.2%, 35.4%, and 39.4%, respectively, compared to that at a C/N ratio of 3. At a C/N ratio of 1, acetic acid-producing bacteria were enriched, severe excessive ethanol oxidation occurred, and the caproic acid concentration was only 31% of that at a C/N ratio of 3. Caproic acid biosynthesis was attributed to the cooperative activity of Clostridium_sensu_stricto_12, DMER64, Para clostridium, Thermovirga, and Sporanaerobacter.

1. Introduction

Anaerobic biotechnology has recently garnered increasing attention for its ability to produce carboxylic acids [1]. Short-chain fatty acids (SCFAs), which are the primary products of this process, serve as intermediates in the production of more complex fuels. However, the low energy density and limited application range of SCFAs diminish the economic benefits of anaerobic fermentation [2]. By contrast, medium-chain fatty acids (MCFAs), produced via carbon chain extension (CCE), exhibit lower solubility, which aids purification and industrial-scale production. The production of MCFAs through CCE typically requires energy-rich reducing chemicals as electron donors and SCFAs as electron acceptors (EAs). Moreover, MCFAs have a higher energy density and greater economic value [3]. They have several industrial applications, including their use as precursors for biofuel production, specifically in aviation fuel and diesel synthesis [4]. They are also used as antimicrobial agents and food additives, and play essential roles in the production of rubber, dyes, fragrances, pharmaceuticals, lubricants, and surfactants [5].
Caproic acid is an important MCFA with broad applications in industry, agriculture, food and pharmaceuticals. Biosynthesis of caproic acid mainly relies on microbial CCE reactions. Tang et al. [6] enhanced the hydrolysis of food waste and increased the abundance of CCE microorganisms by using biochar derived from agricultural waste, thereby promoting caproic acid production. Similarly, Wu et al. [7] employed brewing wastewater as a substrate for anaerobic fermentation, achieving a caproic acid yield of 12.3 g Chemical oxygen demand (COD)/L through microbial CCE process.
The carbon-to-nitrogen (C/N) ratio is a key determinant influencing microbial growth, reproduction, and metabolism [8]. A suitable C/N ratio can sustain an optimal anaerobic environment, promote microbial growth, and enhance methane production [9]. Adjusting the C/N ratio in sludge anaerobic systems through the addition of food waste can increase methane production [10]. According to [11], biogas production at a C/N of 27.2 was approximately three times higher than that at a C/N of 15. A C/N ratio of 15–70 is commonly applied in both aerobic composting and anaerobic digestion [12].
Nitrogen deficiency caused by a high C/N ratio can hamper microbial growth, thereby reducing digestion rates. Conversely, at low C/N ratios, excess nitrogen may lead to ammonia release, which is toxic to fermenting microorganisms and may lead to fermentation failure. The optimal C/N ratio for anaerobic digestion typically ranges from 25 to 30, depending on the concentrations of biodegradable carbon and nitrogen in the substrate [12]. On investigating the performance of pilot-scale hydrogen fermenters at varying C/N ratios (20, 25, and 30), Kim et al. [13] found that at a C/N ratio of >20 g carbohydrate COD/g total kaiser nitrogen (TKN), the digestive efficiency decreased because of the increased lactic acid and propanoic acid production. Lay et al. [14] examined the effect of C/N ratios on hydrogen production in mixed bacterial fermentation. They found that the C/N ratio of the influent water had a significant effect on hydrogen production, with optimal production observed at a C/N ratio of 47. Liu et al. [15] found the initial C/N ratio plays a major role in determining both the yield and distribution of volatile fatty acids (VFAs) during sludge biotransformation, the product yield is the lowest when the initial C/N ratio is 5. Although many studies have explored MCFA production through anaerobic fermentation, limited research has focused specifically on the effect of the C/N ratio on caproic acid production.
This study attempted to identify the C/N ratio optimal for caproic acid production by analyzing the effect of different C/N ratios on anaerobic fermentation performance by using ethanol and butanoic acid as substrates. Furthermore, the study evaluated the impact of varying C/N ratios on product selectivity, electron efficiency, carbon distribution, and microbial community composition.

2. Materials and Methods

2.1. Inoculum and Substrates

The effluent derived from a medium-temperature biogas digester utilizing cow manure and straw as substrates was used as an inoculant. The inoculum was preserved at a temperature of 4 °C and subsequently activated at 37 °C for 6 days before its application. The pH of the inoculum was measured at 7.3 ± 0.1, with total solids (TS) quantified at 8.6 ± 0.2% and volatile solids (VS) recorded at 6.0 ± 0.4%. The medium composition was as follows: CH3COONa2 0.5 g/L, NaHCO3 2.0 g/L, K2HPO4 0.3 g/L, KH2PO4 0.2 g/L, NH4Cl 0.3 g/L, MgSO4·7H2O 0.2 g/L, CaCl2·2H2O 0.2 g/L, yeast extract (total nitrogen ≥ 10%; NaCl ≤ 2.0%; moisture content ≤ 6.0%; ash content ≤ 15%) 1.0 g/L, trace element solution 1 mL, and vitamin solution 1 mL. The trace element and vitamin solutions were prepared as described previously [16]. The trace element solution was composed of the following: C6H9NO6 1.5 g/L, MnSO4 0.447 g/L, FeSO4 0.0545 g/L, CaCl2 0.0755 g/L, CuSO4 0.064 g/L, H3BO3 0.01 g/L, NiCl2 0.0164 g/L, Na2WO4⋅2H2O 0.4 mg/L, MgSO4 1.463 g/L, NaCl 1.0 g/L, CoSO4⋅7H2O 0.18 g/L, ZnSO4 0.101 g/L, KAl(SO4)2 0.0137 g/L, Na2MnO4 0.0087 g/L, Na2SeO3⋅5H2O 0.30 mg/L. The vitamin solution consisted of the following: C10H16N2O3S 2.0 mg/L, C8H11NO3⋅HCl 10.0 mg/L, C17H20N4O6 5.0 mg/L, C18H32CaN2O10 5.0 mg/L, C7H7NO2 5.0 mg/L, C19H19N7O6 2.0 mg/L, C12H17ClN4O⋅HCl 5.0 mg/L, C6H5NO2 5.0 mg/L, C63H88CoN14O14P 0.1 mg/L, C8H14O2S2 5.0 mg/L. Ethanol is one of the most extensively researched and widely used electron donors (EDs) [17]. In this study, ethanol (120 mmol/L) and butanoic acid (60 mmol/L) were added as fermentation substrates to the aforementioned medium. Except for the yeast paste, all of the reagents were of analytically pure grade.

2.2. Experimental Setup

Anaerobic fermentation was performed in reactors with a working volume of 750 mL. The reactors were placed in a thermostatic incubator at 37 ± 0.5 °C with an agitation speed of 120 rpm. The inoculum amount was 15% (w/w). The C/N ratio of different experimental groups were set to 1, 3, 15, 25, 58, 75, and 100, respectively, using NH4Cl as the nitrogen source. The pH was maintained at 6.0 ± 0.1 during the fermentation. Before sealing, each reactor underwent a nitrogen purge for 3 min to establish anaerobic conditions [18]. The fermentation lasted for 20 days and samples were collected daily for ethanol and VFAs analysis. Each experiment was conducted thrice.

2.3. Analytical Methods

The pH value was assessed by using a pH meter of the PHS-3C model. TS and VS were quantified following standardized methodologies [19]. The quantification of VFAs and ethanol was conducted utilizing a gas chromatograph (GC6890, Agilent, Santa Clara, CA, USA), equipped with a flame ionization detector and a Nukol free fused-silica capillary column. Before the analytical procedure, the sample was subjected to centrifugation at 12,000 rpm for 15 min, followed by careful collection of the supernatant for analysis. The supernatant was then acidified with 20% formic acid to reduce the pH to <3.0. The sample was diluted with ultra-pure water to maintain the VFAs concentration within the standard curve’s limits, followed by filtration via a 0.45-μm nylon injection filter [20]. For the samples at the end of fermentation, cyclic voltammetry (CV) tests were conducted on an electrochemical workstation (Huazhi Chen 760E, Shanghai, China). The scanning voltage range was −1.8–1.8 V and the scanning rate was 10 mV/S.

2.4. Microbial Analysis

At the end of fermentation, the samples were collected from reactors with C/N ratios of 1, 3, 25, and 100 (labeled as M1, M2, M3, and M4, respectively) for microbial analysis. Majorbio (Shanghai, China) performed the high-throughput sequencing studies. The OMEGA E.Z.N.A.™ Mag-Bind Soil DNA Kit was used to extract total genomic DNA from the samples. The primers used were 338F (5′-ACTCCTACGGGGAGGCAGCAG-3′) and 806R (5′-GGACTACNNGGGTATCTAAT-3′). The Illumina MiSeq system was employed to sequence the samples.

2.5. Calculations

The selectivity is defined as the proportion of the product relative to the total amount of detected carboxylic acids. The selectivity of VFAs was determined using Equation (1), as follows [21]:
VFAs   Selectivity ( % ) = C C / Σ   C i 1 n   ×   100 %
In this context, Cc denotes the concentration (mg/L) of the specific VFAs, while Ci indicates the concentration (mg/L) of the products identified in the fermentation liquid. These products encompass ethanol, acetic acid, propanoic acid, butanoic acid, iso-butanoic acid, valeric acid, and caproic acid.
The electron efficiency is defined as the percentage of electrons converted from the consumed substrate to the product, using Equation (2) to calculate, as follows [22]:
Electron   efficiency ( % ) = E Products / ( E ethanol   + E butyrate )   ×   100 %  
In this context, Eproducts refer to the number of electrons associated with the products, Eethanol denotes the number of electrons linked to ethanol, and Ebutyrate signifies the number of electrons related to butanoic acid. The molar electron values (expressed as moles of electrons per mole of substance) for the various acids and alcohols are as follows: ethanol (12), acetic acid (8), propanoic acid (14), butanoic acid (20), valeric acid (26), and caproic acid (32).
Carbon distribution represents the percentage of carbon in the product to the carbon in the consumed substrate, and the calculation equation is as follows [22]:
T = n p   ×   c p / ( 2   ×   c e + 4   ×   c b )   ×   100 %
where T is the carbon distribution, np is the carbon number of the product, cp is the molar concentration of the product, ce is the molar concentration of ethanol consumed, and cb is the concentration of butanoic acid consumed.

3. Results and Discussion

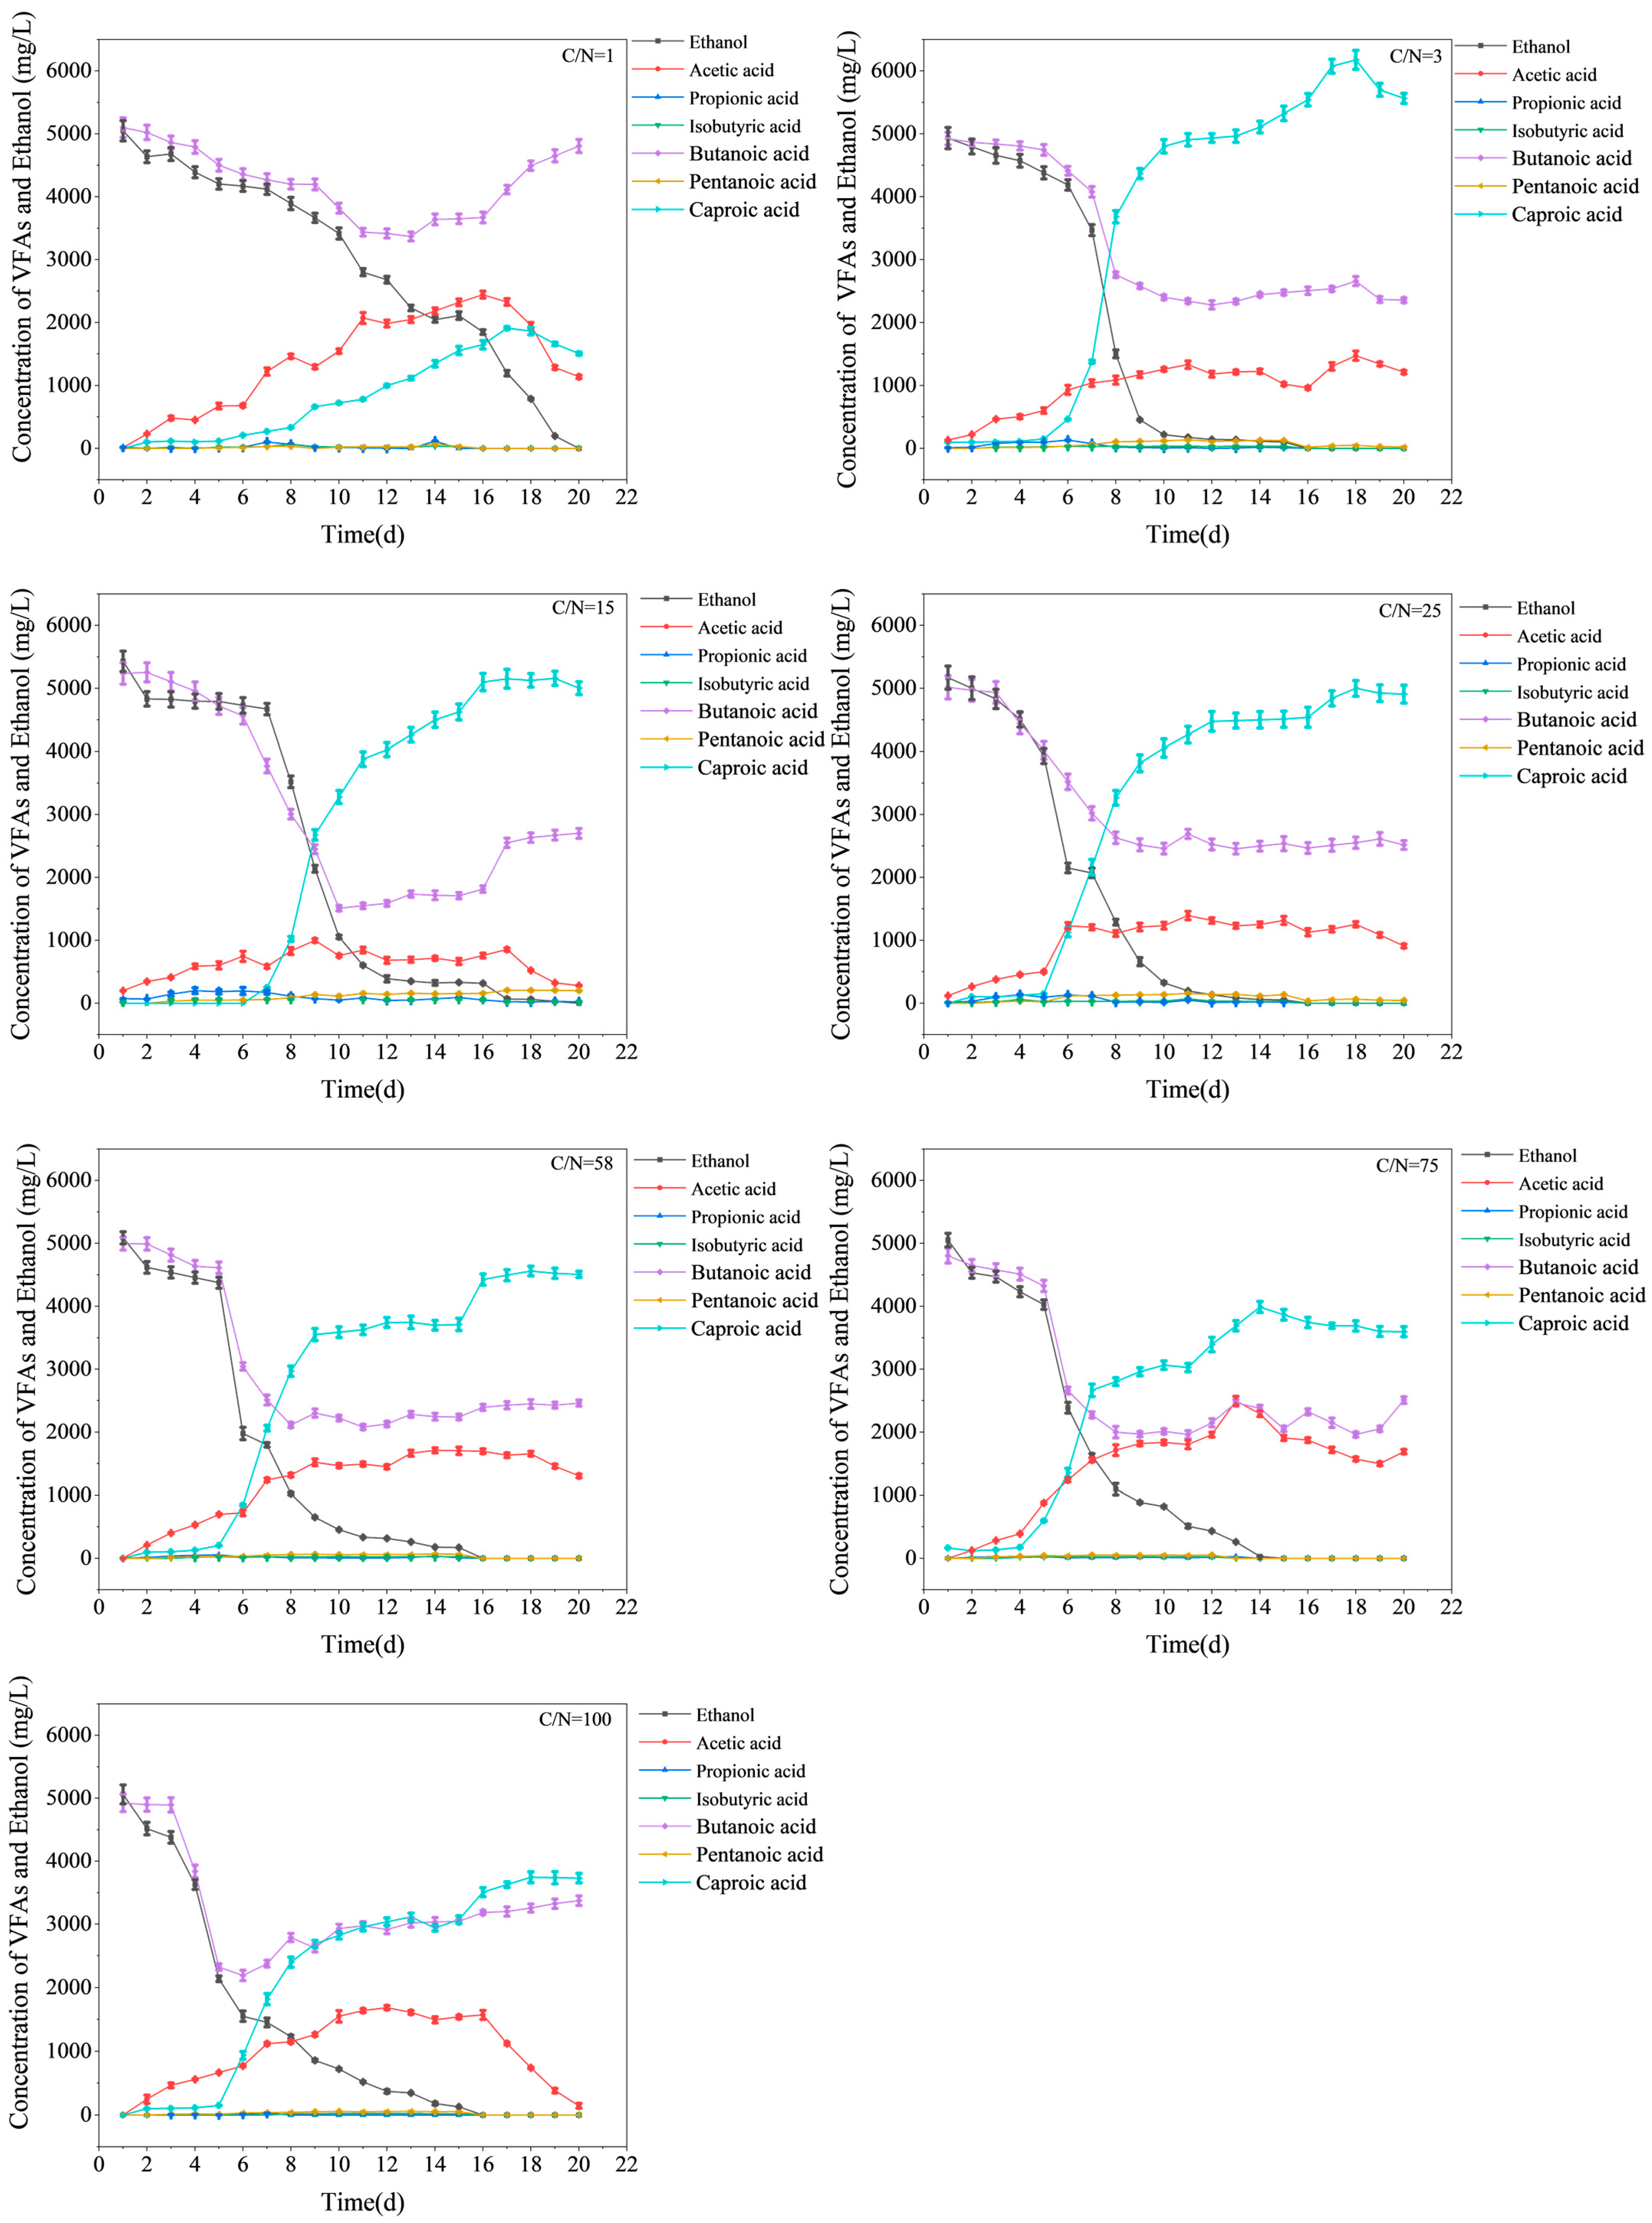
3.1. Variations in Substrates and Product Concentrations

Carbon and nitrogen are critical nutrients that strongly influence microbial growth, metabolic activity, and fermentation efficiency [23]. In this study, ethanol (120 mmol/L) and butanoic acid (60 mmol/L) supplied carbon, while ammonium chloride supplied nitrogen for caproic acid production through anaerobic fermentation. Figure 1 illustrates substrate consumption and product formation at varying C/N ratios. The CCE process requires energy. Theoretically, one-sixth of ethanol is converted to acetic acid during CCE, wherein ethanol and butanoic acid act as substrates. Through substrate-level phosphorylation, this conversion supplies the initial energy required for CCE [24]. Thus, in this study, excessive ethanol oxidation (EEO) was considered to have occurred if the total amount of acetic acid in the fermentation system was >20 mmol/L (1200 mg/L).
At a C/N of 1, the caproic acid concentration increased progressively from day 2, ultimately peaking at 1910.5 mg/L on day 17 (Figure 1). Similarly, the highest concentration of acetic acid was 2444 mg/L, which is an increase of 103.7% relative to the theoretical value, indicating EEO. High ammonia densities (5 g-NH4+/L) obstructed the reverse β-oxidation cycle and promoted ethanol peroxidation [25]. At a C/N of 1, the NH4+ concentration in the reactor was 7.2 g/L, likely contributing to EEO. Serving as a substrate for CCE, the butanoic acid concentration progressively decreased over the initial 13 days, but then gradually increased, reaching 4807 mg/L by day 20. The accumulation of butanoic acid—a product of ethanol oxidation and a precursor to caproic acid—indicates impaired electron transfer, which inhibits caproic acid production [26]. Consequently, butanoic acid accumulation at a C/N of 1 is another major factor contributing to the low caproic acid concentration.
At a C/N ratio of 3 (Figure 1), ethanol and butanoic acid concentrations decreased markedly from day 6 to day 9, whereas the caproic acid concentration exhibited a sharp increase. On day 18, the caproic acid concentration peaked at 6175.9 mg/L, while the acetic acid concentration was also maximum, peaking at 1472 mg/L. Compared with that at a C/N of 1, the acetic acid concentration was reduced by 66% at a C/N of 3, whereas the caproic acid concentration was elevated by 223%. The C/N ratio of 3 fostered an optimal environment for the proliferation of caproic acid-producing microorganisms, thus aiding efficient caproic acid synthesis. At a C/N ratio of 15 (Figure 1), butanoic acid was consumed more rapidly in the initial fermentation phase compared with that at a C/N ratio of 3, but ethanol levels remained stable, slightly delaying caproic acid synthesis. The acetic acid concentration of this treatment (998 mg/L) was the lowest among all treatments. However, caproic acid production at a C/N of 15 was 21.1% lower than that at a C/N of 3. After day 16, the butanoic acid concentration started increasing, while the acetic acid concentration started declining, with the caproic acid concentration remaining relatively constant. These findings suggest that the accumulated acetic acid had participated in reverse β-oxidation, supporting partial CCE. Nzeteu Co et al. [27] reported similar observations, wherein lactic acid oxidation led to acetic acid production, which was subsequently consumed in reverse β-oxidation, thus forming butanoic acid rather than caproic acid. At a C/N ratio of 25 (Figure 1), the caproic acid synthesis accelerated from day 5 to day 8, with its concentration peaking at 4999.5 mg/L on day 18. Throughout fermentation, the maximum acetic acid concentration was 1394 mg/L, which was 43% lower than that at a C/N of 1. The maximum concentration of caproic acid at a C/N of 25 was similar to that at a C/N of 15.
The highest caproic acid concentrations at C/N ratios of 58, 75, and 100 were 4561, 3989, and 3745 mg/L, respectively, which were 26%, 35%, and 39% lower than those at a C/N of 3. At C/N 58 (Figure 1), caproic acid increased rapidly between days 15 and 16, despite ethanol being exhausted and butanoic acid levels remaining stable during the period. This suggests that hexanoyl coenzyme accumulation and ethanol oxidation provided sufficient energy for reverse β-oxidation, promoting caproic acid synthesis. Among all treatments, the C/N 75 treatment led to the highest acetic acid accumulation (2497 mg/L), which was 150% greater than that at C/N 3. On day 19, ethanol was depleted and butanoic acid levels began to rise slowly, indicating that electrons may have been sequestered in intermediates, such as butyryl cofactors, during CCE before subsequent conversion to butanoic acid [28]. At C/N 100, acetic acid concentrations declined rapidly after day 16, whereas butanoic acid and caproic acid concentrations continued to increase. This indicates that acetic acid, initially a fermentation byproduct, was later used as an EA in CCE. During the mid-to-late fermentation stages, rising caproic acid levels coincided with gradually increasing butanoic acid concentrations, suggesting that butanoic acid no longer functioned as an EA but rather accumulated as a product. Because butyryl coenzyme A is a key intermediate in caproic acid synthesis, the persistence of butanoic acid suggests insufficient CCE. The high butanoic acid concentration remaining in the fermentation system hindered electron transfer [26], likely contributing to low caproic acid yields at a C/N ratio of 100.

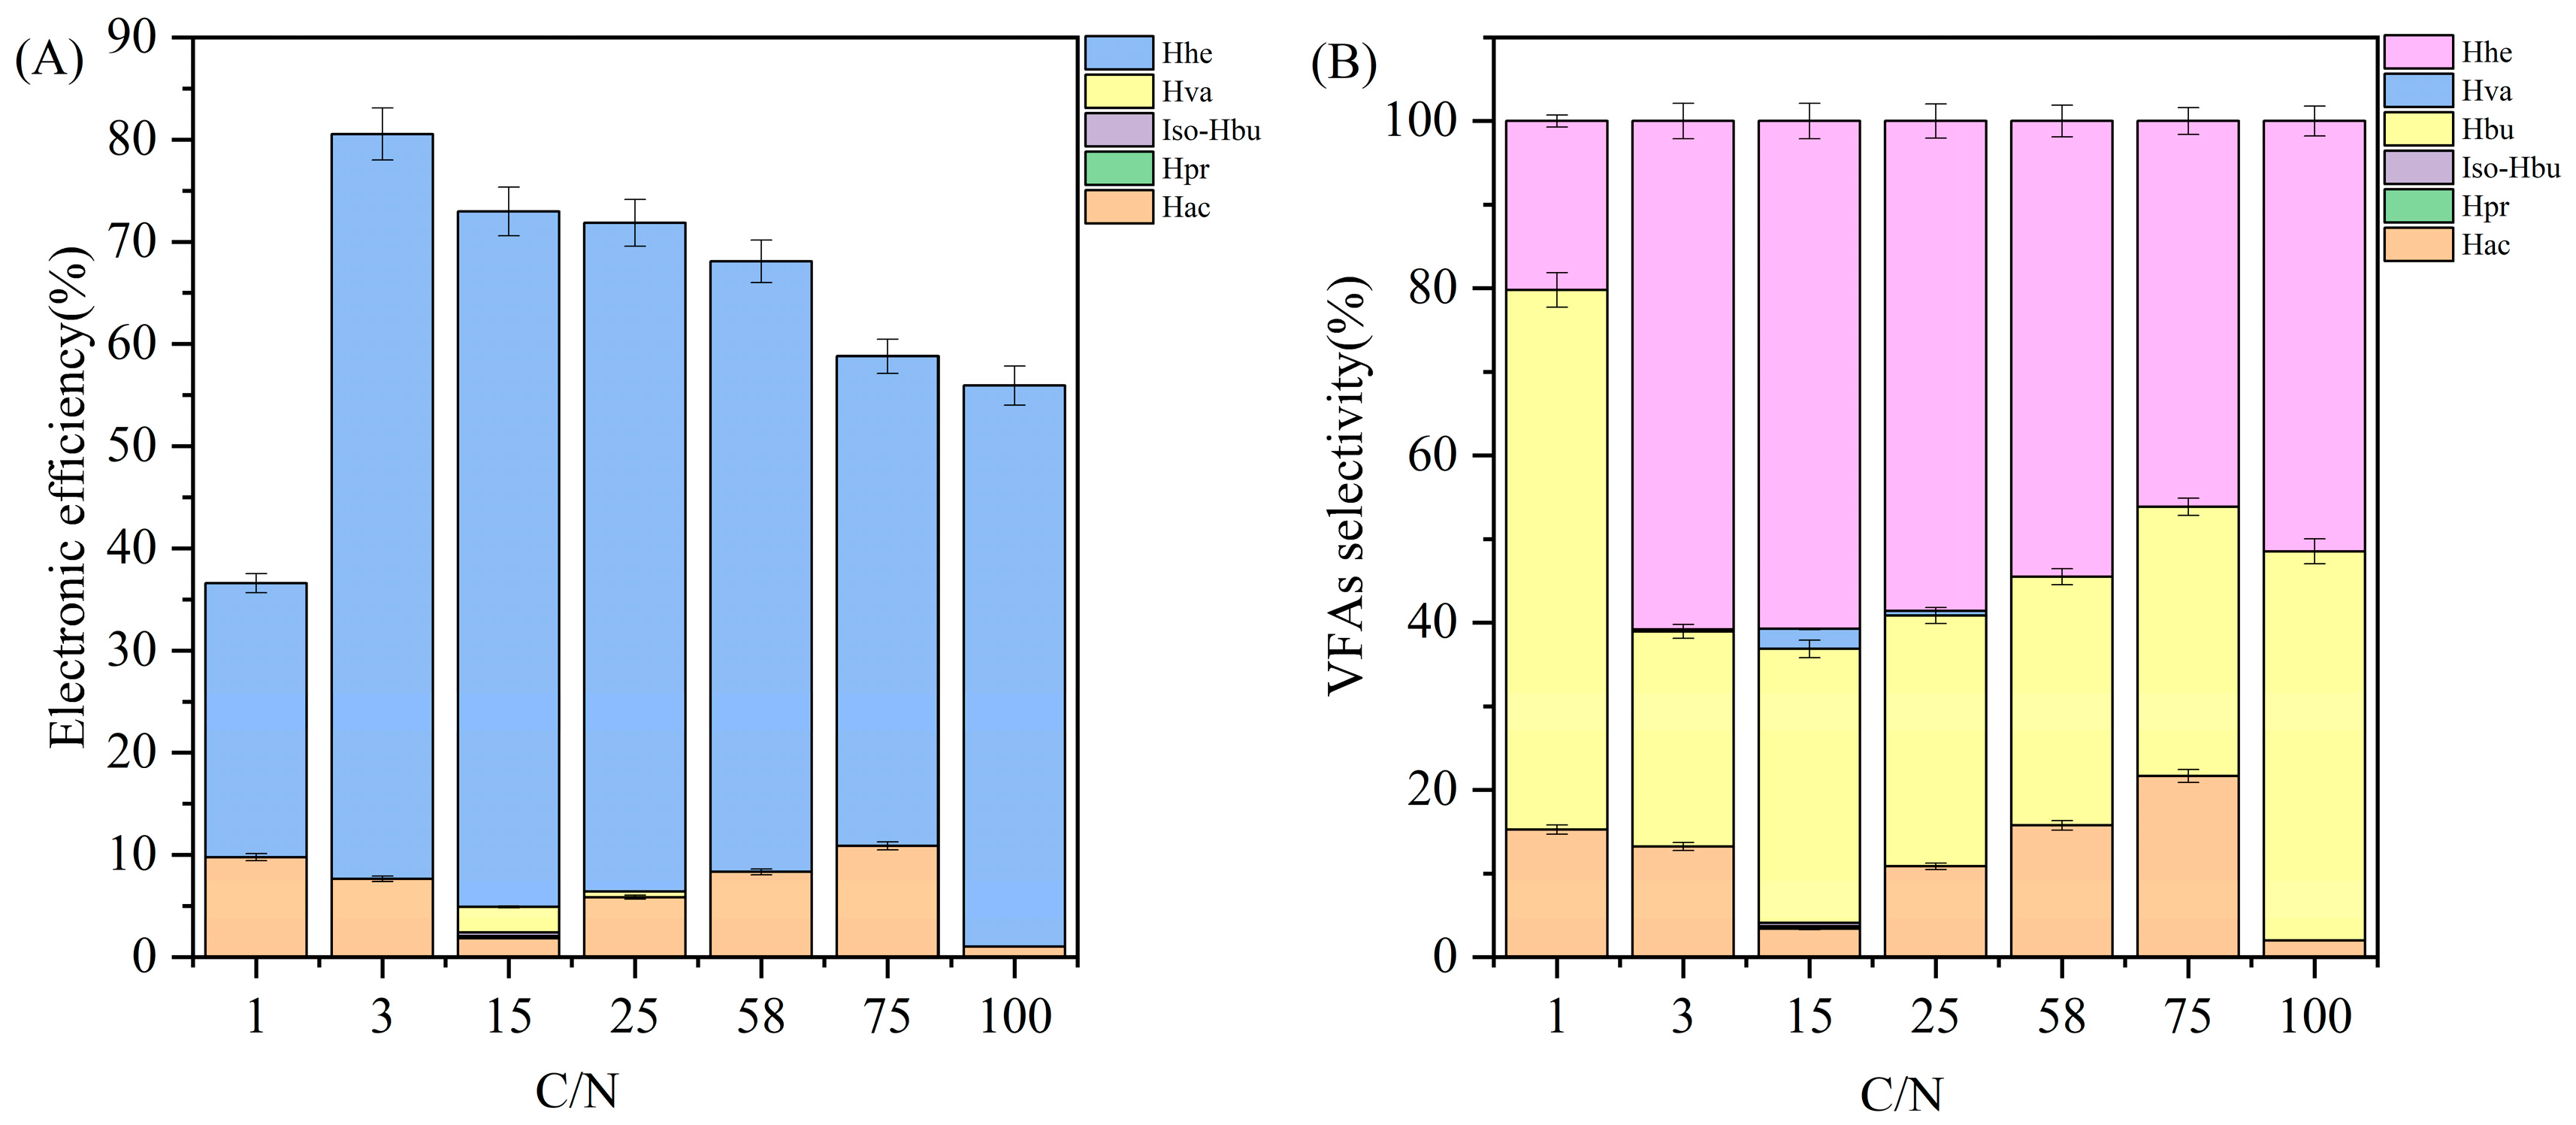
3.2. Electronic Efficiency and Product Selectivity

Electronic efficiency refers to the proportion of substrate electrons effectively converted into desired products [22]. In all fermentation systems, ethanol was completely consumed, while butanoic acid remained at a lower concentration than its initial value. The primary products detected were acetic acid and caproic acid (Figure 1). At a C/N ratio of 1, the overall electron efficiency was only 36.6%, significantly lower than that in other groups (Figure 2A). Wang X et al. [29] demonstrated that high NH4+ concentrations increased reactive oxygen species (ROS) production, which can compromise microbial cell integrity and inhibit bacterial activity [30]. The reduced electron efficiency at C/N 1 may therefore be attributed to ROS production induced by high NH4+ concentrations, subsequently impairing fermentation microorganisms and diminishing the electronic efficiency of the product. At C/N 3, the overall electron efficiency peaked at 80.6%, with the electron efficiency of caproic acid being 72.9%, which was the highest among all treatments. At C/N 15, the overall electron efficiency remained high at 73%, while the caproic acid-specific electron efficiency was recorded at 68%, slightly lower than those at C/N of 3, but not significantly different from those at C/N 25. As the C/N ratio increased to 75, the electronic efficiency of caproic acid declined to 47.9%, whereas that of acetic acid increased to 11%. Rughoonundun H et al. [23] reported that the C/N ratio significantly affects the distribution of carboxylic acid products, especially at extreme C/N ratios (>31.8 or <13.2). At C/N > 62.4, the microbial metabolic pathways shifted predominantly toward acetic acid production. Similarly, the electronic efficiency of acetic acid increased at C/N 75 because of changes in microbial metabolic pathways, which led to EEO.
The selectivity of individual VFAs at the end of fermentation is presented in Figure 2B. At C/N 1, butanoic acid exhibited the highest selectivity, primarily due to the conversion of acetic acid into butanoic acid through CCE in later fermentation stages. In all other treatments, the selectivity of caproic acid was the highest. Caproic acid selectivity was approximately 60% at C/N of 3, 15, and 25. Acetic acid selectivity at C/N of 1 and 3 was 15.3% and 13%, respectively, whereas that at C/N of 15 was only 3.4%. Tennison-Omovoh CA et al. [31] reported at C/N of 5, total VFAs production peaked at 26.08 g/L after 15 days, with acetic acid and butanoic acid as dominant products. The higher acetic acid selectivity at C/N of 1 and 3 was attributed to the high NH4+ concentration, which enhanced acetic acid-producing bacterial growth and reproduction. When C/N > 15, caproic acid selectivity decreased, whereas acetic acid selectivity increased.
Overall, the electron efficiency and selectivity of caproic acid were higher at a C/N ratio of 3–25, indicating that more electrons from the substrate were transported to caproic acid. This C/N ratio range provided a nutrient-rich environment conducive to anaerobic microbial growth and efficient utilization of substrates in the fermentation system.

3.3. Distribution of Carbon in Products

In this study, acetic acid and caproic acid were the key carbon-containing products. During CCE, not all substrate carbon is converted into products, as a portion is consumed for microbial growth. Figure 3 illustrates the carbon distribution of products at different C/N ratios. At C/N 1, only 29.8% of consumed carbon was converted to caproic acid. At C/N ratios of 3, 15, and 25, the proportion of caproic acid carbon was 77%, 72%, and 69%, respectively. This indicated that the C/N range of 3–25 was optimal for the transfer of substrate carbon to caproic acid. As the C/N ratio increased from 25 to 75, caproic acid carbon decreased from 69% to 51%. At C/N 100, the proportion of caproic acid carbon was 59%, slightly higher than that at C/N 75. Conversely, acetic acid carbon at C/N 75 was 15.4%, significantly higher than that at C/N 100. These results are consistent with the finding that acetic acid served as an EA during the CCE of caproic acid and butanoic acid in the late fermentation stages at C/N 100.

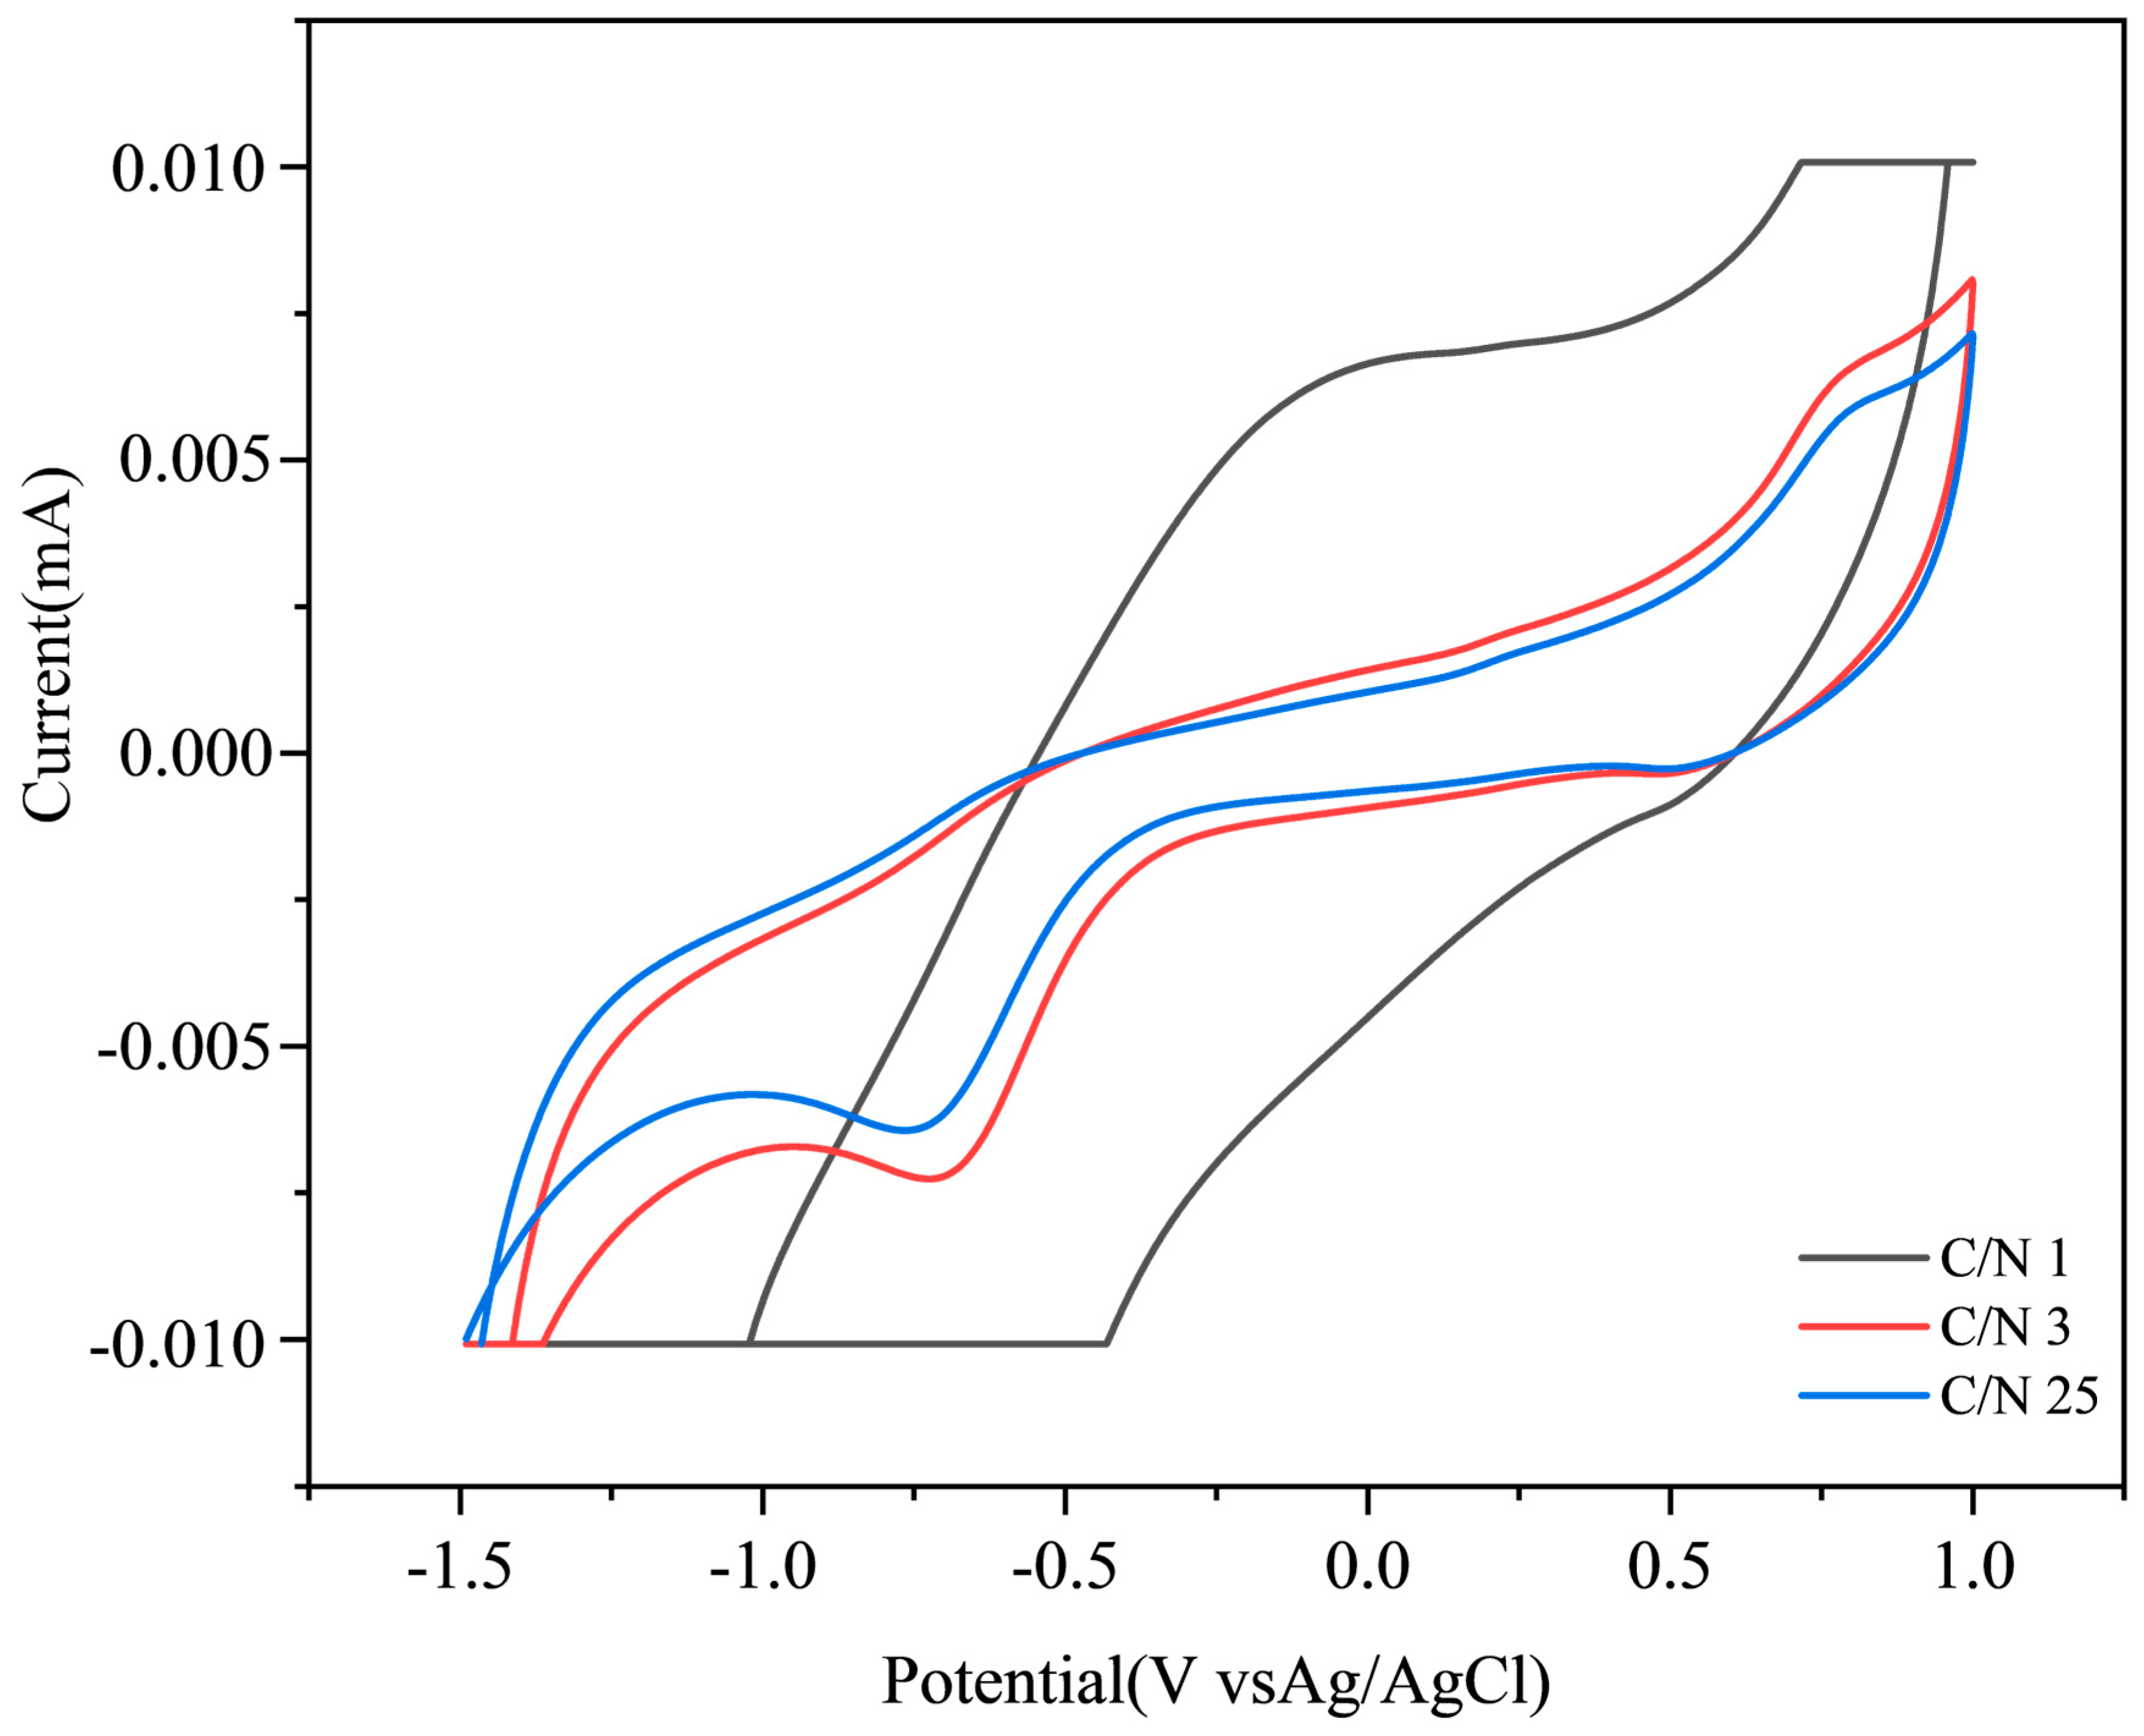
3.4. Electrochemical Analysis

CV is an electrochemical technique used to evaluate the electrical conductivity and redox properties of fermentation broth [32]. Caproic acid synthesis via reverse β-oxidation involves multiple redox reactions. The strong conductivity and reducibility in the fermentation system favor caproic acid synthesis.
In anaerobic fermentation, elevated redox potentials enhance the extracellular electron transfer efficiency [33,34]. NADH/NAD+ is a cofactor involved in cytoplasmic redox reactions, but its cellular availability is limited [35]. NADH/NAD+ mediates electron translocation across the cell membrane, thereby promoting electron exchange among microorganisms and improving the efficiency of CCE [28].
The CV curves at different C/N ratios are presented in Figure 4. No redox peaks were observed in the anaerobic fermentation system with a C/N of 1. Wu Q-L et al. [25] found that NH4+ concentrations exceeding 2.0 g/L reduce the activity of reverse β-oxidation enzymes and lower NADH/NAD+ redox pair availability, hindering electron transfer and caproic acid biosynthesis. At C/N 1, NH4+ levels reached 7.2 g/L, likely explaining the low caproic acid yield. At C/N 3, strong redox peaks appeared at −1.5 to 1.0 V, with a reduction peak voltage of approximately −0.73 V and a current value of approximately −0.0076 mA. This suggests a strong reducing capacity, ideal for CCE, as favorable redox conditions stimulate caproic acid-producing bacteria and boost caproic acid selectivity [36]. Similarly, at C/N of 25, redox peaks were noted in the same voltage range, but with a slightly lower current, indicating weaker reducing power than that at C/N 3. These observations align with caproic acid yields at differing C/N ratios. Guo H et al. [37] found that the greater the current density in anaerobic fermentation systems, the faster the microbial electron transfer. Overall, in the C/N range of 3–25, redox conditions facilitate electron transfer among microorganisms, thus promoting caproic acid formation.

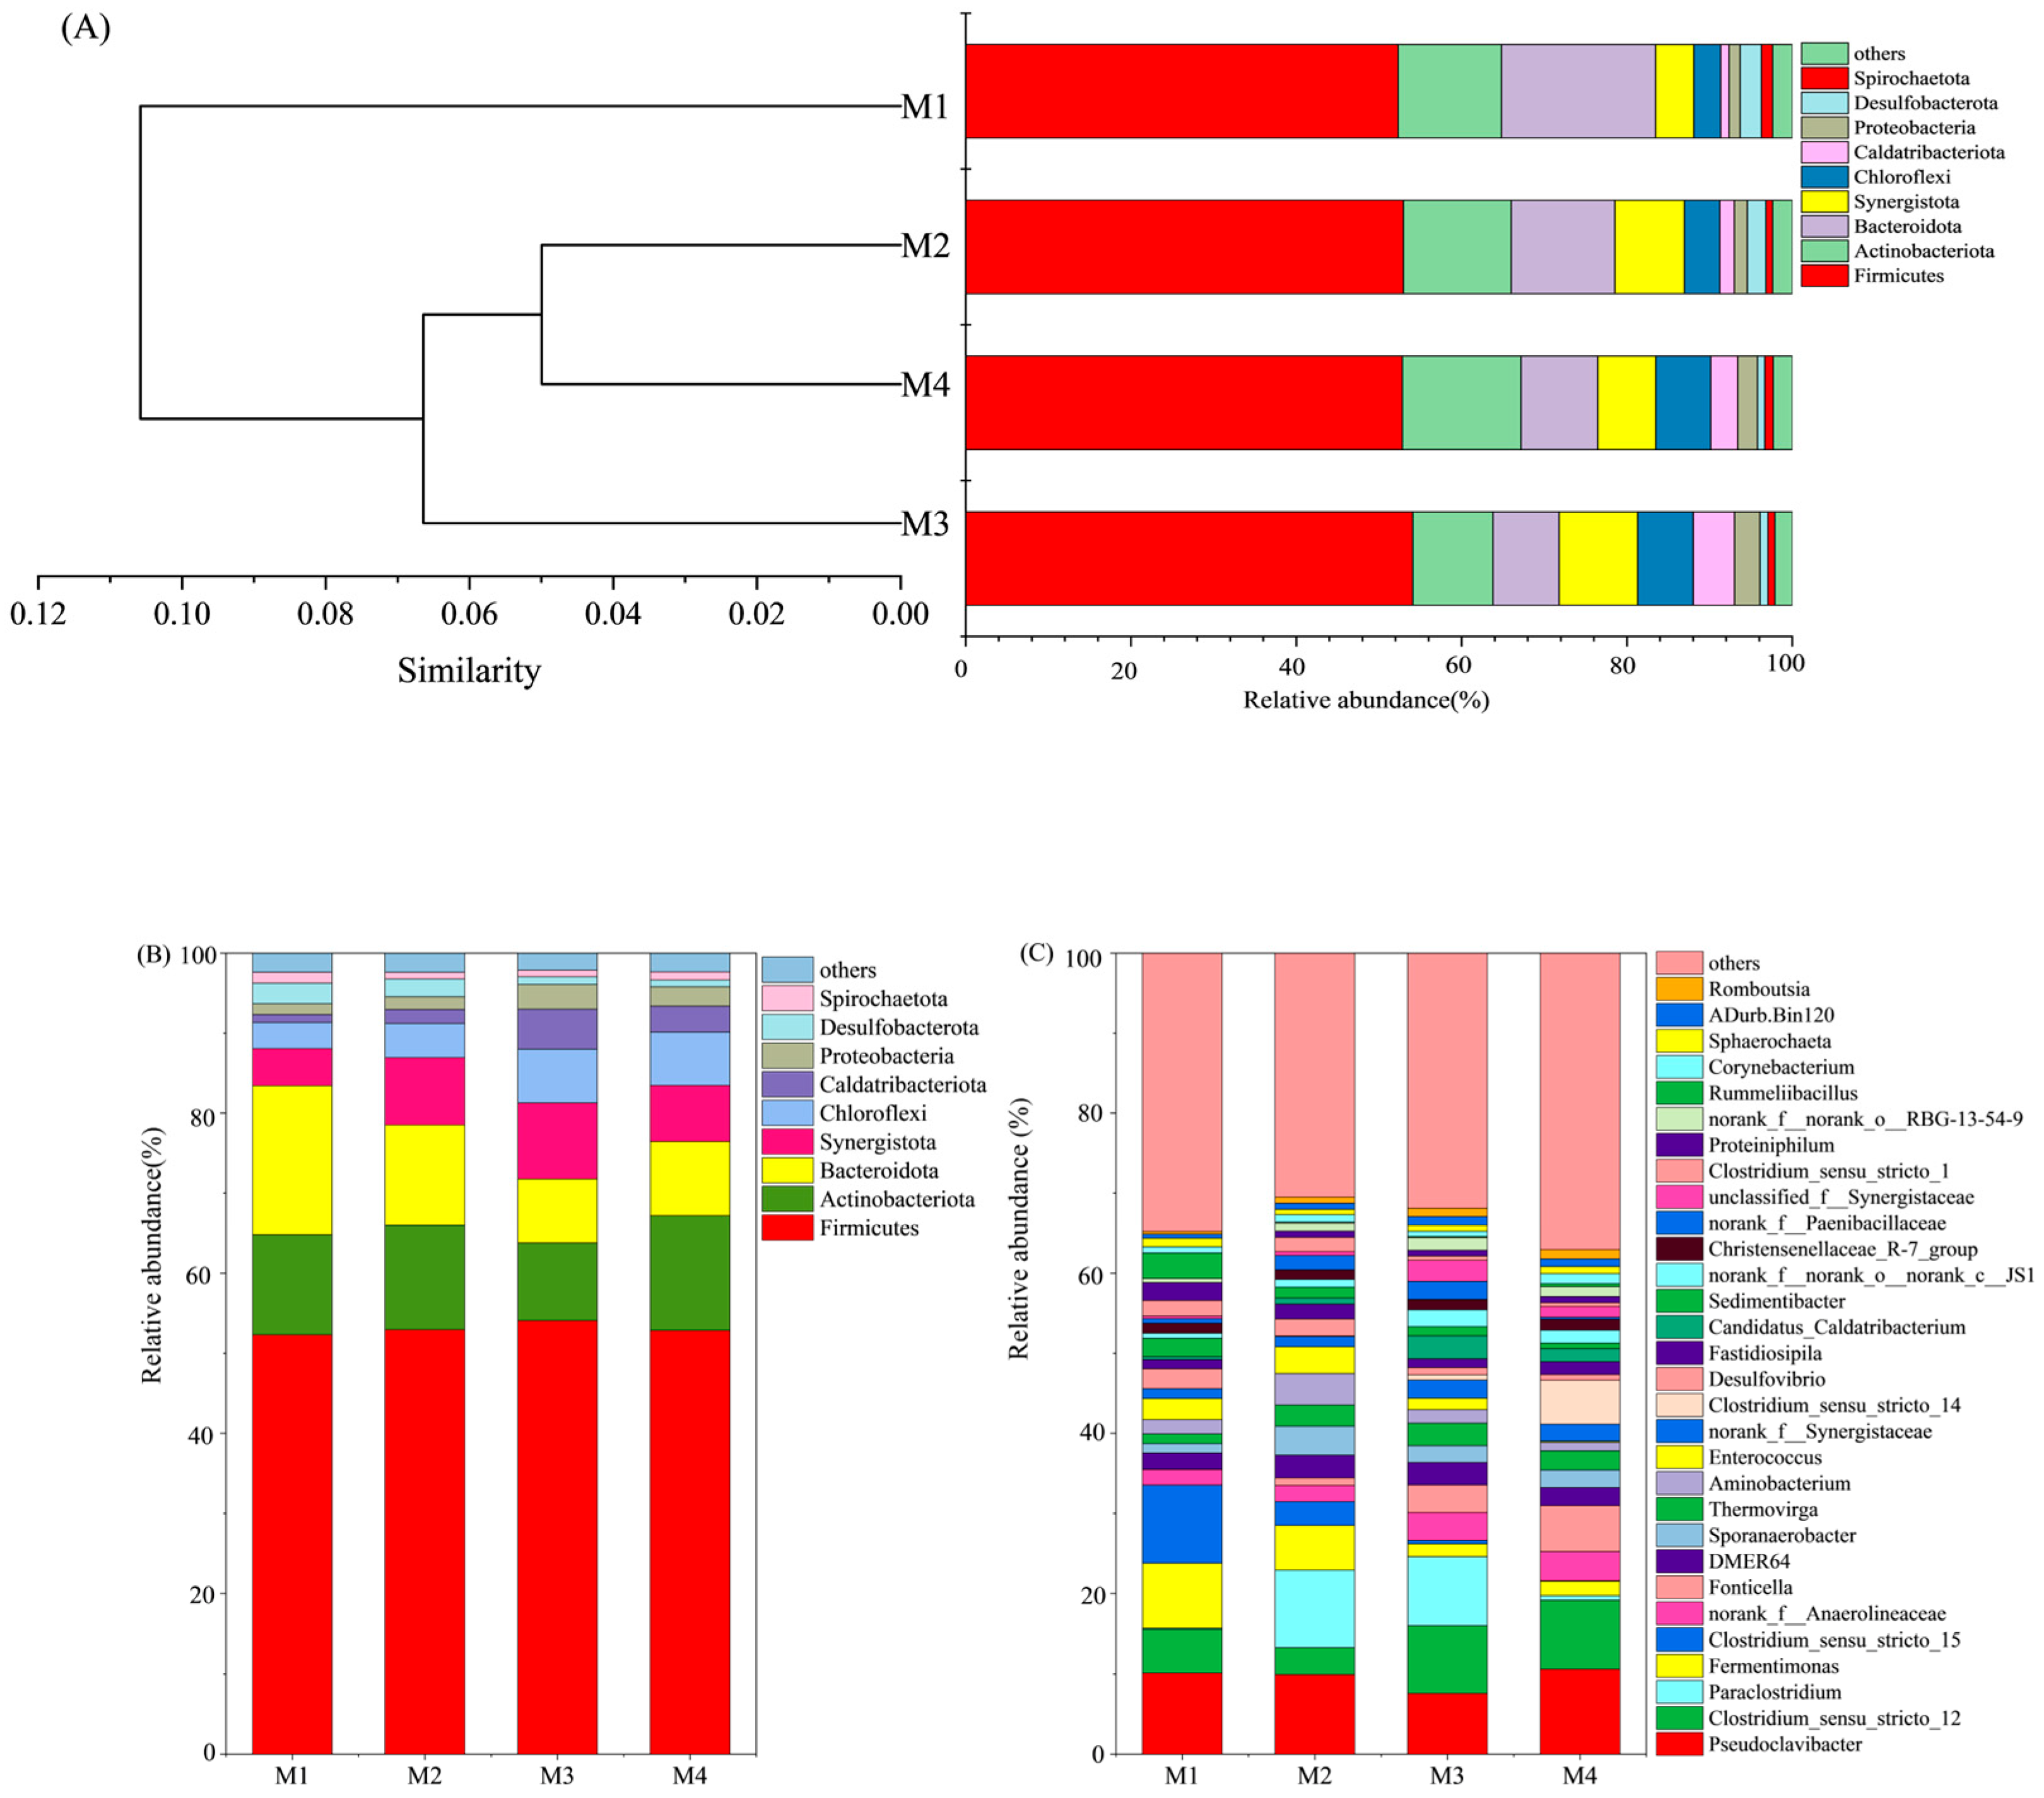
3.5. Microbial Community Analysis

To investigate the effect of C/N ratios on microbial populations and their role in caproic acid production, 16S rRNA sequencing was performed on samples from M1 (C/N = 1), M2 (C/N = 3), M3 (C/N = 25), and M4 (C/N = 100) treatments. Table 1 shows that all groups had an operational taxonomic units (OTUs) coverage of 99%, confirming the accuracy of the sequencing results. Microbial diversity was evaluated using Shannon and Simpson indices, where higher Shannon values indicate greater diversity and higher Simpson values indicate lower diversity [28]. Ace and Chao indices were used to evaluate microbial community richness, with higher values suggesting a richer microbial composition [38]. The M1 treatment had the lowest Shannon index and the highest Simpson index, indicating a less diverse microbial community. By contrast, the M2 and M3 treatments had higher Ace and Chao indices than the other two treatments, which suggested their greater microbial abundance. The dendrogram in Figure 5A depicts microbial community similarities at the phylum level. The M2 and M4 treatments exhibited high similarity in the microbial community structure, whereas M1 differed significantly from the other groups. These differences may be ascribed to a higher presence of acetic acid-producing bacteria and a lower presence of caproic acid-producing bacteria in the M1 treatment [28].
Firmicutes, Actinobacteria, Bacteroidota, Synergistota, and Chloroflexi were the dominant phyla across all samples, accounting for more than 90% of the total microbial population (Figure 5B). Firmicutes and Actinobacteriota may degrade various organic materials, including proteins and carbohydrates, and encompass numerous bacteria involved in SCFA production [39]. Firmicutes are characterized by thick cell walls, strong spore-producing abilities, and the ability to survive under extreme conditions. This phylum includes most chain-elongating bacteria [16]. Firmicutes were the dominating phylum in anaerobic fermentation systems and could consume acetic acid [40]. Its relative abundance was 53% in M2 and 54.1% in M3, correlating with lower acetic acid concentrations in these treatments. This may be attributed to acetic acid utilization by Firmicutes as a carbon source. Clostridium kluyveri, a key caproic acid producer, requires CO2 for cell growth, whereas tetrahydrofolic acid acts as a key coenzyme for CO2 assimilation [41]. P-aminobenzoic acid, a precursor of tetrahydrofolate [42], can be produced by several bacteria, Bifidobacteria, from Actinobacteriota [43], potentially supporting caproic acid biosynthesis. Among the four samples, Bacteroidota was the most abundant in M1 (18.7%), aligning with high butanoic acid accumulation during mid and later stages of M1 treatment, suggesting its role in butanoic acid production [44]. Synergistota, an electrochemically active bacterial phylum involved in microbial electron transfer [45], was significantly more abundant in M2 (8.4%) and M3 (9.5%) than in other treatments. This likely contributed to higher caproic acid concentrations in M2 and M3 treatments.
Microbial community composition at the genus level is shown in Figure 5C. Clostridium_sensu_stricto_12 is strongly associated with caproic acid production [24]. In this study, its relative abundance in M2 was only 3.4%, lower than that in the other three treatments, despite the caproic acid yield being the highest in M2 compared with all treatments. This suggests that other carbon chain-elongating bacteria also contributed to caproic acid synthesis in M2. DMER64, a functional microorganism involved in interspecies hydrogen transfer and microbial electron exchange [46], was more abundant in M2 (2.84%) and M3 (2.8%) treatments than in M1 and M4 treatments. This correlated with higher caproic acid yields, indicating that DMER64 was enriched in the fermentation system at C/N of 3–25, thus facilitating electron transfer among microorganisms for caproic acid biosynthesis. Para clostridium, a typical carbon chain-elongating bacterium that extends these chains by using available electrons [47], was highly abundant in M2 (9.6%) and M3 (8.6%), matching their high caproic acid concentrations. Thermovirga, capable of degrading amino acids and directly participating in direct interspecies electron transfer in microbes [48], was present at 2.7% and 2.8% in M2 and M3 treatments, respectively, favoring caproic acid synthesis. In anaerobic fermentation, Sporanaerobacter is involved in extracellular electron transfer and ethanol-driven chain extension [16]. The relative abundance of Sporanaerobacter was the highest in M2, consistent with its high caproic acid yield [16]. Proteiniphilum, a bacterium hydrolyzing proteins and converting amino acids (glycine and L-arginine) into acetic acid [49], was most abundant in M1, correlating with its highest acetic acid concentration. Together, the experimental results suggest that Clostridium_sensu_stricto_12, DMER64, Para clostridium, Thermovirga, and Sporanaerobacter all contributed to high caproic acid production in both M2 and M3 treatments, supporting the feasibility of large-scale caproic acid production through microbial synergy.

4. Conclusions

This study investigated the effect of C/N ratios on caproic acid synthesis using ethanol-butanoic acid as a substrate, and determined the C/N range suitable for caproic acid biosynthesis, providing a certain theoretical basis for the production of caproic acid. The results indicated that C/N values between 3 and 25 were optimal for caproic acid synthesis. At C/N of 1, high NH4+ levels promoted Proteiniphilum proliferation, resulting in EEO and acetic acid accumulation. At C/N > 58, excessive acetic acid accumulated in the reaction system. Within the C/N range of 3–25, Clostridium_sensu_stricto_12, DMER64, Para clostridium, Thermovirga, and Sporanaerobacter synergistically enhanced caproic acid production.

Author Contributions

The specific contributions of the author are as follows: L.L.: Data curation; Conceptualization; Writing—original draft; Writing—review & editing. Y.S.: Investigation; Data curation. S.Y.: Supervision. Z.C.: Supervision. X.J.: Supervision. J.Z.: Project administration; Funding acquisition; Writing—review & editing. All authors have read and agreed to the published version of the manuscript.

Funding

This research was funded by [the Natural Science Foundation of Shandong Province, China] grant number (ZR2024ME187).

Institutional Review Board Statement

Not applicable.

Informed Consent Statement

Not applicable.

Data Availability Statement

The original contributions presented in the study are included in the article, further inquiries can be directed to the corresponding author/s.

Conflicts of Interest

The authors declare no conflict of interest.

References

  1. Agler, M.T.; Wrenn, B.A.; Zinder, S.H.; Angenent, L.T. Waste to bioproduct conversion with undefined mixed cultures: The carboxylate platform. Trends Biotechnol. 2011, 29, 70–78. [Google Scholar] [CrossRef] [PubMed]
  2. Wu, S.-L.; Sun, J.; Chen, X.; Wei, W.; Song, L.; Dai, X.; Ni, B.-J. Unveiling the mechanisms of medium-chain fatty acid production from waste activated sludge alkaline fermentation liquor through physiological, thermodynamic and metagenomic investigations. Water Res. 2020, 169, 115218. [Google Scholar] [CrossRef] [PubMed]
  3. Agler, M.T.; Spirito, C.M.; Usack, J.G.; Werner, J.J.; Angenent, L.T. Chain extensionwith reactor microbiomes: Upgrading dilute ethanol to medium-chain carboxylates. Energy Environ. Sci. 2012, 5, 8189–8192. [Google Scholar] [CrossRef]
  4. Fortney, N.W.; Hanson, N.J.; Rosa, P.R.F.; Donohue, T.J.; Noguera, D.R. Diverse Profile of Fermentation Byproducts From Thin Stillage. Front. Bioeng. Biotechnol. 2021, 9, 695306. [Google Scholar] [CrossRef]
  5. Wu, Q.; Bao, X.; Guo, W.; Wang, B.; Li, Y.; Luo, H.; Wang, H.; Ren, N. Medium chain carboxylic acids production from waste biomass: Current advances and perspectives. Biotechnol. Adv. 2019, 37, 599–615. [Google Scholar] [CrossRef]
  6. Tang, J.; Hu, Z.; Yang, H.; Pu, Y.; Xiong, Y.; Chen, J.; Liu, R.; Li, T.; Shah, F.; Abomohra, A. Enhancement of caproate production from food waste using biochar produced from agricultural wastes: A microbial perspective. Ind. Crops Prod. 2024, 221, 119401. [Google Scholar] [CrossRef]
  7. Wu, Q.; Feng, X.; Guo, W.; Bao, X.; Ren, N. Long-term medium chain carboxylic acids production from liquor-making wastewater: Parameters optimization and toxicity mitigation. Chem. Eng. J. 2020, 388, 124218. [Google Scholar] [CrossRef]
  8. Zan, F.; Hao, T. Sulfate in anaerobic co-digester accelerates methane production from food waste and waste activated sludge. Bioresour. Technol. 2020, 298, 122536. [Google Scholar] [CrossRef] [PubMed]
  9. Lee, E.; Bittencourt, P.; Casimir, L.; Jimenez, E.; Wang, M.; Zhang, Q.; Ergas, S.J. Biogas production from high solids anaerobic co-digestion of food waste, yard waste and waste activated sludge. Waste Manag. 2019, 95, 432–439. [Google Scholar] [CrossRef]
  10. Naran, E.; Toor, U.A.; Kim, D.-J. Effect of pretreatment and anaerobic co-digestion of food waste and waste activated sludge on stabilization and methane production. Int. Biodeterior. Biodegrad. 2016, 113, 17–21. [Google Scholar] [CrossRef]
  11. Wang, X.; Yang, G.; Feng, Y.; Ren, G.; Han, X. Optimizing feeding composition and carbon–nitrogen ratios for improved methane yield during anaerobic co-digestion of dairy, chicken manure and wheat straw. Bioresour. Technol. 2012, 120, 78–83. [Google Scholar] [CrossRef] [PubMed]
  12. Kayhanian, M.; Tchobanoglous, G. Computation of C/N ratios for various organic fractions. BioCycle 1992, 33, 58–60. [Google Scholar]
  13. Kim, D.H.; Kim, S.H.; Han, S.K.; Shin, H.S. Performance of Pilot-scale H2 fermentor: C/N ratio effect and alkaline shock treatment. J. Environ. Eng. Manag. 2006, 16, 327–331. [Google Scholar]
  14. Lay, C.Y.L.H. Carbon/nitrogen-ratio effect on fermentative hydrogen production by mixed microflora. Int. J. Hydrogen Energy 2004, 29, 41–45. [Google Scholar]
  15. Liu, X.; Liu, H.; Chen, Y.; Du, G.; Chen, J. Effects of organic matter and initial carbon–nitrogen ratio on the bioconversion of volatile fatty acids from sewage sludge. J. Chem. Technol. Biotechnol. 2008, 83, 1049–1055. [Google Scholar] [CrossRef]
  16. Wu, Q.; Guo, W.; Bao, X.; Meng, X.; Yin, R.; Du, J.; Zheng, H.; Feng, X.; Luo, H.; Ren, N. Upgrading liquor-making wastewater into medium chain fatty acid: Insights into co-electron donors, key microflora, and energy harvest. Water Res. 2018, 145, 650–659. [Google Scholar] [CrossRef]
  17. Kucek, L.A.; Spirito, C.M.; Angenent, L.T. High n-caprylate productivities and specificities from dilute ethanol and acetate: Chain extension with microbiomes to upgrade products from syngas fermentation. Energy Environ. Sci. 2016, 9, 3482–3494. [Google Scholar] [CrossRef]
  18. Zhang, D.; Jiang, H.; Chang, J.; Sun, J.; Tu, W.; Wang, H. Effect of thermal hydrolysis pretreatment on volatile fatty acids production in sludge acidification and subsequent polyhydroxyalkanoates production. Bioresour. Technol. 2019, 279, 92–100. [Google Scholar] [CrossRef]
  19. Miner, G. Standard Methods for the Examination of Water and Wastewater, 21st Edition. J. Am. Water Work. Assoc. 2006, 98, 130. [Google Scholar] [CrossRef]
  20. Zhou, X.; Lu, Y.; Huang, L.; Zhang, Q.; Wang, X.; Zhu, J. Effect of pH on volatile fatty acid production and the microbial community during anaerobic digestion of Chinese cabbage waste. Bioresour. Technol. 2021, 336, 125338. [Google Scholar] [CrossRef]
  21. Chen, R.; Ji, X.; Chen, Z.; Huang, L.; Zhu, J. Regulation of hydraulic retention time on caproic acid production via two-phase anaerobic fermentation of Chinese cabbage waste with autopoietic electron donors. J. Biotechnol. 2024, 381, 1–10. [Google Scholar] [CrossRef] [PubMed]
  22. Wu, Q.; Guo, W.; You, S.; Bao, X.; Luo, H.; Wang, H.; Ren, N. Concentrating lactate-carbon flow on medium chain carboxylic acids production by hydrogen supply. Bioresour. Technol. 2019, 291, 121573. [Google Scholar] [CrossRef] [PubMed]
  23. Rughoonundun, H.; Mohee, R.; Holtzapple, M.T. Influence of carbon-to-nitrogen ratio on the mixed-acid fermentation of wastewater sludge and pretreated bagasse. Bioresour. Technol. 2012, 112, 91–97. [Google Scholar] [CrossRef]
  24. Spirito, C.M.; Richter, H.; Rabaey, K.; Stams, A.J.M.; Angenent, L.T. Chain extension in anaerobic reactor microbiomes to recover resources from waste. Curr. Opin. Biotechnol. 2014, 27, 115–122. [Google Scholar] [CrossRef] [PubMed]
  25. Wu, Q.-L.; Yuan, K.-X.; Ren, W.-T.; Deng, L.; Wang, H.-Z.; Feng, X.-C.; Zheng, H.-S.; Ren, N.-Q.; Guo, W.-Q. Unveiling the Mechanism Underlying the Effects of Ammonia on n-Caproate Production: Influenced Pathways, Key Enzymes, and Microbiota Functions. Engineering 2024, 35, 180–190. [Google Scholar] [CrossRef]
  26. Lou, T.; Yin, Y.; Wang, J. Improved production of medium-chain fatty acids by biochar: Effect of biochar dosage and mechanism. J. Clean. Prod. 2024, 450, 142051. [Google Scholar] [CrossRef]
  27. Nzeteu, C.O.; Coelho, F.; Trego, A.C.; Abram, F.; Ramiro-Garcia, J.; Paulo, L.; O’Flaherty, V. Development of an enhanced chain elongation process for caproic acid production from waste-derived lactic acid and butyric acid. J. Clean. Prod. 2022, 338, 130655. [Google Scholar] [CrossRef]
  28. Ji, X.; Chen, Z.; Shen, Y.; Liu, L.; Chen, R.; Zhu, J. Hexanoic acid production and microbial community in anaerobic fermentation: Effects of inorganic carbon addition. Bioresour. Technol. 2024, 403, 130881. [Google Scholar] [CrossRef]
  29. Wang, X.; Han, J.; Zeng, M.; Chen, Y.; Jiang, F.; Zhang, L.; Zhou, Y. Total ammonia nitrogen inhibits medium-chain fatty acid biosynthesis by disrupting hydrolysis, acidification, chain elongation, substrate transmembrane transport and ATP synthesis processes. Bioresour. Technol. 2024, 409, 131236. [Google Scholar] [CrossRef]
  30. Liu, C.; Chen, Y.; Huang, H.; Duan, X.; Dong, L. Improved anaerobic digestion under ammonia stress by regulating microbiome and enzyme to enhance VFAs bioconversion: The new role of glutathione. Chem. Eng. J. 2022, 433, 134562. [Google Scholar] [CrossRef]
  31. Tennison-Omovoh, C.A.; Fagbohungbe, M.O.; Bankole, P.O.; Semple, K.T. The effect of different C-N ratios on volatile fatty acid (VFAs) production from acidogenic fermentation of sucrose in continuous-stirred tank reactors. Biomass Convers. Biorefinery 2022, 13, 9339–9351. [Google Scholar] [CrossRef]
  32. Luo, T.; Xu, Q.; Wei, W.; Sun, J.; Dai, X.; Ni, B.-J. Performance and Mechanism of Fe3O4 Improving Biotransformation of Waste Activated Sludge into Liquid High-Value Products. Environ. Sci. Technol. 2022, 56, 3658–3668. [Google Scholar] [CrossRef] [PubMed]
  33. Feng, Q.; Song, Y.-C.; Li, J.; Wang, Z.; Wu, Q. Influence of electrostatic field and conductive material on the direct interspecies electron transfer for methane production. Environ. Res. 2020, 188, 109867. [Google Scholar] [CrossRef]
  34. Sun, M.; Jiang, H.; Zhang, Z.; Lv, M.; Liu, G.; Feng, Y. Coupling direct voltage and granular activated carbon modified nanoscale zero valent iron for enhancing anaerobic methane production. Chemosphere 2022, 286, 131840. [Google Scholar] [CrossRef] [PubMed]
  35. Grimalt-Alemany, A.; Etler, C.; Asimakopoulos, K.; Skiadas, I.V.; Gavala, H.N. ORP control for boosting ethanol productivity in gas fermentation systems and dynamics of redox cofactor NADH/NAD+ under oxidative stress. J. CO2 Util. 2021, 50, 101589. [Google Scholar] [CrossRef]
  36. Schievano, A.; Pepé Sciarria, T.; Vanbroekhoven, K.; De Wever, H.; Puig, S.; Andersen, S.J.; Rabaey, K.; Pant, D. Electro-Fermentation—Merging Electrochemistry with Fermentation in Industrial Applications. Trends Biotechnol. 2016, 34, 866–878. [Google Scholar] [CrossRef]
  37. Guo, H.; Hua, J.; Cheng, J.; Yue, L.; Zhou, J. Microbial electrochemistry enhanced electron transfer in lactic acid anaerobic digestion for methane production. J. Clean. Prod. 2022, 358, 131983. [Google Scholar] [CrossRef]
  38. Zhang, Y.; Zhao, F.; Feng, C.; Bai, W.; Zhang, Z.; Cai, Q.; Sun, Z.; Feng, L. Effects of Maize/Peanut Intercropping and Nitrogen Fertilizer Application on Soil Fungal Community Structure. Agronomy 2024, 14, 1053. [Google Scholar] [CrossRef]
  39. Duan, X.; Wang, X.; Xie, J.; Feng, L.; Yan, Y.; Zhou, Q. Effect of nonylphenol on volatile fatty acids accumulation during anaerobic fermentation of waste activated sludge. Water Res. 2016, 105, 209–217. [Google Scholar] [CrossRef]
  40. Jang, H.M.; Kim, J.H.; Ha, J.H.; Park, J.M. Bacterial and methanogenic archaeal communities during the single-stage anaerobic digestion of high-strength food wastewater. Bioresour. Technol. 2014, 165, 174–182. [Google Scholar] [CrossRef]
  41. Yu, J.; Huang, Z.; Wu, P.; Zhao, M.; Miao, H.; Liu, C.; Ruan, W. Performance and microbial characterization of two-stage caproate fermentation from fruit and vegetable waste via anaerobic microbial consortia. Bioresour. Technol. 2019, 284, 398–405. [Google Scholar] [CrossRef] [PubMed]
  42. Buchenau, B.; Thauer, R.K. Tetrahydrofolate-specific enzymes in Methanosarcina barkeri and growth dependence of this methanogenic archaeon on folic acid or p-aminobenzoic acid. Arch. Microbiol. 2004, 182, 313–325. [Google Scholar] [CrossRef] [PubMed]
  43. Pompei, A.; Cordisco, L.; Amaretti, A.; Zanoni, S.; Matteuzzi, D.; Rossi, M. Folate Production by Bifidobacteria as a Potential Probiotic Property. Appl. Environ. Microbiol. 2007, 73, 179–185. [Google Scholar] [CrossRef]
  44. Huang, J.; Gao, K.; Yang, L.; Lu, Y. Successional action of Bacteroidota and Firmicutes in decomposing straw polymers in a paddy soil. Environ. Microbiome 2023, 18, 76. [Google Scholar] [CrossRef] [PubMed]
  45. Shao, M.; Zhang, C.; Wang, X.; Wang, N.; Chen, Q.; Cui, G.; Xu, Q. Co-digestion of food waste and hydrothermal liquid digestate: Promotion effect of self-generated hydrochars. Environ. Sci. Ecotechnol. 2023, 15, 100239. [Google Scholar] [CrossRef]
  46. Guo, X.; Sun, C.; Lin, R.; Xia, A.; Huang, Y.; Zhu, X.; Show, P.-L.; Murphy, J.D. Effects of foam nickel supplementation on anaerobic digestion: Direct interspecies electron transfer. J. Hazard. Mater. 2020, 399, 122830. [Google Scholar] [CrossRef]
  47. Lou, T.; Yin, Y.; Wang, J. Influence of adding strategy of biochar on medium-chain fatty acids production from sewage sludge. Chemosphere 2024, 354, 141660. [Google Scholar] [CrossRef]
  48. He, P.; Zhang, H.; Duan, H.; Shao, L.; Lü, F. Continuity of biochar-associated biofilm in anaerobic digestion. Chem. Eng. J. 2020, 390, 124605. [Google Scholar] [CrossRef]
  49. Chen, S.; Dong, X. Proteiniphilum acetatigenes gen. nov., sp. nov., from a UASB reactor treating brewery wastewater. Int. J. Syst. Evol. Microbiol. 2005, 55, 2257–2261. [Google Scholar] [CrossRef]
Figure 1. The product distribution under different C/N conditions with ethanol and butanoic acid as substrates.
Fermentation 11 00316 g001
Figure 2. Electronic efficiency (A) and selectivity (B) of the products.
Fermentation 11 00316 g002
Figure 3. Product carbon distribution (A) and carbon flow (B).
Fermentation 11 00316 g003
Figure 4. CV curves measured at different C/N ratios.
Fermentation 11 00316 g004
Figure 5. Differences in the microbial communities: (A) intergroup similarity plot, (B) phylum level, (C) genus level.
Fermentation 11 00316 g005
Table 1. Comparison of the microbial community diversity in different samples.
Sample GroupSobsShannon IndexSimpson IndexAce IndexChao IndexCoverage
M113274.600.0351421.401376.520.99
M213234.730.0301445.851410.290.99
M313344.860.0251447.931446.190.99
M412974.940.0261357.791348.500.99
Note: M1: C/N = 1; M2: C/N = 3; M3: C/N = 25; M4: C/N = 100.
Disclaimer/Publisher’s Note: The statements, opinions and data contained in all publications are solely those of the individual author(s) and contributor(s) and not of MDPI and/or the editor(s). MDPI and/or the editor(s) disclaim responsibility for any injury to people or property resulting from any ideas, methods, instructions or products referred to in the content.

