Article

Enhanced L-Leucine Production in Escherichia coli via CRISPR-Associated Transposase Genome Engineering

1
State Key Laboratory of Green Papermaking and Resource Recycling, Qilu University of Technology, Jinan 250353, China
2
Dongxiao Biotechnology Co., Ltd., Zhucheng 262200, China
*
Author to whom correspondence should be addressed.
Fermentation 2025, 11(6), 314; https://doi.org/10.3390/fermentation11060314
Submission received: 20 April 2025 / Revised: 23 May 2025 / Accepted: 30 May 2025 / Published: 1 June 2025

Abstract

L-leucine, an essential amino acid which cannot be synthesized in mammals, has extensive applications in various fields. However, the large-scale production of L-leucine still faces various challenges in terms of strain and process optimization. In this study, E. coli A211 was used as the initial strain, and a double enhancement strategy of CRISPR-associated transposase genome integration and a plasmid was employed to enhance the L-leucine metabolic pathway. We constructed four engineered strains—E. coli A101, E. coli B201, E. coli CD301, and E. coli bcd401. The transcriptional levels of key genes (leuA, leuCD, leuB, and bcd) in L-leucine biosynthesis were significantly upregulated to boost L-leucine production. Fermentation screening revealed that E. coli CD301 exhibited the highest L-leucine titer (0.57 ± 0.01 g/L), presenting a 97% increase compared with the parental strain. The fermentation process of E. coli CD301 was further optimized using single-factor optimization followed by response surface methodology of variables such as temperature, C/N ratio, and inoculum size, leading to an enhanced L-leucine titer of 0.89 ± 0.03 g/L, a 56.1% improvement over the pre-optimization level. This study demonstrated the effectiveness of CRISPR-associated transposase genome integration and plasmid double enhancement strategy, providing new insights into metabolic engineering approaches for improving L-leucine production via fermentation with E. coli.

1. Introduction

L-leucine is a branched-chain amino acid (BCAA) [1] with the molecular formula C₆H₁₃NO₂. It appears in the form of white crystals and is an essential amino acid in mammals [2]. Owing to its aliphatic isobutyl side chains, leucine is classified as a hydrophobic amino acid [3]. In recent years, L-leucine has been widely used in dietary supplements [4], animal feed additives [5], and cosmetics because of its diverse physiological functions [6,7]. According to the 2024 Grand View Research report, the current global demand for L-leucine exceeds 30,000 tons. However, the actual production is estimated to be only 20,000 tons, leading to supply falling short of demand [8]. Further, the global demand for L-leucine is growing at a rate of 5–8% annually [9]. Therefore, the development of efficient production processes has become particularly important. The key strategy for achieving this goal is to improve production efficiency and maximize the utilization of carbon output from carbon sources such as glucose [10,11]. Therefore, it is crucial to develop efficient metabolic pathways using genetic engineering modifications.
L-leucine is predominantly produced by microbial fermentation [12]. Escherichia coli K-12 was utilized as the starting strain by Gusyatiner et al. A 4-aza-leucine-resistant mutant strain was obtained from this starter strain by continuous NTG (N-methyl-N’-nitro-N-nitrosoguanidine) mutagenesis and structural similarity screening. The mutant strain was capable of accumulating 5.2 g/L of L-leucine, thus achieving L-leucine production from the starting strain’s genetic background [13]. Corynebacterium glutamicum was explored as a potential L-leucine-producing strain by Vogt et al. [14]. Through genetic modifications that can affect glucose uptake and precursor supply and enhance the L-leucine biosynthesis pathway, the strain MV-LeuF2 was engineered to produce and accumulate L-leucine exceeding the solubility limit of 24 g/L under fed-batch conditions. A molar yield of 0.3 mol L-leucine per mol glucose was achieved, with the maximum volumetric productivity reaching 4.3 mmol L−1 h−1. C. glutamicum JL-51 was constructed by Wang et al. to enhance the supply of acetyl-CoA and the utilization of glucose. Additionally, fermentation conditions were optimized. Under 5 L fed-batch fermentation conditions, an L-leucine titer of 40.11 ± 0.73 g/L, a production rate of 0.59 g L−1 h−1, and a yield of 0.25 g/g were achieved [15]. The highest acid production rate has been reported in China. Currently, L-leucine is predominantly produced via fermentation with C. glutamicum [14].
E. coli exhibits a high growth rate and is amenable to simple genetic operations, and therefore has great development potential in the field of amino acid production. Owing to its rapid cell proliferation rate and the availability of advanced gene manipulation technologies, E. coli is more suitable for fermentation processes [16]. In recent years, remarkable progress has been made in CRISPR technology. CRISPR-associated transposases can be employed to efficiently integrate large-fragment DNA at specific genomic sites [17], which presents the possibility of constructing cell factories. Furthermore, a plasmid reinforcement strategy can be utilized to achieve additional copy expression of target genes, thereby further optimizing metabolic pathways [18]. However, relatively little research has been conducted on combining these two strategies to construct high-yield amino acid strains. This study aimed to construct an efficient E. coli strain capable of producing L-leucine via genome integration using a CRISPR-associated transposase and a double enhancement plasmid strategy. E. coli A211 was employed as the starting strain and the synthetic pathway was reconstructed to enhance the production of L-leucine (Figure 1). Transcriptional levels of isopropylmalate synthase (IPMS, encoded by leuA), isopropylmalate isomerase (IPMI, encoded by leuCD), isopropylmalate dehydrogenase (IPMD, encoded by gene leuB), and leucine dehydrogenase (LeuDH, encoded by bcd) were studied. Moreover, the culture medium components were optimized to determine the optimal nutritional conditions. In this study, a novel genetic engineering modification method was developed. This provides a theoretical basis for subsequent fermentation optimization and the large-scale production of amino acids.

2. Materials and Methods

2.1. Strains, Plasmids, and Culture Media

The strains and plasmids used in this study are listed in Table 1. The plasmids used for gene editing were pQCascade-IS1, pTnsABC, and pCutamp (Nanjing Kingsray Biotechnology Co., Ltd., Nanjing, China).
E. coli was cultured in lysis broth (LB) medium, supplemented with 100 μg/mL ampicillin (Beijing Solarbio Science & Technology Co., Ltd., Beijing, China), 50 μg/mL kanamycin (Solarbio), and 50 μg/mL streptomycin (Solarbio), as needed. Seed culture medium (1 L) included 1 g of glucose (China National Pharmaceutical Group Corporation, Beijing, China), 10 g of peptone (Shanghai Pharmaceuticals Holding Co., Ltd., Shanghai, China), 5 g of yeast powder (Oxoid Ltd., Wade Road, Basingstoke, Hampshire, UK), 6.5 g of beef powder (OXOID), and 2.5 g of sodium chloride (Sinopharm). Fermentation culture (1 L) included 10 g of glucose (Sinopharm), 0.019 g of ferrous sulfate (Sinopharm), 0.004 g of manganese sulfate (Sinopharm), 1.125 g of potassium chloride (Sinopharm), 2.2 g of yeast powder (OXOID), 1.25 g of phosphoric acid (Sinopharm), 0.01 g of vitamin B3 (Sinopharm), and 0.41 g of magnesium sulfate (Sinopharm). The derivative solution was prepared as follows: a 10 g/L solution of FDNB (2,4-dinitrofluorobenzene) was prepared in acetonitrile. The derivative buffer solution was prepared as follows: a 0.5 M NaHCO3 buffer was prepared by dissolving 4.2 g of NaHCO3 in distilled water and diluting it to a final volume of 100 mL. The fixed volume buffer solution was prepared as follows: a phosphate buffer (pH 7.4) was prepared by dissolving 4 g of KH2PO4 in 145.5 mL of 0.1 mol/L NaOH, and subsequently, it was diluted to 500 mL with distilled water. For mobile phase A, a 1:1 (v/v) mixture of acetonitrile and water was prepared, followed by ultrasonic degassing for 15 min. For mobile phase B, an acetate buffer (pH 6.4) was prepared by dissolving 8.2 g of sodium acetate in 1800 mL of water, adjusting the pH to 6.4 with acetic acid, and then diluting it to 2000 mL with distilled water. The buffer was then sonicated for 15 min to remove any dissolved gases. All experimental reagents were of analytical grade or higher.

2.2. CRISPR-Associated Transposase Genome Integration

In this study, the CRISPR-associated transposase system described by Yang et al. was used for genome integration [19], with appropriate modifications. The target gene fragments leuA (Escherichia coli, Sequence lD: CP057808.1), leuB (Escherichia coli, Sequence lD: CP057500.1), leuCD (Escherichia coli, Sequence lD: CP057293.1), and bcd (Bacillus subtilis, Sequence lD: CP154918.1) were obtained from plasmids pET28a-leuA, pET28a-leuB, pET28a-leuCD, and pET28a-bcd, respectively, and ligated to the vector fragment pDonor in pDonor-T7-YdiI to construct the target gene plasmids pDonor-leuA, pDonor-leuB, pDonor-leuCD, and pDonor-bcd, respectively (Figure 2a). Codon optimization was performed for all gene synthesis procedures. In the CRISPR-associated transposase genome integration system (Figure 2b), the plasmid pDonor carrying the target gene fragment and the tool plasmid pTnsABC for recognizing, cleaving, and assisting in transposition were transferred into cells of the starting strain in a competent state. After screening, the tool plasmid pQCascade, which forms a cascade complex, was transferred to these cells. Multiple-copy plasmid-free genome integration was performed, and the plasmid pCutamp, which can provide cleavage enzymes, was transferred for elimination screening.
The following takes the integration of the leuA gene as an example:

2.2.1. Plasmid Construction and Transformation

The pDonor-T7-YdiI vector was amplified using inverse PCR, and the vector fragment was recovered via gel electrophoresis. The leuA gene fragment was obtained through PCR amplification. The leuA gene was inserted into the vector and ligated to generate the pDonor-leuA plasmid. Competent E. coli A211 cells were prepared and pTnsABC and pDonor-leuA were separately transformed into these competent cells, which were then plated on LB agar plates supplemented with ampicillin and kanamycin (dual-antibiotic plates). The pQCascade plasmid was transferred by chemical transformation and the cells were plated on LB agar containing ampicillin, kanamycin, and streptomycin (triple-antibiotic plates).

2.2.2. Induction

The strain obtained in the previous step was re-inoculated onto LB agar plates containing three antibiotics (ampicillin, kanamycin, and streptomycin) and IPTG (isopropyl β-D-1-thiogalactopyranoside, 0.1 mM) to induce the expression of transposition-related proteins. After the formation of the biofilm, the cells were appropriately diluted and seeded onto LB agar plates containing IPTG (1 mM) and three antibiotics for induction. The induction process was repeated five times.

2.2.3. Plasmid Knockout

The plasmid pCutamp was transferred into the strain carrying the three plasmids via electroporation (1.85 kV, 200 Ohm, 25 μF) and then cultured on LB agar plates containing ampicillin and rhamnose (10 mM). The strains were cultured on sucrose LB agar plates. Strains that grew on regular LB plates but failed to grow on plates containing ampicillin, kanamycin, or streptomycin were identified as plasmid-free multi-copy integrated strains E. coli-leuA. Colony PCR was performed to screen for single colonies, and ultimately, the plasmid-free multi-copy integrated strain E. coli-leuA was obtained.
The same method was employed to construct E. coli-leuB, E. coli-leuCD, and E. coli-bcd, and the corresponding verifications were conducted. The primer list is provided in Supplementary Table S1.

2.3. Plasmid Overexpression Enhancement

The gene fragments leuCD and bcd were ligated to pET22b to construct the plasmid pET22b-leuCDbcd, and the gene leuB was ligated to pET28a to construct the plasmid pET28a-leuB. The two plasmids were transferred into competent E. coli-leuA cells via chemical transformation, and the cells were then inoculated into a dual-antibiotic LB liquid medium containing ampicillin (100 μg/mL) and kanamycin (50 μg/mL). The culture was incubated overnight at 37 °C and 200 rpm to obtain an E. coli-leuA four-gene enhanced engineering strain.
Similarly, multi-gene enhanced strains E. coli-leuB, E. coli-leuCD, and E. coli-bcd were obtained. These strains were tested and validated using PCR.

2.4. qPCR Analysis of Transposition Efficiency to Verify Gene Copy Number

Total RNA was extracted from the cells for reverse transcription to obtain cDNA, and the expression levels of individual genes were detected using quantitative real-time fluorescence PCR (qRT-PCR). The CT value of each strain was measured using a LightCycler (Roche96). 16S rRNA was employed as the internal standard for qRT-PCR standardization, and the expression level of each mRNA was analyzed using the 2-△△CT method [20]. The experiments were performed in triplicate (n = 3).

2.5. Transcriptomic Analysis of Engineering Bacterial Strains

Fermentation was initiated by inoculating the fermentation medium, which had an initial pH of 7, with a 10% inoculum of four engineered strains. Subsequently, the inoculated medium was incubated in a shaker at 37 °C and 200 rpm for 24 h. From the fermentation broth, a 10 µL aliquot was taken and centrifuged at 6000 rpm. Total RNA was extracted from the samples using the Trizol method. The quality of the extracted RNA was assessed using a Thermo NanoDrop One (Thermo Fisher Scientific Inc., Waltham, MA, USA). Following successful quality checks, ribosomal RNA was removed using the Ribo-Zero rRNA Removal Kit (Epicentre, Illumina, WI, USA). Subsequently, library preparation was performed using the NEBNext Ultra II Directional RNA Library Prep Kit for Illumina [21]. Finally, machine sequencing of the DNA was performed, and use the expression quantification software RSEM v1.3.3 for quantitative analysis.

2.6. Screening of L-Leucine-Producing Strains

The bacterial strain was removed from the glycerol tube at −80 °C, spread on a seed plate, and incubated at 37 °C for 12 h. Colonies were picked and transferred to a seed culture medium containing ampicillin and kanamycin. After incubation in a shake flask at 37 °C and 200 rpm for 12 h, it was inoculated into the fermentation medium. When the OD600 reached 0.6–0.8, 0.5 mM IPTG was added for induction, and 1 mL of fermentation broth was obtained every 4 h, with a total of 13 samplings. The L-leucine content in the fermentation broth at each time point was determined using high-performance liquid chromatography (Shimadzu, Kyoto, Japan).
For the 24 h fermentation samples, 10 mL of fermentation broth was separately collected from the original strain and four engineered strains. The samples were centrifuged at 10,000 rpm for 20 min at 4 °C, and the supernatants were discarded. The bacterial pellets were resuspended in 1× PBS buffer, and this washing step was repeated twice. Subsequently, a cell disruptor was used to crush the cells for 20 min to facilitate the dissolution of intracellular proteins. After disruption, the mixtures were centrifuged again at 10,000 rpm for 20 min at 4 °C, and the supernatants were collected. The isolated protein solution was diluted to 5 mg/mL and then mixed with equal volumes of reduction buffer (0.5 mol/L Tris-HCl, 20% [mass fraction] Gly, 10% SDS, 3.33% DTT, and 2% bromophenol blue) or non-reducing buffer (0.5 mol/L Tris-HCl, 20% Gly, 10% SDS, and 2% bromophenol blue). The mixtures were heated in a boiling water bath at 100 °C for 5 min. The electrophoresis gel consisted of a 5% concentrated gel and a 10% separation gel, with a sample loading volume of 10 μL. Electrophoresis was performed in a vertical electrophoresis apparatus at 60 V for 20 min, followed by 110 V for approximately 1.2 h. The gels were stained with Coomassie Brilliant Blue R-20 for 30 min and then destained until a clear background was obtained. Finally, the protein bands were observed and analyzed using a gel imaging system.
Cell density was monitored by measuring OD600 and converting it to stem cell weight [22]. The following formula was used:
1DCW (g/L) =0.32 × OD600 + 0.02
The glucose content in the fermentation broth was measured using a biosensor (SBA-40C).
To determine L-leucine concentration, 1 mL of fermentation broth was centrifuged at 12000 rpm for 2 min. The supernatant was collected and passed through an organic filter membrane (0.22 μm). Then, 200 μL of derivatization buffer was mixed with 10 μL of the transmembrane fermentation broth, and 300 μL of derivatization agent was added. The mixture was allowed to react at 60 °C in the dark for 1 h. A constant volume buffer was added to 1.3 mL of the transmembrane sample and chromatographic analysis was performed. An Agilent AAA chromatographic column (4.6 × 150 mm, 5 μm) was used with a mixture of acetate buffer (mobile phase A) and acetonitrile (mobile phase B) as the mobile phase. The flow rate was set at 1.0 mL/min, the column temperature was maintained at 33 °C, the detection wavelength was set at 360 nm, and binary gradient analysis was performed. The mobile phase program settings are presented in Table 2. Before the fermentation broth sample was tested, the peak time of the L-leucine standard was measured for the L-leucine determination.

2.7. Fermentation Optimization

Using the strain with the highest L-leucine production capability, selected from the screening process described in Section 2.6, different fermentation gradients were established in the experiment. Temperature gradients were set at 25, 28, 30, 32, 35, 37, and 40 °C; shaking table speeds were set at 100, 150, 200, 250, and 300 rpm; initial pH values of the culture medium were set at 8.5, 8.0, 7.5, 7.0, 6.5, and 6.0; C/N (carbon concentration–nitrogen concentration) ratios of the culture medium were set at 25:1, 20:1, 15:1, 10:1, and 5:1; and inoculation amounts were set at 5%, 10%, 15%, 20%, and 25%.
Based on the analysis of the single-factor results, three significant factors—temperature, inoculation volume, and C/N—were selected for a three-factor, three-level response surface design. Using Design Expert 8.0.6 software to optimize the culture medium, a three-factor, three-level response surface analysis was conducted on the above factors based on the Box–Behnken design. The experimental design of the Box–Behnken test is shown in Table 3 and Table 4.

2.8. Statistical Analytical

All data are presented as the mean ± standard deviation (SD) of values derived from three distinct parallel samples. One-way analysis of variance (ANOVA), followed by Duncan’s post hoc test, was used to identify significant differences. Statistical significance was set at p < 0.05. All analyses were performed using SPSS27.0 (IBM, New York, NY, USA), and curves were generated using Origin 2021 (OriginLab Corporation) software.

3. Results

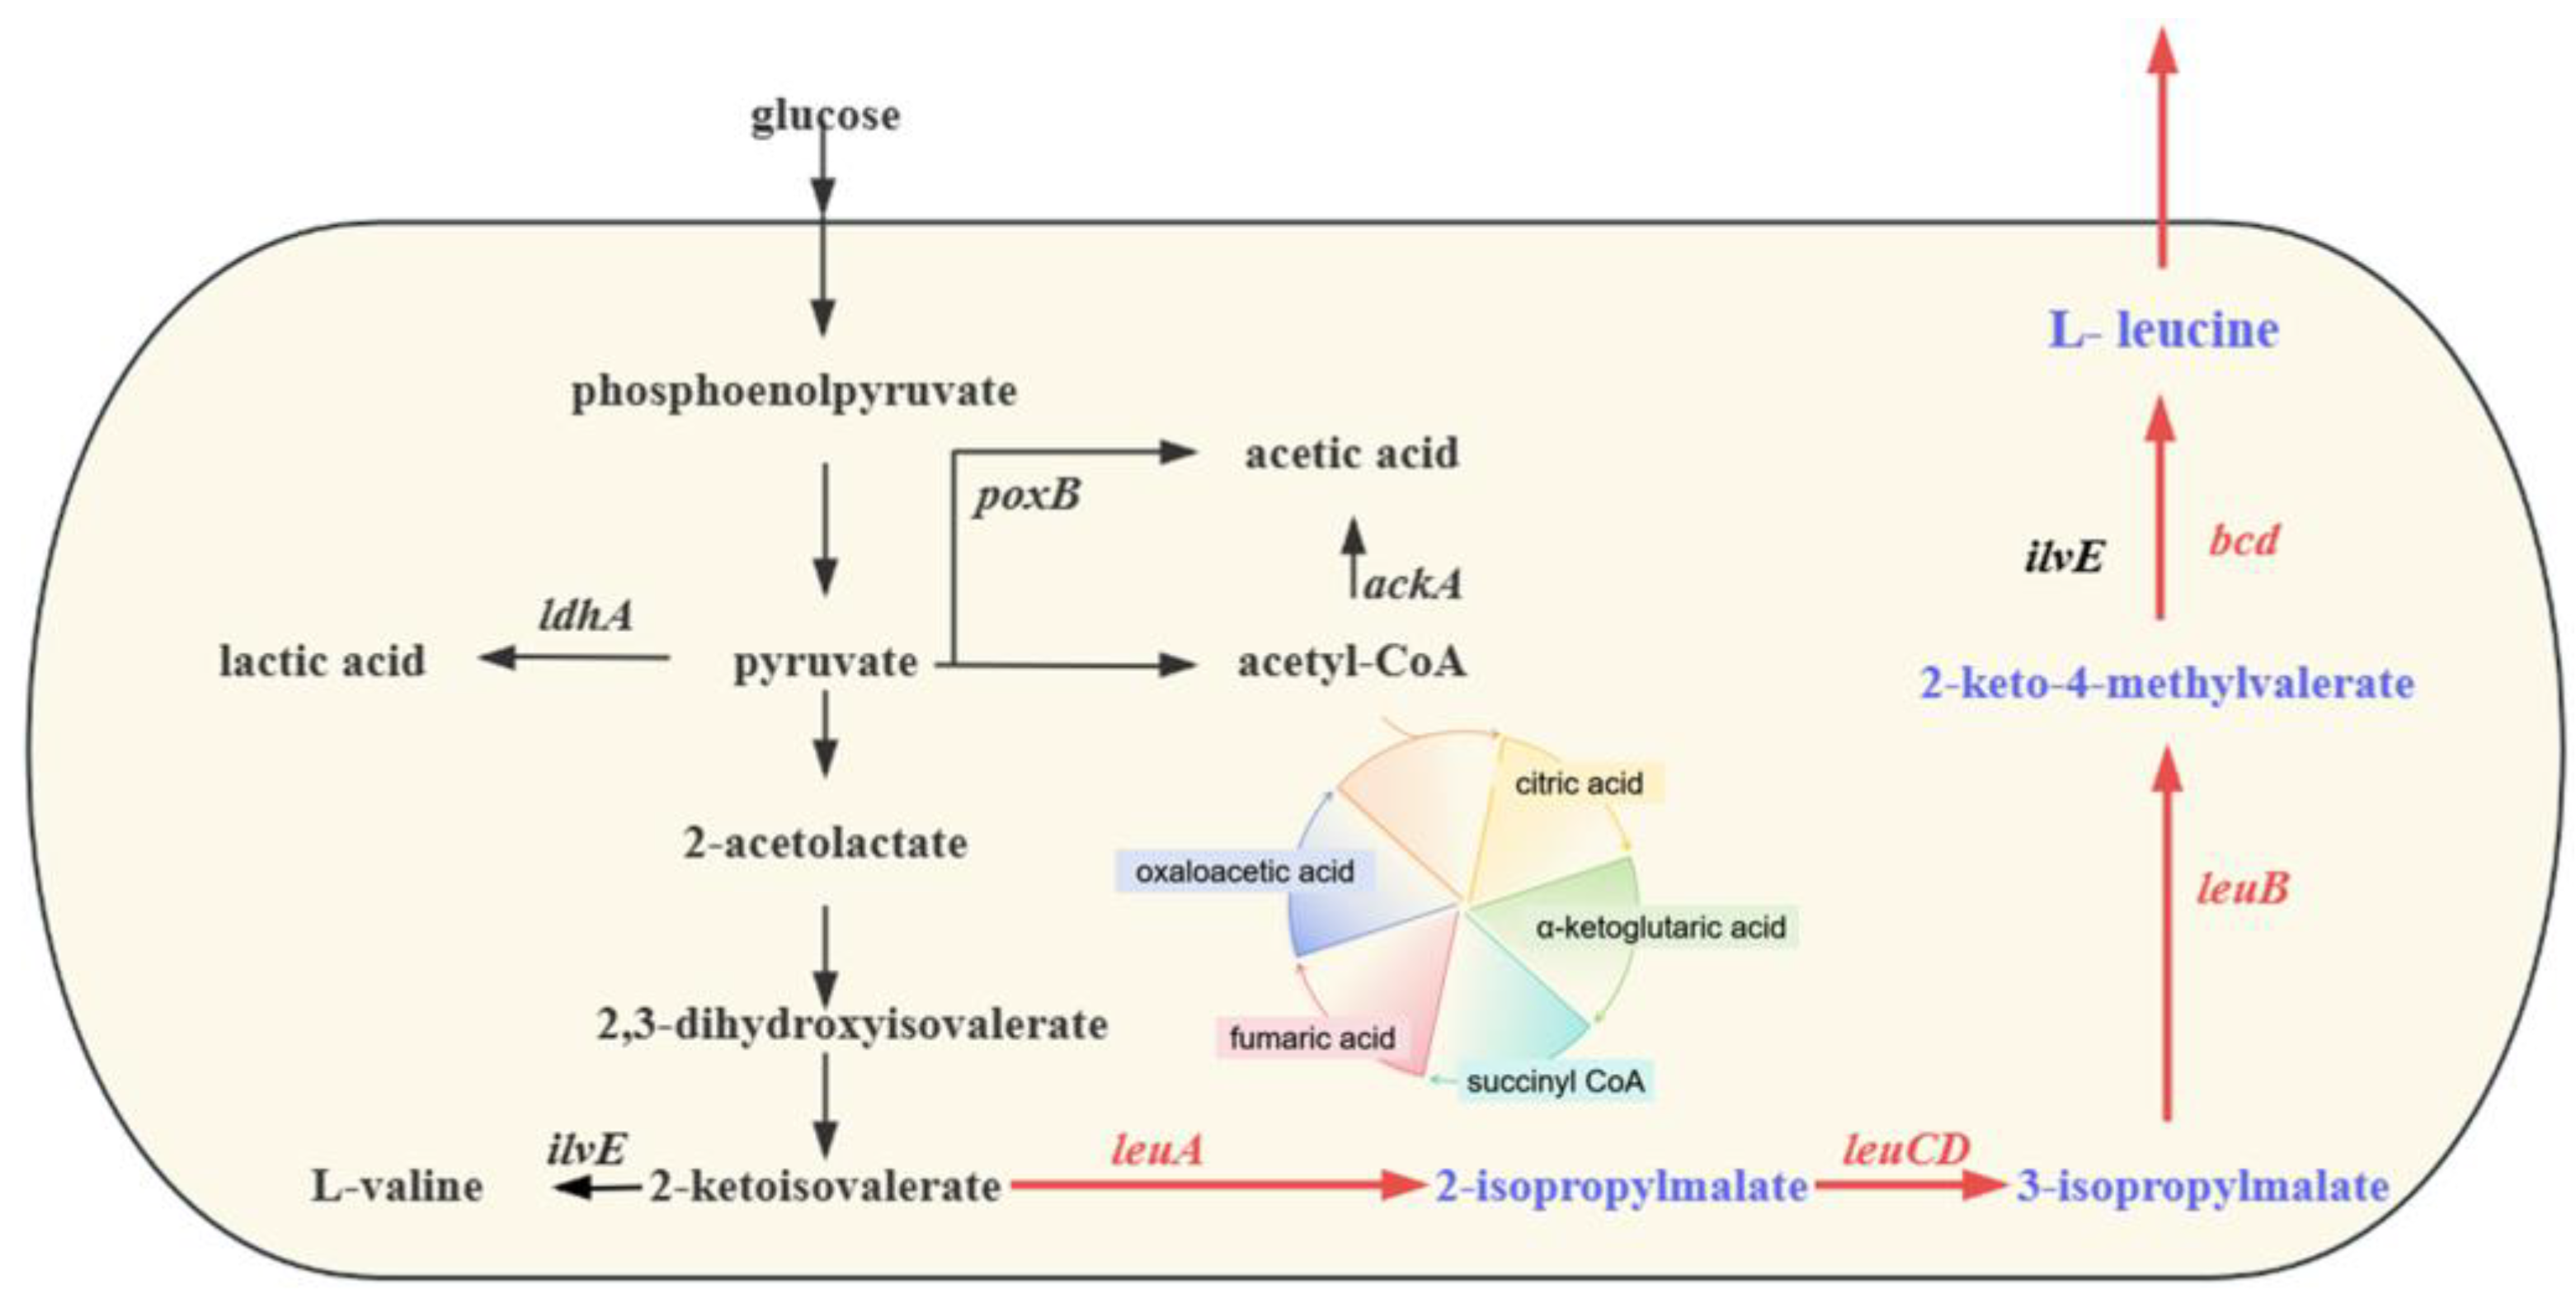
3.1. Construction of Engineered L-Leucine-Producing Strain

In this study, CRISPR-associated transposase genome integration and a plasmid double reinforcement strategy were used to construct engineered L-leucine-producing strains. In the constructed CRISPR-associated transposase genome integration system, the target gene plasmids pDonor-leuA, pDonor-leuB, pDonor-leuCD, and pDonor-bcd were successfully constructed, as evidenced by normal growth on ampicillin-containing medium (Supplementary Table S1). The plasmid pDonor and the plasmid pTnsABC carrying the target gene fragment were transferred to E. coli A211, and PCR verification was carried out using primers PET28-F, PET28-R, ptns-F, and ptns-R (Supplementary Table S1). The lengths of the obtained amplification fragments were consistent with those of the target fragments (Figure 3a,b), indicating that the plasmids pDonor-leuA, pDonor-leuB, pDonor-leuCD, and pDonor-bcd, and pTnsABC were successfully transferred into E. coli A211. After the plasmid pQCascade was introduced via heat shock, the strain grew normally on the triple-antibiotic medium containing ampicillin, kanamycin, and streptomycin. PCR validation was performed using primers pqc-F and pqc-R (Supplementary Table S1). The length of the obtained fragment was consistent with that of the target fragment (Figure 3c), demonstrating that the plasmid pQCascade was successfully transferred into the strain.
After five cycles of induction, the pCutamp plasmid was transferred to the strain, which was then cultured on a solid medium containing ampicillin and 10 mM rhamnose. Subsequently, the cells were cultured in a sucrose solid medium. A strain that grows normally in ordinary LB medium but fails to grow in a medium containing ampicillin, kanamycin, streptomycin, and ampicillin is referred to as a plasmid-free multi-copy integrated strain. The growth status of this strain is shown in Supplementary Figure S1.
Using CRISPR-associated transposase genome integration technology, leuA, leuB, leuCD, and bcd were overexpressed in E. coli A211, resulting in the generation of E. coli-leuA, E. coli-leuB, E. coli-leuCD, and E. coli-bcd strains. The verification results indicated that the length of the obtained fragments were consistent with those of the target fragments (Figure 3d).
To further enhance the synthesis pathway of L-leucine, an engineering strain was constructed via plasmid overexpression based on CRISPR-associated transposase genome integration. In E. coli-leuA, the plasmids pET22b-leuCDbcd and pET28a-leuB were transferred to enhance the expression of the leuB, leuCD, and bcd, respectively. In E. coli-leuB, plasmids pET22b-leuCDbcd and pET28a-leuA were transferred to enhance the expression of leuCD, bcd, and leuA, respectively. In E. coli-leuCD, plasmids pET22b-leuAB and pET28a-bcd were transferred to enhance the expression of leuA, leuB, and bcd, respectively. In E. coli-bcd, the plasmids pET22b-leuAB and pET28a-leuCD were transferred to enhance the expression of the leuA, leuB, and leuCD, respectively. These modifications were aimed at enhancing the synthesis flux of L-leucine. To verify the correct integration of genes, primers AA-F and AA-R, BB-F and BB-R, Bcd-F and Bcd-R, CCD-F and CCD-R, ABA-F and ABA-R, and Cb-CD-F and Cb-CD-R were used to perform colony PCR on the four aforementioned strains (Supplementary Table S1), followed by electrophoresis separation and purification. Using the gel imaging system, the imaging results showed that the length of the obtained segments were consistent with those of the target segment (Figure 3e). Engineered E. coli-leuA::pET22b-leuCDbcd::pET28a-leuB (E. coli A101), E. coli-leuB::pET22b-leuCDbcd::pET28a-leuA (E. coli B201), E. coli-leuCD::pET22b-leuAB::pET28a-bcd (E. coli CD301), and E. coli-bcd::pET22b-leuAB::pET28a-leuCD (E. coli bcd401) were obtained.

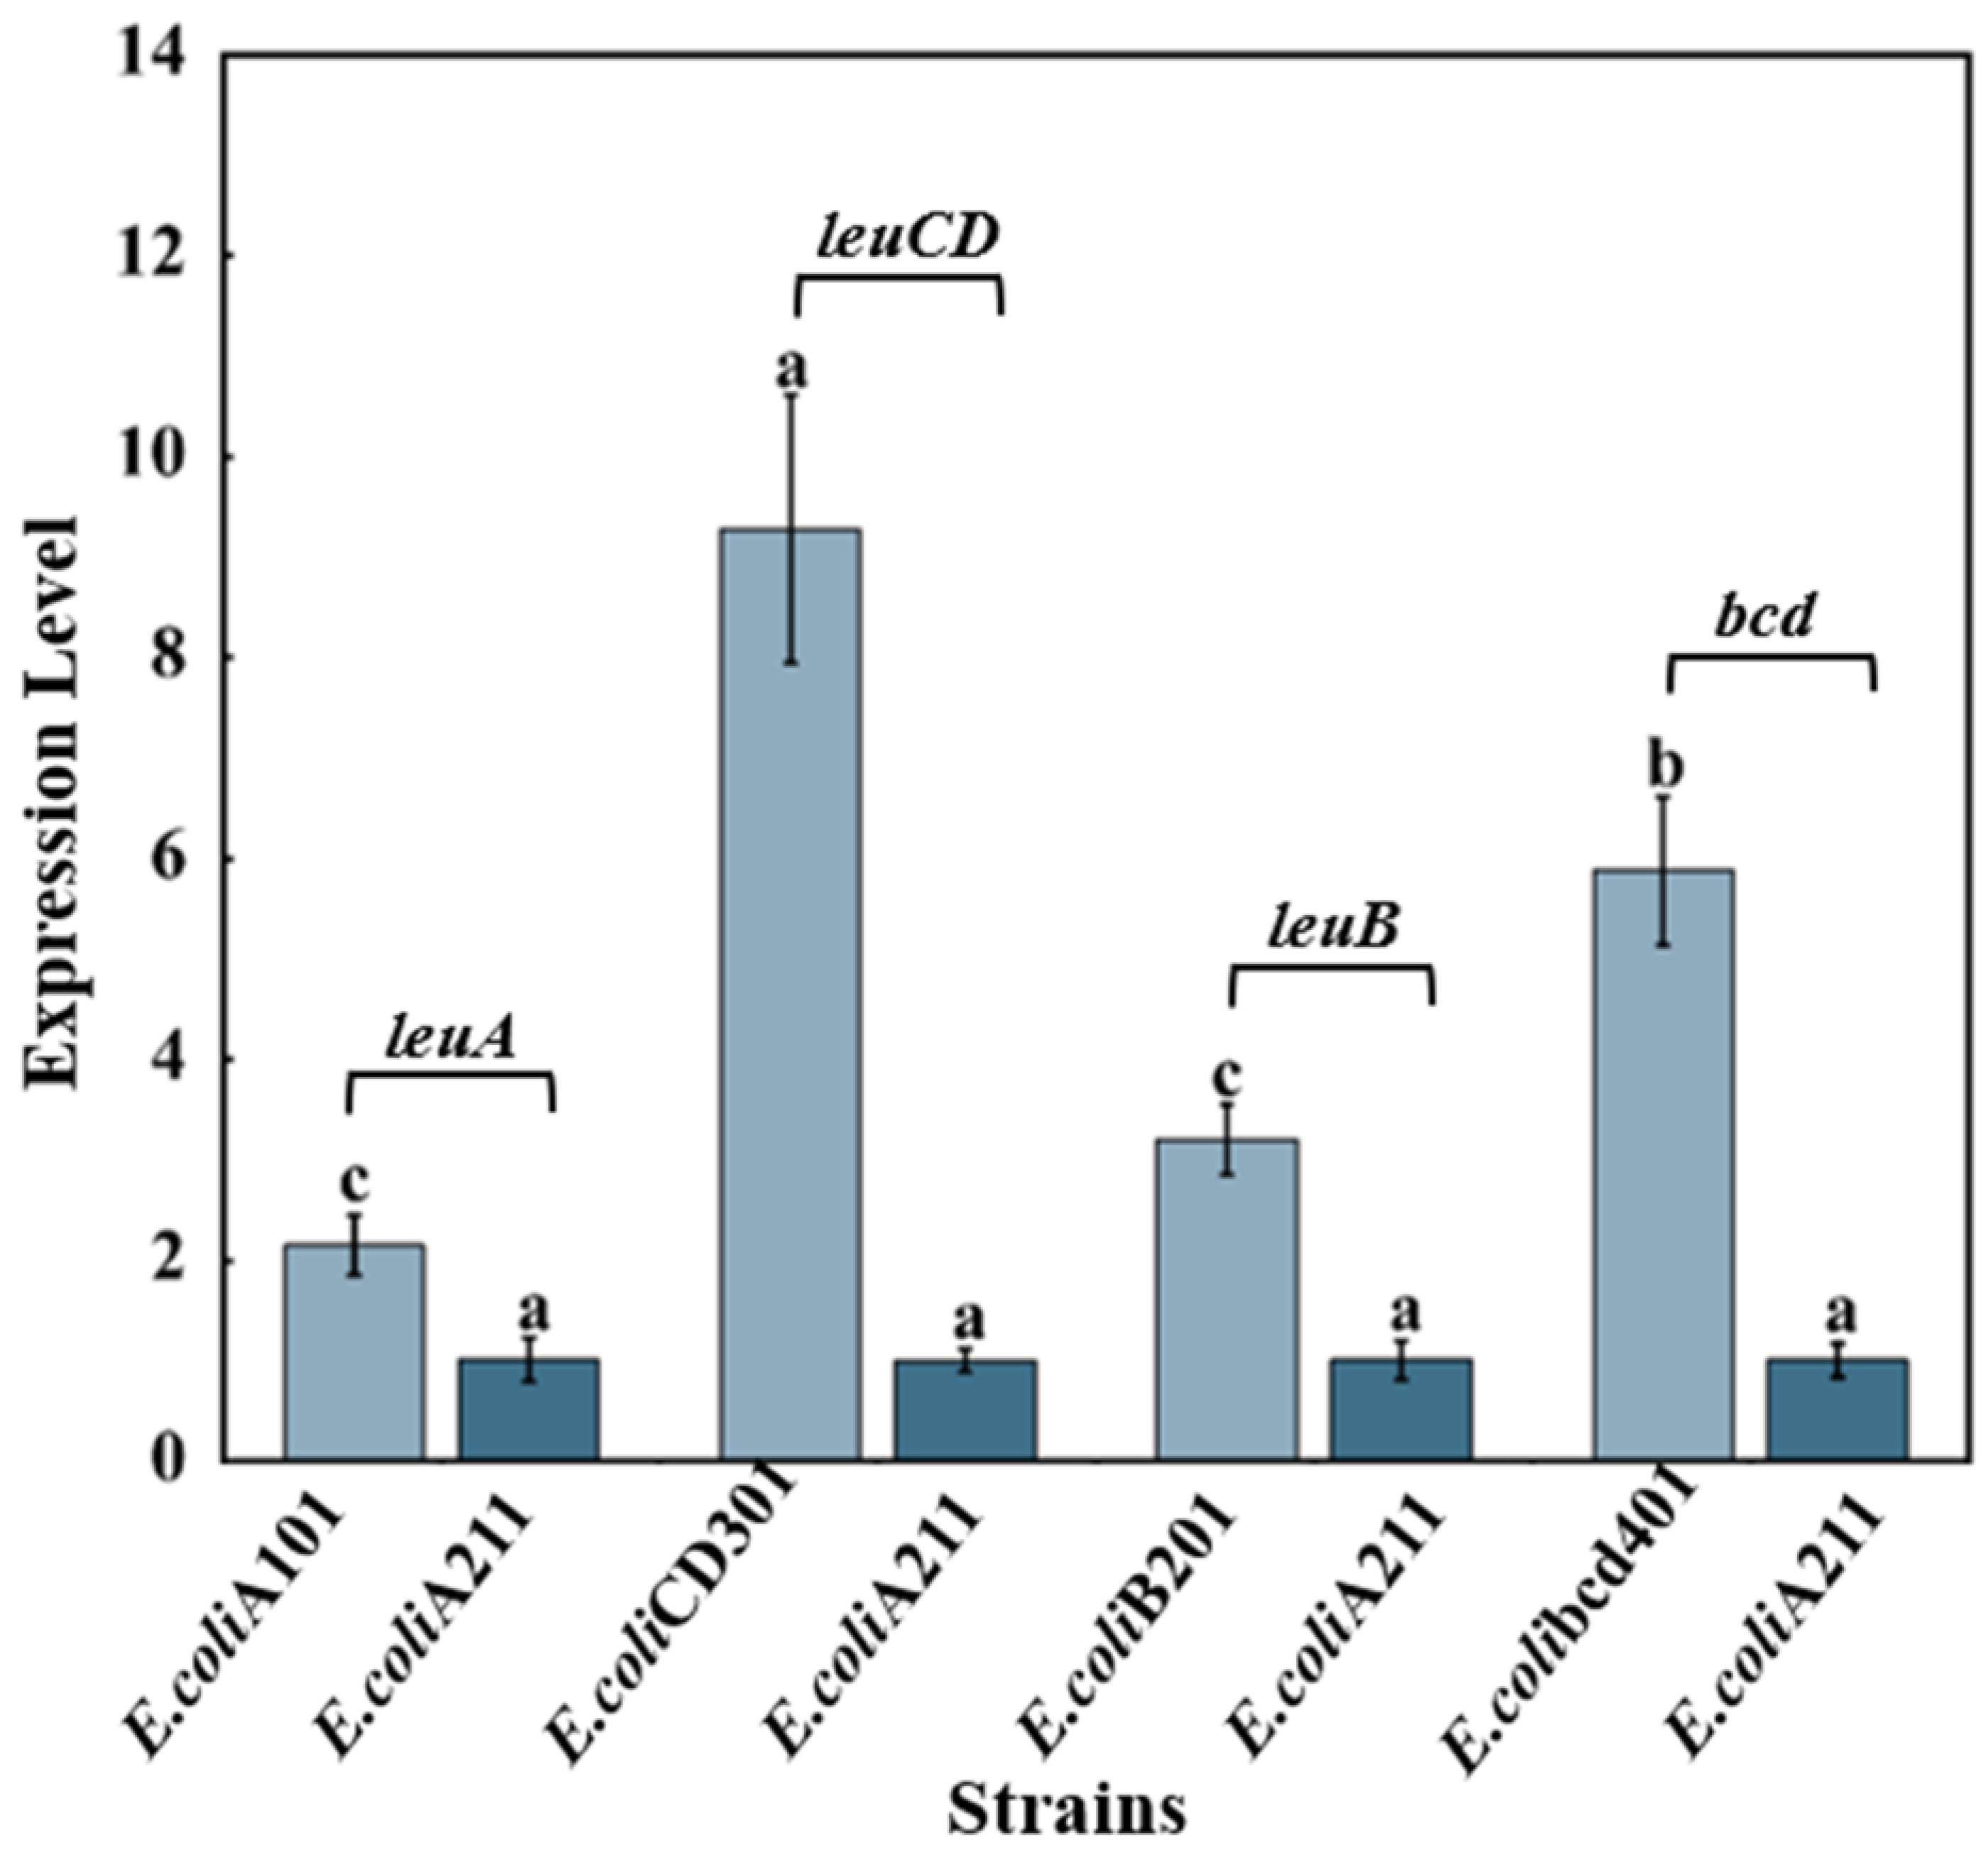
3.2. Estimation of Copy Number Using qPCR

The transcriptional levels of genes (leuA, leuB, leuCD, and bcd) related to the synthesis pathway and transport of L-leucine were analyzed in E. coli A101, E. coli B201, E. coli CD301, E. coli bcd401, and the original strain using qPCR. The results, as shown in Figure 4, indicated that the transcription level of leuCD in the E. coli CD301 was significantly different from those in other modified strains (p < 0.05), and was 9.28 times higher than that in the control strain E. coli A211. The transcription of the bcd and leuB in E. coli bcd401 and E. coli B201 was found to be 5.88 and 3.2 times higher than that in E. coli A211, respectively. Additionally, the transcriptional level of leuA in E. coli A101 was slightly upregulated, reaching 2.15 times that in the control strain E. coli A211. E. coli CD301 was determined to have the highest copy number among the modified strains.

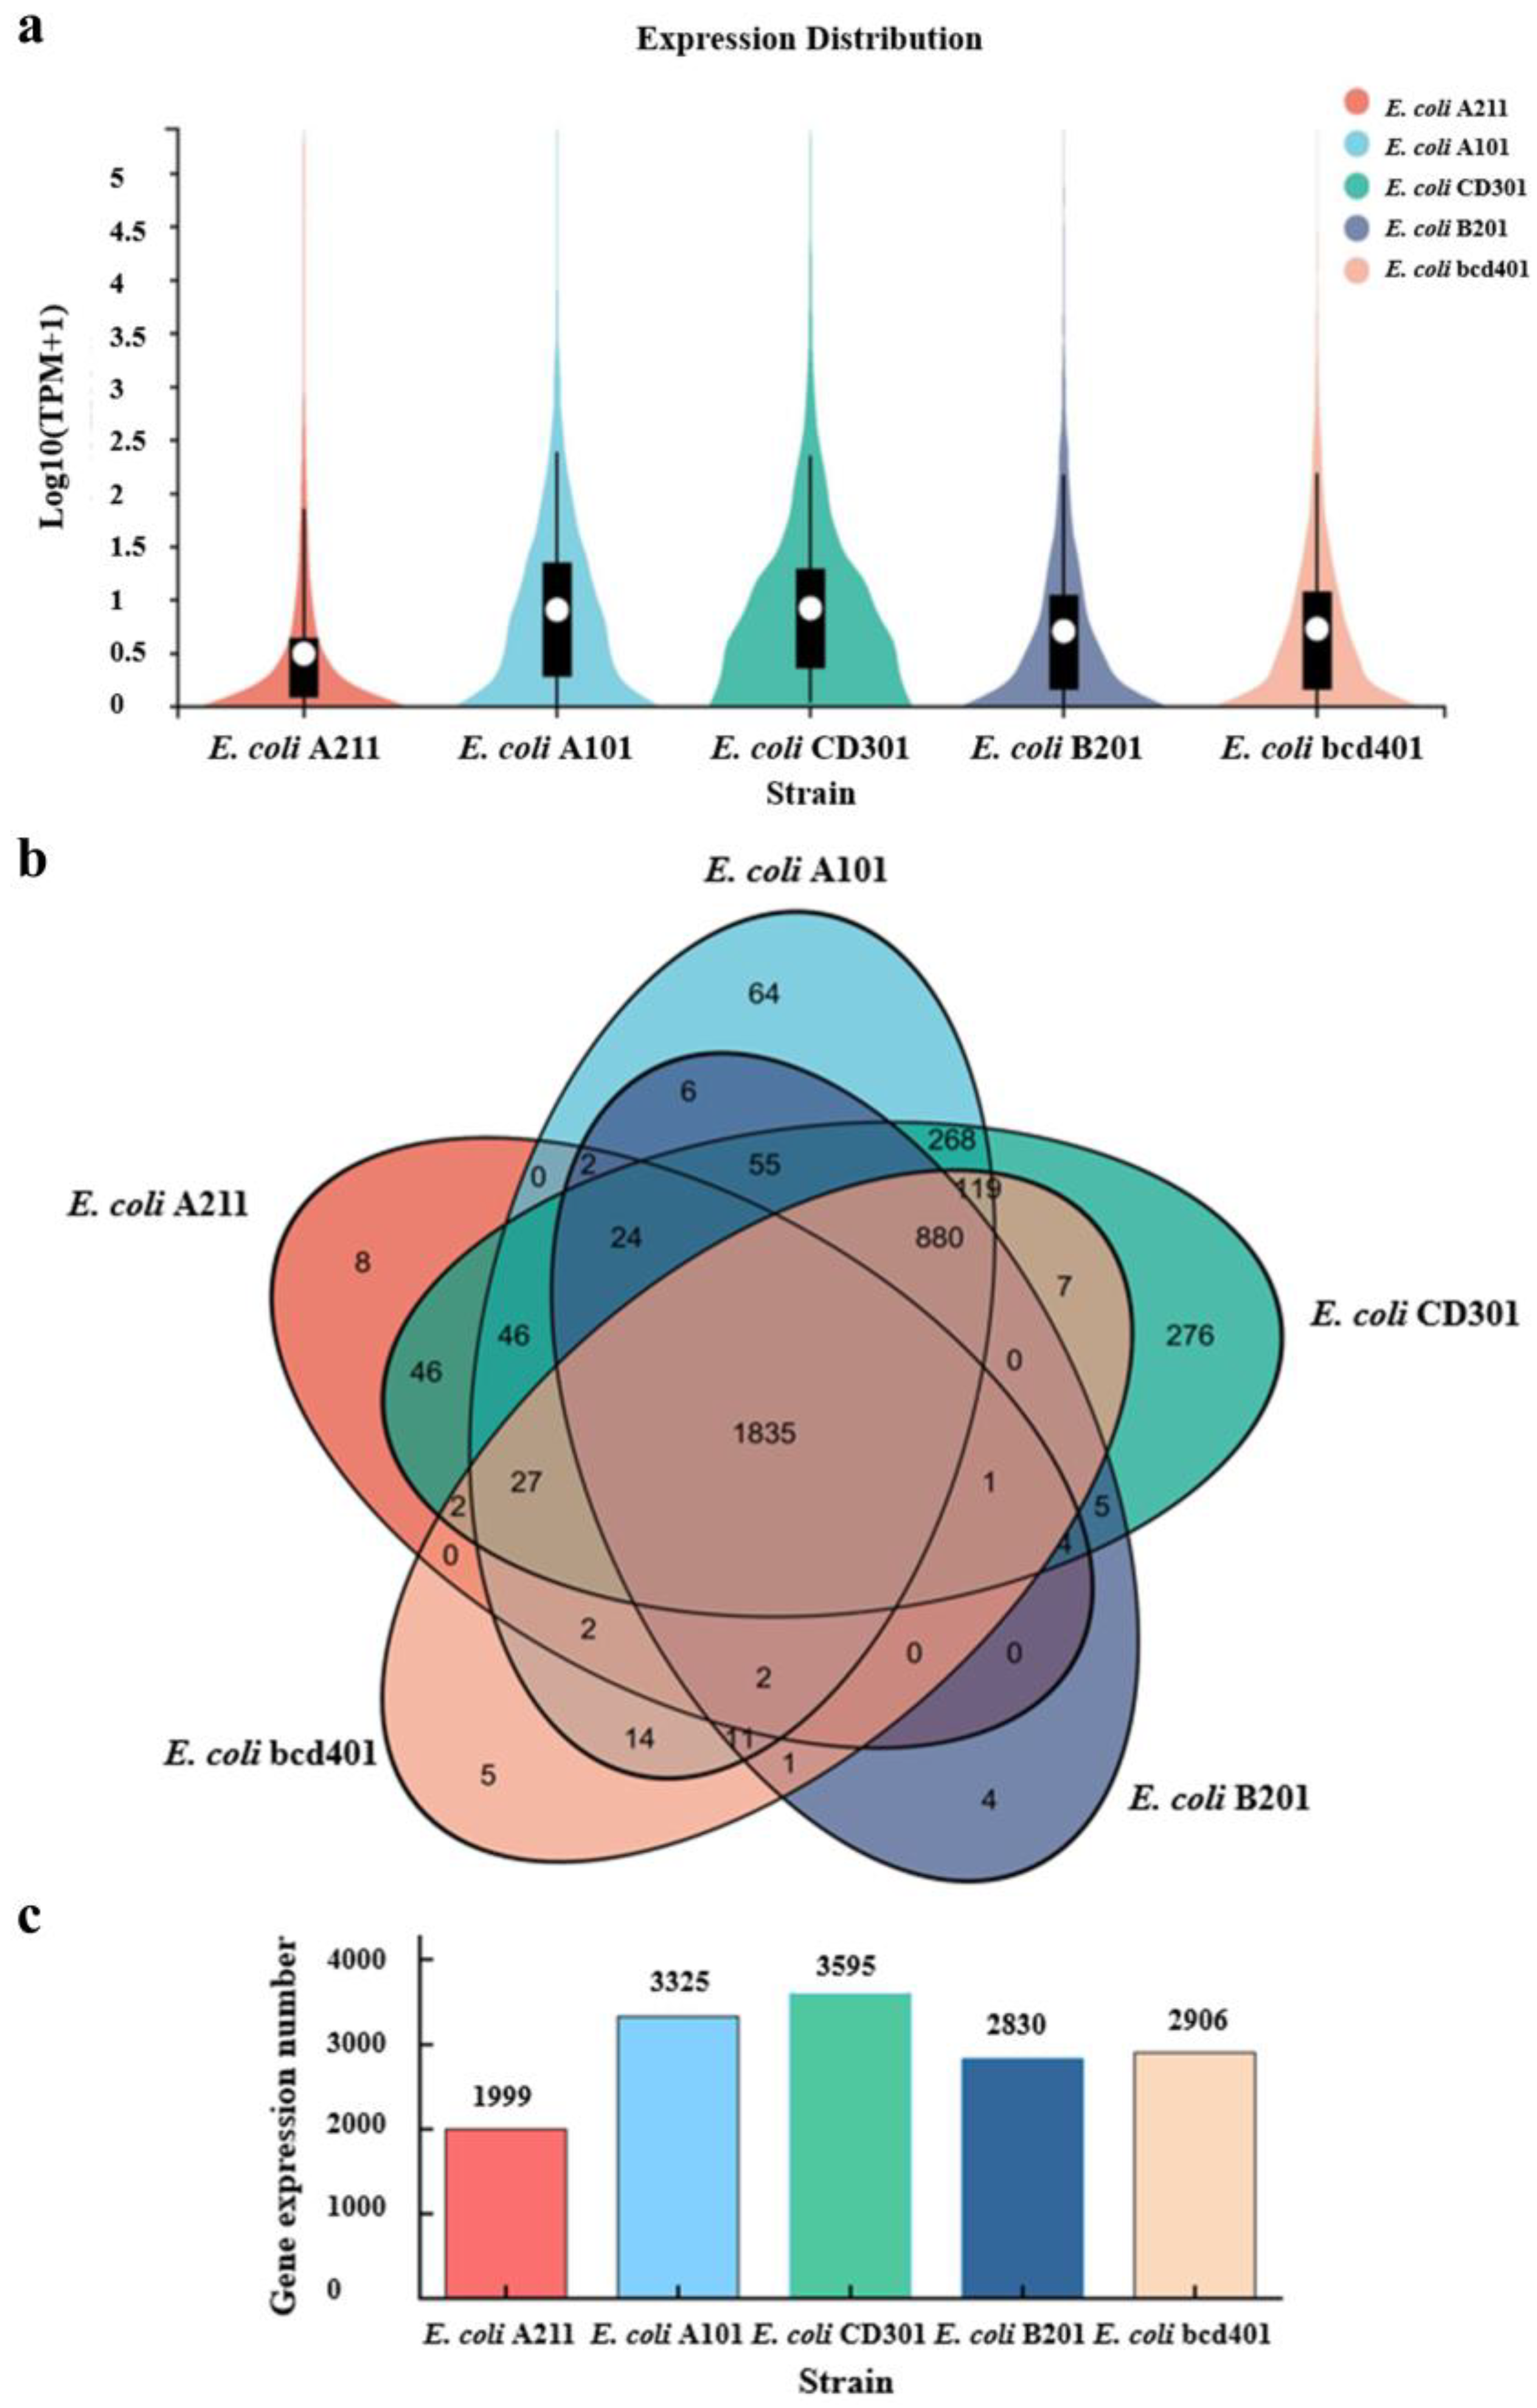
3.3. Analysis of Transcriptional Level of Engineering Bacterial Strains

The relative expression levels of genes in each strain were quantitatively analyzed using the expression quantification software RSEM. Compared with that in the original strain E. coli A211, the highest overall gene expression level was observed in the engineered strain E. coli CD301, followed by E. coli A101. The lowest overall gene expression level was detected in E. coli B201 (Figure 5a).
Based on the expression matrix, Venn analysis was performed to identify co-expressed and uniquely expressed genes between samples or groups. The examination of the expression levels of E. coli A101, E. coli B201, E. coli CD301, E. coli bcd401, and the control strain E. coli A211, revealed that there were a total of 1835 co-expressed genes among the five strains. E. coli CD301 had the highest total number of expressed genes (3595), with 276 uniquely expressed genes. The control strain E. coli A211 had the lowest total number of expressed genes (1999), with 8 uniquely expressed genes. E. coli A101 had a total of 3355 expressed genes, of which 64 were uniquely expressed. E. coli B201 had 2830 expressed genes, with 4 uniquely expressed genes. E. coli bcd401 had a total of 2906 expressed genes, including 5 uniquely expressed genes (Figure 5b,c). E. coli CD301 displayed the highest transcription level, whereas E. coli B201 showed the lowest transcription level.

3.4. Fermentation Screening to Identify Optimal Strains

Triangle bottle fermentation experiments were conducted on the control strain E. coli A211 and the four engineered strains to evaluate the effect of gene overexpression on L-leucine production. The L-leucine titer of the control strain E. coli A211 was 0.29 ± 0.02 g/L, and the yield was 0.029 g/g. E. coli CD301 exhibited the highest L-leucine titer (0.57 ± 0.01 g/L), which was significantly higher than other modified strains (p < 0.05). The L-leucine titer of E. coli CD301 (0.57 ± 0.01 g/L) was 96.6% higher than that of E. coli A211. The yield of E. coli CD301 was 0.069 g/g, which was 138% higher than that of E. coli A211. The L-leucine titer of E. coli A101, E. coli B201, and E. coli bcd401 was 0.34 ± 0.01 g/L, 0.41 ± 0.01 g/L, and 0.45 ± 0.01 g/L, respectively (Figure 6), which were 17.2%, 41.4%, and 55.2% higher than those of E. coli A211, respectively.
The fermentation broth samples of the control strains and four engineered strains were subjected to protein gel electrophoresis for verification. Figure 7 presents the SDS-PAGE results for the control strain E. coli A211 and the engineered strains E. coli A101, E. coli CD301, E. coli B201, and E. coli bcd401. Under induction conditions, leuA, leuCD, leuB, and bcd were simultaneously expressed. The molecular weights of the target proteins were calculated using BioPython based on the sequences of the leuA, leuCD, leuB, and bcd gene fragments, yielding values of 57.3, 49.8, 39.5, and 40 kDa, respectively. The SDS-PAGE results revealed that the accumulation of each induced protein in the lanes corresponding to the four engineered strains was significantly higher than that in the lane corresponding to the control strain E. coli A211, and the molecular weights were consistent with the theoretical calculations. Furthermore, the protein accumulation induced in the E. coli CD301 sample lane was significantly higher than that in the other three engineered strains, confirming the overexpression of leuA, leuCD, leuB, and bcd.

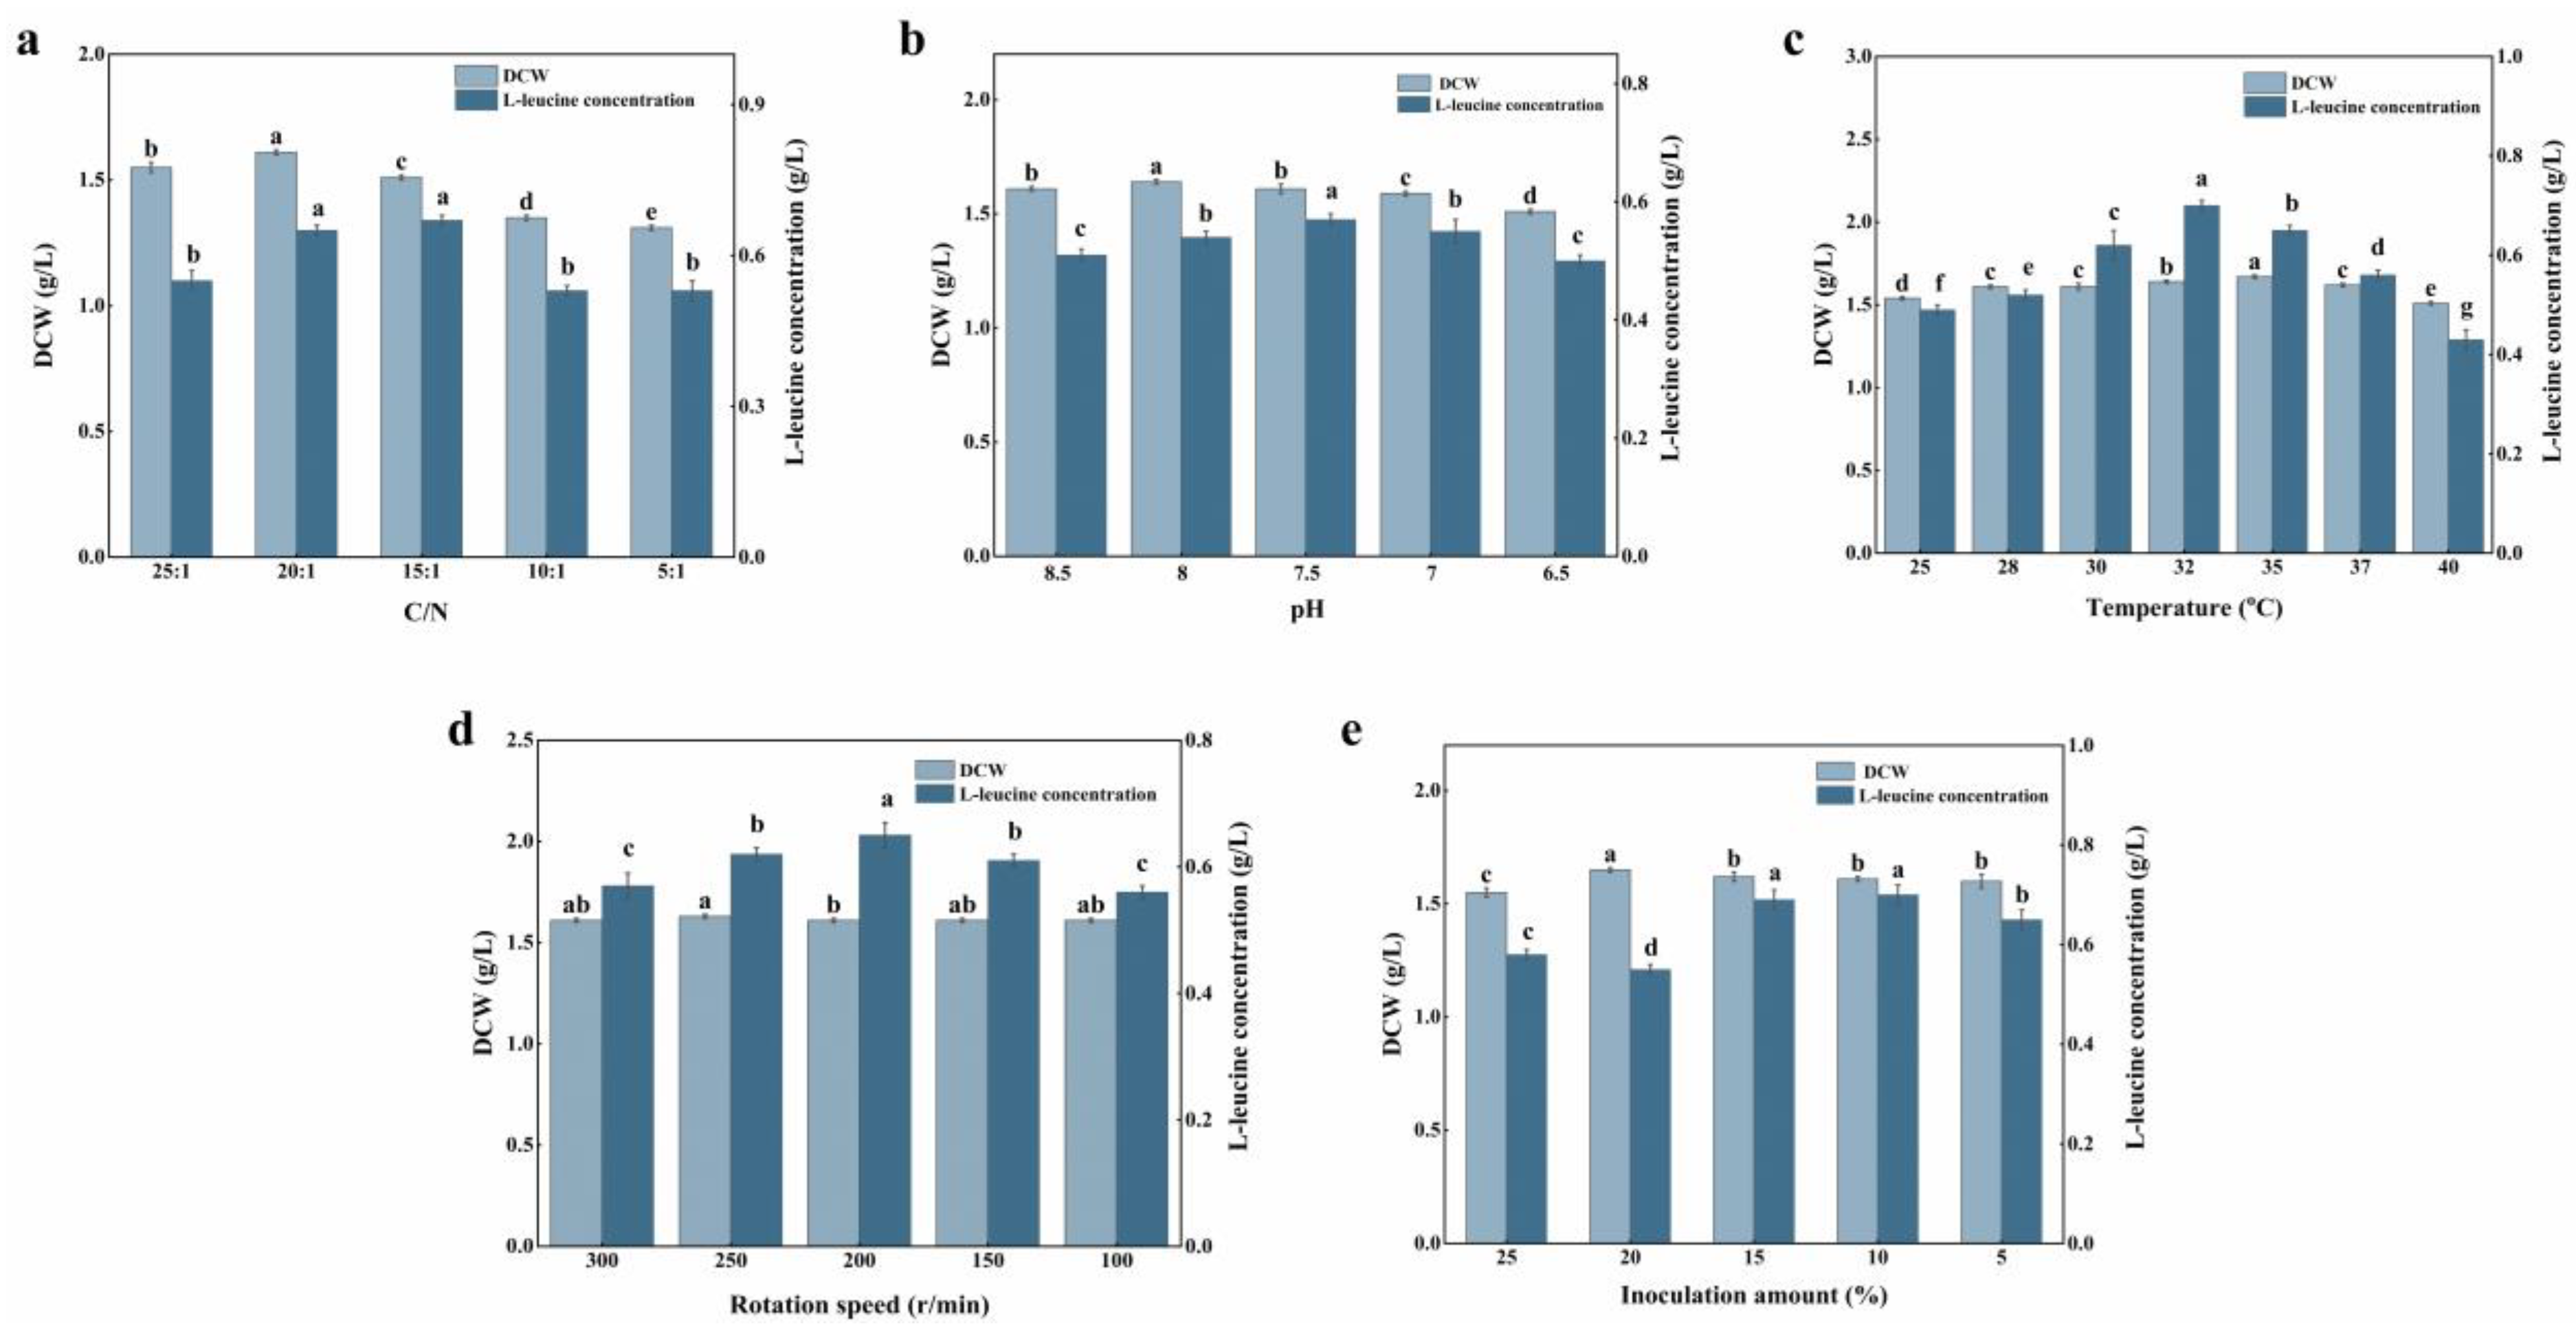
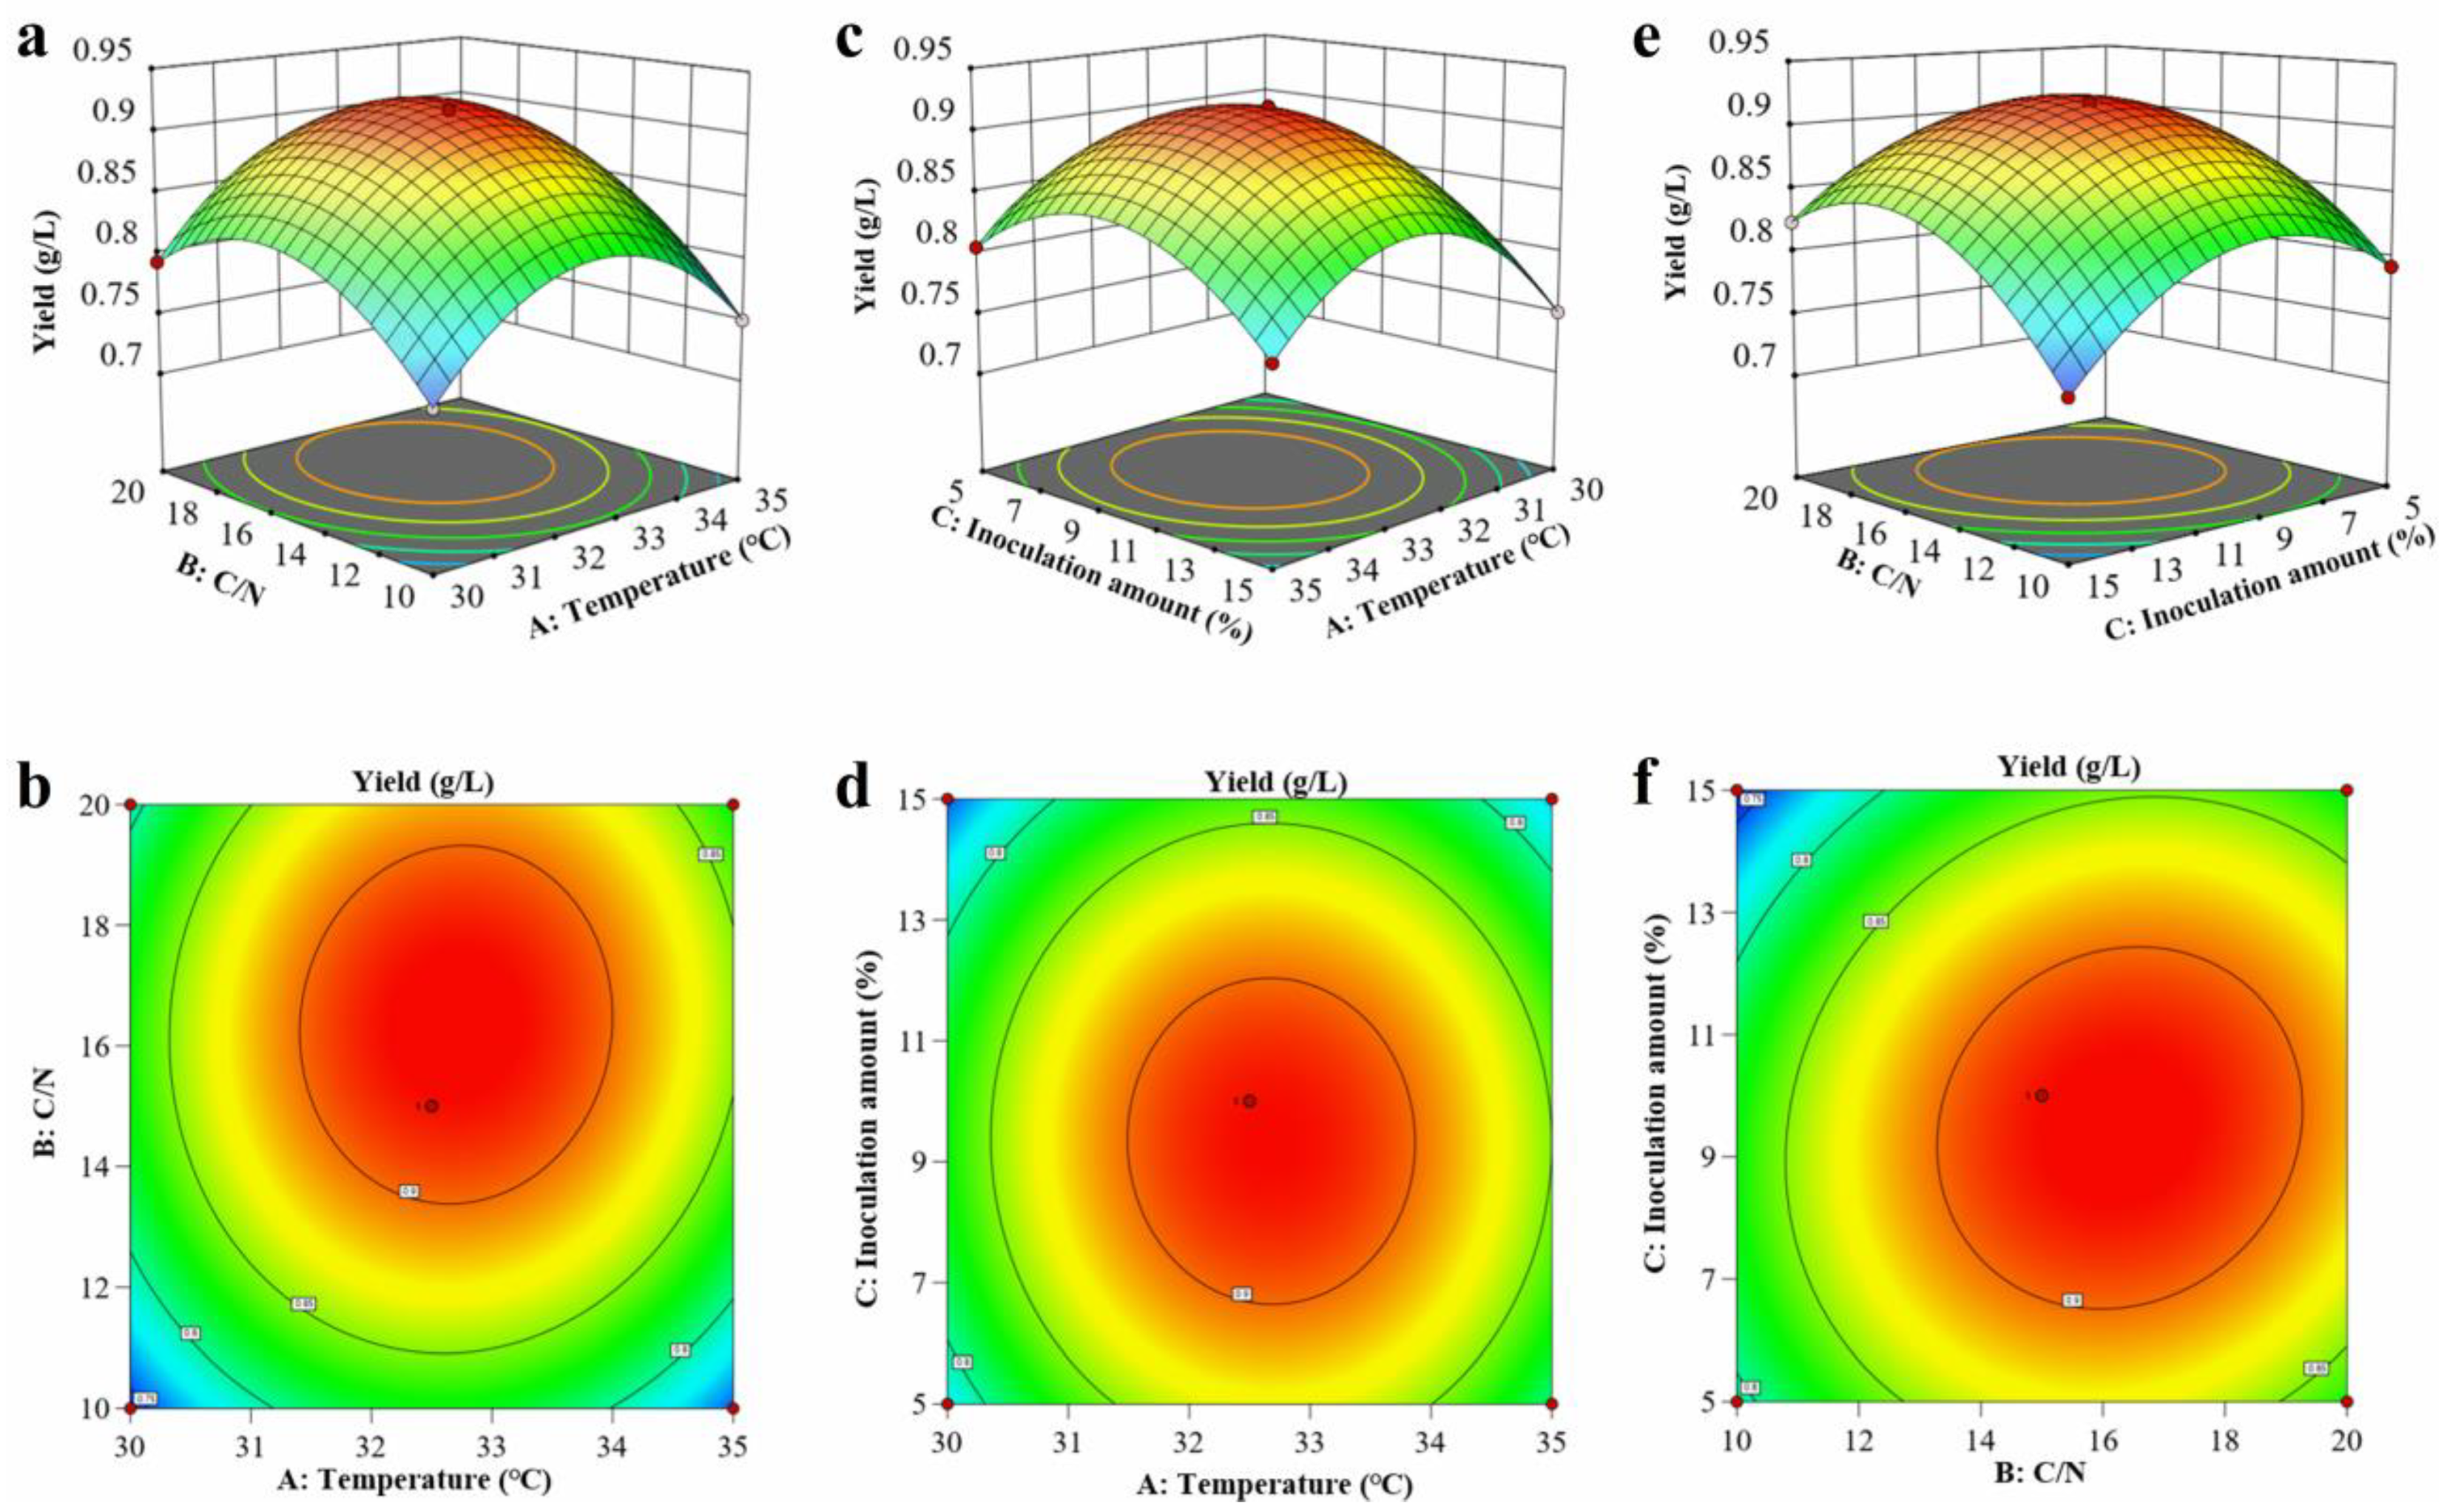
3.5. Control and Optimization of L-Leucine Fermentation

In this study, the C/N ratio and initial pH in the culture medium were optimized. Ammonium sulfate, serving as a rapidly available nitrogen source in microbial fermentation, provides NH₄⁺, which can directly influence the growth of bacterial cells and the synthesis of amino acids during fermentation. As depicted in Figure 8a, the titer of L-leucine under a C/N ratio of 25:1 was 0.55 ± 0.02 g/L (yield was 0.071 g/g). At a C/N ratio of 15:1, the L-leucine titer reached its peak value (0.67 ± 0.01 g/L, yield was 0.084 g/g). This was significantly higher than that obtained at C/N ratios of 25:1, 10:1, and 5:1 (p < 0.05). It is widely recognized that the optimal growth pH for bacterial cells typically differs from the optimal accumulation pH for the target product. As shown in Figure 8b, during the shake flask fermentation process, when the initial pH value was maintained at 7.5, the titer of L-leucine reached its maximum level of 0.57 ± 0.02 g/L (yield was 0.072 g/g). This value was significantly higher than that of the other sample groups (p < 0.05).
To further optimize the fermentation conditions, fermentation temperature, shaker speed, and inoculum amount were optimized. As depicted in Figure 8c, the titer at 37°C was 0.56 ± 0.01 g/L (yield was 0.069 g/g). When the fermentation temperature was adjusted to 32°C, the titer of L-leucine reached a maximum value of 0.70 ± 0.01 g/L (yield was 0.089 g/g). When the shake flask fermentation temperature was 32 °C, the titer of L-leucine was significantly higher than that of other sample groups (p < 0.05), and it was 25% greater than that at the pre-optimization temperature of 37 °C. The shaker speed (Figure 8d) influences the solubility level under shake flask culture conditions. When the shaking speed was maintained at 200 rpm, the titer of L-leucine reached its peak value of 0.65 ± 0.02 g/L (yield was 0.080 g/g), which was significantly higher than that of other sample groups (p < 0.05). The size of the inoculum (Figure 8e) directly affects the fermentation cycle of bacterial cells. When the inoculum amount was 5%, the L-leucine titer was 0.65 ± 0.02 g/L (yield was 0.078 g/g), and reached its highest value of 0.7 ± 0.02 g/L (yield was 0.081 g/g) at an inoculum amount of 10%, representing a 10.8% increase compared to the pre-optimization level.
Based on the results of the single-factor experiment, three influential factors—C/N ratio, inoculum amount, and temperature—were selected for response surface analysis. Multivariate regression fitting was performed using Design Expert software (Version 13, Stat-Ease, Inc., Minneapolis, MN, USA)to obtain a quadratic regression equation for L-leucine titer with respect to the three factors—temperature, inoculum amount, and C/N ratio—in the culture medium.
Y = 0.9164 + 0.0111A + 0.0320B − 0.0161C + 0.0060AB − 0.0013AC + 0.0125BC − 0.0778A2 − 0.0601B2 − 0.0613C2
The quadratic equation was solved to derive the optimized components of the culture medium and fermentation conditions: temperature (32.93 °C), inoculum amount (9.65%), and C/N ratio (16.88). Under these optimized conditions, the titer of L-leucine reached 0.92 g/L, which was higher than that obtained in all previous experiments (p < 0.001). This indicates the effectiveness of the selected quadratic multivariate model, thereby validating the reliability of the experimental data and the rationality of the experimental approach. Therefore, this model can be employed to predict and optimize the optimal medium composition and fermentation conditions for L-leucine production. The response surface plots for various factors are presented in Figure 9 and Supplementary Table S2. These plots illustrate the impact of the interactions among factors on L-leucine production.
The optimal cultivation conditions for L-leucine were determined via analysis using Design Expert software, including the fermentation period (28 h), shaker speed (200 rpm), initial pH of the culture medium (7.5), temperature (32.93 °C), inoculum amount (9.65%), and C/N ratio (16.88). Considering the actual experimental conditions, the final fermentation conditions were determined as follows: a 28h cycle, at a shaking speed of 200 rpm, an initial culture medium pH of 7.5, a temperature of 33 °C, an inoculation volume of 9.6%, and a C/N ratio of 17. The conditions before and after fermentation optimization are presented in Table 5. To verify the accuracy of the model, an L-leucine fermentation medium was prepared according to the optimized medium composition, while keeping the other conditions constant. The results of the triangle bottle fermentation experiment are presented in Figure 10 and Table 6. The titer of L-leucine in strain E. coli A211 was 0.34 ± 0.02 g/L, and the yield was 0.0344 g/g. The titer of the E. coli CD301 L-leucine strain was 0.89 ± 0.03 g/L, which was 56% higher than that obtained under the optimized fermentation conditions (0.57 ± 0.01 g/L) and 161% higher than that of E. coli A211. The yield was 0.1008 g/g, which was 193% higher than that of E. coli A211. The measured titer of E. coli CD301 L-leucine was 0.89 ± 0.03 g/L, which was close to the theoretically predicted value of 0.92 g/L based on the model, indicating that the model is feasible in predicting L-leucine titer.

4. Discussion

In industrial production, glutamic acid rod-shaped bacteria mainly originate from strains generated by random mutagenesis and homologous recombination. However, limitations persist regarding the integration efficiency of target genes using this approach. A low integration efficiency can readily induce cellular physiological abnormalities (e.g., slow growth and by-product accumulation), resulting in reduced production efficiency [23]. In this study, a dual-reinforcement strategy was employed to engineer the starting strain E. coli A211, and fermentation conditions were optimized to effectively increase the production of L-leucine. The overexpression of the key enzyme genes leuA, leuCD, leuB, and bcd involved in L-leucine synthesis was identified as the key to increasing L-leucine production [24]. A metabolic engineering strategy was adopted to regulate the feedback inhibition of key enzymes in the L-leucine synthesis pathway, and the carbon metabolic flow in the branched-chain amino acid synthesis pathway was successfully directed towards L-leucine synthesis. Park et al. also applied this method to remove regulatory repressors of the arginine operon, optimize NADPH levels, disrupt the L-glutamate exporter to increase L-arginine precursors, and optimize the flux of rate-limiting reactions in L-arginine biosynthesis [25]. The simultaneous integration of multiple genes usually leads to increased genomic instability [26]. CRISPR-associated transposase genome integration technology, which provides higher integration efficiency and genomic stability, is regarded as an ideal choice for the separate integration of the leuA, leuB, leuCD, and bcd genes [19]. Furthermore, plasmid enhancement technology was also applied to obtain the four engineered strains—E. coli A101, E. coli B201, E. coli CD301, and E. coli bcd401. This approach is consistent with the results of Ding [27] and Michael Vogt [14], who employed gene integration technology to obtain efficient amino acid-producing strains, thus confirming the effectiveness of this method.
The experimental results indicated that the gene copy number, transcriptional level, and L-leucine yield of the engineered strains were significantly higher than those of the control strains (p < 0.05). These findings provided an important theoretical basis and technical framework for the industrial production of L-leucine.
The optimization of fermentation conditions encompasses two key aspects: nutritional conditions and process control [28]. Regarding the optimization of nutritional conditions, the selection and ratio of carbon and nitrogen sources exert a decisive influence on the synthesis of microbial metabolites [29]. Experiments conducted by Wichmann et al. [30] in a mineral culture medium containing biotin, where glucose was used as the carbon source and ammonium sulfate was used as the nitrogen source, showed an enhanced production of L-leucine, and the feasibility of the selected carbon and nitrogen sources was verified. It is worth noting that ammonium sulfate, serving as a quick-acting nitrogen source, provides NH4+ [31]. This NH4+ not only directly affects the growth of bacterial cells during amino acid fermentation but also synergistically regulates the growth rate of bacterial cells in conjunction with carbon sources [32]. In addition, it was found that a high concentration of NH₄⁺ in the culture medium can inhibit L-leucine synthesis. This finding is consistent with the results of Koyama et al. High concentrations of NH₄⁺ are known to affect the transport function in glucose transport processes, thereby reducing the yield of L-leucine [33]. Through the design of experiments with different C/N ratios, the optimal bacterial growth state and the highest L-leucine production were determined to be achieved when the C/N ratio was 15:1. This discovery provides an important reference for industrial applications.
In addition to nutritional conditions, the fermentation process parameters also have a significant impact on L-leucine production. Temperature is a key parameter that regulates bacterial growth and product accumulation by affecting enzyme activity [34]. Suitable temperature conditions are conducive to enzymatic reactions and significantly enhance the yield of the target product. This finding was consistent with that reported by Dai et al. [35] regarding the effects of temperature on soybean whey fermentation. To optimize the inoculation volume, the dual impact of inoculation volume on product formation was confirmed. An excessively low inoculation volume leads to insufficient biomass accumulation, whereas an excessively high inoculation volume may result in the formation of adverse by-products [36]. In addition, key parameters, such as the C/N ratio, inoculation amount, and temperature, were also systematically optimized through response surface analysis. As a result, the production of L-leucine was increased by 56% compared with the previous level. This not only validates the effectiveness of the fermentation condition optimization strategy but also provides a reliable technical foundation for the industrial production of L-leucine.
The optimization of metabolic pathways and fermentation conditions is an important strategy for enhancing L-leucine production. The L-leucine synthesis pathway was optimized. In the future, proteomics and metabolomics will be employed to conduct in-depth research on the expression levels of proteins and changes in metabolites. This study aimed to reveal the potential roles of various enzymes in enhancing L-leucine synthesis. Moreover, the production process was also optimized in this study. As a result, we obtained an increased yield of L-leucine, and we believe that this study provides a reliable theoretical basis for regulating the fermentation process for the production of L-leucine.

5. Conclusions

L-leucine has enormous market potential owing to its wide range of applications. However, its industrial applications are restricted by its high cost and low yield. In this study, a double enhancement strategy involving CRISPR-associated transposase genome integration and a plasmid was employed to engineer an E. coli strain capable of improving L-leucine production efficiency. Four strains, namely E. coli A101, E. coli B201, E. coli CD301, and E. coli bcd401, were constructed in this study. Among them, E. coli CD301 was verified to be the optimal strain based on the enhanced gene transcription levels of the key enzyme genes leuA, leuCD, leuB, and bcd involved in L-leucine synthesis and the actual L-leucine yield itself. Simultaneously, the composition of the culture medium and fermentation conditions were optimized, resulting in a maximum L-leucine titer of 0.89 ± 0.03 g/L. This titer was 161% higher than that of E. coli A211. The yield reached 0.1008 g/g, which was 193% higher than that of E. coli A211. Thus, the production cost is expected to be reduced by 30–40%. In this study, we demonstrated the feasibility of using a double reinforcement strategy of CRISPR-associated transposase genome integration and plasmids to effectively increase the yield of L-leucine production by E. coli in a fermentation process. This study provides new insights for the further utilization of metabolic engineering modification technology to improve L-leucine yield.

Supplementary Materials

The following supporting information can be downloaded at https://www.mdpi.com/article/10.3390/fermentation11060314/s1: Table S1: List of primers; Figure S1: Screening diagram of plasmid-free multi-copy-integrated strains; Table S2: ANOVA for Quadratic model.

Author Contributions

Conceptualization, X.R. and J.X.; methodology, X.R.; software, X.R. and N.L.; validation, X.R., Z.L. (Zhaoqi Li) and Y.Z.; formal analysis, P.D.; investigation, C.G. and J.W.; resources, J.X.; data curation, Z.L. (Zerun Lin); writing—original draft preparation, X.R.; writing—review and editing, N.L.; visualization, Z.L. (Zhaoqi Li); supervision, P.D.; project administration, Y.Z.; funding acquisition, J.X. All authors have read and agreed to the published version of the manuscript.

Funding

This work was supported by the National Key Research and Development Plan of China (2023YFD1300700).

Institutional Review Board Statement

Not applicable.

Informed Consent Statement

Not applicable.

Data Availability Statement

Data are contained within the article and Supplementary Materials.

Acknowledgments

We would like to thank the State Key Laboratory of Green Papermaking and Resource Recycling at Qilu University of Technology for their help and support.

Conflicts of Interest

Authors Chuanzhuang Guo and Jianbin Wang were employed by the company Dongxiao Biotechnology Co., Ltd. The remaining authors declare that the research was conducted in the absence of any commercial or financial relationships that could be construed as a potential conflict of interest.

References

  1. Park, J.H.; Lee, S.Y. Fermentative production of branched chain amino acids: A focus on metabolic engineering. Appl. Microbiol. Biotechnol. 2010, 85, 491–506. [Google Scholar] [CrossRef] [PubMed]
  2. Yu, S.; Zheng, B.; Chen, Z.; Huo, X.Y. Metabolic engineering of Corynebacterium glutamicum for producing branched chain amino acids. Microb. Cell Factories 2021, 20, 230. [Google Scholar] [CrossRef] [PubMed]
  3. Kyte, J.; Doolittle, R.F. A simple method for displaying the hydropathic character of a protein. J. Mol. Biol. 1982, 157, 105–132. [Google Scholar] [CrossRef] [PubMed]
  4. Yang, Y.; Wu, Z.; Meininger, C.J.; Wu, G. L-Leucine and NO-mediated cardiovascular function. Amino Acids 2015, 47, 435–447. [Google Scholar] [CrossRef]
  5. Zhang, S.; Zeng, X.; Ren, M.; Mao, X.; Qiao, S. Novel metabolic andphysiological functions of branched chain aminoacids: A review. J. Anim. Sci. Biotechnol. 2017, 8, 10. [Google Scholar] [CrossRef]
  6. Wang, X.; Zhang, H.; Quinn, P.J. Production of L-valinefrom metabolically engineered Corynebacterium glu-tamicum. Appl. Microbiol. Biotechnol. 2018, 102, 4319–4330. [Google Scholar] [CrossRef]
  7. Wu, G. Amino acids: Metabolism, functions, and nutrition. Amino Acids 2009, 37, 1–17. [Google Scholar] [CrossRef]
  8. Wang, Y.Y.; Xu, J.Z.; Zhang, W.G. Metabolic engineering of L-leucine production in Escherichia coli and Corynebacterium glutamicum: A review. Crit. Rev. Biotechnol. 2019, 39, 633–647. [Google Scholar] [CrossRef]
  9. Hao, Y.; Pan, X.; You, J.; Li, G.; Xu, M.; Rao, Z. Microbial production of branched chain amino acids: Advances and perspectives. Bioresour. Technol. 2024, 397, 130502. [Google Scholar] [CrossRef]
  10. Choi, K.R.; Jiao, S.; Lee, S.Y. Metabolic engineering strategies toward production of biofuels. Curr. Opin. Chem. Biol. 2020, 59, 1–14. [Google Scholar] [CrossRef]
  11. Wang, Q.; Xu, J.; Sun, Z.; Luan, Y.; Li, Y.; Wang, J.; Liang, Q.; Qi, Q. Engineering an in vivo EP-bifido pathway in Escherichia coli for high-yield acetyl-CoA generation with low CO2 emission. Metab. Eng. 2019, 51, 79–87. [Google Scholar] [CrossRef] [PubMed]
  12. Yang, D.; Eun, H.; Prabowo, C.P.S.; Cho, S.; Lee, S.Y. Metabolic and cellular engineering for the production of natural products. Curr. Opin. Biotechnol. 2022, 77, 102760. [Google Scholar] [CrossRef]
  13. Gusyatiner, M.M.; Lunts, M.G.; Kozlov, Y.I.; Vanovskaya, L.V.; Voroshilova, E.B. DNA coding for mutant isopropylmalate synthase L-leucine-producing microorganism and method for producing L-leucine. U.S. Patent. 2002, 403, 342. [Google Scholar]
  14. Vogt, M.; Haas, S.; Klaffl, S.; Polen, T.; Eggeling, L.; van Ooyen, J.; Bott, M. Pushing product formation to its limit: Metabolic engineering of Corynebacterium glutamicum for L-leucine overproduction. Metab. Eng. 2014, 22, 40–52. [Google Scholar] [CrossRef] [PubMed]
  15. Wang, Y.; Xu, J.; Jin, Z.; Xia, X.; Zhang, W. Improvement of acetyl-CoA supply and glucose utilization increases l-leucine production in Corynebacterium glutamicum. Biotechnol. J. 2022, 17, 2100349. [Google Scholar] [CrossRef]
  16. Blattner, F.R.; Plunkett, G., III; Bloch, C.A.; Perna, N.T.; Burland, V.; Riley, M.; Collado-Vides, J.; Glasner, J.D.; Rode, C.K.; Mayhew, G.F.; et al. The complete genome sequence of Escherichia coli K-12. Science 1997, 277, 1453–1462. [Google Scholar] [CrossRef]
  17. Rybarski, J.R.; Hu, K.; Hill, A.M.; Wilke, C.O.; Finkelstein, I.J. Metagenomic discovery of CRISPR-associated transposons. Proc. Natl. Acad. Sci. USA 2021, 118, e2112279118. [Google Scholar] [CrossRef]
  18. Li, C.; Zou, Y.; Jiang, T.; Zhang, J.; Yan, Y.; Li, C.; Zou, Y.; Jiang, T.; Zhang, J.; Yan, Y. Harnessing plasmid replication mechanism to enable dynamic control of gene copy in bacteria. Metab. Eng. 2022, 70, 67–78. [Google Scholar] [CrossRef] [PubMed]
  19. Zhang, Y.; Sun, X.; Wang, Q.; Xu, J.; Dong, F.; Yang, S.; Yang, J.; Zhang, Z.; Qian, Y.; Chen, J.; et al. Multicopy chromosomal integration using CRISPR-associated transposases. ACS Synth. Biol. 2020, 9, 1998–2008. [Google Scholar] [CrossRef]
  20. Livak, K.J.; Schmittgen, T.D. Analysis of relative gene expression data using real-time quantitative PCR and the 2(-Delta Delta C(T)) method. Methods 2001, 25, 402–408. [Google Scholar] [CrossRef]
  21. Chen, A.; Dong, Y.; Jiang, H.; Yang, S.; Zhang, J.; Wei, D. Identification and analysis of the key genes for Escherichia coli heterologous protein expression by transcriptomic profiling. Mol. Biol. Rep. 2024, 51, 1–9. [Google Scholar] [CrossRef] [PubMed]
  22. Wei, M.; Li, G.; Xie, H.; Yang, W.; Xu, H.; Han, S.; Wang, J.; Meng, Y.; Xu, Q.; Li, Y.; et al. Sustainable production of 4-hydroxyisoleucine with minimised carbon loss by simultaneously utilising glucose and xylose in engineered Escherichia coli. Bioresour. Technol. 2022, 354, 127196. [Google Scholar] [CrossRef] [PubMed]
  23. Park, J.H.; Oh, J.E.; Lee, K.H.; Kim, J.Y.; Lee, S.Y. Rational design of Escherichia coli for Lisoleucine production. ACS Synth. Biol. 2012, 1, 532–540. [Google Scholar] [CrossRef] [PubMed]
  24. Kohlhaw, G.B. Leucine biosynthesis in fungi: Entering metabolism through the back door. Microbiol. Mol. Biol. Rev. 2003, 67, 1–5. [Google Scholar] [CrossRef]
  25. Park, S.H.; Kim, H.U.; Kim, T.Y.; Park, J.S.; Kim, S.S.; Lee, S.Y. Metabolic engineering of Corynebacterium glutamicum for L-Arginine production. Nat. Commun. 2014, 5, 4618. [Google Scholar] [CrossRef]
  26. Kosicki, M.; Tomberg, K.; Bradley, A. Repair of double-strand breaks induced by CRISPR–Cas9 leads to large deletions and complex rearrangements. Nat. Biotechnol. 2018, 36, 765–771. [Google Scholar] [CrossRef]
  27. Ding, X.; Yang, W.; Du, X.; Chen, N.; Xu, Q.; Wei, M.; Zhang, C. High-level and high-yield production of L-leucine in Escherichia coli using multistep metabolic engineering. Metab. Eng. 2023, 78, 128–136. [Google Scholar] [CrossRef]
  28. Pournejati, R.; Karbalaei-Heidari, H.R. Optimization of Fermentation Conditions to Enhance Cytotoxic Metabolites Production by Bacillus velezensis Strain RP137 from the Persian Gulf. Avicenna J. Med. Biotechnol. 2020, 12, 116–123. [Google Scholar]
  29. Yu, J.; Liu, Q.; Liu, Q.; Liu, X.; Sun, Q.; Yan, J.; Qi, X.; Fan, S. Effect of liquid culture requirements on antifungal antibiotic production by Streptomyces rimosus MY02. Bioresour. Technol. 2008, 99, 2087–2091. [Google Scholar] [CrossRef]
  30. Wichmann; Wandreg, C.; Große-Wiesmann, J. Continuous microbial production of l-leucine with cell retention. Appl. Microbiol. Biotechnol. 1990, 32, 373–379. [Google Scholar] [CrossRef]
  31. Putra, M.A.D.; Rukmi, M.I.; Pujiyanto, S.; Mulyani, N.S. Produksi Protease Alkalis Termostabil Dari Aspergillus flavus DUCC- K225Dengan Ammonium Sulfat Sebagai Sumber Nitrogen. Bioma Berk. Ilm. Biologi. 2019, 21, 60–64. [Google Scholar]
  32. Usuda, Y.; Nishio, Y.; Iwatani, S.; Van Dien, S.J.; Imaizumi, A.; Shimbo, K.; Kageyama, N.; Iwahata, D.; Miyano, H.; Matsui, K. Dynamic modeling of Escherichia coli metabolic and regulatory systems for amino-acid production. J. Biotechnol. 2010, 147, 17–30. [Google Scholar] [CrossRef] [PubMed]
  33. Koyama, N. Stimulatory effect of NH4+ on the transport of leucine and glucose in an anaerobic alkaliphile. Eur. J. Biochem. 1993, 217, 435–439. [Google Scholar] [CrossRef] [PubMed]
  34. Membré, J.M.; Leporq, B.; Vialette, M.; Mettler, E.; Perrier, L.; Thuault, D.; Zwietering, M. Temperature effect on bacterial growth rate: Quantitative microbiology approach including cardinal values and variability estimates to perform growth simulations on/in food. Int. J. Food Microbiol. 2005, 100, 179–186. [Google Scholar] [CrossRef]
  35. Dai, Y.; Xu, Z.; Xia, X. Effects of fermentation temperature on bacterial community, physicochemical properties and volatile flavor in fermented soy whey and its coagulated tofu. LWT 2023, 173, 114355. [Google Scholar] [CrossRef]
  36. Wang, Y.H.; Feng, J.T.; Zhang, Q.; Zhang, X. Optimization of fermentation condition for antibiotic production by Xenorhabdus nematophila with response surface methodology. J. Appl. Microbiol. 2008, 104, 735–744. [Google Scholar] [CrossRef]
Figure 1. Metabolic pathway of L-leucine biosynthesis in Escherichia coli. This includes the L-leucine biosynthesis pathway (this study), acetoacetate metabolic pathway, and acetyl CoA metabolic pathway. The red region illustrates our modified and enhanced L-leucine synthesis pathway.
Fermentation 11 00314 g001
Figure 2. Schematic diagram of enhanced design of key enzyme genes. (a) Schematic diagram of plasmid pDonor construction. (b) Schematic diagram of key enzymes involved in CRISPR-related transposase multi-copy chromosome integration for L-leucine synthesis.
Fermentation 11 00314 g002
Figure 3. Gel electrophoresis diagram for verifying transformation into the strain. (a) M: marker DL2000; 1: pDonor-leuA, 2012b; 2: pDonor-leuB,1532bp; 3: pDonor-leuCD, 1841bp; 4: pDonor-bcd, 1535 bp. (b) 1, 2: pTnsABC,1033 bp; (c) 1, 2: pQCascade, 1106 bp; (d) 1: E. coli-leuA, 2012 bp; 2: E. coli-leuB, 1475 bp; 3: E. coli-leuCD, 1841 bp; 4: E. coli-bcd, 1535 bp; (e) M: marker DL2000; 1: Primers ABA-F and ABA-R were used for the PCR of strains E. coli CD301 and E. coli bcd401 770 bp; 2: Primers Cb-CD-F and Cb-CD-R were used for the PCR of strains E. coli A101 and E. coli B201, 738 bp; 3: Primers AA-F and AA-R were used for PCR of the four engineered strains, with a total of 1445 bp; 4: Primers BB-F and BB-R were used for PCR of the four engineered strains, with a total of 1010 bp; 5: Primers CCD-F and CCD-R were used for PCR of the four engineered strains, with 1163 bp; 6: Primers Bcd-F and Bcd-R were used for PCR analysis of the four engineered strains, with a total length of 977 bp.
Fermentation 11 00314 g003
Figure 4. Copy number verification of key enzyme genes involved in L-leucine synthesis. Significant differences (p < 0.05) were determined using a one-way analysis of variance with Duncan’s test and are represented using different letters.
Fermentation 11 00314 g004
Figure 5. Transcriptional level analysis of engineering strains. (a) Expression level distribution. (b) Venn analysis of expressed genes among strains. (c) Total number of expressed genes in each strain.
Fermentation 11 00314 g005
Figure 6. Fermentation outcomes of engineered strains. Significant differences (p < 0.05) were determined using a one-way analysis of variance with Duncan’s test and are represented using different letters.
Fermentation 11 00314 g006
Figure 7. SDS-PAGE showing protein expression of the induced genes. Lanes: 1: E. coli A211, 2: E. coli A101, 3: E. coli CD301, 4: E. coli B301, 5: E. coli bcd401.
Fermentation 11 00314 g007
Figure 8. Fermentation outcomes of E. coli CD301 at different conditions. (a) C/N, (b) pH, (c) temperature, (d) shaker speed, (e) inoculum amount. Significant differences (p < 0.05) were determined using a one-way analysis of variance with Duncan’s test and are represented using different letters.
Fermentation 11 00314 g008
Figure 9. Response surface and contour plot of the effect of three-factor interaction on L-leucine production. (a,b) Fermentation temperature and C/N ratio of the culture medium; (c,d) fermentation temperature and inoculum amount; (e,f) inoculum amount and C/N ratio of culture medium.
Fermentation 11 00314 g009
Figure 10. Comparison of fermentation outcomes between E. coli A211 and E. coli CD301 at the optimized fermentation conditions. Significant differences (p < 0.05) were determined using a one-way analysis of variance with Duncan’s test and are represented using different letters.
Fermentation 11 00314 g010
Table 1. Strains and plasmids.
CategoryNameCharacteristicsSource
Bacterial strainE. coli A211Original engineering strainThis study
E. coli DH5αCloneVazyme
PlasmidpET28a-leuACarrying the target gene leuAThis study
pET28a-leuBCarrying the target gene leuBThis study
pET28a-leuCDCarrying the target gene leuCDThis study
pET28a-bcdCarrying the target gene bcdThis study
pET22b-leuABCarrying genes leuA, leuBThis study
pET22b-leuCD-bcdCarrying genes leuCD, bcdThis study
pDonor-T7-YdiIKey enzyme expression vectorThis study
pQCascade-IS1Tool enzyme expressionThis study
pTnsABCTool enzyme expressionThis study
pCutampTool enzyme expressionThis study
Table 2. Gradient of mobile phase.
SequenceTime (min)Mobile Phase A (%)Mobile Phase B (%)Notes
101684Initial state
20.181684
32.43070
44.23466
57.24357
613.35545
7155545
820.4982
921.31684
10301684Rebalance the system and restore its initial state
Table 3. Experimental factor levels for Box–Behnken design.
FactorCodeLevel
−101
Temperature (°C)A3032.535
C/NB101520
Inoculation amount (%)C51015
Table 4. Box–Behnken experimental design.
Sequence Temperature (°C)C/NInoculation Amount (%)
1−1−10
21−10
3−110
4110
5−10−1
610−1
7−101
8101
90−1−1
1001−1
110−11
12011
13000
14000
15000
16000
17000
Table 5. Comparison before and after the optimization of fermentation conditions.
Fermentation
Conditions
Culture Medium C/NInitial pH of the Culture MediumFermentation Temperature (°C)Shaking Speed (r/min)Strain Inoculation Amount (%)
Before optimization25:17372005
After optimization17:17.5332009.6
Table 6. Validation of fermentation results between original and engineering strains.
StrainTiter (g/L)Sugar Consumption (g/L)Yield (g/g)
E.coli A2110.349.870.03
E.coli CD3010.898.830.10
Disclaimer/Publisher’s Note: The statements, opinions and data contained in all publications are solely those of the individual author(s) and contributor(s) and not of MDPI and/or the editor(s). MDPI and/or the editor(s) disclaim responsibility for any injury to people or property resulting from any ideas, methods, instructions or products referred to in the content.

