1. Introduction
Biopharmaceutical production using the fermentation of Chinese Hamster Ovary (CHO) cells is a pivotal process in the manufacturing of state-of-the-art therapeutic proteins and antibodies [
1]. Ensuring the required efficiency and consistency in the production of monoclonal antibodies (mAbs) necessitates numerous critical process steps, with process analytical technologies (PATs) being an absolutely indispensable endeavor, as emphasized by FDA guidelines [
2]. The array of sensors and analytical methods utilized as PATs is extensive, reflecting the critical importance of accurate monitoring in biopharmaceutical production. Among these, spectroscopic sensors have seen significant development. Raman spectroscopy, in particular, has gained the most popularity due to its stability, minimal fluorescence interference and insensitivity to water [
3]. Furthermore, all process information can be gathered online without sample preparation as well as in a non-destructive [
4] and non-invasive manner [
5,
6].
The ability of Raman spectroscopy to simultaneously identify a wide range of chemicals (molecular fingerprinting), as well as to utilize flexible sampling methods, allows it to be employed in various monitoring configurations, and its simple probe-based system makes it suitable for many bioprocess monitoring purposes [
7,
8,
9].
However, there remains a major challenge regardless of how Raman spectroscopy is used in modern bioprocesses: the robustness of the chemometric calibration model, which is influenced by factors such as the selection of wavenumber regions, the complexity of biological systems, the presence of overlapping signals or co-correlations of components, data preprocessing and susceptibility to environmental noise, all of which contribute to the ongoing challenge of maintaining robust calibration [
8,
10,
11,
12,
13]. The aforementioned challenges manifest differently when using Raman spectroscopy for the analysis of fermentation gas-phases, i.e., the fermentation
the off-gas stream. Unlike conventional Raman spectroscopy in liquids like fermentation media, Raman gas analysis allows in various cases for the direct assignment of detectable Raman bands in the spectrum to specific analytes, even when these are present at relatively low concentrations. This advantage is further enhanced by performing multi-component gas analysis in parallel, which is normally not possible with conventional gas sensor arrays like electrochemical or semiconductor-based gas sensors [
14,
15].
Especially for the well-known fermentation key gasses O
2 [
16] and CO
2 [
17,
18], a direct correlation between Raman bands and their gas concentrations can be found, eliminating the extensive preprocessing and complexity of interpreting mixed signals typically required for liquid-phase analysis. CO
2, in particular, is one of the most important gasses for mammalian bioprocesses, as it serves, on the one hand, as a critical indicator of cellular respiration and metabolic activity and, on the other, it is used for the pH determination as well as pH regulation of bicarbonate-buffered fermentation media [
19,
20]. Additionally, CO
2 in its dissolved form and its related species (like HCO
3−) are prone to negatively interfere with several intracellular processes, potentially leading to adverse effects not only in cells but also affecting critical product quality attributes (CQAs) [
20,
21,
22,
23]. Given the critical role of CO
2 in bioprocesses and in light of the mentioned challenges, we have focused our research in this article on the utilization of Raman spectroscopy for the analysis of fermentation off-gas. Specifically, we aimed to achieve precise measurement of CO
2 in the fermentation off-gas stream during media hold time for two different fermentation media (medium 1 and 2), with two different lots each. In a next step, the Raman off-gas predicted CO
2 was used to calculate the pH value of the fermentation media in order to generate a correlation relationship inspired by the advantageous methodology presented by Klinger et al. [
19]. Furthermore, we also investigated the estimation of the media pH through a direct Raman off-gas model, showing that this technique offers the potential for not only precise CO
2 but also for precise and robust pH predictions out of the off-gas stream. While Raman gas spectroscopy has found applications in other fields, such as the analysis of environmental gasses or natural gasses using techniques like surface-, cavity- or fiber-enhanced Raman spectroscopy (SERS, CERS and FERS), its use in mammalian bioprocesses for determining critical process variables like CO
2 or pH remains unexplored to our knowledge [
12,
14,
15,
24,
25].
2. Materials and Methods
2.1. Experimental Off-Gas Measurement SetUp
To determine the exhaust carbon dioxide concentration, an off-gas measurement was set up (
Figure 1). Exhaust gas analysis was performed using a four-channel gas analyzer (DasGip
® GA4, Eppendorf AG, Hamburg, Germany). The gas analyzer was two-point calibrated with process air and a defined gas mixture (Linde AG, Höllriegelskreuth, Germany) containing 2% O
2 and 10% CO
2.
The measurement of the carbon dioxide concentration was conducted using a dual-beam infrared absorption technique. The pressure compensation function of the gas analyzer was set to inactive and environmental pressure was set to 941 mbar (reflecting the elevation of 621 m at the Roche site in Penzberg, Germany).
Raman off-gas spectra were measured using a Raman gas probe (AirHead
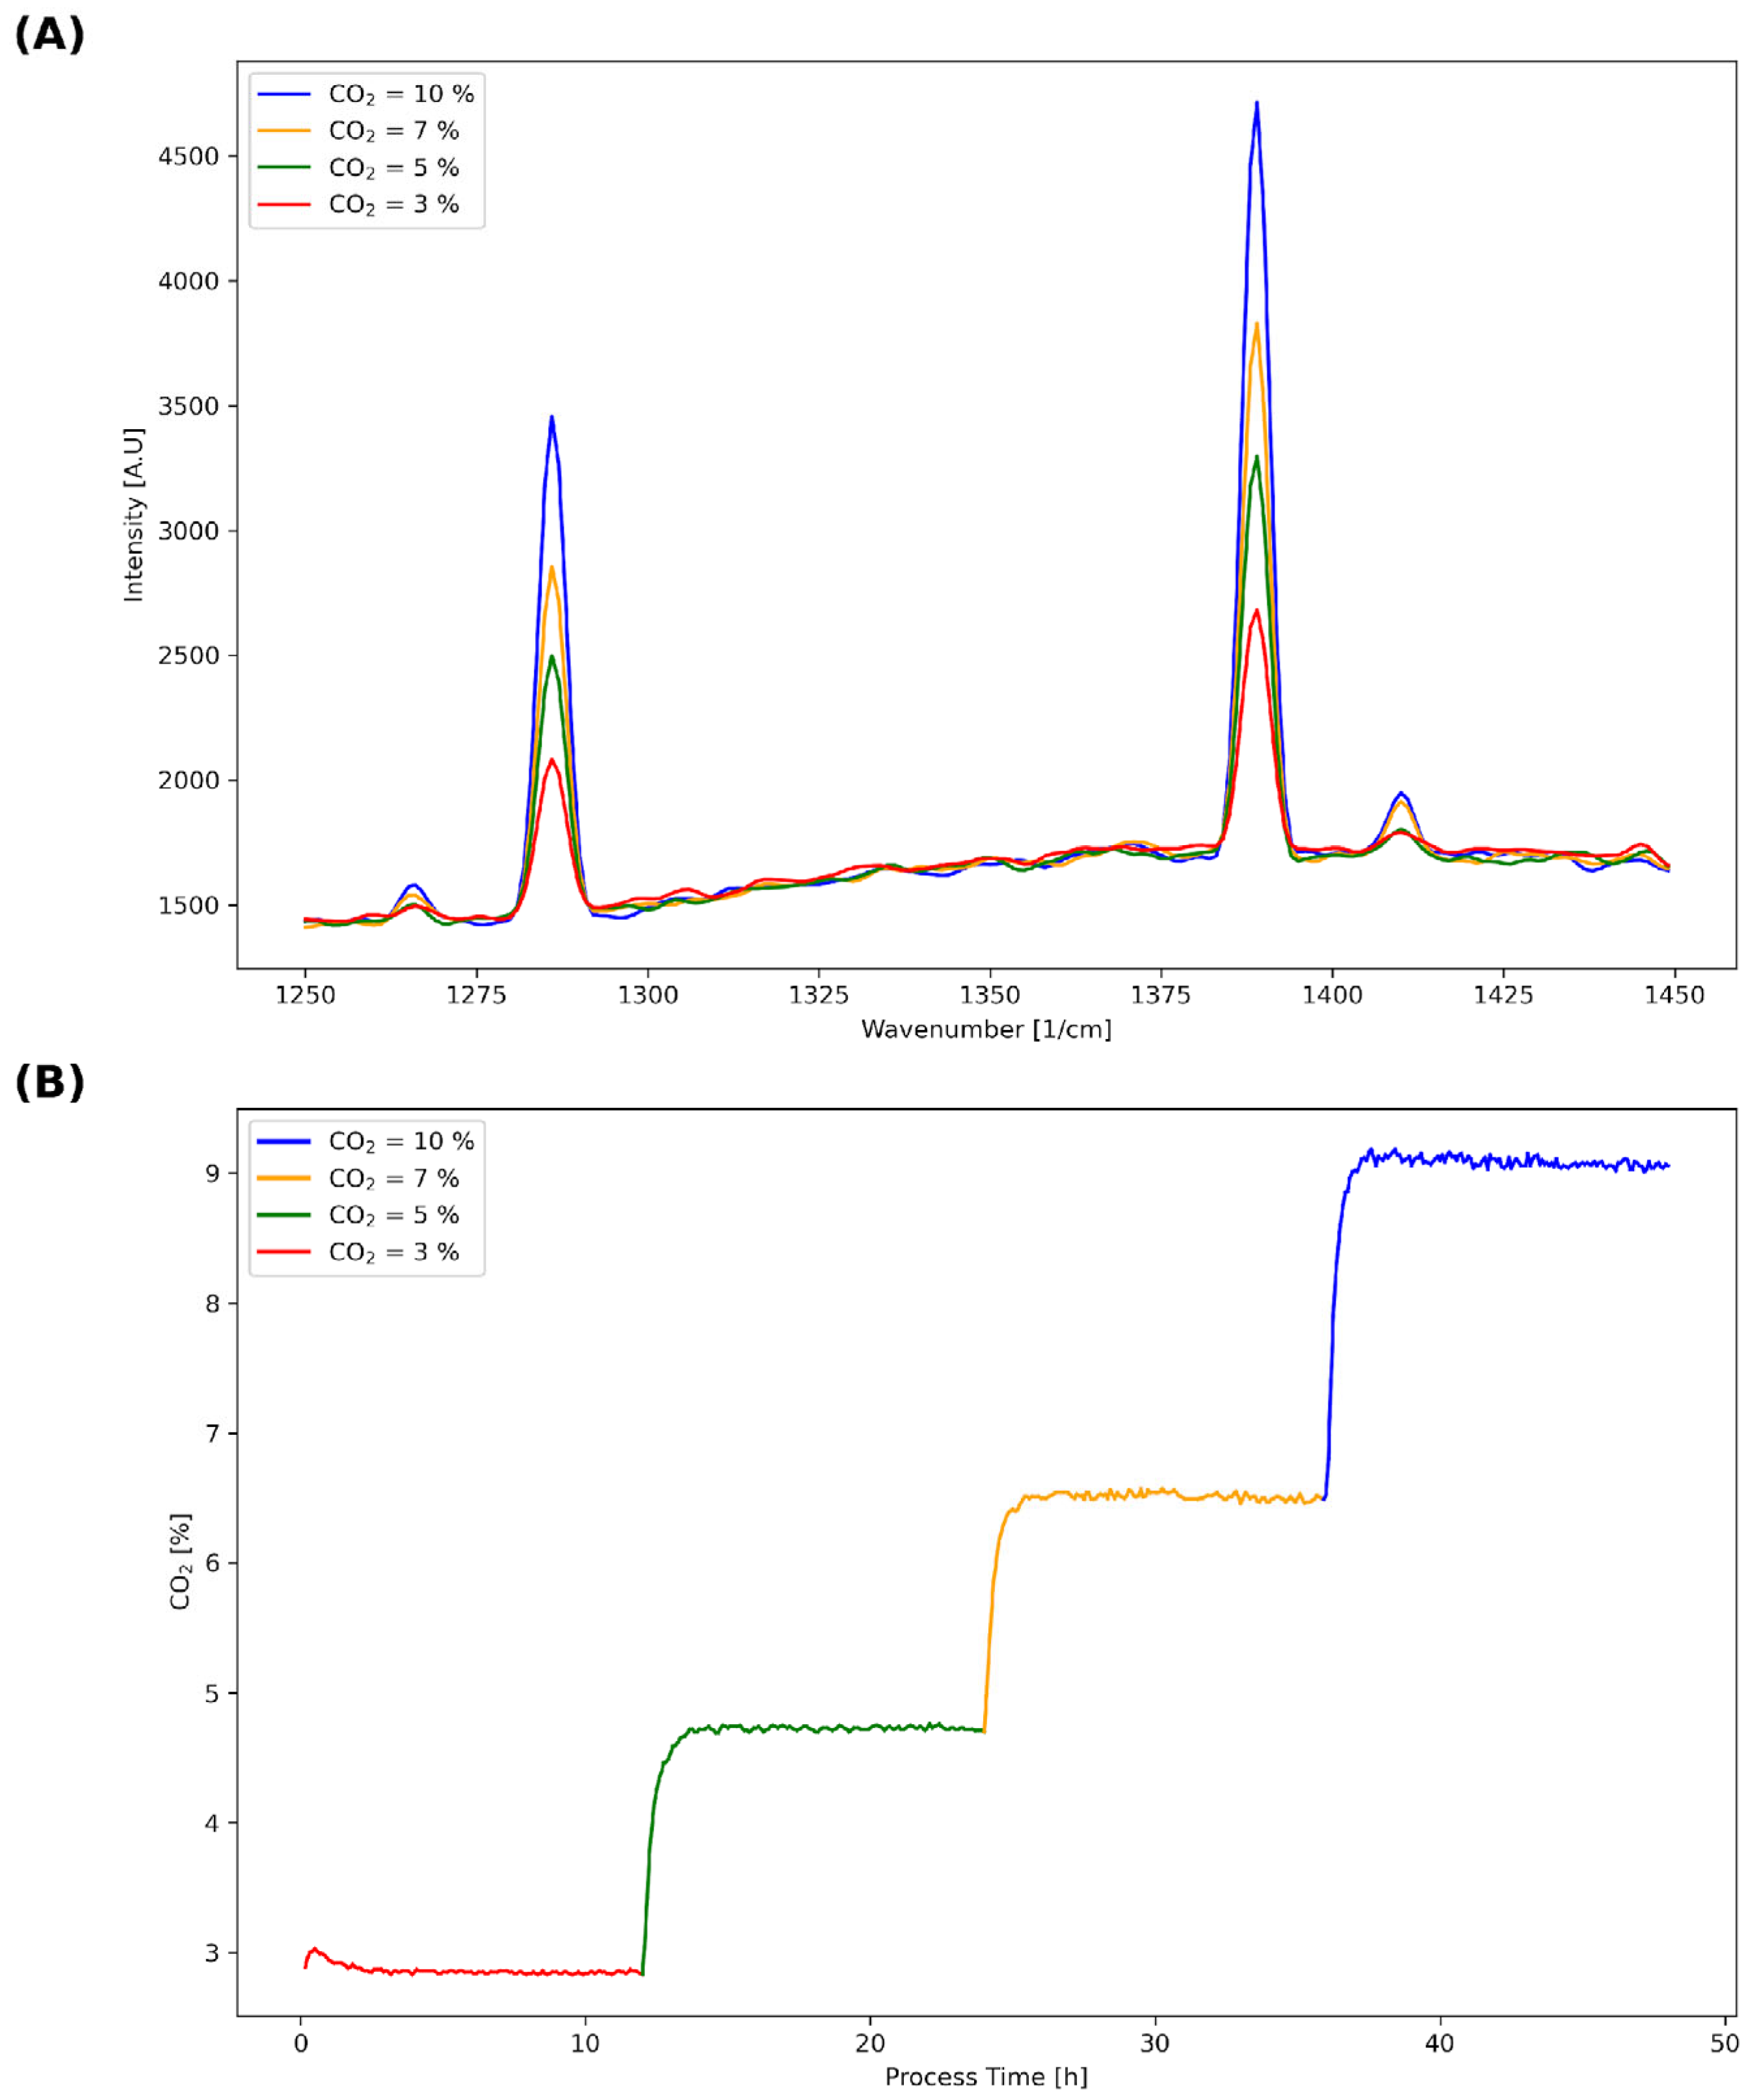
TM, Endress+Hauser, Coburg, Germany) with an RXN2 Raman analyzer operating with a 758 nm laser wavelength (Kaiser Optical Systems Inc., Ann Arbor, MI, USA). CO
2 exhibits four Raman peaks due to a phenomenon called Fermi resonance. Therefore, two strong peaks (Fermi doublets) at 1285 and 1388 cm⁻
1 and two weak peaks (hot bands) at 1265 and 1408 cm⁻
1 can be observed [
26]. The prominent wavelength region (1250 to 1450 cm⁻
1) of the CO
2 spectra is shown in
Figure 2A. The Raman measurement conditions were set to 1 min exposure time and 5 counts for all conducted measurements in this study using the AirHead
TM probe. The Raman AirHead
TM probe was integrated into a specially designed and gas-tight measurement chamber (cross-flow cell, Endress+Hauser, Coburg, Germany), which was mounted in a self-made holder fabricated using 3D printing technology. The exhaust air flow passed through the measurement chamber vertically, ensuring that any condensate did not interfere with the measurement of the Raman spectra. To ensure a gas-tight connection setup, Teflon tubes (Festo Vertrieb GmbH & Co. KG, Esslingen, Germany) were utilized for all gas lines (
Figure 1).
All devices used in this study were 2 L stirred tank glass bioreactors (BIOSTAT
® B-DCU Quad, Sartorius, Göttingen, Germany). Bioreactors, along with pH probes (Mettler Toledo, Gießen, Germany) InPro3253/225/PT100) and Raman probes (Endress+Hauser, RXN-10 probe with bIO-Optic), were wet-sterilized in KH
2PO
4 solution (1.2 g/L). Subsequent media fill of the 2 L bioreactors was performed under sterile conditions. The bioreactor pH probes were initially two-point calibrated (buffers with pH 4.00 and 7.00 at 25 °C, Mettler Toledo). To ensure accurate and reliable pH measurements that are not affected by any offline sampling procedure, two bioreactor ports were opened, consequently compromising the sterility of the system. In a next step, two independent pH probes (Mettler Toledo InLab Semi-Micro pH probe with Knick Portavo 907 pH-meter) were submerged into the media through the open ports in order to measure the pH directly, excluding any sampling. Both pH probes were three-point calibrated (buffer with pH 9.21, 7.00 and 4.00 at 25 °C, Mettler Toledo), each with automated temperature compensation. Their average pH readings were used for the one-point adjustment of the bioreactor pH probes. The upper acceptable deviation limit between the pH meter readings was set to 0.02 pH, while this limit was 0.01 pH for the pH buffer. This preparation procedure as well as the specified pH acceptance limits were implemented in line with the methods described in the work of Klinger et al. [
13].
2.2. Data Analysis and Model Building
All analysis was performed using Python 3.10. The in-house build linear CO
2 model has been trained and tested on Raman off-gas spectra collected from experiments with predefined CO
2 gas mixtures (
Figure 2B) as well as diverse fermentation processes. For model development, the Lasso regression algorithm from scikit-learn was employed. Optimal hyperparameters were identified using a grid search in combination with 5-fold cross-validation. To evaluate model performance on an independent dataset not previously seen by the algorithm, the following parameters were applied: alpha = 0.01, precompute = True, selection = ‘random’ and max_iter = 1000.
For direct pH predictions in this publication, a random forest algorithm was used. All analysis here was performed for two different media. The datasets for each medium were temporally split into training and test sets to assess the model’s generalization capability. The first experiment per medium was used for training, and the second experiment run per medium was used for testing. The parameters used for predicting the test data were selected through a grid search using the following grid:
‘n_estimators’: [100, 300, 500, 700, 1000, 1500, 2000]
‘max_depth’: [None, 10, 20, 30, 40, 50, 75, 100]
‘min_samples_split’: [2, 4, 6, 8, 10, 15, 20]
‘min_samples_leaf’: [1, 2, 4, 8, 16, 32]
‘max_features’: [‘auto’, ‘sqrt’, ‘log2’, 0.2, 0.5, 0.8]
‘bootstrap’: [True, False]
‘criterion’: [‘squared_error’, ‘absolute_error’]
‘max_samples’: [0.5, 0.7, 0.9, 1.0]
Prior to model development, all Raman spectra were preprocessed to enhance signal quality and ensure comparability across samples. The following steps were applied to both off-gas and submers Raman spectra:
For off-gas spectra, only the spectral region between 1200 and 1800 cm⁻1 was retained. For submers spectra, two regions were selected: 432–1830 cm⁻1 and 2900–3066 cm⁻1. This selection was performed to exclude irrelevant or noisy regions and focus on the most informative spectral features.
- 2.
Savitzky–Golay Filtering:
To reduce noise and, if required, compute derivatives, a Savitzky–Golay (SG) filter [
27] was applied to the spectra using the scipy.signal.savgol_filter function. The filter was applied along the spectral axis (axis = 1). The following parameters were used:
Window length: 11 (off-gas) and 19 (submers);
Polynomial order: 1;
Derivative order: 1.
These parameters were chosen to balance noise reduction with preservation of spectral features and to enhance subtle changes in the spectra relevant for downstream modeling.
- 3.
Standard Normal Variate (SNV) Normalization:
To correct for scatter effects and baseline shifts, spectra were normalized using the Standard Normal Variate (SNV) [
28] method. This transformation centers each spectrum to zero mean and scales it to unit variance.
2.3. Assessing Media Specific Relationships Between Off-Gas CO2 and Associated Raman Spectra
In this study, we analyzed two different cell culture media with two different lots each (
Table 1). Medium 1 was commercially available chemically defined serum-free cell culture medium (Xell HEK Vip NB, Sartorius Xell GmbH, Bielefeld, Germany) and medium 2 was a proprietary chemically defined and serum-free Roche medium.
For each medium and their respective lot, one 2 L glass vessel was used with a fill volume of 1.5 L to minimize headspace volume as well as potential delays. To collect the media-specific correlation curves between the off-gas CO
2 and medium pH of two different media with two lots each, a manual multiplexing step was necessary due to the availability of a single Raman AirHead
TM probe. Once the equilibration phase for each gas mixture in a given 2 L vessel was achieved and all Raman-based measurements were collected, the AirHead
TM probe was connected to the next 2 L vessel to initiate CO
2 gas mixture ramping and subsequent data collection (
Figure 3). In order to save time, the first gas mixture (CO
2 = 3 %) was prepared one day in advance. As already described in
Section 2.1, two InLab Semi-Micro pH probes were inserted into the bioreactor to also verify the pH measurements from the bioreactor inline pH probe once a stable equilibration phase was reached. This inline pH verification procedure was performed for each gas mixture. No inline pH probe recalibration was necessary as all pH verification measurements were within a range of +/− 0.02 pH.
3. Results and Discussion
The accurate monitoring of CO2 levels and pH in fermentation processes is critical for optimizing bioprocesses, particularly in mammalian cell cultures. In this study, we demonstrate the effectiveness of Raman spectroscopy for real-time CO2 measurement and its subsequent use for pH prediction in bioreactor off-gas streams.
To evaluate the performance of our pretrained CO
2 prediction model, we conducted Raman measurements for four distinct CO
2 gas mixtures (3%, 5%, 7% and 10%) (see
Figure 2B) using two different media: a commercial medium (medium 1) and an in-house Roche medium (medium 2). Both train and test data were used for testing the pretrained CO
2 model.
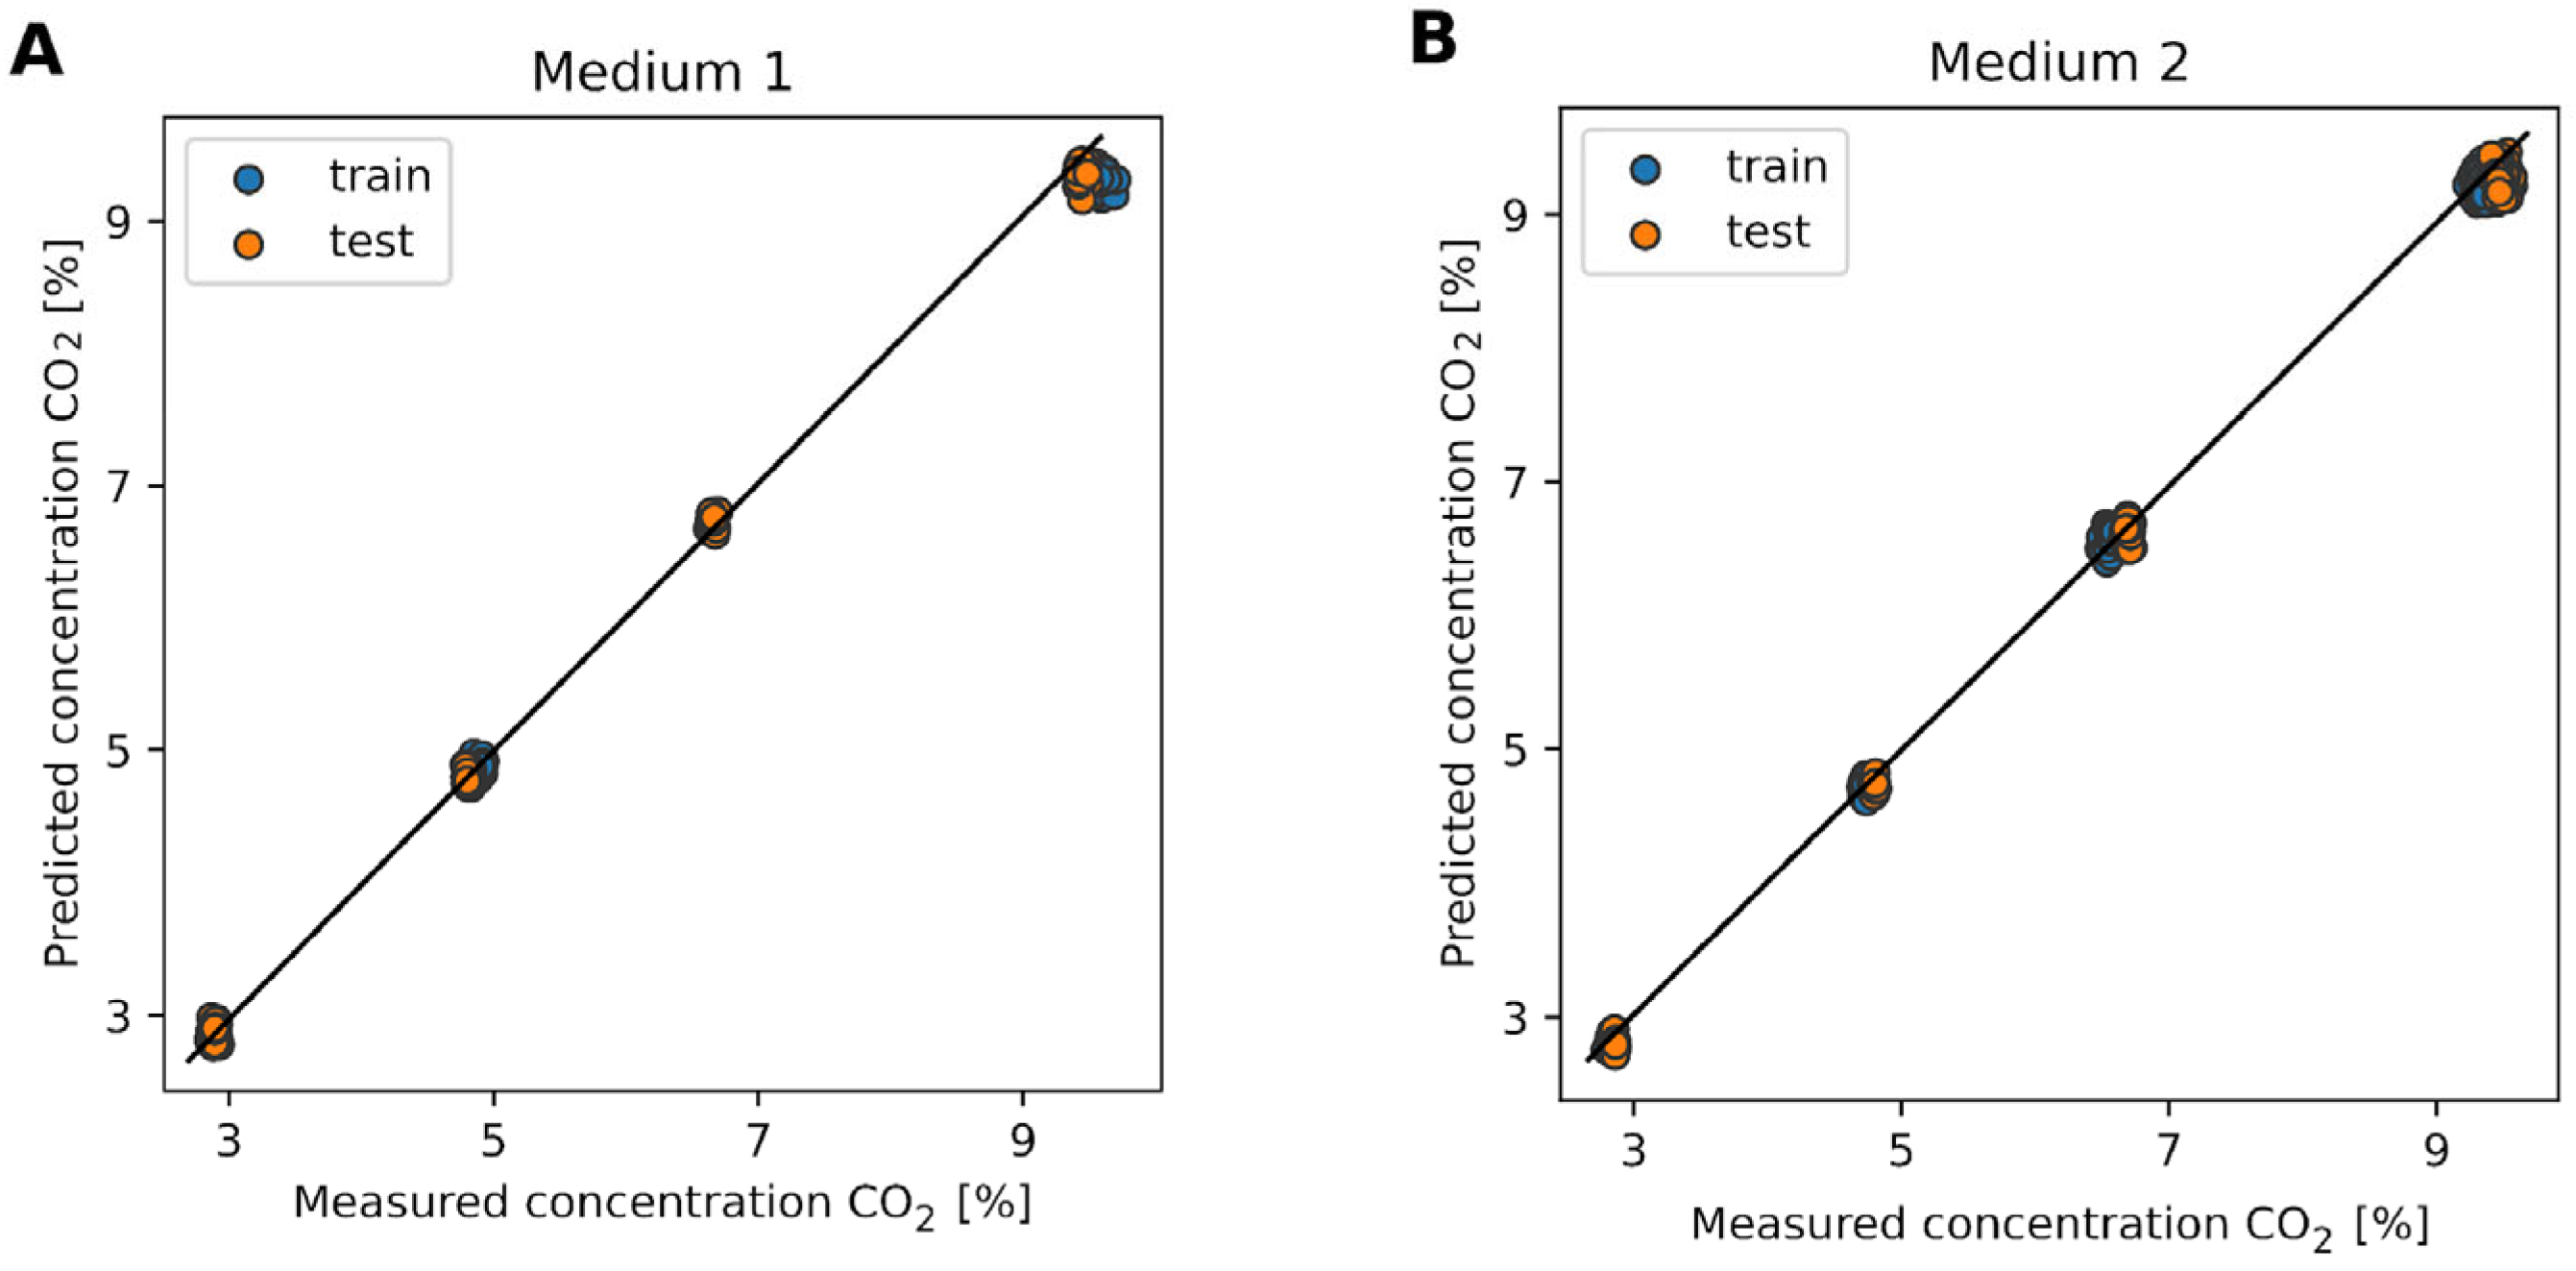
Figure 4 illustrates the predicted CO
2 concentrations versus the measured CO
2 concentrations for both media. The blue points represent the training data, and the orange points represent the test data. Panel A shows the results for medium 1. The predicted CO
2 concentrations closely match the measured values for both the training (R
2 = 0.998, RMSE = 0.179%) and test sets (R
2 = 0.992, RMSE = 0.085%), indicating that the model performs well in this medium. The clustering of points around the diagonal line suggests a high degree of accuracy and minimal bias in the predictions. Panel B presents the results for medium 2. Similar to medium 1, the predicted CO
2 concentrations align well with the measured values for both the training (R
2 = 0.995, RMSE = 0.109%) and test sets (R
2 = 0.999, RMSE = 0.201%). The consistency in the model’s performance across different media highlights its robustness and reliability.
We further explored the relationship between the predicted CO
2 concentrations and the pH of the fermentation media. Specifically, we trained a logarithmic fit (logfit) on the predicted CO
2 values to estimate the pH. We then evaluated the performance of this logfit on test data and compared it to the logfits obtained using the Dasgip
® CO
2 measurements, which serve as the gold standard for the off-gas-based pH reference method, as described by Klinger et al. [
19].
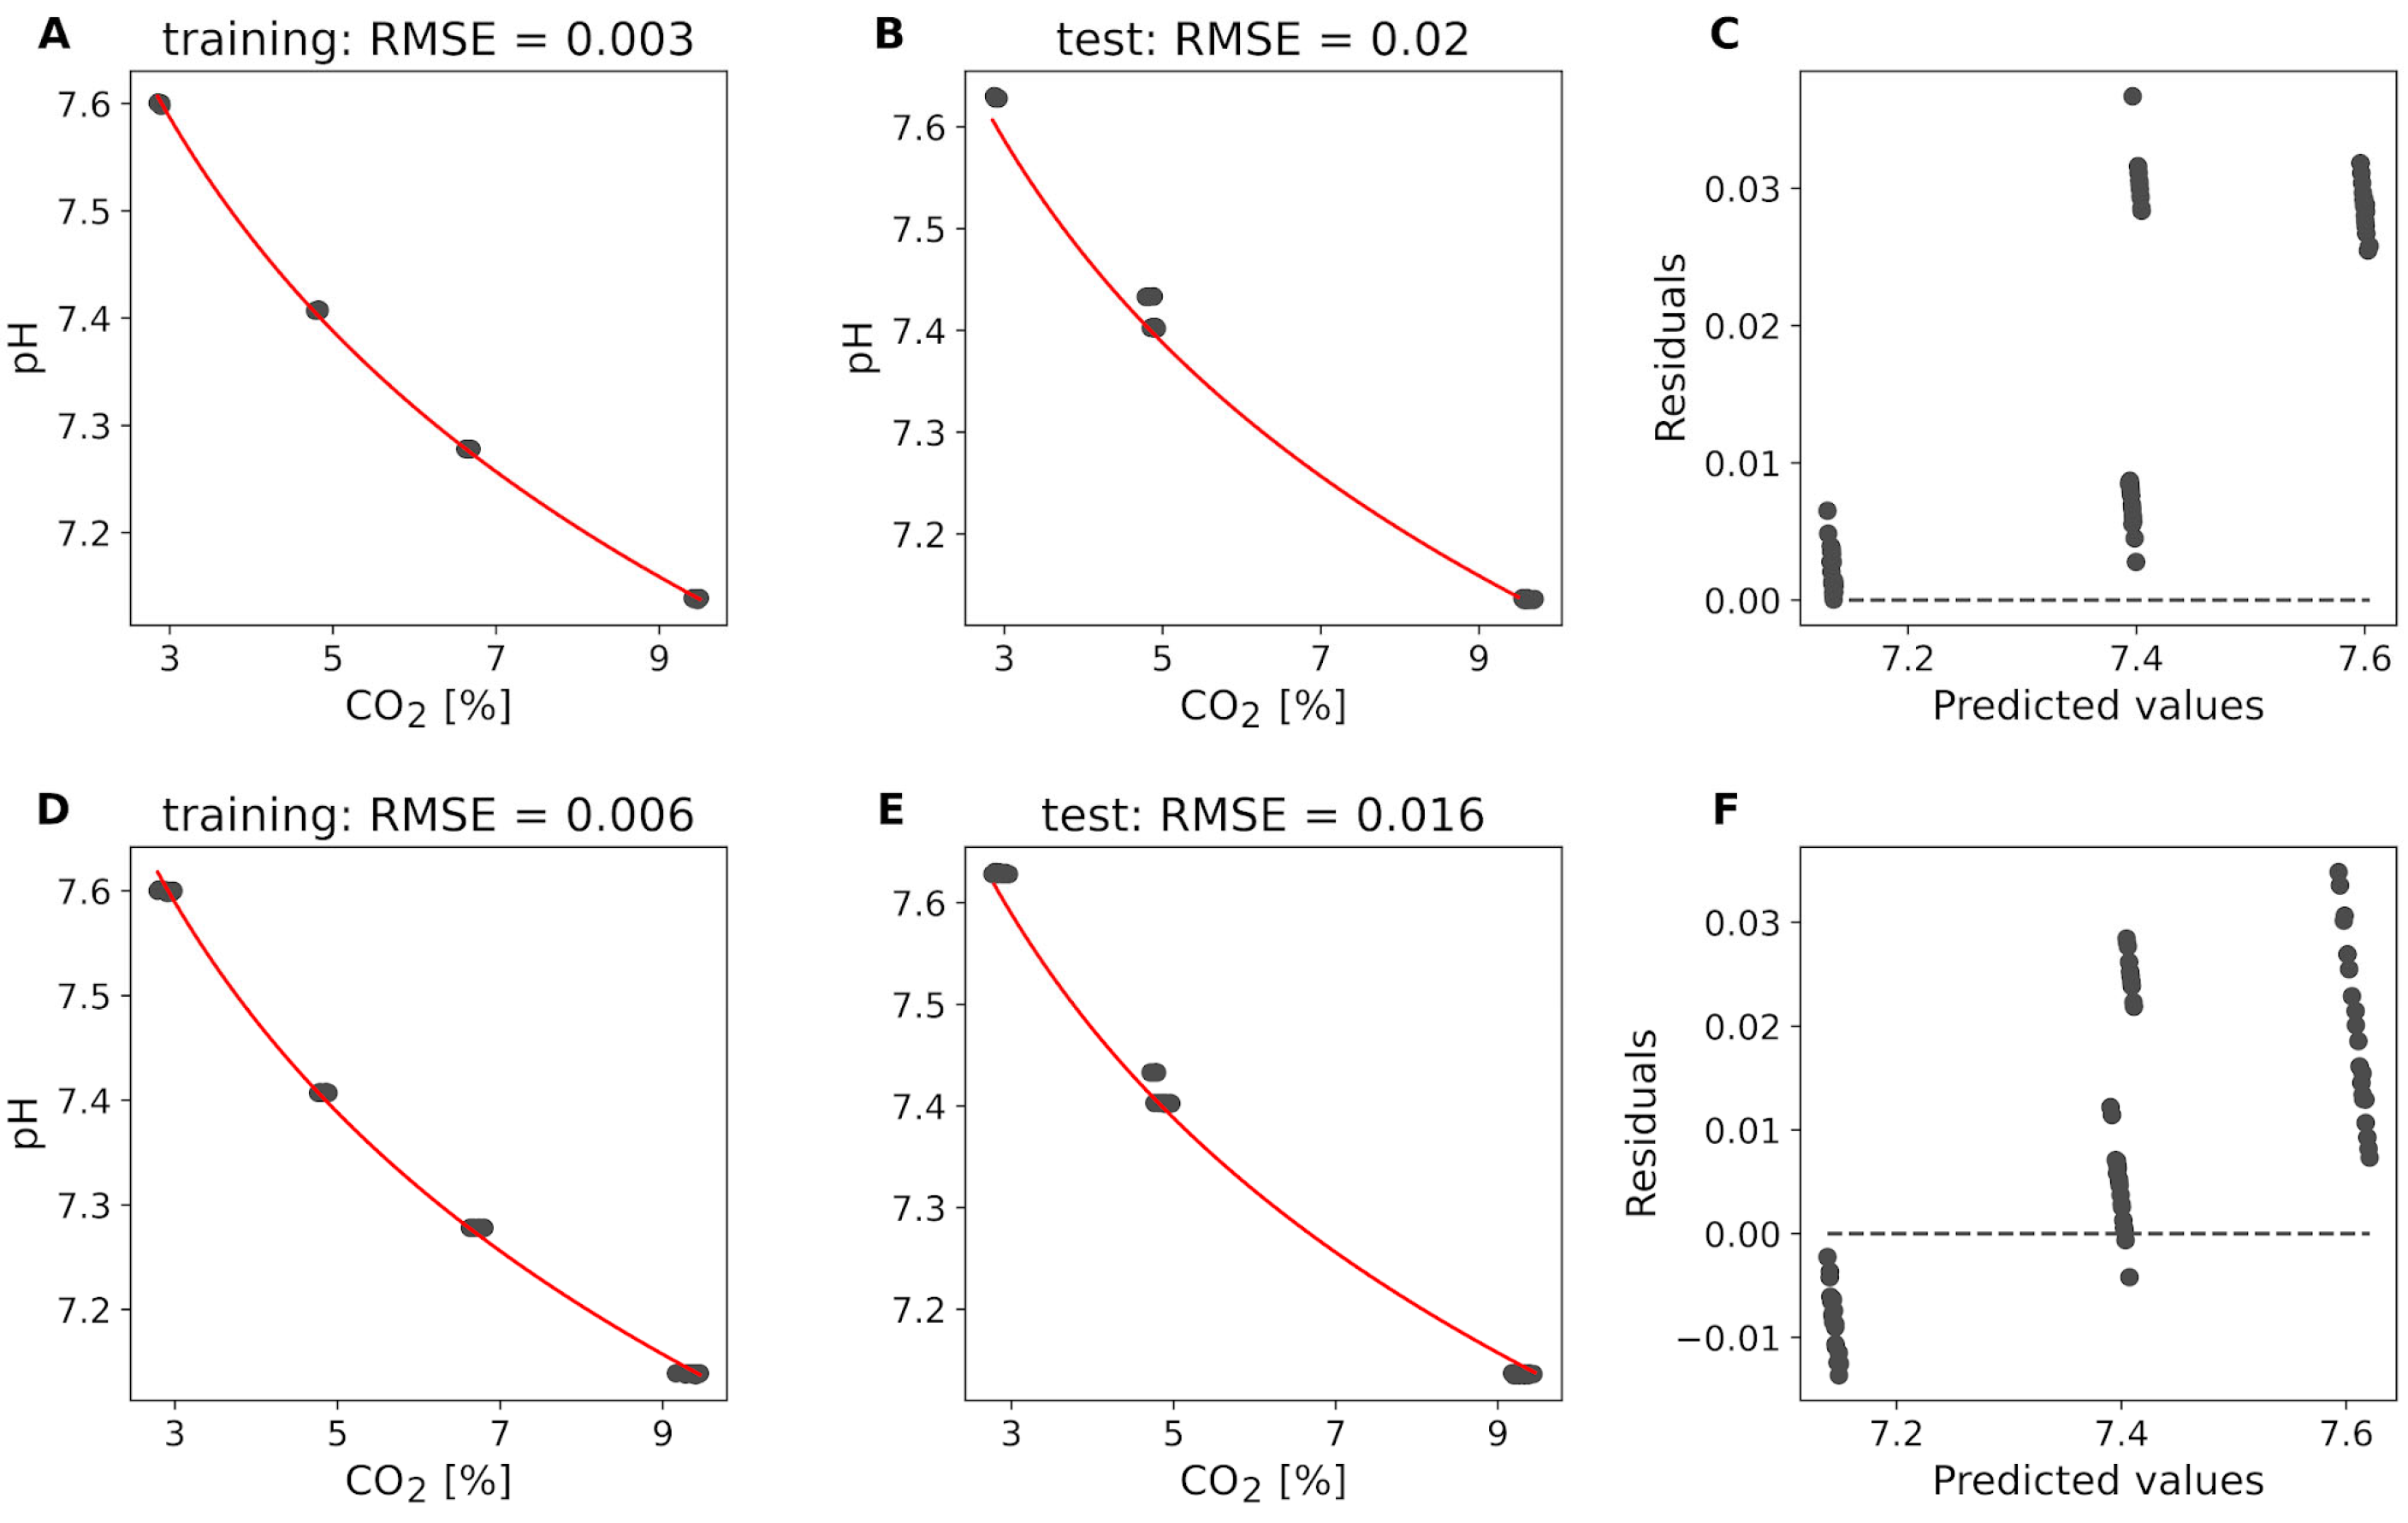
Figure 5 presents the results of these analyses. The logfit of the predicted CO
2 concentrations to the pH values for the training dataset of medium 1 gives a root mean squared error RMSE of 0.003% (
Figure 5A). Applying the logfit derived from the training dataset to the test dataset of medium 1 yields an RMSE of 0.020% (
Figure 5B). Panel C shows the residuals of the predicted pH values versus the actual pH values for the test dataset of medium 1, demonstrating deviations between 0.0 and 0.037 pH from the true values. Similarly, the logfit of the CO
2 concentrations measured with the gold standard (Dasgip
® GA4) to the pH values for the training dataset of medium 1 results in an RMSE of 0.006 pH (
Figure 5D). When this logfit is applied to the test dataset of medium 1, the RMSE is 0.016 pH (
Figure 5E). Panel F illustrates the residuals of the predicted pH values versus the actual pH values for the test dataset of medium 1, showing deviations ranging between −0.014 and 0.035 pH from the true values. Results for medium 2 are in a similar range. These results indicate that the logfit model provides accurate and reliable pH predictions from CO
2 concentrations, whether predicted or measured with the gold standard.
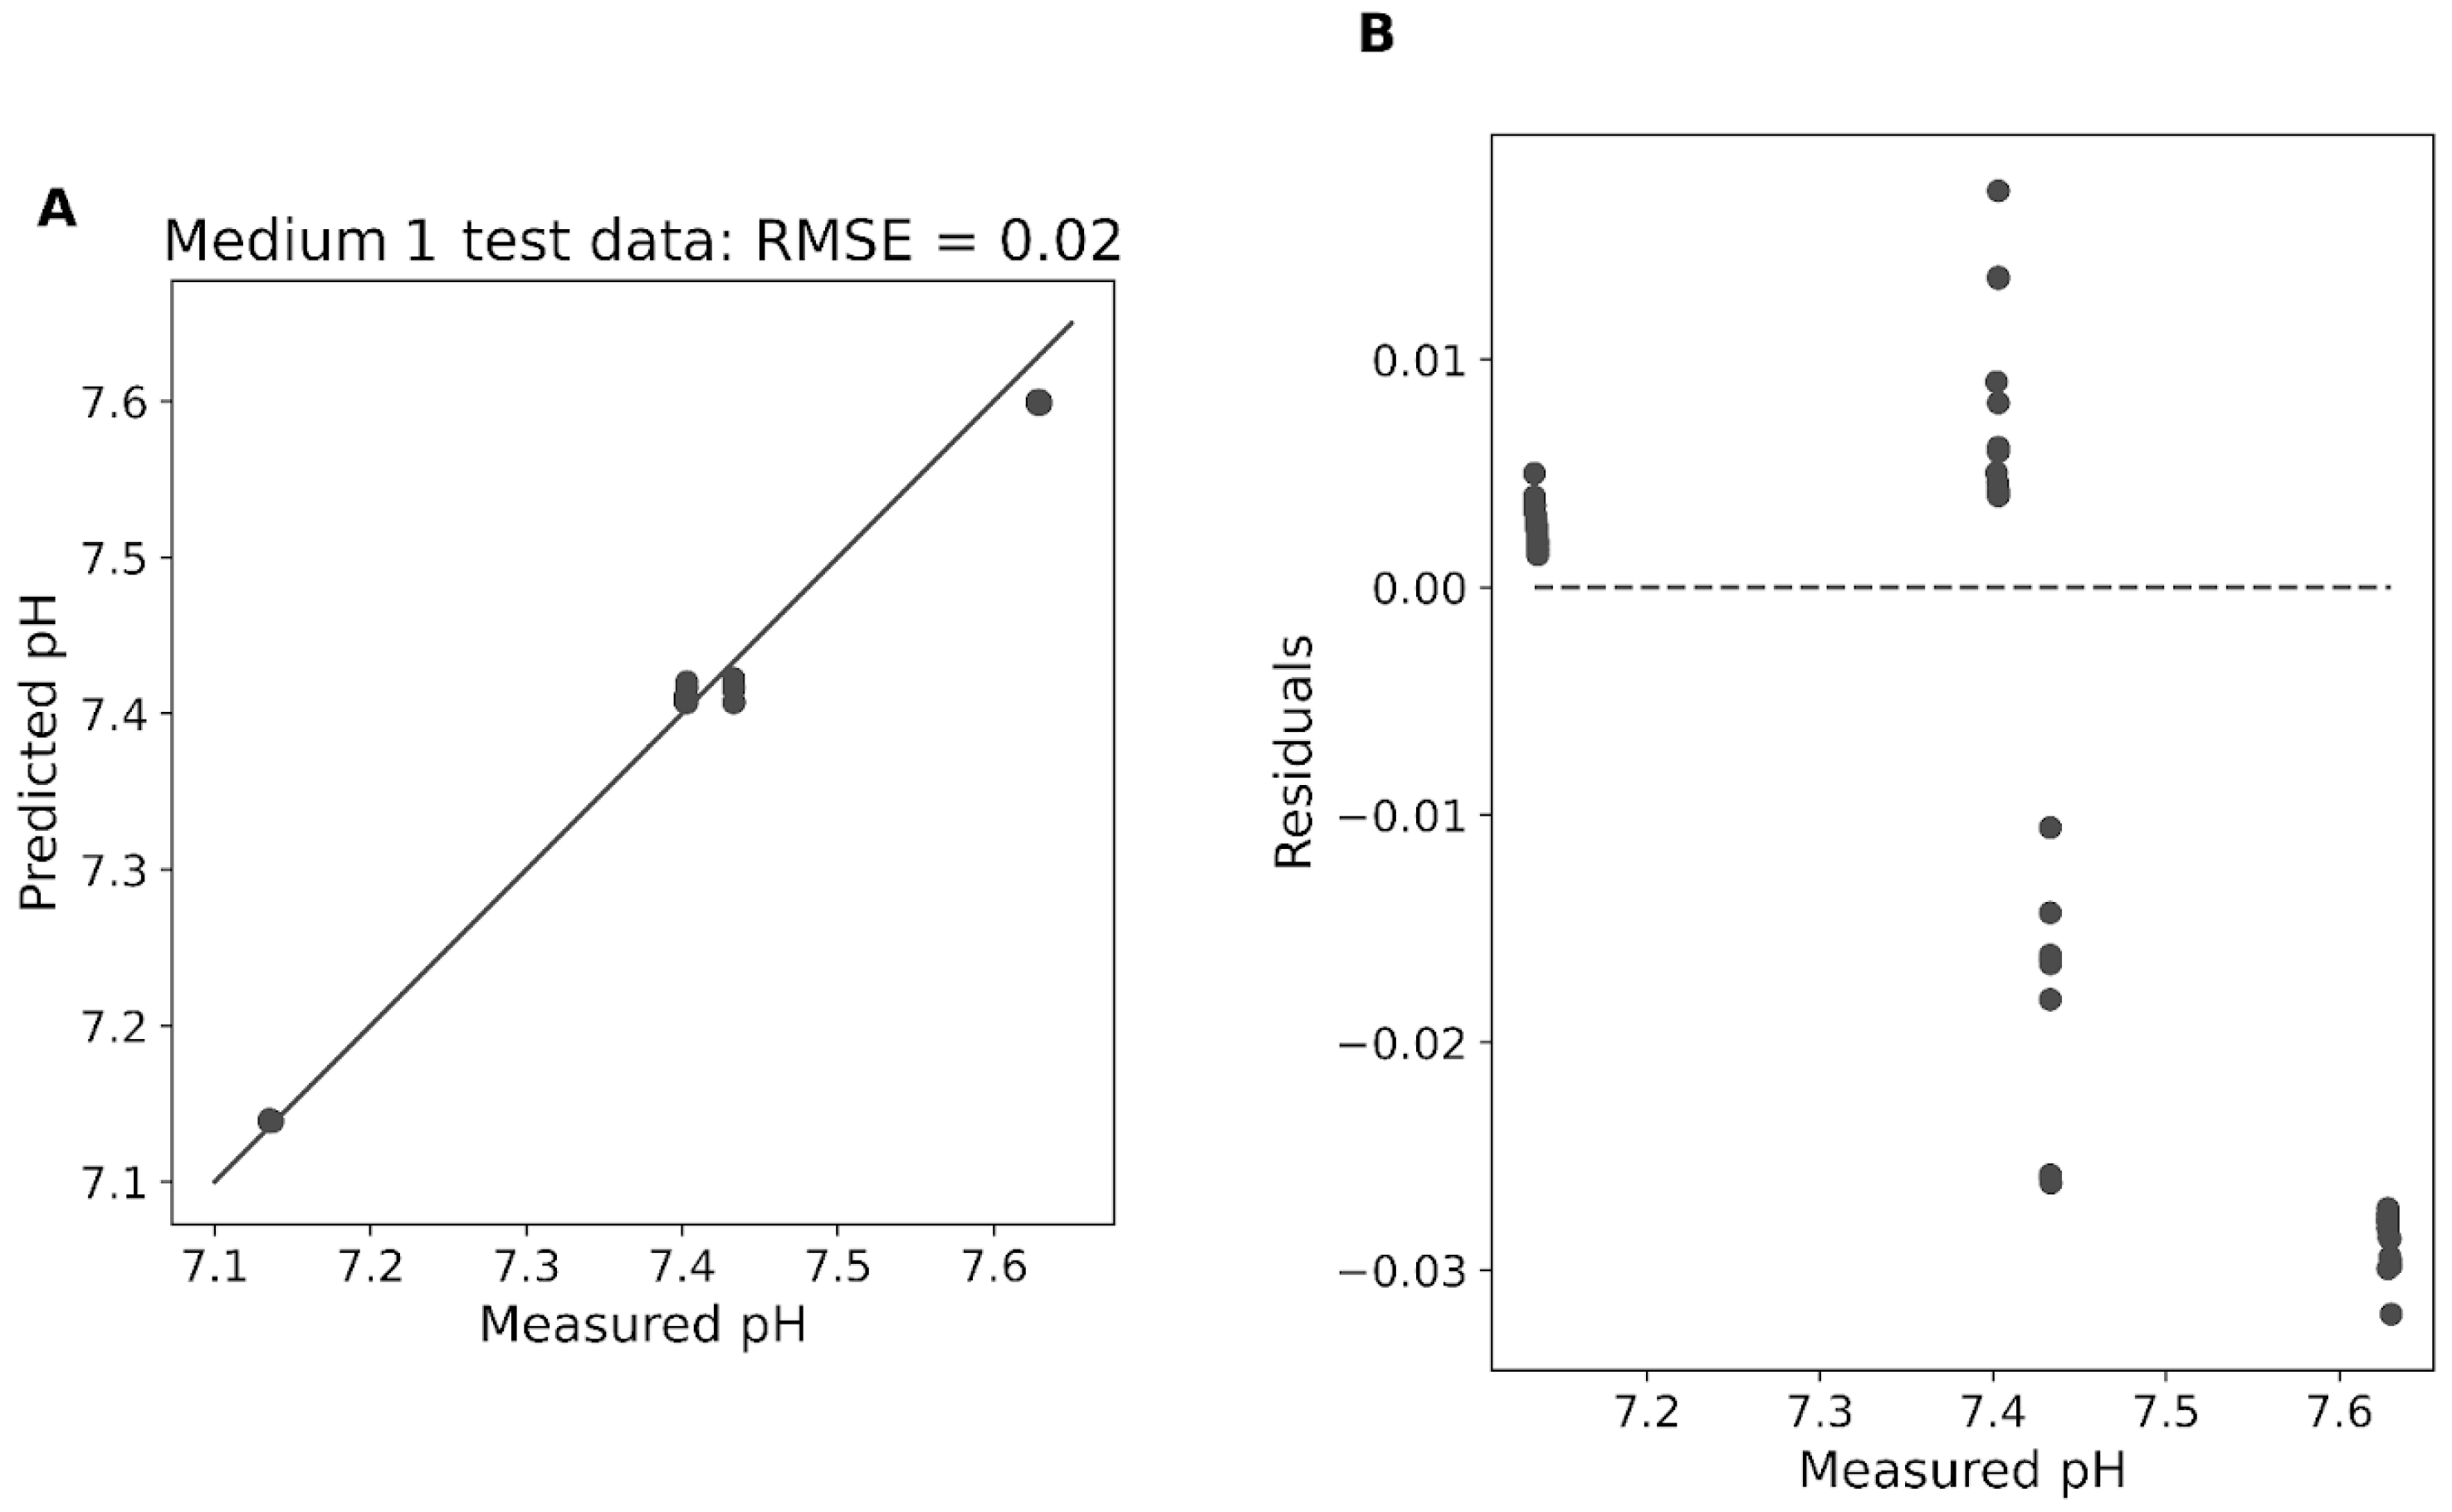
Given the strong relationship between CO2 and pH, we further trained a random forest algorithm to directly predict the pH from the Raman spectrum. The algorithm was trained on the training dataset of medium 1, and its performance was evaluated on the test dataset.
Figure 6 shows the predicted pH values versus the measured pH values for the test dataset of medium 1. The root mean squared error (RMSE) for the test data is 0.02 pH, indicating a high degree of accuracy in the pH predictions. Panel B illustrates the residuals of the predicted pH values versus the measured pH values for the test dataset of medium 1. The residuals, which represent the differences between the predicted and actual pH values, demonstrate deviations ranging between −0.014 and 0.035 pH.
The majority of the residuals are clustered around zero, indicating that the random forest model provides reliable pH predictions with minimal error. Results for medium 2 are in a similar range but not shown.
Comparing the results from
Figure 5A–F and
Figure 6, we observe that the logfit model based on predicted CO
2 concentrations (
Figure 5A–C) and the logfit model based on Dasgip
® CO
2 measurements (
Figure 5D–F) both provide comparable, highly accurate pH predictions with low RMSE values. The residuals in both cases are minimal, indicating reliable pH predictions.
The random forest algorithm (
Figure 6) also demonstrates a high degree of accuracy in directly predicting pH from the Raman spectrum, with an RMSE of 0.02 pH for the test dataset. The RMSE is highly comparable to the logfit models and the random forest model offers the advantage of directly predicting pH without the intermediate step of CO
2 concentration prediction. This direct approach simplifies the process and still maintains a high level of accuracy.
In the final step of our study, we employed a Raman submers probe (RXN-10 probe with bIO-Optic) to predict CO2 and pH directly within the fermentation medium. Raman spectroscopy is frequently utilized in bioprocessing to measure or control critical process parameters such as glucose, biomass, amino acids or biomass. Therefore, extending its application to CO2 (off-gas-based pH reference method) and pH measurement could be highly advantageous.
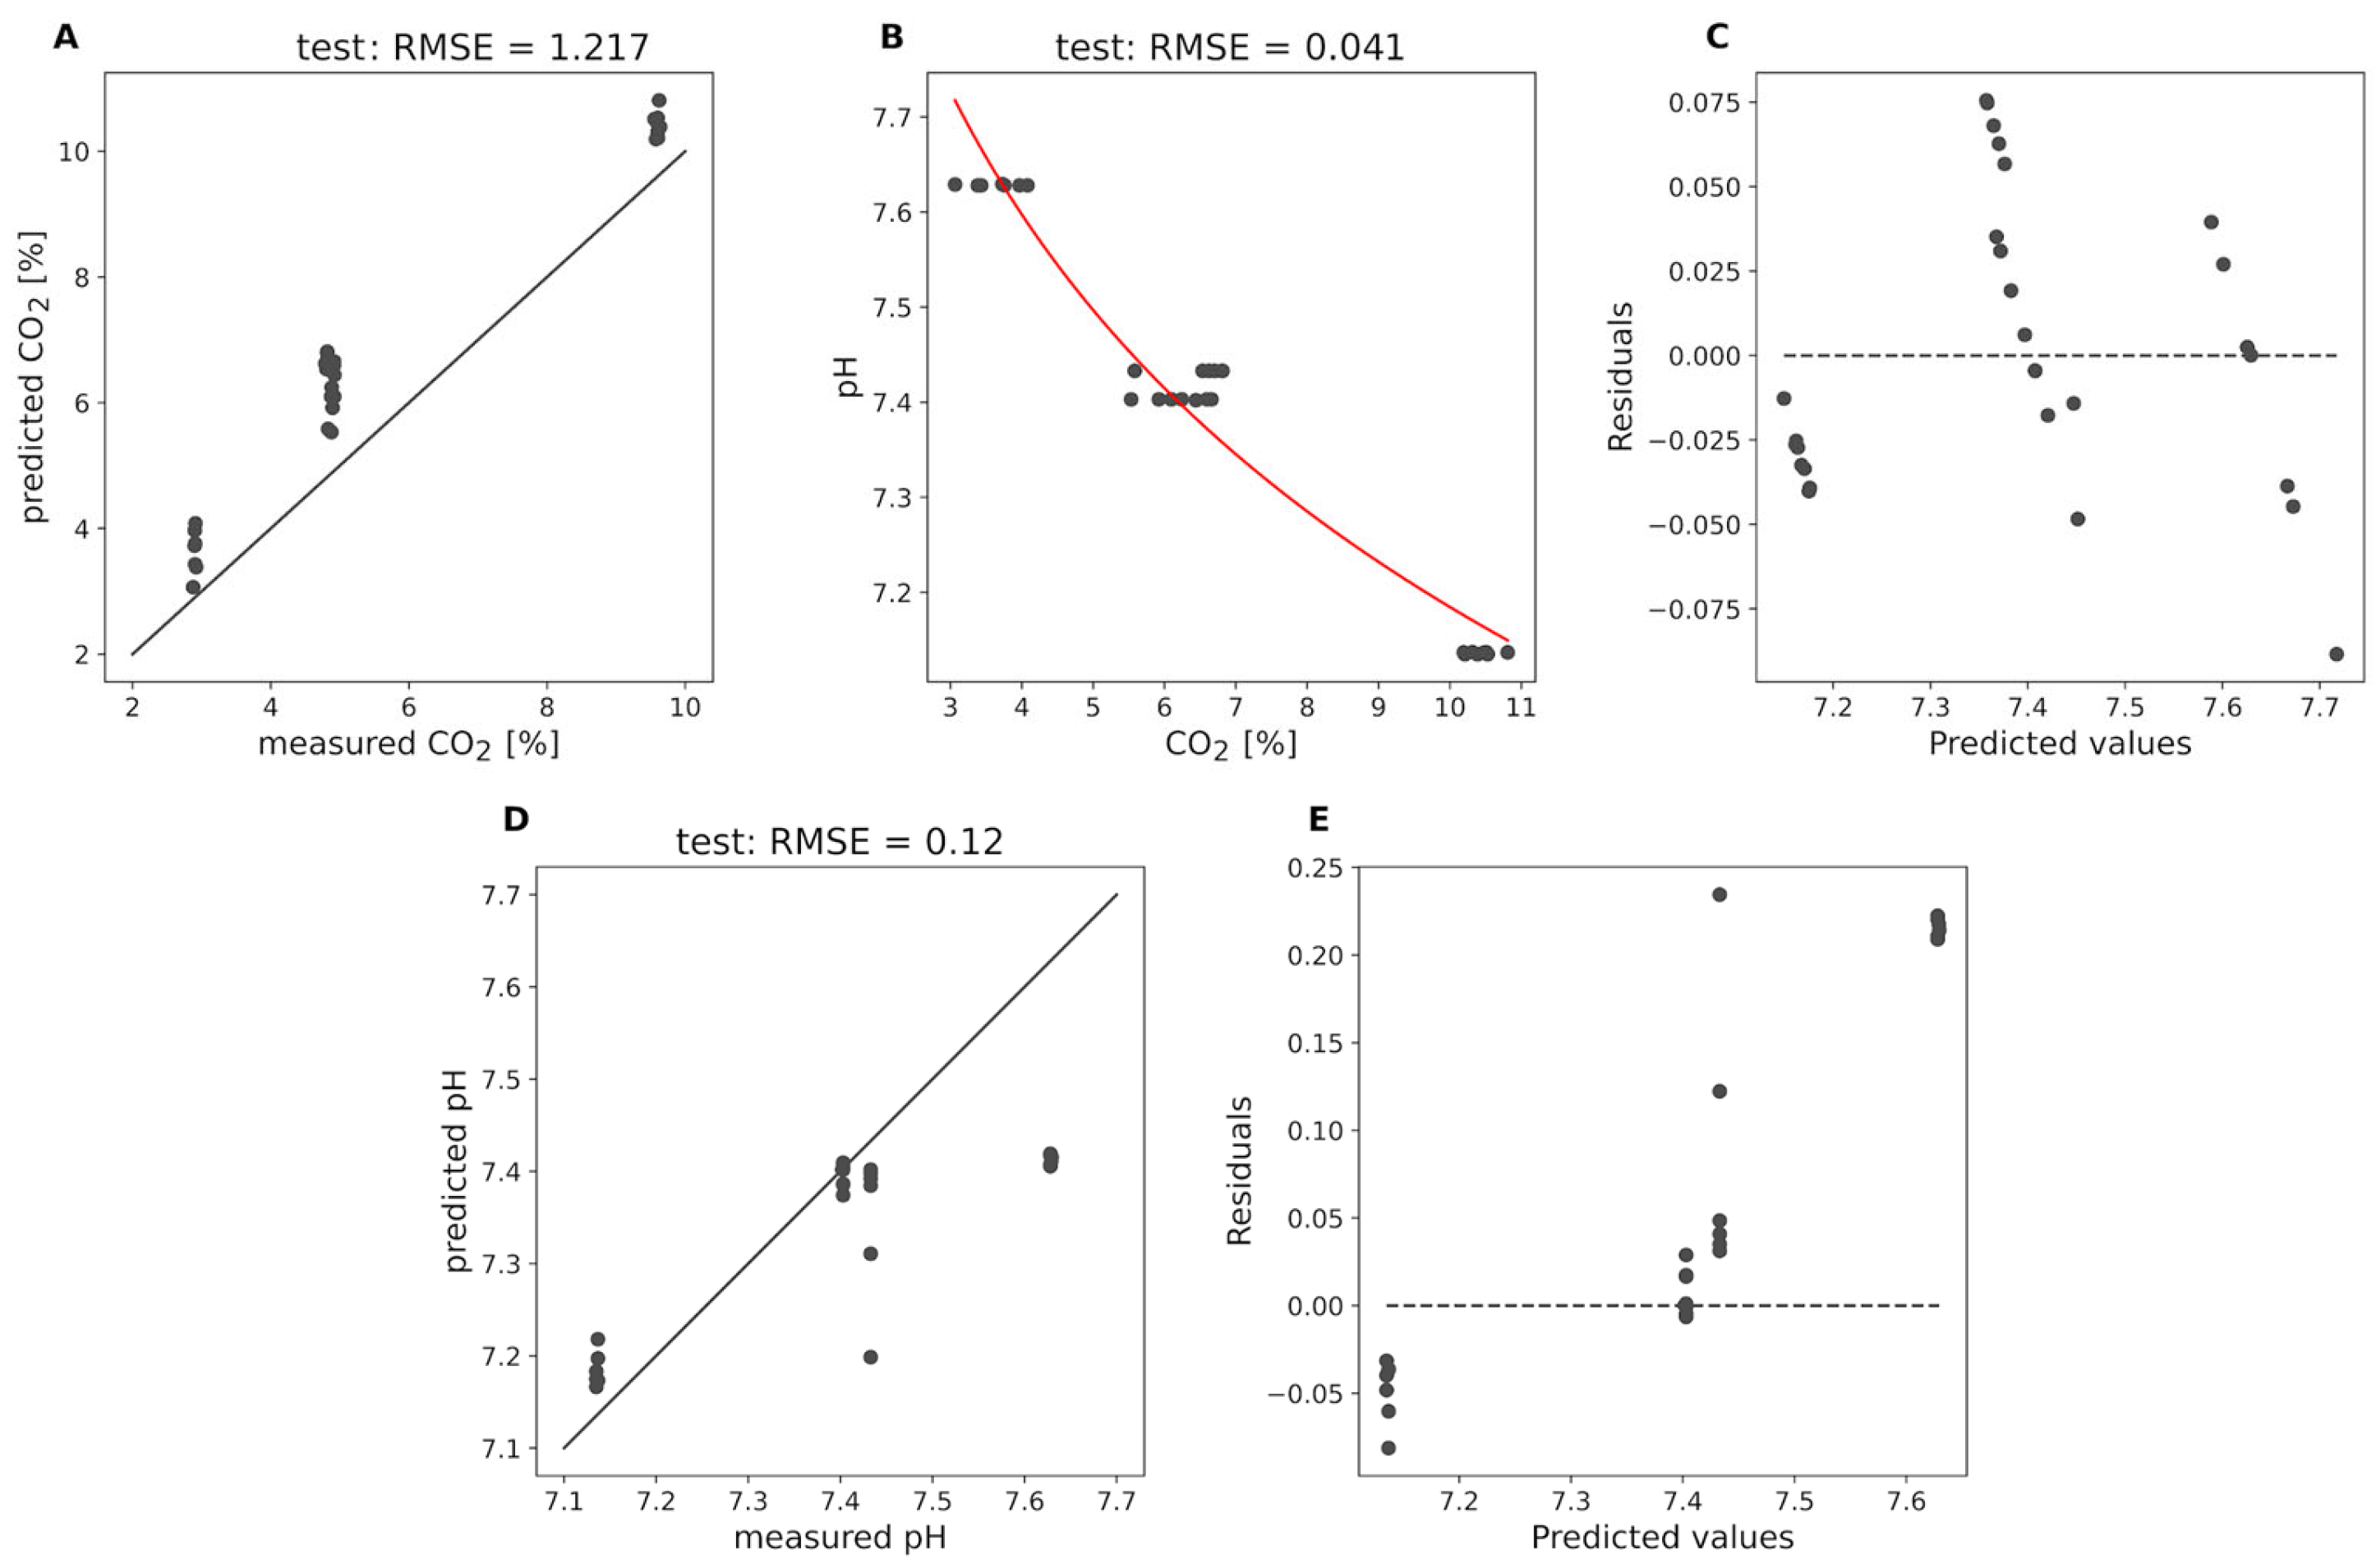
Figure 7 presents the results of these predictions for the test set of medium 1. Panel A shows the predicted CO
2 concentrations versus the measured CO
2 concentrations. The root mean squared error (RMSE) for the test data is 1.22%, indicating a moderate level of accuracy in the CO
2 predictions. The predicted CO
2 values are always above the diagonal line. This suggests that while the model captures the general trend, there is room for improvement in the accuracy of CO
2 predictions. Panel B illustrates the logfit of the predicted CO
2 concentrations to the pH values for the test dataset of medium 1, with an RMSE of 0.041%. The red curve represents the logarithmic fit, and the scatter of points around this curve indicates the deviations between the predicted and actual pH values. Panel C shows the residuals of the predicted pH values versus the actual pH values for the test dataset, demonstrating deviations ranging between approximately −0.088 and 0.076 pH from the true values. The residuals are relatively dispersed, indicating that the logfit model’s performance in predicting pH from CO
2 concentrations within the medium is less accurate compared to the off-gas stream predictions. Panels D and E present the results of direct pH prediction using the Raman submers probe. Panel D shows the predicted pH values versus the measured pH values for the test dataset, with an RMSE of 0.12 pH.
The points are clustered around the diagonal line, but especially for higher pH values, the predictions are far too low. This can also be seen by the residuals in Panel E. Panel E illustrates the residuals of the predicted pH values versus the measured pH values, with deviations ranging between −0.081 and 0.234 pH. The residuals are more dispersed compared to the off-gas stream predictions, indicating a higher degree of error in the direct pH predictions within the medium.
Compared to the model performance in the off-gas stream, the performance of the Raman submers probe in predicting CO2 and pH within the medium is significantly worse. For CO2, we did not have a pretrained model, which might explain the lower accuracy. It is possible that with further training and optimization, the performance of the Raman submers probe could be improved. However, it remains uncertain whether it can reach the high level of accuracy observed in the off-gas stream predictions. In addition to the lack of a pretrained model, several other factors may contribute to the lower predictive performance of the Raman submers probe. The complex and variable composition of the fermentation broth can introduce spectral interferences and overlapping signals, making it more challenging to accurately quantify target analytes such as CO2 and pH. Furthermore, the presence of suspended solids, cells and other particulates in the broth can lead to increased light scattering and baseline distortions in the Raman spectra, further complicating the analysis. In contrast, the off-gas stream contains fewer and less complex components—primarily CO2, O2 and N2—with well-separated spectral peaks and minimal background effects. This absence of strong overlapping signals and baseline distortions in the off-gas stream likely contributes to the superior model performance observed in that setting.
4. Conclusions and Outlook
The results of this study demonstrate the potential of Raman spectroscopy for real-time CO2 measurement and pH prediction in bioreactor off-gas streams. The pretrained CO2 prediction model showed high accuracy and robustness across different media, and the subsequent pH predictions using a logarithmic fit model were reliable and comparable to those obtained using the gold-standard Dasgip® CO2 measurements. Additionally, the random forest algorithm provided a direct and accurate method for pH prediction from the Raman spectrum, simplifying the process by eliminating the intermediate step of CO2 concentration prediction.
However, the performance of the Raman submers probe for direct CO2 and pH prediction within the fermentation medium was less accurate compared to the off-gas stream predictions. This suggests that further optimization and training of the model are necessary to improve its accuracy within the medium. Future work should focus on enhancing the performance of the Raman submers probe, potentially by incorporating additional training data and refining the model parameters. This could help determine whether the Raman submers probe is fundamentally suitable for CO2 and pH prediction or whether its reduced performance is primarily due to the complex composition or the optical properties of the fermentation broth, which introduce spectral interferences, overlapping signals and baseline distortions that are not present in the off-gas stream. Moreover, the use of a Raman off-gas probe can offer further potential advantages such as the capability for multi-component analysis, which allows for the simultaneous detection as well as quantification of various gasses or volatile metabolites. This feature, coupled with the non-invasive and non-destructive nature of the Raman technology, could significantly enhance bioprocessing capabilities and contribute to the development of more efficient and reliable biomanufacturing processes.
In conclusion, while the current study highlights the effectiveness of Raman spectroscopy for CO2 and pH monitoring in off-gas streams, further research is needed to achieve similar accuracy within the fermentation medium.


