Article

Enhancement of Lipid Production in Rhodosporidium toruloides: Designing Feeding Strategies Through Dynamic Flux Balance Analysis

by
María Teresita Castañeda
*,
Sebastián Nuñez
,
Martín Jamilis
and
Hernán De Battista
Grupo de Control Aplicado (GCA), Instituto LEICI, UNLP-CONICET, Facultad de Ingeniería, Universidad Nacional de La Plata, La Plata 190, Buenos Aires, Argentina
*
Author to whom correspondence should be addressed.
Fermentation 2025, 11(6), 354; https://doi.org/10.3390/fermentation11060354
Submission received: 15 May 2025 / Revised: 16 June 2025 / Accepted: 16 June 2025 / Published: 18 June 2025

Abstract

Fed-batch cultivation is a widely used strategy for microbial lipid production, offering flexibility in nutrient control and the potential for high lipid productivity. However, optimizing feeding strategies remains a complex challenge, as it depends on multiple factors, including strain-specific metabolism and process limitations. In this study, we developed a computational framework based on dynamic flux balance analysis and small-scale metabolic models to evaluate and optimize lipid production in Rhodosporidium toruloides strains. We proposed equations to estimate both the carbon and energy source mass feed rate ( F i n · s r ) and its concentration in the feed ( s r ) based on lipid accumulation targets, and defined minimum feeding flow rate ( F i n ) according to process duration. We then assessed the impact of these parameters on commonly used bioprocess metrics—lipid yield, titer, productivity, and intracellular accumulation—across wild-type and engineered strains. Our results showed that the selection of F i n · s r was strongly strain-dependent and significantly influenced strain performance. Moreover, for a given F i n · s r , the specific values of s r , and the resulting F i n , had distinct and non-equivalent effects on performance metrics. This methodology enables the rational pre-selection of feeding strategies and strains, improving resource efficiency and reducing the probability of failed experiments.

1. Introduction

Microbial oils, also known as single cell oils (SCO), are lipids obtained through biotechnological processes involving the cultivation of oleaginous microorganisms (e.g., yeasts, bacteria, and algae). These microorganisms are capable of accumulating more than 20% of their dry cell weight as lipids, mainly in the form of triacylglycerols (TAG) [1], making them promising microbial platforms for the sustainable production of oleochemicals and biofuels [2]. Compared to conventional lipid feedstocks, microbial oils offer several techno-economic and environmental advantages. They can be synthesized from a wide range of renewable carbon sources, including agroindustrial wastes, without competing with food production or requiring arable land [3]. Furthermore, oleaginous microorganisms exhibit rapid growth kinetics, allowing significantly shorter production cycles than traditional oilseed crops [3]. Their cultivation is not constrained by climatic or geographic factors, requires fewer unit operations, and is highly compatible with industrial-scale bioprocessing [4,5]. These characteristics contribute to greater process efficiency and lower overall environmental impact. Notably, life cycle assessment (LCA) studies have shown that microbial lipids tend to exhibit a smaller carbon footprint than plant-derived oils, underscoring their potential as a more sustainable alternative for biodiesel and oleochemical production [3].
Among oleaginous yeasts, Rhodosporidium toruloides is a highly promising candidate for industrial lipid production due to its excellent lipid biosynthetic performance in terms of content, yield, and productivity [5]. It can accumulate substantial amounts of TAGs while co-producing valuable carotenoids such as torularhodin and β -carotene [6]. It exhibits a broad substrate range, including lignocellulosic hydrolysates, and shows strong tolerance to common biomass-derived inhibitors, making it particularly suitable for biorefinery applications [7]. These characteristics, together with its metabolic flexibility [8] and suitability for metabolic engineering [9], reinforce the potential of R. toruloides as a robust microbial chassis for the sustainable production of lipid-based bioproducts.
De novo lipogenesis in wild-type (WT) R. toruloides is triggered under conditions of excess carbon and the limitation of a growth-essential nutrient (usually nitrogen) [1]. As a metabolic response to this nutrient imbalance, cells redirect excess carbon flux toward lipid biosynthesis [2]. To improve lipid accumulation in R. toruloides, both cultivation-based and metabolic engineering strategies have been explored. From a cultivation standpoint, the two-stage bioprocess (TSB) has demonstrated high efficiency and scalability for lipid production [10]. This approach decouples biomass formation and lipid biosynthesis by sequentially applying nutrient-rich conditions to promote cell growth in the first stage, followed by nitrogen-limited and carbon-rich conditions in the second stage to induce lipid accumulation [6]. Alternatively, recent advances in genome annotation and metabolic modeling have expanded the potential of R. toruloides as a robust platform for synthetic biology [9]. Metabolic engineering strategies aim to redirect carbon flux toward lipid synthesis through rational genetic modifications. These include the overexpression of key biosynthetic genes and the deletion of genes associated with competing pathways [11]. In particular, growth-coupled production strategies have been developed in which lipid synthesis is intrinsically linked to cell growth. This is typically implemented through targeted knockouts that rewire metabolism to favor lipid accumulation in a one-stage bioprocess (OSB) [12].
In our previous work [13], we conducted an in silico assessment of lipid production by Rhodosporidium toruloides under batch cultivation, comparing the conventional TSB using the WT strain with a OSB applied to four genetically engineered strains obtained through targeted gene knockouts. Using a small scale metabolic model [14] and dynamic flux balance [15] analysis, we evaluated key bioprocess performance indicators across a range of initial carbon-to-nitrogen (C/N) ratios and a Global Lipid Efficiency Metric (GLEM) was proposed to integrate these indicators and enable comprehensive comparison across different conditions.
Although batch cultivation remains a widely used and straightforward approach, particularly for preliminary screening studies, it is often limited by substrate inhibition, nutrient depletion, and the accumulation of inhibitory by-products, which can affect both growth and lipid accumulation in oleaginous yeasts [6,10]. Batch cultivation, as a closed system, restricts dynamic process control since all reactants (cells and substrates) are introduced initially, with no external modulation during the course of fermentation [10]. In contrast, fed-batch cultivation mode has been widely adopted in industrial bioprocessing due to its capacity to modulate substrate availability through controlled feeding strategies, thereby minimizing substrate-induced metabolic inhibition and enabling high-cell-density culture systems [16]. Additionally, fed-batch systems support an extended lipid accumulation phase by maintaining optimal nutrient supply, while retaining the operational simplicity of batch processes [6,16]. Overall, fed-batch fermentation has demonstrated superior performance in terms of lipid yield, titer, productivity, and process scalability, reinforcing its role as a benchmark in microbial lipid bioprocessing [3,6,10,17].
The optimization of substrate feeding strategies in fed-batch cultivation is critical for enhancing the metabolic efficiency of oleaginous yeasts such as R. toruloides. The substrate concentration in the feed ( s r ) directly impacts key fermentation parameters, including nutrient utilization efficiency and lipid yield [17]. Additionally, variations in the feeding rate ( F i n ) influence the reactor’s volume dynamics, which in turn affect the concentrations of all bioreactor components and ultimately impact productivity [17]. Despite the relevance of these factors, few studies have systematically evaluated the effects of different substrate mass feed rate ( F i n · s r ) on lipid production in fed-batch systems [10]. Given the complex metabolic shifts that occur under dynamic conditions, computational approaches such as dynamic flux balance analysis (DFBA) are essential for predicting optimal feeding profiles. These models enable the simulation of substrate-limited environments, identification of key metabolic trade-offs, and rational bioprocess design tailored to strain-specific metabolic capabilities.
In this work, fed-batch cultivation strategies for SCO production were systematically evaluated in R. toruloides WT and knockout strains through in silico simulations. A small-scale stoichiometric metabolic model was employed in conjunction with DFBA to optimize substrate-limited feeding profiles and assess their impact on lipid biosynthesis performance. The approach aimed to identify strain-specific feeding regimes that maximize lipid production under fed-batch conditions relevant for industrial application and scale-up.

2. Materials and Methods

2.1. Metabolic Model for Lipid Production in Rhodosporidium toruloides

For the in silico analysis of different strains under fed-batch cultivation, a small-scale metabolic model for SCO production in R. toruloides was employed [14]. With 93 metabolites, 104 reactions, and 116 genes, the model is designed to support the assimilation of four carbon and energy sources (CES): glucose, glycerol, xylose, and arabinose. The model encompasses key central metabolic pathways (glycolysis, the pentose phosphate pathway, the tricarboxylic acid (TCA) cycle, the glyoxylate cycle, central nitrogen metabolism, and oxidative phosphorylation) distributed across cytosolic and mitochondrial compartments.
Biomass synthesis is represented by a pseudo-reaction termed Biomass-Eqn, which includes all the metabolic precursors required for biomass biosynthesis, as well as the energy (ATP) and reducing power (NADPH) needed for anabolic processes. Since the biomass composition is assumed constant in this model, Biomass-Eqn represents the synthesis of residual biomass (x), i.e., biomass that only includes structural lipids and excludes microbial lipids. To incorporate de novo SCO production, the model includes tripalmitin as a representative triglyceride. Its biosynthesis is modeled in two stages: (i) fatty acid biosynthesis reactions leading to palmitate (C16), and (ii) esterification of fatty acids with glycerol-3-phosphate to yield tripalmitin (C51). The net production of x and SCO is captured through two exchange reactions, GrowthEx and TAGEx, respectively. These exchange reactions, along with those for nutrient uptake and by-product secretion, correspond to specific consumption or production rates ( q i ), except for the specific growth rate ( μ ).
Non-growth-associated maintenance energy (NGAM) is represented by the reaction ATPM, which accounts for the ATP hydrolysis required for cellular maintenance functions. Its value was estimated based on continuous culture data using glucose as the sole CES [18].

2.2. Designed Strains for Growth-Couple Lipid Production in R. toruloides

In a previous study [19], four R. toruloides strains were rationally designed using the OptKnock algorithm [20] to enhance lipid production with glucose as the sole CES. The OptKnock algorithm was formulated as a bilevel optimization problem, where TAG production was maximized subject to the maximization of biomass formation and additional constraints: a maximum glucose uptake rate of 3 mmol/g h, a minimum specific growth rate of 0.06 h−1, and a lower bound for ATPM reaction of 0.422 mmol/g h. Each strain carried an increasing number of gene deletions: KO (single knockout), DKO (double knockout), TKO (triple knockout), and QKO (quadruple knockout). In these engineered strains, metabolic flux through the lipid biosynthetic pathway is mandatory for optimal growth, thus enforcing a growth-coupled lipogenesis phenotype. For the purposes of this work, only the KO and DKO strains were selected for further analysis, as they displayed distinct behaviors in batch cultivation [13], while no significant improvements in overall efficiency were observed beyond the two-gene knockout strategy. In the KO strain, the deletion of the Glucose-6-phosphate isomerase (PGI1) gene forces all assimilated glucose to be processed through the pentose phosphate pathway. This increases NADPH production, which is then used for fatty acid biosynthesis and triacylglycerol (TAG) formation. In the DKO strain, in addition to PGI1, the NADPH–Glutamate dehydrogenase (GDH1) gene is also deleted. This further increases NADPH availability for TAG production, as GDH1 typically uses NADPH to synthesize glutamate from 2-oxoglutarate and ammonium during nitrogen assimilation. Figures S1–S3 in Supplementary Information show metabolic maps for the WT, KO and DKO strains, respectively. Metabolic maps were constructed using the Escher visualization tool [21].

2.3. Simulation of Lipid Production by R. toruloides During Fed-Batch Cultivation Using DFBA

2.3.1. DFBA Implementation

DFBA was employed for the in silico assessment of lipid production in R. toruloides WT and designed strains (KO and DKO) during fed-batch cultivation. DFBA is an extension of Flux Balance Analysis (FBA), a constraint-based method for predicting steady-state metabolic flux distributions [22]. DFBA incorporates dynamic changes in the extracellular environment, allowing the simulation of time-dependent behavior and the prediction of substrate, biomass, and product concentration profiles in bioreactors [15]. To implement DFBA, the Dynamic Flux Balance Analysis laboratory (DFBAlab) toolbox [23] was used. This toolbox combines linear programming feasibility analysis with lexicographic optimization, enabling the identification of consistent and uniquely optimal solutions. All optimizations were performed using Gurobi Optimizer version 12 (Beaverton, OR, USA), under an academic license [24].
To simulate extracellular dynamics within the DFBAlab framework, a system of differential equations was defined to describe the time evolution of culture volume, biomass, and concentrations of substrates and products:
V ˙ = F i n F o u t
x ˙ = μ · x F i n V · x
c ˙ = v c · x + F i n V · ( c r c ) + M T c
In this formulation, V is the total volume of culture medium and F i n and F o u t correspond to the feeding and harvesting flow rates, respectively. Under fed-batch cultivation, no medium is removed ( F o u t = 0 ), and minor changes in volume due to operational interventions (e.g., sampling and antifoam addition) were considered insignificant. The variable x refers to the concentration of residual biomass, which includes only the structural components of the yeast cells (excluding storage lipids), while the term μ denotes the specific growth rate. The vector c comprises concentrations of key compounds in culture medium such as glucose (s), ammonia (n), and triacylglycerols (l), and c r are the concentration of substrates in the feed reservoir. Finally, v c represents the specific uptake or secretion flux of each metabolite. The mass transfer term M T c refers to the gas–liquid mass transfer rate, which was assumed to be zero for the compounds considered. Therefore, metabolite dynamics were governed mainly by metabolic activity and dilution due to feed flow.
DFBAlab computes μ and v c at each time step by solving a modified FBA problem that applies lexicographic optimization to ensure solution uniqueness. The optimization problem was defined as follows:
max or min Z subject to S · v = 0 v l b < v < v u b
where v is the vector of metabolic reaction fluxes, S is the stoichiometric matrix, and Z is the objective function. The selection and prioritization of objective functions were guided by established regulatory principles in oleaginous yeasts [1]. The hierarchy prioritized biomass production during nutrient-rich phases, followed by glucose and ammonia uptake to meet metabolic demands. Lipid accumulation, typically triggered under nitrogen-limiting conditions, was incorporated as the final objective. Accordingly, the sequential objective functions were defined as the maximization of (1) biomass synthesis, (2) glucose uptake, (3) ammonia uptake, and (4) lipid production.
The lower and upper bounds ( v l b and v u b ) in Equation (4) restrict fluxes according to physiological and kinetic constraints. Flux constraints for substrate uptake were modeled using Monod-type kinetics:
v c l b ( c ) = v c , max · c K c + c for c = s , n
where v c , max is the maximum uptake rate and K c is the half-saturation constant for each substrate. Although lipids accumulate intracellularly, for modeling purposes they were treated as if excreted by the cell. However, in agreement with experimental findings, lipid production decreases as intracellular content approaches a critical threshold. This effect was represented through a saturation-based constraint [13].
v l u b ( l ) = v l , max · 1 f l f l , max β
where f l is the lipid-to-residual biomass ratio, f l , max is its maximum permissible value, and β modulates the sharpness of the saturation response.

2.3.2. Simulation of the Batch Phase

The overall process was modeled as consisting of two main stages: a batch phase and a feeding phase. For batch-phase simulations, a minimal medium for yeast growth was defined, with glucose as the sole CES and ammonia as the nitrogen source (NS). At the beginning of the batch phase, the simulation was initialized using the nutrient concentrations specified in the culture medium formulation and allowed to evolve without external intervention. In this study, a carbon-limited batch condition was simulated to promote biomass production during this phase and to trigger lipogenesis in the subsequent feeding phase, thus establishing a TSB strategy for microbial lipid production. To suppress biomass formation during the latter phase, the amount of nitrogen source was stoichiometrically calculated based on the empirical formula of residual biomass and the biomass-to-CES yield, ensuring its depletion immediately after CES exhaustion at the end of the batch phase. In all cases, the batch phase was considered complete, and feeding was initiated in the simulation, once the CES concentration fell below the detection limit of enzymatic colorimetric assays commonly used for glucose quantification.

2.3.3. Design of Feeding Strategies

The design of the feeding strategy is a critical aspect of fed-batch processes aimed at lipid production. The substrate feed rate must be carefully adjusted to match the maximum specific uptake capacity of the microbial strain, ensuring efficient redirection of carbon flux toward lipid biosynthesis while preventing substrate accumulation and potential inhibitory effects.
The feeding phase was simulated following the batch phase, starting immediately after CES depletion. During this stage, glucose (CES) was supplied using a constant rate strategy, chosen for its simplicity of implementation and because no significant improvement in lipid productivity has been reported with more complex strategies such as exponential feeding [10]. To design the feeding strategy, i.e., to define the feed flow rate ( F i n ) and the glucose concentration in the reservoir ( s r ), the maximum mass feed rate ( ( F i n · s r ) m a x ) was calculated. To this end, Equation (3) was applied to glucose:
s ˙ = v s · x + F i n V · ( s r s )
For the design of the feeding strategy, it was assumed that the glucose input rate equals the consumption rate ( s ˙ = 0 ). Furthermore, the glucose concentration in the culture medium (s) was considered negligible compared to s r . Under these assumptions, Equation (7) was used to derive the following expression:
F i n · s r = v s · x · V
At this stage of the cultivation, since the nitrogen source in the medium is nearly depleted and no additional NS is supplied through feeding, the glucose provided can be directed toward two main purposes: (i) lipid synthesis and (ii) ATP production for NGAM requirements. These possible allocations of the CES were described using the Pirt equation [25], by replacing the specific substrate consumption rate ( v s ) in Equation (8). Then, ( F i n · s r ) m a x can be calculated as follows:
( F i n · s r ) m a x = v l , 0 y l / s + m s · x b · V b
Here, y l / s denotes the theoretical lipid yield in the absence of cellular maintenance, estimated by FBA using the metabolic model and the COBRA toolbox [26], and m s represents the maintenance coefficient. The specific rate of lipid production at the end of the batch phase ( v l , 0 ) was calculated using Equation (6), based on the concentrations of lipids and biomass obtained during this phase. The product ( x b · V b ) corresponds to the total biomass in the culture medium at the end of the batch phase, which remains constant throughout the cultivation, as no cell growth occurs during the feeding phase. It can be inferred from Equation (9) that the minimum F i n · s r is achieved when the mass feed rate of glucose is only sufficient to fulfill non-growth-associated maintenance requirements (Equation (10)).
( F i n · s r ) m i n = m s · x b · V b
Within the range in which F i n · s r may vary, there are many combinations of F i n and s r that can be used. To further constrain the problem, a feasible range for the glucose concentration in the reservoir was defined. For this purpose, the lipid yield on glucose during the feeding phase, given by Equation (11), was used.
y l / s , f = l f · V f l b · V b s r · ( V f V b )
where l b and l f denote the concentrations of microbial lipids at the end of the batch and feeding phases, respectively. V b represents the culture volume of the batch phase, while V f corresponds to the final culture volume after the feeding phase. The value of y l / s , f can be calculated during the feeding phase using FBA, by setting the lipid production reaction as the objective function. According to Equation (11), the maximum value of s r corresponds to the condition in which the lipid-to-residual biomass ratio reaches its highest possible value ( f l , m a x ). This occurs when the lipid content reaches a 76% lipid content, which is the maximum reported in the literature [27]. Then, by replacing l f · V f , s r , m a x resulted in
s r , m a x = f l , m a x · x b · V b l b · V b y l / s , f · ( V f V b )
In contrast, the minimum s r value depends on the lipid content achieved at the end of the batch phase. If this value is below 20%, the threshold commonly used to define an oleaginous strain, then the minimum s r must ensure that at least this lipid content is reached at the end of the feeding phase (Equation (13)). If the lipid content after the batch phase is already above 20%, the proposed minimum s r should be sufficient to maintain the lipid concentration reached during the batch phase throughout the feeding phase (Equation (14)).
s r , m i n = f l , m i n · x b · V b l b · V b y l / s , f · ( V f V b ) for f l < f l , m i n
s r , m i n = l b · V f l b · V b y l / s , f · ( V f V b ) for f l > f l , m i n
The parameters used in the DFBA simulations are shown in Table 1. Most values were obtained from literature sources, while some correspond to initial conditions commonly used in laboratory-scale bioreactors of 5 L capacity.

2.4. Bioprocess Efficiency Metrics

To comprehensively evaluate bioprocess performance under the simulated conditions, a set of efficiency metrics was selected based on their relevance to microbial lipid production. Lipid productivity (Equation (15)) and biomass productivity (Equation (16)) were employed to quantify the rates of lipid and biomass generation, which are key indicators for assessing the industrial feasibility of microbial oil production. These metrics were calculated as the concentration of lipids or biomass produced over the total cultivation time.
P l = l f l 0 t f t 0
P x = ( x f x 0 ) t f t 0
In addition, lipid titer (Equation (17)) and lipid content (Equation (18)) were included to provide insight into the overall lipid accumulation in the culture and the oleaginous potential of the strain under the simulated conditions. Lipid titer refers to the final lipid concentration achieved during the fed-batch cultivation, while lipid content represents the proportion of lipids relative to the total biomass, expressed as a percentage.
T l = l f
% TAG = l f x f + l f · 100
Finally, lipid yield on substrate (Equation (19)) was used to assess the efficiency of CES conversion into lipids, while carbon utilization efficiency (Equation (20)) quantified the fraction of supplied carbon that was effectively assimilated by the cells. The lipid yield was calculated as the ratio of total lipid produced to the amount of glucose consumed during both the batch and feeding phases. Carbon utilization efficiency (CUE) was determined as the ratio between the amount of glucose consumed by the cells and the total amount of glucose supplied during the entire cultivation process, thus reflecting potential substrate losses due to overfeeding or incomplete utilization.
y l / s = l f · V f l 0 · V f ( s 0 , l s b ) · V 0 + s r · ( V f V 0 ) s f · V f
C U E = ( s 0 s b ) · V 0 + s r · ( V f V 0 ) s f · V f s 0 · V 0 + s r · ( V f V 0 )
It is important to note that, since the WT strain does not produce lipids during the batch phase, the value of s 0 , l , defined as the glucose concentration at the onset of lipogenesis, was used in Equation (19). This adjustment allows for a fairer comparison with the designed strains, in which lipid production begins earlier in the process.

3. Results

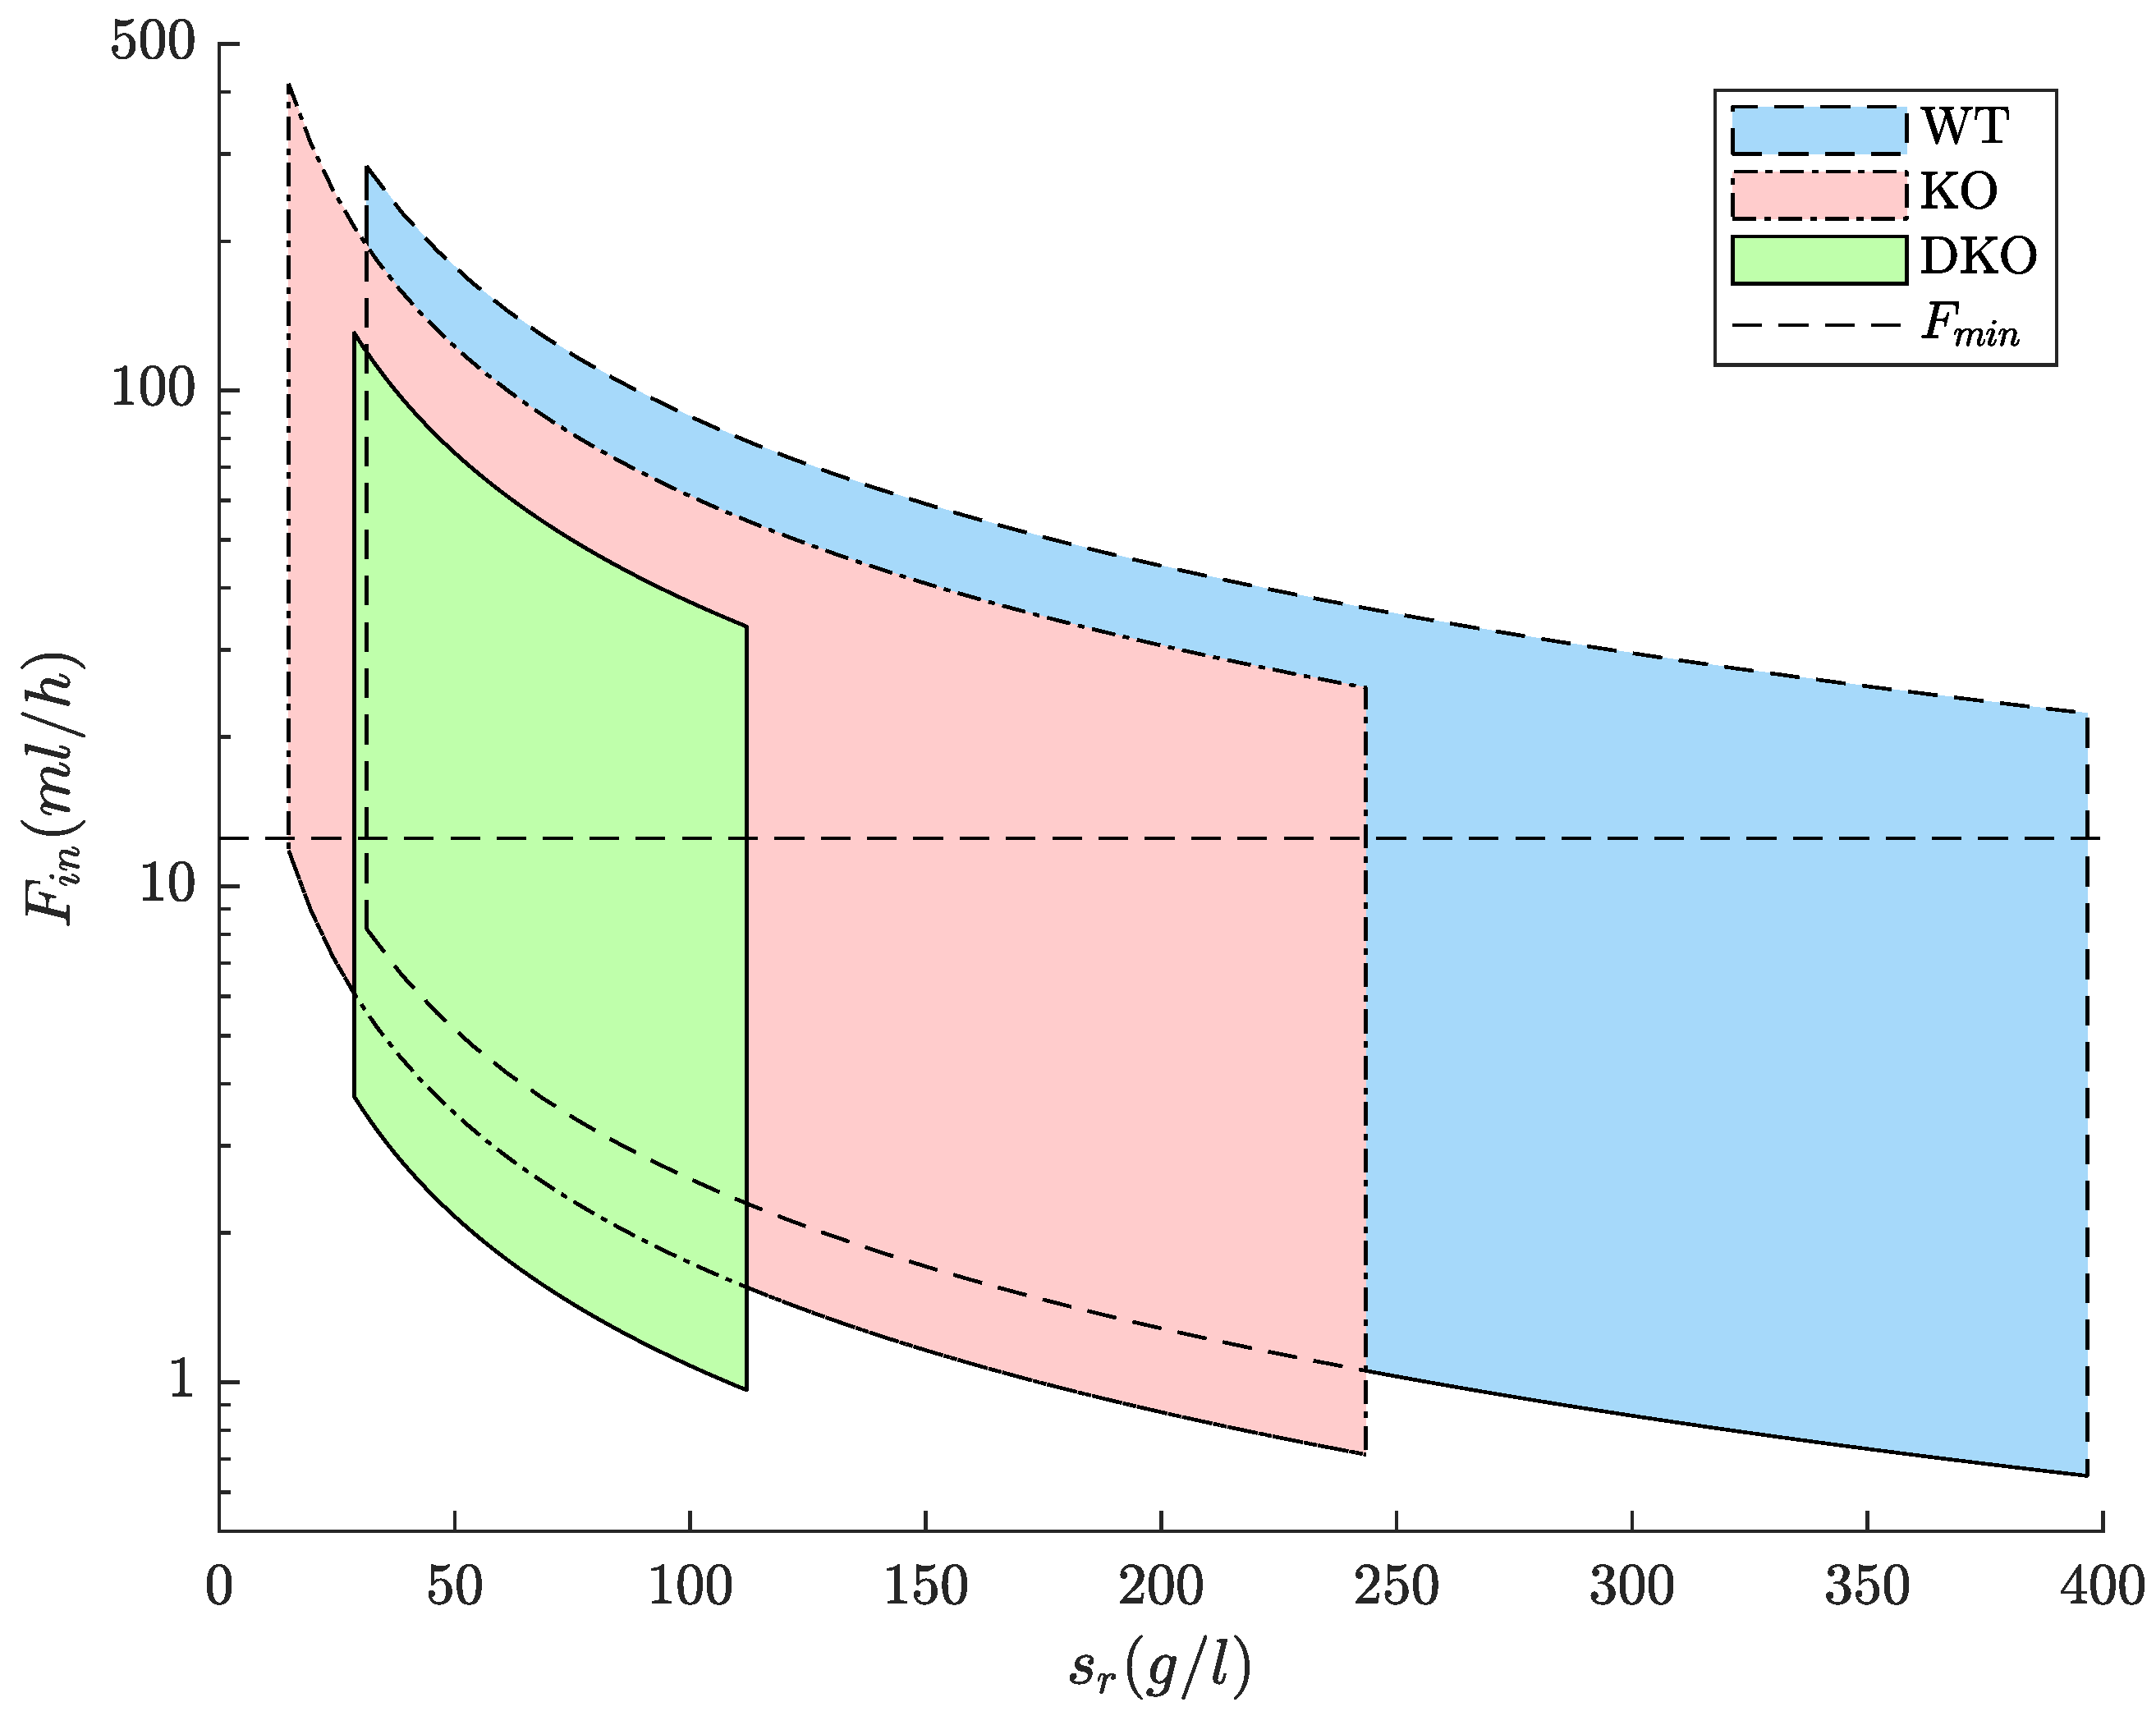
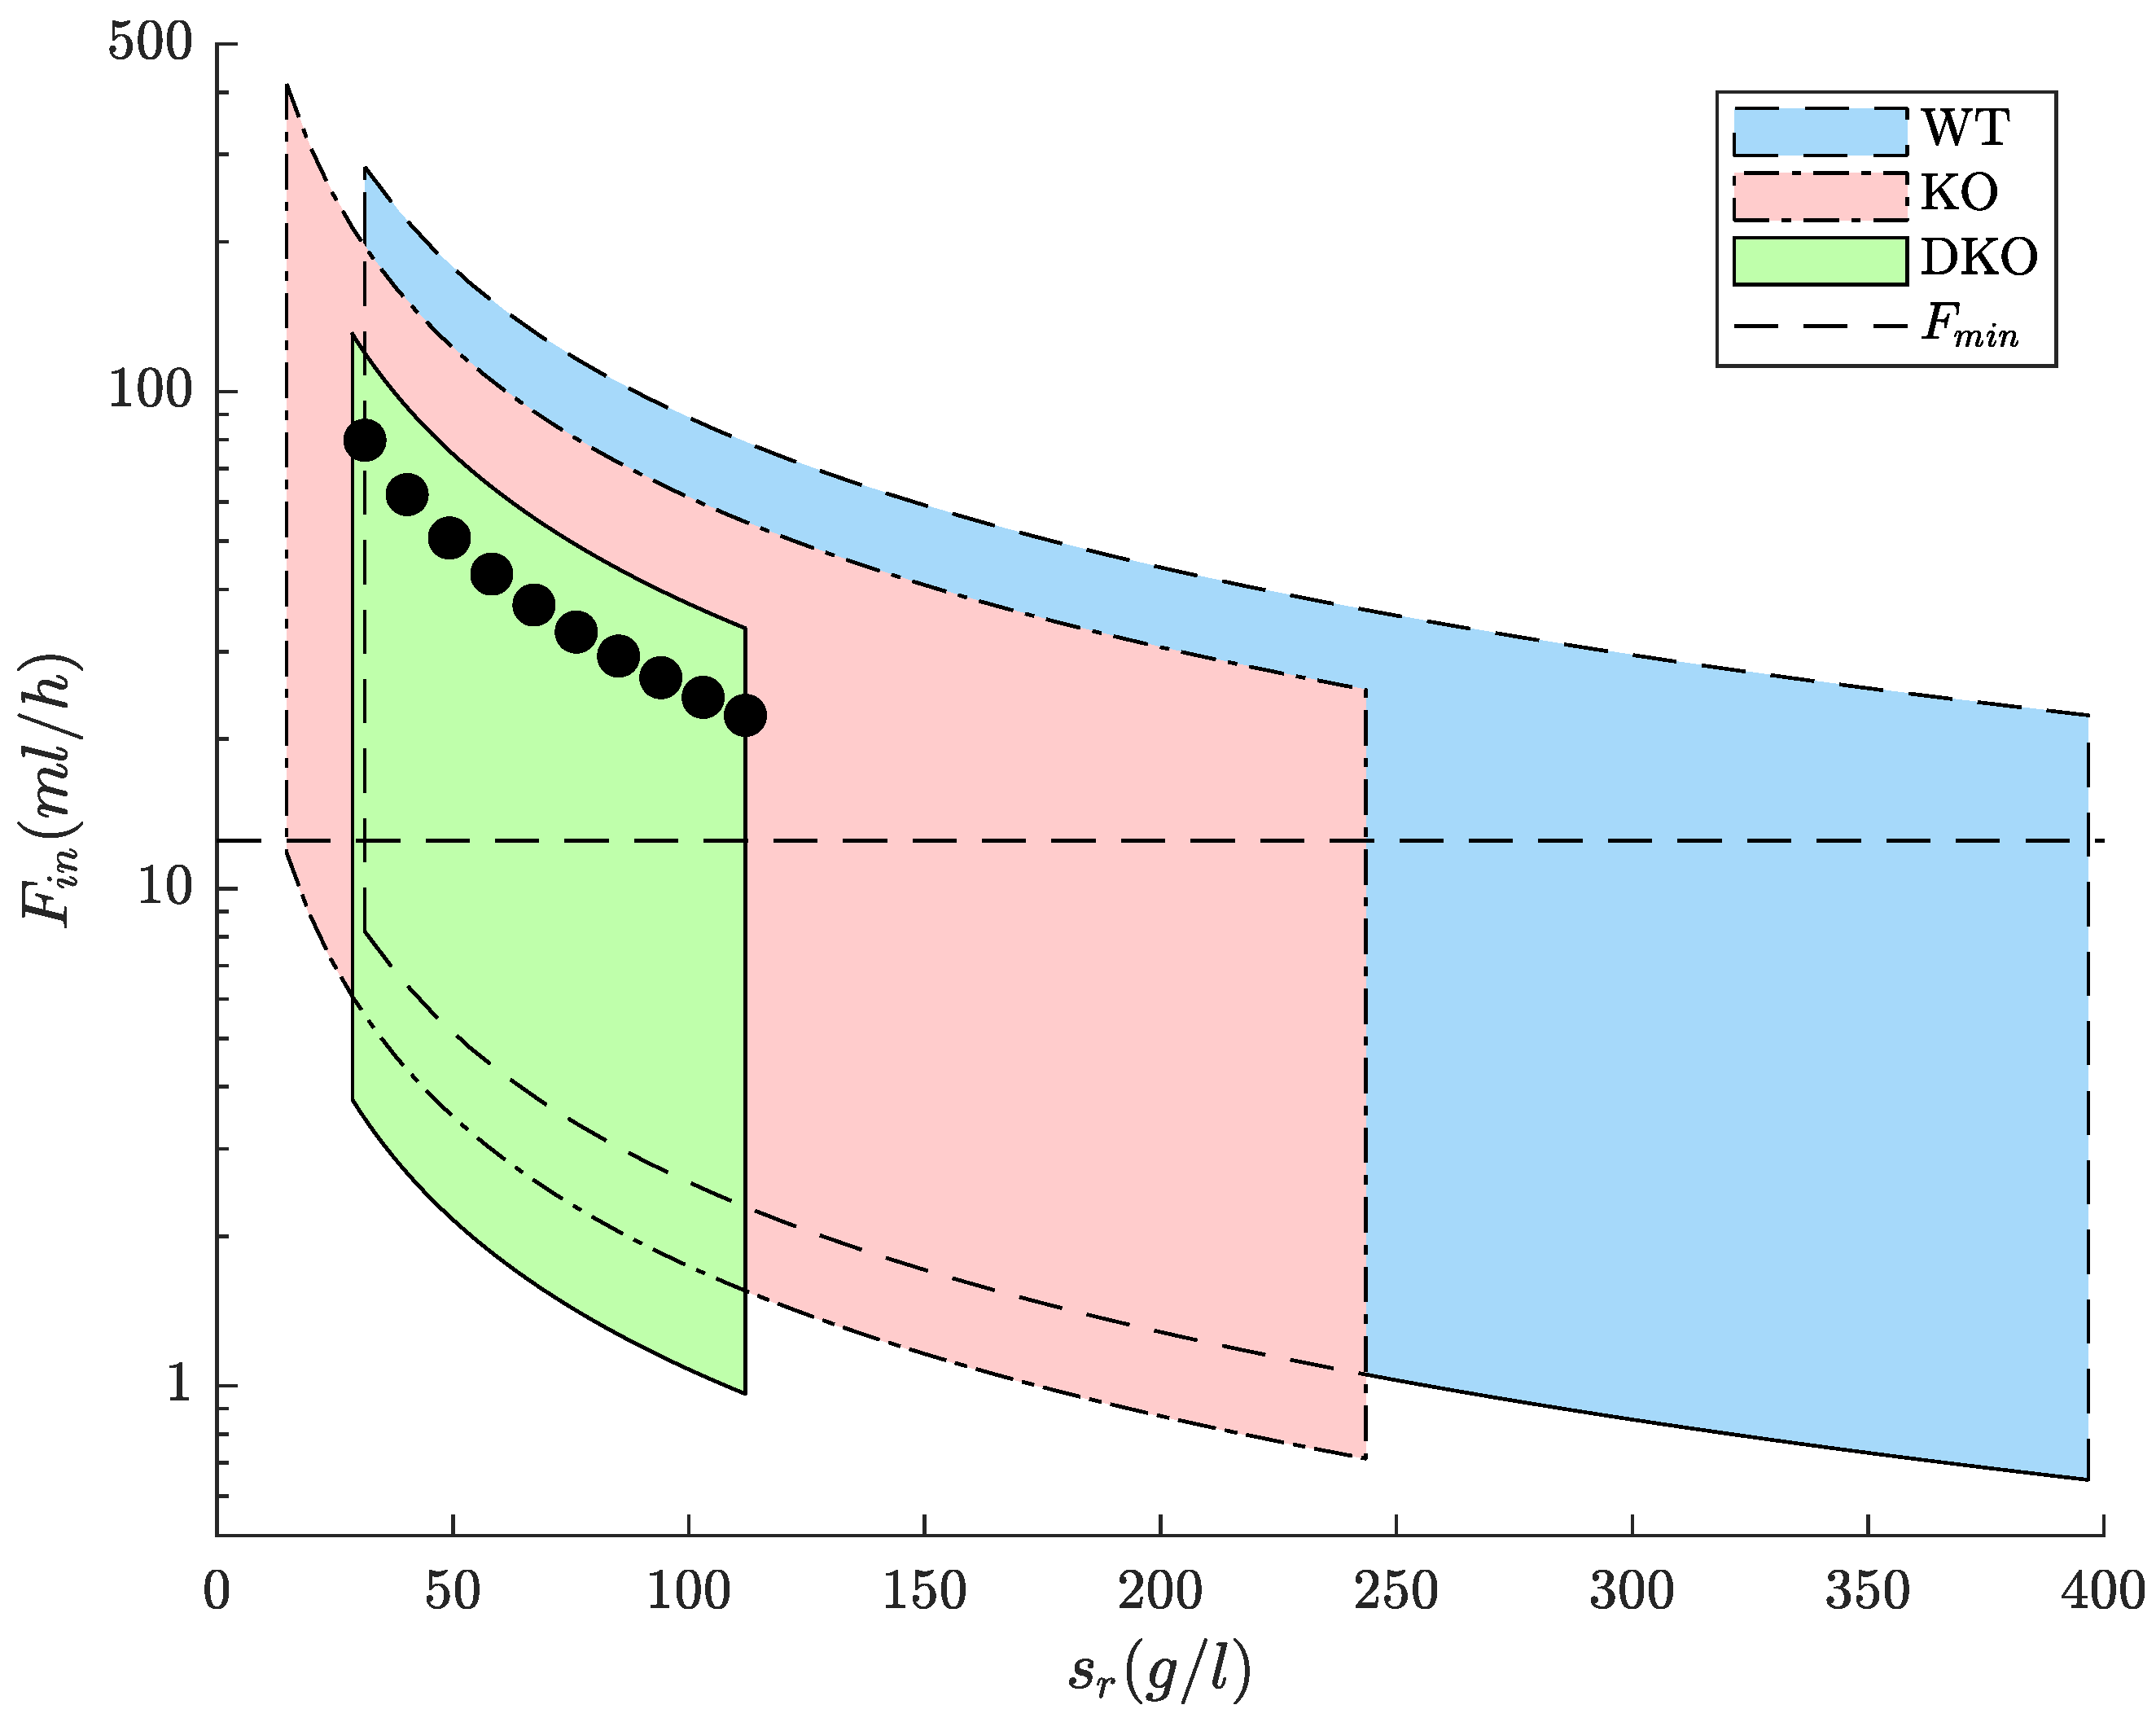
3.1. Feeding Strategies for WT and Designed Strains Lipid Production

Based on the design equations (Equations (9)–(14)), the maximum and minimum values of the glucose mass feed rate and the glucose concentration in the reservoir were established. These constraints, specific to each of the strains under study, are summarized in Table 2.
As shown in the table, the WT strain exhibited a wider variation range both in the amount of substrate that can be fed per hour and in the reservoir concentration. This allows it to operate across a broad range of F i n and s r , as illustrated in Figure 1. In contrast, for the engineered strains, a progressive reduction in these variation ranges is observed as the number of knockouts increases.
An analysis of Figure 1 reveals that very low flow rates occurred when the product F i n · s r decreased and high glucose concentrations in the reservoir were used. Under these conditions, the feeding rate became too low, leading to operational limitations and excessively long cultivation times. For this reason, a more restrictive F min was defined for the subsequent simulations, further narrowing the operating range of the strains. This F min was calculated based on a maximum feeding phase duration of five days.
In summary, both the F i n · s r and the s r (and consequently the F i n ) showed to be highly dependent on the strain used and its metabolic capabilities, which directly constrain the feasible operating range for each case.

3.2. Growth and Lipid Production of R. toruloides Strains During Fed-Batch Cultivation

Based on the proposed feeding strategy, different scenarios were simulated using DFBAlab. Figure 2 presents the growth and lipid production kinetics under fed-batch cultivation for the three strains under study (WT, KO, and DKO). For each strain, two simulations were performed using the maximum glucose mass feed rate ( F i n · s r ) m a x , combined with either the maximum ( s r , m a x ) or minimum ( s r , m i n ) glucose concentration in the reservoir.
In the case of the WT strain (Figure 2a,b), the simulations displayed the expected behavior, characteristic of a conventional TSB. During the batch phase, glucose was directed exclusively toward biomass synthesis. Once the nitrogen source was exhausted, the fed-batch phase induced lipogenesis. In contrast, the KO (Figure 2c,d) and DKO (Figure 2e,f) strains, which were genetically modified for growth-coupled lipid production, exhibited lipid accumulation during the batch phase and under carbon-limited conditions. Consequently, these strains entered the feeding phase with an initial lipid concentration, higher in the DKO strain (≈8.5 g/L) than in the KO strain (≈4.3 g/L).
Another notable difference between the engineered strains and the WT strain was the total cultivation time, which was influenced by the duration of both the batch and feeding phases. The duration of the batch phase, in particular, varied considerably depending on the metabolic characteristics of each strain. In the WT strain, the batch phase lasted approximately 17 h, whereas in the engineered strains, a progressive increase in duration was observed—25 h for the KO strain and nearly 70 h for the DKO strain.
As previously discussed, a higher biomass concentration at the end of the batch phase was expected for the WT strain, given that the entire CES was channeled exclusively toward biomass synthesis. In contrast, the engineered strains redirected a fraction of the carbon flux toward lipid biosynthesis, resulting in lower biomass concentrations. As a result, the WT strain reached approximately 18 g/L of biomass at the end of the batch phase, whereas the KO and DKO strains reached around 12 g/L and 8 g/L, respectively. It is important to highlight that, although biomass concentration decreased due to dilution during the feeding phase, the total biomass quantity remained constant throughout this stage.
Regarding the feeding phase, as shown in Figure 2, the performance of all strains was influenced by the glucose concentration in the feed ( s r ) and, consequently, by the feed flow rate ( F i n ), which can be determined by certain s r for a given value of F i n · s r . Figure 2 shows that, for all strains, lipid production was lower under the s r , min condition (left column), which corresponds to the highest F i n and, therefore, the highest medium dilution rate. Due to the mathematical definition of s r , min (Equations (13) and (14)), lipid concentration increased during the feeding phase in the WT strain. In contrast, in the engineered strains, lipid concentration remained at the level reached at the end of the batch phase.
At the opposite end, under the s r , max condition, F i n reached its minimum value for each strain. Under these conditions, simulations predicted significantly higher final lipid concentrations. Compared to the s r , min simulations, lipid concentration at the end of fed-batch cultivation increased by ≈11.2-fold in the WT strain (Figure 2b), ≈5.4-fold in the KO strain (Figure 2d), and ≈2.7-fold in the DKO strain (Figure 2f). However, it is important to note that this increase was accompanied by a longer overall cultivation time, which depended on the feed flow rate. Specifically, the cultivation time increased by approximately 3.7-fold for the WT strain, 3-fold for the KO strain, and 1.4-fold for the DKO strain. Finally, in the case of the DKO strain under the s r , max condition, an increase in glucose concentration was observed at the end of the process (Figure 2f). This can be attributed to a reduction in substrate consumption toward the end of the cultivation, as the specific lipid production rate decreases when the intracellular lipid content increases (Equation (6)).
The results highlight clear differences in metabolic behavior among the strains. Engineered strains produced lipids during the batch phase, which extended cultivation time and led to lower final biomass concentrations compared to the WT. During the feeding phase, higher s r resulted in increased final lipid concentrations and extended cultivation durations, particularly in the WT strain due to its broader operational range. These findings underscore the importance of tailoring feeding strategies to the metabolic characteristics of each strain in order to optimize bioprocess performance. The following sections examine the impact of these differences on the most commonly used efficiency metrics in bioprocesses.

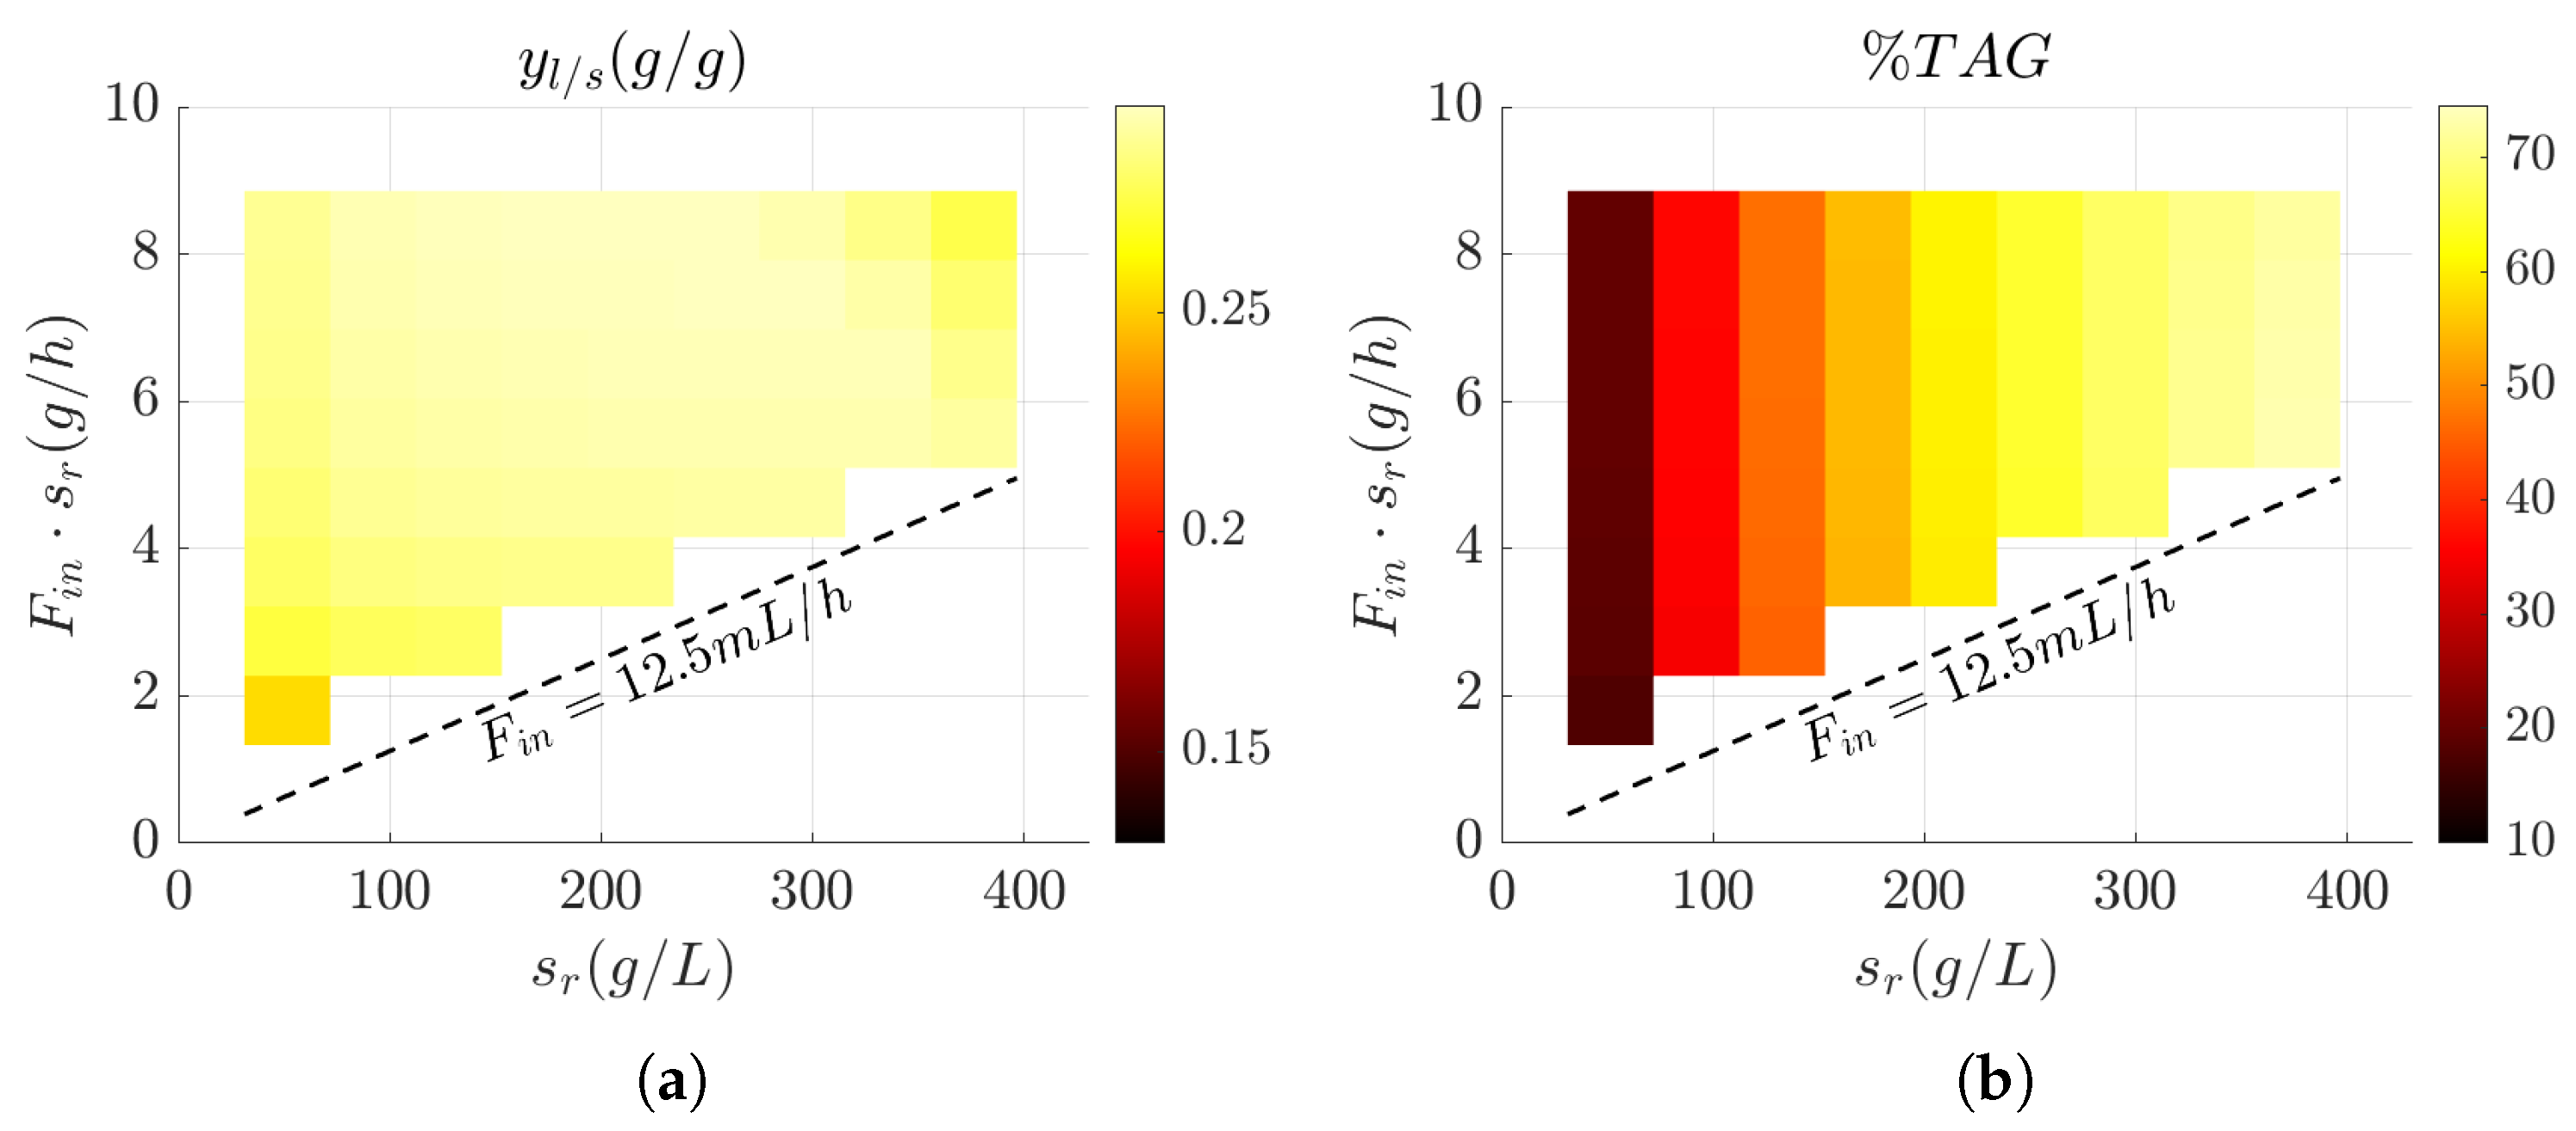
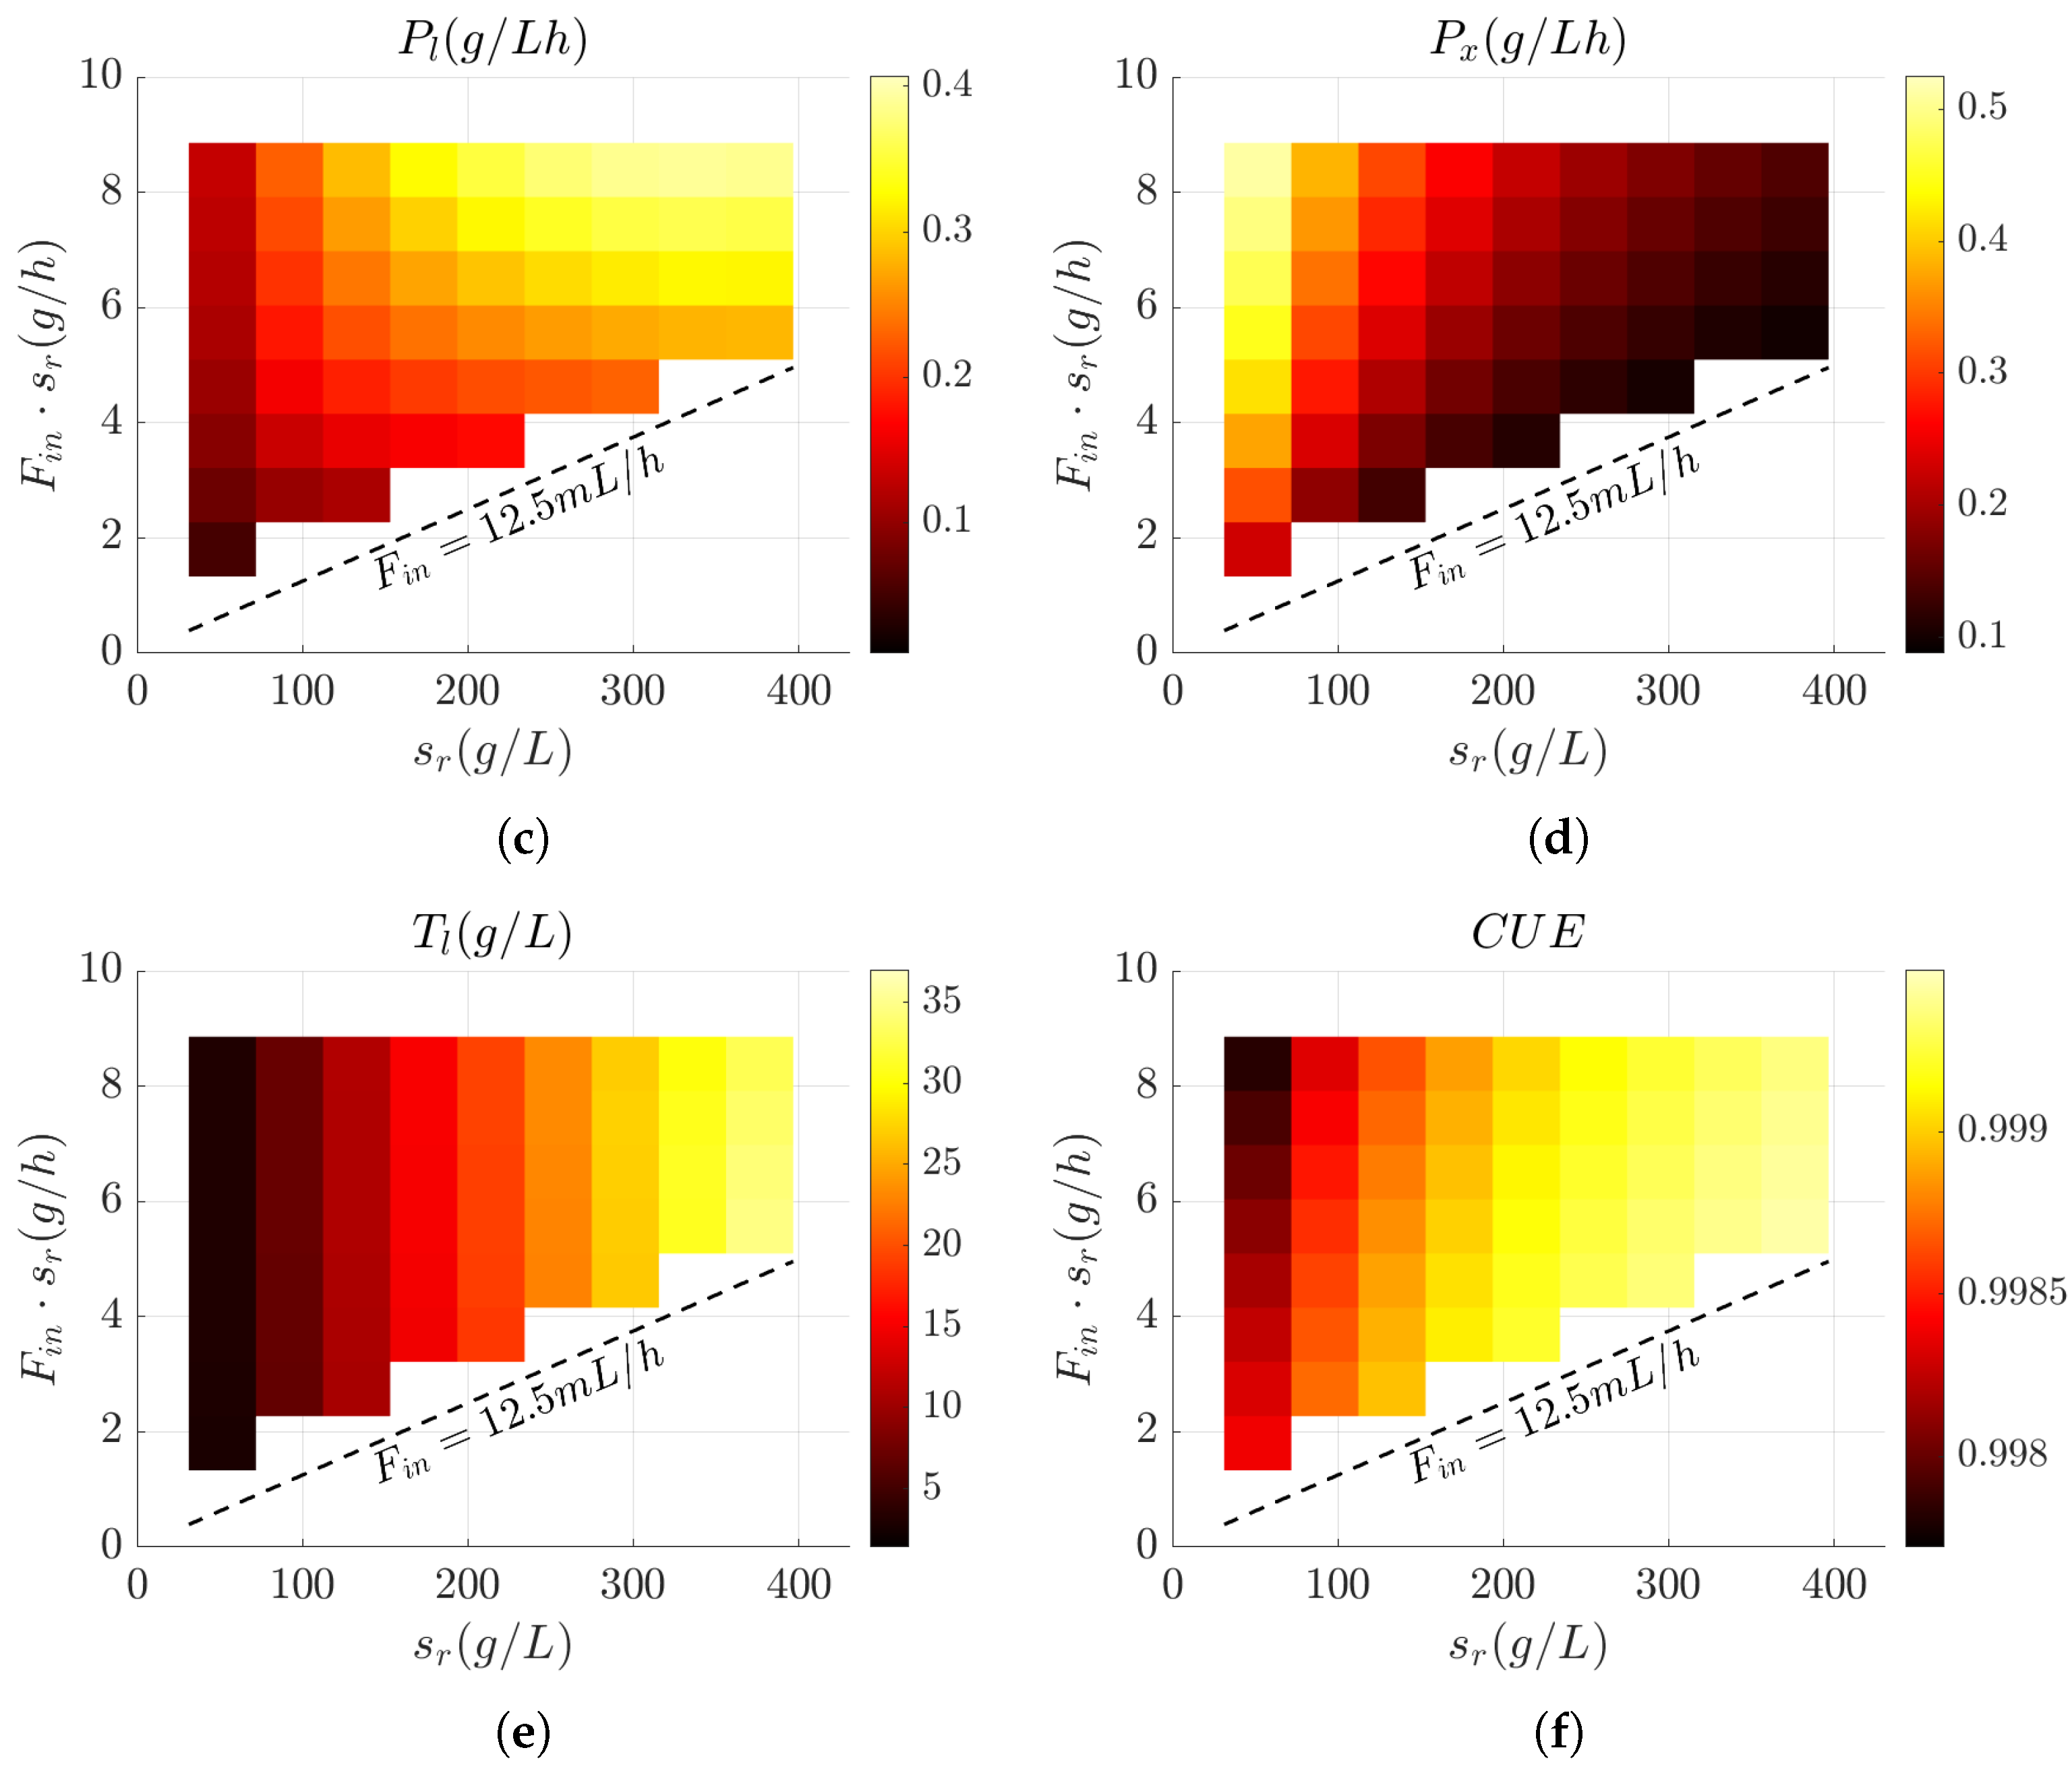
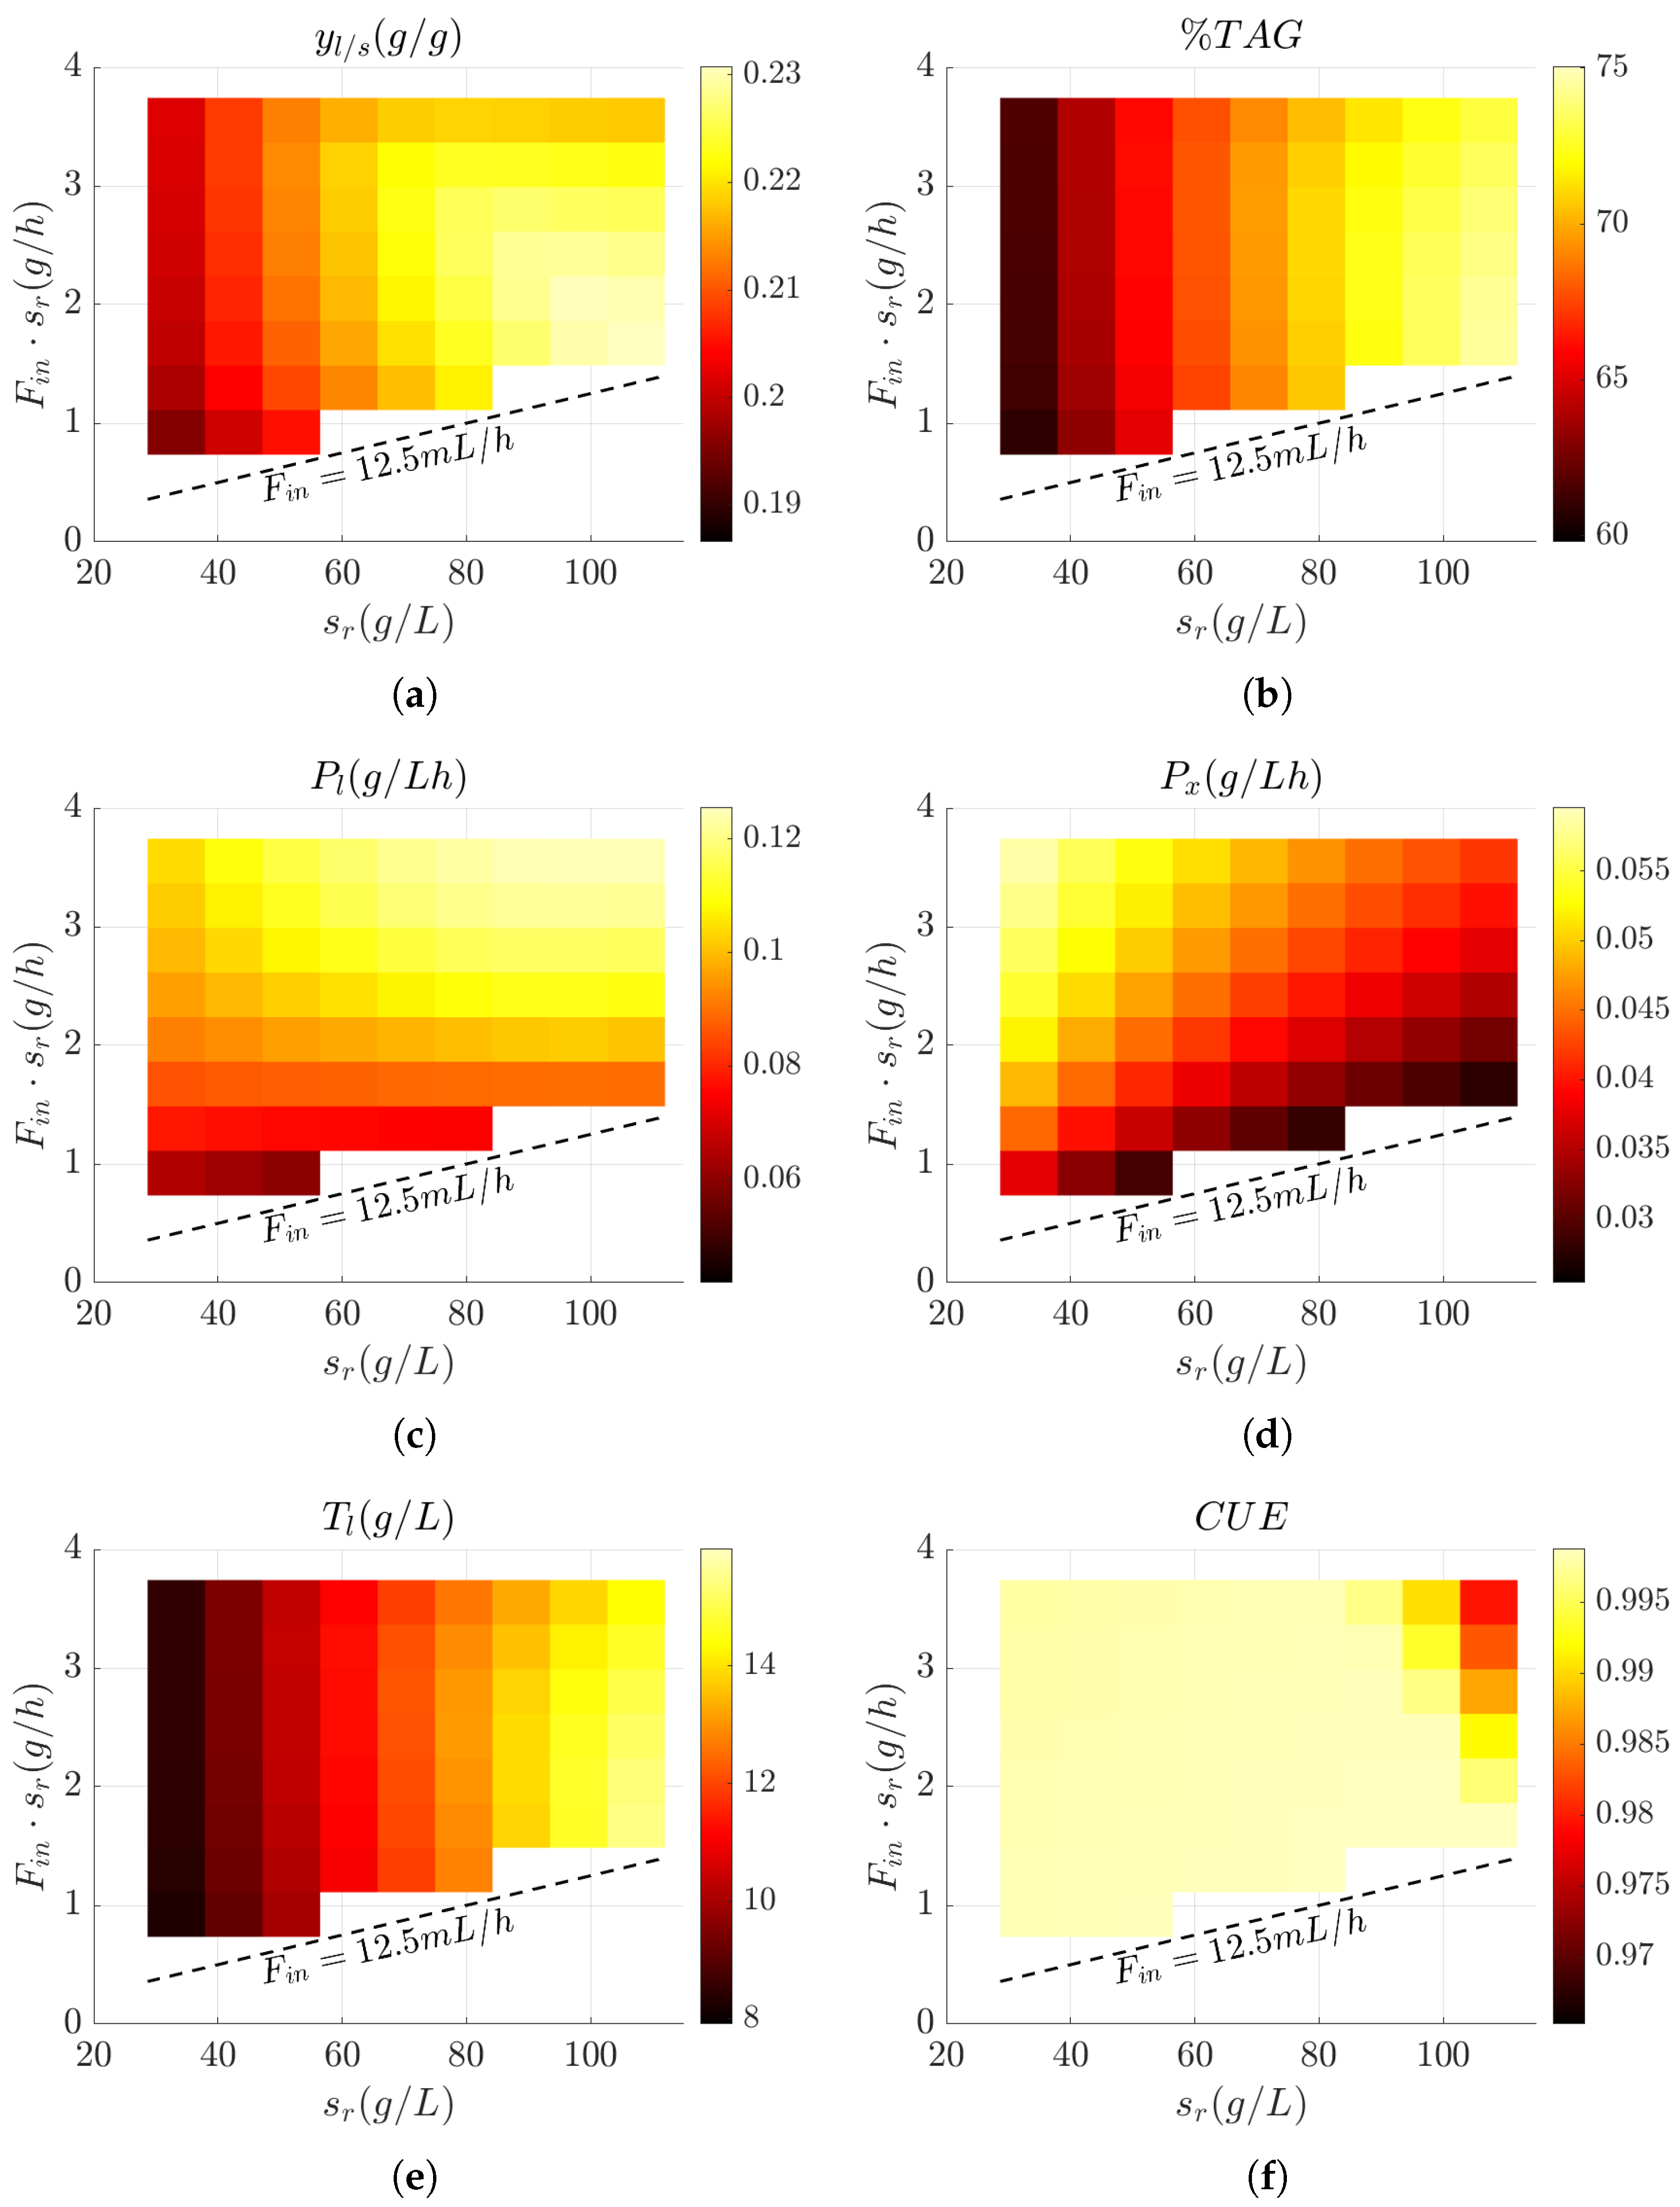
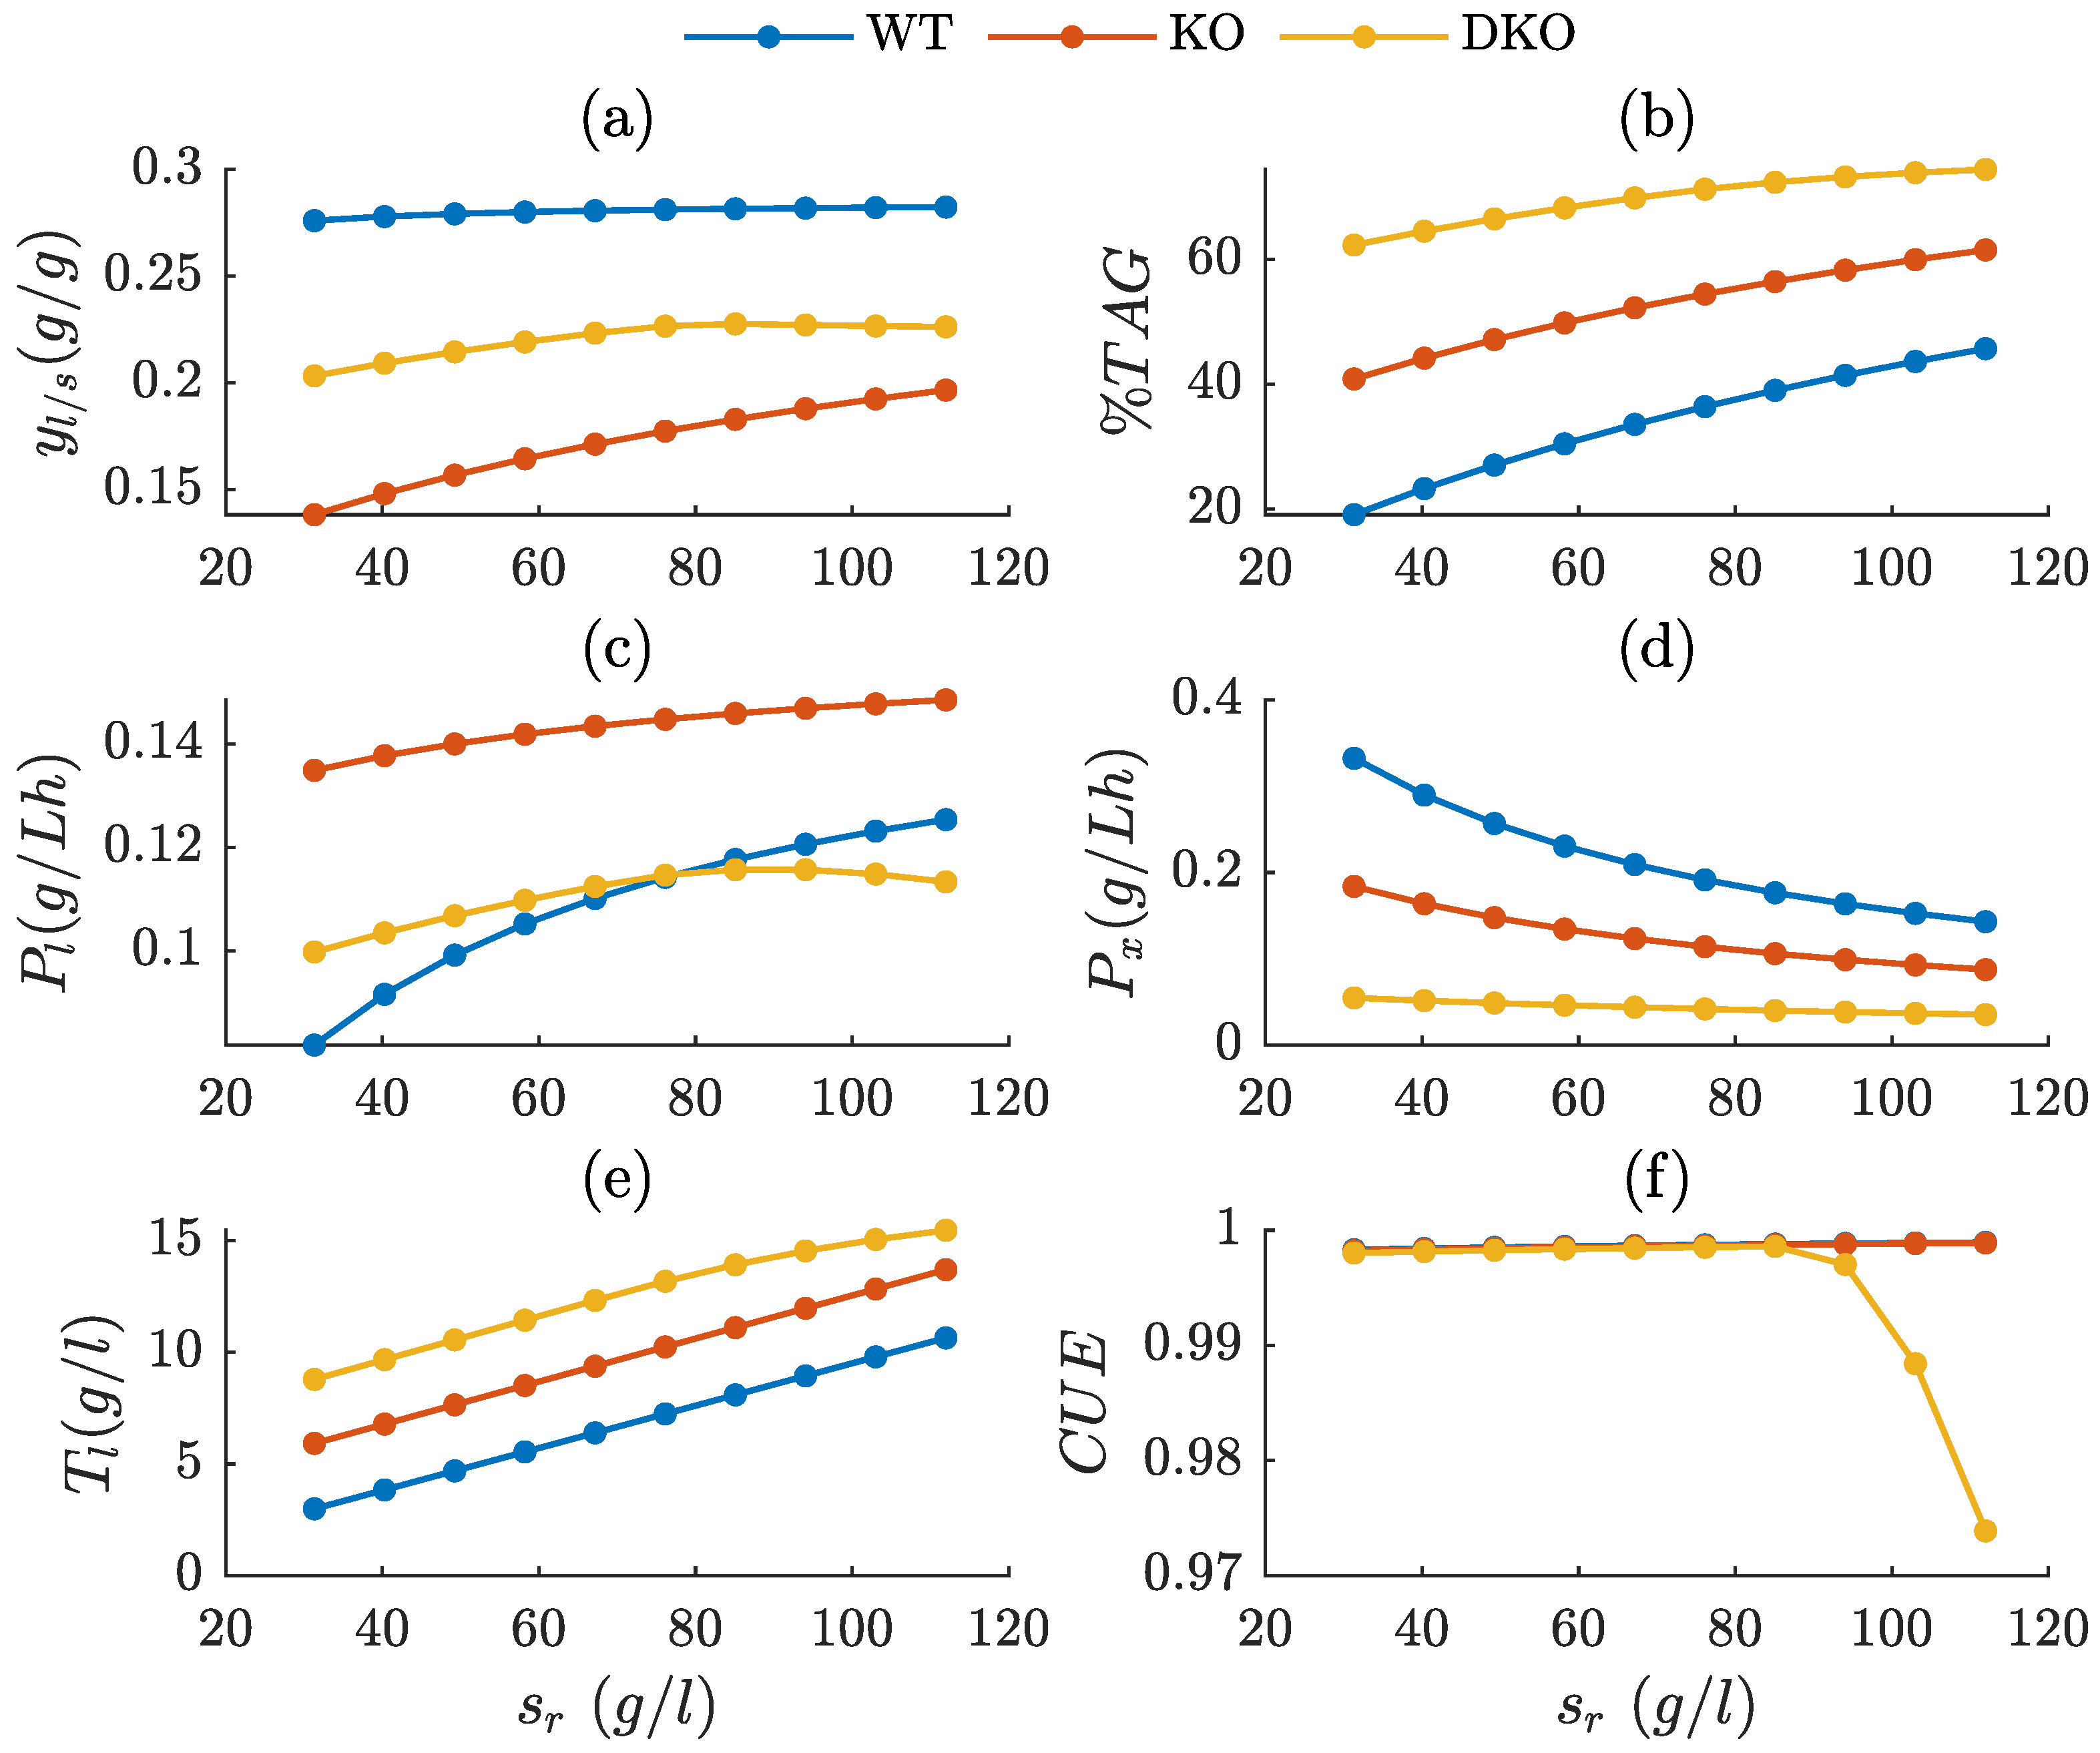
3.3. Influence of Feed Design on Key Bioprocess Performance Metrics

To evaluate the impact of feeding strategy design parameters, a series of culture conditions were simulated, covering the full range between the minimum and maximum values of glucose mass feed rate ( ( F i n · s r ) m i n to ( F i n · s r ) m a x ), as well as between the minimum and maximum feed glucose concentrations ( s r , m i n to s r , m a x ). At the same time, a minimum feed flow rate ( F i n ) of 12.5 mL/h was imposed, in order to avoid solutions where the feeding phase would extend beyond 5 days. Under these conditions, various bioprocess efficiency metrics were computed. The results obtained for the WT strain are presented in Figure 3.
Regarding lipid yield (Figure 3a), the WT strain showed limited sensitivity to variations in both F i n · s r and s r . The minimum yield observed was 0.255 g/g at low s r and low ( F i n · s r ) values, while the maximum yield reached 0.297 g/g at high ( F i n · s r ) and intermediate s r levels, representing an overall variation of approximately 16%. Regarding intracellular lipid accumulation (TAG content), although it did not appear to be significantly influenced by the glucose mass feed rate F i n · s r , a clear dependency on s r was observed (Figure 3b). Higher s r values, corresponding to lower F i n , led to substantial improvements in lipid accumulation (up to ≈75%), likely due to the favorable effect of reduced dilution rates on the inherently slow lipid synthesis kinetics. Conversely, TAG content decreased markedly as s r was reduced and the medium dilution rate increased. A similar behavior was observed for the final lipid titer (Figure 3e), which was influenced by the same effect. Working at s r values close to the maximum led to improvements of up to 26-fold, highlighting the strong impact of reduced dilution rates on overall lipid accumulation. In contrast, lipid productivity ( P l , Figure 3c) and biomass productivity ( P x , Figure 3d) were influenced by both the glucose mass feed rate F i n · s r and the glucose concentration ( s r ). For P l , higher F i n · s r values resulted in increased lipid productivity, as more glucose was supplied per unit of time. Moreover, as discussed previously, higher s r values led to higher intracellular lipid concentrations, further enhancing P l . As a result, a lipid productivity as high as 0.4 g/L·h could be achieved. In contrast, P x behaved differently. Since no biomass was produced during the feeding phase, lower s r values and higher F i n shortened the duration of the feeding process, which in turn increased biomass productivity (up to ≈0.5 g/Lh) due to a shorter overall process time. Finally, no significant differences were observed in the CUE, which remained close to 1 across all conditions. This behavior is expected under well-designed feeding conditions, where the assumption of complete carbon consumption holds true, indicating that the feeding profile was properly adjusted to match the metabolic capacity of the strain.
The same efficiency metrics were evaluated for the KO strain (Figure 4), yielding slightly different results when compared to the WT strain. To begin with, lipid yield was notably more variable than in the WT strain, ranging from 0.11 g/g to 0.22 g/g (Figure 4a). In this strain, higher lipid yields were observed at intermediate values of F i n · s r combined with high s r . As with the DKO strain, lipid yield ( y l / s ) in the KO strain resulted from the combined contribution of both the batch and feeding phases. Lipid content followed a similar trend to that of the WT strain, reaching % T A G levels comparable to those observed in the two-stage WT process, despite the more limited s r range (Figure 4b). This also influenced the final lipid titer, which, due to the constraints imposed on F i n · s r and s r , reached a maximum of approximately 25 g/L, compared to around 37 g/L for the WT strain (Figure 4e). Lipid productivity ( P l , Figure 4c) and residual biomass productivity ( P x , Figure 4d) exhibited trends similar to those previously described, but in this case, maximum lipid productivity reached 0.27 g/L·h, while biomass productivity was of a similar magnitude (approximately 0.28 g/L·h). Finally, the CUE remained close to 1 across all conditions, indicating efficient glucose usage (Figure 4d).
Finally, the performance metrics for the DKO strain were evaluated and are presented in Figure 5. This strain, designed for lipid overproduction, showed higher lipid yields at lower F i n · s r values and higher glucose concentrations s r , reaching up to 0.23 g/g, with a minimum yield of approximately 0.19 g/g (Figure 5a). Due to the significant lipid synthesis occurring during the batch phase, high % T A G values were expected. Although the best results were obtained at high s r (approximately 75%), lipid contents around 60% were also achieved under conditions of low F i n · s r and low s r (Figure 5b). As previously mentioned, this strain operated within a more limited range of feeding parameters. Combined with the prolonged batch-phase cultivation time, this led to lower lipid productivity ( P l ), which reached a maximum of approximately 0.13 g/L·h (Figure 5c). Biomass productivity ( P x ) was even more affected by the extended cultivation time and reached maximum values around 0.06 g/L·h (Figure 5d). As with the other strains, the final lipid titer was favored by high s r values, where the dilution rate was reduced. Under such conditions, the DKO strain achieved lipid concentrations up to 16 g/L (Figure 5e), despite operating at significantly lower s r values than the other strains. Nevertheless, due to the limited range of feasible feed conditions and the drop in lipid synthesis rate at high accumulation levels, the carbon consumption rate decreased. This led to substrate accumulation in the culture medium at high feed rates and concentrations, as reflected by the CUE, which sharply decreased under these conditions (Figure 5f).
The analysis showed that no single set of feed parameters maximized all metrics, and optimal values depended on both the strain and the target metric. In most cases, higher s r improved performance, although it led to glucose accumulation in the DKO strain, especially at high F i n · s r values. The WT strain achieved the highest overall values, in part due to its broader range of feasible feeding conditions.

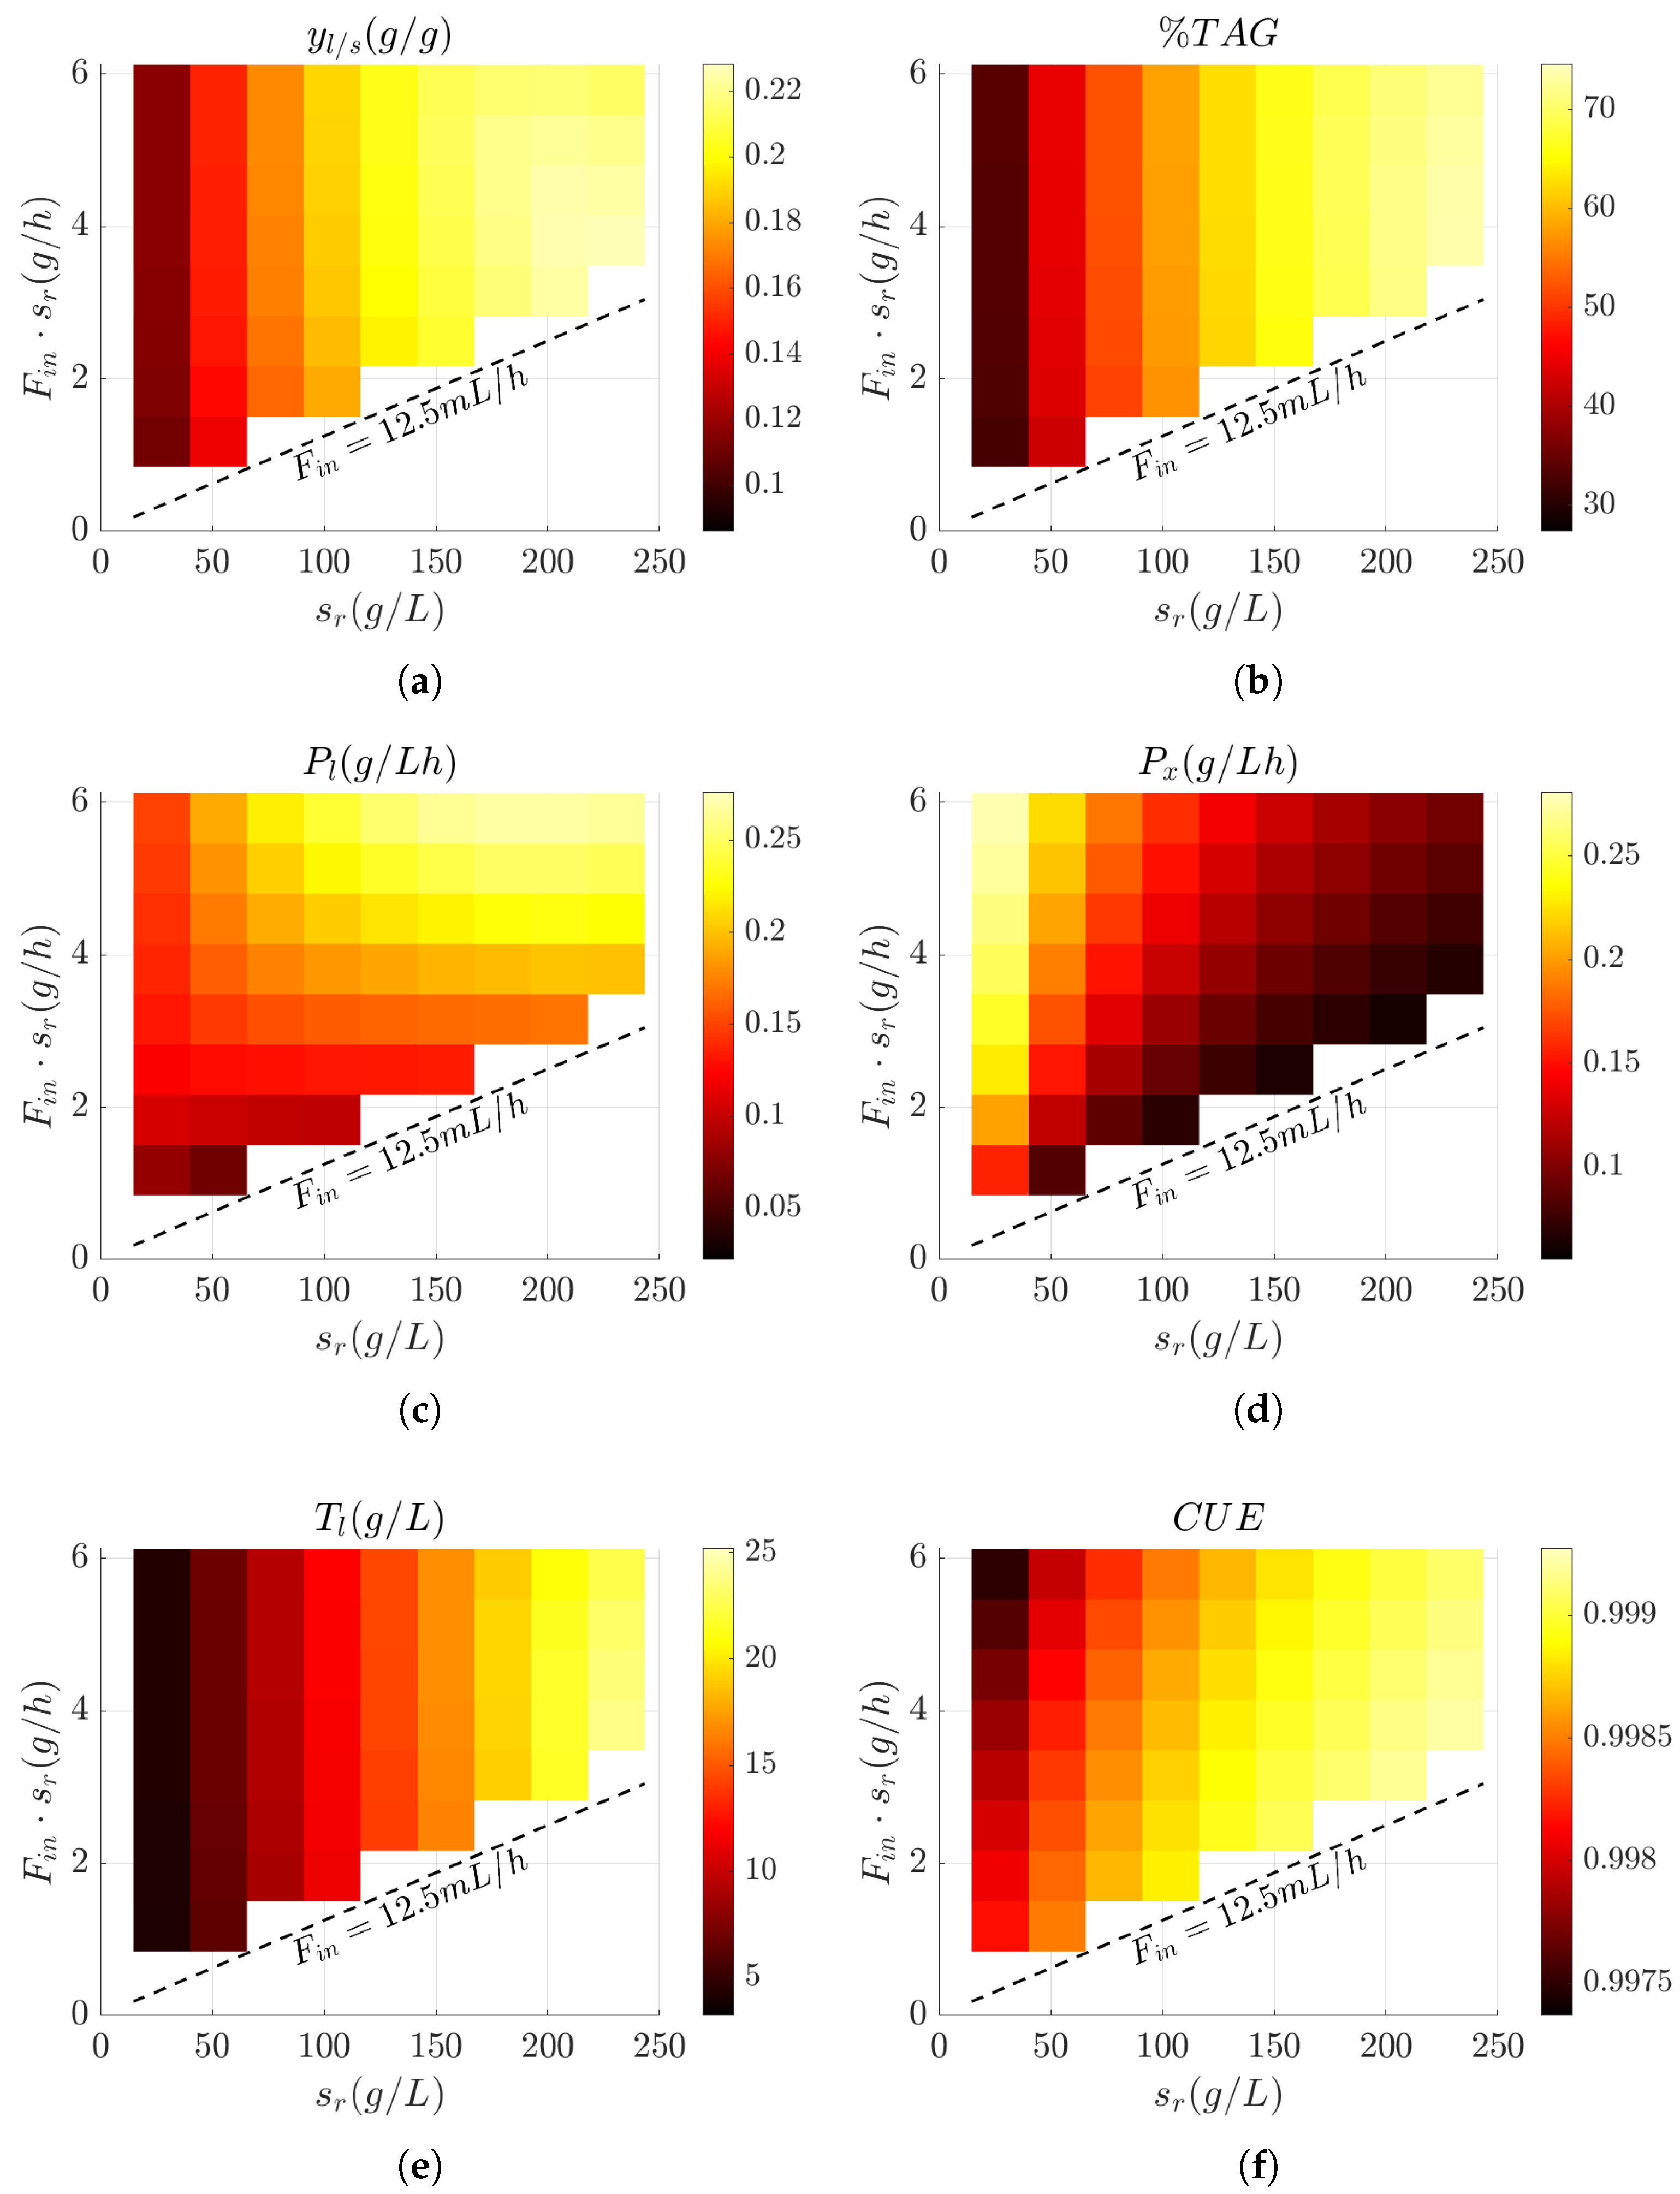
3.4. Evaluation of Bioprocess Efficiency in Wild-Type and Engineered Strains

In the previous section, the effect of varying glucose mass feed rates ( F i n · s r ) and feed concentrations ( s r ) on key bioprocess performance metrics was examined. As shown in Figure 1, the feasible operating range for these parameters is broader in the WT strain and becomes increasingly restricted as the number of genetic modifications increases. To ensure a consistent basis for comparison across all strains, a fixed glucose feed rate of 2.5 g/h—within the feasible range for WT, KO, and DKO strains—was selected. Under this standardized feeding condition, the effect of glucose concentration ( s r ) on bioprocess efficiency metrics was systematically evaluated within the range defined by s r , min of the WT strain to the s r , max of the DKO strain (Figure 6).
Figure 7 shows the calculated bioprocess metrics for each strain. Regarding lipid yield ( y l / s ), which reflects the efficiency of glucose-to-lipid conversion, the highest values under the evaluated conditions were obtained for the WT strain, operated under the previously described TSB strategy (Figure 7a). In this strain, the yield remained nearly constant at approximately 0.28 g/g across the entire range of glucose feed concentrations. It is important to note that the batch phase was excluded from the yield calculation, as lipogenesis was only induced during the feeding phase. In contrast, for the engineered strains, the DKO consistently outperformed the KO strain in terms of lipid yield across all s r values. In the DKO, the yield increased up to an s r of approximately 76 g/L, beyond which it stabilized. The KO strain, however, showed greater sensitivity to s r , with a continuous increase in yield across the entire tested range.
Another key parameter in lipid production is lipid content ( % T A G ), as it directly impacts the efficiency of downstream recovery processes due to its intracellular accumulation. As shown in Figure 7b, within the tested range of glucose concentrations, the DKO strain achieved the highest lipid accumulation (≈62–74%), followed by the KO strain (≈40–62%), and finally the WT strain (≈20–45%). This difference became more pronounced at lower s r values, where the dilution rate was significantly higher. In this context, the engineered strains have the advantage of entering the feeding phase with a pre-existing lipid content, which enhances their efficiency in lipid accumulation, especially in processes with short feeding phases. Conversely, the WT strain benefits from longer feeding durations, which are associated with higher s r values. This provided sufficient time for de novo lipid accumulation, ultimately resulting in a higher lipid content.
Regarding productivity, both lipid productivity ( P l ) and residual biomass productivity ( P x ) are critical parameters for assessing industrial feasibility, as they account for the production time factor. Among the tested strains, the KO strain exhibited the highest lipid productivity under the evaluated conditions, with values ranging from approximately 0.135 to 0.148 g/L·h (Figure 7c). In this strain, the ability to produce lipids during the batch phase within a reasonable time frame enables consistently high productivity across the entire range of s r values analyzed. In contrast, although the DKO strain demonstrated high lipid synthesis efficiency, its extended cultivation time resulted in lower overall productivity. As for the WT strain, its lack of lipid production during the batch phase makes it inherently less productive compared to the engineered strains, in which lipid accumulation is growth-coupled. However, under conditions of higher s r , which correspond to lower dilution rates, the WT strain achieved higher productivities than the DKO strain. This outcome is attributed to the significantly shorter batch phase duration in the WT strain relative to DKO under equivalent s r conditions.
On the other hand, biomass productivity ( P x ) was higher (up to 0.33 g/Lh) in the WT strain compared to the engineered strains (Figure 7d). This is because biomass is only produced during the batch phase, and in the engineered strains, part of the available CES is diverted toward lipid synthesis during this stage. Since no biomass was produced during the feeding phase in any of the strains, due to the absence of a nitrogen source, the biomass generated during the batch phase was only subject to dilution. This trend can be explained by the fact that, at lower s r values—which correspond to higher feed flow rates ( F i n )—the feeding phase is shorter, allowing less time for biomass dilution and thus resulting in higher biomass productivity. However, this effect is less evident in the DKO strain, as its extended batch phase duration reduces the relative impact of the feeding phase on overall productivity compared to the other strains.
The final lipid titer is another key variable in bioprocesses, as it reflects the total amount of lipids obtained per liter of culture medium. As shown in Figure 7e, under the tested conditions, the highest lipid titer was achieved by the DKO strain (up to 15.5 g/L), followed by the KO strain (up to 13.7 g/L) and the WT strain (up to 10.6 g/L). These results are consistent with the fact that both the DKO and KO strains were engineered for enhanced lipid overproduction. In general, lipid titers were higher at elevated s r concentrations, which correspond to lower feed flow rates ( F i n ). This can be attributed to the reduced dilution rate, which favors lipid synthesis, an inherently slow metabolic process. In the case of the DKO strain, the relationship between lipid titer and s r becomes nonlinear at higher concentrations, presumably due to saturation effects caused by the high levels of lipid accumulation, which may in turn reduce the lipid production rate.
Finally, the CUE is a critical parameter for evaluating whether the supplied carbon is efficiently channeled into biomass and lipid synthesis, or instead accumulates in the bioreactor. A CUE value below unity indicates not only inefficient carbon conversion but also the potential need for downstream processing to manage residual carbon in the culture medium. As illustrated in Figure 7f, both the WT and KO strains demonstrated effective carbon utilization across all tested conditions. In contrast, the DKO strain exhibited a marked decline in CUE at s r values exceeding 85 g/L, falling below 1. This trend aligns with the lipid production plateau observed in other efficiency metrics at elevated s r levels. Given that, at this stage, all carbon input is directed exclusively toward lipid biosynthesis, any excess substrate that exceeds the cellular capacity for lipid accumulation is likely to accumulate in the medium.
This analysis revealed that, under feeding conditions defined by a fixed F i n · s r and a common s r range, the optimal strain depended entirely on the target metric. For example, under these conditions, the WT strain maximized y l / s and P x , the KO strain showed the highest P l , and the DKO strain achieved the greatest % T A G and T l . These results highlight the value of simulation-based approaches to guide strain and feeding strategy selection based on specific performance goals and practical constraints.

4. Discussion

This study presents a methodology for designing fed-batch cultivation aimed at optimizing lipid production in both native and metabolically engineered strains, using DFBA in combination with reduced metabolic models. In fed-batch cultivation systems, the ability to define an optimal feeding strategy in advance is crucial, as it directly influences whether the supplied substrates are directed toward biomass formation or product accumulation. These systems offer a high degree of control over nutrient supply, making them especially suitable for fine-tuning metabolic outcomes. Additionally, fed-batch processes are typically time-consuming and resource-intensive, which underscores the importance of careful planning to ensure economic viability.
Three R. toruloides strains were analyzed: WT strain, KO strain, and DKO strain. The KO strain exhibited an intermediate phenotype, balancing lipid production and growth. In contrast, although the DKO strain also couples growth with lipid accumulation, it was specifically engineered to favor lipid production at the expense of biomass formation.
For the analysis of the feeding strategy, we proposed an initial carbon-limited batch phase followed by a feeding phase in which only the CES was supplied at a constant feed rate. This approach is based on a TSB design concept proposed in the literature [6,10], where the primary objective of the first phase is biomass generation, while the second phase aims to promote lipid accumulation.
One of the primary factors to consider when designing a fed-batch strategy is the mass feed rate ( F i n · s r ), as it directly influences the efficient utilization of a resource that often represents a major operational cost: CES. Given that CES is typically the most abundant substrate supplied, its high cost has been identified by several authors as a key limitation to its application at an industrial scale [16,31,32]. Throughout this study, we found that selecting an appropriate value for the mass feed rate ( F i n · s r ) is non-trivial and has a significant impact on lipid production. While it is often assumed that increasing F i n · s r leads to improved process performance, our results demonstrate that key efficiency-related metrics, such as yield ( y l / s ), lipid content ( % T A G ), and lipid titer ( T l ), can in fact improve under lower F i n · s r values, depending on the specific cultivation conditions.This is particularly relevant for overproducing strains such as DKO, where, under certain conditions, operating at high F i n · s r values may lead to substrate accumulation in the culture medium. This not only results in inefficient use of the CES but also increases the carbon load in the waste stream [33]. The modeling framework proposed in this work enables the identification of optimal CES mass feed rates ( F i n · s r ) based on the desired objective of the process.
On the other hand, for a given value of F i n · s r , multiple combinations of feed flow rate ( F i n ) and CES concentration ( s r ) can be applied. In this study, we employed various bioprocess performance metrics to evaluate how changes in s r , and indirectly in F i n , affect lipid production. We proposed equations to estimate the variation of s r as a function of the lipid accumulation percentage, and defined a minimum threshold for F i n based on the maximum allowable duration of the feeding phase. The results showed a strong influence of these parameters on lipid production across all strains tested. In general, due to the inherently slow kinetics of lipid synthesis, higher s r values, associated with lower F i n and, consequently, lower dilution rates, proved beneficial in improving lipid yield ( y l / s ), lipid accumulation percentage (%TAG), lipid productivity ( P l ), and lipid titer ( T l ) at a fixed F i n · s r . The only metric for which this trend did not hold was biomass productivity ( P x ), which was negatively impacted by the extended process time associated with lower F i n , since biomass formation in the proposed design occurs exclusively during the initial batch phase. These finding are consistent with the observations reported by other authors [17]. It is important to note that the selection of s r and F i n values depend on process-specific constraints, such as the operational range of the feed pump, the viscosity of the feed solution, the chemical stability of the medium, among other factors. This further underscores the value of the proposed tool, which enables the identification of optimal feeding conditions within the practical operating range available in laboratory or industrial settings. By doing so, it enhances resource utilization and contributes to improving the overall economic performance of the process.
The selection of feeding parameters is also influenced by the choice of the production strain. In previous work [13], we evaluated the feasibility of using different strains for lipid production under batch conditions. In that context, strains engineered for lipid overproduction outperformed the WT strain across most performance metrics, particularly the DKO strain, which achieved high lipid titers in OSB. In contrast, the fed-batch strategy offers an additional degree of control through the feeding phase, which enables better exploitation of the WT strain’s metabolic potential. As demonstrated throughout this study, the ability to modulate a broad range of F i n · s r and s r values allowed the WT strain to reach high performance under specific conditions, achieving y l / s , P l , and % T A G values comparable to those reported in the literature for R. toruloides cultivated on glucose under fed-batch conditions (Table 3).
Nevertheless, our results demonstrate that even within a common range of F i n · s r and s r values, the choice of strain has a substantial impact on process performance, depending on the selected operating point and the metric used to assess efficiency. In fact, for a given F i n · s r , the specific concentration of s r employed can determine which strain is more suitable, highlighting the strong interdependence between feeding conditions and strain performance.

5. Conclusions

Designing an effective feeding strategy for lipid production is a multifactorial and complex task that is highly dependent on the selected microbial strain. In this study, we presented a computational approach to improve lipid production in fed-batch systems, based on DFBA and strain-specific small-scale metabolic models. This methodology allowed the identification of optimal feeding parameters and the most suitable strains prior to experimental implementation, enhancing resource efficiency and reducing the incidence of failed or suboptimal experiments.
The proposed framework proved to be flexible and adaptable to a wide range of strain designs, including both engineered and WT strains commonly used in bioprocesses. As such, it served as a valuable tool for rational process development, with potential applications in industrial-scale lipid production, where feeding strategies must be tailored to process-specific constraints.
The choice of a small-scale metabolic model enabled faster simulations and facilitated metabolic interpretation while preserving the essential pathways for growth and lipid accumulation. Although environmental variables such as temperature and pH were not explicitly included, the simulations remain valid under the assumption that these parameters are optimally controlled. Future work will focus on incorporating additional layers of biological complexity, refining kinetic constraints, and extending the methodology to multi-stage processes and alternative feeding strategies, thereby enhancing its applicability to large-scale biotechnological systems.

Supplementary Materials

The following supporting information can be downloaded at: https://www.mdpi.com/article/10.3390/fermentation11060354/s1, Figure S1: Flux distribution resulting from FBA optimization in the WT strain; Figure S2: Flux distribution resulting from FBA optimization in the KO strain; Figure S3: Flux distribution resulting from FBA optimization in the DKO strain.

Author Contributions

Conceptualization, M.T.C.; methodology, M.T.C. and S.N.; software, S.N. and M.J.; formal analysis, M.T.C.; writing—original draft preparation, M.T.C.; writing—review and editing, M.T.C., S.N., M.J. and H.D.B.; supervision, H.D.B.; funding acquisition, H.D.B. All authors have read and agreed to the published version of the manuscript.

Funding

This research was funded by the Consejo Nacional de Investigaciones Científicas y Técnicas CONICET (PIP-0331, PIP-2595).

Institutional Review Board Statement

Not applicable.

Informed Consent Statement

Not applicable.

Data Availability Statement

The original contributions presented in this study are included in the article/Supplementary Materials. Further inquiries can be directed to the corresponding author. Metabolic model is available at http://hdl.handle.net/11336/235072 (accessed on 5 May 2025).

Acknowledgments

During the preparation of this manuscript, the authors used ChatGPT Version GPT-4-turbo for the purposes of improving English redaction. The authors have reviewed and edited the output and take full responsibility for the content of this publication.

Conflicts of Interest

The authors declare no conflicts of interest.

References

  1. Papanikolaou, S.; Aggelis, G. Lipids of oleaginous yeasts. Part I: Biochemistry of single cell oil production. Eur. J. Lipid Sci. Technol. 2011, 113, 1031–1051. [Google Scholar] [CrossRef]
  2. Lopes da Silva, T.; Fontes, A.; Reis, A.; Siva, C.; Gírio, F. Oleaginous Yeast Biorefinery: Feedstocks, Processes, Techniques, Bioproducts. Fermentation 2023, 9, 1013. [Google Scholar] [CrossRef]
  3. Lyu, Q.; Dar, R.A.; Baganz, F.; Smoliński, A.; Rasmey, A.H.M.; Liu, R.; Zhang, L. Effects of Lignocellulosic Biomass-Derived Hydrolysate Inhibitors on Cell Growth and Lipid Production During Microbial Fermentation of Oleaginous Microorganisms—A Review. Fermentation 2025, 11, 121. [Google Scholar] [CrossRef]
  4. Soccol, C.R.; Neto, C.J.D.; Soccol, V.T.; Sydney, E.B.; da Costa, E.S.F.; Medeiros, A.B.P.; de Souza Vandenberghe, L.P. Pilot scale biodiesel production from microbial oil of Rhodosporidium toruloides DEBB 5533 using sugarcane juice: Performance in diesel engine and preliminary economic study. Bioresour. Technol. 2017, 223, 259–268. [Google Scholar] [CrossRef]
  5. Ye, Z.; Sun, T.; Hao, H.; He, Y.; Liu, X.; Guo, M.; Chen, G. Optimising nutrients in the culture medium of Rhodosporidium toruloides enhances lipids production. Amb Express 2021, 11, 1–11. [Google Scholar] [CrossRef]
  6. Wankhede, L.; Bhardwaj, G.; Saini, R.; Osorio-Gonzalez, C.S.; Brar, S.K. Technological modes and processes to enhance the Rhodosporidium toruloides based lipid accumulation. Microbiol. Res. 2024, 287, 127840. [Google Scholar] [CrossRef]
  7. Osorio-González, C.S.; Saini, R.; Hegde, K.; Brar, S.K.; Lefebvre, A.; Ramirez, A.A. Carbon/Nitrogen ratio as a tool to enhance the lipid production in Rhodosporidium toruloides-1588 using C5 and C6 wood hydrolysates. J. Clean. Prod. 2023, 384, 135687. [Google Scholar] [CrossRef]
  8. Spagnuolo, M.; Yaguchi, A.; Blenner, M. Oleaginous yeast for biofuel and oleochemical production. Curr. Opin. Biotechnol. 2019, 57, 73–81. [Google Scholar] [CrossRef]
  9. Wen, Z.; Zhang, S.; Odoh, C.K.; Jin, M.; Zhao, Z.K. Rhodosporidium toruloides-A potential red yeast chassis for lipids and beyond. FEMS Yeast Res. 2020, 20, foaa038. [Google Scholar] [CrossRef]
  10. Karamerou, E.E.; Webb, C. Cultivation modes for microbial oil production using oleaginous yeasts—A review. Biochem. Eng. J. 2019, 151, 107322. [Google Scholar] [CrossRef]
  11. Zhang, S.; Ito, M.; Skerker, J.M.; Arkin, A.P.; Rao, C.V. Metabolic engineering of the oleaginous yeast Rhodosporidium toruloides IFO0880 for lipid overproduction during high-density fermentation. Appl. Microbiol. Biotechnol. 2016, 100, 9393–9405. [Google Scholar] [CrossRef] [PubMed]
  12. Muiznieks, R.; Dace, E.; Stalidzans, E. Integrated Sustainability Score Implementation as an Objective Function in Sustainable Metabolic Engineering. Fermentation 2023, 9, 548. [Google Scholar] [CrossRef]
  13. Castañeda, M.T.; Nuñez, S.; Jamilis, M.; De Battista, H. Computational assessment of lipid production in Rhodosporidium toruloides in two-stage and one-stage batch bioprocesses. Biotechnol. Bioeng. 2024, 121, 238–249. [Google Scholar] [CrossRef]
  14. Castañeda, M.T.; Nuñez, S.; Garelli, F.; Voget, C.; De Battista, H. Comprehensive analysis of a metabolic model for lipid production in Rhodosporidium toruloides. J. Biotechnol. 2018, 280, 11–18. [Google Scholar] [CrossRef]
  15. Varma, A.; Palsson, B.O. Stoichiometric flux balance models quantitatively predict growth and metabolic by-product secretion in wild-type Escherichia coli W3110. Appl. Environ. Microbiol. 1994, 60, 3724–3731. [Google Scholar] [CrossRef] [PubMed]
  16. Fei, Q.; O’Brien, M.; Nelson, R.; Chen, X.; Lowell, A.; Dowe, N. Enhanced lipid production by Rhodosporidium toruloides using different fed-batch feeding strategies with lignocellulosic hydrolysate as the sole carbon source. Biotechnol. Biofuels 2016, 9, 1–12. [Google Scholar] [CrossRef] [PubMed]
  17. Bolmanis, E.; Dubencovs, K.; Suleiko, A.; Vanags, J. Model predictive control—A stand out among competitors for fed-batch fermentation improvement. Fermentation 2023, 9, 206. [Google Scholar] [CrossRef]
  18. Shen, H.; Gong, Z.; Yang, X.; Jin, G.; Bai, F.; Zhao, Z.K. Kinetics of continuous cultivation of the oleaginous yeast Rhodosporidium toruloides. J. Biotechnol. 2013, 168, 85–89. [Google Scholar] [CrossRef]
  19. Castañeda, M.T.; Nuñez, S.; Voget, C.; De Battista, H. In silico optimization of lipid production in Rhodosporidium toruloides by gene knockout strategies. IFAC-PapersOnLine 2019, 52, 94–99. [Google Scholar] [CrossRef]
  20. Burgard, A.P.; Pharkya, P.; Maranas, C.D. OptKnock: A bilevel programming framework for identifying gene knockout strategies for microbial strain optimization. Biotechnol. Bioeng. 2003, 84, 647–657. [Google Scholar] [CrossRef]
  21. King, Z.A.; Dräger, A.; Ebrahim, A.; Sonnenschein, N.; Lewis, N.E.; Palsson, B.O. Escher: A web application for building, sharing, and embedding data-rich visualizations of biological pathways. PLoS Comput. Biol. 2015, 11, e1004321. [Google Scholar] [CrossRef] [PubMed]
  22. Orth, J.D.; Thiele, I.; Palsson, B.Ø. What is flux balance analysis? Nat. Biotechnol. 2010, 28, 245–248. [Google Scholar] [CrossRef]
  23. Gomez, J.A.; Höffner, K.; Barton, P.I. DFBAlab: A fast and reliable MATLAB code for dynamic flux balance analysis. BMC Bioinform. 2014, 15, 409. [Google Scholar] [CrossRef] [PubMed]
  24. Gurobi Optimization, LLC. Gurobi Optimizer Reference Manual. 2025. Available online: https://www.gurobi.com (accessed on 3 May 2025).
  25. Pirt, S.J. Maintenance energy: A general model for energy-limited and energy-sufficient growth. Arch. Microbiol. 1982, 133, 300–302. [Google Scholar] [CrossRef]
  26. Heirendt, L.; Arreckx, S.; Pfau, T.; Mendoza, S.N.; Richelle, A.; Heinken, A.; Haraldsdóttir, H.S.; Wachowiak, J.; Keating, S.M.; Vlasov, V.; et al. Creation and analysis of biochemical constraint-based models using the COBRA Toolbox v. 3.0. Nat. Protoc. 2019, 14, 639–702. [Google Scholar] [CrossRef]
  27. Li, Y.H.; Liu, B.; Zhao, Z.B.; Bai, F.W. Optimization of Culture Conditions for Lipid Production by Rhodosporidium toruloides. Chin. J. Biotechnol. 2006, 22, 650–656. [Google Scholar] [CrossRef]
  28. Janda, S.; Kotyk, A.; Tauchová, R. Monosaccharide transport systems in the yeast Rhodotorula glutinis. Arch. Microbiol. 1976, 111, 151–154. [Google Scholar] [CrossRef]
  29. Karamerou, E. Bioprocessing Strategies for the Cultivation of Oleaginous Yeasts on Glycerol; The University of Manchester: Manchester, UK, 2016. [Google Scholar]
  30. Mozumder, M.S.I.; Goormachtigh, L.; Garcia-Gonzalez, L.; De Wever, H.; Volcke, E.I. Modeling pure culture heterotrophic production of polyhydroxybutyrate (PHB). Bioresour. Technol. 2014, 155, 272–280. [Google Scholar] [CrossRef]
  31. Zheng, X.; Hu, R.; Chen, D.; Chen, J.; He, W.; Huang, L.; Lin, C.; Chen, H.; Chen, Y.; Zhu, J.; et al. Lipid and carotenoid production by the Rhodosporidium toruloides mutant in cane molasses. Bioresour. Technol. 2021, 326, 124816. [Google Scholar] [CrossRef]
  32. Saini, R.; Osorio-Gonzalez, C.S.; Hegde, K.; Brar, S.K.; Vezina, P. Effect of creating a fed-batch like condition using carbon to nitrogen ratios on lipid accumulation in Rhodosporidium toruloides-1588. Bioresour. Technol. 2021, 337, 125354. [Google Scholar] [CrossRef]
  33. Wiebe, M.G.; Koivuranta, K.; Penttilä, M.; Ruohonen, L. Lipid production in batch and fed-batch cultures of Rhodosporidium toruloides from 5 and 6 carbon carbohydrates. BMC Biotechnol. 2012, 12, 26. [Google Scholar] [CrossRef] [PubMed]
  34. Zhao, X.; Hu, C.; Wu, S.; Shen, H.; Zhao, Z.K. Lipid production by Rhodosporidium toruloides Y4 using different substrate feeding strategies. J. Ind. Microbiol. Biotechnol. 2011, 38, 627–632. [Google Scholar] [CrossRef] [PubMed]
  35. Li, Y.; Zhao, Z.K.; Bai, F. High-density cultivation of oleaginous yeast Rhodosporidium toruloides Y4 in fed-batch culture. Enzym. Microb. Technol. 2007, 41, 312–317. [Google Scholar] [CrossRef]
  36. Tchakouteu, S.S.; Kopsahelis, N.; Chatzifragkou, A.; Kalantzi, O.; Stoforos, N.G.; Koutinas, A.A.; Aggelis, G.; Papanikolaou, S. Rhodosporidium toruloides cultivated in NaCl-enriched glucose-based media: Adaptation dynamics and lipid production. Eng. Life Sci. 2017, 17, 237–248. [Google Scholar] [CrossRef]
Figure 1. Operating ranges for the proposed feeding design considering the different strains: WT (light blue), KO (pink), and DKO (green). F m i n represents the feed flow rate at which the feeding phase lasts 5 days.
Fermentation 11 00354 g001
Figure 2. Growth and lipid production in WT (a,b), KO (c,d), and DKO (e,f) strains during fed-batch cultivation. For each strain, simulations were performed using a glucose mass feed rate of ( F i n · s r ) m a x , with either the s r , m i n (left column) or s r , m a x (right column) reservoir glucose concentration (Table 2). The vertical dotted line marks the transition from the batch to the feeding phase.
Fermentation 11 00354 g002
Figure 3. Bioprocess efficiency metrics for the WT strain across the full range of glucose mass feed rates ( F i n · s r ) and feed glucose concentrations ( s r ). The evaluated parameters include (a) lipid yield on glucose ( y l / s ), (b) intracellular lipid content ( % T A G ), (c) lipid productivity ( P l ), (d) residual biomass productivity ( P x ), (e) final lipid titer ( T l ), and (f) carbon utilization efficiency (CUE).
Fermentation 11 00354 g003aFermentation 11 00354 g003b
Figure 4. Bioprocess efficiency metrics for the KO strain across the full range of glucose mass feed rates ( F i n · s r ) and feed glucose concentrations ( s r ). The evaluated parameters include (a) lipid yield on glucose ( y l / s ), (b) intracellular lipid content ( % T A G ), (c) lipid productivity ( P l ), (d) residual biomass productivity ( P x ), (e) final lipid titer ( T l ), and (f) carbon utilization efficiency (CUE).
Fermentation 11 00354 g004
Figure 5. Bioprocess efficiency metrics for the DKO strain across the full range of glucose mass feed rates ( F i n · s r ) and feed glucose concentrations ( s r ). The evaluated parameters include (a) lipid yield on glucose ( y l / s ), (b) intracellular lipid content ( % T A G ), (c) lipid productivity ( P l ), (d) residual biomass productivity ( P x ), (e) final lipid titer ( T l ), and (f) carbon utilization efficiency (CUE).
Fermentation 11 00354 g005
Figure 6. Feeding parameters used for comparative analysis of the WT and engineered strains. Circles indicate the common conditions evaluated for all strains: a fixed glucose mass feed rate ( F i n · s r ) of 2.5 g/h and feed glucose concentrations ( s r ) ranging from 31.32 g/L to 111.98 g/L.
Fermentation 11 00354 g006
Figure 7. Bioprocess efficiency metrics for the WT (blue), KO (orange), and DKO (yellow) strains under a common glucose mass feed rate ( F i n · s r ) of 2.5 g/h. The feed glucose concentration ( s r ) was varied from 31.315 g/L (corresponding to the s r , min of the WT strain) to 111.977 g/L (corresponding to the s r , max of the DKO strain). The evaluated metrics include (a) lipid yield on glucose ( y l / s ), (b) lipid content ( % T A G ), (c) lipid productivity ( P l ), (d) residual biomass productivity ( P x ), (e) final lipid titer ( T l ), and (f) carbon utilization efficiency (CUE), enabling a comprehensive comparison of process performance across the three strains.
Fermentation 11 00354 g007
Table 1. Parameters used in fed-batch simulations.
ParameterDescriptionValue
V 0 Batch phase volume3 L
V f Final fed-batch volume4.5 L
x 0 Initial biomass concentration (batch)0.5 g/L
s 0 Initial glucose concentration (batch)30 g/L
l 0 Initial lipid concentration (batch)0 g/L
s b Final glucose concentration (batch)0.0054 g/L
v ATPM NGAM reaction flux0.422 mmol/g h 
m s Maintenance coefficient0.0045 g/g h 
v s , max Glucose maximum uptake rate−3.07 mmol/g h 
v n , max Ammonia maximum uptake rate−1.95 mmol/g h 
v l , max Lipid maximum production rate0.057 mmol/ g h 
K s Glucose half-saturation constant0.47 mmol/L §
K n Ammonia half-saturation constant3.571 mmol/L
f l , m a x Max. lipid-to-residual biomass ratio3.1667
f l , m i n Min. lipid-to-residual biomass ratio0.25
β Lipid saturation power coefficient3.85
y x / n biomass to nitrogen source yield6.25 Cmol/Nmol ζ
References: [18], § [28], [29], [27], [1], [30], ζ [14].
Table 2. Minimum and maximum values of the glucose mass feed rate ( F i n · s r ) and the glucose concentration in the reservoir ( s r ) for each strain, expressed in g/h and g/L, respectively.
Strain ( F in · s r ) min (g/h) ( F in · s r ) max (g/h) s r , min (g/L) s r , max (g/L)
WT0.2578.85831.315396.661
KO0.1746.12314.747243.476
DKO0.1083.74228.671111.977
Table 3. Reported lipid production metrics for WT Rhodosporidium toruloides in fed-batch cultivations using glucose as sole CES.
StrainMethod y l / s (g/g) % TAG P l (g/L h)Reference
CBS14Constant and intermittent feed0.22750.21 [33]
RT880Intermittent feed0.09260.13 [11]
Y4Constant and intermittent feed0.20–0.2358.6–61.80.36–0.57 [34]
Y4Intermittent feed0.2367.50.54 [35]
DSM 4444Intermittent feed0.2164.50.088 [36]
Disclaimer/Publisher’s Note: The statements, opinions and data contained in all publications are solely those of the individual author(s) and contributor(s) and not of MDPI and/or the editor(s). MDPI and/or the editor(s) disclaim responsibility for any injury to people or property resulting from any ideas, methods, instructions or products referred to in the content.

