1. Introduction
In the last decades, there has been a notable increase in interest in functional foods, attributed to their potential health benefits. These foods are distinguished by their capacity to provide advantages that go beyond basic nutritional value [
1]. Among them, fermented foods have gained considerable attention for their potential to improve gut health and overall well-being, while also contributing to food preservation and improving sensory qualities [
2].
Beer, the most widely consumed fermented beverage globally, is recognized for its nutritional value, provided it is consumed in moderation [
3]. A diverse array of beer styles exists, each offering distinct flavors and characteristics. Recent innovations in brewing have led to the creation of beers fermented with probiotics, which have attracted growing interest as they bridge the gap between traditional brewing and the rising demand for functional, health-oriented beverages [
4]. Probiotics are microorganisms that, when administered in adequate amounts, confer health benefits to the host [
5]. However, a crucial consideration in realizing these benefits is identifying the effective dose of probiotics, a factor far from standardized. This is because the optimal dose is highly dependent on several variables: the specific health outcome targeted, the particular probiotic strain employed, the method of delivery (e.g., capsule, liquid), and the route of administration. Consequently, establishing a universally optimal probiotic dose is a significant challenge, highlighting the need for personalized dosage regimens to maximize efficacy and safety [
6]. Tailoring the probiotic dose to individual needs ensures the best possible response and minimizes the risk of ineffective treatment or adverse effects. The incorporation of probiotic yeast strains into beer production not only enhances the nutritional and functional profile of the beverage but also presents unique challenges and opportunities for understanding microbial dynamics and optimizing fermentation processes [
7,
8].
Yeasts are versatile eukaryotic microorganisms with applications in various industries, including brewing and probiotic production. Their resistance to adverse conditions and their ability to metabolize a wide range of substrates make them ideal as fermentation starters and probiotics, offering benefits in health and food production [
9,
10]. Within functional beverages, dairy products boast the longest established history, commonly utilizing lactic acid bacteria with probiotic functionalities. Lately, fruit, vegetables, legume, cereal, coffee, and tea-based juices are rapidly gaining market prominence. In these beverages, the contribution of yeasts is crucial, providing probiotic properties beneficial to the consumer and placing them in a position of preference [
11,
12,
13]. These properties expand the possibilities for functional food products, including probiotic beers with enhanced health benefits. Combining traditional brewing techniques with advanced biotechnology offers exciting new avenues for improving beer quality, understanding microbial interactions, and overcoming production challenges. This research, driven by increasing consumer demand for gut-health promoting beverages, positions probiotic beer as a novel functional food within the expanding health-focused beverage market [
14].
The use of an autochthonous probiotic yeast strain from the viticultural environments of San Juan, Argentina, represents a novel approach in the brewing industry. The distinct agroecological conditions of this region contribute to the unique properties of the yeast, making it a valuable candidate for probiotic beer production. This research expands on extensive prior work by the research group focusing on microbial growth kinetics [
15,
16] and the characterization of autochthonous yeast strains from the region. Previous studies have comprehensively assessed fermentative performance, flavor complexity in craft beer, and key probiotic attributes including biosafety, resistance to gastrointestinal conditions (low pH, bile salts), and adhesion properties (hydrophobicity, autoaggregation, and biofilm formation). Additionally, in laboratory-scale experiments, this yeast exhibited enzymatic activities that promote digestion, such as lipases, proteases, and phytases. It demonstrated antioxidant activity against the DPPH (2,2-diphenyl-1-picrylhydrazyl) radical, reduced cholesterol concentrations in the medium, and produced organic acids of interest, including lactic, acetic, and propionic acids [
17,
18].
Mathematical modeling is a fundamental tool that employs mathematical equations to describe the behavior of fermentation systems. It offers a wide range of approaches, from complex thermodynamic and phenomenological models to simpler kinetic models, adapting to the specific needs of each study [
19]. Beer fermentation has been extensively studied, leading to the development of highly complex traditional models that often fail to adequately represent the specific complexities of probiotic fermentation, particularly the lag phases and metabolite production. Dry cell weight (DCW) measurements, frequently used in such models, are unsuitable for this study, as they do not accurately reflect the crucial final viable cell count [
20]. Some bibliographic studies propose growth and viability parameters over short periods, without describing the complete fermentation process. This presents a challenge, as determining the viable cell count is crucial at the end of fermentation, when the cells are in the dead phase. These viable cells are essential for providing probiotic properties to the beer, transforming it into a functional beverage and adding significant value to the final product [
21]. Additionally, some models suggest that the rate at which viable cell concentration evolves during the fermentation phase is a combination of viable cell growth, viable cell death, and the conversion of latent cells into viable cells. These processes, influenced by environmental stressors, are modeled using complex experimental data, presenting significant challenges for the craft brewing industry [
22]. Specifically, these models are highly coupled and nonlinear, as they require detailed measurements and extensive experimental data to validate the parameters of the intricate model. Classical and validated models provide a foundational framework for characterizing microbial growth [
23,
24]; however, they are not suitable for this case, where there is a particular interest in the behavior of viable cells.
A simple way to study the fermentative kinetics of beer is through the adjustment of simple mathematical models that describe the growth of probiotic yeast and alcohol production. In this work, the logistic model, widely studied in fermentation processes, and the FOPDT: First Order Plus Dead Time model, commonly used by process engineers, were used to fit the cell growth kinetics. Meanwhile, a modified Luedeking–Piret model, developed by our group, was applied to fit ethanol production. The incorporation of a delay parameter in this latter model allowed for greater accuracy in predicting alcohol production [
15,
25].
The primary objective of this study is to apply a novel and comprehensive modeling approach to describe probiotic beer production. This approach integrates the logistic growth model, the FOPDT model, and a modified Luedeking–Piret equation [
15]. The models incorporate two state variables: total cells and dead cells. Additionally, they include delay functions to account for the lag phase and cell death, both essential for accurately modeling microbial kinetics. Experimental data from controlled microfermentations quantified biomass growth, dead phase dynamics, and metabolite production rates. These factors are particularly relevant for autochthonous probiotic strains, whose lag phases are influenced by environmental conditions [
26]. Modeling these dynamics is necessary to achieve a final cell concentration that ensures health benefits.
2. Materials and Methods
2.1. Microorganisms
Saccharomyces cerevisiae PB101 was isolated from grape must of spontaneous fermentation during the 2011 harvests (San Juan, Argentina), belonging to the collection of autochthonous microorganism strains of the Institute of Biotechnology, Faculty of Engineering, National University of San Juan. The yeast strain was identified by conventional morphological, physiological, and biochemical assays according to [
27] and a molecular assay as described [
28]. This yeast was selected based on the following parameters: Biosecurity traits: hemolytic activity and urease negativity, resistance to antibacterials (ampicillin, gentamicin, levofloxacin, rifampicin, tetracycline, chloramphenicol), and sensitivity to broad spectrum antifungals (ketoconazole, clotrimazole, itraconazole, miconazole and nystatin); Tolerance to gastrointestinal tract conditions: growth at 37, 39, and 42 °C, resistance to acidic pH values (2 and 3) and bile salts (1%) with a bile resistance index IR: 15; Properties for adhering to intestinal epithelial cells: hydrophobicity, biofilm production (greater than the control strain), and autoaggregation (greater than 85%); Tolerance to simulated gastrointestinal tract conditions [
18].
In addition,
S. cerevisiae PB101 was selected for having the best technological traits, such as oxidative and fermentative assimilation of sugars, present in the beer wort, (glucose, maltose, sucrose and fructose) and determination of off-flavor compounds (production of volatile phenols and production of sulphydric acid) [
29].
S. cerevisiae Safale US05 (Fermentis®, Marquette-lez-Lille, France) was used as a positive control for the fermentation assays. Uninoculated culture media will be treated as a negative control. All isolates are stored and preserved in a glycerol solution (25%) at −80 °C.
2.2. Fermentation Assay
Yeasts were activated and propagated in YEPD broth (g/L: yeast extract 10, peptone 20, glucose 20) under gentle shaking for 24 h prior to experimental use.
A total of two beer fermentations were conducted during the years 2024 and 2025. We inoculated 1 × 10
7 cells/mL of previously activated yeast in 2000 mL Erlenmeyer flasks with 1400 mL of brewer’s wort Kolsch style (initial conditions: 1046 OG/11.5 °P initial, 20 IBU, pH 5.2). The worts were aerated, reaching 7.8 ppm of oxygen, according to the analytical microbiological EBC method [
30] and 4.5 g/hL of diammonium phosphate (FERMOPLUS
® Dap Free, Mendoza, Argentine) was added prior pitching. The worts used in this study were provided by Donata del Desierto Brewery immediately after boiling. These worts were dispensed into a sterile container and transported under refrigerated conditions to the laboratory for the experimental trials.
The assays were incubated under static conditions (without agitation) at a controlled temperature of 18 ± 1 °C throughout the process. Fermentation kinetics were monitored daily by measuring density, weight loss, and the plate count of colony-forming units (CFU) of yeast on YEPD agar.
At the end of the fermentation process, density, pH, and alcohol content (% v/v) were determined. The following parameters were then calculated:
- -
Apparent attenuation (AA) [
29]:
- -
Alcohol content (%
v/
v): is the capacity of a strain to produce ethanol alcohol [
31]:
where Original gravity (OG) and Final gravity (FG).
2.3. Simulated Gastrointestinal Passage
Digestion under simulated in vitro gastric and pancreatic conditions was performed following the method described by [
32] with modifications. For gastric condition, a synthetic gastric juice was prepared in a buffer solution at pH 2 (pH of gastric juice in the stomach) containing (g/L) NaCl 2.05, KH
2PO
4 0.60, CaCl
2 0.11 and KCl 0.37. After sterilization of the medium, 0.0133 g/L of filter-sterilized pepsin (0.22 μm) was added. Aliquots of 10 mL of fermented craft beer assays with probiotic yeast (4600 rpm, 10 min) were centrifuged and the pellet (from the biomass produced during fermentation) was washed twice with PBS. Then, the yeast cells were resuspended in 7 mL of the gastric solution, and the cell concentration was adjusted to approximately 1 × 10
8 CFU/mL. The gastric solution with yeast was incubated for 2.5 h (approximate time of food passage through the stomach) at 37 °C (internal body temperature) under constant agitation at 100 rpm., to simulate peristaltic movements. At this stage, samples were taken at 0 and 2.5 h (initio and final), diluted and plated for subsequent viable cell count (CFU).
The simulation of the pancreatic solution was carried out using a buffer solution at pH 7.0 (pH of the duodenum) containing: bile salts (3.0 g/L), filter-sterilized pancreatin (0.1 g/L), Na
2HPO
4 (26.9 g/L) and NaCl (8.5 g/L). Subsequently, the pancreatic phase was carried out, for which the cells harvested during the previous (gastric) step were centrifuged (4600 rpm, 5 min) and then resuspended in 7 mL of the pancreatic solution. The suspension (pancreatic solution and yeast) was incubated for 3 h (approximate time the food bolus spends in the duodenum) at 37 °C with agitation (100 rpm). Samples were taken after 0 and 3 h, diluted and plated for viable cell count (CFU). Survival during the two phases for each sampling point was determined as follows.
where:
log n° initial CFU/mL is the natural logarithm of initial number colony forming units.
log n° final CFU/mL is the natural logarithm of final number of colonies forming units.
2.4. Mathematical Model
The kinetics of probiotic yeast are described by adjusting a mathematical model previously studied by our research group. However, the study of viable cells xV is incorporated into this model. In microbial kinetics studies, total cells x1 are typically quantified experimentally. To analyze the kinetics of xV, the concept of population dead, represented by dead cells x2, is introduced. Thus, at any given time, the system is described using two state variables: x1 and x2, where xV is defined as the difference between x1 and x2. Additionally, ethanol production is analyzed during the fermentation process due to its correlation with viable cells. Experimental data obtained from samples collected during laboratory-scale brewing fermentation in 2025 are used to develop growth curves, which are subsequently fitted to mathematical models. The implemented models are detailed below.
2.4.1. Model 1: First Order Plus Dead Time
According to the explanation before and taking into account that two state variables are established, a FOPDT model is proposed for each one.
The dynamics of the total cell population are described by a first-order system Equation (1) with a delay (T
L). The term x
1,max (t − t
L) represents the delayed maximum cell population, accounting for the lag phase inherent in microbial adaptation. The initial condition (x
1 (0) = x
1 0) ensures that the simulation starts with the initial viable cell count.
The function
is defined by:
where:
: system time constant for total cells [h];
: total biomass growth rate [CFU/mL. h];
: current condition for total cells [CFU/mL];
: maximum total cell population [CFU/mL];
: initial condition for total cells [CFU/mL].
: delay time for total cells [h].
The initial conditions ensure that the simulation starts with the initial total cell count: x1 (0) = x1 0.
This piecewise function Equation (2) defines is the maximum cell population growth over time. Before the delay (t < tL), the maximum population remains at its initial value (x1 0). After the delay (t ≥ tL), the maximum population reaches the asymptotic limit (xmax).
Equation for dead cells
where:
: system time constant for dead cells;
: current condition for dead cells,
: Initial condition for dead cells.
The initial condition corresponds to the starting number of dead cells: x2(0) = x2 0.
The Equation (3) models the dynamics of dead cells (x
2) as a first-order system with a delay (t
D). The input function u
2 (t − t
D) represents the delayed contribution to the dead cell population. The initial condition (x
2(0) = x
2 0) corresponds to the starting number of dead cells.
The Equation (4) defines the point at which the cell dead process becomes significant, as it represents a fraction of the current total cell population (x1). For this reason, the parameter K1 is bounded within the range 0 ≤ K1 ≤ 1, ensuring that the fraction of total cells contributing to the dead cell population remains biologically and physically realistic.
Viable Cells
The viable cell population is computed as the difference between the total cells (x
1) and the dead cells (x
2). This relationship allows for the simulation of the viable cell trajectory over time, as shown in
Figure 1. In this way, yeast production kinetics have been modeled using a linear model with two state variables [
29].
The proposed mathematical model introduces two state variables to accurately capture the dynamics of viable cell populations in fermentation. Additionally, a delay term accounts for inherent process lags, ensuring a more precise representation of yeast growth behavior. This approach enables the simulation of viable cell population dynamics throughout fermentation. Yeast kinetics are modeled using a two-state-variable linear framework, improving the predictive capability of the system (
Figure 1).
The novelty of the mathematical model lies in the incorporation of two state variables to capture the real dynamics of the system, along with the addition of a delay term to account for the inherent time delays of the process.
Methodology for FOPDT Parameter Estimation
For an initial approximation of the model parameters, the following procedure is applied:
Lag time for growth tL and lag time for death tD.
- -
For tL, the experimental curve of viable cells xviable is analyzed to identify the point where the viable population begins to increase significantly after the latency period. This point defines tL.
- -
For tD, the curve of dead cells x2 is observed to determine the point at which the population of dead cells starts to increase following the exponential growth phase of viable cells. This marks the lag time tD.
Time constants τL and τD.
- -
The time constant is defined as the time required for a variable (total or dead cells) to reach 63.2% of its total change. To calculate the time constant, the total expected change in x1 or x2 is determined from the start of growth or death until it reaches its asymptotic value Xmax. The time constant, τL or τD, is defined as the difference between t1 (the time at which x reaches 63.2% of its maximum change, i.e., x(t1) = x (0) + 0.632 (xmax − x (0)) and tL or tD, respectively. Here, x represents either x1 or x2, depending on the parameter being determined.
Maximum cell population xmax.
- -
The asymptotic value of the total cell population curve x1 is observed. This value represents the maximum growth of the cell population achieved under controlled experimental conditions.
Death factor K1.
- -
K1 is defined as the fraction of viable cells that transition into the dead state. It is calculated as: K1 = (x2 max − x20)/xmax where Δx2 represents the increase in the dead cell population, and x1(t) is the total cell population at the corresponding time point. K1 is constrained between 0 and 1 to ensure biological and physical consistency.
Once the initial data is obtained, the parameter optimization process is performed using a hybrid methodology based on Monte Carlo and genetic algorithms, developed by our research team. For further details, refer to [
33,
34]. The algorithm combines two complementary approaches: Monte Carlo, a probabilistic method, and genetic algorithms, an evolutionary optimization technique. This integration enables an efficient and reliable exploration of the parameter space, improving the accuracy and effectiveness of the optimization process.
Note: It is important to highlight that the same hybrid strategy is utilized for optimizing the parameters of the models presented in the following sections.
2.4.2. Model 2: Logistic Growth Model
Equation for Total Cells
In Equation (7), the term in parentheses ensures that x1 remains at x1 0 for t < tL. For t > tL, x1 tends toward xmax.
Where:
: Specific growth rate of total cells;
: Current population of total cells;
: A delayed maximum viable cell population is added to this model, allowing for a better fit to the experimental data. This term ensures that growth slows as xT approaches its delayed maximum.
Equation for Dead Cells
The following equation models the gradual accumulation of dead cells in the system:
In Equation (8), the term U2 (t − tD) ensures that x2 remains at x2 0 for t < tD. For t > tD, x2 tends toward a fraction of x1. In the limiting case, as t→∞ (a very large time), if K1 = 1, then x2 will approach xmax, leading viable cells to tend toward zero.
Where:
: Initial condition for dead cells.
μ2: is the specific death rate of dead cells.
tD: lag time for dead cell population.
As in Equation (7), a delay term is added to improve the fit U2 (t − tD).
Viable Cells
The viable cell population xV is calculated from Equation (6).
Methodology for Logistic Parameter Estimation
Upper Limit of dead cells U2 and x1max
- -
Their calculation must follow the methodology described in FOPDT.
Growth and Death Rates μ1 and μ2
- -
For μ1: Fit the experimental data of total cells to the growth Equation (7). Optimize μ1 using a numerical approach (e.g., least squares fitting) to minimize the error between the model and experimental data.
- -
For μ2: Fit the dead cells data to Equation (8) and apply the same optimization process.
For parameters such as tL and tD, refer to the methodology previously described.
2.4.3. Modified Luedeking–Piret Equation for Product Formation (P)
A modified Luedeking–Piret equation is proposed for product formation. This strategy was originally formulated in [
15]. The Luedeking–Piret model with delay time or modified Luedeking–Piret model enhances predictive accuracy by addressing a key limitation in traditional fermentation models: the lag between biomass production and metabolite generation. This improvement is achieved by introducing a time delay parameter, which allows the model to account for the non-instantaneous relationship between cell growth and product formation.
where:
P is the product formation [g/L].
is the time delay for product formation [h].
is the growth-associated product yield coefficient [gproduct/CFU].
is the maintenance-associated product formation coefficient [gproduct/gbiomass h].
This model incorporates viable cells, allowing for a more precise fit to the experimental data, as they directly contribute to ethanol production. Additionally, a delay time is introduced in both terms of the modified Luedeking–Piret equation (Equation (9)), whereas the original formulation included a delay time td in only one of its terms [
15]. This refinement integrates both the inclusion of viable cells and the consideration of delays in both terms, significantly enhancing the model’s accuracy in capturing the system’s kinetic behavior.
2.5. Data Analysis
In each independent fermentation (2024–2025) triplicate replicates were performed; the results represent the mean of the three determinations together with the corresponding standard deviation. To determine the significance of the differences between the two groups (US05 and PB101) in each fermentation, the unpaired Student’s t-test was used. p-values less than 0.05 were considered statistically significant. InfoStat software version 2020 was used for data analysis.
Matlab version R2016b was used to test the fitting mathematical models for dynamic and metabolite cells production in all cases.
Evaluating the accuracy and statistical significance of the proposed models requires the use of key performance metrics such as LOF: Lack of Fit, MSE: Mean Squared Error, F-statistic, and p-value. These parameters provide a comprehensive assessment of model reliability, ensuring an optimal fit to the experimental data and strong predictive capabilities.
In this work, the global sensitivity of the models was explored by varying each parameter within a range of ±50% of its estimated value, while keeping the other parameters constant. The effect of these variations was measured through the relative error of the model. A parameter was defined as sensitive and well-estimated if a variation greater than 5% generated an increase of more than 5% in the discrepancy between the simulation and the experimental data.
3. Results and Discussion
This article explores the use of an autochthonous yeast with probiotic potential in craft beer production, emphasizing the significance of modeling cell growth and ethanol production for creating functional beverages. The PB101 strain, native to specific geographic regions, is increasingly recognized for its ability to impart unique flavors and characteristics to beers [
29]. Its probiotic properties make it especially valuable in the crafting of functional beers, making it essential to ensure its viability throughout the brewing process to maintain its beneficial effect. This yeast underwent experimental tests designed to evaluate its probiotic potential and resistance to the human digestive system, as described in
Section 2.3. Fermentation assays were conducted under the conditions outlined in
Section 2.2, generating experimental data on total cells, viable cells, and product formation, which were subsequently used for mathematical modeling (
Section 2.4).
3.1. Analysis of Final Parameters of Beer Fermentation
The results of fermentations conducted in the years 2024 and 2025 indicate that the autochthonous yeast registered lower sugar consumption (%AA) in the brewing wort compared to the commercial yeast. This lower sugar consumption correlated with a lower alcohol content (%A) in the beer brewed with the potential probiotic strain PB101. It is important to note that the final pH values obtained from fermentations using PB101 were lower than those from commercial strain, as shown in
Table 1.
Once the fermentation process was completed, the PB101 yeast reached a viable population of 5.50 × 10
7 in 2024 and 5.15 × 10
7 CFU/m in 2025 (
Table 1). These values differ significantly by the value of commercial yeast beer with values between 7.28 × 10
6 and 9.52 × 10
7 CFU/mL.
The brewing process presents a stressful environment for microorganisms due to the production of alcohol and acid, which can affect yeast viability during storage [
9,
21,
35], and could be considered an additional stress factor during gastrointestinal transit. In this study, beers fermented with the autochthonous yeast PB101, after 30 days of maturation at 4 °C, were subjected to simulated gastrointestinal conditions. The result was a 20–28% reduction in yeast survival until the final duodenal phase (
Table 1).
To exert the beneficial effect at the site of action, the probiotic must be at an adequate concentration, which will depend on its survival during gastrointestinal transit [
18]. Moreover, there are reports establishing a minimum concentration to be reached at the site of action (1 × 10
6 cel/mL) [
36,
37] to achieve a beneficial effect on the host. Thus, the autochthonous yeast PB101 recorded values between 1.07 × 10
6 and 2.55 × 10
6 CFU/mL after simulated gastrointestinal transit, suggesting that it could reach substantial concentrations at its site of action in the intestine.
However, studies indicate that the required concentration of viable cells varies considerably depending on the strain and the desired health, a general consideration for all probiotics [
38]. For example, studies with
Saccharomyces cerevisiae var.
boulardii—effective against antibiotic-associated diarrhea and
Clostridium difficile colitis—showed that, although 60% of the ingested yeast was not viable in the feces, viable yeast concentrations exceeded 10
5 CFU/g in the colon [
39]. This suggests that the yeast in this study reaches substantial concentrations at its site of action in the intestine. While a minimum concentration of 1 × 10
6 cells/mL was classically considered necessary for probiotic efficacy, current research indicates this is an oversimplification. The effective dose now appears to be dependent on the desired effect/property, the target outcome, and the specific probiotic microorganism employed.
It is important to note that the alcohol levels reached during fermentation did not significantly compromise the probiotic yeast population or the post-transit survival rate, as their values were comparable to those reported in other studies [
21,
40].
3.2. Description and Analysis of Proposed Models’ Adjustments
The models in this work show a strong fit with the experimental data (
Table 2,
Table 3 and
Table 4). To further evaluate their accuracy and statistical significance, key parameters such as the LOF, MSE, F-statistic, and
p-value were analyzed. These metrics help assess the reliability of the models, ensuring that they accurately capture experimental trends and provide robust predictive performance. Based on these criteria, users can select either the model with the highest R
2 value for better fit or the simplest option, depending on their needs. To optimize the model parameters using the coefficient of determination (R
2) as the optimization criterion, a hybrid algorithm was developed, integrating the Monte Carlo method with genetic algorithms, originally designed by our research group. The process began with the generation of an initial set of parameters through 500 Monte Carlo simulations, based on predefined reference values. The 50 best-performing parameter sets were then selected to form the first generation of the genetic algorithm. Standard genetic operators, including selection, crossover, and mutation, were applied to refine the parameter set further. To minimize the risk of converging to local optima, a randomly generated parameter set was introduced into each new generation. The optimization process continued for 30 simulation cycles, ensuring convergence to an optimal solution.
Figure 1 and
Figure 2 present the experimental results (means with their respective standard deviations) of PB101 and ethanol kinetics in the experiments, along with the fits of their respective mathematical models.
This study implements mathematical models that combine FOPDT with logistic growth models to describe the dynamics of probiotic beer fermentation. Tailored to the specific characteristics of Saccharomyces cerevisiae yeast, these models effectively adjust total biomass, viable cell counts, and ethanol production, clearly delineating lag, growth, and death phases. To correlate cell populations with product formation, a modified Luedeking–Piret equation was proposed, incorporating a time delay to account for the inherent dynamics of the fermentation process, achieving the desired results. Hence, this approach successfully integrates experimental data obtained under controlled conditions, focusing on viable cells, total biomass, and ethanol production. The primary goal was to accurately model the dynamics of viable yeast cell growth, death, and ethanol synthesis. The models’ adaptability and ease of calibration render them valuable tools for understanding probiotic beer production. The user can apply FOPDT or logistic models to represent the two state variables, total cells (x1) and viable cells (xv), or alternatively, combine models, using one model for total cells and another for dead cells. This flexibility allows for an approach that is either simplified or tailored to specific analytical needs, providing valuable adaptability in the modeling process.
3.2.1. Model 1: First Order Plus Dead Time
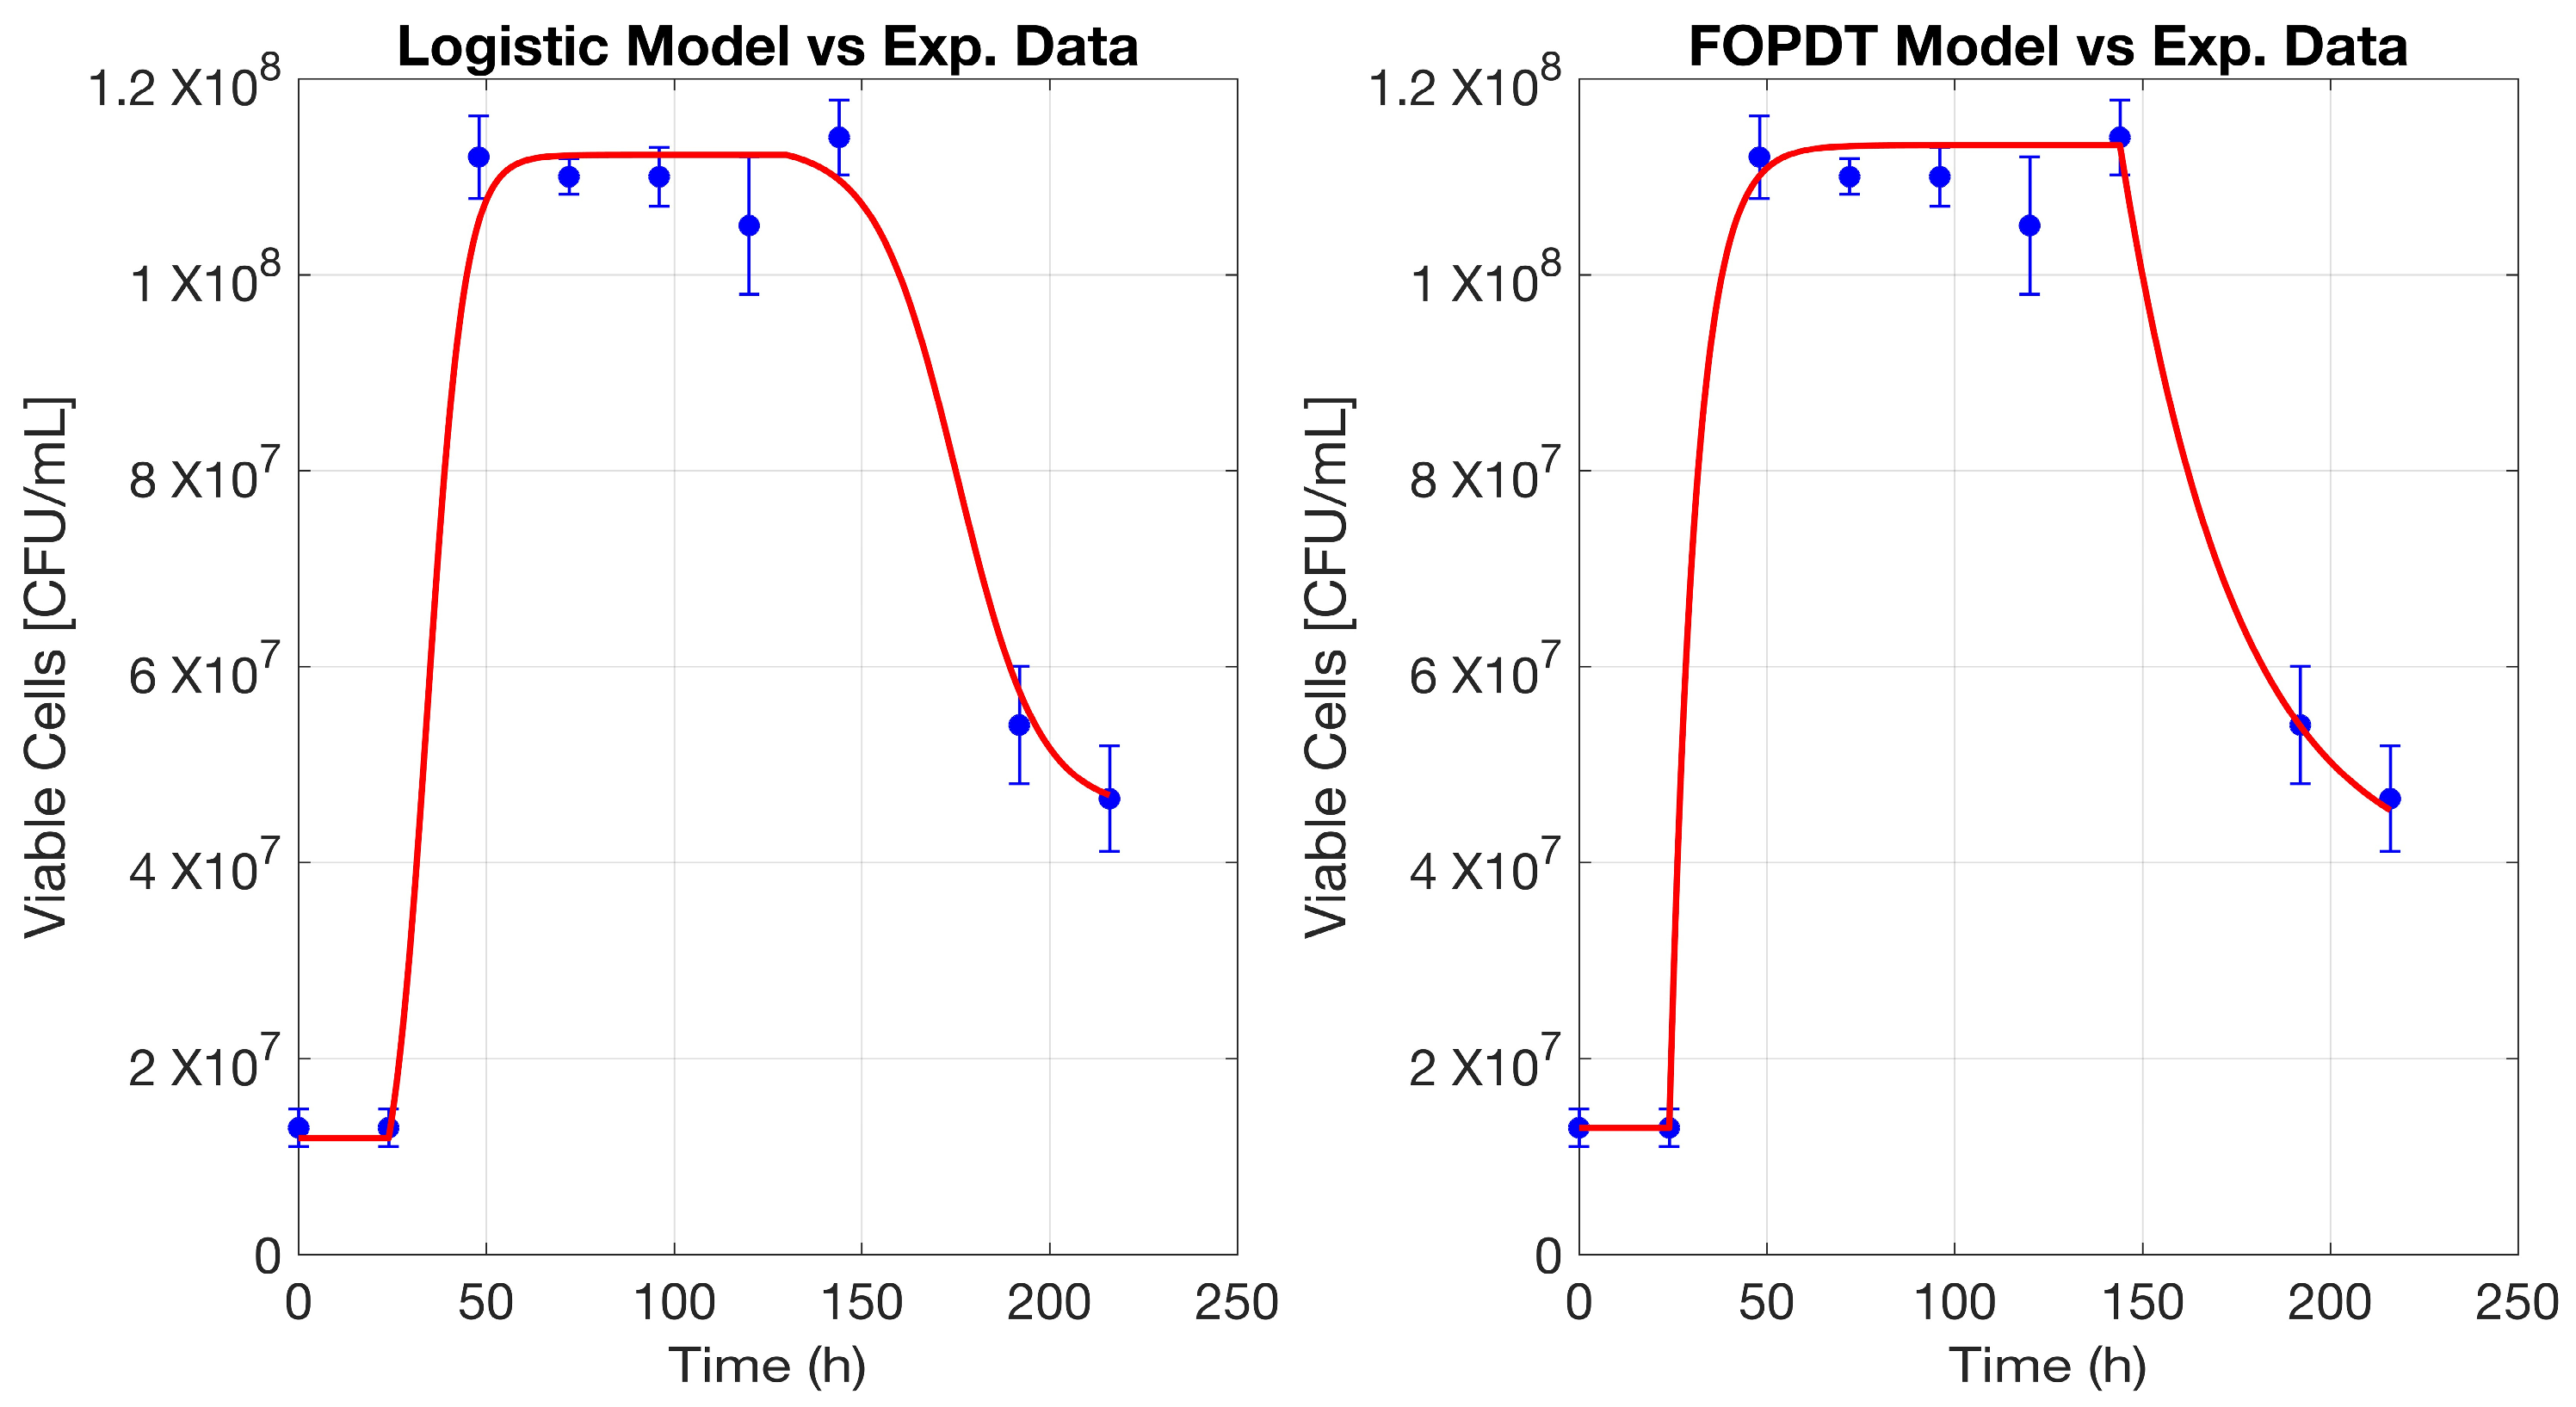
The FOPDT model was applied to describe yeast growth dynamics during fermentation, effectively capturing the key phases of microbial behavior. The model was used to fit the two state variables, total cell populations and dead cells, allowing for a realistic representation of viable cell evolution. By subtracting the modeled dead cell population from the total cells, the viable cell concentration was determined, which closely aligned with experimental data (
Figure 1). The growth phase, characterized by an initial lag period followed by an exponential phase, was effectively modeled using FOPDT for total cells. The delay incorporated into the model accounts for the adaptation period of yeast before active proliferation. This lag time is crucial in fermentation modeling, as it reflects the biological reality of microbial activation before reaching maximum metabolic activity. The modeled total cell curve follows the experimental data closely, demonstrating that the FOPDT approach can robustly describe the biomass accumulation phase. During the decline phase, the FOPDT model was also applied to estimate cell death dynamics, ensuring consistency in describing both growth and decay processes. The use of a separate model for dead cells allows for an independent assessment of cell mortality rates and their impact on viable cell populations. The gradual decrease in viable cells suggests that the delay introduced into the model successfully captures the temporal offset between peak biomass and the onset of significant cell death. To evaluate the adequacy of the proposed model in predicting the number of viable cells, a LOF analysis was performed, complemented by the calculation of the coefficient of determination R
2, the F-statistic, and its corresponding
p-value. First, the LOF value was determined to be 0.606, indicating a minimal discrepancy between the experimental and predicted values. Additionally, the MSE was 0.067, suggesting that the average per-sample error is low, reinforcing the model’s predictive accuracy. The high R
2 value of 99.33% indicates a strong correlation between the model predictions and experimental observations, supporting the model’s reliability in characterizing yeast fermentation kinetics. Furthermore, a lack-of-fit test was conducted using the F-statistic, yielding a value of 1.342 with an associated
p-value of 0.354. Since the
p-value exceeds the standard significance threshold of 0.05, the null hypothesis cannot be rejected, implying that no statistically significant LOF was detected. The ability of the FOPDT approach to simulate both total cell growth and cell death independently provides valuable insights into yeast viability throughout fermentation.
Overall, the modeling strategy demonstrates that a two-state-variable model using FOPDT, which is simple to implement, can effectively represent the complex temporal interactions in yeast fermentation.
3.2.2. Model 2: Logistic Growth Model
The logistic model was applied to describe yeast population dynamics throughout the fermentation process, offering a comprehensive representation of microbial behavior. This approach was utilized to estimate both total and dead cell populations, enabling a detailed assessment of viable biomass evolution over time. By subtracting the simulated dead cell count from the total biomass curve, the trajectory of viable cells was reconstructed, showing strong agreement with experimental measurements (
Figure 1).
The initial phase of the fermentation process, characterized by a progressive adaptation period followed by sigmoidal growth, was effectively modeled using a logistic function. This methodology inherently accounts for growth limitations imposed by nutrient availability and environmental constraints, making it particularly suited for biological systems where self-regulated expansion occurs. The model successfully reproduces the growth slowdown observed as fermentation progresses, accurately depicting the transition from active proliferation to the stationary phase. In the later stages, the logistic model was also employed to describe cell inactivation, maintaining consistency in the representation of both growth progression and viability loss. The use of a separate logistic function for cell mortality allowed for an individualized evaluation of the factors contributing to population decline. The simulated trend effectively illustrates how the depletion of essential resources and accumulation of metabolic byproducts influence cell survival, progressively leading to a reduction in viable biomass. A LOF analysis was performed, complemented by a significance test using the F-statistic and its corresponding p-value. The LOF value was calculated as 0.811, indicating a low discrepancy between the experimental and predicted values. Additionally, the MSE was 0.090, suggesting that the average per-sample error is low, reinforcing the model’s reliability. With an R2 value of 99.09%, the logistic model demonstrates a strong predictive capability, aligning closely with experimental observations and reinforcing its applicability to fermentation modeling. To assess the statistical significance of the LOF, the F-statistic was computed, yielding a value of 1.161, with an associated p-value of 0.425. Since the p-value is greater than the 0.05 significance threshold, the null hypothesis cannot be rejected, indicating that no statistically significant LOF was detected in the model. Its ability to independently represent both population expansion and cell attrition provides valuable information on yeast viability under varying fermentation conditions.
In this study, the FOPDT model and the logistic model were applied to characterize microbial growth and death dynamics in fermentation processes. These models are adaptable to a wide range of biological systems, regardless of whether they include a latency phase or a stationary plateau. They effectively capture key fermentation behaviors and allow for the application of one approach over the other, depending on specific modeling requirements. Both methodologies exhibit a strong correlation with experimental data, making them suitable for representing yeast population dynamics. In this case, the FOPDT model achieves a slightly superior fit; however, the logistic model provides a smoother trajectory, minimizing abrupt variations. This characteristic may be particularly advantageous in future applications related to process control and optimization, where gradual transitions and system stability are preferred. Furthermore, these models can be integrated into a hybrid framework, where total cell populations are estimated using the logistic model, while cell mortality is described using FOPDT, or alternatively, the reverse configuration may be employed based on the specific characteristics of the system. This adaptability enables a customized modeling approach, ensuring accurate representation of diverse biological processes.
3.2.3. Model 3: Modified Luedeking–Piret
The modified Luedeking–Piret (L-P) model, as introduced by [
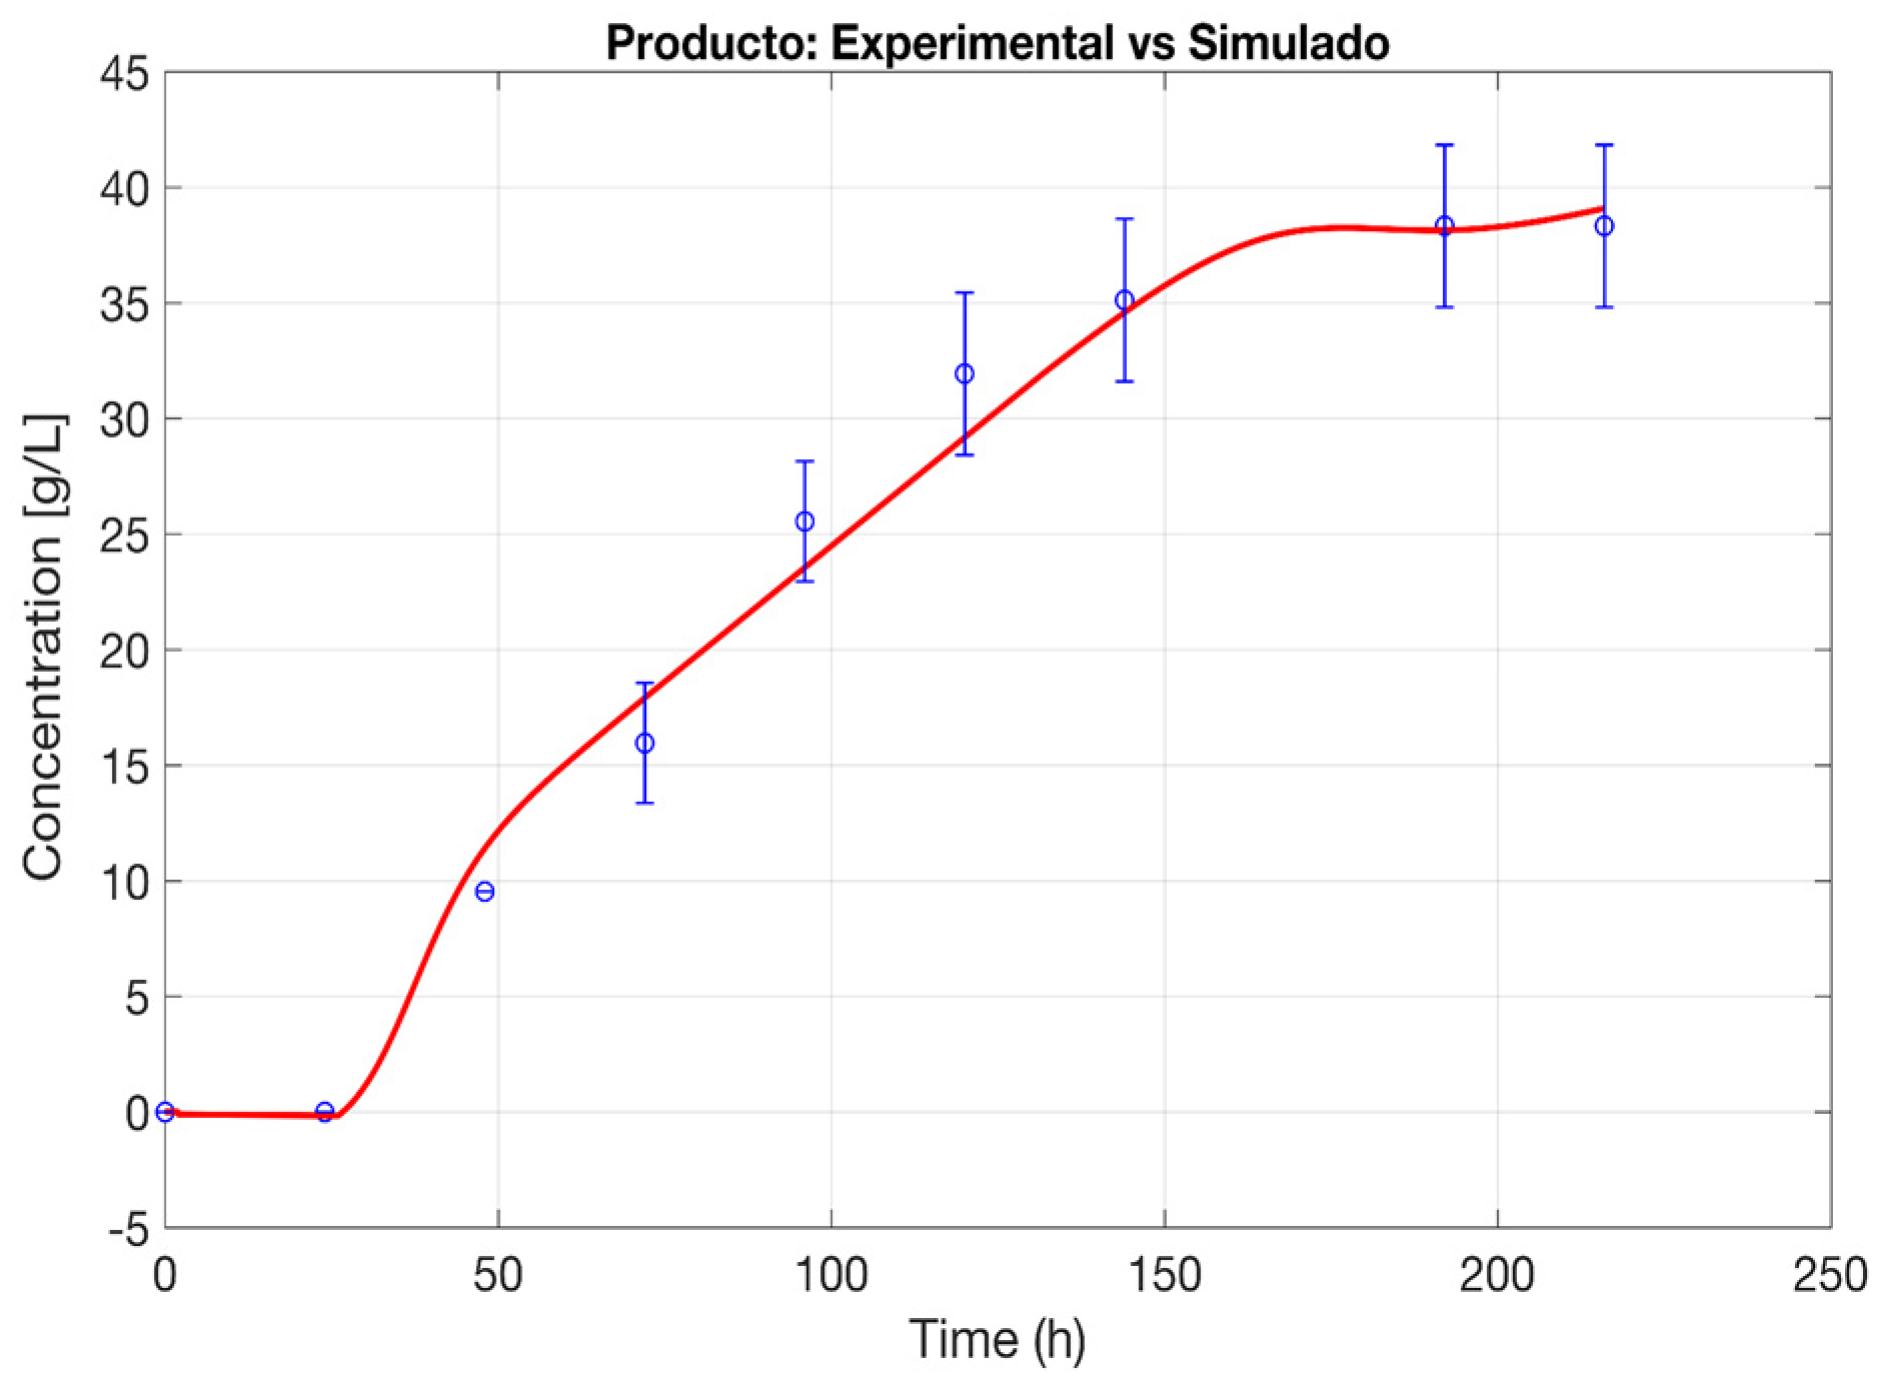
15], was applied to describe ethanol production dynamics, achieving a high degree of accuracy with an R
2 of 98.99% (
Figure 2). This strong correlation between experimental data and model predictions underscores the model’s capability to effectively capture the relationship between viable biomass and ethanol formation by incorporating both growth-associated Y
P/X and non-growth-associated mp terms, reflecting the dual contribution of microbial metabolism to ethanol synthesis. The ethanol production curve follows a well-defined trajectory, mirroring the temporal progression of viable cell populations.
During the initial phase, ethanol accumulation remains low, corresponding to the microbial adaptation period, while as cell growth accelerates, ethanol synthesis increases proportionally, driven by growth-associated production mechanisms. The model successfully accounts for this phase, aligning closely with observed experimental trends. A key feature of the model is its ability to integrate time-dependent metabolic transitions, which are particularly relevant in later fermentation stages. The gradual decline in ethanol productivity, despite the persistence of viable biomass, suggests the influence of substrate depletion, inhibitory byproducts, or physiological changes in microbial metabolism. The LOF value of 19.994 indicated a reasonable alignment between experimental and predicted data, while an MSE of 2.222 confirmed that deviations remained within acceptable limits. Furthermore, an F-statistic of 1.309, coupled with a p-value of 0.3657, provided additional statistical support, indicating that the model adequately describes ethanol production kinetics under the studied fermentation conditions. Additionally, the coefficient of determination R2, which quantifies the proportion of variability explained by the model, reached 0.9899, confirming that the model accounts for 98.99% of the variability present in the experimental data. This high degree of correlation reinforces the reliability of the proposed approach in modeling ethanol synthesis trends. Given that the p-value exceeded the 0.05 threshold, no significant LOF was observed, further validating the model’s suitability for describing ethanol production dynamics under the analyzed conditions.
The modified L-P framework, as proposed by [
15], effectively captures this behavior, demonstrating its robustness in modeling fermentation systems where metabolite synthesis extends beyond exponential growth phases. A major refinement in this model is the incorporation of a time-delay parameter, addressing the inherent lag between biomass production and ethanol synthesis. This adjustment aligns with previous findings that identified a distinct temporal separation between cell proliferation and metabolite accumulation, accounting for the metabolic adjustments required before ethanol production reaches its peak and further enhancing the model’s predictive accuracy. The ability of the modified Luedeking–Piret model to simulate ethanol production with such precision has significant implications for future process control strategies. By accurately describing both growth-dependent and independent ethanol synthesis, the model provides a valuable tool for optimizing fermentation conditions to maximize ethanol yield. Additionally, the high degree of correlation between modeled and experimental data validates the approach for potential applications in scaling up biotechnological processes. The flexibility of the model also enables integration with other kinetic models, such as FOPDT or logistic models, depending on specific fermentation conditions, making the modified L-P equation a robust framework for modeling ethanol production across various microbial systems.
The importance of modeling viable cell and ethanol production counts stems from their critical role in both beer fermentation and the final product’s probiotic properties. This specific yeast strain not only drives fermentation but also imparts functional characteristics by reaching the gut in sufficient numbers to exert a probiotic effect. Therefore, modeling its behavior was crucial for understanding its dynamics and key interactions during fermentation, ultimately contributing to the development of a functional probiotic beer. Additionally, incorporating kinetic models such as FOPDT, logistic growth, and the modified Luedeking–Piret equation allows for a more precise representation of microbial activity, ethanol formation, and cell viability over time. The ability to differentiate between total, viable, and dead cell populations enhances the accuracy of metabolic predictions, offering a structured framework for evaluating fermentation performance.
Following fermentation, the beer undergoes cold maturation, necessitating an assessment of cell viability and count post-maturation. This probiotic beer exhibited viability after 60 days of cold storage and simulated gastrointestinal transit [
29]. A minimum concentration of approximately 10⁶ CFU/mL is generally considered necessary for a probiotic to exert beneficial effects in the gut [
41], suggesting the potential for beneficial effects from the observed concentration. Therefore, the ability to accurately determine the viable cell count at the end of fermentation through a precise mathematical model is of great importance. These viable cells play a crucial role in defining the functional properties of beer, as they are directly responsible for transforming it into a functional food product.
Therefore, developing a precise mathematical approach that integrates viable cell count dynamics until the completion of fermentation is essential for ensuring consistency in probiotic beer production and, in the future, optimizing fermentation control strategies. However, some mathematical models [
21] do not provide a continuous, time-dependent framework to track viable cell populations from inoculation to the final fermentation stage. While these models estimate key kinetic parameters, such as specific growth rate, biomass yield, and generation time, they do not explicitly describe the complete trajectory of viable cells throughout the entire process. This limitation can result in gaps in accurately capturing cell viability dynamics, particularly during the later stages of fermentation when factors such as nutrient depletion, ethanol accumulation, and metabolic shifts influence yeast survival. Although DCW measurements are commonly employed in mathematical models to estimate biomass dynamics, they do not accurately capture the final viable cell count, which is a critical parameter in probiotic fermentations. The model presented in [
20] effectively predicts product formation using DCW as a growth indicator; however, it does not explicitly track the decline in viable cell populations, potentially leading to overestimations in metabolic activity when non-viable biomass accumulates over time. Other models describe microbial population dynamics by considering cell growth, death, and the transition of latent to active cells. The challenge lies in the fact that highly coupled and nonlinear models, such as those referenced in the literature [
22], require extensive experimental data for parameter validation, making their implementation demanding and their applicability limited.
The framework includes clear guidance on parameter selection and adjustment, making it readily applicable by industry practitioners.
4. Conclusions
In conclusion, the probiotic yeast Saccharomyces cerevisiae PB101 demonstrated effective brewing fermentation capabilities, achieving parameters comparable to those of the control strain. After simulated gastrointestinal exposure, PB101 showed high survival rates, suggesting its ability to reach significant concentrations at the probiotic site of action.
Logistic and First-Order Plus Dead Time (FOPDT) models were employed to fit experimental data on viable cell populations, achieving accuracy levels of 99.33% and 99.09%, respectively. The modified Luedeking–Piret equation indicated that ethanol production is more closely related to the cell growth rate than to cell count.
This study’s results indicate that the probiotic yeast fermentation process using S. cerevisiae PB101 has significant potential for scaling up to commercial production of probiotic beers, given its ability to survive harsh gastrointestinal conditions and maintain viability during storage. The developed mathematical models provide valuable tools for optimizing fermentation processes and ensuring the viability of probiotic strains in the final product, potentially enhancing the efficiency and quality of functional beers.
Further research is needed to evaluate the scalability of the fermentation process in large-scale industrial settings, considering variations in wort composition and fermentation temperatures. Stability studies are essential to determine the shelf life of probiotic beers, and clinical trials should be conducted to validate the health benefits of S. cerevisiae PB101, particularly regarding gut health, thus providing scientific evidence for its use in functional beverages.


 ,
, 

