Article

Transcriptome Analysis of Sclerotium rolfsii: Unraveling Impact of Glycolytic Pathway on Substrate Utilization and Microbial Polysaccharide Production

1
State Key Laboratory of Food Nutrition and Safety, Tianjin Engineering Research Center of Microbial Metabolism and Fermentation Process Control, College of Biotechnology, Tianjin University of Science & Technology, Tianjin 300457, China
2
Shandong Baoyuan Biotechnology Co., Ltd., Yantai 264006, China
*
Author to whom correspondence should be addressed.
Fermentation 2025, 11(3), 143; https://doi.org/10.3390/fermentation11030143
Submission received: 24 January 2025 / Revised: 7 March 2025 / Accepted: 7 March 2025 / Published: 13 March 2025
(This article belongs to the Special Issue Metabolic Engineering in Microbial Synthesis)

Abstract

Scleroglucan is the extracellular polysaccharide (EPS) produced by Sclerotium rolfsii (S. rolfsii). The low EPS titer and limited substrate utilization of S. rolfsii present significant challenges in the fermentation process, restricting industrial applications of scleroglucan. In this study, we performed a transcriptomic analysis on the mycelium of S. rolfsii fermented with different carbon sources. The key genes involved in polysaccharide biosynthesis (6-phosphofructokinase 1 (PFK1), pyruvate decarboxylase (PDC), aldehyde dehydrogenase (NAD (P)+) (ALDH3), and acetyl-CoA synthase (ACS)) were identified and their roles in the process were investigated. The supplementation of specific precursors—fructose-6-phosphate, pyruvate, aldehydes, and acetate—was shown to enhance both the polysaccharide titer and substrate utilization. By adding precursors, the titer of SEPS produced in a 5 L fermentation tank reached 48.69 ± 3.8 g/L. Notably, the addition of these precursors increased the titer of EPS fermented with sucrose (SEPS) by 65.63% and substrate utilization by 119.3%, while the titer of EPS fermented with lactose (LEPS) rose by 80.29% and substrate utilization rose by 47.08%. These findings suggest that precursor supplementation can effectively improve polysaccharide production and substrate efficiency, thereby minimizing resource waste and environmental impact.

1. Introduction

Sclerotium rolfsii (S. rolfsii) belongs to the soil-dwelling phylum Basidiomycota and sub-phylum Agaricomycotina fungus. EPS is produced by S. rolfsii via fermentation and is widely used in food processing, cosmetics, the pharmaceutical industry, crude oil recovery, and other industries due to its good ductility and rheological properties [1,2,3]. Scleroglucan remains stable over a wide pH range and at high temperatures, allowing it to be used as a stabilizer at a low pH and high temperatures, and also as a low-calorie functional food (since it is non-digestible). It can also be used as a thickener or preservative in starchy foods [4]. Wang et al. identified the key genes in sclerotium biosynthesis by Illumina sequencing of the S. rolfsii transcriptome [5]. Previous studies found that various carbon sources have significantly different effects on the titer and viscosity of EPS. Moreover, the glycolytic pathway is essential for promoting substrate carbon uptake, which subsequently drives the biosynthesis of EPS [6]. A comparative analysis of the titer and viscosity of EPS produced by S. rolfsii using different carbon sources revealed that SEPS exhibited a significantly higher titer and viscosity, whereas LEPS demonstrated a markedly lower titer and viscosity. Both carbon sources are disaccharides, but they produce different titers and viscosities of EPS. Therefore, S. rolfsii and its EPS obtained by fermentation with sucrose and lactose, respectively, were selected as the research objects of this study.
Changes in fermentation conditions can significantly affect the fermentation process. Tan et al. [7] adopted the pH drift strategy and added glucose in the later stage of fermentation to increase the titer of scleroglucan to 42 g/L. Moreover, the addition of precursor substances in a 5 L fermenter is expected to enhance the glycolysis pathway to increase the titer of SEPS produced by fermentation in 5 L fermenters by 65%. The biosynthesis process of microbial EPS is more complex and has been reported to include the anabolic pathways of polysaccharides, such as dextran [8], cellulose [9,10], hyaluronic acid [11,12], and xanthan gum. The main steps of polysaccharide biosynthesis basically include the absorption of sugar monomers, glycosyl transfer, the generation of sugar nucleotide donors, synthesis, modification, the polymerization of polysaccharide repeat units, and the transportation of polysaccharide macromolecules after synthesis [13,14]. The biosynthesis of scleroglucan follows the classical steps of microbial polysaccharide synthesis, which are divided into the following three phases: substrate uptake, sugar nucleotide donor generation, and polymerization and secretion. β-glucan biosynthesis begins with glucose transport into cells, followed by hexokinase-mediated phosphorylation into glucose-6-phosphate. Phosphoglucomutase then converts this intermediate to glucose-1-phosphate, which is subsequently activated by UTP-glucose-1-phosphate uridylyltransferase to form UDP-glucose. The linear β-(1→3)-glucan backbone is synthesized by β-(1→3)-glucan synthase using UDP-glucose as a substrate. Finally, trans-β-D-glucosidase introduces β-(1→6)-linked branches at periodic intervals along the polysaccharide chain [15]. Schmid et al. used different strategies to reveal the genes involved in scleroglucan synthesis and the oxalate metabolism of S. rolfsii. Putative genes associated with each predicted biosynthetic step of scleroglucan production, oxalate generation, and oxalate catabolism have been identified through genomic analysis [16]. The factor that most affects pH is generally the formation of oxalic acid as a byproduct. This is an essential loss carbon source during scleroglucan production. Genes and proteins in certain pathways can have important effects during EPS synthesis. Wang et al. [17] speculated that an ATP binding cassette transporter and phosphotransferase two-component system may be the most basic factor in EPS biosynthesis. Fu et al. [18] found that nitrogen stress promotes an improvement in MBFA9 polysaccharide synthesis ability and enhances the substrate utilization competition between polysaccharide synthesis and bacterial growth.
Although microbial fermentation has the advantages of abundant raw materials and easy extraction, its low substrate utilization and low polysaccharide production are problematic [19,20]. This severely limits the broader application of scleroglucan in industry, and the inadequate utilization of substrates leads to a waste of resources. Meanwhile, the production of by-products and the discharge of fermentation broth cause environmental pollution.
In this study, transcriptome analysis was conducted on the fungus S. rolfsii fermented by different carbon sources. Related genes and gene functions in polysaccharide synthesis were analyzed. Metabolic precursors were screened and added at different concentrations and different time points to explore their effects on parameters in the fermentation process of S. rolfsii. The results of this study provide a basis to increase the production of EPS, improve substrate utilization, and reduce environmental pollution.

2. Materials and Methods

2.1. Materials and Reagents

The following materials and reagents were used: anhydrous ethanol, anthrone, and concentrated H2SO4 (Tianjin Chemical Reagent Plant No. 2, Tianjin, China); lactose and sucrose (Yaohua Chemical Plant, Tianjin, China); MgSO4·7H2O, NaNO3, K2HPO4, KCl, FeSO4, FeCl3, and citric acid (Yaohua Chemical Plant, Tianjin, China); chloroform and acetonitrile (Tianjin Damao Chemical Reagent Plant, Tianjin, China); n-butanol (Tianjin Jindong Tianzheng Fine Chemical Reagent Factory, Tianjin, China); total RNA extraction kit (Beijing Solarbio Technology Co., Ltd., Beijing, China); and reverse transcription kit and real-time reverse-transcription polymerase chain reaction kit (Takara, Shiga, Japan). Unless otherwise specified, all reagents used were of pure analytical grade.

2.2. Culture Medium and Culture Conditions

The S. rolfsii strain SMR-1046 is deposited in the Strain Preservation Center, College of Biological Engineering, Tianjin University of Science and Technology. The sclerotium of S. rolfsii was inoculated in Erlenmeyer flasks (250 mL capacity), which were filled with 100 mL of potato dextrose broth (PDB) medium and incubated with shaking at 220 rpm and 28 °C for 72 h. Seed liquid culture containing a large amount of mycelium was obtained, then inoculated into the fermentation medium (5%), and incubated with shaking at 220 rpm and 28 °C. Samples were taken at fermentation time points of 0, 12, 14, 26, 48, 60, and 72 h to measure the pH, polysaccharide titer, and residual sugar content.
The seed culture medium composition was as follows (g/L): 50 glucose, 1 yeast extract, 2.25 NaNO3, 2 K2HPO4, 0.5 MgSO4·7 H2O, 0.5 KCl, 0.05 FeSO4, and 0.7 citric acid. The fermentation medium composition was as follows (in g/L): 50 sucrose or lactose, 1 yeast extract, 2.25 NaNO3, 2 K2HPO4, 0.5 MgSO4·7H2O, 0.5 KCl, 0.05 FeSO4, and 0.7 citric acid. The culture media were sterilized by autoclaving for 20 min at 115 °C.
Similarly, the seed liquid culture was inoculated into a fermenter containing 2.5 L of fermentation medium at an inoculum volume of 6%, with an aeration volume of 2.5 L/min, fermentation temperature of 28 °C, and a rotational speed of 200 rpm. Fermentation for 24 h was followed by replenishment at a concentration of 250 g/L sucrose at a rate of 20 mL/h for a total of 50 h. The pH was maintained at 4 for the first 45 h and 3 after 45 h. Samples were taken at 0, 12, 24, 36, 48, 60, and 72 h of fermentation time to measure the polysaccharide titer and residual sugar content. The fermenter medium composition was as follows: sucrose 60 g/L, tryptone 6.96 g/L, NaNO3 3.32 g/L, KCL 0.5 g/L, K2HPO4 1.34 g/L, MgSO4 0.92 g/L, and FeSO4 0.017 g/L. Fermentation was carried out in a 5 L fermentation tank.

2.3. Extraction of Extracellular Polysaccharides

Exopolysaccharides (EPSs) were extracted using an alcohol precipitation method. Briefly, the filtered fermentation broth was mixed with four volumes of anhydrous ethanol and incubated at 4 °C overnight. The mixture was then centrifuged at 5000 rpm for 20 min to obtain the precipitate. The precipitate was subsequently redissolved in deionized water, while the supernatant was concentrated under reduced pressure to recover the organic solvent. Both fractions were stored at 4 °C for further analysis.

2.4. Parameter Detection in Fermentation Process

For the detection of pH, approximately 2 mL of fermentation broth was collected at specific time intervals during the fermentation process. After centrifugation at 8000 rpm for 5 min, the supernatant was taken, and the pH of the solution was measured to plot the fermentation cycle–pH curve.
For the detection of residual sugars, about 2 mL of fermentation broth fermented for a certain time was collected. After centrifugation at 8000 rpm for 5 min, the supernatant was taken and diluted with deionized water to a certain multiple. The samples were analyzed by HPLC (Agilent Technologies, Santa Clara, CA, USA) equipped with an evaporative light scattering detector (ELSD) and a Prevail Carbohydrate ES column (250 mm × 4.6 mm). The mobile phase was acetonitrile–water (80:20) at a flow rate of 1.0 mL/min. The injection volume was 10 µL, the column temperature was 35 °C, the drift tube temperature was 90 °C, and the carrier gas rate was 2.2 L/min. This method can simultaneously quantify glucose, fructose, sucrose, lactose, and galactose.
The polysaccharide content was determined using the phenol sulfate method with glucose as the standard. The specific procedure was as follows:
(1)
Preparation of the Standard Curve
A standard curve was established by plotting the glucose concentration (g/L) against the corresponding absorbance values at 490 nm. Serial dilutions of glucose solutions (0–100 mg/L) were prepared, and their absorbance was measured following the phenol sulfate method.
(2)
Sample Analysis
The purified EPS solution was diluted to an appropriate concentration. Subsequently, the reaction was initiated by adding 1.0 mL of 5% (w/v) phenol solution and 5 mL of 98% (v/v) sulfuric acid to 1.0 mL of the diluted sample in a test tube. The mixture was allowed to stand at room temperature for 30 min, and the absorbance was measured at 490 nm using a spectrophotometer. Each sample was analyzed in triplicate, and the average absorbance value was used to calculate the polysaccharide concentration based on the glucose standard curve.
(3)
Blank Control
A blank control was prepared by replacing the sample with 1.0 mL of deionized water, and the same procedure was followed to correct for background absorbance.

2.5. Transcriptome and Metabolome Analysis

SEPS and LEPS comparison groups were set up by collecting S. rolfsii after 24 h and 48 h of fermentation with sucrose and lactose as carbon sources. Methods were referenced from Song et al. [21].
To identify the DEGs (differentially expressed genes) between two different samples/groups, the expression level of each transcript was calculated according to the transcripts per million reads (TPM) method. RSEM [22] was used to quantify gene abundances. Essentially, differential expression analysis was performed using the DESeq2 [23] or DEGseq [24]. DEGs with | l o g 2 F C |   1 and F D R > 0.05 (DESeq2) or F D R < 0.001 (DEGseq) were considered to be significantly differentially expressed genes. In addition, functional enrichment analysis, including GO and KEGG, was performed to identify which DEGs were significantly enriched in GO terms and metabolic pathways at a Bonferroni-corrected p - v a l u e < 0.05 compared with the whole-transcriptome background. GO functional enrichment and KEGG pathway analysis were carried out by the Goatools (Version 1.4.12) and Pythonscipy (Version 1.1.1.dev0) software, respectively.
The response intensities of the sample mass spectrometry peaks were normalized using the sum normalization method to obtain the normalized data matrix. Meanwhile, variables of QC samples with a relative standard deviation ( R S D ) > 30 % were excluded and log10 logarithmicized to obtain the final data matrix for subsequent analysis. Then, the R package “ropls” (Version 1.6.2) was used to perform a principal component analysis (PCA), orthogonal least partial squares discriminant analysis (OPLS-DA), and 7-cycle interactive validation evaluating the stability of the model. The metabolites with V I P > 1 , p < 0.05 were determined as significantly different metabolites based on the variable importance in the projeciton (VIP) obtained by the OPLS-DAmodel and the p-value generated by Student’s t test. Transcriptome and metabolome analyses were analyzed on the online platform of Majorbio Cloud Platform (https://cloud.majorbio.com/, accessed on 10 October 2020) [25].
Genes and metabolites with significant differential expression and production levels, respectively, were identified and analyzed. The number of differentially expressed genes and metabolites in the SEPS and LEPS comparison groups was calculated. The annotation results of Trinotate were used to count the genes annotated in each GO entry based on the Gene Ontology (GO) database. The metabolic pathways of the differential genes were analyzed by the Kyoto Encyclopedia of Genes and Genomes (KEGG). The genes were first annotated using KEGG, and the annotated proteins were matched into the corresponding pathways by KEGG Mapper for the enrichment analysis. Each pathway in KEGG was enriched and analyzed by a hypergeometric test. Pathways significantly enriched in differentially expressed genes were identified using p < 0.05 .

2.6. RNA Extraction and cDNA Synthesis

The fermentation broth collected in Section 2.4 was centrifuged and washed three times at 8000 rpm for 5 min, and the precipitate was mycelium. Then, 0.1 g of mycelium was used to extract the total RNA using the total RNA Extraction Kit (Solarbio, Beijing, China). After the RNA was extracted and verified, cDNA was synthesized from the total RNA using PrimeScript™ RT Reagent Kit with gDNA Eraser Kit (Takara).

2.7. RT-PCR Validation

Real-time PCR analysis was performed on pools of RNA derived from two independent biological experiments. All the samples were examined in triplicate. The cDNA sample was diluted 10 times in ddH2O and then used as the RT-PCR template. β-tubulin (β-TUB), a stably expressed housekeeping gene, was selected as the internal control for data normalization. Specific primer pairs were designed for the target genes chosen for validation using the Primer 5 software. TB Green ®Premix Ex Taq GC (Perfect Real Time) kit was used. The thermal cycle curve was set as follows: step 1, denaturation at 95 °C/30 s; step 2, PCR (40 repeats) 95 °C/10 s, 60 °C/30 s; and step 3, melting at 95 °C/15 s, 60 °C/1 min, 95 °C/15 s. qRT-PCR was used to analyze the relative gene expression levels according to the 2−∆∆CT method [26].

2.8. Precursor Addition Validation Experiment

According to differences screened by omics and the significance level of differential genes in the SEPS and LEPS comparison groups, genes with a significantly down-regulated expression were screened. The enzymes were located in the metabolic pathways to determine their precursors, which could enhance enzyme activity by the addition of precursor substances. Disodium acetaldehyde, acetic acid, pyruvate, and fructose 6-phosphate were prepared into 10 mg/mL solutions. At 0, 12, and 24 h of fermentation, precursors were added at 0.1 mg/mL to the fermentation broth at the corresponding time. After 72 h of fermentation with lactose as a carbon source, polysaccharides were extracted by alcohol precipitation. The polysaccharide content was determined using the anthrone–sulfuric acid method. The fermentation broth without precursors was used as the blank control.
Based on the single-factor test, the polysaccharide titer was taken as the response value according to the Box–Behnken central composite design principle. The preparation conditions were optimized by response surface analysis. The optimal preparation conditions were obtained using the Design-Expert 8.0.6 software. According to the optimal preparation conditions, lactose and sucrose were used as carbon sources for verification. The parameters in the fermentation process, including pH, polysaccharide titer, and residual sugar content, were detected according to Section 2.4.
Fermentation with sucrose as a carbon source in a 5 L fermenter was carried out. A total of 0.035 g/L of acetic acid and 0.83 g/L of pyruvate were added at 0 h of fermentation. In total, 1 g/L of disodium fructose 6-phosphate and 0.79 g/L of acetaldehyde were added at 24 h of fermentation. The detail parameters of cultivation in a 5 L fermenter are given in Section 2.2.

2.9. Mycelium Morphology

The ultrastructure of mycelium was observed using a scanning electron microscope (SEM, Hitachi, Tokyo, Japan). The mycelium was washed three times with PBS, pre-fixed with an electron microscope fixative (acetaldehyde) at 4 °C for 4 h, dehydrated sequentially with 30%, 50%, 70%, 80%, and 90% ethanol, and then dehydrated with anhydrous ethanol three times. The samples were placed in a critical point desiccator to replace the ethanol with liquid CO2 and subsequently heated to the critical point (31 °C, 73.8 bar) to vaporize the CO2 and avoid damage to the samples by surface tension. A gold plating conductive layer was sprayed for 60 s in a vacuum sprayer. Samples were observed at a magnification of 6000×, a working distance of 3.9 mm, and a working voltage of 1.00 kV.

2.10. Statistical Analysis

All the experiments were performed in triplicate and the results are presented as mean ± standard error (SE). For comparisons between two groups, Student’s t-test (for normally distributed data) was applied. A p-value of < 0.05 was considered to be statistically significant. Transcriptome and metabolome analyses were analyzed on the online platform of Majorbio Cloud Platform (https://cloud.majorbio.com/, access on 10 October 2022) [25]. Design response surface design and data analysis were conducted using the Design-export 8.0.6 software.

3. Results

3.1. Dynamic Analysis of the Fermentation Process

With 50 g/L of sucrose and lactose as substrates, fermentation was conducted in 250 mL Erlenmeyer flasks and fermentation broth was collected at 0, 12, 24, 36, 48, 60, and 72 h to monitor dynamic changes during the fermentation process. The titer of SEPS was 4.8 g/L ± 0.21 g/L, whereas the LEPS titer was 2.79 g/L ± 0.06 g/L (Figure 1A). The substrate utilization rate with lactose as a carbon source (55.9% ± 0.72%) was higher than that with sucrose (34.8% ± 3.4%) (Figure 1B). Sucrose was completely decomposed into glucose and fructose after 24 h of fermentation. Glucose and fructose showed a trend of increasing at the initiation stage and then decreasing (Figure 1C). No significant difference in pH was observed during the fermentation process, but the pH of both groups slightly increased at the late fermentation stage (Figure 1D).

3.2. Differences in Gene Expression Levels Under Different Carbon Sources

Screening identified the enzymes regulated by genes common to the 24 h and 48 h transcriptomes during the hydrolysis of sucrose. The genes regulated by glucose-6-phosphate isomerase, PFK1, and solute carrier family 35 (UDP-galactose transporter) were down-regulated. Among them, glucose-6-phosphate isomerase was the most significantly down-regulated. Considering the hexose catabolic pathway, the results show that these processes were most active during the growth phase, which is the stage of the rapid utilization of glucose and rapid growth of the fungus.
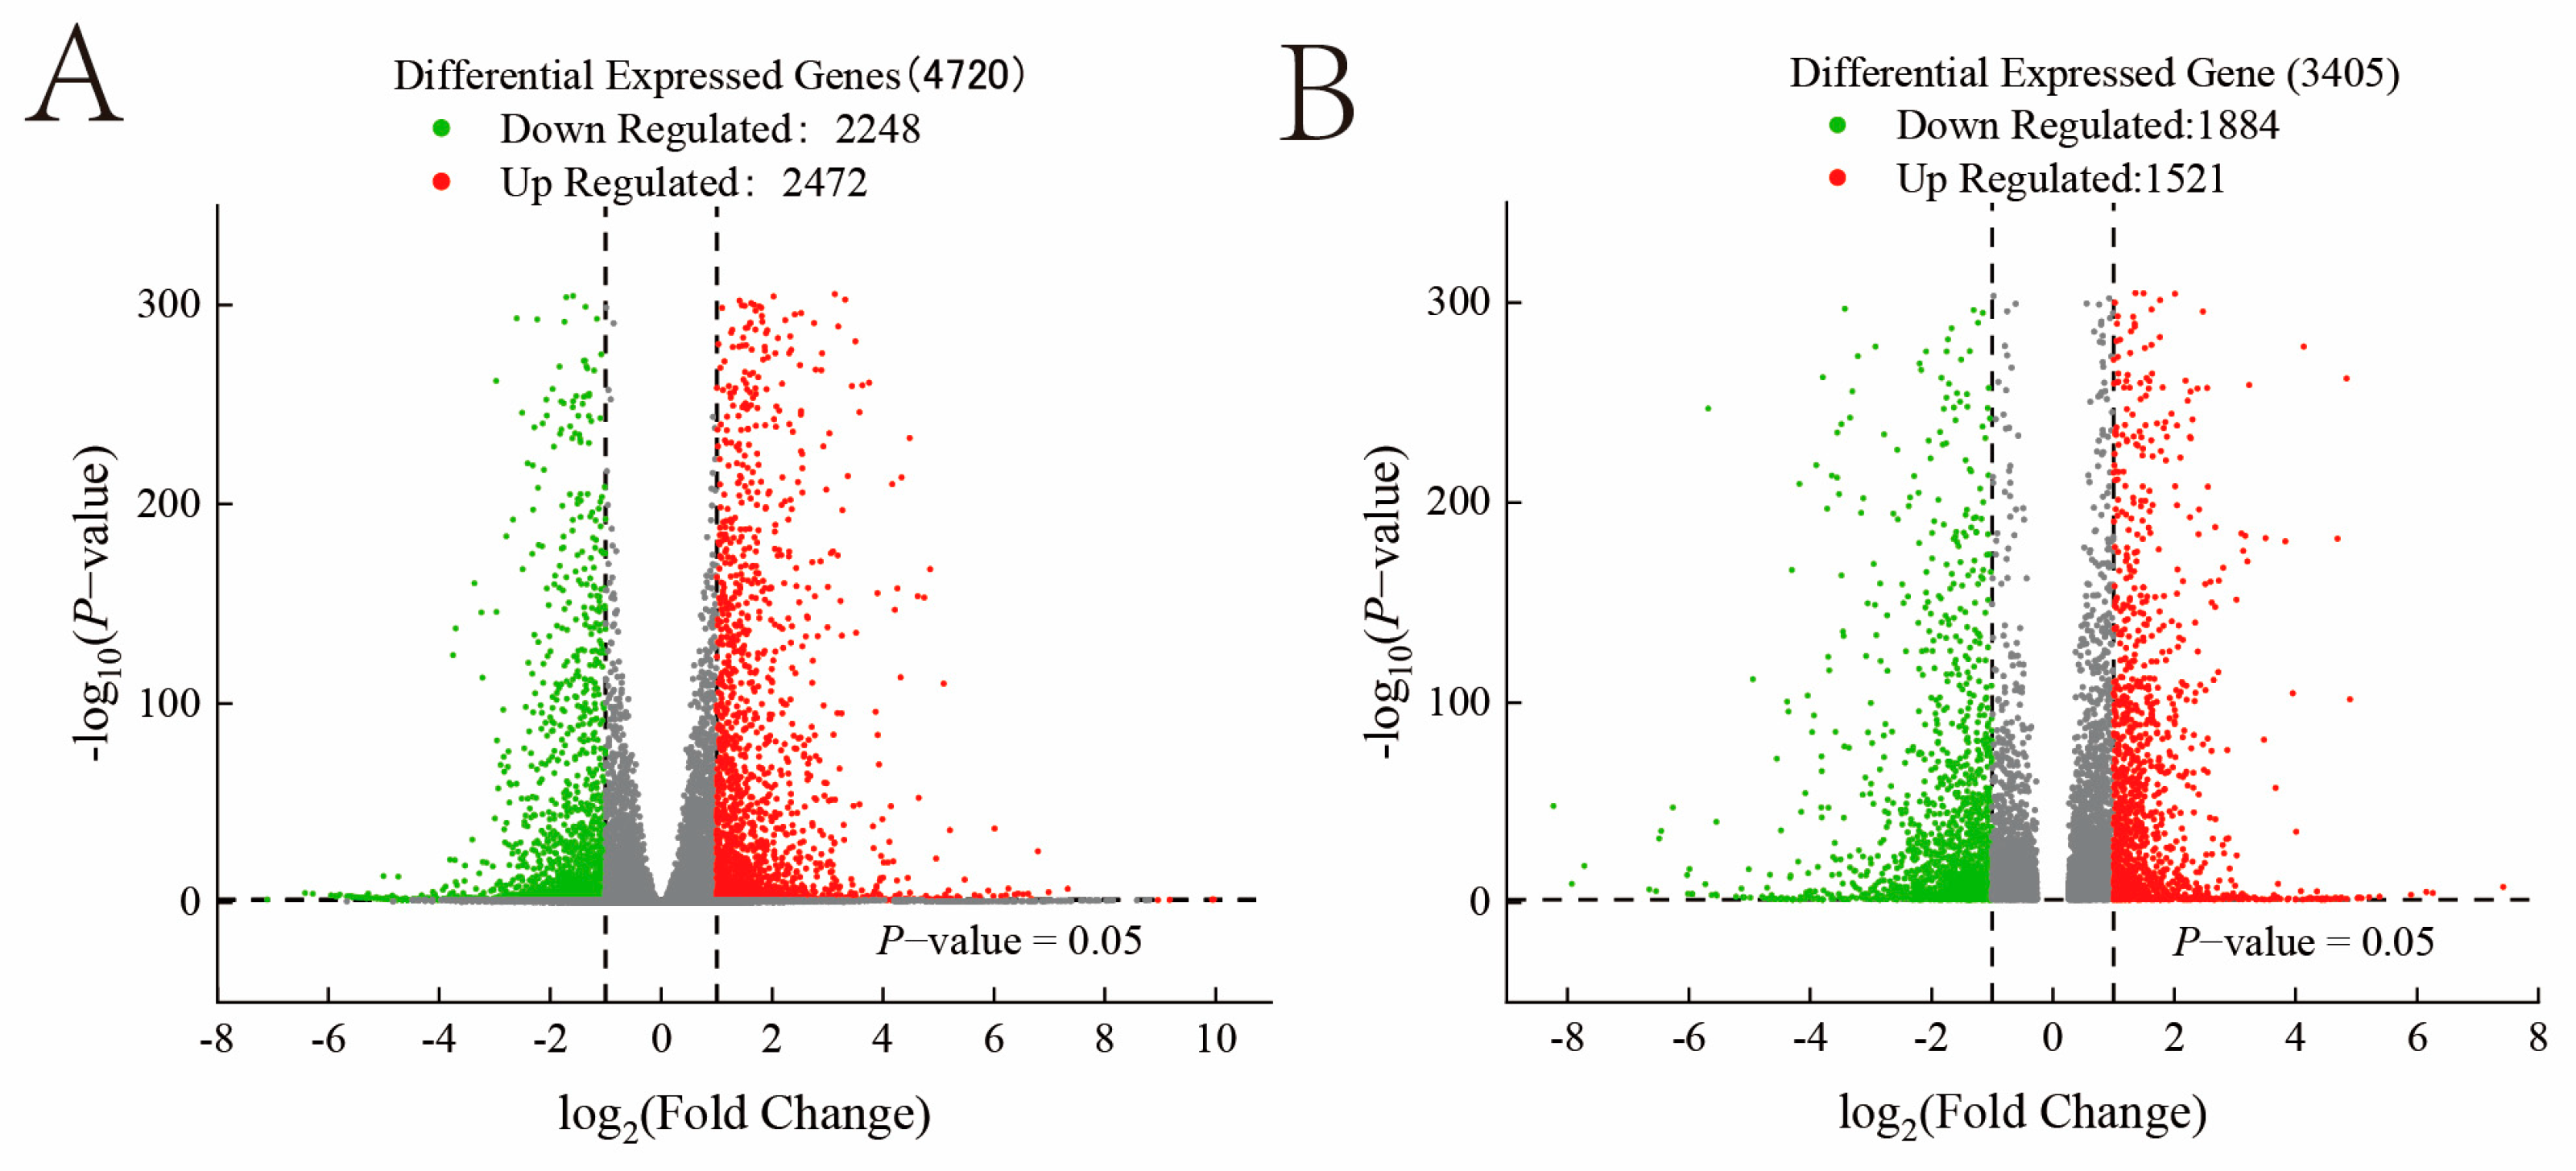
There were 2472 differentially up-regulated genes and 2248 differentially down-regulated genes in the SEPS and LEPS comparison groups in the 24 h transcriptomic data for the logarithmic growth period, while there were 1521 differentially up-regulated and 1884 differentially down-regulated genes in the 48 h transcriptomic data (Figure A2).

3.3. Functional Enrichment Analysis

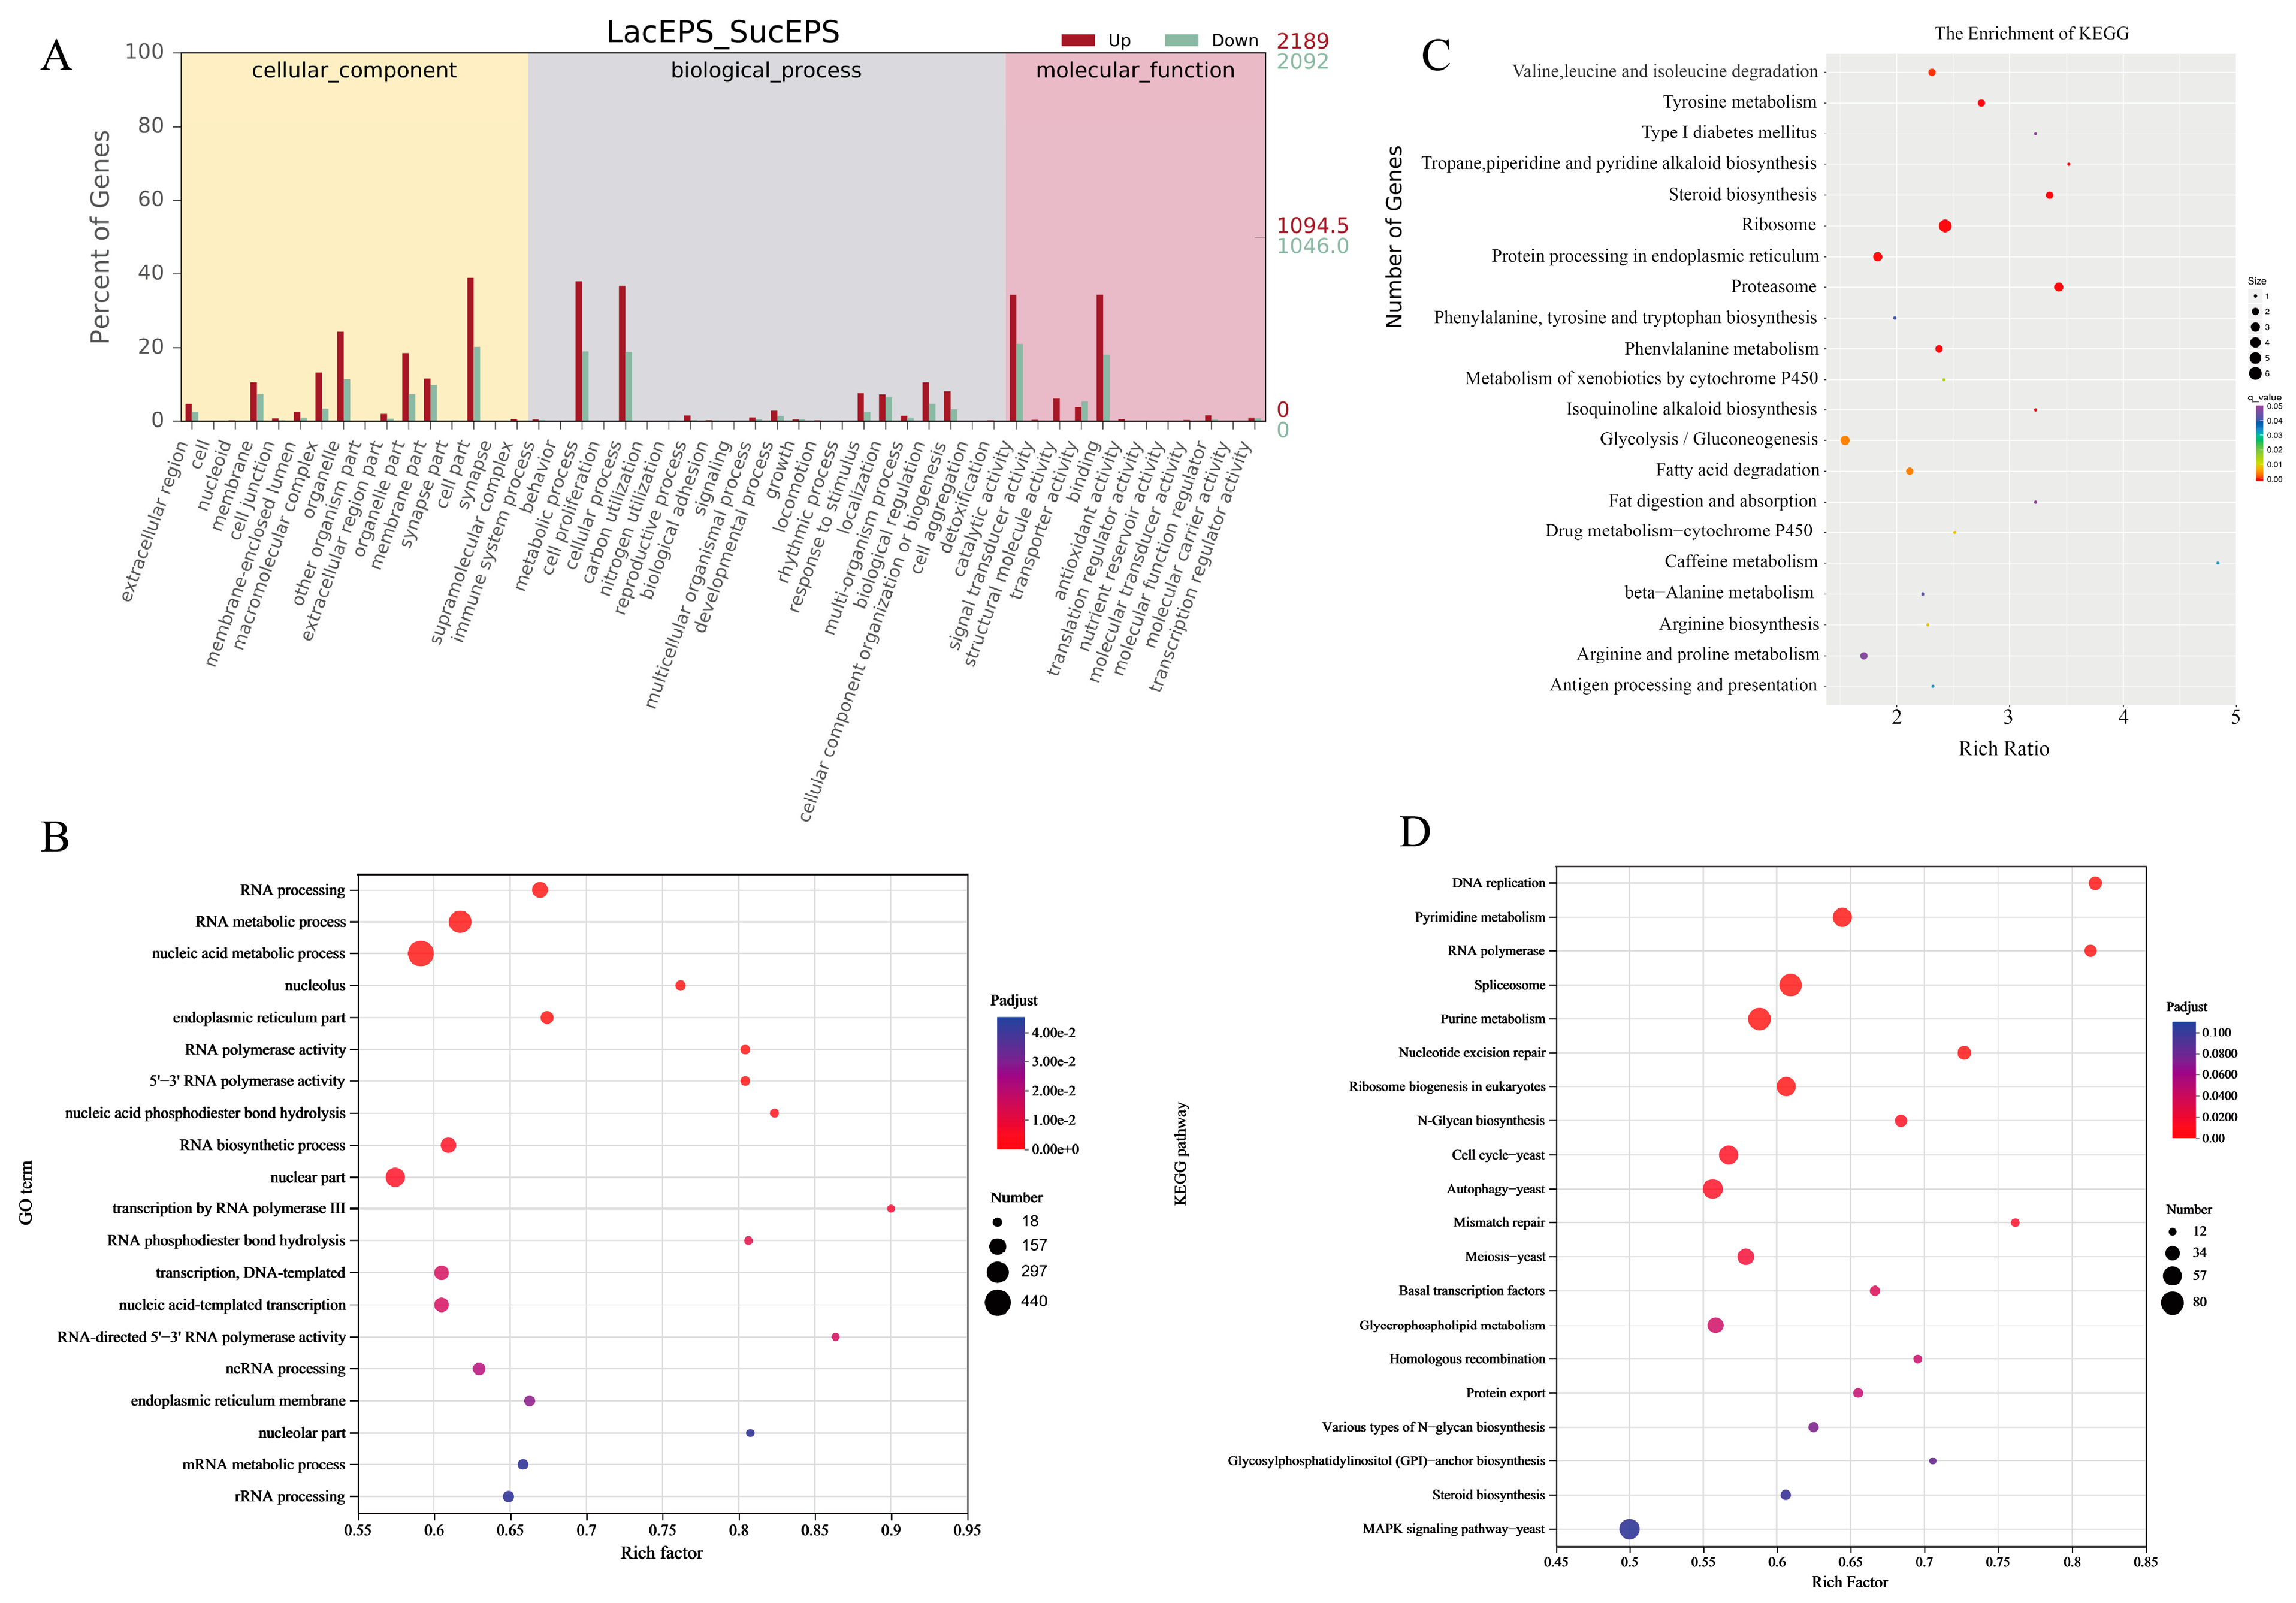
In the 24 h transcriptome data, GO enrichment analysis revealed that the most significant correlations of differential genes were found in the biological processes (BPs) of redox processes and cellular metabolic processes (Figure 2A), which indicates that S. rolfsii was in a rapid growth phase. After entering the stable phase (48 h), it was mainly correlated with RNA processing, RNA metabolic processes, and nucleic acid metabolic processes (Figure 2B). Most of these processes are related to the activity of transferases, the production of intracellular glycans, and the process of glycan formation. Regarding the cellular components (CCs) aspect, both phases were most significantly related in cellular fraction, organelle fraction, and macromolecular complexes. As to the molecular function (MF) aspect, a significant correlation was found in catalytic activities. In addition, most genes of carbonyl hydrolytic enzymes possessing O-glycosyl hydrolase activity that are related to sugar metabolism were up-regulated, including 1,4-α-glucan branching enzyme, glutathione reductase, and oxalate decarboxylase (Figure 2A).
Differential genes’ co-enrichment in the transcriptome at 24 and 48 h was revealed to be mostly associated with genetic information processing and cellular metabolism in the KEGG pathways. They are involved in translation, protein folding, sorting and degradation, carbohydrate metabolism, amino acid metabolism, and other biosynthetic pathways (Figure 2C,D). In the 24 h transcriptome, all genes related to endoplasmic reticulum protein processing, valine, leucine, and isoleucine degradation, fatty acid degradation, and β-alanine metabolism were up-regulated, and most genes involved in glycolysis/gluconeogenesis, sterol biosynthesis, alkaloid synthesis, aromatic amino acid biosynthesis, and arginine and proline metabolism were down-regulated (up-regulated in SEPS).
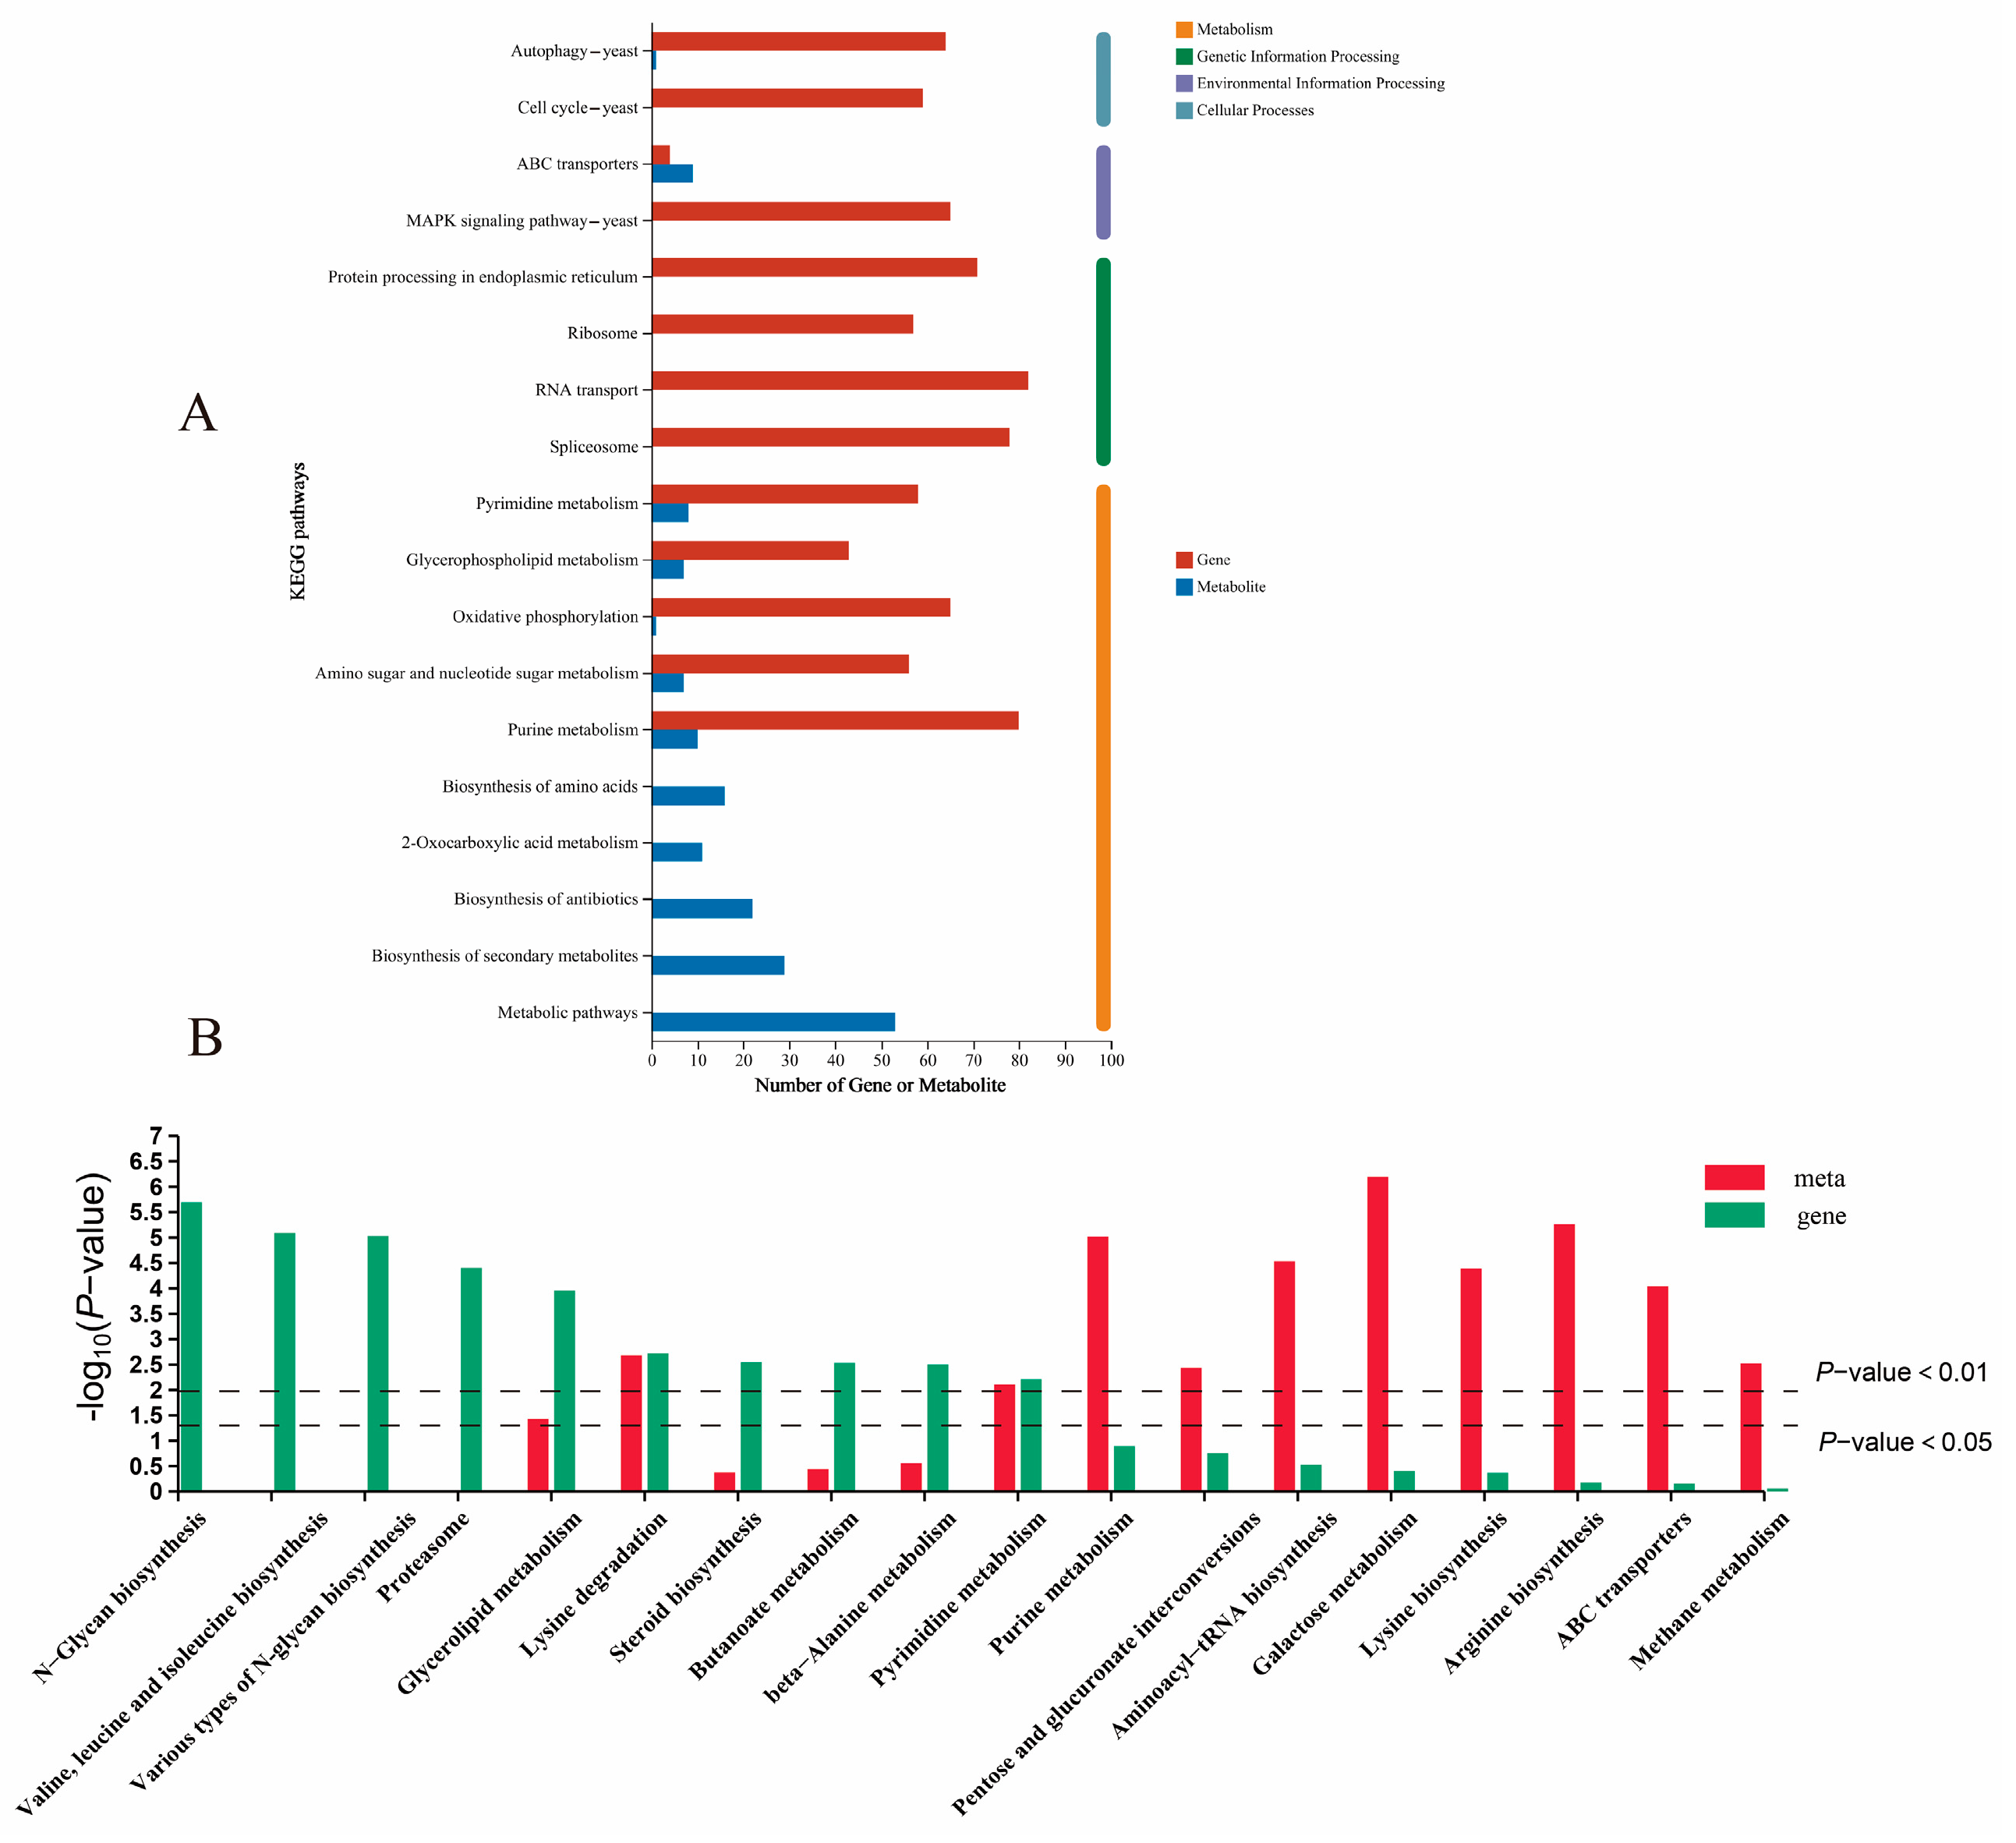
A joint analysis of the transcriptome and metabolome (Figure A3) revealed that differential genes and metabolites in the KEGG pathways were still mainly associated with carbohydrate metabolism, such as the pentose phosphate pathway, glycolysis/gluconeogenesis pathway, galactose metabolism pathway, fructose and mannose metabolism, and amino acid metabolism (phenylalanine metabolism and tryptophan metabolism).
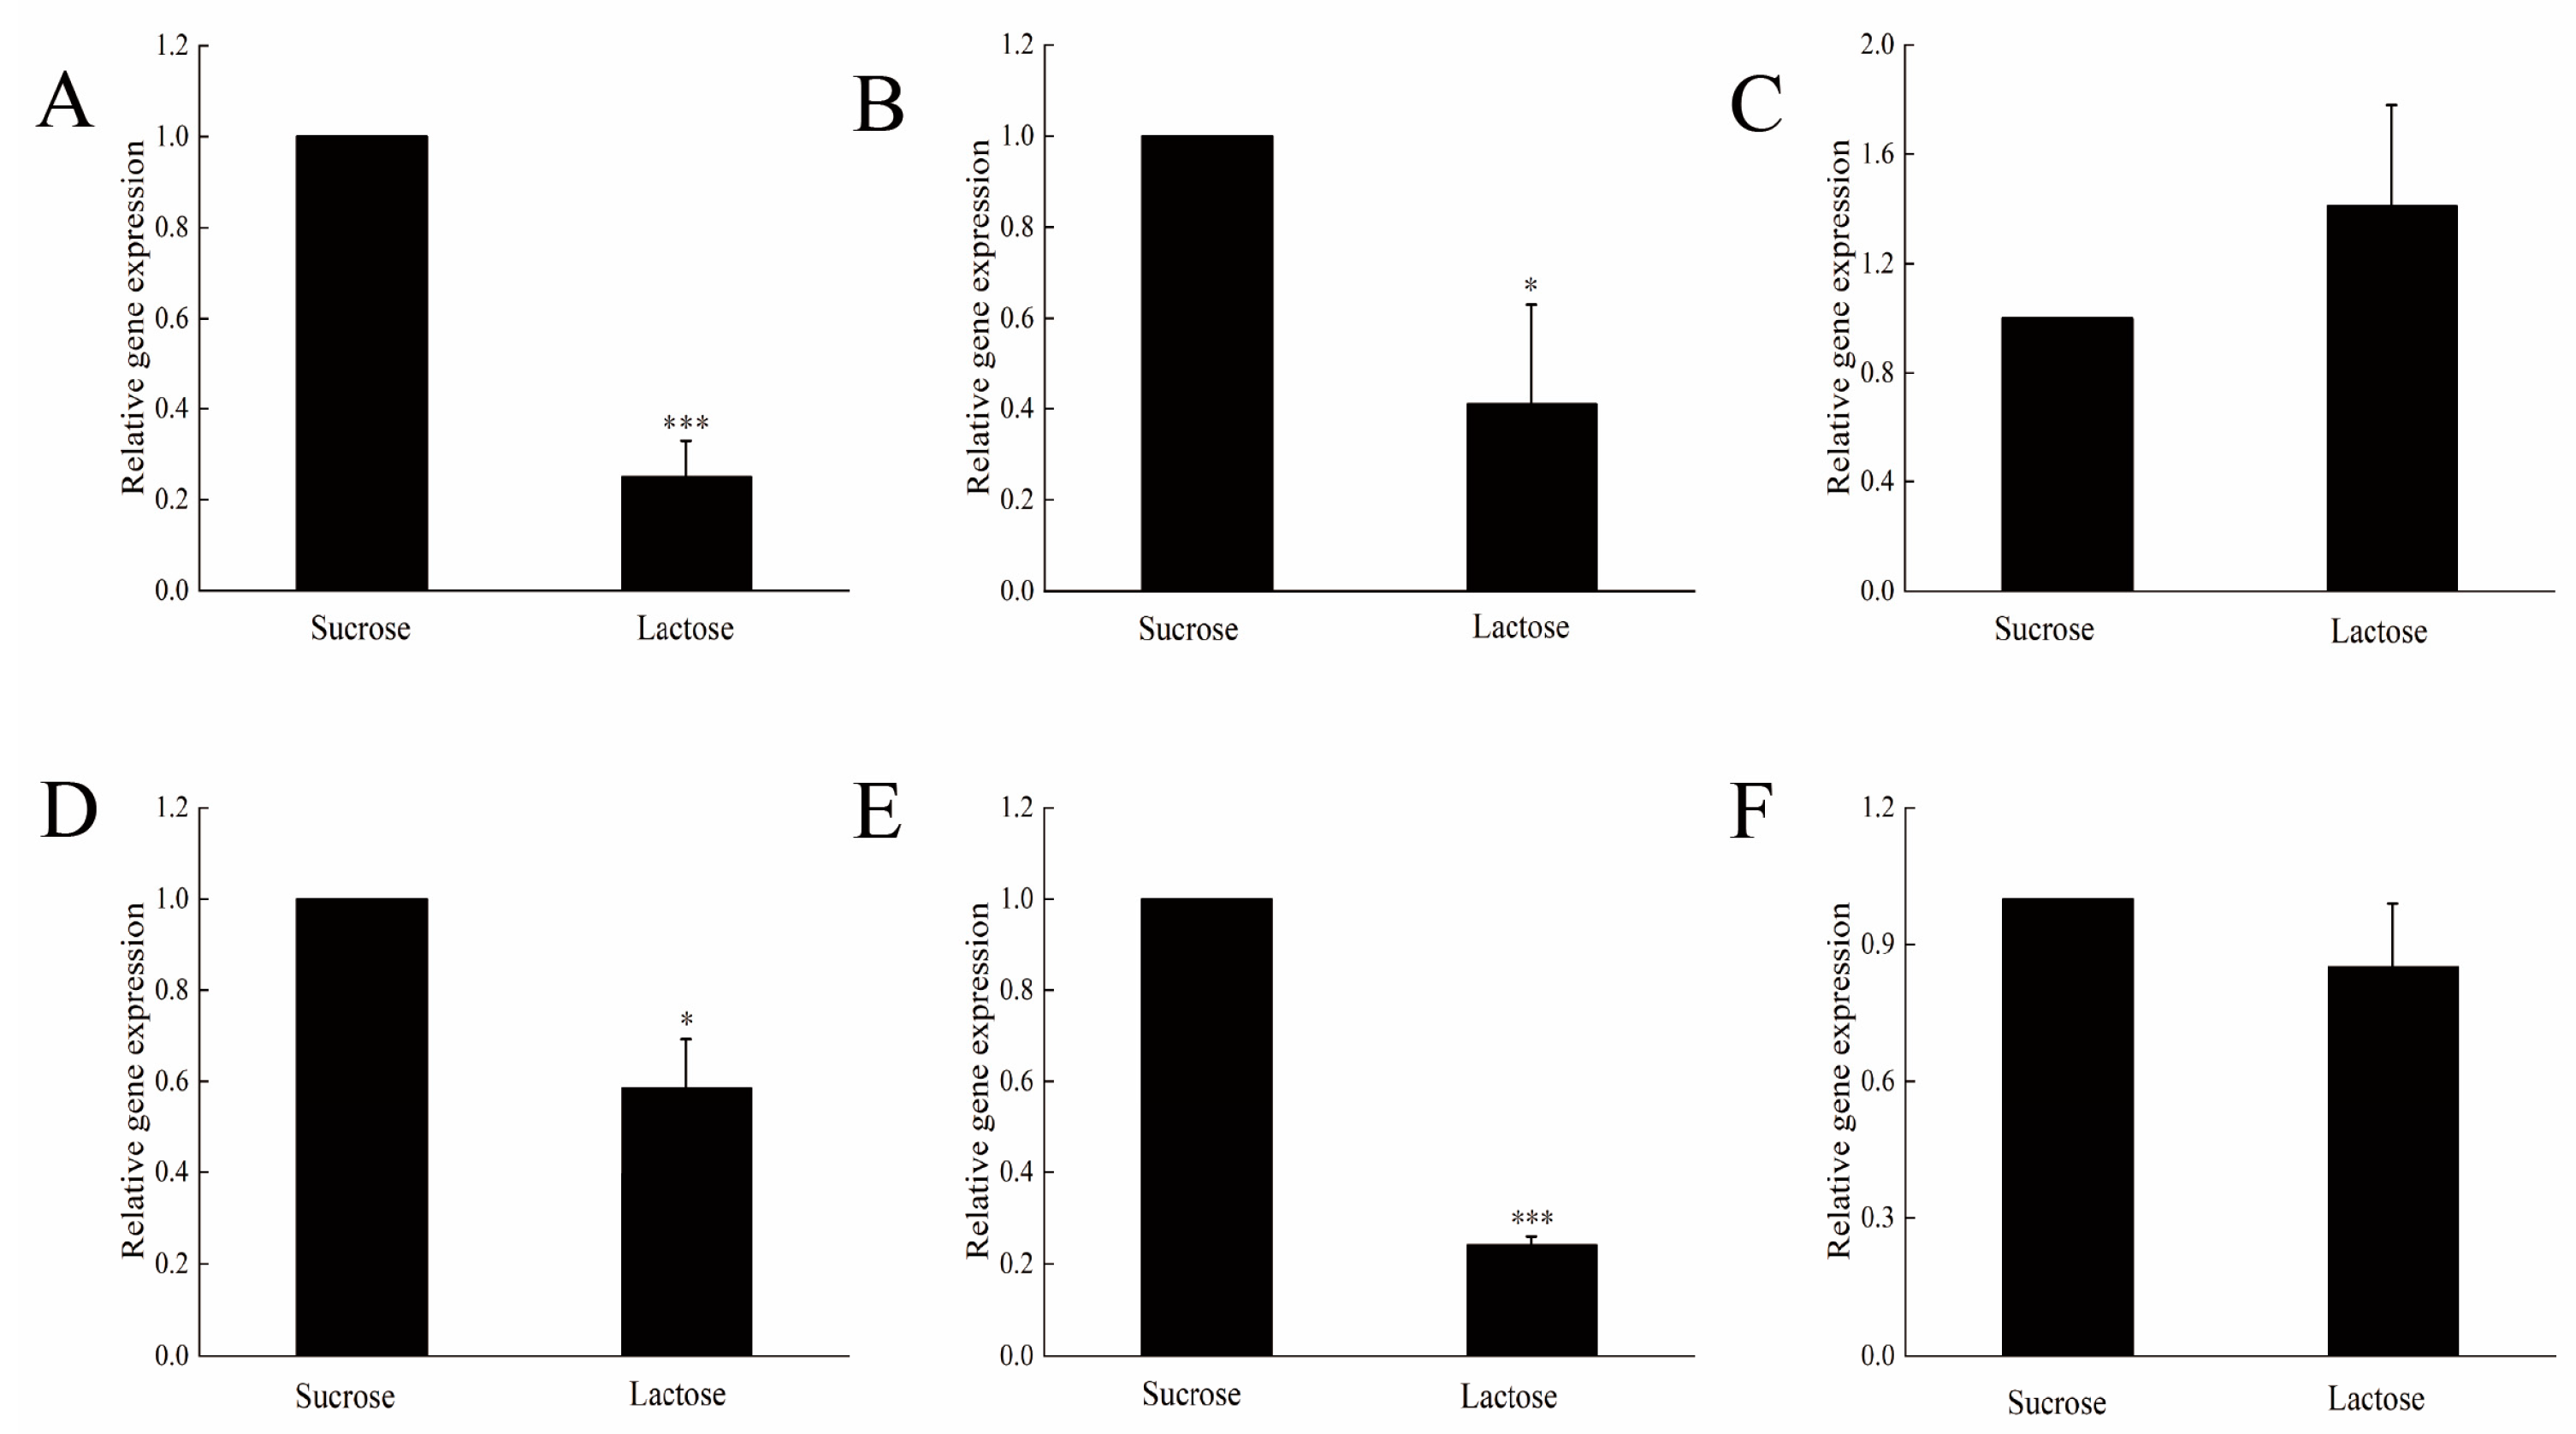
In previous studies, SEPS was superior to LEPS in terms of its polysaccharide titer and viscosity. In the glycolytic metabolism pathway, fructose 6-phosphate is converted to fructose 1,6-diphosphate (F-1,6-2P) by PFK1, and this is the rate-limiting step [27]. In this study, the PFK1 (TRINITY_DN10075_c2_g2) gene expression level was found to be 5-fold higher in the SEPS group than that in the LEPS group (Figure 3A). Glycolysis can transfer released free energy to ATP, which is also the common degradation pathway of hexose, such as fructose, mannose, and galactose. This degradation activated the synthetase system of polysaccharides and promoted the synthesis of pullulan under the stimulation of fructose isomerization [28]. The final analysis concluded that the fructose and galactose produced after catabolism eventually entered the glucose-related glycolytic/glycoisomeric pathway. Guo et al. [27] found that the mutation of glucose-6-phosphate isomerase (G6PI) in glycolysis not only blocked gluconeogenesis, but also part of hexose (such as sucrose, fructose, and mannose) from flowing into the pentose phosphate pathway (PPP) or the Entner–Doudoroff (ED) pathway. Taken together, these results suggest that the glycolysis pathway may have had great influences on the two comparison groups. Therefore, differential genes related to the glycolysis pathway were selected for further verification and analysis.

3.4. RT-PCR Analysis

To verify the data from the transcriptome analysis, RT-PCR was used to examine the expression levels of differential genes in S. rolfsii cultured with different carbon sources (Figure 3). Differential genes in the glycolytic pathway were selected for validation, and among the enzymes encoded by the genes in the LAC group, fructose 6-phosphate kinase 1, glyceraldehyde 3-phosphate dehydrogenase, fructose bisphosphate aldolase, class II, PDC, and ALDH3 were down-regulated and hexokinase was upregulated, using the SEP group as a control group. The expression of the genes corresponding to PFK1 and PDC in the SEPS group was 5-fold higher than that in the LEPS group. In general, the expression levels of most genes were consistent with the transcriptomic data.

3.5. Single-Factor Experiment

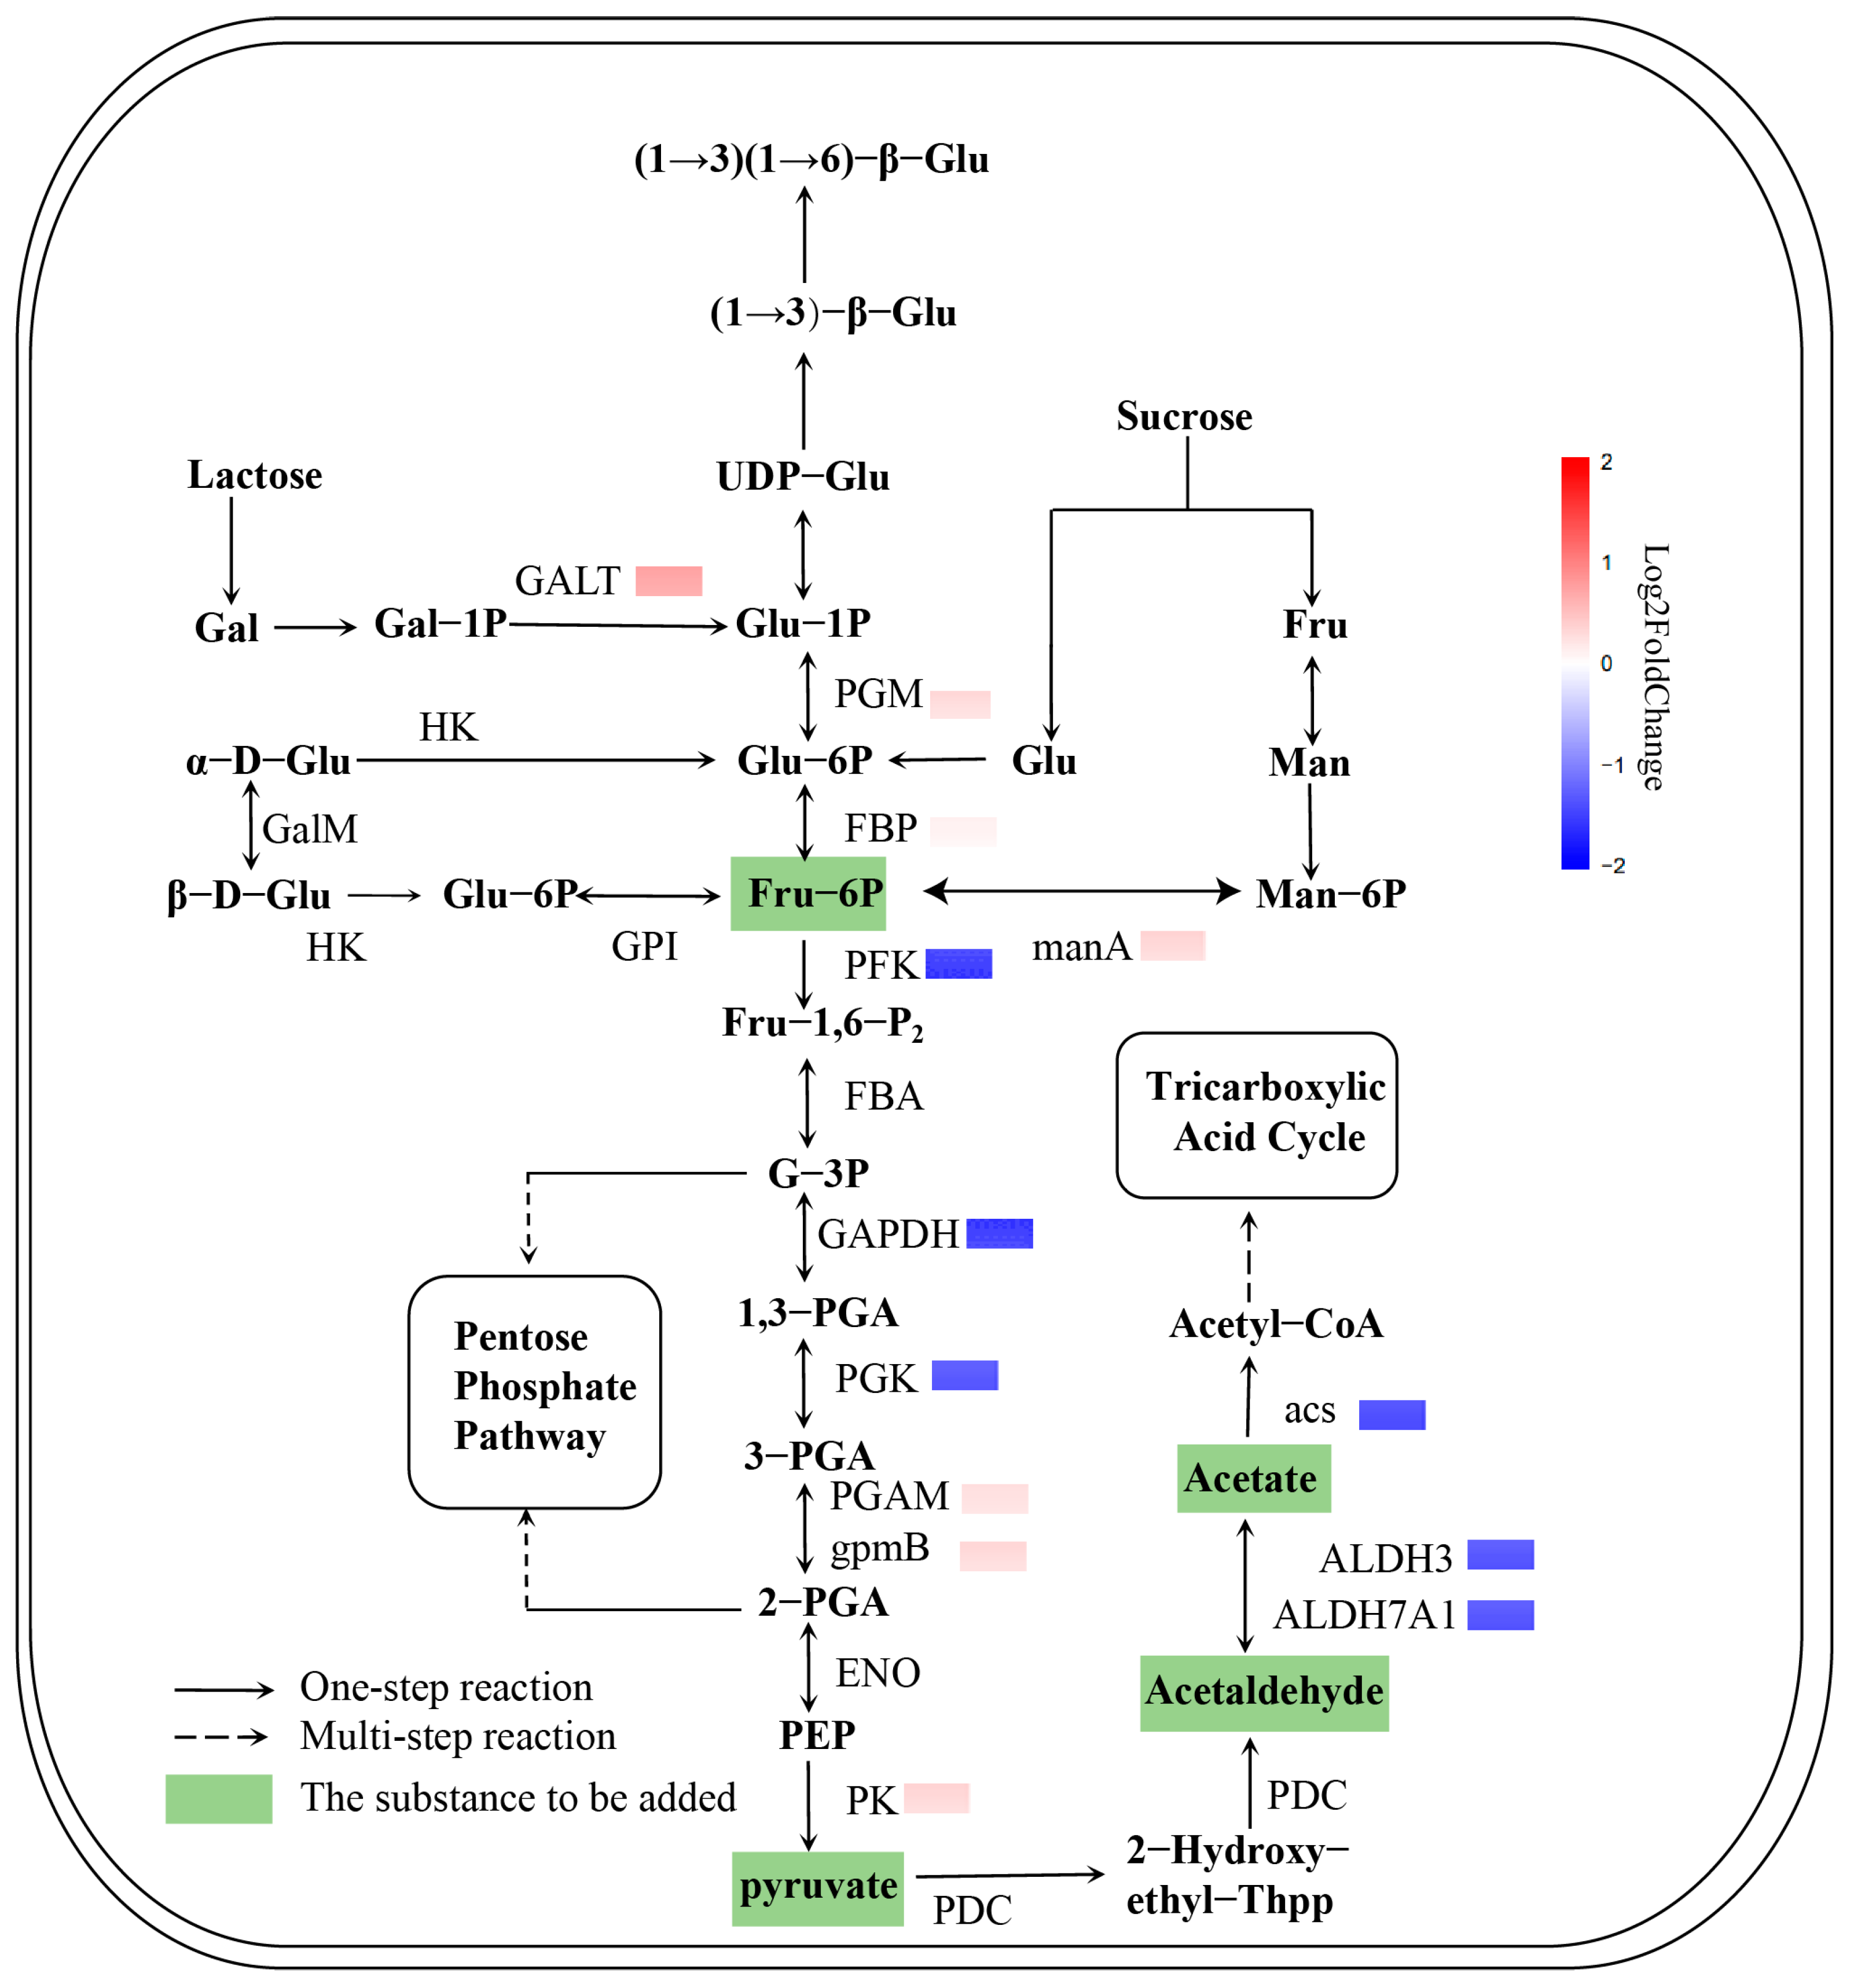
The key links and regulatory nodes in the process of metabolism were analyzed, and the biosynthesis pathway of EPS from S. rolfsii was constructed using the EMP pathway as a template combined with transcriptome data (Figure 4). The proteins that corresponded to genes with a higher differential expression ratio were 6-phosphofructokinase, PDC, ALDH3, and ACS. The precursors were added at different time points of fermentation, and the effects of different precursors on the polysaccharide titer were observed (Table 1). Adding fructose 6-phosphate disodium and acetaldehyde at 24 h increased the titer of EPS to 4.55 and 4.36 g/L. Adding pyruvate and acetic acid at 0 h increased the titer of EPS to 4.00 and 4.03 g/L. Therefore, pyruvate and acetic acid were added at 0 h, and fructose 6-phosphate disodium was added at 24 h for a response surface experiment with acetaldehyde to further optimize the added concentration.

3.6. Response Surface Experiment

The level values of four factors affecting the titer of EPS were determined through a single-factor experiment combined with actual production. The Design-Export 8.0.6 software was used for Box–Behnken Design response surface Design (BBD) and data analysis. A, B, C, and D were used to represent the concentrations of disodium acetate, acetaldehyde, pyruvate, and fructose 6-phosphate, respectively.
Design-expert (8.0.6) was used to conduct a multivariate fitting analysis of the data shown in Table A1 to determine the influence of each factor on the response value Y. The regression equation is as follows:
Y = 4.30 0.50 A + 0.061 B + 0.12 C + 0.65 D 0.21 A B 0.11 A C 0.28 A D + 0.11 B 0.067 B D 0.14 C D 0.48 A 2 0.24 B 2 0.31 C 2 0.33 D 2
The results of variance (Table A2) showed p < 0.0001 , indicating that the model was significant and the regression effect was good. The missing items were not significant ( p = 0.0626 > 0.05 ), indicating that the model had a good fitting degree. In this experiment, acetic acid and fructose 6-phosphate disodium were the most significant among the four influencing factors. The significance order of the four influencing factors was f r u c t o s e   6 p h o s p h a t e = a c e t i c   a c i d > p y r u v a t e > a c e t a l d e h y d e . The results showed a model determination coefficient and adjustment determination coefficient of R a d j 2 = 0.933 . The parameter indicated a high reliability and precision of the model.
The regression analysis showed that the best precursors were 1 g/L of fructose 6-phosphate disodium, 0.035 g/L of acetic acid, 0.83 g/L of pyruvate, and 0.79 g/L of acetaldehyde. The titer result predicted in the model was 5.01 ± 0.17 g/L.

3.7. Growth Characteristics and Morphological Changes

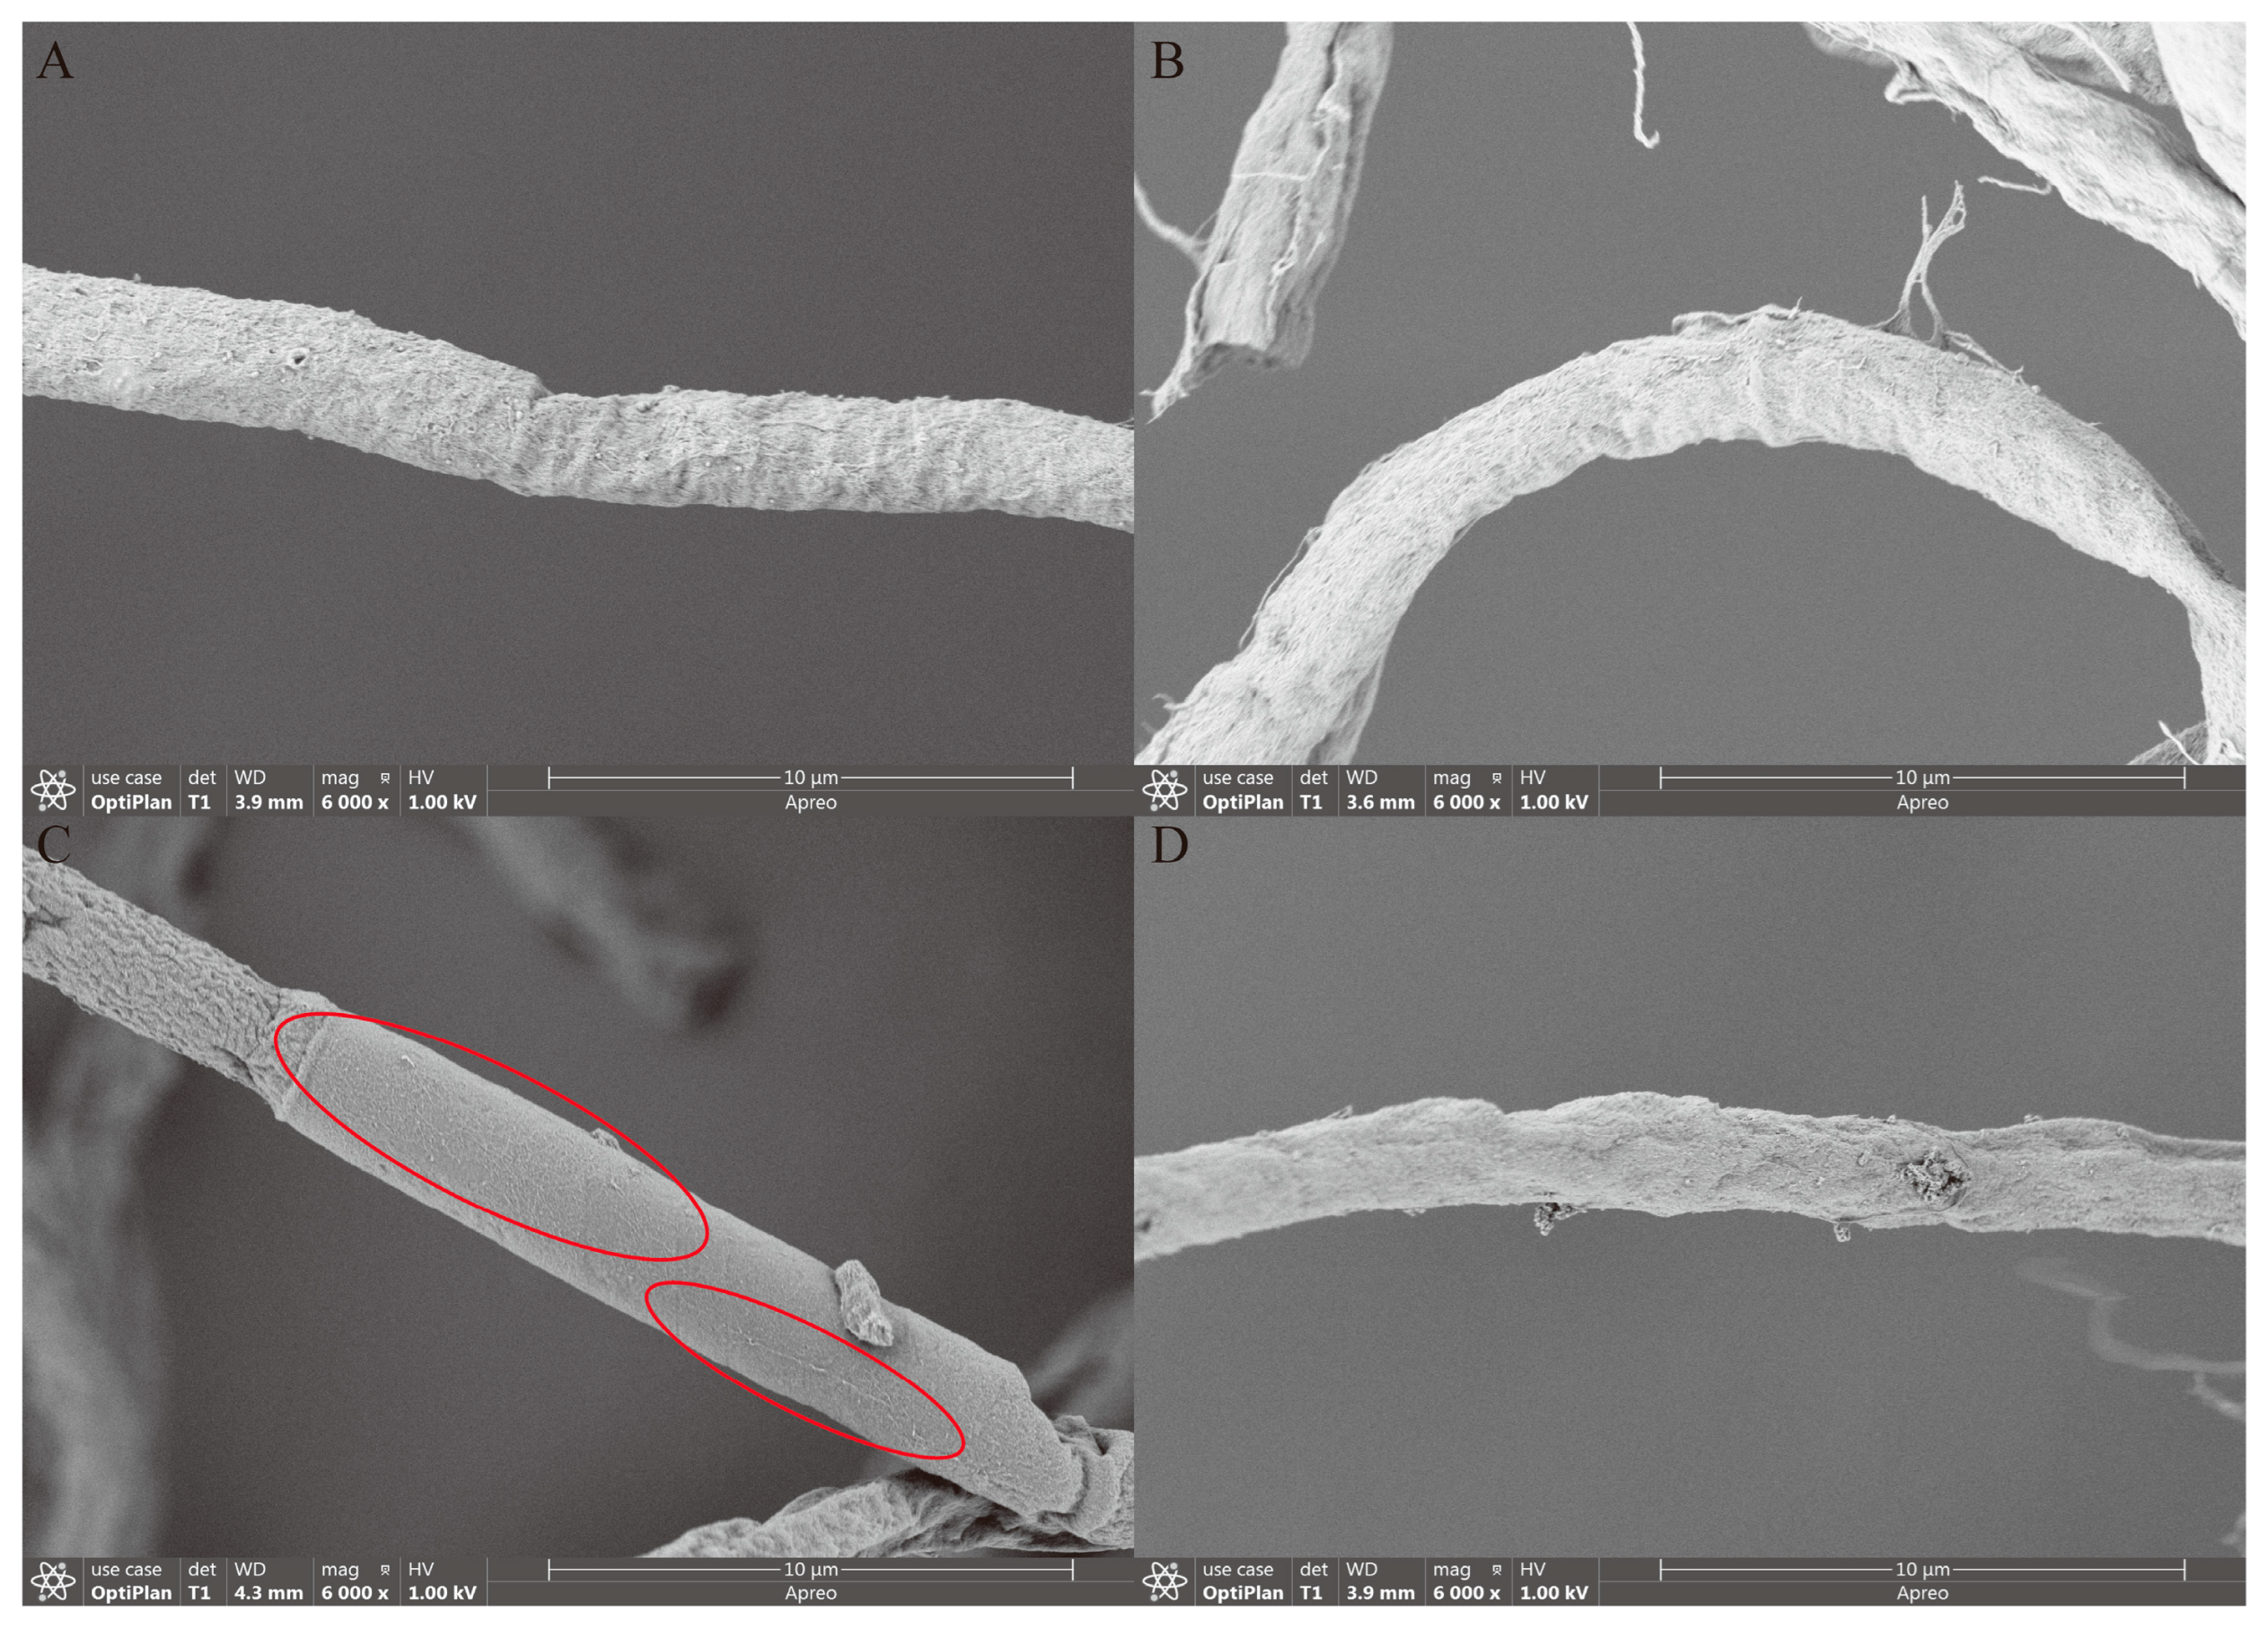
The morphology of mycelium at 48 h of fermentation was observed by scanning electron microscopy (Figure 5). A change in the carbon source and the addition of precursors had no significant effects on the width of the mycelium, and the width of all mycelia was about 2.5 μm. SEM analysis revealed that the SEPS group exhibited extensive nascent mycelial networks, with pronounced hyphal elongation and branching. After adding the precursor, the fine mycelia increased and began to separate from the surface of the main mycelium. Compared with the SEPS group, the mycelium surface of the LEPS group was relatively smooth and covered with floccules observed under the scanning electron microscope (Figure 5C). After the addition of the precursor, the mycelium surface had more folds and smaller mycelia grew. It was hypothesized that the surface area of the mycelium in the SPES group increased, which resulted in a stronger absorption capacity for carbon sources and accelerated the metabolism of the mycelium. The addition of precursors significantly roughened the mycelium and increased the mycelial surface area. Fine mycelium appeared in the SEPS group, further strengthening the uptake and metabolism of nutrients and promoting the glycolytic pathway.

3.8. Dynamic Analysis of Fermentation Process After Adding Precursors

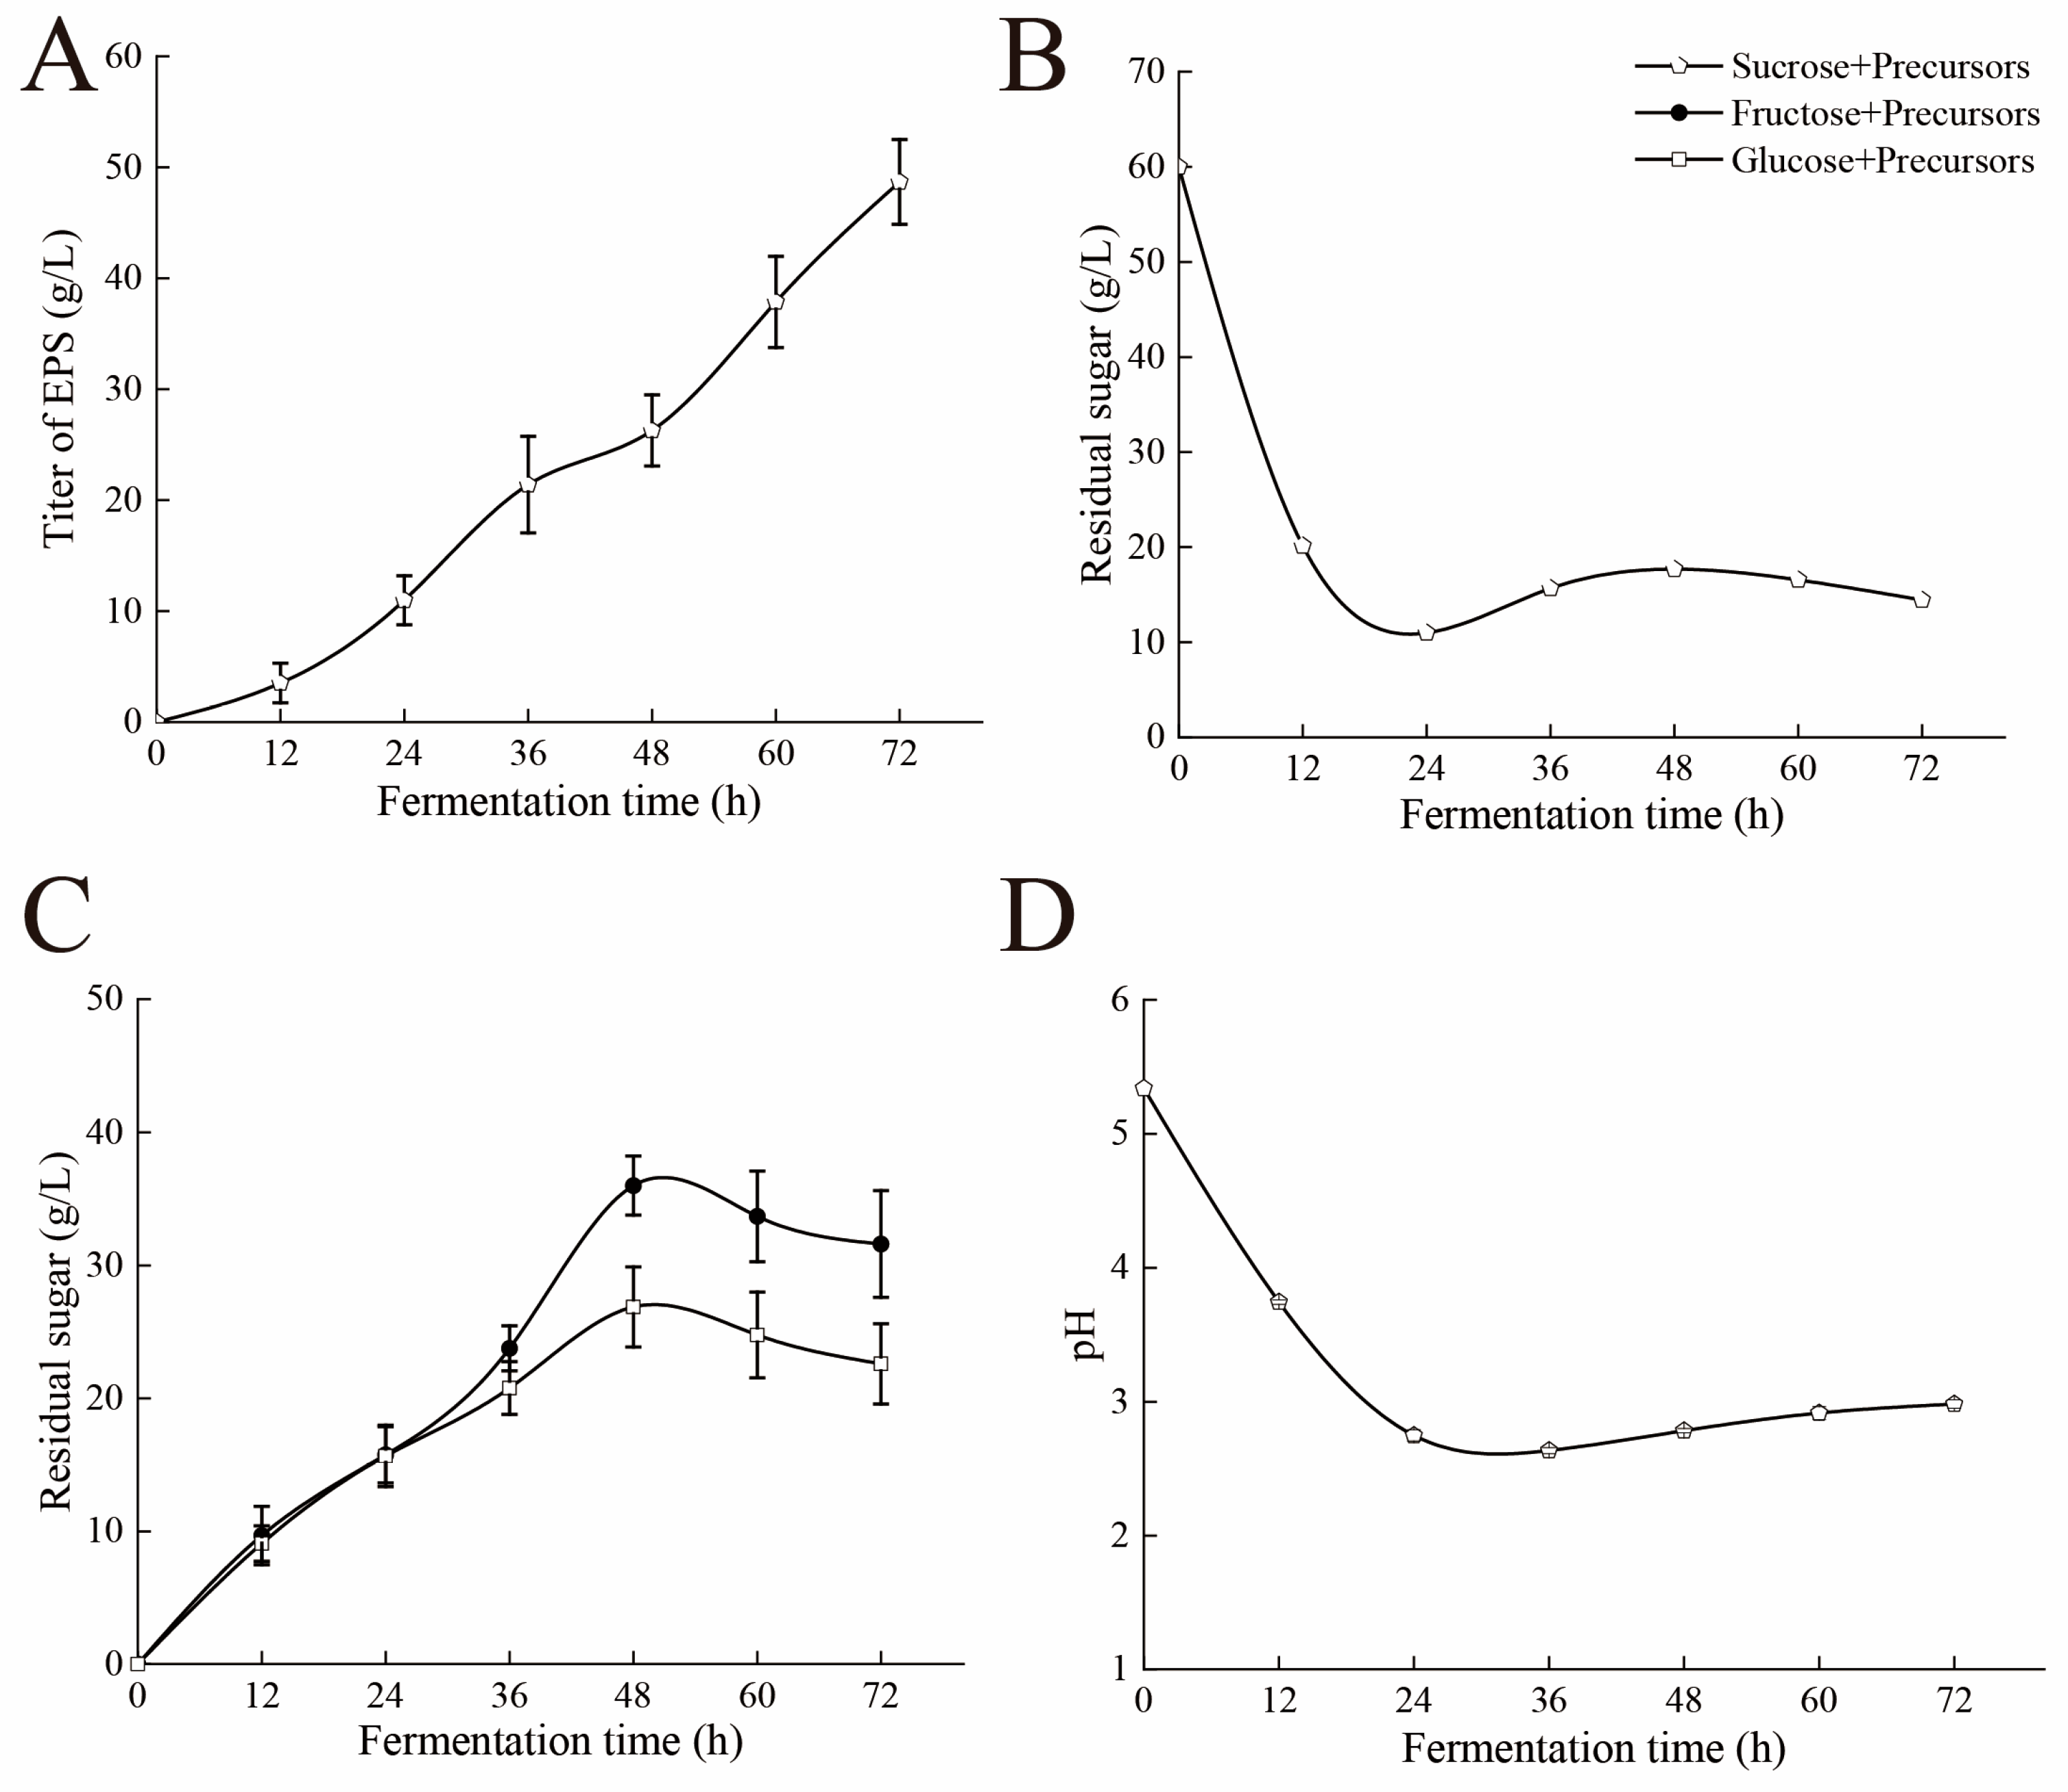
According to the response surface results, the optimal addition conditions were selected for fermentation process detection, as follows: 0.035 g/L of acetic acid and 0.83 g/L of pyruvate were added at 0 h of fermentation, and 1 g/L of disodium fructose 6-phosphate and 0.79 g/L of acetaldehyde were added at 24 h of fermentation. In a 5 L fermenter, the addition of precursors increased the polysaccharide titer. The addition of precursors significantly increased the titer of EPS, and the titer of the SEPS group was 48.69 g/L ± 3.8 g/L, which was the maximum titer reported so far (Figure 6A). Meanwhile, the substrate utilization of sucrose also increased to varying degrees, reaching 53.15% ± 1.58% for sucrose (Figure 6B,C).
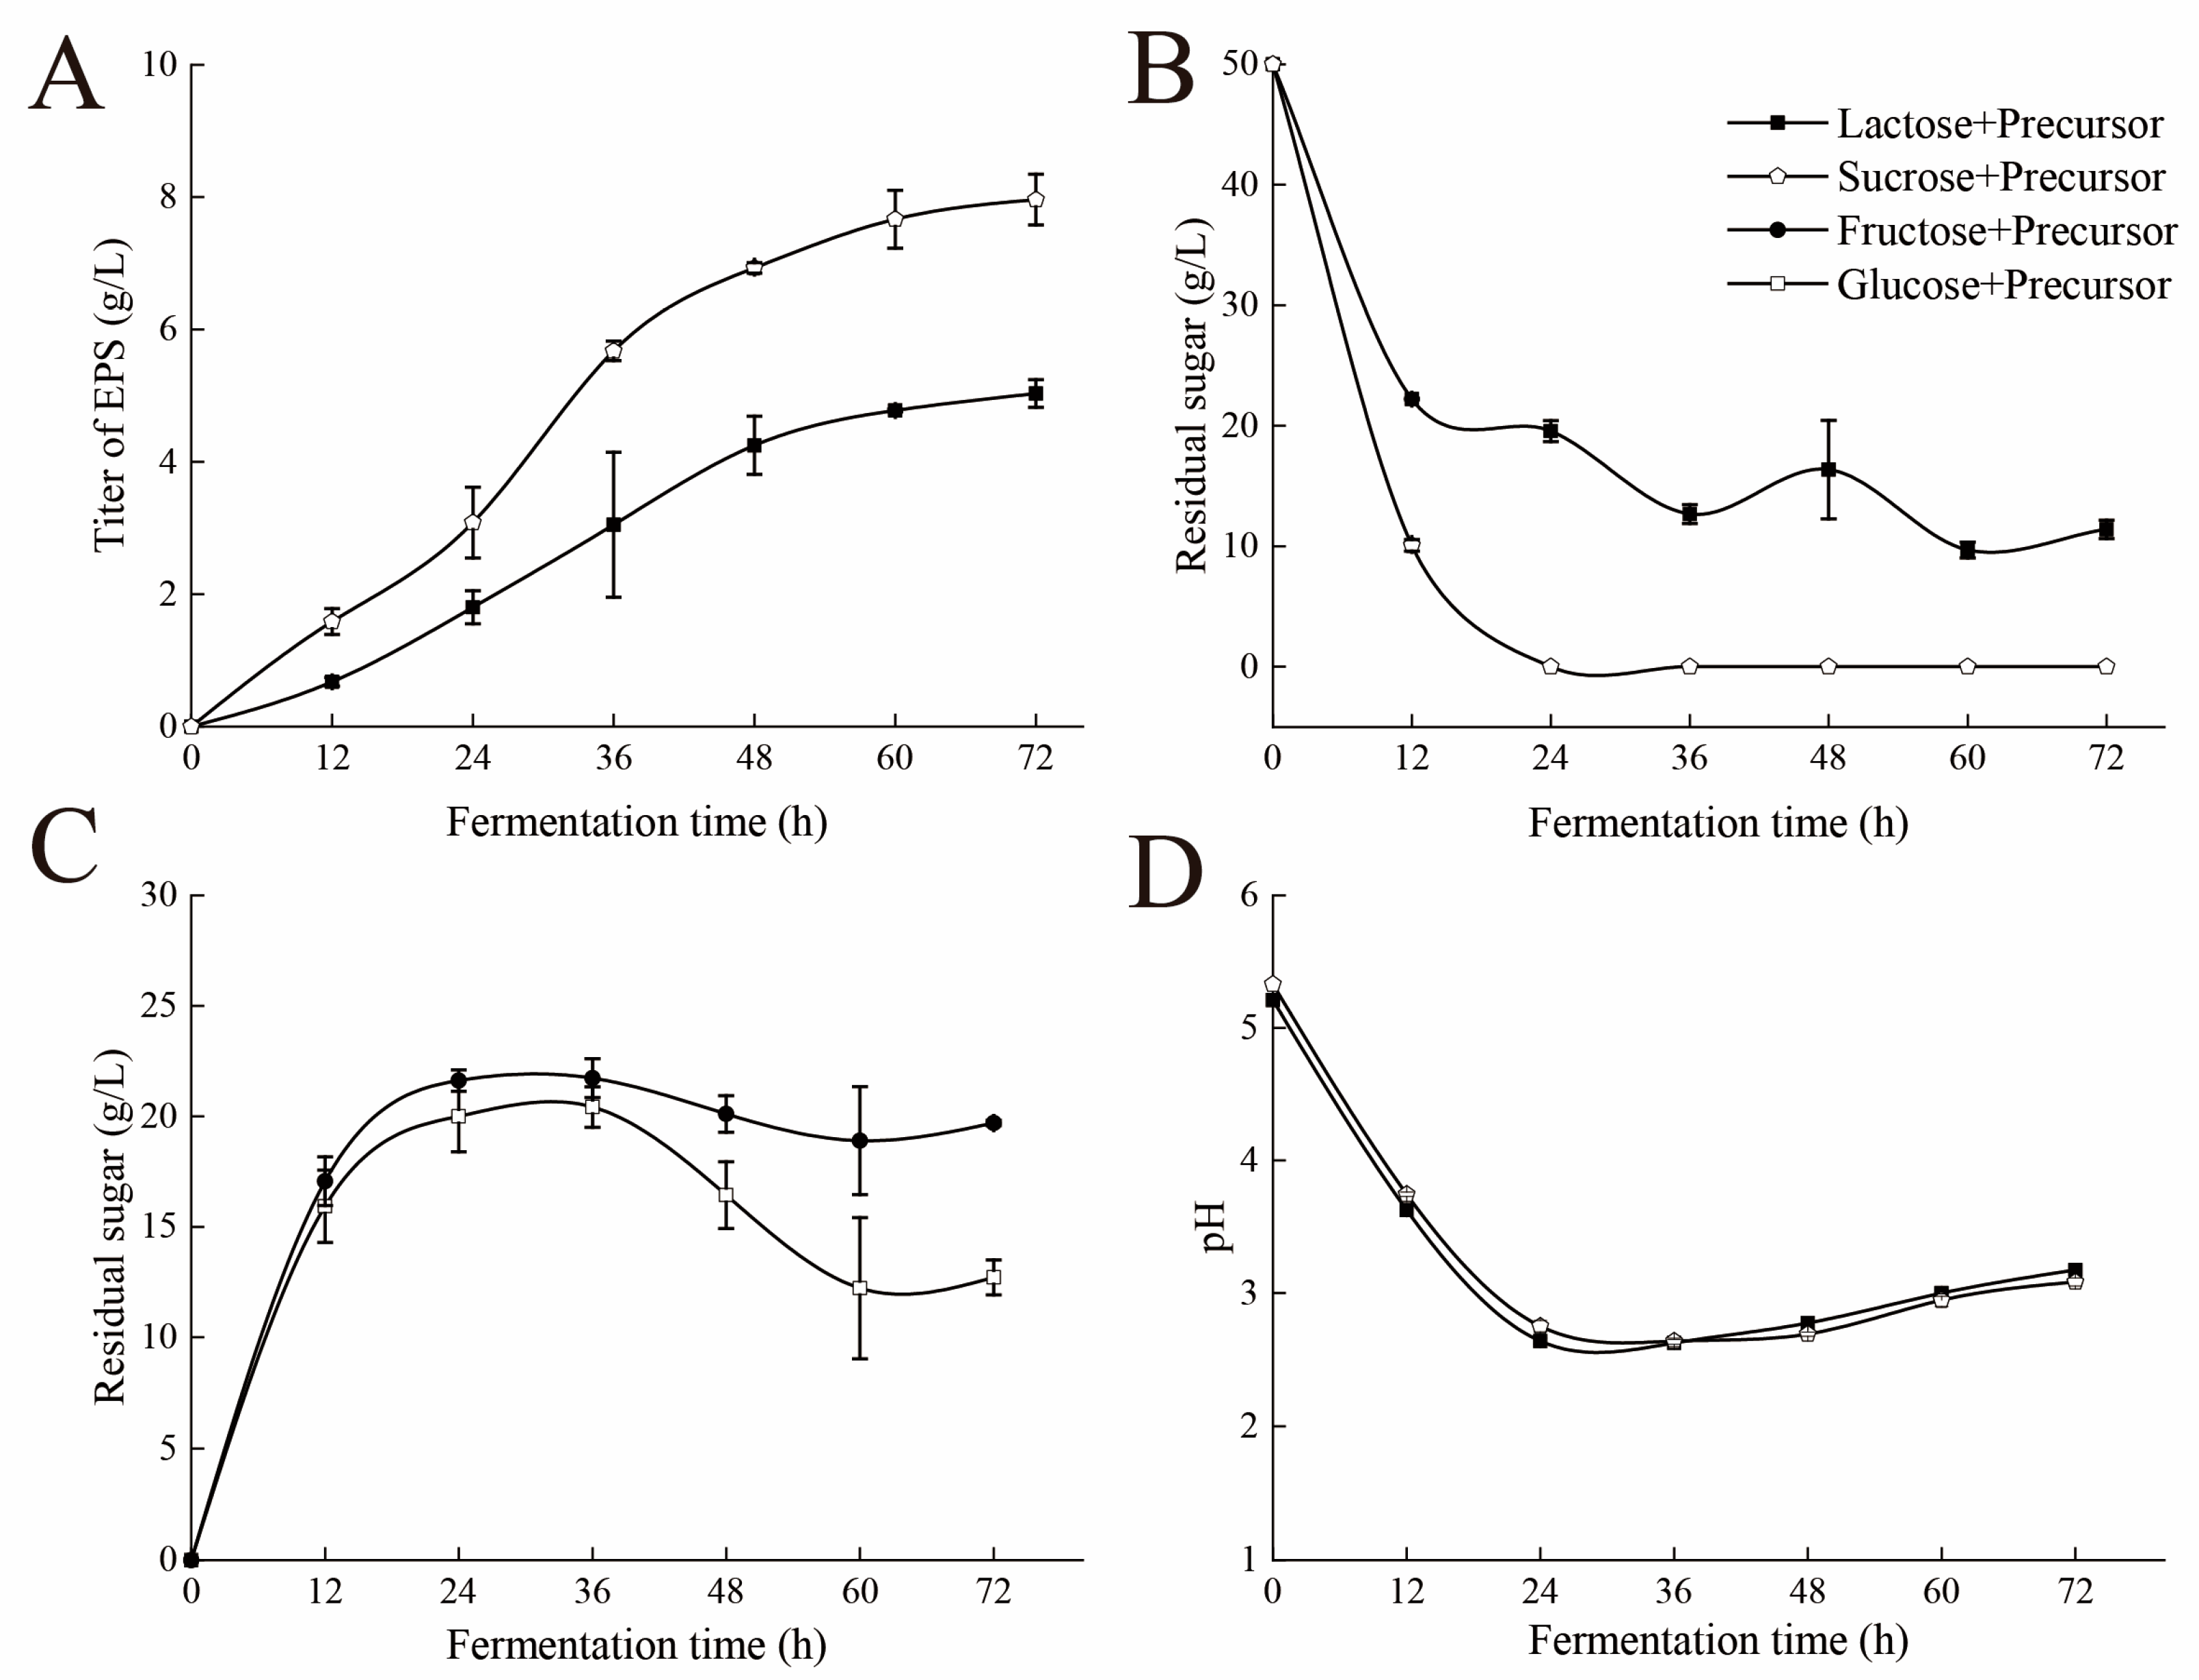
The addition of the precursor to the Erlenmeyer flasks did not significantly change the pH of the fermentation broth (Figure A1D) but increased the titer of the EPS. This suggests that there may not have been a significant change in the oxalic acid content. The titers in the SEPS and LEPS groups were 7.95 ± 0.38 and 5.03 g ± 0.21 g/L, respectively. The addition of appropriate amounts of precursors increased the titer of SEPS by 65.63% (Figure A1A) and substrate utilization by 119.3% (Figure A1B). The titer of LEPS increased by 80.29% (Figure A1A) and the substrate utilization increased by 47.08% (Figure A1B).

4. Discussion

A comparative analysis of the EPS produced by S. rolfsii using different carbon sources revealed that SEPS exhibited a significantly higher titer and viscosity, whereas LEPS demonstrated a markedly lower titer and viscosity. Therefore, S. rolfsii and its EPS obtained by fermentation with sucrose and lactose as carbon sources were selected for transcriptome analysis. Related genes and gene functions in polysaccharide synthesis were analyzed. Metabolic precursors were screened and added at different time points and concentrations to explore their effects on the parameters in the fermentation process of S. rolfsii, increase EPS production and improve substrate utilization, and reduce environmental pollution.
The SEM analysis revealed that the SEPS group exhibited a marked proliferation of nascent mycelial structures and outward expansion after the addition of the precursors, while the LEPS group had a relatively smooth mycelium surface and much smaller grown mycelium. The transcriptome analysis showed that most of the genes involved in glycolysis/gluconeogenesis, sterol biosynthesis, alkaloid biosynthesis, aromatic amino acid biosynthesis, and arginine and proline metabolism were down-regulated (up-regulated in SEPS). Glycolysis is the first stage of glucose catabolism during cell respiration [29]. Zhang et al. [30] found that NO inhibited PDC activity through dihydrolipoic acid (DHLA) and negatively regulated the conversion of pyruvate into acetyl-CoA, which then regulated the decrease in glycolytic enzyme and ATP synthase activities. This phenomenon resulted in a decrease in ATP and uridine diphosphate glucose (UDPG) content and ultimately led to the inhibition of Arabidopsis polysaccharide biosynthesis. Glycolysis is a common degradation pathway of hexose such as fructose, mannose, and galactose, which can transfer released free energy to ATP. Glycolysis depends on NAD+, which accepts electrons to form NADH and H+. NAD+ can be reoxidized from NADH to ensure the cyclic effects of glycolysis in all cells. This pathway has a great effect on the synthesis of polysaccharides, so differentially expressed genes and their related metabolic precursors were analyzed.
The PFK1 gene showed the most significantly differential expression in the LEPS and SEPS comparison groups. PFK1 catalyzes fructose 6-phosphate to produce fructose 1, 6-diphosphate in the glycolysis pathway. This process is the second phosphorylation reaction of the glycolysis pathway, requiring the participation of ATP and Mg2+. The ATP/AMP ratio plays an important role in the regulation of PKF1 activity. When the concentration of ATP is high, 6-phosphofructokinase-1 becomes almost inactive and glycolysis is weakened. When AMP is accumulated and the concentration of ATP is low, the enzyme activity is restored and glycolysis is strengthened. PKF1 is the main rate-limiting enzyme and regulatory point during glycolysis. Woo et al. [31] regulated glucose and galactose consumption rates by knocking out the pfkA and zwf genes encoding 6-phosphofructokinase I and glucose-6-phosphodehydrogenase, respectively, in E.coli. In addition, the galU-ugd and glms-glmm-glmu gene clusters were overexpressed to control the biosynthesis pathway of hyaluronic acid, thereby producing UDP-glucuronic acid and UDP-N-acetyl glucosamine. The batch culture of the final engineered strain produced 29.98 mg/L of hyaluronic acid from glucose and galactose. Kong et al. [32] also enhanced L-lactic acid accumulation through overexpression of the related genes of the fructose-6-phosphate kinase of K. marxianus. In this study, the addition of fructose 6-phosphate disodium significantly enhanced the activity of 6-phosphate fructokinase 1, thereby enhancing the glycolysis process, promoting the absorption and utilization of glucose, and laying a foundation for the synthesis of polysaccharides.
PDC genes also showed significantly differential expressions in the LEPS and SEPS comparison groups. The PDC gene encodes PDC, which is a kind of carboxylase of α-ketoate hexose, an important enzyme in cellular respiration. PDC (A/B/C/D) is the main bridge between bacterial glycolysis and the tricarboxylic acid cycle, leading to the oxidative decarboxylation of pyruvate into acetyl-CoA [33]. PDC, ALDH3, and ACS catalyze pyruvate into acetyl-CoA. In normal growth environments, PDC mainly catalyzes the non-oxidative decarboxylation of pyruvate into acetaldehyde and carbon dioxide and the oxidative decarboxylation to acetyl-CoA. Agarwal et al. [34] improved the titer of (R)-PAC by changing the carbon binding activity of PDC in Saccharomyces cerevisiae. The overexpression of the mutant PDC increased the level of wild-type (R)-PAC by 50% ± 2.5%. In this study, pyruvate was added at the early stage of fermentation to enhance PDC activity and increased the titer of EPS. At the same time, pyruvate supplementation enhanced the citric acid cycle, and this increase in citric acid production was conducive to an improvement in the polysaccharides of S. rolfsii. However, the excessive accumulation of citric acid inhibited the activity of PKF1, so the amount of pyruvate is considered to be important for the titer of EPS.
Another key enzyme in the glycolysis pathway is the ALHD3 family, as first proposed in the study of mosses and algae by Wood and Duff [35]. Aldehyde dehydrogenase exists widely in plant species, and its functional diversity fully reflects its importance in organisms. ALDH3 is a kind of aldehyde dehydrogenase that catalyzes the oxidation of acetaldehyde into acetic acid. It can also catalyze the oxidative dehydrogenation of endogenous or exogenous aldehydes into corresponding carboxylic substances by combining NAD+ or NADP+ [36]. Acetaldehyde dehydrogenase contains a superfamily of genes encoding NADP+-dependent enzymes that catalyze the irreversible oxidation of a variety of endogenous and exogenous aromatic and aliphatic aldehydes [37]. Mori et al. [38] found that a high ALDH3 production was associated with increased glucose uptake, activation of the glycolysis pathway, and elevated glucose transporter 1 (GLUT1). The intracellular glucose and lactic acid levels in high ALDH3 cells were found to be higher than those in low ALDH3 cells. Various studies have shown that aldehyde dehydrogenase plays an important role in the growth of many plants [39,40]. In the present study, the addition of acetaldehyde at different time points activated the activity of acetaldehyde dehydrogenase, which enhanced the glycolysis pathway and ultimately improved the titer of EPS. However, the timing of acetaldehyde addition had little effect on EPS production, suggesting that other factors may influence this process.
ACS exists in prokaryotes and eukaryotes and is a core enzyme of their metabolism. It is widely found in various organelles and tissues. Two metabolic pathways of acetic acid exist in Escherichia coli. First, acetic acid is directly catalyzed by ACS to produce acetyl-CoA [41,42]. Second, ACS converts acetic acid into acetyl-CoA in a two-step irreversible reaction [43]. In general, acetate is catalyzed by ACS to produce acetyl-CoA directly into the main metabolic pathway. Subsequently, dicarbon acetate is converted into high-carbon compounds, such as C5 ribose and C6 glucose, through the glyoxylic acid pathway and gluconeogenesis [44].
Many prokaryotic and eukaryotic microorganisms can use not only glucose, fructose, lactose, and other sugars, but also acetic acid, pyruvate, and lactic acid as energy and carbon sources in their metabolism for their growth. In this study, the addition of appropriate acetic acid could reduce the pH of the fermentation broth and promote the growth of S. rolfsii and the synthesis of polysaccharides. A low pH during early fermentation is more favorable for fungal growth and polysaccharide synthesis. We speculated the metabolic pathways related to the synthesis of polysaccharides and identified the key proteins involved. Compared with the blank group, the addition of precursors for polysaccharide synthesis increased the polysaccharide titer with sucrose and lactose as the carbon sources by 184.9% and 80.29%, respectively. Meanwhile, the substrate utilization rate increased by 119.3% and 47.08%, respectively. This study showed that whether the carbon source was sucrose or lactose, adding fructose 6-phosphate disodium, acetaldehyde, pyruvate, and acetic acid to the fermentation broth could effectively improve the titer and substrate utilization of polysaccharides. This suggests that the nutrient salts developed in this study accelerated the growth of S. rolfsii, as well as the efficiency of polysaccharide production, and increased substrate utilization, thereby reducing the waste of resources and environmental pollution.
A comparative analysis of the results of this study with those of Tan et al. [7] reveals that their scleroglucan titers obtained by the pH conversion strategy were 92.86% and 139.82% higher compared to the pH under the pH conversion strategy and at natural pH, respectively, but substrate utilization was about 42.8%. Compared to the 42 g/L polysaccharide titer already reported in the literature, the SEPS group showed a 15.9% increase in maximum titer and a 32.9% increase in substrate utilization. In this work, the optimal amount of precursor substance addition was optimized by the mathematical modeling method and the titer of SEPS was increased by 65.63%, but the substrate utilization was increased by 119.3% compared with that before precursor addition. The titer of LEPS was increased by 80.29%, but the substrate utilization was increased by 47.08%. It was found that this study effectively improved substrate utilization by adding polysaccharide synthesis precursors. This study also reduced the waste of resources and environmental pollution, especially when sucrose was used as the carbon source. Sucrose is the most commonly used carbon source in the fermentation process of S. rolfsii.

5. Conclusions

In this study, a transcriptome analysis was conducted on S. rolfsii fermented with different carbon sources. Related genes in polysaccharide synthesis were analyzed, and the titer was improved by adding related precursors (disodium fructose 6-phosphate, pyruvate, acetic acid, and acetaldehyde). The optimal addition was analyzed by response surface analysis based on single-factor testing with the polysaccharide titer as the response value. The results showed that the substrate utilization was improved by 119.3% for SEPS and 47.08% for LEPS. This study effectively improved the substrate utilization of polysaccharides, thus reducing the waste of resources and environmental pollution.

Author Contributions

Conceptualization, J.S.; methodology, J.S.; formal analysis, J.L., C.Z. and B.F.; investigation, J.L., J.D. and B.F.; data curation, R.Z., J.H. and B.G.; writing—original draft, J.L. and B.F.; writing—review and editing, J.S., L.T. and M.W.; funding acquisition, Y.Z., J.S. and M.W. All authors have read and agreed to the published version of the manuscript.

Funding

This research was funded by the Open Project of State Key Laboratory of Food Nutrition and Safety, Tianjin University of Science & Technology [grant number SKLFNS-KF-202102] and Leading Talents Project of YEDA (2021RC005).

Institutional Review Board Statement

Not applicable.

Informed Consent Statement

Not applicable.

Data Availability Statement

Data will be made available on request.

Acknowledgments

The authors acknowledge the helpful advice from faculty members of the Lab of Systems Microbiology and Biomanufacturing Engineering, School of Bioengineering, Tianjin University of Science and Technology for their helpful suggestions.

Conflicts of Interest

Author Yu Zheng was employed by the Shandong Baoyuan Biotechnology Co., Ltd. The remaining authors declare that the research was conducted in the absence of any commercial or financial relationships that could be construed as potential conflict of interest.

Appendix A

Table A1. Box–Behnken response surface test design and results.
NumberA
Acetic Acid (g/L)
B
Aldehyde
(g/L)
C
Pyruvic Acid (g/L)
D
Fructose 6-Phosphate (g/L)
Y
Polysaccharide Titer (g/L)
10.011.010.510.514.39 ± 0.12
20.510.511.010.013.19 ± 0.04
30.010.010.510.513.68 ± 0.07
40.510.011.010.513.82 ± 0.11
50.510.510.510.514.28 ± 0.17
60.510.510.510.514.31 ± 0.09
70.511.010.510.013.16 ± 0.08
80.511.010.511.014.12 ± 0.14
90.510.511.011.014.45 ± 0.12
100.510.510.010.012.58 ± 0.05
110.510.010.511.014.35 ± 0.14
120.510.510.510.514.42 ± 0.10
131.010.510.511.013.31 ± 0.07
140.010.510.010.513.84 ± 0.07
150.510.510.510.514.19 ± 0.09
160.510.010.510.013.12 ± 0.06
170.510.510.011.014.4 ± 0.13
180.511.010.010.513.54 ± 0.10
191.010.510.010.513.11 ± 0.06
201.011.010.510.513.07 ± 0.06
210.510.510.510.514.28 ± 0.12
220.010.511.010.514.05 ± 0.13
230.010.510.511.015.01 ± 0.17
240.510.010.010.513.6 ± 0.12
250.010.510.511.013.2 ± 0.06
261.010.511.010.512.86 ± 0.05
271.010.510.510.012.64 ± 0.04
Table A2. Variance analysis of response surface test results.
Sum of MeanFp-ValueSignificant
SourceSquaresdfSquareValueProb > F*
Model29.215193.24617.47990.0073*
A-A3.045413.04547.01750.0330
B-B2.613412.61346.02200.0439
C-C3.291713.29177.58500.0283
AB1.895711.89574.36820.0750
AC0.066610.06660.15350.7069
BC8.650018.649919.93180.0029
A21.645411.64543.79150.0926
B27.0256017.0256016.18880.0050
C20.305510.30550.70390.4292
Residual3.037870.4340
Lack of Fit2.452330.81745.58410.0650
Pure Error0.585540.1464
Cor Total32.252916
Data were presented as mean ± SD, n = 3. The asterisks indicate a significant difference from the blank group (* p < 0.05). A2, B2 and C2 it mean square.

Appendix B

Figure A1. Dynamic monitoring of fermentation process of S. rolfsii after adding precursors in Erlenmeyer flasks. (A) Glucose and fructose residues (sucrose was broken down into glucose and fructose residues); (B) residual sugars; and (C) titer of EPS; (D) pH. Data are presented as mean ± SD, n = 3.
Fermentation 11 00143 g0a1
Figure A2. Analysis of DEGs in SEPS and LEPS groups. (A) The number of up- and down-regulated DEGs in the 24 h transcriptome and (B) the number of up- and down-regulated DEGs in the 48 h transcriptome. Red dots represent up-regulated DEGs, green dots represent down-regulated ones.
Fermentation 11 00143 g0a2
Figure A3. Transcriptome and metabolome co-analysis. (A) KEGG annotation results and (B) KEGG enrichment results. Green represents metabolites, red represents genes.
Fermentation 11 00143 g0a3

References

  1. Bashir, K.M.I.; Choi, J.S. Clinical and Physiological Perspectives of beta-Glucans: The Past, Present, and Future. Int. J. Mol. Sci. 2017, 18, 1906. [Google Scholar] [CrossRef] [PubMed]
  2. Moreno-Mendieta, S.; Guillen, D.; Hernandez-Pando, R.; Sanchez, S.; Rodriguez-Sanoja, R. Potential of glucans as vaccine adjuvants: A review of the alpha-glucans case. Carbohydr. Polym. 2017, 165, 103–114. [Google Scholar] [CrossRef]
  3. Zlotko, K.; Wiater, A.; Wasko, A.; Pleszczynska, M.; Paduch, R.; Jaroszuk-Scisel, J.; Bieganowski, A. A Report on Fungal (1-->3)-alpha-d-glucans: Properties, Functions and Application. Molecules 2019, 24, 3972. [Google Scholar] [CrossRef] [PubMed]
  4. Castillo, N.A.; Valdez, A.L.; Farina, J.I. Microbial production of scleroglucan and downstream processing. Front. Microbiol. 2015, 6, 1106. [Google Scholar] [CrossRef]
  5. Wang, F.; Wang, X.; Tang, T.; Duan, Y.; Mao, T.; Guo, X.; Wang, Q.; You, J. De Novo RNA Sequencing and Transcriptome Analysis of Sclerotium rolfsii Gene Expression during Sclerotium Development. Genes 2023, 14, 2170. [Google Scholar] [CrossRef]
  6. Song, J.; Jia, Y.X.; Su, Y.; Zhang, X.Y.; Tu, L.N.; Nie, Z.Q.; Zheng, Y.; Wang, M. Initial Analysis on the Characteristics and Synthesis of Exopolysaccharides from Sclerotium rolfsii with Different Sugars as Carbon Sources. Polymers 2020, 12, 348. [Google Scholar] [CrossRef]
  7. Tan, R.Q.; Lyu, Y.B.; Zeng, W.Z.; Zhou, J.W. Enhancing scleroglucan production by Sclerotium rolfsii WSH-G01 through a pH-shift strategy based on kinetic analysis. Bioresour. Technol. 2019, 293, 122098. [Google Scholar] [CrossRef]
  8. Sen, I.K.; Mandal, A.K.; Chakraborty, R.; Behera, B.; Yadav, K.K.; Maiti, T.K.; Islam, S.S. Structural and immunological studies of an exopolysaccharide from Acinetobacter junii BB1A. Carbohydr. Polym. 2014, 101, 188–195. [Google Scholar] [CrossRef]
  9. Hernandez, L.L. ADSA Foundation Scholar Award: A role for serotonin in lactation physiology-Where do we go from here? J. Dairy. Sci. 2018, 101, 5671–5678. [Google Scholar] [CrossRef]
  10. Cenci-Goga, B.T.; Sechi, P.; Iulietto, M.F.; Amirjalali, S.; Barbera, S.; Karama, M.; Aly, S.S.; Grispoldi, L. Characterization and Growth under Different Storage Temperatures of Ropy Slime-Producing Leuconostoc mesenteroides Isolated from Cooked Meat Products. J. Food Prot. 2020, 83, 1043–1049. [Google Scholar] [CrossRef]
  11. Deepak, V.; Ramachandran, S.; Balahmar, R.M.; Pandian, S.R.; Sivasubramaniam, S.D.; Nellaiah, H.; Sundar, K. In vitro evaluation of anticancer properties of exopolysaccharides from Lactobacillus acidophilus in colon cancer cell lines. In Vitro Cell. Dev. Biol. Anim. 2016, 52, 163–173. [Google Scholar] [CrossRef] [PubMed]
  12. Ali, K.; Mehmood, M.H.; Iqbal, M.A.; Masud, T.; Qazalbash, M.; Saleem, S.; Ahmed, S.; Tariq, M.R.; Safdar, W.; Nasir, M.A.; et al. Isolation and characterization of exopolysaccharide-producing strains of Lactobacillus bulgaricus from curd. Food Sci. Nutr. 2019, 7, 1207–1213. [Google Scholar] [CrossRef]
  13. Morona, J.K.; Morona, R.; Paton, J.C. Characterization of the locus encoding the Streptococcus pneumoniae type 19F capsular polysaccharide biosynthetic pathway. Mol. Microbiol. 1997, 23, 751–763. [Google Scholar] [CrossRef]
  14. De Vuyst, L.; Degeest, B. Heteropolysaccharides from lactic acid bacteria. FEMS Microbiol. Rev. 1999, 23, 153–177. [Google Scholar] [CrossRef]
  15. Sutherland, I.W. Microbial polysaccharides—A comparison with eukaryotic polymers. Symp. Soc. Exp. Biol. 1989, 43, 389–402. [Google Scholar] [PubMed]
  16. Schmid, J.; Müller-Hagen, D.; Bekel, T.; Funk, L.; Stahl, U.; Sieber, V.; Meyer, V. Transcriptome sequencing and comparative transcriptome analysis of the scleroglucan producer Sclerotium rolfsii. BMC Genomics 2010, 11, 329. [Google Scholar] [CrossRef] [PubMed]
  17. Wang, L.Y.; Wu, L.T.; Chen, Q.Y.; Li, S.; Zhu, Y.B.; Wu, J.N.; Chu, J.L.; Wu, S.S. Development of sugarcane resource for efficient fermentation of exopolysaccharide by using a novel strain of Kosakonia cowanii LT-1. Bioresour. Technol. 2019, 280, 247–254. [Google Scholar] [CrossRef]
  18. Fu, L.; Jiang, B.; Wei, J.; Liu, J.; Hu, X.; Zhang, L. Transcriptome analysis of polysaccharide-based microbial flocculant MBFA9 biosynthesis regulated by nitrogen source. Sci. Rep. 2020, 10, 2918. [Google Scholar] [CrossRef] [PubMed]
  19. Fariña, J.I.; Santos, V.E.; Perotti, N.I.; Casas, J.A.; Molina, O.E.; García-Ochoa, F. Influence of the nitrogen source on the production and rheological properties of scleroglucan produced. World J. Microb. Biotechnol. 1999, 15, 309–316. [Google Scholar] [CrossRef]
  20. Lin, S.; Liu, Z.Q.; Baker, P.J.; Yi, M.; Wu, H.; Xu, F.; Teng, Y.; Zheng, Y.G. Enhancement of cordyceps polysaccharide production via biosynthetic pathway analysis in Hirsutella sinensis. Int. J. Biol. Macromol. 2016, 92, 872–880. [Google Scholar] [CrossRef]
  21. Song, J.; Qiu, Y.; Zhao, R.; Hou, J.; Tu, L.; Nie, Z.; Wang, J.; Zheng, Y.; Wang, M. Transcriptomics and Metabolomics Analysis of Sclerotium rolfsii Fermented with Differential Carbon Sources. Foods 2022, 11, 3706. [Google Scholar] [CrossRef] [PubMed]
  22. Li, B.; Dewey, C.N. RSEM: Accurate transcript quantification from RNA-Seq data with or without a reference genome. BMC Bioinform. 2011, 12, 323. [Google Scholar] [CrossRef] [PubMed]
  23. Love, M.I.; Huber, W.; Anders, S. Moderated estimation of fold change and dispersion for RNA-seq data with DESeq2. Genome Biol. 2014, 15, 550. [Google Scholar] [CrossRef]
  24. Wang, L.; Feng, Z.; Wang, X.; Wang, X.; Zhang, X. DEGseq: An R package for identifying differentially expressed genes from RNA-seq data. Bioinformatics 2009, 26, 136–138. [Google Scholar] [CrossRef] [PubMed]
  25. Han, C.; Shi, C.; Liu, L.; Han, J.; Yang, Q.; Wang, Y.; Li, X.; Fu, W.; Gao, H.; Huang, H.; et al. Majorbio Cloud 2024: Update single-cell and multiomics workflows. iMeta 2024, 3, e217. [Google Scholar] [CrossRef]
  26. Livak, K.J.; Schmittgen, T.D. Analysis of Relative Gene Expression Data Using Real-Time Quantitative PCR and the 2−ΔΔCT Method. Methods 2001, 25, 402–408. [Google Scholar] [CrossRef]
  27. Guo, W.; Zou, L.F.; Ji, Z.Y.; Cai, L.L.; Chen, G.Y. Glucose 6-phosphate isomerase (Pgi) is required for extracellular polysaccharide biosynthesis, DSF signals production and full virulence of Xanthomonas oryzae pv. oryzicola in rice. Physiol. Mol. 2017, 100, 209–219. [Google Scholar] [CrossRef]
  28. West, T.P.; Strohfus, B. Short Communication: Effect of manganese on polysaccharide production and cellular pigmentation in the fungus Aureobasidium pullulans. World J. Microbiol. Biotechnol. 1997, 13, 233–235. [Google Scholar] [CrossRef]
  29. Judge, A.; Dodd, M.S. Metabolism. Essays Biochem. 2020, 64, 607–647. [Google Scholar] [CrossRef]
  30. Zhang, Z.W.; Luo, S.; Zhang, G.C.; Feng, L.Y.; Zheng, C.; Zhou, Y.H.; Du, J.B.; Yuan, M.; Chen, Y.E.; Wang, C.Q.; et al. Nitric oxide induces monosaccharide accumulation through enzyme S-nitrosylation. Plant Cell Environ. 2017, 40, 1834–1848. [Google Scholar] [CrossRef]
  31. Woo, J.E.; Seong, H.J.; Lee, S.Y.; Jang, Y.S. Metabolic Engineering of Escherichia coli for the Production of Hyaluronic Acid From Glucose and Galactose. Front. Bioeng. Biotechnol. 2019, 7, 351. [Google Scholar] [CrossRef]
  32. Kong, X.; Zhang, B.; Hua, Y.; Zhu, Y.; Li, W.; Wang, D.; Hong, J. Efficient l-lactic acid production from corncob residue using metabolically engineered thermo-tolerant yeast. Bioresour. Technol. 2019, 273, 220–230. [Google Scholar] [CrossRef] [PubMed]
  33. Yang, M.; Zhang, X. Construction of pyruvate producing strain with intact pyruvate dehydrogenase and genome-wide transcription analysis. World J. Microbiol. Biotechnol. 2017, 33, 59. [Google Scholar] [CrossRef] [PubMed]
  34. Agarwal, P.K.; Uppada, V.; Swaminathan, A.G.; Noronha, S.B. Engineering of yeast pyruvate decarboxylase for enhanced selectivity towards carboligation. Bioresour. Technol. 2015, 192, 90–96. [Google Scholar] [CrossRef]
  35. Wood, A.J.; Duff, R.J. The aldehyde dehydrogenase (ALDH) gene superfamily of the moss Physcomitrella patens and the algae Chlamydomonas reinhardtii and Ostreococcus tauri. Bryologist 2009, 112, 1–11. [Google Scholar] [CrossRef]
  36. Rodrigues, S.M.; Andrade, M.O.; Gomes, A.P.; Damatta, F.M.; Baracat-Pereira, M.C.; Fontes, E.P. Arabidopsis and tobacco plants ectopically expressing the soybean antiquitin-like ALDH7 gene display enhanced tolerance to drought, salinity, and oxidative stress. J. Exp. Bot. 2006, 57, 1909–1918. [Google Scholar] [CrossRef]
  37. Kirch, H.H.; Bartels, D.; Wei, Y.; Schnable, P.S.; Wood, A.J. The ALDH gene superfamily of Arabidopsis. Trends Plant Sci. 2004, 9, 371–377. [Google Scholar] [CrossRef]
  38. Mori, Y.; Yamawaki, K.; Ishiguro, T.; Yoshihara, K.; Ueda, H.; Sato, A.; Ohata, H.; Yoshida, Y.; Minamino, T.; Okamoto, K.; et al. ALDH-Dependent Glycolytic Activation Mediates Stemness and Paclitaxel Resistance in Patient-Derived Spheroid Models of Uterine Endometrial Cancer. Stem Cell Rep. 2019, 13, 730–746. [Google Scholar] [CrossRef] [PubMed]
  39. Liu, F.; Schnable, P.S. Functional specialization of maize mitochondrial aldehyde dehydrogenases. Plant. Physiol. 2002, 130, 1657–1674. [Google Scholar] [CrossRef]
  40. Szekely, G.; Abraham, E.; Cseplo, A.; Rigo, G.; Zsigmond, L.; Csiszar, J.; Ayaydin, F.; Strizhov, N.; Jasik, J.; Schmelzer, E.; et al. Duplicated P5CS genes of Arabidopsis play distinct roles in stress regulation and developmental control of proline biosynthesis. Plant J. 2008, 53, 11–28. [Google Scholar] [CrossRef]
  41. Kumari, S.; Tishel, R.; Eisenbach, M.; Wolfe, A.J. Cloning, characterization, and functional expression of acs, the gene which encodes acetyl coenzyme A synthetase in Escherichia coli. J. Bacteriol. 1995, 177, 2878–2886. [Google Scholar] [CrossRef] [PubMed]
  42. Makris, D.P.; Rossiter, J.T. Heat-induced, metal-catalyzed oxidative degradation of quercetin and rutin (Quercetin 3-O-rhamnosylglucoside) in aqueous model systems. J. Agric. Food Chem. 2000, 48, 3830–3838. [Google Scholar] [CrossRef] [PubMed]
  43. Gordon, J.I.; Duronio, R.J.; Rudnick, D.A.; Adams, S.P.; Gokel, G.W. Protein N-myristoylation. J. Biol. Chem. 1991, 266, 8647–8650. [Google Scholar] [CrossRef] [PubMed]
  44. Kim, Y.; Lama, S.; Agrawal, D.; Kumar, V.; Park, S. Acetate as a potential feedstock for the production of value-added chemicals: Metabolism and applications. Biotechnol. Adv. 2021, 49, 107736. [Google Scholar] [CrossRef]
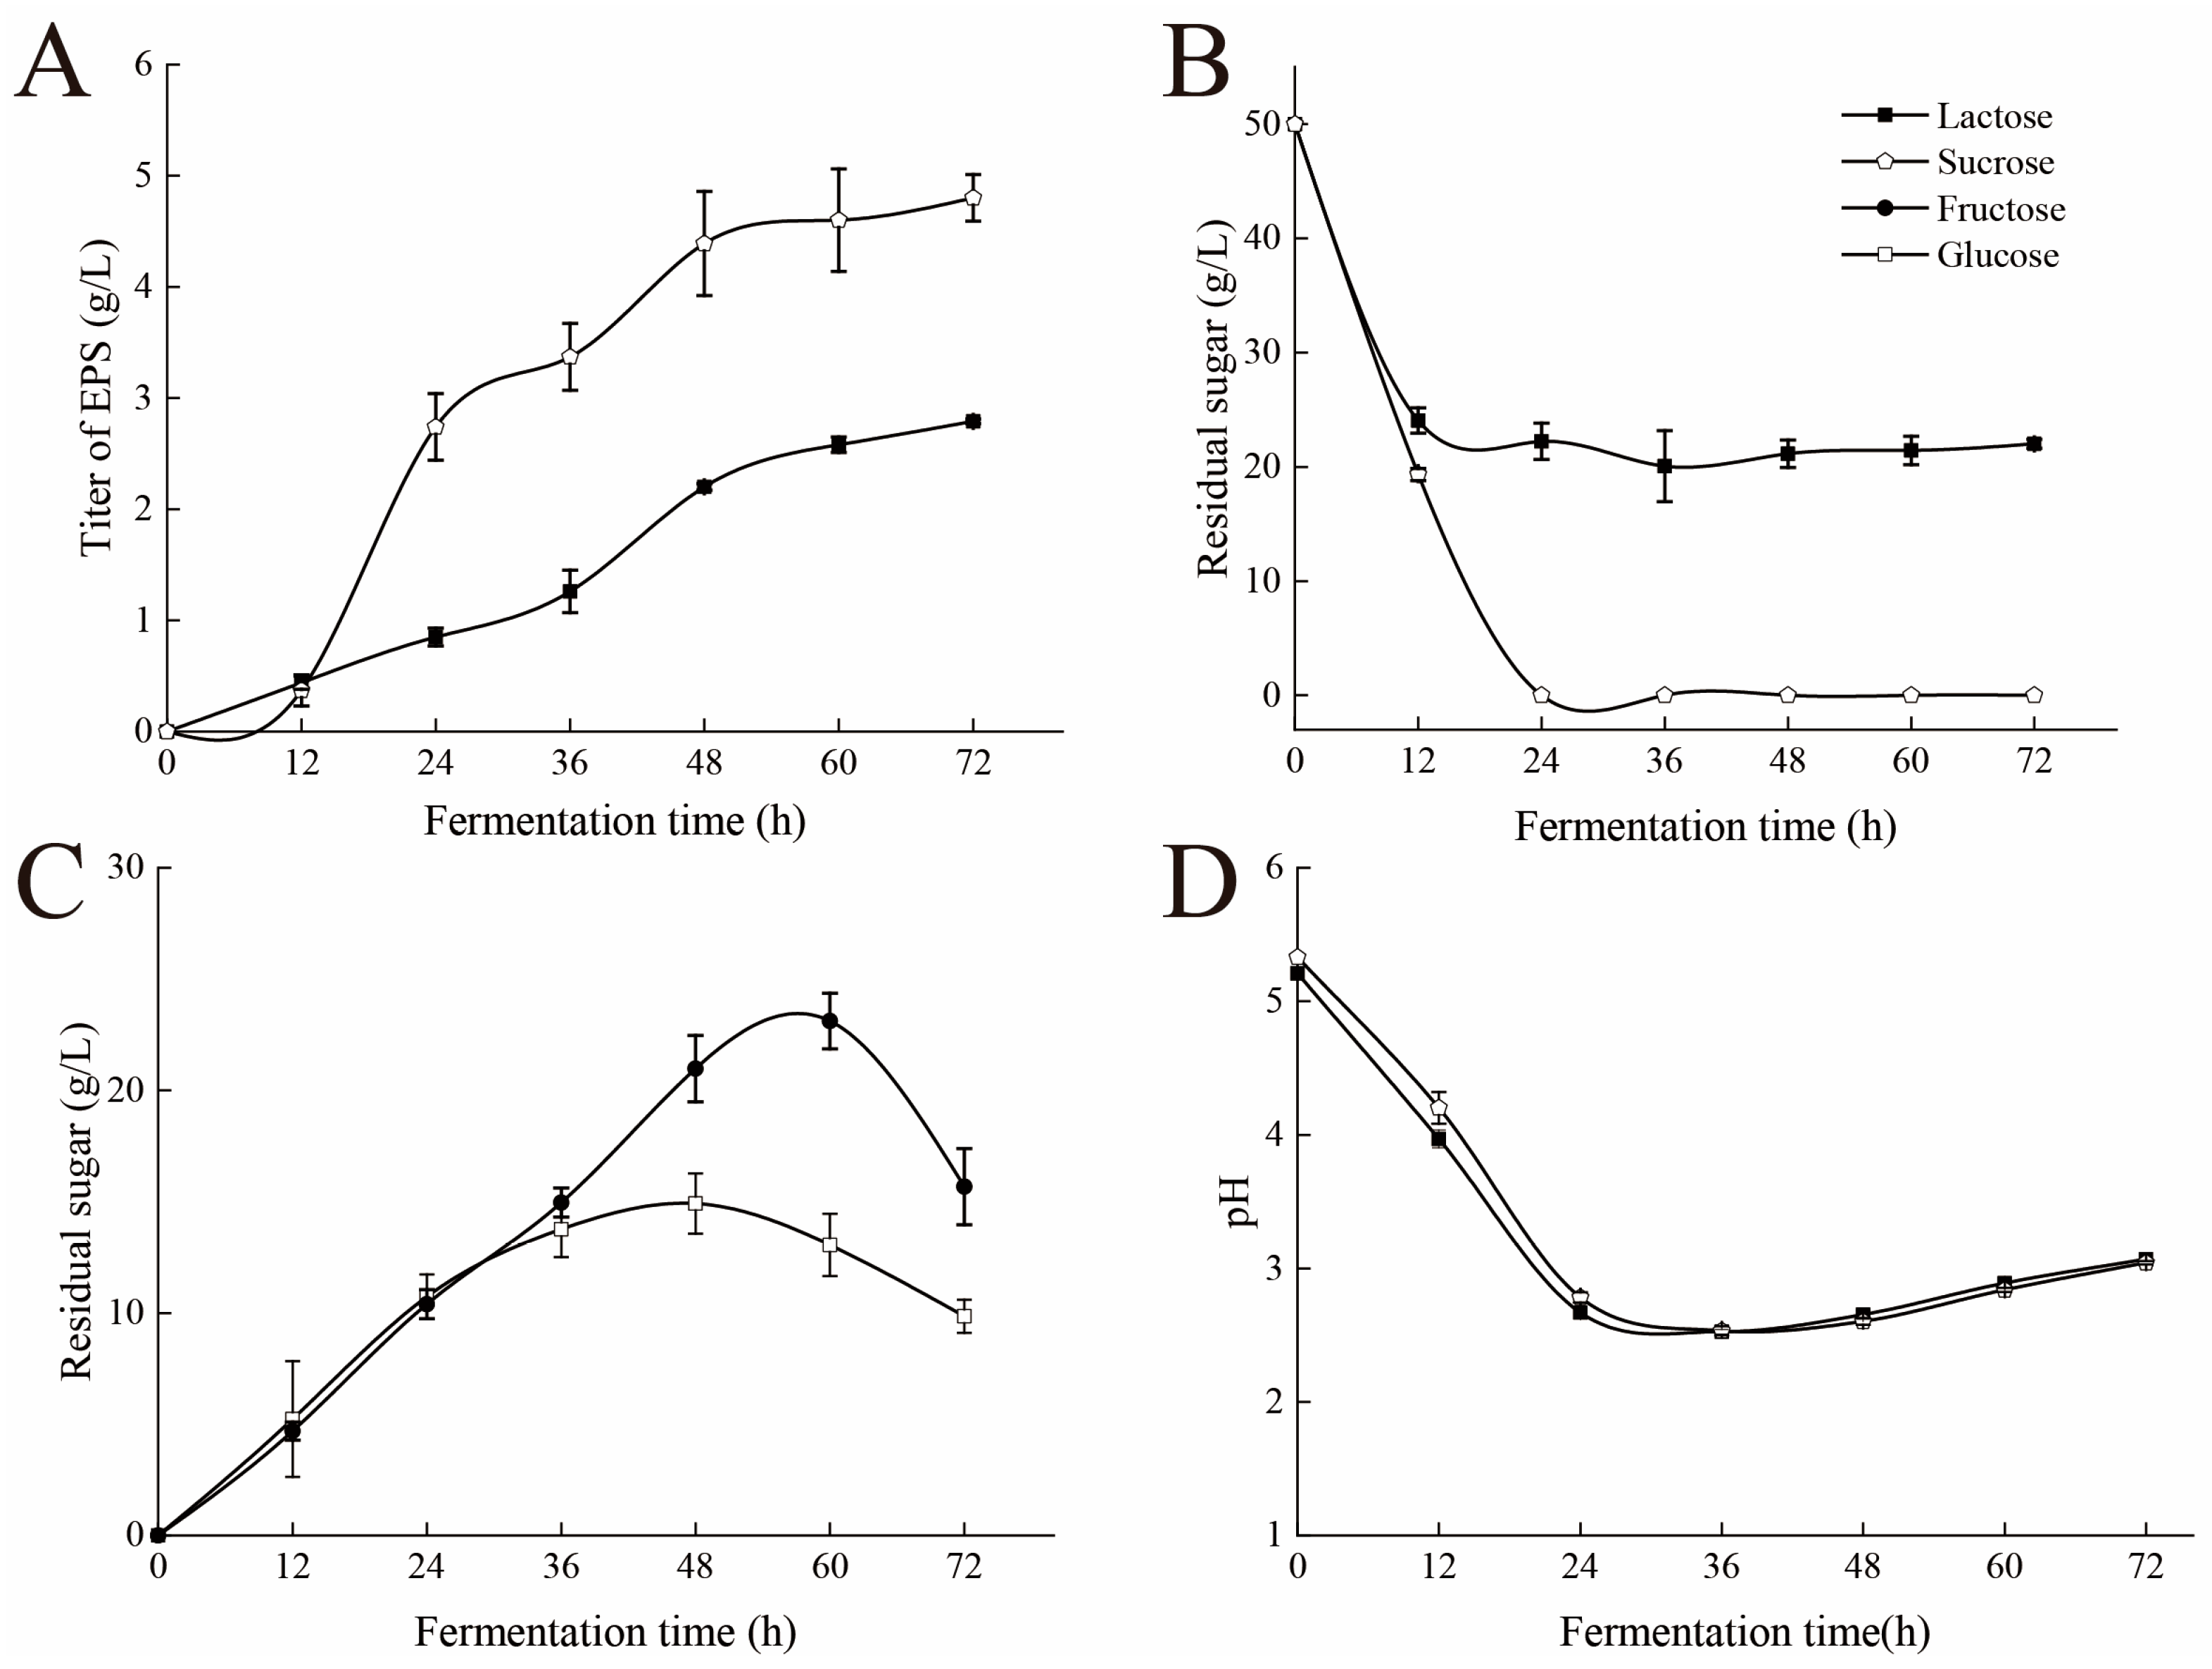
Figure 1. Dynamic monitoring of the fermentation process of S. rolfsii in Erlenmeyer flasks. (A) Titer of EPS; (B) residual sucrose and lactose; (C) glucose and fructose residues (sucrose is broken down into glucose and fructose residues); and (D) pH. Data are presented as mean ± SD, n = 3.
Fermentation 11 00143 g001
Figure 2. GO and KEGG enrichment analysis between SEPS and LEPS groups. (A) GO enrichment column chart of DEGs in the 24 h transcriptome (biological process, cellular component, and molecular function); (B) GO enrichment bubble chart of DEGs in the 48 h transcriptome; (C) KEGG enrichment bubble chart of DEGs in the 24 h transcriptome; and (D) KEGG enrichment bubble chart of DEGs in the 48 h transcriptome. The colors in (B) represent the q value, the colors in (C,D) represent the padjust value, and the size of the bubble represents the number of enriched genes.
Fermentation 11 00143 g002
Figure 3. Analysis of relative gene expression levels of identified differential genes using Suc as a control group. (A) PFK1; (B) GAPDH; (C) HK; (D) FBA; (E) PDC; and (F) ALDH3. (Data are presented as mean ± SD, n = 3. The asterisks indicate a significant difference from the blank group. t-test: * p < 0.05, and *** p < 0.001).
Fermentation 11 00143 g003
Figure 4. Biosynthesis of exopolysaccharides from EMP pathway based on transcriptome data. SEPS is the control group, and LEPS is the experimental group. Blue and red represent differentially expressed genes, red represents the up-regulation of the experimental group, blue represents down-regulation, and green indicates the substance to be added.
Fermentation 11 00143 g004
Figure 5. Morphology of S. rolfsii mycelia obtained using different carbon sources and precursors added for 48 h of fermentation. (A) Sucrose; (B) sucrose + precursor; (C) lactose; and (D) lactose + precursor. (Covered with floccules observed in the red circle).
Fermentation 11 00143 g005
Figure 6. Dynamic monitoring of the fermentation process of S. rolfsii in the 5 L fermenter. (A) Titer of EPS; (B) residual sugars; and (C) glucose and fructose residues (sucrose is broken down into glucose and fructose residues); and (D) pH. Data are presented as mean ± SD, n = 3.
Fermentation 11 00143 g006
Table 1. Polysaccharide titer experiments under different conditions.
Regulated ProteinsAdded PrecursorTime (h)Concentration (g/L)Polysaccharide Titer (g/L)
Blank group2.79 ± 0.06
ALHD3Acetaldehyde00.13.65 ± 0.12 *
120.13.93 ± 0.07 *
240.14.36 ± 0.12 **
Alcohol Dehydrogenase (ADH)Acetic acid00.14.03 ± 0.13 *
120.13.82 ± 0.09 *
240.12.82 ± 0.07
PKF1D-Fructose 6-phosphate disodium00.13.14 ± 0.27
120.13.42 ± 0.08
240.14.55 ± 0.18 **
PDCPyruvic acid00.14.00 ± 0.18 *
120.13.77 ± 0.15 *
240.13.59 ± 0.22 *
Data are presented as mean ± SD, n = 3. The asterisks indicate a significant difference from the blank group (* p < 0.05, ** p <0.01).
Disclaimer/Publisher’s Note: The statements, opinions and data contained in all publications are solely those of the individual author(s) and contributor(s) and not of MDPI and/or the editor(s). MDPI and/or the editor(s) disclaim responsibility for any injury to people or property resulting from any ideas, methods, instructions or products referred to in the content.