Article

Apple and Grape Waste Pomace Fermentation and Co-Ferment Product Chemistry

1
Department of Food Science and Technology, Texas A&M University, College Station, TX 77843, USA
2
Department of Horticultural Sciences, Texas A&M University, College Station, TX 77843, USA
3
Western Agriculture Research Center, Montana State University, Corvallis, MT 59828, USA
*
Author to whom correspondence should be addressed.
Fermentation 2025, 11(3), 126; https://doi.org/10.3390/fermentation11030126
Submission received: 16 January 2025 / Revised: 15 February 2025 / Accepted: 26 February 2025 / Published: 5 March 2025

Abstract

:
The pomace from apple and grape processing is usually treated as waste. Nowadays, pomace has attracted increasing interest due to its potential value as a nutrient source, as a raw ingredient for fermented products, and as a health beneficial product. Hence, from the perspective of a circular economy, this study incorporated different ratios of grape pomace from ‘Frontenac gris’ and apple pomace from ‘McIntosh’ to develop novel fermented beverages. This study provides knowledge of the fundamental characteristics, fermentation dynamics, and final fermented product chemistries. The results indicated different amounts of apple and grape pomace influenced sugar content, tartaric acids, and yeast nutrients in the fermentation must. The dynamic color changes indicated that grape pomace contributed to the wine’s red color, whereas apple pomace mainly contributed to the yellow coloration in the fermented products. Apple and grape pomace also contributed differently to the phenolic compounds, ethanol, and volatile acids. Different pomace contributed different phenolic components in the final wine. This fermentation study indicated the potential application of grape and apple pomace in the wine industry.

1. Introduction

Over the rising concerns of food wastage and sustainable food products, recycling and reusing food processing wastes have arisen as solutions to the global crisis [1]. The food system in-turn, has shifted towards capitalizing upon circular economy approaches [2]. In the grape and apple beverage industry, pomace, an abundant by-product, remains unused; this represents approximately 25% or more of the total fruit weight [3,4,5]. Both grape and apple pomaces contain many nutritional and bioactive compounds, such as polyphenols, organic and fatty acids, acids, minerals, and vitamins [6,7].
Recently, pomace has received recognition due to its health-promoting effects and circular economy benefits. Interestingly, pomaces have been used a long time ago for alcoholic beverages. In classical Rome, Lora or Vinum operarium was made after the addition of water to the grape pomace (such as skins, seeds, and stems). This type of beverage usually has low alcohol content, from 4% to 8% (v/v). The descendants of this kind of beverage are known as piquette in France [8]. Piquette is made traditionally by letting water and sugar ferment over crushed grapes and skins after pressing [9]. Pomace fermentation can reduce the waste of grape processing and dilute the tartaric acid in grape wines, which is more sustainable and environmentally friendly. It is important to note that piquette production as a wine-like product is legal in the US and UK, but may remain illegal to produce for sale in some European Union nations to protect the wine industry from overproduction and to prevent consumer confusion [10]. A similar product, ciderkin, is a fermented beverage made from apple pomace left after apple pressing [11]. It was described as a soft mellow cider, treated as a popular children’s drink in the 18th and early 19th centuries [12].
Blending and co-fermentation are common techniques for wine and cider fermentation to enhance their quality by achieving target chemistries and flavors. Blending different grape varieties can create increasingly complex flavor and aroma profiles in wines [13]. It is also common to use multiple cider apple varieties for cider processing, and these raw materials influence the sensory and volatile profiles of cider [14]. Each type of fruit variety will lead to final fermentation products with a unique volatile profile. In fruit wine research, blending and co-fermentation have similar advantages stemming from blending strategies. Through mixed fruit fermentation, producers can achieve methods to preserve and enhance fruit nutrients, minerals, vitamins, aroma, and tastes [15]. The aromatization by the joint fermentation of fruits ensures the enrichment of wines with biologically active substances [16]. Grape with fruit juices from cherry, kiwi, peach, and strawberry co-fermented wine as an innovative and pleasant beverage stimulated new aromatic profiles and increased consumer acceptability [17]. Blended cactus pear and Lantana camara fruit-floral wine had differing acidity when compared to single-fruit derived fruit wine [18]. Likewise, apple-blended pear wine has increased the total concentration of esters and terpenoids compared to pear wine [19].
Technically, ciderkin-piquette is a product made from the blends of cider and grape-based wastes taking a targeted approach to capture value while innovating a new product. For commercial producers interested in producing ciderkin-piquette, there are no research publications to serve as a reference. In this study, we used grape pomace from ‘Frontenac gris’ and apple pomace from ‘McIntosh’, taking advantage of the two wastes as sustainable substrates to obtain fermented beverages. One reason to consider blending these two materials is to balance their chemical and sensory values. Ciderkins and piquettes can be out of balance on their own based on sensory evaluation [20]. Cold hardy grapes, such as ‘Frontenac gris’, frequently have low pH values and high titratable acidity levels [21]. Similarly, ‘McIntosh’ apple flesh is sweet with a tart taste [22]. Beyond basic chemistry, the color spectral characteristics of alcoholic beverages play an important role in the sensory evaluation. ‘Frontenac gris’, a mutation from the noir colored ‘Frontenac’, contains a hint of pink in its must [23]. On the other hand, ciderkin from ‘McIntosh’ apples provide yellow to brown colors [24]. Aroma comes from several volatile components in alcoholic beverages, such as esters, terpenes, pyrazines, phenols, aldehydes, and thiols [25]. The aroma differences between ‘Frontenac gris’ and ‘McIntosh’ apples are intense, which may impact the senses in fermented products. Aromas in ‘Frontenac gris’ are described as floral/fruity, butterscotch, and tomato in the early harvest fruits and honey, fruity, grassy, strawberry, and woody in the late harvest fruits [26]. ‘McIntosh’ unripe apples exhibited grassy and green aroma, and ripe fruit were described as fruity and cheesy [27]. Considering the differences between ‘Frontenac gris’ and ‘McIntosh’, blending might be an excellent way to create a balanced and interesting beverage.
This research thoroughly studied fundamental fermentation chemical changes and final wine characteristics. The co-fermentation effects from different ratios of apple and grape pomace were measured through fermentation physiochemical characteristics, fermentation dynamics and final products. This study aims to provide a thorough initial analysis of pomace utilization in fermentation of waste from grapes and apples.

2. Materials and Methods

2.1. Fruit Materials

‘McIntosh’ apple trees and ‘Frontenac gris’ grapes were harvested from plants located at the Western Agricultural Research Center (WARC) of Montana State University, Corvallis, MT, USA, which is located within USDA Hardiness Zone 5b (−26.1 to −23.3 °C average annual coldest temperature) [28] with Burnt Fork loam soils [29]. During the growing season, ‘McIntosh’ apple trees received protective sprays against fire blight (Erwinia amylovora) infection according to regional recommendations [30]. Neither fungicide nor insecticide applications were made to the ‘Frontenac gris’ vines due to low in-season pest and disease pressure during 2023. No supplemental fertilizer was applied to the ‘McIntosh’ apple planting nor the ‘Frontenac gris’ vines in 2023. Supplemental irrigation was provided via drip irrigation as needed for the ‘Frontenac gris’ vines and via mobile irrigation pipes and sprinklers as needed for the ‘McIntosh’ apple planting.
‘McIntosh’ apples were harvested in October 2023 and ground by an electric apple grinder (MuliMIX, Downey, CA, USA) before pressing. ‘Frontenac gris’ grapes were harvested in October 2023 and destemmed by an Enoltalia manual crusher destemmer (Enoltalia, Verona, Italy) before pressing. Harvested apples were pressed by a bladder fruit press (Speidel, Providence, RI, USA) with 3 bar water pressure, whereas the grapes were pressed via a 6 L bladder press (SQUEEZE master, Sacramento, CA, USA). Afterward, the apple and grape pomace were collected in plastic baskets and stored in an Amerikooler walk-in freezer (Amerikooler, Hialeah, FL, USA) at −20 °C until fermentation.

2.2. Fermentation

Before fermentation, about 15 kg apple pomace and 15 kg grape pomace were moved into a walk-in cooler (0–4 °C, humidity > 95%) one day earlier. The dry weight of pomaces was determined by weighting aliquotes of 20 g fresh weights placed at 65 °C in a Quincy lab oven (Tulsa, OK, USA) for 24 h, which was about 19.25% of fresh weight for the grape pomace, and 18.8% of fresh weight for the apple pomace.
On fermentation day, a combined mass of 1 kg pomace from apples and grapes were allocated to different fermenters taking approximately 1 L volume within the fermenter. There were five treatments of different grape to apple pomace ratios depicted as apple–grape based on w/w: a purely grape pomace-based treatment [GA1 (1:0)]; a purely apple pomace-based treatment [GA2 (0:1)]; a predominantly grape pomace-based treatment [GA3 (3:1)]; a predominantly apple-based pomace treatment [GA4 (1:3)]; and an evenly weighted apple and grape pomace-based treatment [GA5 (1:1)]. Following fruit allocation, 2 L of water were added to each fermenter. Each fermentation treatment was repeated three times to form three biological replicates. The fermentation experiments were conducted in 5.3 L glass Little Big Mouth Bubblers (Northern Brewer, Minneapolis, MN, USA). Potassium metabisulfite (Morewine, Pittsburg, CA, USA) was added to each fermenter at a rate of 0.05 g/L. A stock solution with the mixture of 0.35 g/L Scottzyme HC (Scott Labs, Petaluma, CA, USA), 0.5 g/L Lysozyme (BSG, Shakopee, MN) and 0.5 g/L Bactiless (Lallemand, Montréal, QC, Canada) was also added into each fermenter. Scottzyme HC serves to function in breaking down the pectins and cell walls of pomaces to increase juice availability; Lysozyme and Bactiless were used to reduce risk of bacterial contamination before further fermentative processes.
Following a resting period spanning overnight, the must soluble solid content (SSC, in °Brix) was tested by a density meter (DMA 35, Anton Paar, USA) and adjusted to 15 °Brix by addition of corn sugar (Brewmaster, Pittsburg, CA, USA) with drinking water to achieve a final pre-fermentation volume of 4 L. Must pH was tested by an Atago PAL-pH portable pH meter (ATAGO, Tokyo, Japan) as the initial pH. Yeast inoculation was with a hybrid strain of Saccharomyces cerevisiae and Saccharomyces paradoxus known as Exotics Mosaic yeast strain (Scottlab, Petaluma, CA, USA). The yeast inoculation rate was 0.3 g/L and yeast nutrient Go-Ferm (Scottlab, Petaluma, CA, USA) was added during rehydration at a rate of 0.375 g/L. After SSC dropped to 2/3 of initial °Brix during fermentation, additional nutrients were added as 0.5 g/L Fermaid O (Scottlab, Petaluma, CA, USA) to help nourish yeast during fermentation. On day 4, all the fermentation musts were manually pressed by hand using cheesecloth and transferred into clean 1.89 L glass bottle fermenters. All the fermentations except GA2 took about 21 days to complete. Due to the sluggish fermentation in GA2, on Day 19, fermenters for this treatment were reinoculated with the same amount of the same yeast strain following rehydration as described at the beginning of fermentation. GA2 fermentation completed fermentation following reinocculation, concluding at approximately 29 days in total. All the fermentations were conducted at room temperature (20–24 °C). After no signs of continued fermentation were observed based on carbon dioxide evolution and density reductions, fermented products were transferred into 1.5 L clear bottles and corked following the addition of 0.05 g/L of potassium metabisulfite.

2.3. Chemical Properties of Cider Piquettes

Pre-fermentation liquid portions of must were taken after sugar adjustment and were assessed for the total yeast assimilable nitrogen (YAN). YAN was calculated by the equation: YAN = YAN(K-LARGE) + YAN(PAN). YAN(K-LARGE) was generated from L-Arginine/Urea/Ammonia kits (K-LARGE, Neogen, Lansing, MI, USA) and YAN(PAN) was generated from primary amino nitrogen kits (K-PANOPA, Neogen, MI, USA).
Fermentable sugars after must sugar adjustment were tested through K-SUFRG enzymatic kits (Neogen, MI, USA), according to the manuals. During fermentation, soluble solid content (SSC in °Brix) was monitored by a density meter DMA (Anton Paar, Ashland, VA, USA). Must pH was assessed through an Atago pH meter (PAL-pH; Atago, Tokyo, Japan). All of the acid assays were based on enzymatic reactions and detected by UV absorbance. K-CITR citric acid assay kit (Neogen, MI, USA) with the limit of 0.491 mg/L was used to test citric acid in must and cider piquettes. Malic acid was quantified by a K-LMAL malic acid assay kit (Neogen, MI, USA) with a 0.25 mg/L test limit. K-TART tartaric acid kit (Neogen, MI, USA) with a 108 mg/L test limit was used to detect and quantify tartaric acid in the samples.

2.4. Chromatic Properties of Cider Piquettes

During fermentation, liquid portions of musts from each fermenter were collected into 1.5 mL microcentrifuge tubes for color spectrum measurement. Samples were briefly centrifuged at the speed of 4000 rpm for 30 s (MC12-Pro, Joan Lab Equipment Co., Ltd., Huzhou, Zhejiang, China) at room temperature to separate solid parts from the solution before testing. The samples were transferred into Corning 96 well plates (SLS3922, Millipore Sigma, Burlington, MA, USA) and analyzed with a SPECTROstarnano microplate reader (BMG Labtech, Cary, NC, USA) for the visual spectra (380 nm to 700 nm). Spectra were collected as a means of assessing color dynamics. The color data were converted by the software ColorBySpectra [31]. The absorbance data were translated into CIEL*a*b* color parameters. The color information was reported with L* (Lightness), a* (green-red), and b* (blue-yellow) and plotted through R 4.2.1 Core Team [32].

2.5. Final Cider Piquette Characteristics

Using the basic wine model, final fermentation products were analyzed by an FTIR wine analyzer (Lyza5000 wine, Anton Paar, Ashland, VA, USA) to collect profiles, such as estimated ethanol and glycerol levels.
The titratable acidity of the final products were analyzed according to AOAC methods [33] and calculated to express as g/L malic acid equivalents based on the following equation:
T i t r a t a b l e   A c i d i t y   % = 0.1 N   N a O H × 0.0067 m L   o f   c i d e r   u s e d × 100 .
Final wine tannin content was detected and quantified by a general tannin assay kit (MyBioSource, San Diego, CA, USA). The results of tannin amounts were expressed as mg/mL.

2.6. The Phenolics Concentrations and Antiradical Activities of Cider Piquettes

Total phenolics in final fermented products were quantified through the Folin-Ciocalteu method [34]. In detail, collected samples were centrifuged at 2082 RCF (× g) for 10 min. Afterward, 0.25 mL supernatant was transferred into two tubes. Then, 0.25 mL of Folin reagent and 0.25 mL of ddH2O solution were added into the tubes separately. The samples were vortexed and kept for 2 min at room temperature. One milliliter of Na2CO3 solution was added, followed by 30 s vortexing, and the sample was kept at room temperature for 1 h. An ethanol solution was used as the blank, and the absorbance values were determined at 760 nm.
2,2-diphenyl-1-picrylhydrazyl radical (DPPH) free radical scavenging methods (KF01007, BQC, Asturias, Spain) [35] and ferric reducing antioxidant power (FRAP) methods (Ab234626, Abcam, Cambridge, UK) [36] were used to test antiradical activities of final cider piquettes. Both assay operations followed the product manuals. The outcomes of DPPH assays were expressed as trolox equivalent antioxidant capacity (TEAC µM/µL) and FRAP assay results were expressed as mM ferrous equivalent/µL).

2.7. Flavonoids and Phenolic Acids in Cider Piquettes

Final cider piquettes wines were quantitatively analyzed for the measurement of flavonoids and phenolic acid by using a Shimadzu Nexera X2 high-performance liquid chromatography system (Spectra Lab Scientific Inc, Markham, ON, Canada) coupled with a Sciex QTRAP 6500 + mass spectrometer (Sciex, Framingham, MA, USA) at Creative Proteomics (New York, NY, USA). The electrospray ionization (ESI) source operation parameters were as follows: source temperature, 450 °C; ion spray voltage, –4500 V; ion source gas 1, ion source gas 2, and curtain gas, 50, 50, and 25 psi, respectively; collision gas (CAD), medium. The MS/MS system was operated in the multiple reaction monitoring (MRM) mode with the optimized collision. The ionization energy, MRM transition ions (molecular and product ions), collision energy (CE), declustering potential (DP), entrance potential (EP), and collision cell exit potential (CXP) were optimized by a Sciex Analyst software package. Analytical data were processed using the Analyst 1.6.3 software platform (Sciex, MA, USA) (Supplementary Table S1).
For samples, an aliquot of 100 µL of the wine samples was extracted for flavonoids and phenolic acids using 100% methanol. An internal standard was spiked before drying them down. The samples were reconstituted in 100 µL of 30% methanol and injected at 0.2 µL. The following phenolic compounds were included in the targeted assay: apigenindin, delphinidin, caffeic acid, ferulic acid, gallic acid, genistein, hesperetin, kaempferol, luteolin, nargingenin, p-counmaric acid, phloretin, proanthocyanindin A2, procyanindin B2, protocatechuic acid, quercetin, quercetin-3-galactoside, quercetin-3-glucodie, resveratrol, rutin, syringic acid, and vanillic acid. The results were normalized using a synthetic strigolactone (GR24) as the standard. The concentrations are reported in ng/mL of the compounds.

2.8. Statistical Analysis

All experimental data were expressed as mean ± standard deviation (SD) of three replicates in each treatment. Statistical analysis was conducted using R 4. 2.1 Core Team (2023) [37]. The biological replicates (3 of each treatment) were treated as random, while treatments were treated as fixed effects. One-way ANOVA followed by Tukey HSD was used to determine if there were significant differences among treatments. The confidence level of 95% was used for the fitting and analysis of models. The package ggplot2 was used to generate the plots [38]. The correlation matrix plot of phenolics was constructed using Pearson methods by package ‘corrplot’ in R. The correlation plot was constructed with clustering order.

3. Results and Discussion

3.1. Pre-Fermentation Must Components

The initial SSC in the must of each treatment (Table 1) indicated that the more grape pomace was used, the more sugar was detected in the must before adjustment, ranging from 4.37 to 8.40 °Brix. On the contrary, the original apple pomace provided less sugar content with only 4.37 °Brix. Since yeast strains have a differential preference for glucose and fructose, therefore, after sugar adjustment, the fermentable sugar was tested in each must [39]. The results (Table 2) indicated that although the total SSC in the initial must was close to 15 °Brix in each fermentor, glucose, fructose content, and glucose–fructose ratios were not the same. Glucose ranged from 107.71 g/L in GA4 to 119.24 g/L in GA1, and it was not related to pomace type. On the other hand, fermenters with higher amounts of apple pomace, including GA2 and GA4, had lower quantities (25–28 g/L) of fructose. The distinguished ratios were shown in GA1 with smaller ratios (less than 3) of glucose to fructose. Treatment GA2, which contained only apple pomace, had the highest glucose–fructose ratios (4.25). There were no significant differences in fructose-glucose ratios from GA3 and GA5, although the fermenters had different ratios of apple and grape pomaces.

3.2. Pre-Fermentation Yeast Assimilable Nitrogen Content in the Must

Different pomaces contributed different kinds of yeast-assimilable nitrogen. Nitrogen in the pre-fermentation must indicates that GA1 with grape pomace contained the most YAN (60 mg N/L on average). GA2 with apple pomace contained the lowest YAN observed (less than 5 mg N/L). The total YAN in the must range from higher to lower was correlated with the quantities of grape pomace. It was also noticeable that PAN (primary nitrogen) contributed most of the total YAN in each treatment with 2.5 to 60 mg N/L. The K-LARGE detected L-arginine/urea/ammonia contributed lower portions of total YAN, ranging from 5 to 15 mg N/L in the must. Nitrogen addition timing and nitrogen source type have previously been shown to influence fermentation kinetics and the production of metabolites [40].
It is recommended that the minimum YAN requirement is approximately 100 mg/L for red wine to 150 mg/L for white wine [41]. In this study, all the must contained lower nitrogen than the yeast requirement, especially those with only apple pomace. Apples are notably low in yeast-assimilable nitrogen with cider apples containing about 12 to 190 mg N/L YAN in New York state [42]. A previous study indicated that ‘McIntosh’ apple mash had only about 10 mg N/L YAN content [24]. Low nitrogen levels can cause sluggish or incomplete fermentation [43]. In this research, Go-Ferm (0.375 g/L), and Fermaid O (0.5 g/L) were both utilized as nitrogen resources for yeast consumption to ensure fermentation; however, future work on pomace-based fermentation may consider YAN addition rates and sources as a valuable question to address processing questions and concerns.

3.3. Acids in Pre-Fermented Must

Acidity is a chemical characteristic that plays an essential role in cider and wine chemistry and quality. In this research, grape pomace and apple pomace were the core ingredients, and tartaric acid (Table 3) was the only acid with significant differences among the treatments. Based on fruit organic acid information, tartaric acid is the primary organic acid in grapes and is responsible for shaping grape wine taste, stability, and overall quality [44]. Citric acid and malic acid are abundant organic acids in grapes [45]. Malic acids contribute most of the organic acids in apples and citric acids might exist in mature apples as well [46]. From the acid results, GA1 and GA3, both treatments with more grape pomace had more tartaric acid (1.43 to 1.59 g/L on average) compared to other treatments with less than 1 g/L tartaric acids. GA2 with only apple pomace had no tartaric acid detected. Both malic acid and citric acid did not have significant differences among the treatments, although malic acid content was higher in each must compared to the corresponding citric acid content.

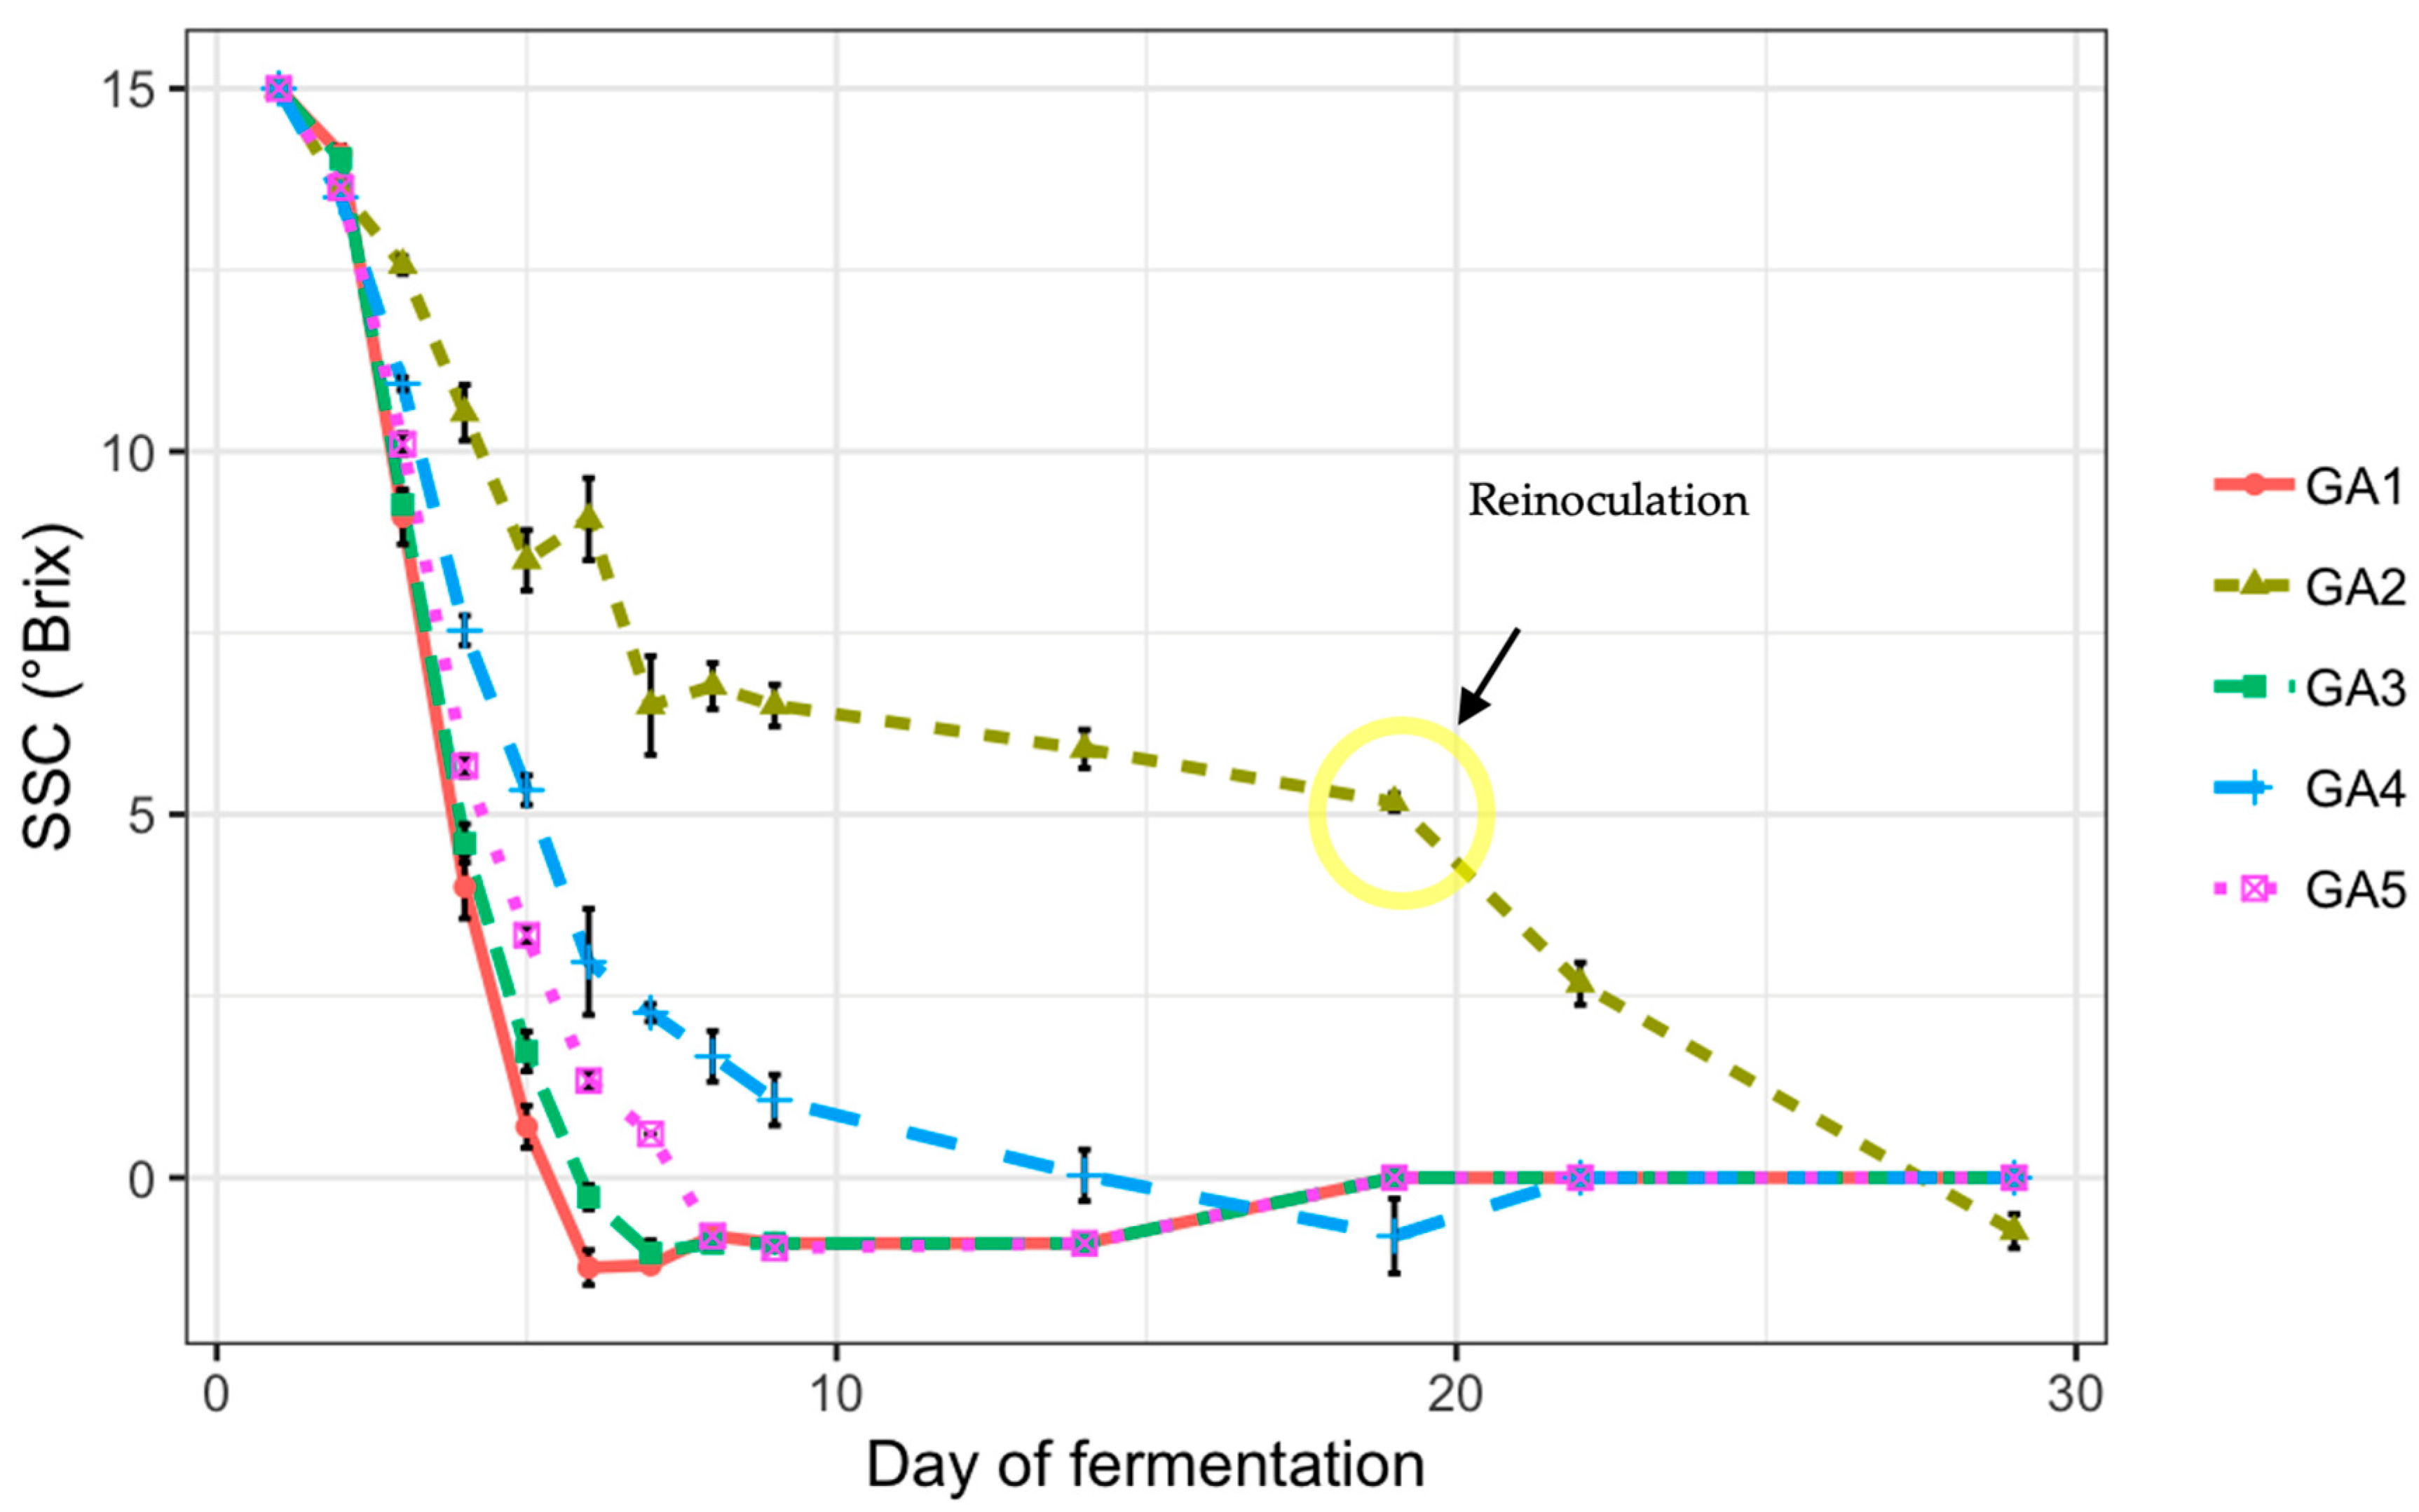
3.4. SSC Dynamic Changes During Fermentation

SSC dynamic changes were monitored daily to understand the influence of the grape pomace and apple pomace ratio on fermentation speed (Figure 1). The more grape pomace in the must, the faster the sugar was consumed by the yeast. The fermentation finished quicker in the must with higher grape pomaces. Treatments GA1, GA3, and GA5 had a day difference in fermentation completion. Treatment GA4, which had higher amounts of apple pomace, finished the fermentation in 14 days. Treatment GA2, with only apple pomace, exhibited a sluggish fermentation with minimum SSC changes observed from Day 10 to Day 19. On Day 19, reinoculation yeast and yeast nitrogen solved the stuck fermentation problems in GA2 must, indicating potentially unfavorable conditions existed in GA2 treatments; the total fermentation of GA2 took almost one month.
One cause for yeast sugar consumption differences may have been yeast preferences for fermentable sugar type. Saccharomyces cerevisiae wine yeast strains preferentially ferment glucose to varying degrees [39]. Glucose is consumed at a faster rate than fructose, and different yeast can tolerate different amounts of fructose [47]. These experimental musts contained differential sugar content, which might cause various fermentation rates since yeast stains have various preferences. Previous work with fermentation by Saccharomyces cerevisiae indicated the kinetic parameters were variable, based on the different sugars [48].
In this study, a hybrid yeast strain (Saccharomyces cerevisiae × Saccharomyces paradoxus) was utilized. The dynamic changes occurring before Day 10 indicated that GA1 had the quickest yeast consumption, followed by GA3, GA5, GA4, and GA2. Besides being highly correlated with pomace type, the fermentation sugar consumption might also indicate that yeast strain preferred fructose over glucose (Table 2). The lower G: F in the fermenter, the faster yeast consumed the sugar during fermentation, which may differ from other Saccharomyces cerevisiae strains. Its performance in GA2 with a high glucose–fructose ratio further indicate potential preferential fermentation for different sugars substrates. However, the complexity with different pomaces exists not only in sugar content but also in the nutrients. Therefore, more research needs to be conducted to understand specific strain fermentation conditions, especially in the context of pomace-reclaiming fermentations.
The stuck fermentation in this study was not likely caused by a deficiency of YAN, since the total amounts of YAN were the same in each fermenter. This common cause behind stuck fermentation alone may not explain the stuck fermentation problems observed completely; considerations and future work must acknowledge both the types of nitrogen sources and the amounts of nitrogen which might influence the completion of fermentation.

3.5. pHs Changes During Fermentation

From the pH dynamic changes (Figure 2), there was a similar sharp dropping trend from the initial pH of 3.45 to the pH of approximately 3.1 on Day 7 detected in all of the fermenters. After Day 7, pH values in GA1 to GA5 separated, ending with a pH range from 3.15 to 3.0 on Day 29; this was also correlated with the pomace types. The more grape pomace present in the must, the higher the pH in the final products. The decreasing pH during fermentation may be due to the production of acids and the rapid sugar and nutrient consumption by yeast.

3.6. Chromatic Dynamics During Fermentation

Color as one of the fermented product organoleptic properties is also the first indicator of taste [49]. Investigating the relationship between fermentation processes and chromatic changes during fermentation, cider piquettes were analyzed for L* (lightness), a* (green/red), and b* (blue/yellow) values (Figure 3A,B). The L* line chart indicated that the lightness was consistently separated for treatments; GA2 had the greatest lightness values, mainly above 90 L*, followed by GA4, GA5, GA3, and GA, ranging from 75 to 87.5 L*. This chart also corresponded with the L* plot on the right side. The GA2 treatment with only apple pomace had the highest lightness. The more grape pomaces used, the darker the must was. This might also indicate that the higher amounts of ‘Frontenac gris’, the lower the transparency of the fermented products.
The a* line chart of fermentations and plotting of sample colors indicated that the more grape pomaces used, the redder the must was, something logical and expected (Figure 3C,D). Grape pomace fermentation a* values changed from 40 to 20 a* during fermentation. On the other hand, apple pomace had negligible values. This indicates the grape materials contributed to the red colors, which likely come from the pigment present in skins of ‘Frontenac gris’ [50]. The grape pomace readily provided red tints for the fermented products, indicating promise for co-fermentation instead of using red-fleshed apple varieties to produce rosé ciders, because it may be easier for producers to generate a marketable product by mixing grape pomace with apple musts to produce more stable red tints in final ciders [51].
The b* value varied in ranking among treatments (Figure 3E,F). Before Day 4, GA1 with only grape pomace had the lowest b* values with less than 9 b*. The b* value, which represented the blue–yellow values, kept increasing during fermentation and ranked at the top with 15 b* after Day 8. On the other hand, GA2 (apple pomace only) and GA4 (more apple pomace, less grape pomace) had b* values ranging from 9 to 12. This indicated that the must from these two treatments had more yellow in the color than the others. GA3 and GA5 had no differences with approximate b* values of 14 after Day 8, which might indicate that apple pomace amounts largely influence b* values.
CIE L*a*b* color closely matches human perception [52]. Therefore, in this study, color dynamic changes were applied to estimate the impacts from the must materials. Depending on the apple varieties, the produced cider color can be bright yellow, golden orange, straw golden, or light straw [53]. ‘Frontenac gris’ wine was described as white wine with a hint of salmon color [54]. The color can be darker depending on the season and winemaking techniques It was reported that grape skins contribute to the wine pigments and could increase pigment concentration [55]. This might explain why the more grape pomace in the fermenter, the darker the fermented products were. With the direct color present (Figure 3G), the preferred colors for pomace fermented products can be established based on producer targets.

3.7. Final Wine Characteristics

Final wine characteristics from the FTIR wine analyzer (Table 4) indicated that the pH ranged from 3.24 to 3.26 on average, and GA1 with a pH of 3.26 and GA2 with a pH of 3.21 had significant differences. Even though the SSC was adjusted the same from the beginning, the ethanol content in the final wine still had significant differences. Treatments GA1 (8.13% vol) and GA3 (8.16% vol) had significantly different ethanol contents from GA2, GA4, and GA5 (with less than 8.00% vol).
Titratable acidity is an acidity measurement that reflects the perceived acidity. The titratable acidity amounts in the final wines did not follow the grape and apple pomace ratios, since GA5 (1:1 grape–apple pomace ratio) was the highest (5.73 g/L acidity) on average, significantly different from any other treatments. One possible reason could be the variations in tissue distribution of grape pomace in fermented replicates or challenges in the FTIR-based prediction of acids in pomace-based fermented products. Malic acid and tartaric acids are the primary acids in grapes but are localized in different tissues of grapes [56]. On the other hand, malic acid is the primary acid in apple pomace [57]. For future precise fermentation, ground powder from pomaces can be used to minimize the acid variations.
Volatile acids ranked from the lowest and the highest following apple pomace amounts. GA2 had the highest volatile acids (0.15 g/L on average), whereas GA1 from grape pomace had the lowest volatile acids (0.05 g/L on average). Glycerol contents were from 5.53 g/L to 6.00 g/L with GA1 having the highest glycerol content with 6.00 g/L on average; treatment GA2 had the lowest glycerol content detected, with 5.43 g/L on average. Glycerol can contribute to wine’s mouthfeel, perceived weight, and perceived sweetness [58].
There were some residual sugars, including both glucose and fructose in each final wine. Glucose residues were related to the pomace type in the fermenters. Treatment GA2, with only apple pomace, had the highest glucose residues with 2.47 g/L, followed by GA4 with 2.20 g/L residual glucose. Treatment GA1, with only grape pomace, had the least glucose (1.06 g/L) left. The residual fructose in the fermented products was minor, ranging from 0.03 to 0.53 g/L on average and there were no significant differences among the treatments. Further studies may identify yeast strain preferences and correlation with the residual sugars in the fermented products from waste stream pomace.
To confirm the correlation relationship between wine characteristics and fermentation materials, the correlation matrix plot (Figure 4) was created. Corresponding to the statistical analysis (Table 4), grape pomace amounts were highly correlated with ethanol and glycerol amounts with high correlation values (~0.8). Apple pomace amounts were highly correlated (~0.7) with volatile acids.
Meanwhile, this assessment also suggested that glycerol can be highly correlated with a 0.7 correlation coefficient to ethanol in this study. It was reported that glycerol production was linearly associated with ethanol production, and this correlation was influenced by the process conditions, especially the yeast inoculation time [59]. In this study, titratable acidity and pH were moderately correlated (with ~0.5 correlation coefficient). Although there was no direct or predictable relationship between pH and TA, the pH was influenced by acids’ ability to dissociate in fermentation [60]. Grape and apple pomace had differential impacts on titratable acidity and volatile acidity. Apple pomace had a positive correlation with volatile acidity, whereas grape pomace had a negative correlation with titratable acidity.
From the correlation matrix, the grape pomace was positively correlated to the pH levels, whereas the apple pomace was negatively correlated to the pH levels. Similarly, ethanol contents in the final wines were highly correlated with the pomace types, negatively correlated with apple pomace, but positively correlated with grape pomace. As one of the final products from sugar utilized by yeast fermentation, the ethanol contents also indicated the sugar contents from different pomaces were correlated to the final products.

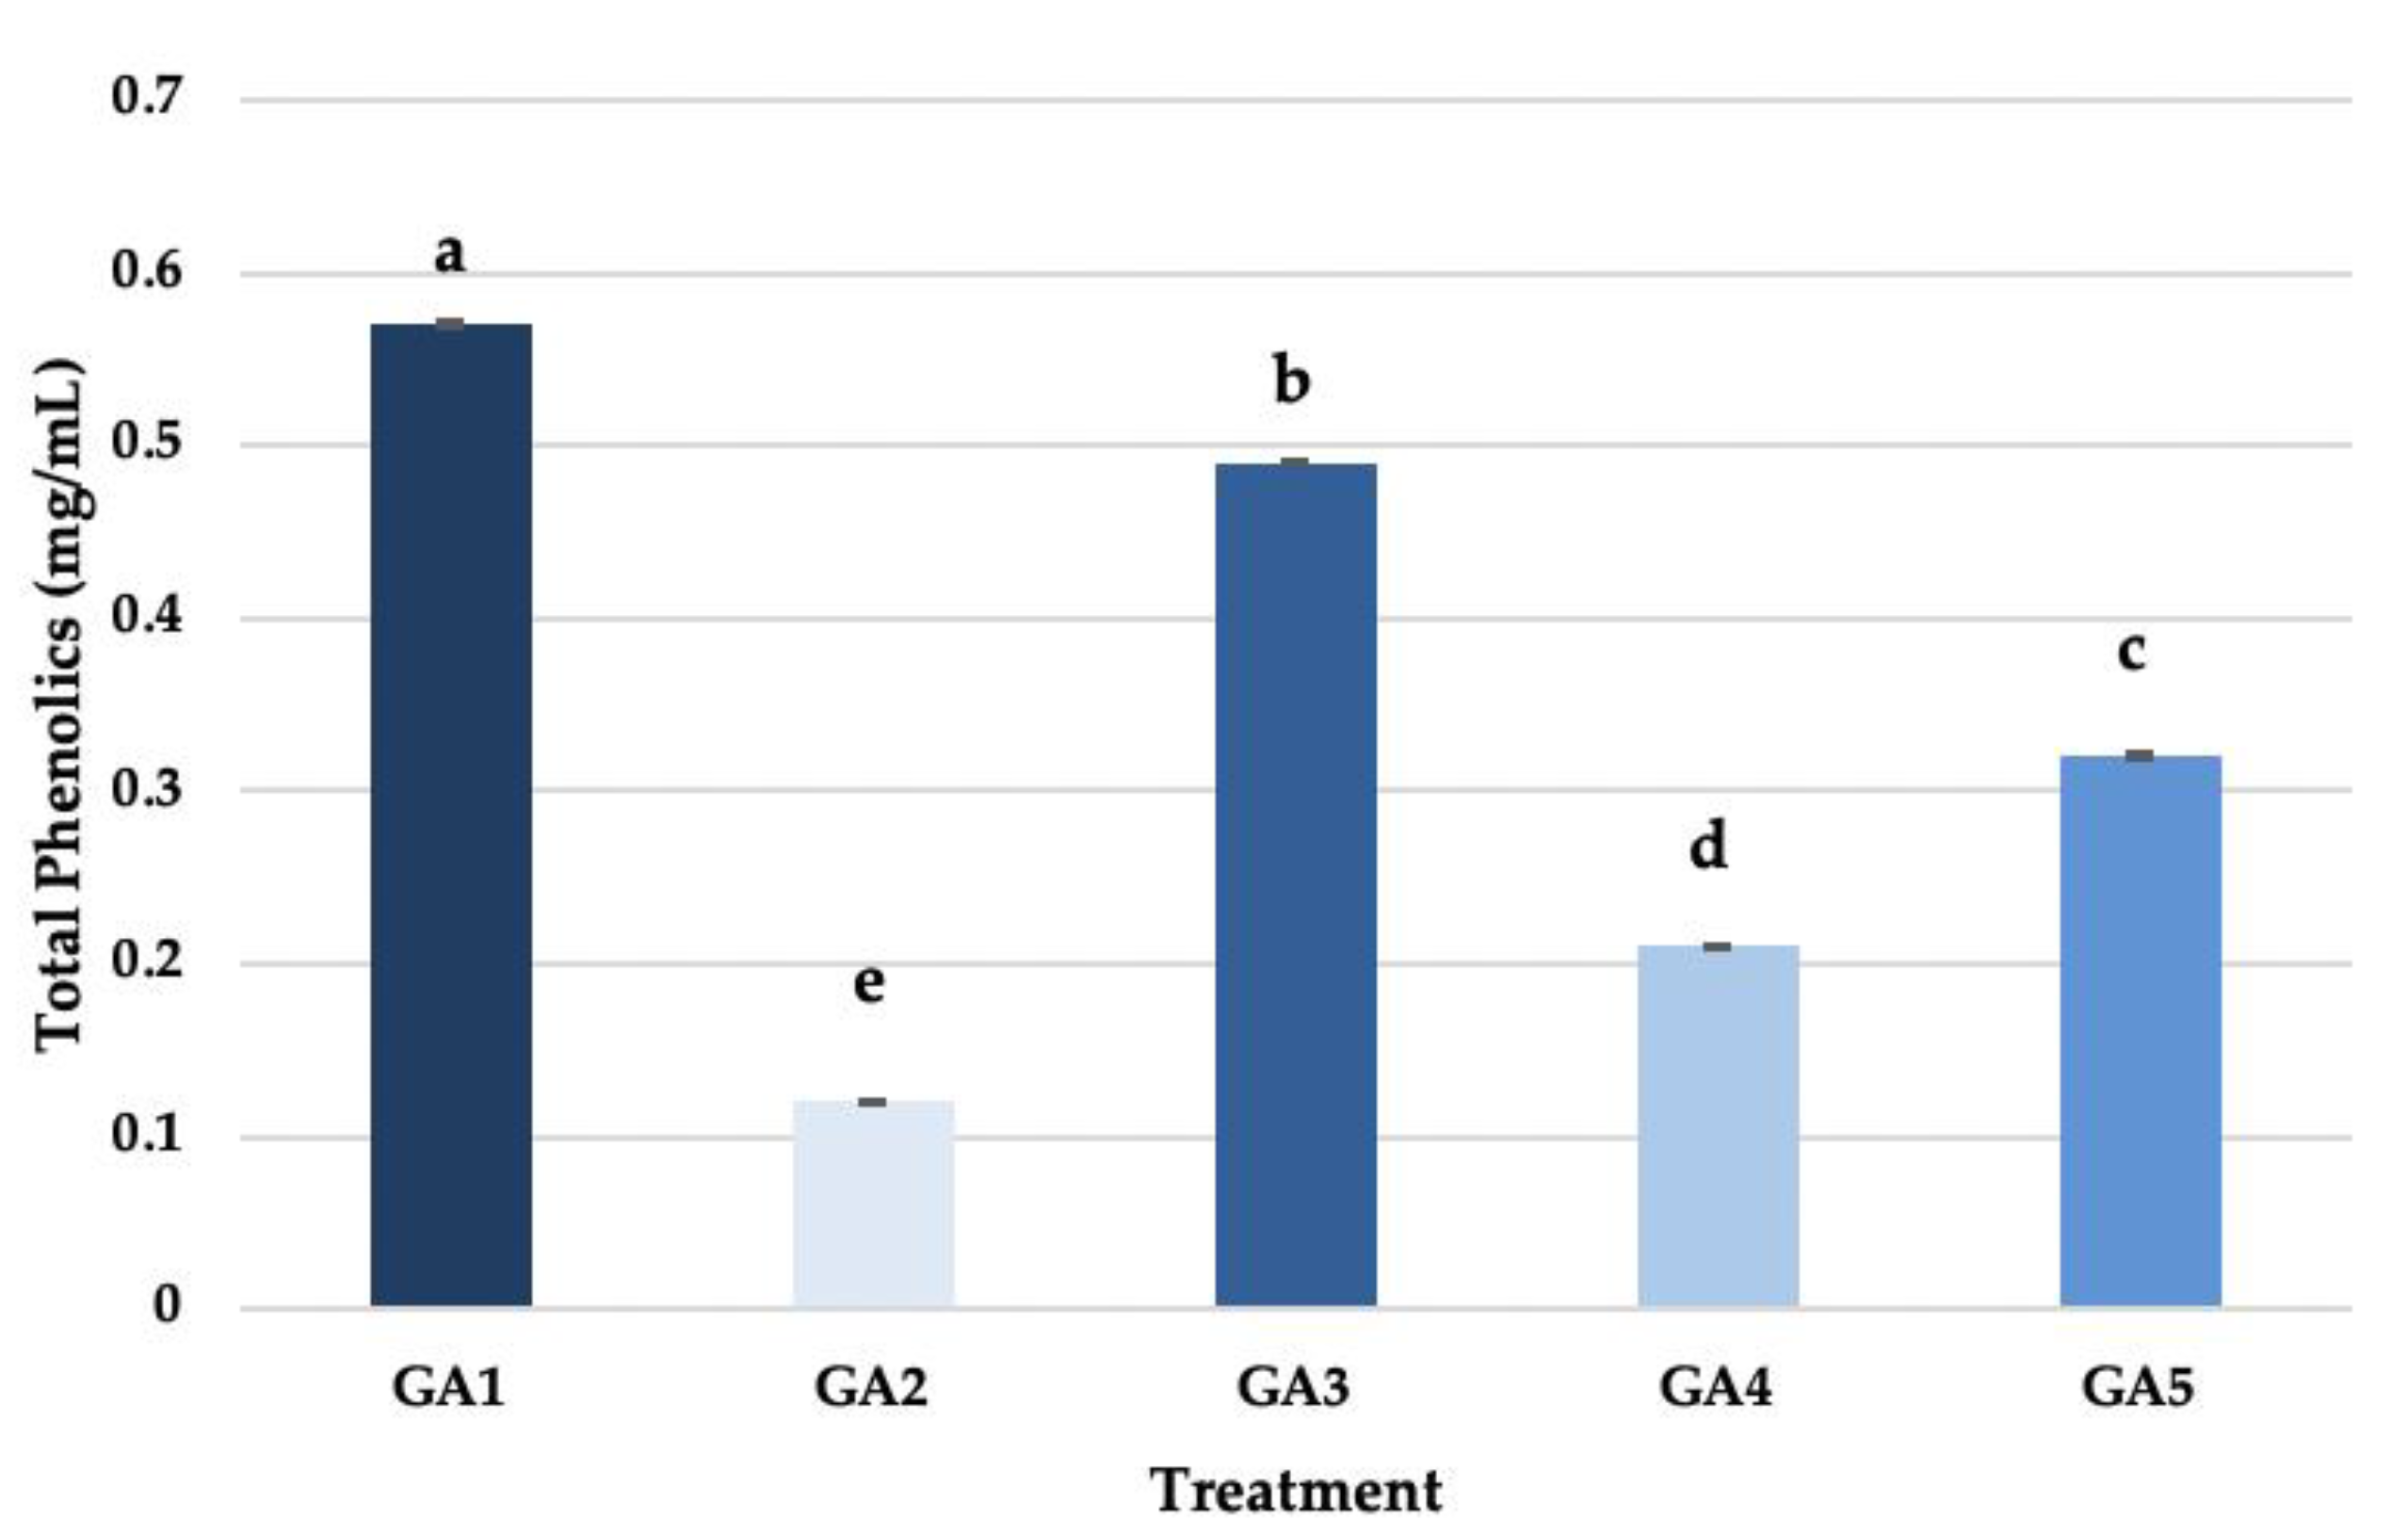
3.8. Final Wine Total Phenolics Content

The total polyphenol content in the final wines (Figure 5) was significantly different from each other with the highest amount in GA1 (grape pomace derived) and the lowest in GA2 (apple pomace derived). The higher amounts of grape pomace, the more polyphenol content in the final wines. GA1 had about five times the total phenolics (more than 0.55 mg/mL) compared to GA2 with 0.1 mg/mL phenolics, indicating that apple pomace did contribute some to polyphenol content in these fermented products.
Phenolics in fermented products affect the beverage’s taste, color, and longevity [61]. The phenolic quantities in this study indicated that with additions of more grape pomaces, more phenolics existed in the fermented end products. The total phenolic contents of treatments GA3, GA5, and GA4 were ranked in decreasing order relative to decreasing grape pomace additions, but further investigations may identify the presence of phenolic interactions during fermentation [62].

3.9. Final Wine Antioxidant Capacities

Based on FRAP assay and DPPH assay results (Table 5), it was concluded that the fermented products from only grape pomace (GA1) had the highest antioxidant capacities with 25.97 mM ferrous equivalent/µL and 705. 79 TEAC µm/µL. In contrast, fermented products using only apple pomace (GA2) had the lowest antioxidant capacities with only 1.02 mM ferrous equivalent/µL and 530.84 TEAC µm/µL. FRAP results had higher sensitivity in detecting antioxidant capacities in this research and they were ranked in accordance with grape pomace aliquots.
Although the DPPH assay had a similar rank of antioxidant capacity detection in the final wines, it could not separate some of the treatments, such as GA1 and GA3, and GA2, GA4, and GA5, in significance. Based on both methods, fermented grape pomace contributed greater antiradical activity. The sensitivity differences between DPPH and FRAP might stem from their different detection principles. DPPH assay is used to assess the free radical scavenging potential of antioxidant molecules [63]. In contrast, the FRAP assay measures the antioxidant capacity of a sample by its ability to reduce ferric ions to ferrous irons [36].
Apple pomace could enhance the phenolic contents and antioxidant capacity, which were proven by DPPH and FRAP assays [64]. Similarly, the antioxidant measurements indicated the grape pomaces contained an appreciable amount of polyphenols [65]. Further elongation of maceration timelines with pomace could enhance antioxidant capabilities of fermented products [66]. Beyond ethanol targeted fermentations, pomaces are potential ingredients for the development of functional foods, especially for nutraceutical purposes contributing to human health.

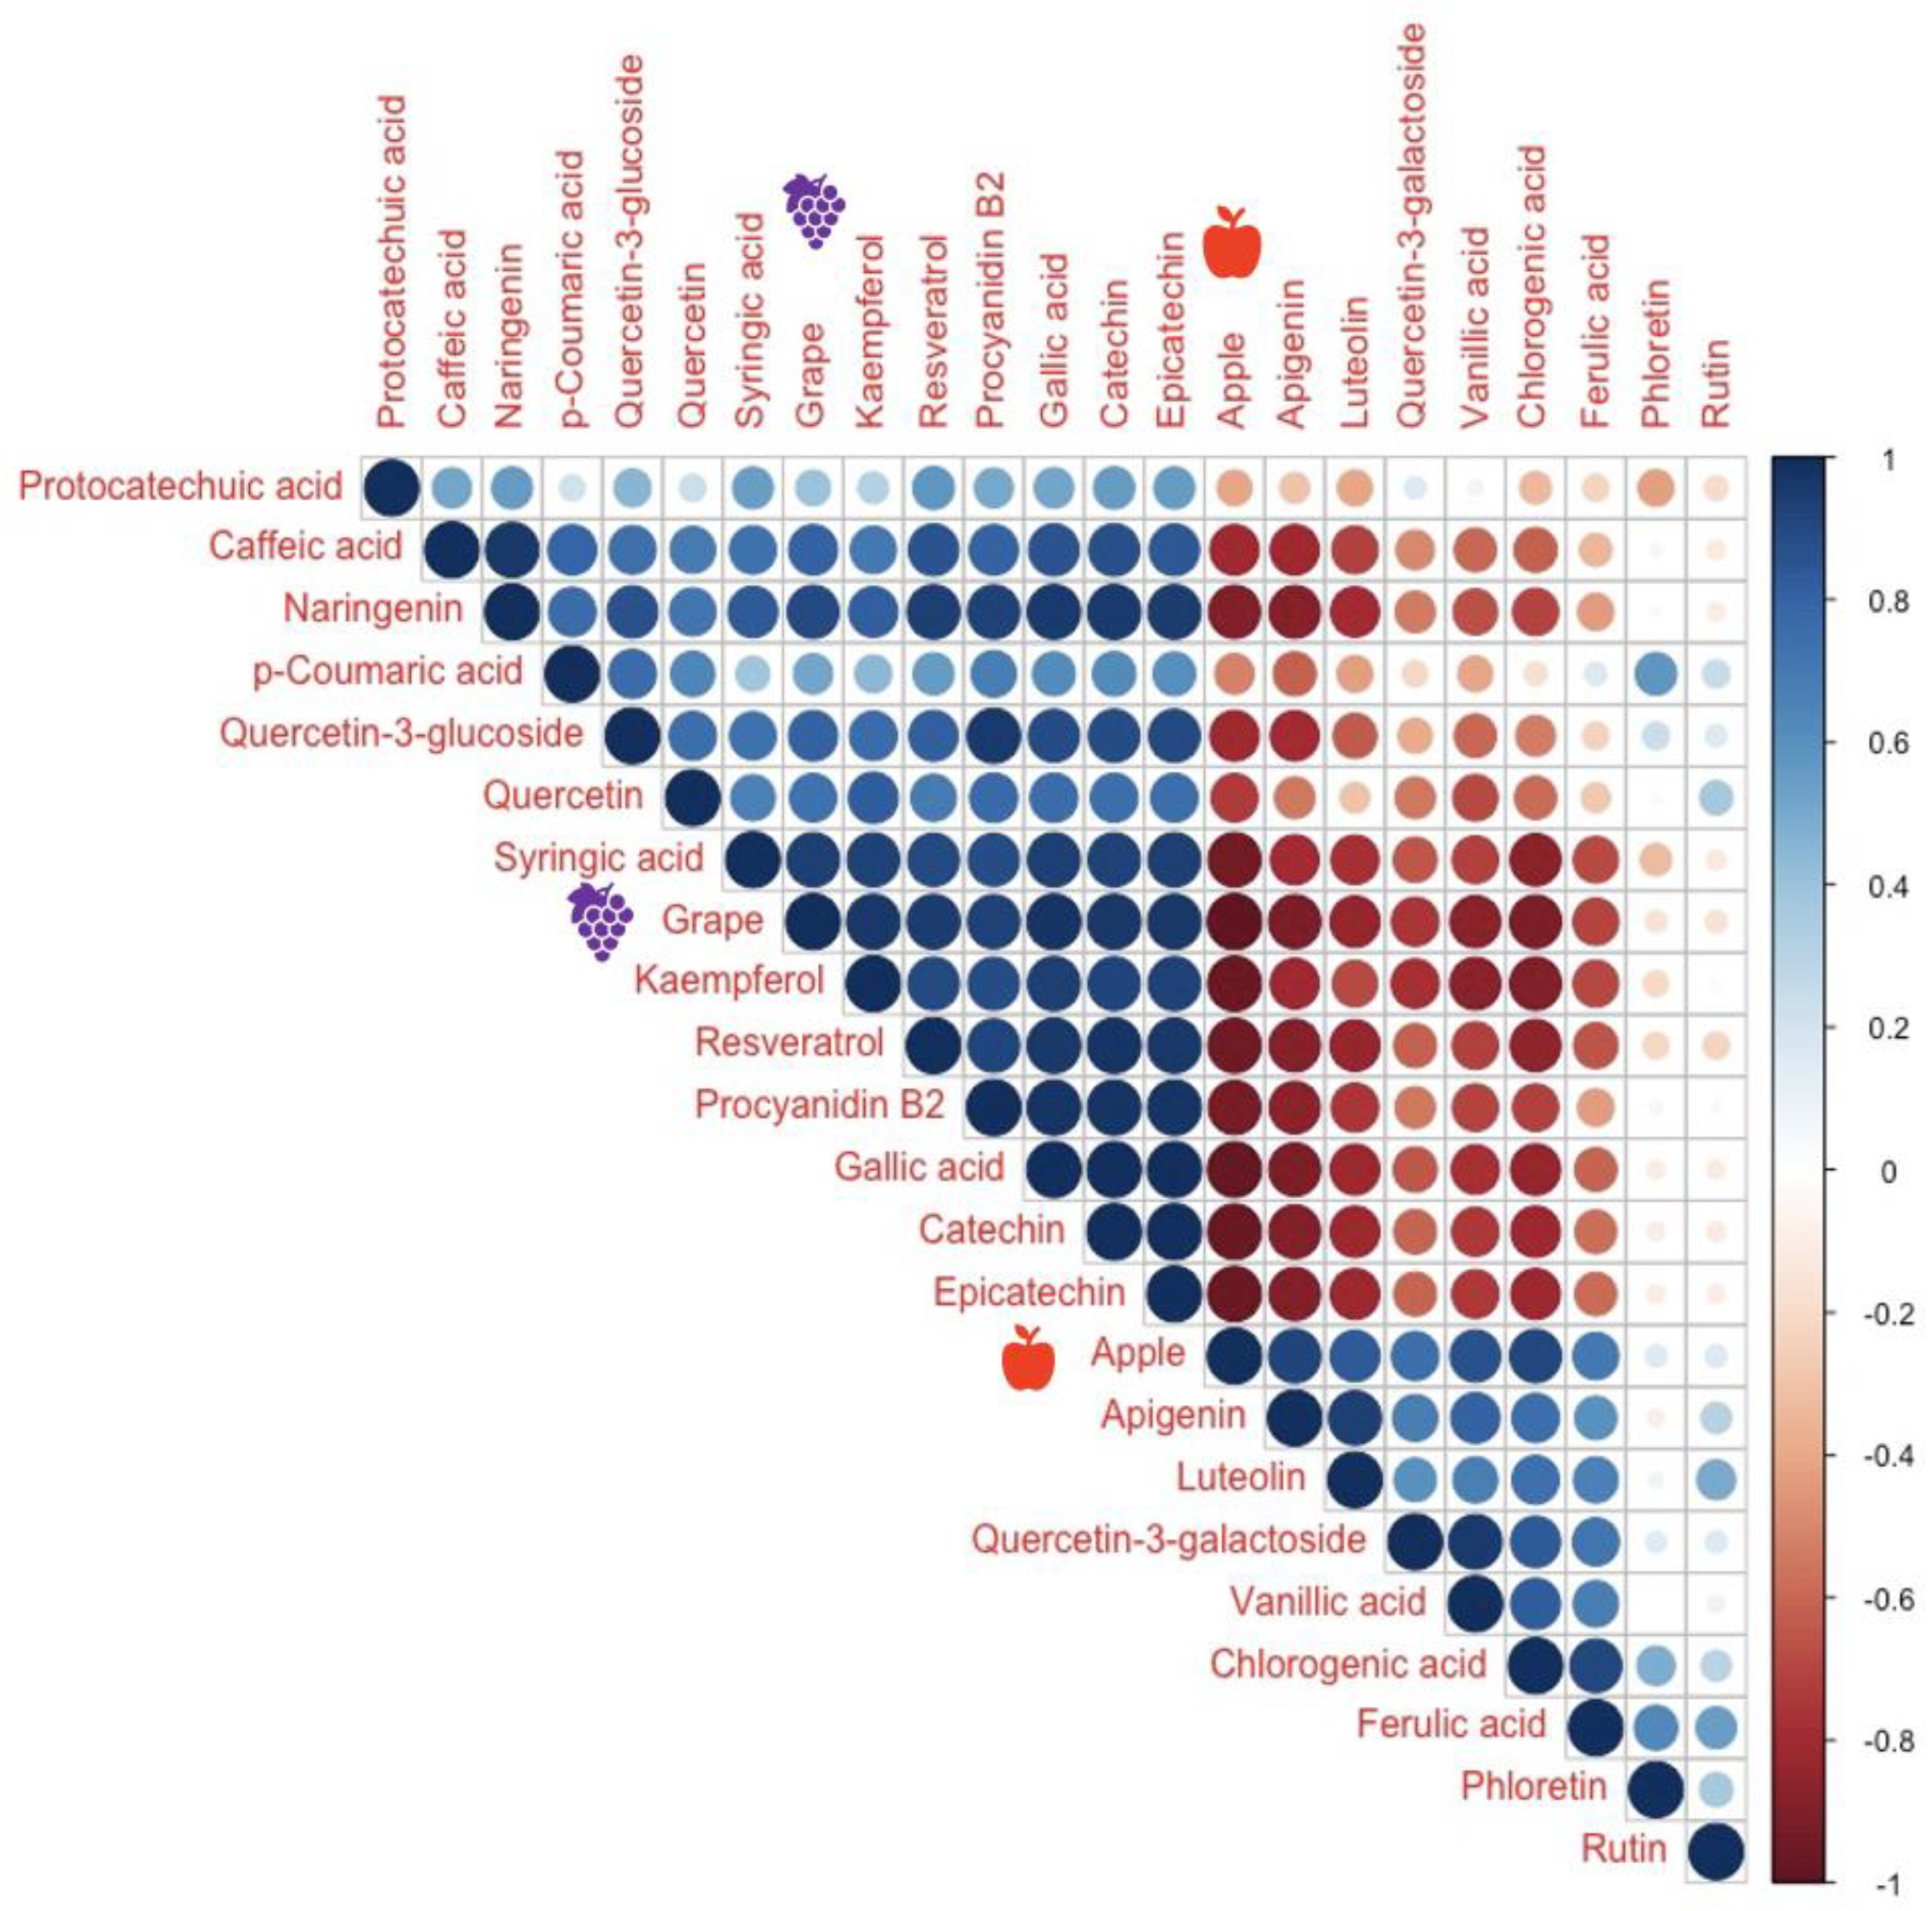
3.10. Final Wine Flavonoids and Phenolic Acids Compounds

The bioactive compounds in grape pomace are mainly phenolic compounds, such as anthocyanins, flavan-3-ols, flavonols, stilbenes, and phenolic acids [4]. Apple pomace bioactive compounds have various phenolic and terpenic compounds. Gallic acid (benzoic acids), hydroxycinnamic acids (chlorogenic acid), flavanols (catechin), flavonols (rutin), and chalcones (phloridzin) were detected in the pomaces from four different apple cultivars (Gala, Golden, Granny Smith, and Pink Lady) [67].
Total phenolic amounts (Figure 6) indicated that grape pomace provides more quantities of phenolic compounds compared to apple pomace. To further understand the effects of mixed pomaces, the detailed phenolic compounds were measured in each treatment (Table 6, Table 7 and Table 8).
The dominant phenolic compounds in the fermented products included catechin, epicatechin, gallic acid, quercetin-3-glucoside, quercetin-3-galactoside, and quercetin (Table 6). Both catechin and catechin-derived compound epicatechin were detected in large quantities in the fermented products, especially from largely grape pomace-derived treatments. Clinical studies indicated that catechin’s beneficial effects were due to their antioxidant actions, which highly correlated with cardiovascular health, positively regulating cancer and cancer-related disorders [68]. Catechin and epicatechin’s regenerative and anti-inflammatory capacity were identified to have pharmaceutical benefits [69]. Gallic acid, a secondary metabolite present in most plants, has a high correlation with grape pomace quantities in this study. Gallic acid exhibited a range of bioactivities, preventing many human diseases [70]. It also exerts anti-inflammatory effects, anticancer properties, and cardiovascular benefits [71]. The potential uses of gallic acids are in functional foods, pharmaceuticals, and nutraceuticals. Both the Quercetin-3-glucoside and Quercetin-3-galactoside quantities had fewer variations among the treatments. The grape pomace-only fermented treatment (GA1) and the apple pomace-only fermented treatment (GA2) had significant differences for content Quercetin-3-glucoside with the difference of about 30 mg/L and for Quercetin-3-galactoside quantities with differences of 7.5 mg/L. Grape pomace fermented wine had the least Quercetin-3-galactoside (about 7.76 mg/L) but had the largest amounts of Quercetin-3-glucoside (about 53.13 mg/L). Although apple pomaces contain both Quercetin-3-galactoside and Quercetin-3-glucoside, the diversity of polyphenols present indicate the importance of understanding the polyphenol profiles in pomace resources [72]. Quercetin, one of the six subclasses of flavonoid compounds, is widely present in various fruits and vegetables. As a nutritional supplement, quercetin may play an essential role in preventing various diseases [73]. In this study, quercetin was also detected in large quantities in the wines, especially in grape-derived wines, with the amount of 20.47 mg/L.
Moderate amounts of phenolic compounds detected in the final wines included caffeic acid, p-coumaric acid, ferulic acid, kaempferol, procyanidin B2, phloretin, and protocatechuic acid (Table 7). Caffeic acid was detected to the greatest extent in treatments GA1 and GA3 with a quantity of more than 7.5 mg/L. This phenolic acid has antioxidant, anti-inflammatory, and anticarcinogenic activities [74]. This study might indicate that grape pomace can be used for enhancing caffeic acid in fermented products. Similarly, procyanidin B2 was present in larger amounts (8.88 mg/L) in solely grape pomace-derived wines, corresponding to research reports indicating procyanidins were commonly found in red wines [75]. p-coumaric acid and kaempferol both function in human health and cancer prevention [76,77]. Grape pomace contributed heavily to their quantities with 1.72 (p-coumaric) and 4.97 mg/L (kaempferol) detected in fermented treatment GA1. On the other hand, protocatechuic had no significant differences among the treatments, ranging from 2.08 to 2.96 mg/L on average. As functional phenolics, this might indicate that apple/grape pomace fermented products contain great potential [77]. Resveratrol, which possesses anti-inflammatory and anticancer properties, was only detected in treatments with grape pomace (1.43 ng/mL for the GA1 treatment) and no resveratrol was detected in apple pomace-produced ferments in GA2 [78].
The final wines also contained some phenolic compounds in small quantities (Table 8), including vanillic acid, naringenin, rutin, chlorogenic acid, luteolin, and apigenin. Vanillic acid is often used as a flavoring agent, preservative, and food additives [79]. In this study, vanillic acid was more prevalent with 1074 ng/mL in the fermentation of solely apple pomace (GA2), about two times the amounts that were present in GA1 (with 457.74 ng/mL on average), the grape pomace derived product. Syringic acid is an excellent therapeutic agent in various diseases [80]. In this research, on average, syringic acid existed in both grape and apple pomace fermented products, ranging from 165 to 398 ng/mL. Naringenin, as a citrus flavonoid, existed in more significant amounts (81.67 ng/mL) for treatment GA1 than treatment GA2 (28.97 ng/mL). Rutin, also known as vitamin P or rutoside, had no significant differences among the treatments. Chlorogenic acid, an ester of caffeic acid and quinic acid, has many pharmacological effects [81]. It was mainly detected in apple pomace products, and the content (804 ng/mL) in treatment GA2 was nearly 30 times that of treatment GA1. Luteolin and apigenin were detected in the lowest concentrations of phenolic compounds in this study, with apple pomace content leading to increased apigenin and luteolin content. Overall, phenolic compound quantities in final fermented products varied with different treatments of grape and apple pomace ratios.
To understand the correlation between specific phenolic compounds and must materials better, a correlation matrix was built. The matrix (Figure 6) indicated that there were multiple phenolic compounds highly correlated with grape amounts, such as syringic acid, kaempferol, resveratrol, procyanidin B2, gallic acid, catechin acid, and epicatechin. Meanwhile, apigenin, luteolin, quercetin-3-galactoside, vanillic acid, chlorogenic acid, and ferulic acid were highly correlated with apple pomace amounts. A moderate correlation was observed between grape pomace amounts with caffeic acid, naringenin, quercetin-3-glucoside, and quercetin. Phloretin and rutin quantities had a weak correlation with most phenolic compounds. Further research with different pomace materials for fermentation should consider interactions between phenolics and the interactions with other compounds during fermentation.
Although prohibitive legislation of piquette still exists in some countries, this ancient fermentation technique using pomaces is gaining consumer acceptance and preference [82]. Commonly made low-alcohol beverages from pomaces not only could retrieve the nutrients from wastes but also be consumed by broader markets. This study provides fundamental information for applying pomace in the wine and cider industry.

4. Conclusions

This study assesses grape and apple pomace-based ciderkin, piquette, and ciderkin-piquette fermentation and fermentation products in multiple dimensions. Through the differential material combination, the must indicated that there were variations in sugar content, acids, and yeast nutrients. Apple pomace provided higher ratios of glucose to fructose, whereas the grape pomaces contributed most to the tartaric acids and L-LARGE measurement of YAN.
Color dynamic changes represent that pomace influences the colors during fermentation. ‘Frontenac gris’ grape pomace contributed to the wine’s red color. The less grape pomace used, the less a* (red-green range) value changes. The b* (blue-yellow range) values were decreasing during ciderkin fermentation, whereas they increased during grape pomace-contained must fermentation, and the grape amount influenced the b* changes differentially.
The final wine characteristics indicated that grape pomace amounts were highly correlated with ethanol, glycerol content, and antioxidant capacities in the final products. Apple pomace amounts were highly correlated to the volatile acids in the final wines. Further analysis of flavonoids and phenolic compounds in wines showed that apple and grape pomaces contained different phenolic components. Grape pomace fermented products contained more syringic acid, kaempferol, resveratrol, procyanidin B2, gallic acid, catechin acid, and epicatechin. Apple pomace amounts were highly correlated with apigenin, luteolin, quercetin-3-galactoside, vanillin acid, chlorogenic acid, and ferulic acids. The functional compounds in the fermented ciderkins, piquettes, and ciderkin-piqeuttes indicated that apple and grape pomace provided differential nutritional values, and blending these two for fermentation might enhance the functional properties in fermented products. The mixture of pomaces could be utilized to produce value-added products and food coloring in a traditional method; further work may improve understanding of their use in low and non-ethanol fermentations. Beyond fermented products, the blended pomaces could also produce extracts of bioactive compounds, which may be useful in pharmaceuticals, nutraceuticals, or functional foods.

Supplementary Materials

The following supporting information can be downloaded at: https://www.mdpi.com/article/10.3390/fermentation11030126/s1, Table S1: ESI source operation parameters.

Author Contributions

Conceptualization, Z.W.; methodology, Z.W.; investigation, Z.W. and A.S.; formal analysis, Z.W. and A.S.; resources and fruit collection, Z.W., A.S. and Z.M.; writing—original draft, Z.W.; writing—review and editing, Z.W., A.S. and Z.M.; funding acquisition, Z.W., A.S. and Z.M. All authors have read and agreed to the published version of the manuscript.

Funding

This research is funded by Montana Department of Agriculture. Grant No: AM22SCBPMT1127.

Data Availability Statement

The raw data supporting the conclusions of this article will be made available by the authors on request.

Acknowledgments

The authors would like to thank Haydon Davis and the 2023 summer crew for assistant with farm maintenance and harvesting. The authors would like to thank the Montana Berry Grower Association’s support.

Conflicts of Interest

The authors declare no conflicts of interest.

References

  1. Rakesh, B.; Mahendran, R. Upcycling of Food Waste and Food Loss—A Sustainable Approach in the Food Sector. Trends Food Sci. Technol. 2024, 143, 104274. [Google Scholar] [CrossRef]
  2. Jurgilevich, A.; Birge, T.; Kentala-Lehtonen, J.; Korhonen-Kurki, K.; Pietikäinen, J.; Saikku, L.; Schösler, H. Transition towards Circular Economy in the Food System. Sustainability 2016, 8, 69. [Google Scholar] [CrossRef]
  3. Beres, C.; Costa, G.N.S.; Cabezudo, I.; da Silva-James, N.K.; Teles, A.S.C.; Cruz, A.P.G.; Mellinger-Silva, C.; Tonon, R.V.; Cabral, L.M.C.; Freitas, S.P. Towards Integral Utilization of Grape Pomace from Winemaking Process: A Review. Waste Manag. 2017, 68, 581–594. [Google Scholar] [CrossRef]
  4. Teles, A.S.C.; Chávez, D.W.H.; Oliveira, R.A.; Bon, E.P.S.; Terzi, S.C.; Souza, E.F.; Gottschalk, L.M.F.; Tonon, R.V. Use of Grape Pomace for the Production of Hydrolytic Enzymes by Solid-State Fermentation and Recovery of Its Bioactive Compounds. Food Res. Int. 2019, 120, 441–448. [Google Scholar] [CrossRef]
  5. Shalini, R.; Gupta, D.K. Utilization of Pomace from Apple Processing Industries: A Review. J. Food Sci. Technol. 2010, 47, 365–371. [Google Scholar] [CrossRef]
  6. Skinner, R.C.; Gigliotti, J.C.; Ku, K.-M.; Tou, J.C. A Comprehensive Analysis of the Composition, Health Benefits, and Safety of Apple Pomace. Nutr. Rev. 2018, 76, 893–909. [Google Scholar] [CrossRef] [PubMed]
  7. Almanza-Oliveros, A.; Bautista-Hernández, I.; Castro-López, C.; Aguilar-Zárate, P.; Meza-Carranco, Z.; Rojas, R.; Michel, M.R.; Martínez-Ávila, G.C.G. Grape Pomace—Advances in Its Bioactivity, Health Benefits, and Food Applications. Foods 2024, 13, 580. [Google Scholar] [CrossRef] [PubMed]
  8. Harutyunyan, M.; Viana, R.; Granja-Soares, J.; Martins, M.; Ribeiro, H.; Malfeito-Ferreira, M. Adaptation of Ancient Techniques to Recreate ‘Wines’ and ‘Beverages’ Using Withered Grapes of Muscat of Alexandria. Fermentation 2022, 8, 85. [Google Scholar] [CrossRef]
  9. Campbell, C. The Botanist and the Vintner: How Wine Was Saved for the World; Algonquin Books: Chapel Hill, NC, USA, 2006; ISBN 978-1-56512-528-5. [Google Scholar]
  10. Piquette: The Perfect Summer Quencher. Available online: https://www.vinerra.com/in-depth-guides/piquette-the-perfect-summer-quencher (accessed on 10 February 2025).
  11. Shockey, C.; Shockey, K.K. The Big Book of Cidermaking: Expert Techniques for Fermenting and Flavoring Your Favorite Hard Cider; Storey Publishing: North Adams, MA, USA, 2020; ISBN 978-1-63586-113-6. [Google Scholar]
  12. Proulx, A. Making the Best Apple Cider; Storey Publishing: North Adams, MA, USA, 1980; ISBN 978-0-88266-222-0. [Google Scholar]
  13. Casassa, F.; Mawdsley, P.; Stoffel, E.; Williams, P.; Dodson, P.J.C. Fermenation: Chemical and Sensory Effects of Cofermentation and Post-Malolactic Fermentation Blending of Syrah with Rhone White Cultivars. Wine Vitic. J. 2021, 35, 22+24–28. [Google Scholar] [CrossRef]
  14. Calugar, P.C.; Coldea, T.E.; Salanță, L.C.; Pop, C.R.; Pasqualone, A.; Burja-Udrea, C.; Zhao, H.; Mudura, E. An Overview of the Factors Influencing Apple Cider Sensory and Microbial Quality from Raw Materials to Emerging Processing Technologies. Processes 2021, 9, 502. [Google Scholar] [CrossRef]
  15. Ogodo, A.C.; Ugbogu, O.C.; Ugbogu, A.E.; Ezeonu, C.S. Production of Mixed Fruit (Pawpaw, Banana and Watermelon) Wine Using Saccharomyces Cerevisiae Isolated from Palm Wine. SpringerPlus 2015, 4, 683. [Google Scholar] [CrossRef]
  16. Skorospelova, E.; Motovilov, O.; Nitsievskaya, K.; Sherbinin, V. Comparative Characteristics of Varietal and Blended Flavored Wines. IOP Conf. Ser. Earth Environ. Sci. 2019, 403, 012022. [Google Scholar] [CrossRef]
  17. Fracassetti, D.; Bottelli, P.; Corona, O.; Foschino, R.; Vigentini, I. Innovative Alcoholic Drinks Obtained by Co-Fermenting Grape Must and Fruit Juice. Metabolites 2019, 9, 86. [Google Scholar] [CrossRef]
  18. Tsegay, Z.T. Total Titratable Acidity and Organic Acids of Wines Produced from Cactus Pear (Opuntia-Ficus-Indica) Fruit and Lantana Camara (L. Camara) Fruit Blended Fermentation Process Employed Response Surface Optimization. Food Sci. Nutr. 2020, 8, 4449–4462. [Google Scholar] [CrossRef]
  19. Yang, X.; Zhao, F.; Yang, L.; Li, J.; Zhu, X. Enhancement of the Aroma in Low-Alcohol Apple-Blended Pear Wine Mixed Fermented with Saccharomyces Cerevisiae and Non-Saccharomyces Yeasts. LWT 2022, 155, 112994. [Google Scholar] [CrossRef]
  20. Kovach, E. What Is Cider Piquette?|Ciderkin and Cider Piquette 101. Cider Cult. 2022. Available online: https://www.ciderculture.com/what-is-cider-piquette/ (accessed on 27 February 2024).
  21. Aipperspach, A.; Hammond, J.; Hatterman-Valenti, H. Utilizing Pruning and Leaf Removal to Optimize Ripening of Vitis Riparia-Based ‘Frontenac Gris’ and ‘Marquette’ Wine Grapes in the Northern Great Plains. Horticulturae 2020, 6, 18. [Google Scholar] [CrossRef]
  22. McIntosh Apple. Available online: https://www.thecanadianencyclopedia.ca/en/article/mcintosh-apple (accessed on 27 February 2024).
  23. Jones, D.S.; McManus, P.S. Distinctive Symptoms and Signs of Downy Mildew on Cold-Climate Wine Grape Cultivars. Plant Health Prog. 2017, 18, 192–195. [Google Scholar] [CrossRef]
  24. Wang, Z.; Svyantek, A.; Miller, Z.; Watrelot, A.A. Fermentation Process Effects on Fermented McIntosh Apple Ciders. Fermentation 2024, 10, 115. [Google Scholar] [CrossRef]
  25. He, Y.; Wang, X.; Li, P.; Lv, Y.; Nan, H.; Wen, L.; Wang, Z. Research Progress of Wine Aroma Components: A Critical Review. Food Chem. 2023, 402, 134491. [Google Scholar] [CrossRef]
  26. ENGİN, S.; MERT, C. The Effects of Harvesting Time on the Physicochemical Components of Aronia Berry. Turk. J. Agric. For. 2020, 44, 361–370. [Google Scholar] [CrossRef]
  27. Panasiuk, O.; Talley, F.B.; Sapers, G.M. Correlation Between Aroma and Volatile Composition of Mcintosh Apples. J. Food Sci. 1980, 45, 989–991. [Google Scholar] [CrossRef]
  28. 2023 USDA Plant Hardiness Zone Map|USDA Plant Hardiness Zone Map. Available online: https://planthardiness.ars.usda.gov/ (accessed on 31 January 2025).
  29. Web Soil Survey|Natural Resources Conservation Service. Available online: https://www.nrcs.usda.gov/resources/data-and-reports/web-soil-survey (accessed on 31 January 2025).
  30. Murray, M. Intermountain Commercial Tree Fruit Production Guide 2024-25; Colorado, United States. Available online: https://intermountainfruit.org/files/IntermountainTFG-2024.pdf (accessed on 31 January 2025).
  31. Farr, J.E.; Sigurdson, G.T.; Giusti, M.M. Influence of Cyanidin Glycosylation Patterns on Carboxypyranoanthocyanin Formation. Food Chem. 2018, 259, 261–269. [Google Scholar] [CrossRef]
  32. R: A Language and Environment for Statistical Computing|BibSonomy. Available online: https://www.bibsonomy.org/bibtex/7469ffee3b07f9167cf47e7555041ee7 (accessed on 20 March 2024).
  33. Horwitz, W.; Latimer, G.W. Official Methods of Analysis of AOAC International, 18th ed.; AOAC International: Gaithersburg, MD, USA, 2005; ISBN 978-0-935584-75-2. [Google Scholar]
  34. Lamuela-Raventós, R.M. Folin–Ciocalteu Method for the Measurement of Total Phenolic Content and Antioxidant Capacity. In Measurement of Antioxidant Activity & Capacity; John Wiley & Sons, Ltd.: Hoboken, NJ, USA, 2018; pp. 107–115. ISBN 978-1-119-13538-8. [Google Scholar]
  35. Gulcin, İ.; Alwasel, S.H. DPPH Radical Scavenging Assay. Processes 2023, 11, 2248. [Google Scholar] [CrossRef]
  36. Benzie, I.F.F.; Devaki, M. The Ferric Reducing/Antioxidant Power (FRAP) Assay for Non-Enzymatic Antioxidant Capacity: Concepts, Procedures, Limitations and Applications. In Measurement of Antioxidant Activity & Capacity; John Wiley & Sons, Ltd.: Hoboken, NJ, USA, 2018; pp. 77–106. ISBN 978-1-119-13538-8. [Google Scholar]
  37. R: The R Project for Statistical Computing. Available online: https://www.r-project.org/ (accessed on 16 November 2023).
  38. Wickham, H. Programming with Ggplot2. In ggplot2: Elegant Graphics for Data Analysis; Wickham, H., Ed.; Use R! Springer International Publishing: Cham, Switzerland, 2016; pp. 241–253. ISBN 978-3-319-24277-4. [Google Scholar]
  39. Berthels, N.J.; Cordero Otero, R.R.; Bauer, F.F.; Thevelein, J.M.; Pretorius, I.S. Discrepancy in Glucose and Fructose Utilisation during Fermentation by Saccharomyces Cerevisiae Wine Yeast Strains. FEMS Yeast Res. 2004, 4, 683–689. [Google Scholar] [CrossRef]
  40. Su, Y.; Heras, J.M.; Gamero, A.; Querol, A.; Guillamón, J.M. Impact of Nitrogen Addition on Wine Fermentation by S. Cerevisiae Strains with Different Nitrogen Requirements. J. Agric. Food Chem. 2021, 69, 6022–6031. [Google Scholar] [CrossRef]
  41. The Australian Wine Research Institute. Yeast Assimilable Nitrogen (YAN); The Australian Wine Research Institute: Urrbrae, Australia, 2025. [Google Scholar]
  42. Boudreau, T.F.; Peck, G.M.; O’Keefe, S.F.; Stewart, A.C. Free Amino Nitrogen Concentration Correlates to Total Yeast Assimilable Nitrogen Concentration in Apple Juice. Food Sci. Nutr. 2017, 6, 119–123. [Google Scholar] [CrossRef] [PubMed]
  43. Song, Y.; Gibney, P.; Cheng, L.; Liu, S.; Peck, G. Yeast Assimilable Nitrogen Concentrations Influence Yeast Gene Expression and Hydrogen Sulfide Production During Cider Fermentation. Front. Microbiol. 2020, 11, 1264. [Google Scholar] [CrossRef] [PubMed]
  44. Li, M.; Su, J.; Yang, H.; Feng, L.; Wang, M.; Xu, G.; Shao, J.; Ma, C. Grape Tartaric Acid: Chemistry, Function, Metabolism, and Regulation. Horticulturae 2023, 9, 1173. [Google Scholar] [CrossRef]
  45. Lima, M.M.M.; Choy, Y.Y.; Tran, J.; Lydon, M.; Runnebaum, R.C. Organic Acids Characterization: Wines of Pinot Noir and Juices of ‘Bordeaux Grape Varieties’. J. Food Compos. Anal. 2022, 114, 104745. [Google Scholar] [CrossRef]
  46. Li, Y.; Sun, H.; Li, J.; Qin, S.; Yang, W.; Ma, X.; Qiao, X.; Yang, B. Effects of Genetic Background and Altitude on Sugars, Malic Acid and Ascorbic Acid in Fruits of Wild and Cultivated Apples (Malus Sp.). Foods 2021, 10, 2950. [Google Scholar] [CrossRef]
  47. Mocke, L. Kinetic Modelling of Wine Fermentations: Why Does Yeast Prefer Glucose to Fructose; Stellenbosch University: Stellenbosch, South Africa, 2013. [Google Scholar]
  48. Wang, D.; Xu, Y.; Hu, J.; Zhao, G. Fermentation Kinetics of Different Sugars by Apple Wine Yeast Saccharomyces Cerevisiae. J. Inst. Brew. 2004, 110, 340–346. [Google Scholar] [CrossRef]
  49. Santos-Buelga, C.; de Freitas, V. Influence of Phenolics on Wine Organoleptic Properties. In Wine Chemistry and Biochemistry; Moreno-Arribas, M.V., Polo, M.C., Eds.; Springer: New York, NY, USA, 2009; pp. 529–570. ISBN 978-0-387-74118-5. [Google Scholar]
  50. Brady, J. Descriptive Analysis of Frontenac Gris and Brianna Wine Grape and Wine Varieties; University of Minnesota: Minneapolis, MN, USA, 2017. [Google Scholar]
  51. Techakanon, C.; Sirimuangmoon, C. The Effect of Pasteurization and Shelf Life on the Physicochemical, Microbiological, Antioxidant, and Sensory Properties of Rose Apple Cider during Cold Storage. Beverages 2020, 6, 43. [Google Scholar] [CrossRef]
  52. Hensel, M.; Scheiermann, M.; Fahrer, J.; Durner, D. New Insights into Wine Color Analysis: A Comparison of Analytical Methods to Sensory Perception for Red and White Varietal Wines. J. Agric. Food Chem. 2024, 72, 2008–2017. [Google Scholar] [CrossRef]
  53. The Elemental Profile of Ciders Made from Different Varieties of Apples. Available online: https://colab.ws/articles/10.21603%2F2308-4057-2024-2-604 (accessed on 6 March 2024).
  54. Frontenac Gris Grape Cultivar|Minnesota Hardy. Available online: https://mnhardy.umn.edu/frontenac-gris (accessed on 6 March 2024).
  55. Sparrow, A.M.; Dambergs, R.G.; Close, D.C. Grape Skins as Supplements for Color Development in Pinot Noir Wine. Food Res. Int. 2020, 133, 108707. [Google Scholar] [CrossRef]
  56. Possner, E.; Kliewer, W.M. The Localisation of Acids, Sugars, Potassium and Calcium in Developing Grape Berries. Available online: https://ojs.openagrar.de/index.php/VITIS/article/view/5976 (accessed on 6 March 2024).
  57. Ginni, G.; Adish Kumar, S.; Mohamed Usman, T.M.; Pakonyi, P.; Rajesh Banu, J. Chapter 13—Integrated Biorefineries of Food Waste. In Food Waste to Valuable Resources; Banu, J.R., Kumar, G., Gunasekaran, M., Kavitha, S., Eds.; Academic Press: Cambridge, MA, USA, 2020; pp. 275–298. ISBN 978-0-12-818353-3. [Google Scholar]
  58. Remize, F.; Roustan, J.L.; Sablayrolles, J.M.; Barre, P.; Dequin, S. Glycerol Overproduction by Engineered Saccharomyces Cerevisiae Wine Yeast Strains Leads to Substantial Changes in By-Product Formation and to a Stimulation of Fermentation Rate in Stationary Phase. Appl. Environ. Microbiol. 1999, 65, 143–149. [Google Scholar] [CrossRef]
  59. Mutton, M.J.R.; Ferrari, F.C.S.; de Freita, L.A.; de Freita, C.M.; Andrietta, M.d.G.S.; Andrietta, S.R. Interaction between the Production of Ethanol and Glycerol in Fed-Batch Bioreactors. Braz. J. Microbiol. 2019, 50, 389. [Google Scholar] [CrossRef] [PubMed]
  60. The Australian Wine Research Institute. Acidity and pH; The Australian Wine Research Institute: Urrbrae, Australia, 2025. [Google Scholar]
  61. Waterhouse, A.L. Wine Phenolics. Ann. N. Y. Acad. Sci. 2002, 957, 21–36. [Google Scholar] [CrossRef]
  62. Rocchetti, G.; Gregorio, R.P.; Lorenzo, J.M.; Barba, F.J.; Oliveira, P.G.; Prieto, M.A.; Simal-Gandara, J.; Mosele, J.I.; Motilva, M.-J.; Tomas, M.; et al. Functional Implications of Bound Phenolic Compounds and Phenolics–Food Interaction: A Review. Compr. Rev. Food Sci. Food Saf. 2022, 21, 811–842. [Google Scholar] [CrossRef] [PubMed]
  63. Mishra, K.; Ojha, H.; Chaudhury, N.K. Estimation of Antiradical Properties of Antioxidants Using DPPH Assay: A Critical Review and Results. Food Chem. 2012, 130, 1036–1043. [Google Scholar] [CrossRef]
  64. Reis, S.F.; Rai, D.K.; Abu-Ghannam, N. Apple Pomace as a Potential Ingredient for the Development of New Functional Foods. Int. J. Food Sci. Technol. 2014, 49, 1743–1750. [Google Scholar] [CrossRef]
  65. Ky, I.; Lorrain, B.; Kolbas, N.; Crozier, A.; Teissedre, P.-L. Wine By-Products: Phenolic Characterization and Antioxidant Activity Evaluation of Grapes and Grape Pomaces from Six Different French Grape Varieties. Molecules 2014, 19, 482–506. [Google Scholar] [CrossRef] [PubMed]
  66. Živković, N.M.; Čakar, U.D.; Petrović, A.V. Effects of Spontaneous and Inoculated Fermentation on the Total Phenolic Content and Antioxidant Activity of Cabernet Sauvignon Wines and Fermented Pomace. Food Feed Res. 2024, 51, 119–129. [Google Scholar] [CrossRef]
  67. Grigoras, C.G.; Destandau, E.; Fougère, L.; Elfakir, C. Evaluation of Apple Pomace Extracts as a Source of Bioactive Compounds. Ind. Crops Prod. 2013, 49, 794–804. [Google Scholar] [CrossRef]
  68. Zanwar, A.A.; Badole, S.L.; Shende, P.S.; Hegde, M.V.; Bodhankar, S.L. Chapter 21—Antioxidant Role of Catechin in Health and Disease. In Polyphenols in Human Health and Disease; Watson, R.R., Preedy, V.R., Zibadi, S., Eds.; Academic Press: San Diego, CA, USA, 2014; pp. 267–271. ISBN 978-0-12-398456-2. [Google Scholar]
  69. German, I.J.S.; Pomini, K.T.; Andreo, J.C.; Shindo, J.V.T.C.; Castro, M.V.M.d.; Detregiachi, C.R.P.; Araújo, A.C.; Guiguer, E.L.; Fornari Laurindo, L.; Bueno, P.C.d.S.; et al. New Trends to Treat Muscular Atrophy: A Systematic Review of Epicatechin. Nutrients 2024, 16, 326. [Google Scholar] [CrossRef] [PubMed]
  70. Fernandes, F.H.A.; Salgado, H.R.N. Gallic Acid: Review of the Methods of Determination and Quantification. Crit. Rev. Anal. Chem. 2016, 46, 257–265. [Google Scholar] [CrossRef]
  71. Hadidi, M.; Liñán-Atero, R.; Tarahi, M.; Christodoulou, M.C.; Aghababaei, F. The Potential Health Benefits of Gallic Acid: Therapeutic and Food Applications. Antioxidants 2024, 13, 1001. [Google Scholar] [CrossRef]
  72. Guo, S.; Guan, L.; Cao, Y.; Li, C.; Chen, J.; Li, J.; Liu, G.; Li, S.; Wu, B. Diversity of Polyphenols in the Peel of Apple (Malus Sp.) Germplasm from Different Countries of Origin. Int. J. Food Sci. Technol. 2016, 51, 222–230. [Google Scholar] [CrossRef]
  73. Zhang, M.; Swarts, S.G.; Yin, L.; Liu, C.; Tian, Y.; Cao, Y.; Swarts, M.; Yang, S.; Zhang, S.B.; Zhang, K.; et al. Antioxidant Properties of Quercetin. In Proceedings of the Oxygen Transport to Tissue XXXII; LaManna, J.C., Puchowicz, M.A., Xu, K., Harrison, D.K., Bruley, D.F., Eds.; Springer US: Boston, MA, USA, 2011; pp. 283–289. [Google Scholar]
  74. Espíndola, K.M.M.; Ferreira, R.G.; Narvaez, L.E.M.; Silva Rosario, A.C.R.; da Silva, A.H.M.; Silva, A.G.B.; Vieira, A.P.O.; Monteiro, M.C. Chemical and Pharmacological Aspects of Caffeic Acid and Its Activity in Hepatocarcinoma. Front. Oncol. 2019, 9, 541. [Google Scholar] [CrossRef]
  75. Chen, J.; Zhong, K.; Jing, Y.; Liu, S.; Qin, S.; Peng, F.; Li, D.; Peng, C. Procyanidin B2: A Promising Multi-Functional Food-Derived Pigment for Human Diseases. Food Chem. 2023, 420, 136101. [Google Scholar] [CrossRef]
  76. Kiliç, I.; Yeşiloğlu, Y. Spectroscopic Studies on the Antioxidant Activity of p-Coumaric Acid. Spectrochim. Acta Part A Mol. Biomol. Spectrosc. 2013, 115, 719–724. [Google Scholar] [CrossRef]
  77. Imran, M.; Salehi, B.; Sharifi-Rad, J.; Aslam Gondal, T.; Saeed, F.; Imran, A.; Shahbaz, M.; Tsouh Fokou, P.V.; Umair Arshad, M.; Khan, H.; et al. Kaempferol: A Key Emphasis to Its Anticancer Potential. Molecules 2019, 24, 2277. [Google Scholar] [CrossRef] [PubMed]
  78. Frémont, L. Biological Effects of Resveratrol. Life Sci. 2000, 66, 663–673. [Google Scholar] [CrossRef] [PubMed]
  79. Kim, S.-J.; Kim, M.-C.; Um, J.-Y.; Hong, S.-H. The Beneficial Effect of Vanillic Acid on Ulcerative Colitis. Molecules 2010, 15, 7208–7217. [Google Scholar] [CrossRef] [PubMed]
  80. Srinivasulu, C.; Ramgopal, M.; Ramanjaneyulu, G.; Anuradha, C.M.; Suresh Kumar, C. Syringic Acid (SA)—A Review of Its Occurrence, Biosynthesis, Pharmacological and Industrial Importance. Biomed. Pharmacother. 2018, 108, 547–557. [Google Scholar] [CrossRef]
  81. Tajik, N.; Tajik, M.; Mack, I.; Enck, P. The Potential Effects of Chlorogenic Acid, the Main Phenolic Components in Coffee, on Health: A Comprehensive Review of the Literature. Eur. J. Nutr. 2017, 56, 2215–2244. [Google Scholar] [CrossRef]
  82. Harutyunyan, M.; Viana, R.; Granja-Soares, J.; Asryan, A.; Marques, J.C.; Malfeito-Ferreira, M. Consumer Acceptance of Sweet Wines and Piquettes Obtained by the Adaptation of Ancient Wine-Making Techniques. J. Sens. Stud. 2023, 38, e12823. [Google Scholar] [CrossRef]
Figure 1. SSC changes during fermentation of five apple and grape pomace-based fermentations: a purely grape pomace-based treatment [GA1 (1:0)], a purely apple pomace-based treatment [GA2 (0:1)], a predominantly grape pomace-based treatment [GA3 (3:1)], a predominantly apple-based pomace treatment [GA4 (1:3)], and an evenly weighted apple and grape pomace-based treatment [GA5 (1:1)]. The yellow circle indicates the yeast and nutrient reinoculation time for GA2. SSC represents soluble solid content. The bars indicate the standard deviation of means (n = 3).
Fermentation 11 00126 g001
Figure 2. pH changes during fermentation of five apple and grape pomace-based fermentations: a purely grape pomace-based treatment [GA1 (1:0)], a purely apple pomace-based treatment [GA2 (0:1)], a predominantly grape pomace-based treatment [GA3 (3:1)], a predominantly apple-based pomace treatment [GA4 (1:3)], and an evenly weighted apple and grape pomace-based treatment [GA5 (1:1)]. The bars indicate the standard deviation of means (n = 3). The bars indicate the standard deviation of means (n = 3).
Fermentation 11 00126 g002
Figure 3. Line chart (A) and plot depicting daily sample color (B) for fermenting must lightness (L*) values, line chart (C) and plot depicting daily sample color (D) for fermenting must red/green values (a*), line chart (E) and plot depicting daily sample color (F) for fermenting must blue/yellow (b*) value changes during fermentation, bottled fermented products in 1.5 L vessels (G) for five apple and grape pomace-based fermentations: a purely grape pomace-based treatment [GA1 (1:0)], a purely apple pomace-based treatment [GA2 (0:1)], a predominantly grape pomace-based treatment [GA3 (3:1)], a predominantly apple-based pomace treatment [GA4 (1:3)], and an evenly weighted apple and grape pomace-based treatment [GA5 (1:1)].
Fermentation 11 00126 g003
Figure 4. Correlation matrix of final fermented product characteristics for five apple and grape pomace-based fermentations: a purely grape pomace-based treatment [GA1 (1:0)], a purely apple pomace-based treatment [GA2 (0:1)], a predominantly grape pomace-based treatment [GA3 (3:1)], a predominantly apple-based pomace treatment [GA4 (1:3)], and an evenly weighted apple and grape pomace-based treatment [GA5 (1:1)]. Positive correlations are displayed in blue and negative correlations in red color. Color intensity and the size of the circle are proportional to the correlation coefficients. The right legend bar color shows the correlation coefficients and the corresponding colors.
Fermentation 11 00126 g004
Figure 5. Total polyphenolics in the final fermented product characteristics for five apple and grape pomace-based fermentations: a purely grape pomace-based treatment [GA1 (1:0)], a purely apple pomace-based treatment [GA2 (0:1)], a predominantly grape pomace-based treatment [GA3 (3:1)], a predominantly apple-based pomace treatment [GA4 (1:3)], and an evenly weighted apple and grape pomace-based treatment [GA5 (1:1)]. The bar indicates the standard deviation of the mean for individual treatments (n = 3). The different letters above the bars and the color depth of the bars indicate significant differences (p < 0.05).
Fermentation 11 00126 g005
Figure 6. Phenolic compound correlation in final products of five apple and grape pomace-based fermentations: a purely grape pomace-based treatment [GA1 (1:0)], a purely apple pomace-based treatment [GA2 (0:1)], a predominantly grape pomace-based treatment [GA3 (3:1)], a predominantly apple-based pomace treatment [GA4 (1:3)], and an evenly weighted apple and grape pomace-based treatment [GA5 (1:1)]. Positive correlations are displayed in blue and negative correlations in red color. Color intensity and the size of the circle are proportional to the correlation coefficients. The right legend bar color shows the correlation coefficients and the corresponding colors. Grape and apple signs highlight the materials in matrix correlations.
Fermentation 11 00126 g006
Table 1. Soluble solid content (SSC in °Brix) in the must of five apple and grape pomace-based treatments before and after SSC adjustment.
TreatmentGrape Pomace:Apple Pomace Ratios (w/w)Must Total Volume (L)SSC °Brix Before AdjustmentSSC °Brix After Adjustment
GA11:038.40 ± 0.1015.00 ± 0.01
GA20:134.37 ± 0.0515.00 ± 0.01
GA33:137.33 ± 0.1515.00 ± 0.11
GA41:335.40 ± 0.1015.00 ± 0.01
GA51:136.43 ± 0.1115.00 ± 0.01
GA indicates grape and apple combined materials for fermentation. Five treatments (GA1–GA5) are included in this study: a purely grape pomace-based treatment [GA1 (1:0)], a purely apple pomace-based treatment [GA2 (0:1)], a predominantly grape pomace-based treatment [GA3 (3:1)], a predominantly apple-based pomace treatment [GA4 (1:3)], and an evenly weighted apple and grape pomace-based treatment [GA5 (1:1)]. Each treatment contains three replicates (fermenters). The sign indicated the pomace ratios in each treatment: pink indicated the grape pomace; orange indicated the apple pomace. Initial SSCs before and after corn sugar adjustment are shown in this table. The data are shown as the mean ± standard deviation (n = 3).
Table 2. Sugar contents and ratios in the must of five apple and grape pomace-based treatments after sugar adjustment.
Sugar Contents and Ratios in Treatments
Treatment Glucose (g/L)Fructose (g/L)G:F ratio
GA1119.24 ± 0.31 a41.35 ± 1.97 a2.89 ± 0.13 b
GA2113.89 ± 0.80 ab25.54 ± 2.67 b4.49 ± 0.45 a
GA3108.52 ± 6.44 b31.31 ± 5.71 ab3.52 ± 0.43 ab
GA4107.71 ± 6.44 b28.05 ± 2.45 b3.86 ± 0.31 a
GA5116.49 ± 2.18 ab36.81 ± 1.31 a3.17 ± 0.07 b
GA indicates grape and apple combined materials for fermentation. Five treatments (GA1–GA5) are included in this study: a purely grape pomace-based treatment [GA1 (1:0)], a purely apple pomace-based treatment [GA2 (0:1)], a predominantly grape pomace-based treatment [GA3 (3:1)], a predominantly apple-based pomace treatment [GA4 (1:3)], and an evenly weighted apple and grape pomace-based treatment [GA5 (1:1)]. Each treatment contains three replicates (fermenters). The sign indicated the pomace ratios in each treatment: pink indicated the grape pomace; orange indicated the apple pomace. G:F represents glucose–fructose ratios. The data are shown as the mean ± standard deviations (n = 3). The different superscript letters signify a statistically significant difference.
Table 3. Acids in pre-fermented must of five apple and grape pomace-based treatments after sugar adjustment.
TreatmentTartaric Acid (g/L) Malic Acid (g/L) Citric Acid (g/L)
GA11.59 ± 0.18 a0.99 ± 0.06 a0.04 ± 0.02 a
GA20.00 ± 0.00 c1.14 ± 0.13 a0.00 ± 0.05 a
GA31.43 ± 0.20 a1.17 ± 0.13 a0.09 ± 0.06 a
GA40.78 ± 0.33 b1.19 ± 0.12 a0.01 ± 0.05 a
GA50.89 ± 0.30 b1.01 ± 0.06 a0.04 ± 0.02 a
Tartaric acid, malic acid, and citric acids are included in the acid tests. Values within a column (lowercase) are significantly different (p ≥ 0.05). The values are expressed as mean ± standard deviation (n = 3). Treatments are as follows: a purely grape pomace-based treatment [GA1 (1:0)], a purely apple pomace-based treatment [GA2 (0:1)], a predominantly grape pomace-based treatment [GA3 (3:1)], a predominantly apple-based pomace treatment [GA4 (1:3)], and an evenly weighted apple and grape pomace-based treatment [GA5 (1:1)]. The different superscript letters signify a statistically significant difference.
Table 4. Final characteristics of five apple and grape pomace-based fermentations: a purely grape pomace-based treatment [GA1 (1:0)], a purely apple pomace-based treatment [GA2 (0:1)], a predominantly grape pomace-based treatment [GA3 (3:1)], a predominantly apple-based pomace treatment [GA4 (1:3)], and an evenly weighted apple and grape pomace-based treatment [GA5 (1:1)].
Treatment pH Ethanol (%vol)Titratable Acidity
(pH = 8.2) (g/L)
Volatile Acids
(g/L)
Glycerol (g/L)Glucose (g/L)Fructose (g/L)
GA13.26 ± 0.17 a8.13 ± 0.06 a5.45 ± 0.12 b0.05 ± 0.01 b6.00 ± 0.00 a1.06 ± 0.12 c0.40 ± 0.10 a
GA23.21 ± 0.0 b7.87 ± 0.05 b4.79 ± 0.08 c0.15 ± 0.02 a5.43 ± 0.15 b2.47 ± 0.06 a0.17 ± 0.06 a
GA33.24 ± 0.01 ab8.16 ± 0.07 a5.56 ± 0.05 b0.08 ± 0.03 b5.83 ± 0.23 ab1.43 ± 0.15 bc0.30 ± 0.00 a
GA43.24 ± 0.03 ab7.88 ± 0.09 b5.51 ± 0.04 b0.21 ± 0.06 a5.53 ± 0.25 ab2.20 ± 0.15 a0.53 ± 0.61 a
GA53.26 ± 0.01 a7.99 ± 0.06 b5.73 ± 0.05 a0.13 ± 0.02 ab5.53 ± 0.12 ab1.70 ± 0.10 b0.03 ± 0.06 a
pH, ethanol, titratable acidity, volatile acids, glycerol contents, glucose, and fructose quantity are from the FTIR wine analyzer. Values are listed as means ± standard deviation of three replicates. Means followed by the same letter within columns are not significantly different (p < 0.05). Glucose and fructose are the residual sugar remains after fermentation.
Table 5. Antioxidant capacities in final products of five apple and grape pomace-based fermentations: a purely grape pomace-based treatment [GA1 (1:0)], a purely apple pomace-based treatment [GA2 (0:1)], a predominantly grape pomace-based treatment [GA3 (3:1)], a predominantly apple-based pomace treatment [GA4 (1:3)], and an evenly weighted apple and grape pomace-based treatment [GA5 (1:1)].
Treatment FRAP AssayDPPH Assay
(mM Ferrous Equivalent/µL)TEAC (µm/µL)
GA125.97 ± 0.11 a705.79 ± 49.82 a
GA21.02 ± 0.02 e530.84 ± 2.17 b
GA36.19 ± 0.25 b668.69 ± 9.21 a
GA42.57 ± 0.12 d595.38 ± 52.31 b
GA54.21 ± 0.22 c601.91 ± 7.99 b
Two assays were used in assessing the antioxidant capacities of final fermented products. FRAP stands for ferric ion-reducing antioxidant potential. The results of FRAP are represented in mM ferrous equivalent/µL. DPPH stands for 2-diphenyl-1-picrylhydrazyl radical scavenging assay. The results are expressed as trolox equivalent antioxidant capacity (TEAC µm/µL). The different superscript letters signify a statistically significant difference.
Table 6. Dominant phenolics compounds (>10 mg/L) in final products of five apple and grape pomace-based fermentations: a purely grape pomace-based treatment [GA1 (1:0)], a purely apple pomace-based treatment [GA2 (0:1)], a predominantly grape pomace-based treatment [GA3 (3:1)], a predominantly apple-based pomace treatment [GA4 (1:3)], and an evenly weighted apple and grape pomace-based treatment [GA5 (1:1)].
Treatment Dominant Phenolic Compounds (mg/L)
Catechin EpicatechinGallic AcidQuercetin-3-GlucosideQuercetin-3-Galactoside Quercetin
GA164.77 ± 4.25 a48.54 ± 2.12 a29.90 ± 0.98 a53.13 ± 11.77 a7.76 ± 1.30 b20.47 ± 1.50 a
GA20.22 ± 0.02 c0.79 ± 0.06 c0.05 ± 0.00 c14.54 ± 3.14 b15.15 ± 2.27 a9.27 ± 0.75 c
GA351.11 ± 11.38 a37.61 ± 7.87 a23.96 ± 3.50 ab52.66 ± 9.93 a9.88 ± 2.07 a18.97 ± 3.25 a
GA415.23 ± 2.46 bc11.97 ± 1.73 bc7.74 ± 1.03 b34.88 ± 6.18 a11.85 ± 2.89 a18.78 ± 1.81 a
GA530.94 ± 11.33 b23.33 ± 8.65 ab14.57 ± 4.41 b44.12 ± 15.91 a10.72 ± 3.16 a14.89 ± 0.80 b
p-Value <0.001<0.001<0.001<0.01<0.05<0.001
Values are listed as means ± standard deviation of three replicates. Means followed by the same letter within columns are not significantly different (p < 0.05).
Table 7. Moderate content (approximately 1 mg/L to 10 mg/L) phenolic compounds in final products of five apple and grape pomace-based fermentations: a purely grape pomace-based treatment [GA1 (1:0)], a purely apple pomace-based treatment [GA2 (0:1)], a predominantly grape pomace-based treatment [GA3 (3:1)], a predominantly apple-based pomace treatment [GA4 (1:3)], and an evenly weighted apple and grape pomace-based treatment [GA5 (1:1)].
TreatmentModerate Quantity Phenolic Compounds
Caffeic Acid (mg/L)p-Coumaric Acid (mg/L)Ferulic Acid (mg/L)Kaempferol (mg/L)Procyanidin B2 (mg/L)Phloretin (mg/L)Resveratrol (mg/mL)
GA17.68 ± 3.14 b1.72 ± 0.46 bc0.91 ± 0.11 b4.97 ± 0.49 a8.88 ± 0.83 a0.12 ± 0.04 c1.43 ± 0.21 a
GA22.10 ± 0.05 a0.70 ± 0.05 c1.64 ± 0.14 a0.04 ± 0.02 c1.47 ± 0.09 c0.68 ± 0.12 bND
GA38.05 ± 2.28 b2.51 ± 0.87 abc1.38 ± 0.18 a3.47 ± 0.25 a7.74 ± 1.19 a2.17 ± 0.30 a1.16 ± 0.30 a
GA43.50 ± 0.67 a1.77 ± 0.40 ab1.93 ± 0.24 a1.98 ± 0.15 b4.30 ± 0.54 b2.51 ± 0.07 a0.15 ± 0.02 b
GA55.52 ± 1.32 a2.22 ± 0.64 ab1.65 ± 0.45 a2.15 ± 0.46 b5.86 ± 2.20 ab3.60 ± 1.25 a0.53 ± 0.15 a
p-Value <0.05<0.05<0.05<0.01<0.01<0.001<0.001
Values are listed as means ± standard deviation of three replicates. Means followed by the same letter within columns are not significantly different (p < 0.05). ND indicates no detection.
Table 8. Low content (1–1000 ng/mL) phenolic compounds in final products of five apple and grape pomace-based fermentations: a purely grape pomace-based treatment [GA1 (1:0)], a purely apple pomace-based treatment [GA2 (0:1)], a predominantly grape pomace-based treatment [GA3 (3:1)], a predominantly apple-based pomace treatment [GA4 (1:3)], and an evenly weighted apple and grape pomace-based treatment [GA5 (1:1)].
Treatment Small Quantity Phenolic Compounds
Apigenin (ng/mL)Chlorogenic Acid (ng/mL)Luteolin (ng/mL)Naringenin (ng/mL)Rutin (ng/mL)Syringic Acid (ng/mL)Vanillic Acid (ng/mL)
GA11.20 ± 0.20 a27.20 ± 7.08 b6.16 ± 0.73 b81.67 ± 13.59 a77.07 ± 32.14 a398.60 ± 48.58 a457.73 ± 33.29 b
GA26.33 ± 0.30 b804.43 ± 74.99 a15.00 ± 0.91 a28.97 ± 1.01 c17.47 ± 22.2 a119.33 ± 23.01 b1074.83 ± 123.02 a
GA31.40 ± 0.36 a335.17 ± 86.40 b7.63 ± 1.24 b82.23 ± 11.89 a116.77 ± 53.76 a281.80 ± 7.78 a602.80 ± 83.77 a
GA45.80 ± 0.26 b743.60 ± 138.60 a18.33 ± 1.70 a42.43 ± 3.86 b422.13 ± 213.9 a165.20 ± 24.56 b769.00 ± 123.88 a
GA52.00 ± 0.34 a648.77 ± 210.90 a8.73 ± 1.75 b58.83 ± 15.13 ab98.80 ± 87.9 a197.03 ± 36.34 ab624.77 ± 174.25 a
p-Value <0.001<0.001<0.001<0.001<0.01<0.001<0.001
Values are listed as means ± standard deviation of three replicates. Means followed by the same letter within columns are not significantly different (p < 0.05).
Disclaimer/Publisher’s Note: The statements, opinions and data contained in all publications are solely those of the individual author(s) and contributor(s) and not of MDPI and/or the editor(s). MDPI and/or the editor(s) disclaim responsibility for any injury to people or property resulting from any ideas, methods, instructions or products referred to in the content.

