Article

Improving the Feasibility of 2G Ethanol Production from Lignocellulosic Hydrolysate Using Immobilized Recombinant Yeast: A Technical–Economic Analysis and Life Cycle Assessment

by
Luísa Pereira Pinheiro
1,†,
Andreza Aparecida Longati
2,†,
Andrew Milli Elias
3,
Caroline Lopes Perez
4,
Laís Portugal Rios da Costa Pereira
4,
Teresa Cristina Zangirolami
2,4,
Felipe Fernando Furlan
2,4,
Roberto de Campos Giordano
2,4 and
Thais Suzane Milessi
2,4,*
1
Graduate Program of Energy Engineering, Federal University of Itajubá, Itajubá 37500-903, Brazil
2
Department of Chemical Engineering, Federal University of São Carlos, São Carlos 13565-905, Brazil
3
Embrapa Instrumentação, São Carlos 13560-970, Brazil
4
Graduate Program of Chemical Engineering, Federal University of São Carlos, São Carlos 13565-905, Brazil
*
Author to whom correspondence should be addressed.
These authors contributed equally to this work.
Fermentation 2025, 11(3), 116; https://doi.org/10.3390/fermentation11030116
Submission received: 16 January 2025 / Revised: 20 February 2025 / Accepted: 27 February 2025 / Published: 2 March 2025
(This article belongs to the Special Issue Bioprocesses for Biomass Valorization in Biorefineries)

Abstract

This work addresses the technical–economic–environmental analysis of a 1G2G ethanol integrated process using immobilized recombinant Saccharomyces cerevisiae and crude sugarcane bagasse acid hydrolysate mixed with molasses. Three case studies were evaluated and compared with the traditional 1G plants. The minimal ethanol-selling price and the life cycle assessment using CML-IA midpoint indicators were chosen as the economic and environmental metrics, respectively. The values found for the ethanol-selling price ranged from 472.92 USD/m3 to 966.53 USD/m3 for the integrated case studies. Compared to the average sales value of 1G ethanol (673.48 USD/m3), the first and second case studies were interesting for their economic viability, while the third case study would require a 43.5% increase in the price of ethanol to achieve production profitability. In the environmental assessment, the integrated 2G ethanol processes of the first and third case studies allowed for the increase in ethanol production per ton of sugarcane processed without decreasing the environmental performance of the process. The third case study presented the lowest environmental impact indicators, except for global warming potential and photochemical oxidation categories, highlighting the importance of the development of biomass pretreatment strategies with lower carbon footprint. The strategy of integrating the 2G process into a 1G ethanol biorefinery offers interesting economic and environmental values, allows the use of hemicellulose, and contributes to the development of 2G processes in sugarcane biorefineries and to the sustainability of the processes.

1. Introduction

According to the Intergovernmental Panel on Climate Change (IPCC), the main cause of global warming is the use of fossil fuels, which account for 89% of global CO2 emissions, with the transport sector accounting for a quarter of these emissions [1]. In addition, oil price volatility affects the global geopolitics and economies [2], creating several risks and uncertainties regarding energy supply. In this context, global concerns about climate change and super-inflation (caused by oil price volatility) have increased [3], leading to investments in the renewable energy generation sector to diversify the energy matrix and achieve greater economic stability and energy efficiency [4]. In addition, the transition of the global matrix from fossil fuels to sustainable processes is essential to achieve the goals set out in Agenda 2030 [5].
Biomass is considered the most foreseeable raw material for the transition of the global matrix from fossil fuels to sustainable processes [6,7]. The potential of this feedstock is related to its composition (mainly cellulose, hemicellulose, and lignin), comprising about 70% of monosaccharides that could be used as substrate to produce biofuels and valuable bioproducts through second-generation (2G) processes in biorefineries [8]. Bioethanol is one of the most widely used biofuels in the world, and it can reduce greenhouse gas (GHG) emissions by 70% compared to gasoline [9]. Brazil, one of the world’s largest producers of ethanol from sugarcane, has an estimated harvest of 713.2 million tons of sugarcane for the 2023/2024 season, with the production of approximately 29.69 billion liters of ethanol and 45.68 million tons of sugar [10]. Currently, most of the Brazilian biorefineries co-produce first-generation (1G) bioethanol, sugar, and electricity [11], which makes 2G bioethanol a natural biofuel to be incorporated in these plants once an integrated 1G/2G bioethanol production process can potentially improve bioprocess economics [12]. However, the feasibility of 2G technologies on a large scale faces some challenges due to the high prices of the 2G process [13,14]. In sugarcane-based biorefineries, the bagasse and straw are byproducts generated in large quantities [15]. In addition to being burned for electricity co-production, part of these materials could be converted to valuable products to help to achieve the viability of the plant. The 1G2G integration increases the productivity of ethanol per hectare of sugarcane (due to better use of the energy resources of this biomass) [16], shares operations and equipment within the same plant, and reduces the costs of implementing the 2G technology [17].
Recent studies have shown significant progress in the production of 2G ethanol, with improvements in the efficiency of biomass conversion processes. Barreto et al. [18] developed the production of 2G ethanol from the alkaline pretreatment of sugarcane bagasse, followed by enzymatic hydrolysis (with a mixture of cellulases and hemicellulases) and cofermentation of C5 and C6 sugars by a yeast consortium. The process developed by these authors allowed for the production of 30.75 L of 2G ethanol per 200 kg of bagasse (153 L of ethanol per ton of sugarcane bagasse). Fernandes Araújo et al. [19] evaluated the use of crude glycerol in the organosolv pretreatment of sugarcane bagasse and the impact of this pretreatment on the enzymatic hydrolysis and alcoholic fermentation of the cellulosic hydrolysate for the production of 2G ethanol. As a result, they estimated the production of 190.1 L of ethanol per ton of sugarcane bagasse.
In Brazil, 2G ethanol production occurs on a commercial scale mainly by two companies: GranBio and Raízen. Both companies use straw and bagasse as the main sources of raw materials to produce 2G biofuel. GranBio’s BioFlex plant has been operating since 2017 [20], with a current production of 30 million liters of cellulosic ethanol per year. For the 2G ethanol production, the company uses enzymatic pretreatment technology (PROESA, from the Italian company Betarenewables), enzymes (Novozymes), and yeasts (from the company DSM) in lignocellulosic biomass [21]. The company has projects to expand cellulosic ethanol production to 60 million liters/year from 2026, and 200 million liters/year in the combination of 1G and 2G ethanol from 2027 [22]. Raízen is one of the pioneering companies with proprietary technology to produce cellulosic ethanol [23]. The Costa Pinho Bioenergy Park has been in operation since the 2014–2015 harvest [24], with a production capacity of 30 million liters of cellulosic ethanol per year in 2022 [25]. Currently, Raízen is investing in the expansion of 2G ethanol production with 20 plants over the next 10 years. The company estimates that with all plants in operation, the production potential will be greater than 1.6 billion liters of cellulosic ethanol [25].
Despite commercial 2G ethanol plants, lignocellulosic biomass biorefineries still face challenges in biomass pretreatment, hydrolysis [26], and in the complete use of biomass components [8]. Lignocellulosic biomass is a carbon-rich source with recalcitrant properties, which is related to the protection of its carbohydrates/sugars against degradation by biological or enzymatic attack. Therefore, in order to modify the structure of the biomass (reducing its recalcitrance) and to increase the accessibility of the biomass carbohydrates, biomass pretreatment becomes a necessary and crucial operation. The major challenges of pretreatment include energy consumption and degradation of biomass sugars into inhibitory by-products [27]. In the case of the hydrolysis stage, which aims to release glucose from the cellulose polymer, the main bottlenecks are the high cost of hydrolytic enzymes and the low solids loading in the reactor, which contribute significantly to the price of the hydrolysis and ethanol in the biorefinery [26,28]. High production costs, technological limitations, and long processing times also hinder large-scale adoption. Additionally, issues like microbial contamination, byproduct formation, and the need for specialized infrastructure add to the challenges [21,29].
To achieve plant feasibility, all biomass components must be fully utilized. In a conventional biorefinery, the hemicellulose fraction, despite being the second most abundant carbohydrate in biomass [30], is underutilized if it is composed mainly of xylose [31]. In order to use this fraction for ethanol production, yeasts capable of fermenting pentoses, such as Spathaspora passalidarum, Scheffersomyces stipitis, Pichia stipitis, Candida shehatae, and Pachysolan tannophilus [32], are required. However, these microorganisms generally present low ethanol tolerance and low yields and productivities [33].
The yeast Saccharomyces cerevisiae is the most used microorganism for ethanol production worldwide, due to its unique characteristics, such as tolerance to high sugar and ethanol concentrations, ability to resist stressful conditions, and high fermentation efficiency [34]. However, the wild-type strains of this yeast cannot metabolize xylose, making the use of this polymer a challenge to overcome [35]. In this sense, genetic and metabolic engineering have been used to enable the fermentation of xylose by S. cerevisiae in order to obtain a robust and competitive 2G ethanol process [36,37].
Cell immobilization, on the other hand, is a technique with several advantages, such as easy yeast recovery and recycling, the possibility of process operation using high cell loadings, and the cell protection against stressful conditions due to the presence of the immobilization support [38]. Considering the use of genetically modified organisms (GMO) at the industrial scale, the use of immobilized cells is particularly interesting, as it could reduce the efforts and costs related to cell propagation and ensure the process conduction in isolation, in compliance with legal restrictions of GMO use, such as in countries like Brazil [33].
Taking the abovementioned into account, Perez et al. [33] evaluated 2G ethanol production in an integrated process using an immobilized recombinant yeast in a medium based on sugarcane bagasse undetoxified crude hemicellulose acid hydrolysate and molasses. The process used a high-performance recombinant yeast, S. cerevisiae MDS130, immobilized on calcium alginate beads in a fixed-bed bioreactor in repeated batches. The MDS130 yeast is capable of completely assimilating xylose in lignocellulose hydrolysate media with high yields and ethanol concentrations and stands out as a promising strain for industrial applications involving the production of 2G ethanol [39]. The authors achieved remarkable ethanol productivities of 22.8 g/L/h in 20 cell recycles. The addition of molasses to crude hemicellulose hydrolysate proposed by Perez et al. [33] increased the sugar content of the fermentation medium and minimized the risk of contamination of the fermentation due to the rapid production of ethanol from hexoses. Additionally, hydrolysate inhibitor components (such as acetic acid and furfural) were kept at non-toxic levels for the microorganisms. As a result, this strategy offers several advantages: it eliminates two steps in the 2G ethanol production process (concentration and detoxification of the hydrolysate), resulting in lower capital and operational expenditures (capex and opex, respectively); enhances the process productivity (due to faster hexose assimilation); and saves process water, steam, and electricity. However, the scale-up of the process technology developed by Perez et al. [33] demands the technical–economic–environmental analysis (TEEA) of the process to ensure its sustainability and economic competitiveness.
Several studies on the TEEA of integrated biorefineries have been reported [16,40,41,42,43,44,45,46,47]; nevertheless, there is a paucity of works evaluating the use of molasses in 2G ethanol processes with a focus on technical–economic analysis (TEA) and life cycle assessment (LCA). Moonsamy et al. [48] evaluated TEA in several 1G2G integration possibilities for ethanol production in an African sugar mill. The best technical and economical results were obtained in the scenario based on the co-fermentation of the whole steam explosion pretreated biomass supplemented with molasses. In this case, the authors found a minimum ethanol-selling price (MESP) of USD 1.23/L. Although this result is promising in the African reality, in the Brazilian scenario, this MESP is not low enough to make the process viable, since the average of the selling price of ethanol is USD 0.53/L. Losordo et al. [45] simulated a 2G process annexed to a Brazilian sugar and ethanol plant to evaluate the technical–economic feasibility of the co-fermentation of C5 (from steam pretreatment of bagasse) and C6 sugars (sugarcane molasses) with engineered yeast (S. cerevisiae M3799). The authors reported that ethanol yields in this industry increased by 37% (9.5 billion liters of ethanol) compared to a 1G plant, without affecting the sugar production and achieved positive economic performance (MESP from USD 0.17/L to USD 0.29/L at a 10% return, which is cost-competitive with 1G ethanol). Moreover, these works pointed out that this type of configuration represents a fully integrated scenario that can be the way to make the 1G2G biorefineries feasible. Therefore, studies of promising processes, such as the one reported by Perez et al. [33] using molasses for 1G2G ethanol production, are scarce, and, to the best of our knowledge, no study has reported a TEEA of the 2G ethanol production from molasses and unconcentrated crude hemicellulose hydrolysate using immobilized yeasts.
Therefore, the present work addresses the TEEA of three case studies based on the integration of the 2G process developed by Perez et al. [33] in a 1G sugarcane biorefinery. In all case studies, part of the bagasse stream is diverted from cogeneration towards an acid pretreatment reactor. The pretreated solid fraction feeds the boiler, while the liquid fraction (hydrolysate rich in xylose coming from hemicellulose) is mixed with molasses and directed to the 1G2G process. Both case studies are compared to a conventional 1G distillery and 1G ethanol–sugar industry. The net present value (NPV) and MESP were chosen as economic metrics, and CML-IA midpoints were the environmental indicators. We show that the strategies proposed by Perez et al. [33] reveal important solutions to allow hemicellulose utilization and 2G process feasibility, reaching economic values closer to the 1G ethanol average selling price of recent years.

2. Materials and Methods

2.1. Overview and Software

Figure 1 and Figure 2 show a block flow diagram for each case study of the 1G2G sugarcane biorefinery configuration evaluated in this paper. The case study simulations were performed considering the implementation of 2G process (from crude bagasse hemicellulose acid hydrolysate mixed with molasses) based on Perez et al. [33] to 1G ethanol plant (called base cases). The base cases represent two Brazilian biorefinery configurations; the first is a conventional 1G ethanol–sugar plant (case study CsA), and the second is a 1G sugarcane distillery plant (case study CsB).
The first case study (case study Cs1) represents the integration of a 1G ethanol–sugar plant (case base CsA) into the 2G process developed by Perez et al. [33]. The second case study (case study Cs2) and the third case study (Cs3) correspond to the 2G process (based on Perez et al. [33]) integrated into a 1G distillery (CsB base case) with modifications: the first one producing molasses through the 1G treated broth concentration and using it for both ethanol production and cell propagation; and the second one purchasing molasses as a 2G input, as an alternative configuration to not include a sugar or molasses production sector in the biorefinery. All integrated plants (Cs1, Cs2, and Cs3 cases) produce ethanol (both 1G and 2G) and electricity (from bagasse, straw, and unreacted solids). The exception is the Cs1 case study, which also produces sugar in the plant. The case studies are compared to the base cases CsA and CsB.
The software used to simulate the processes was EMSO simulator (EMSO stands for environment for modeling, simulation, and optimization), an equation-oriented process simulator for modeling complex dynamic or steady-state processes. The software contains an open library of models and allows model editing (by inserting mathematical equations into its internal library) and development (the user can create their models). The simulator has several numerical solvers for differential-algebraic systems, libraries of equipment models, and thermodynamic and fluid properties packages, which can be used in different fields [49]. SimaPro software was used to generate the data required for the life cycle analysis process. These data were inserted into the case study simulations at EMSO in order to obtain all the results of the technical–economic–environmental analysis together.

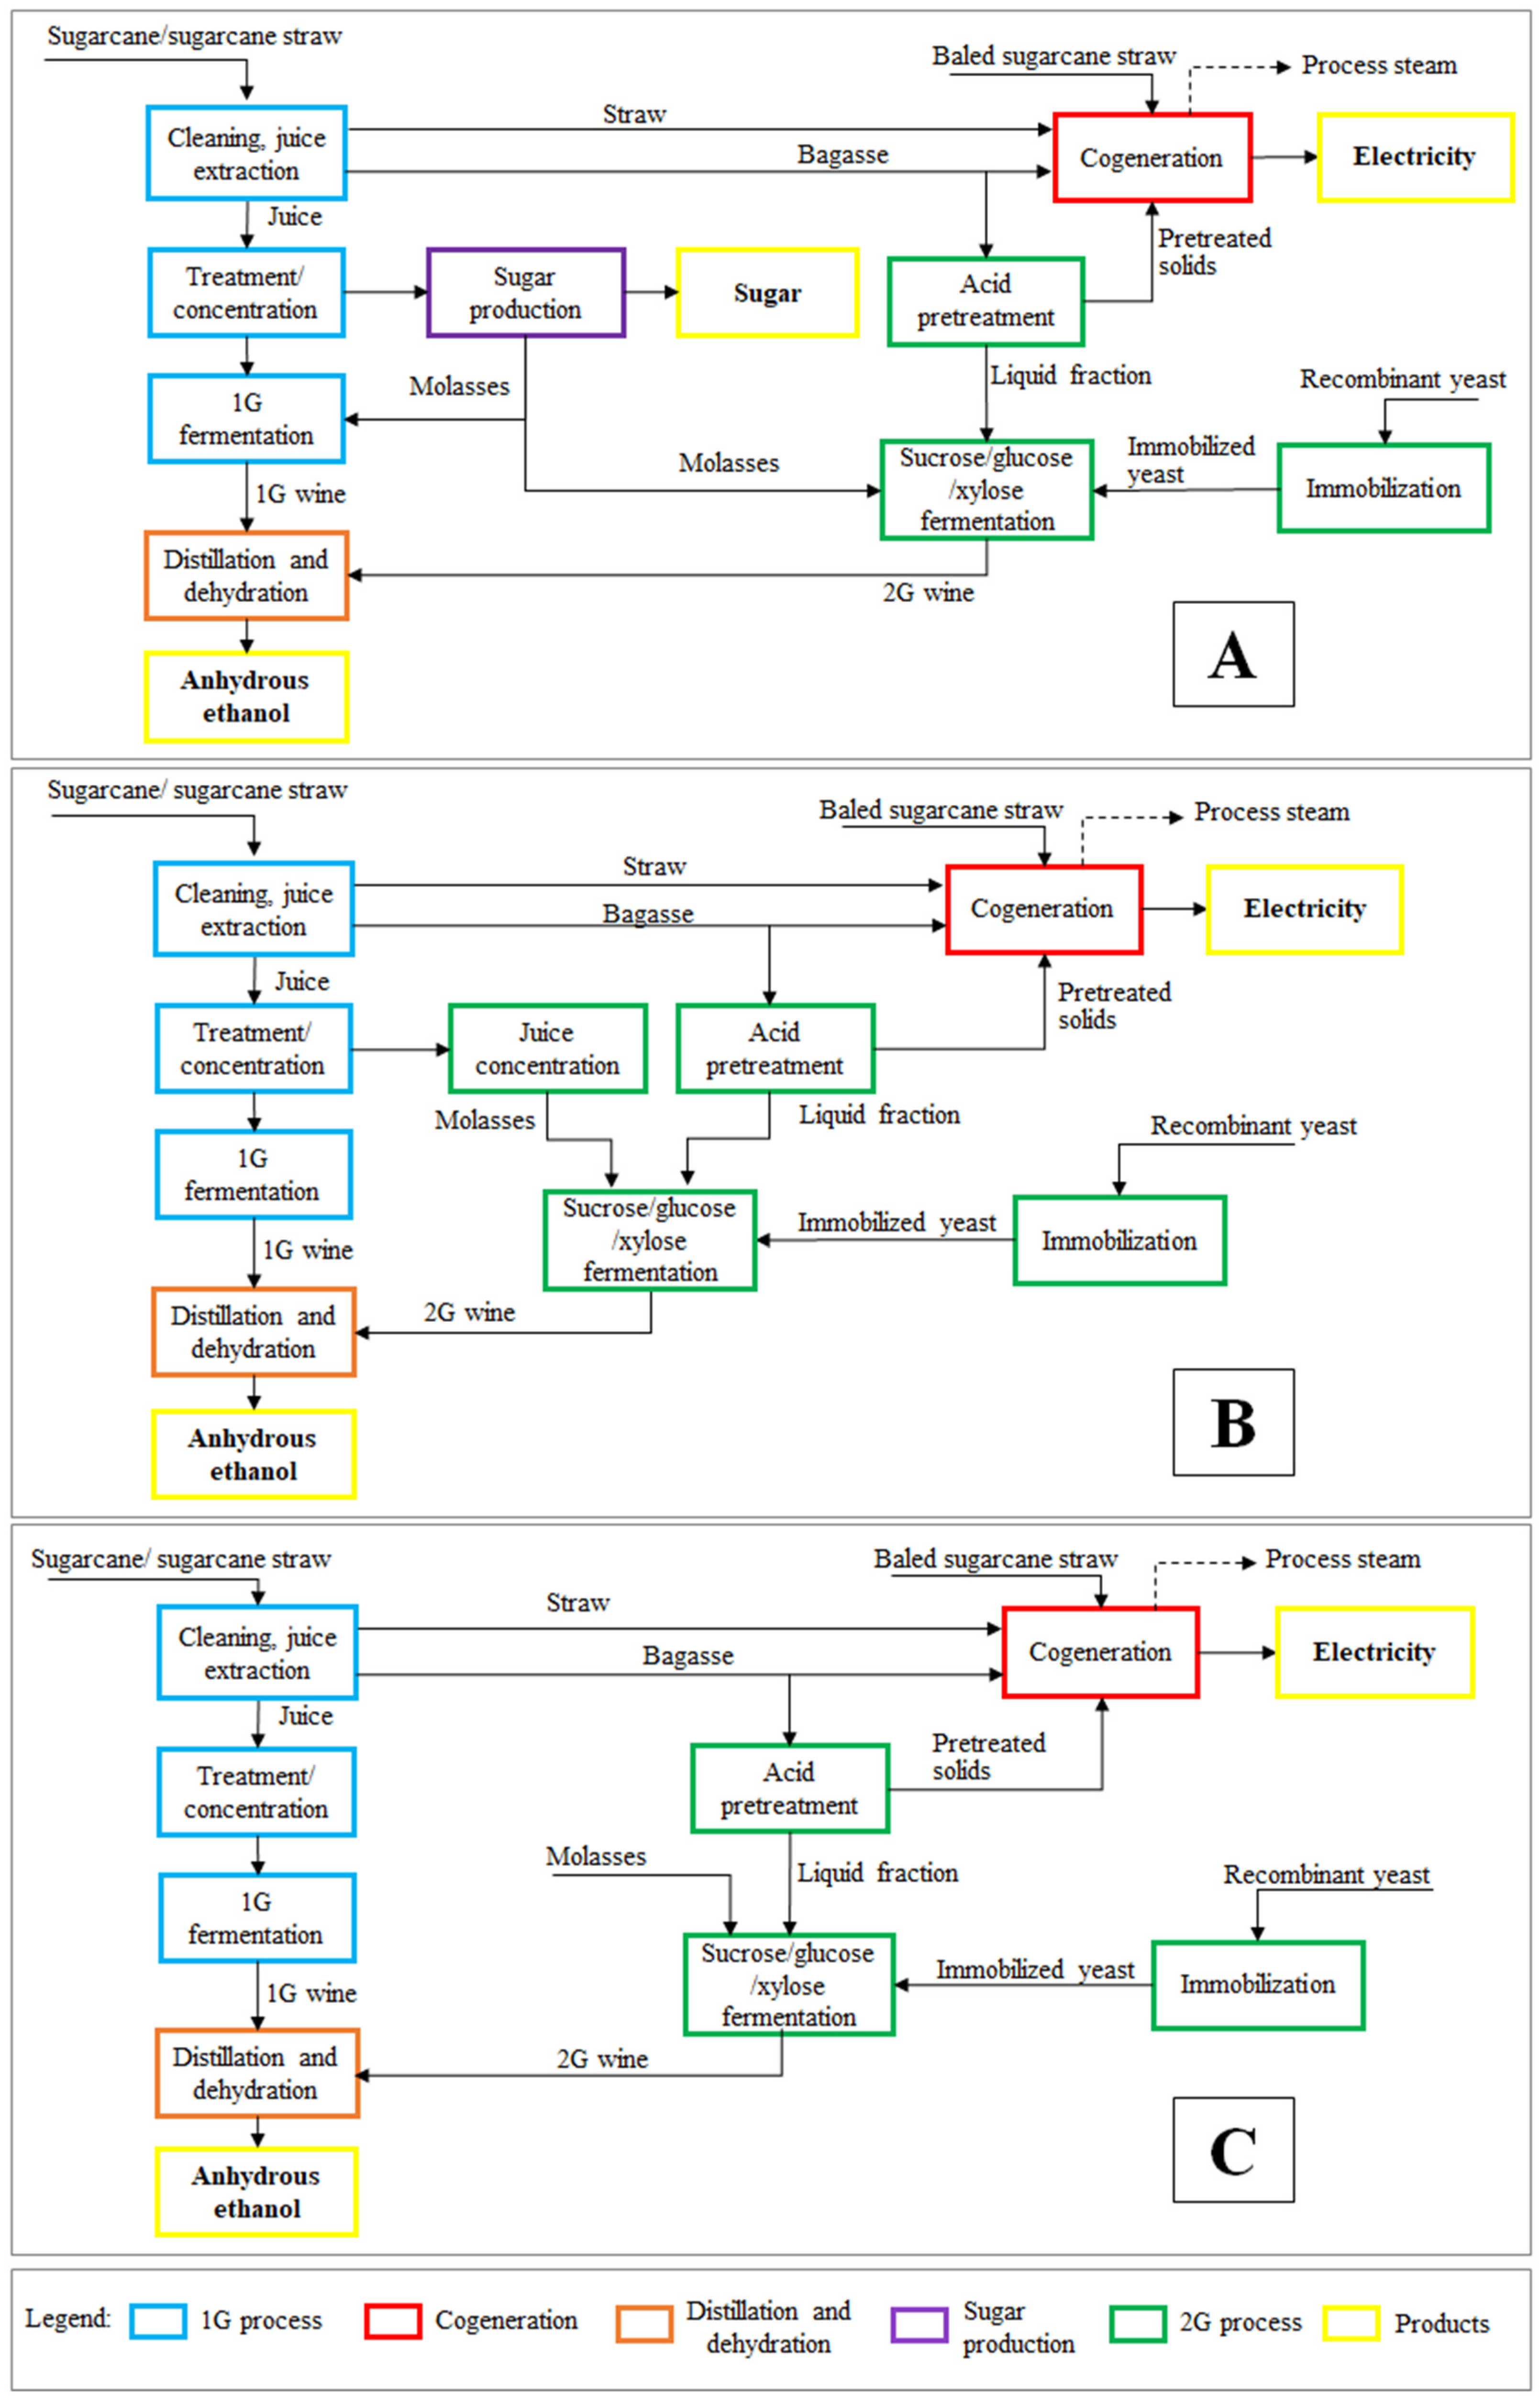
2.2. Process Description

A Brazilian biorefinery processing 4 million tons of sugarcane per season and recovering 50% of the sugarcane straw produced in the field was simulated in EMSO. The plant operates 240 days per year and 21 h per day [50]. The composition of sugarcane and straw is described in Longati et al. [16].
The 1G ethanol–sugar process (base case, CsA), is the traditional sugarcane plant producing ethanol, sugar, and electricity (Figure 1A). First, the sugarcane, which still contains remnants of straw, leaves, and soil, is sent to the dry-cleaning process to remove vegetable impurities and mineral residues. The sugarcane straw collected in bales from the fields is sent to the boiler along with the dry-cleaned vegetable impurities removed. The cleaned sugarcane is sent to the sugar extraction stage to produce juice. The juice extracted from the sugarcane in the mills goes through the treatment process, which consists of removing most of its impurities. In this step, one stream of bagasse and two streams of treated juice are generated, one for the sugar production and the other for the 1G fermentation. The juice to be concentrated passes through a series of evaporators until it reaches a Brix of 60° and becomes a syrup [51]. The syrup is destined for the crystallization stage (sugar production), where it is boiled and becomes a mass whose solid part, after centrifugation, is called sugar, while the liquid part is the syrup/honey. The extracted honey returns to the cooking process until it is exhausted [52], turning into molasses (a honey that can no longer extract sugar). The 1G fermentation stage uses molasses diluted/mixed with the treated juice as feedstock in a fed-batch process with recirculation of S. cerevisiae for 1G ethanol production. The next steps of the process correspond to distillation and dehydration (with monoethylene glycol to obtain anhydrous ethanol) and cogeneration. The bagasse generated in the extraction section is sent to the cogeneration system, which allows for the simultaneous production of thermal and electrical energy from lignocellulosic biomass. All thermal energy is used on-site in the plant. The surplus electricity generated (energy not consumed by the biorefinery) is sold to the grid, contributing to the profitability of the sector. The boiler fuels are bagasse (with 50% humidity) and straw (with 15% humidity) for 1G case studies and 2G solids from pretreatment for the cases studies Cs2 and Cs3 (2G processes), which maintain the plant’s energy self-sufficiency. Energy integration is achieved by running a pinch analysis concurrently with the simulations according to Elias et al. [53].

2.2.1. The 1G Ethanol–Sugar Process (CsA Case Study)

In this simulation, about 50% of the production calculated from the mass balance of the total reducing sugars is distributed in a production mix between sugar and ethanol. In this way, it is possible to monitor the yields of the biorefinery products (sugar and ethanol) and determine how much of the treated juice should be allocated to the sugar and 1G ethanol sectors.

2.2.2. The 1G Process (CsB Case Study)

The second base case, CsB, represents a 1G autonomous ethanol distillery (Figure 1B) as described in Elias et al. [54] and Longati et al. [16]. The steps of the raw materials reception (sugarcane and straw), sugarcane preparation, dry cleaning, sugarcane juice extraction by mills, and juice treatment (which removes most of the impurities) and cogeneration are identical to the base case A (CsA) described in Section 2.2. The whole purified juice is sent to the concentration stage (where it is concentrated to 20° brix), followed by the 1G fermentation stage (which operates with recirculation of S. cerevisiae yeast in a fed-batch process), and then fermented. The wine produced during fermentation is sent to the distillation and dehydration stage, which produces anhydrous ethanol.

2.2.3. The 1G2G Process of the Cs1

The first case study (Cs1) comprises the 2G process ethanol production proposed by Perez et al. [33] (from crude sugarcane bagasse hemicellulose acid hydrolysate mixed with molasses) integrated into the CsA 1G ethanol–sugar process (Figure 2A). The 1G ethanol–sugar process steps are described in Section 2.1. The amount of bagasse diverted from cogeneration to the 2G process, is not a fixed value, but is defined based on the amount of molasses available to 2G sector, without compromising the plant’s energy demand and 1G ethanol production. A fraction of molasses (from the 1G process) is sent to the 2G bioreactor for ethanol production together with the sugarcane bagasse hemicellulose hydrolysate (SCBH) produced through acid pretreatment using bagasse at 50% moisture. The acid pretreatment is based on Marcelino et al. [55], and the reactions and stoichiometric coefficients (molar base) considered are based on Humbird et al. [56].
The pretreated mixture (with the temperature adjusted to 80 °C) is then filtered, and the solid and liquid fractions are separated. The solid fraction (50% of moisture) is sent to the cogeneration, where it is burned alongside bagasse and straw. The liquid fraction, rich in xylose, is sent to the 2G bioreactor.
Similarly to the CsA baseline scenario (described in Section 2.2.1), case study Cs1 produces sugar in its 1G plant as one of the biorefinery products. The molasses produced in the sugar production step is divided into two streams, one for the 1G sector for the ethanol production process, while the other stream is destined for the 2G bioreactor sector.
The 2G bioreactor follows the process and conditions described in Perez et al. [33]. The feed stream containing hydrolysate and molasses is composed of 16.2 g/L of xylose, 61.2 g/L of sucrose, 6.8 g/L of glucose, 100 mg/mL of ampicillin, and 0.25M of calcium chloride (to maintain the integrity of immobilizes cell beads) [33] (values given at the inlet of bioreactor 2G, with hydrolysate density equal to water and molasses density equal to 1400 kg/m3). The process is carried out at 35 °C for 8 h, producing around 41.8 g/L of ethanol. The wine obtained from xylose and molasses is sent to the purification sector (distillation and dehydration), along with 1G wine.
Before being fed into the 2G bioreactor, the recombinant yeast undergoes the process of yeast immobilization. The immobilization process is performed by Ca-alginate gel entrapment based on Milessi et al. [36] and Perez et al. [33], which allows for the operation of the bioreactor with high cell loads. The main parameters used in this case study are described in the Supplementary Material.

2.2.4. The 1G2G Process of the Cs2

The integrated process of the Cs2 case study comprises the 2G process proposed by Perez et al. [33] integrated into a 1G ethanol process (CsB base case) (Figure 1B), with the molasses being used solely to supplement the 2G process and produced in an on-site juice concentration step (Figure 2B). The 1G process steps are described in Section 2.2.2 and the 2G process (acid pretreatment, yeast propagation, and immobilization, 2G fermentation) in Section 2.2.3.
In this scenario, a fraction of the concentrated juice from the 1G process is diverted to molasses production. Since the plant does not include a sugar production process to obtain molasses (an important component of the fermentation medium in the 2G sector), a process is developed to concentrate a fraction of the juice diverted from the 1G sector in a series of evaporators. This process produces a concentrated juice with 88° Brix, compatible with the molasses used in the CsA base case and the Cs1 case study.

2.2.5. The 1G2G Process of the Cs3

The Cs3 case study (Figure 2C) involved the SCBH fermentation in a similar configuration to the Cs2 case study, but instead of producing molasses by concentrating 1G juice, molasses are purchased as an input for 2G fermentation.

2.3. Economic Analysis

The TEA is performed to determine the economic performance of the process. The minimum ethanol-selling price (MESP) is the economic parameter adopted to evaluate the feasibility of the process. For the MESP calculation, the net present value (NPV, Equation (1)) is equal to zero, and the minimum attractiveness rate as the discount rate (r), capital expenditure, operating expenditure, revenues (ethanol, sugar, CBIO, and electricity sales) are calculated or estimated (according to Peters et al. [57]).
N P V X 1 , X 2 , , X i = j = 1 N C a s h F l o w ( X 1 , X 2 , , X i ) 1 + r j C A P E X X 1 , X 2 , , X i
N P V ( r = M A R R ,   P i ) = 0
where r is the return on investment, and N is the project lifetime. NPV is calculated as the difference between the discounted cash flow (first term in the right side of Equation (1)) and the capital cost (second term in the right side of Equation (1)). Cash Flow and CAPEX (capital cost) are functions of the process variables ( X 1 , X 2 , , X i ). The CAPEX for 1G and integrated 1G2G ethanol production are based on Longati et al. [16], Elias et al. [54], and Junqueira et al. [44]. For the 2G sector, equipment costs are estimated based on Davis et al. [58], Humbird et al. [59], and Davis et al. [60] (using scaling factor). Operational expenditures are based on the raw materials cost and on Peters et al. [57]. The price of raw materials, products, and chemicals considered are as follows: 13.35 USD/tons of sugarcane, 15.96 USD/tons of sugarcane straw, 0.1943 USD/tons of water, 2.16 USD/kg of ammonia, 2.57 USD/kg of phosphoric acid, 0.29 USD/kg of CaOH2, 0.08 USD/kg of H2SO4 (98%), 0.67 USD/kg of NaOH, 3.06 USD/kg of CaCl2, 36.55 USD/kg of ampicillin, 15.35 USD/kg of calcium alginate, and 20USD/kg of recombinant yeast (MDS130). A selling price of 673.48 USD/m3 is adopted for ethanol, 30.75 USD/MWh for electricity, 0.44 USD/kg for sugar, 16.92 USD/t for CBio (average price between December/2020 to December/2023, according to [61,62,63]. The exchange rate is 5.19 BRL/USD (average price between December/2020 to December/2023).
The economic analysis considers a minimum attractive rate of return (MARR) of 11% per year, a project lifetime of 25 years, a tax rate of 34%, tax-deductible linear depreciation of 10% per year, and a construction time of two years. To better understand the behavior of the MESP during the economic analysis, the MESP 2G is calculated using the equation presented in Macrelli et al. [64].
A local sensitivity analysis is performed to assess the impact of the industrial investment, the operational expenditures, the input raw materials prices, and the biorefinery products prices on the MESP. A variation spanning −50% and +50% of the estimated values of the plant is considered for this analysis.

2.4. Life Cycle Assessment

SimaPro software was used to generate the data required for the life cycle analysis process. The LCA methodology is used to evaluate the environmental impacts of the different scenarios of ethanol production processes. In the present work, the functional unit was defined as 1 MJ of anhydrous ethanol. The cradle-to-gate approach was adopted, and the material and energy inputs and outputs are obtained from the simulations. The agricultural and transport stages data are obtained from Longati et al. [16]. At the industrial stage, the data are obtained from the simulations. The environmental impact of the infrastructure (including buildings, laboratories, offices, etc.) is not considered due to the large throughput and long effective life of the sugarcane-processing facility.
SimaPro 9.0 software and its database provide the datasets for the main inputs of the agricultural and industrial steps (data in Supplementary Material). LCA was conducted through the CML-IA baseline 2000 V3.04 method. The impact categories addressed are as follows: abiotic depletion (AD), acidification (AC), eutrophication (EU), global warming potential (GWP100), ozone layer depletion (ODP), human toxicity (HT), aquatic ecotoxicity of freshwater (FWAET), marine aquatic ecotoxicity (MAET), terrestrial ecotoxicity (TET), and photochemical oxidation (PO).
The final environmental impacts of the process are obtained from computational simulations by inserting equations and data from both SimaPro alongside the mathematical models of the process units in EMSO, in order to obtain all the results of the technical–economic and environmental analysis together.
The comparison of case studies in research is often not a straightforward task but is necessary to identify patterns, evaluate outcomes, or select the most appropriate approach for a given context. In LCA, however, environmental parameters are inherently diverse, often using different units, scales, and data. This diversity makes direct comparisons difficult. To address this, researchers and analysts often develop a single metric value that is normalized to a range between 0 and 1. A 0 to 1 metric provides a standardized range, making it easier to directly compare different datasets without having to interpret complex units or scales. In this context, an environmental impact score ranging between 0 and 1 was created based on Julio et al. [65] to facilitate comparison between scenarios by combining the different environmental impacts into a single metric. It provides a clear, interpretable scale, where 1 represents the least favorable outcome (the worst environmental performance), and 0 represents the most favorable (the best environmental performance). The highest value in each environmental indicator was considered equal to 1, and the remaining values were calculated proportionally to this value. This approach facilitates objective evaluation, ensures consistency across diverse datasets, and enhances the clarity of results. The normalized values ( A i ) were multiplied by the weighting factor of each environmental indicator ( f i ). The final score (τ) is the result of the sum of ( f i × A i ), shown in Equation (3).
τ = f G W P   × A G W P + f A D × A A D + f O D P   × A O D P + f H T × A H T + f F W A E T × A F W A E T + f M A E T × A M A E T + f T E T × A T E T + f P O   × A P O + f A C   × A A C + f E U × A E U
The GWP100 indicator received a weighting factor of 20% (1/5), and the remaining 80% was equally distributed among the other impact categories of the LCA, receiving a weighting factor of 1/9 for each environmental indicator, for a total of 80%. The GWP100 indicator received more weighting factors because this indicator addresses one of the most urgent global environmental challenges: climate change. It provides a universal metric for assessing and mitigating greenhouse gas emissions. Its global relevance, ease of interpretation, and alignment with international climate goals make it a cornerstone of sustainability assessments and a key driver in the transition toward a low-carbon future [66].
The decarbonization credit (CBIO) was also evaluated. CBIO is an environmental credit of the Brazilian National Biofuels Policy (RenovaBio), which corresponds to one ton of C O 2 equivalent (CO2eq) not emitted by the use of fossil biofuels. RenovaBio, implemented in 2017, aims to expand the production and use of biofuels in the Brazilian energy matrix [67]. Through this program, producers/plants that produce biofuels can certify their production and receive environmental energy efficiency notes (NEEA) (in gCO2/MJ). These NEEAs are multiplied by the volume of biofuel produced and sold, generating CBIOs [68]. The performance of biofuels in terms of GHG emissions, as determined by the NEEA, is quantified within the LCA by the “climate change” category [68]. In addition, the CBIO generated by the producer/plant can be traded on the stock exchange. This income is considered in the technical–economic analysis as a crop product, such as ethanol, sugar, or electricity.
The sensitivity analysis of the GWP100 impact is performed to evaluate how the variation of −50% and +50% in each raw material input affects the GWP100 category. This impact category was chosen because of its importance in the current world scenario. The potential to reduce GHG is one of the main motivations for renewable energy alternatives. At the national level, Brazil has committed to an absolute reduction in greenhouse gases at COP 21 as part of a proposed global pact against climate change [1].

3. Results and Discussion

Simulations of the case studies described in Section 2.3 were performed, and the main process data are presented in Table 1, where the CsB, Cs2, and Cs3 plants produce ethanol and electricity as main outputs, while CsA and Cs1 produce ethanol, electricity, and sugar as main outputs.
The integration of the 2G process into the 1G process increased ethanol production in all case studies. The Cs1 case study produced about 49 L of ethanol per tons of cane (L/TC), a smooth increment of 3.3% when compared with CsA base case. In the case studies Cs2 and Cs3, the increase in ethanol production were 10.4% (99.11 L/TC) and 79.6% (161.26 L/TC), respectively, compared to the CsB base case. The increase in the total ethanol production is due to the production of 2G ethanol from the bagasse diverted from cogeneration to maximize ethanol production, without compromising the plant’s energy self-sufficiency. This fact results in lower electricity generation in the integrated plants compared to the baseline plants (5.8% for Cs1, 33.4% for Cs2, and 43.3% for Cs3); however, these values are comparable to other works of literature [16,44,48,54].
When comparing the three cases studied, Cs1 has the lowest production of 1G2G ethanol. In this plant configuration, all the juice produced is divided between sugar and ethanol production. This case is different from other integrated case studies (Cs2 and Cs3), where all the sugarcane juice is used for ethanol production. Furthermore, in the Cs1 case study, there is a balance between ethanol and sugar production. This balance keeps the plant producing sugar and ethanol proportionally, at 50%. Thus, with the production of 2G ethanol in the plant, part of the juice destined for 1G ethanol is diverted to the sugar production sector, maintaining this balance between productions, which is the reason for the similar ethanol and sugar production.
Although all the case studies simulations aimed to maximize ethanol production, Cs3 presented the higher ethanol production (161.26 L/TC) compared to Cs1 and Cs2, which is superior to other works from literature: 109.5 L/TC [17], 111.82 L/TC [16], 108.4 L/TC [44], 115.2 L/TC [69], and 121.7 L/TC [70]. A large amount of bagasse can be diverted from the cogeneration to the 2G process in the Cs3 because the plant’s energy demand is met by straw and pretreated solids (lignin and unhydrolyzed cellulose remaining after the bagasse acid pretreatment) in addition to bagasse. In this case study, the pretreated solids are the main boiler fuel (55%, Table 1) followed by the sugarcane straw (29%, Table 1). Therefore, in addition to the highest ethanol production, Cs3 also has the majority of ethanol production from the 2G sector (with 51% of the total ethanol production).
In terms of ethanol production, the integrated processes have lower ethanol concentrations in 1G2G wines than their respective base cases (7.77% for CsA and 7.44% for CsB), 6.50% for Cs1, 7.02% for Cs2, and 6.51% for Cs3. These results occur because 2G wine (with lower ethanol concentration than 1G wine) produces a diluted wine when mixed with 1G wine. This fact explained the higher vinasse generation (Table 1) in the integrated scenarios, which increased by 26% (88.6 m3/h) for Cs1, 18% (121.71 m3/h) for Cs2, and 109% (739.87 m3/h) for Cs3 (compared to the baseline case studies).
From the technical point of view of steam consumption, Cs1 presented an increase in steam consumption (both steams 2.5 and 6 bar) compared to CsA, due to the increase in sugar production (with a greater quantity of juice to be concentrated) and the distillation system for ethanol recovery. On the other hand, Cs1 had the lowest steam consumption in the condensing turbine (0.1 bar), which highlights the lower electricity production. In the Cs2, the molasses production in the 2G fermentation stage (using steam of 2.5 bar) and the distillation system (using steam of 6.0 bar) were responsible for the increase in steam consumption of the plant. In Cs3, the distillation system is the main source of increased steam consumption (using steam of 6.0 bar) due to the higher ethanol volume produced in this case.
The results of the technical analysis show that the integration of the 1G and 2G processes allows for an increase in ethanol production without compromising the energy self-sufficiency of the biorefinery, making the use of biomass more efficient. However, this increase in production capacity must be analyzed in conjunction with the economic and environmental impact of the process, since the feasibility of implementing 2G ethanol on a large scale depends not only on the optimization of technical parameters, but also on the economic and environmental performance of the process (presented below in 3.2 and 3.3 items). Therefore, the combination of technological advances, economical strategies, and environmental benefits is essential to make the process sustainable, economically attractive in the marketplace, and environmentally friendly.

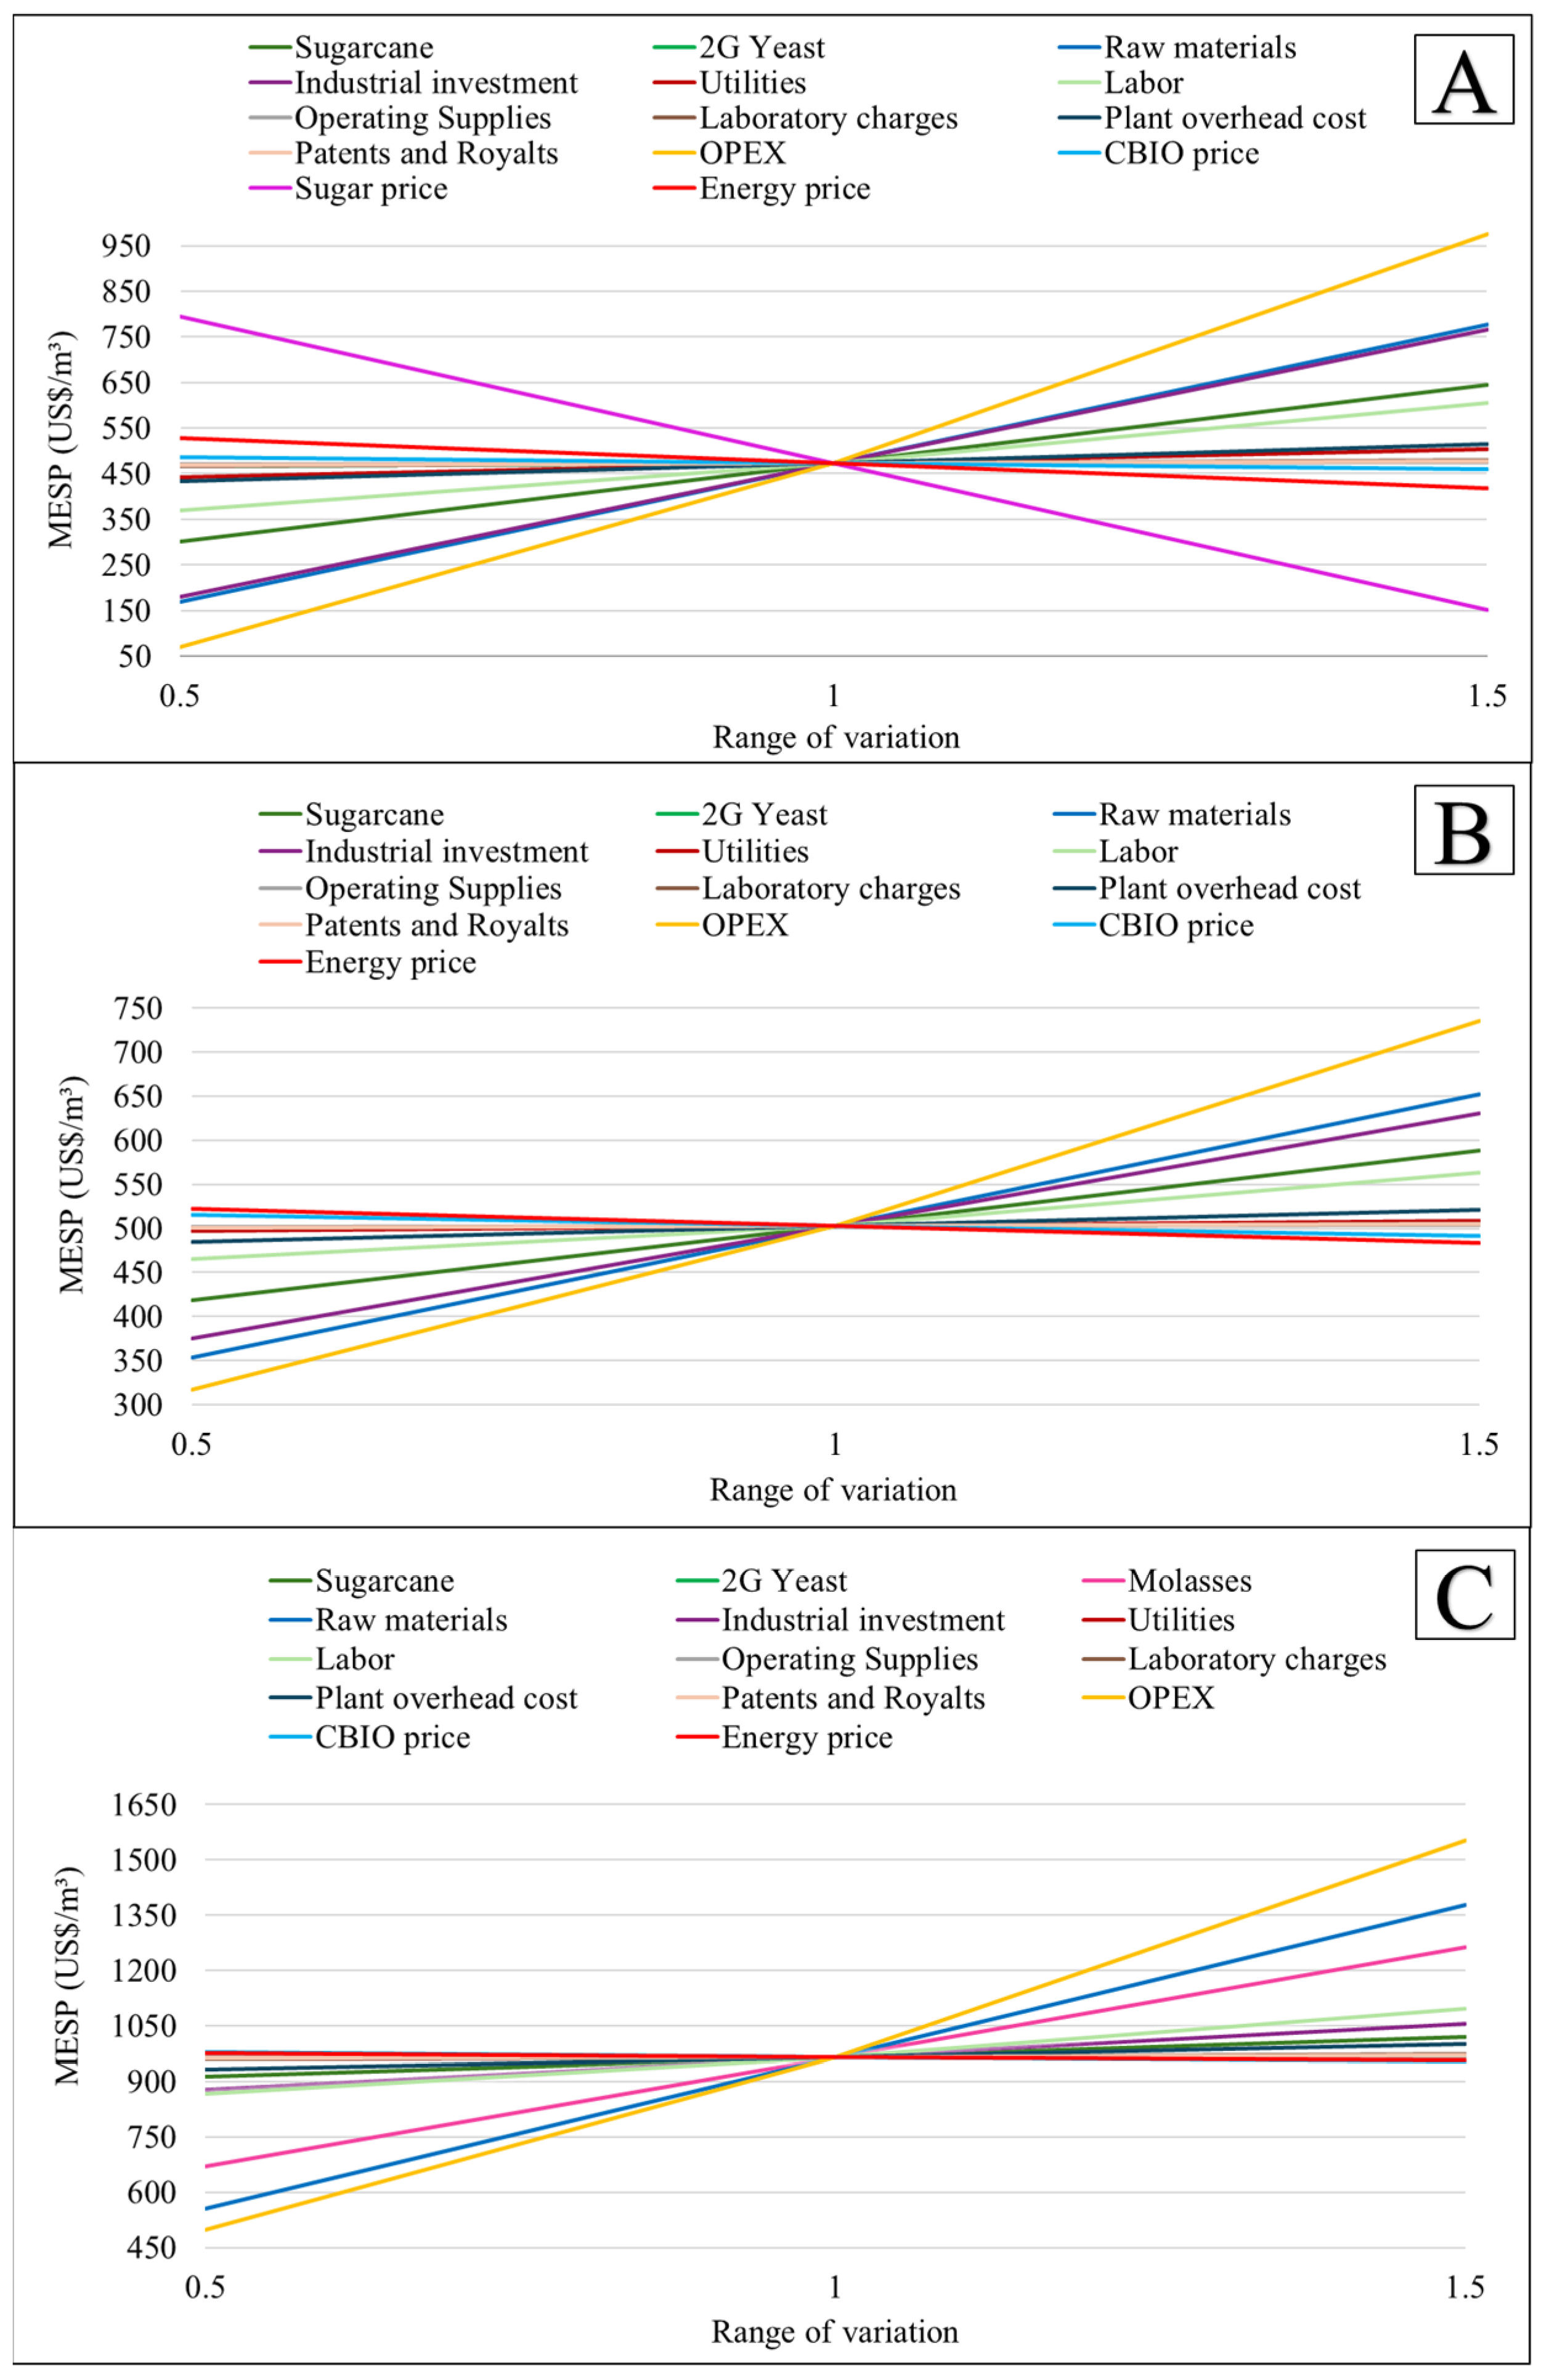
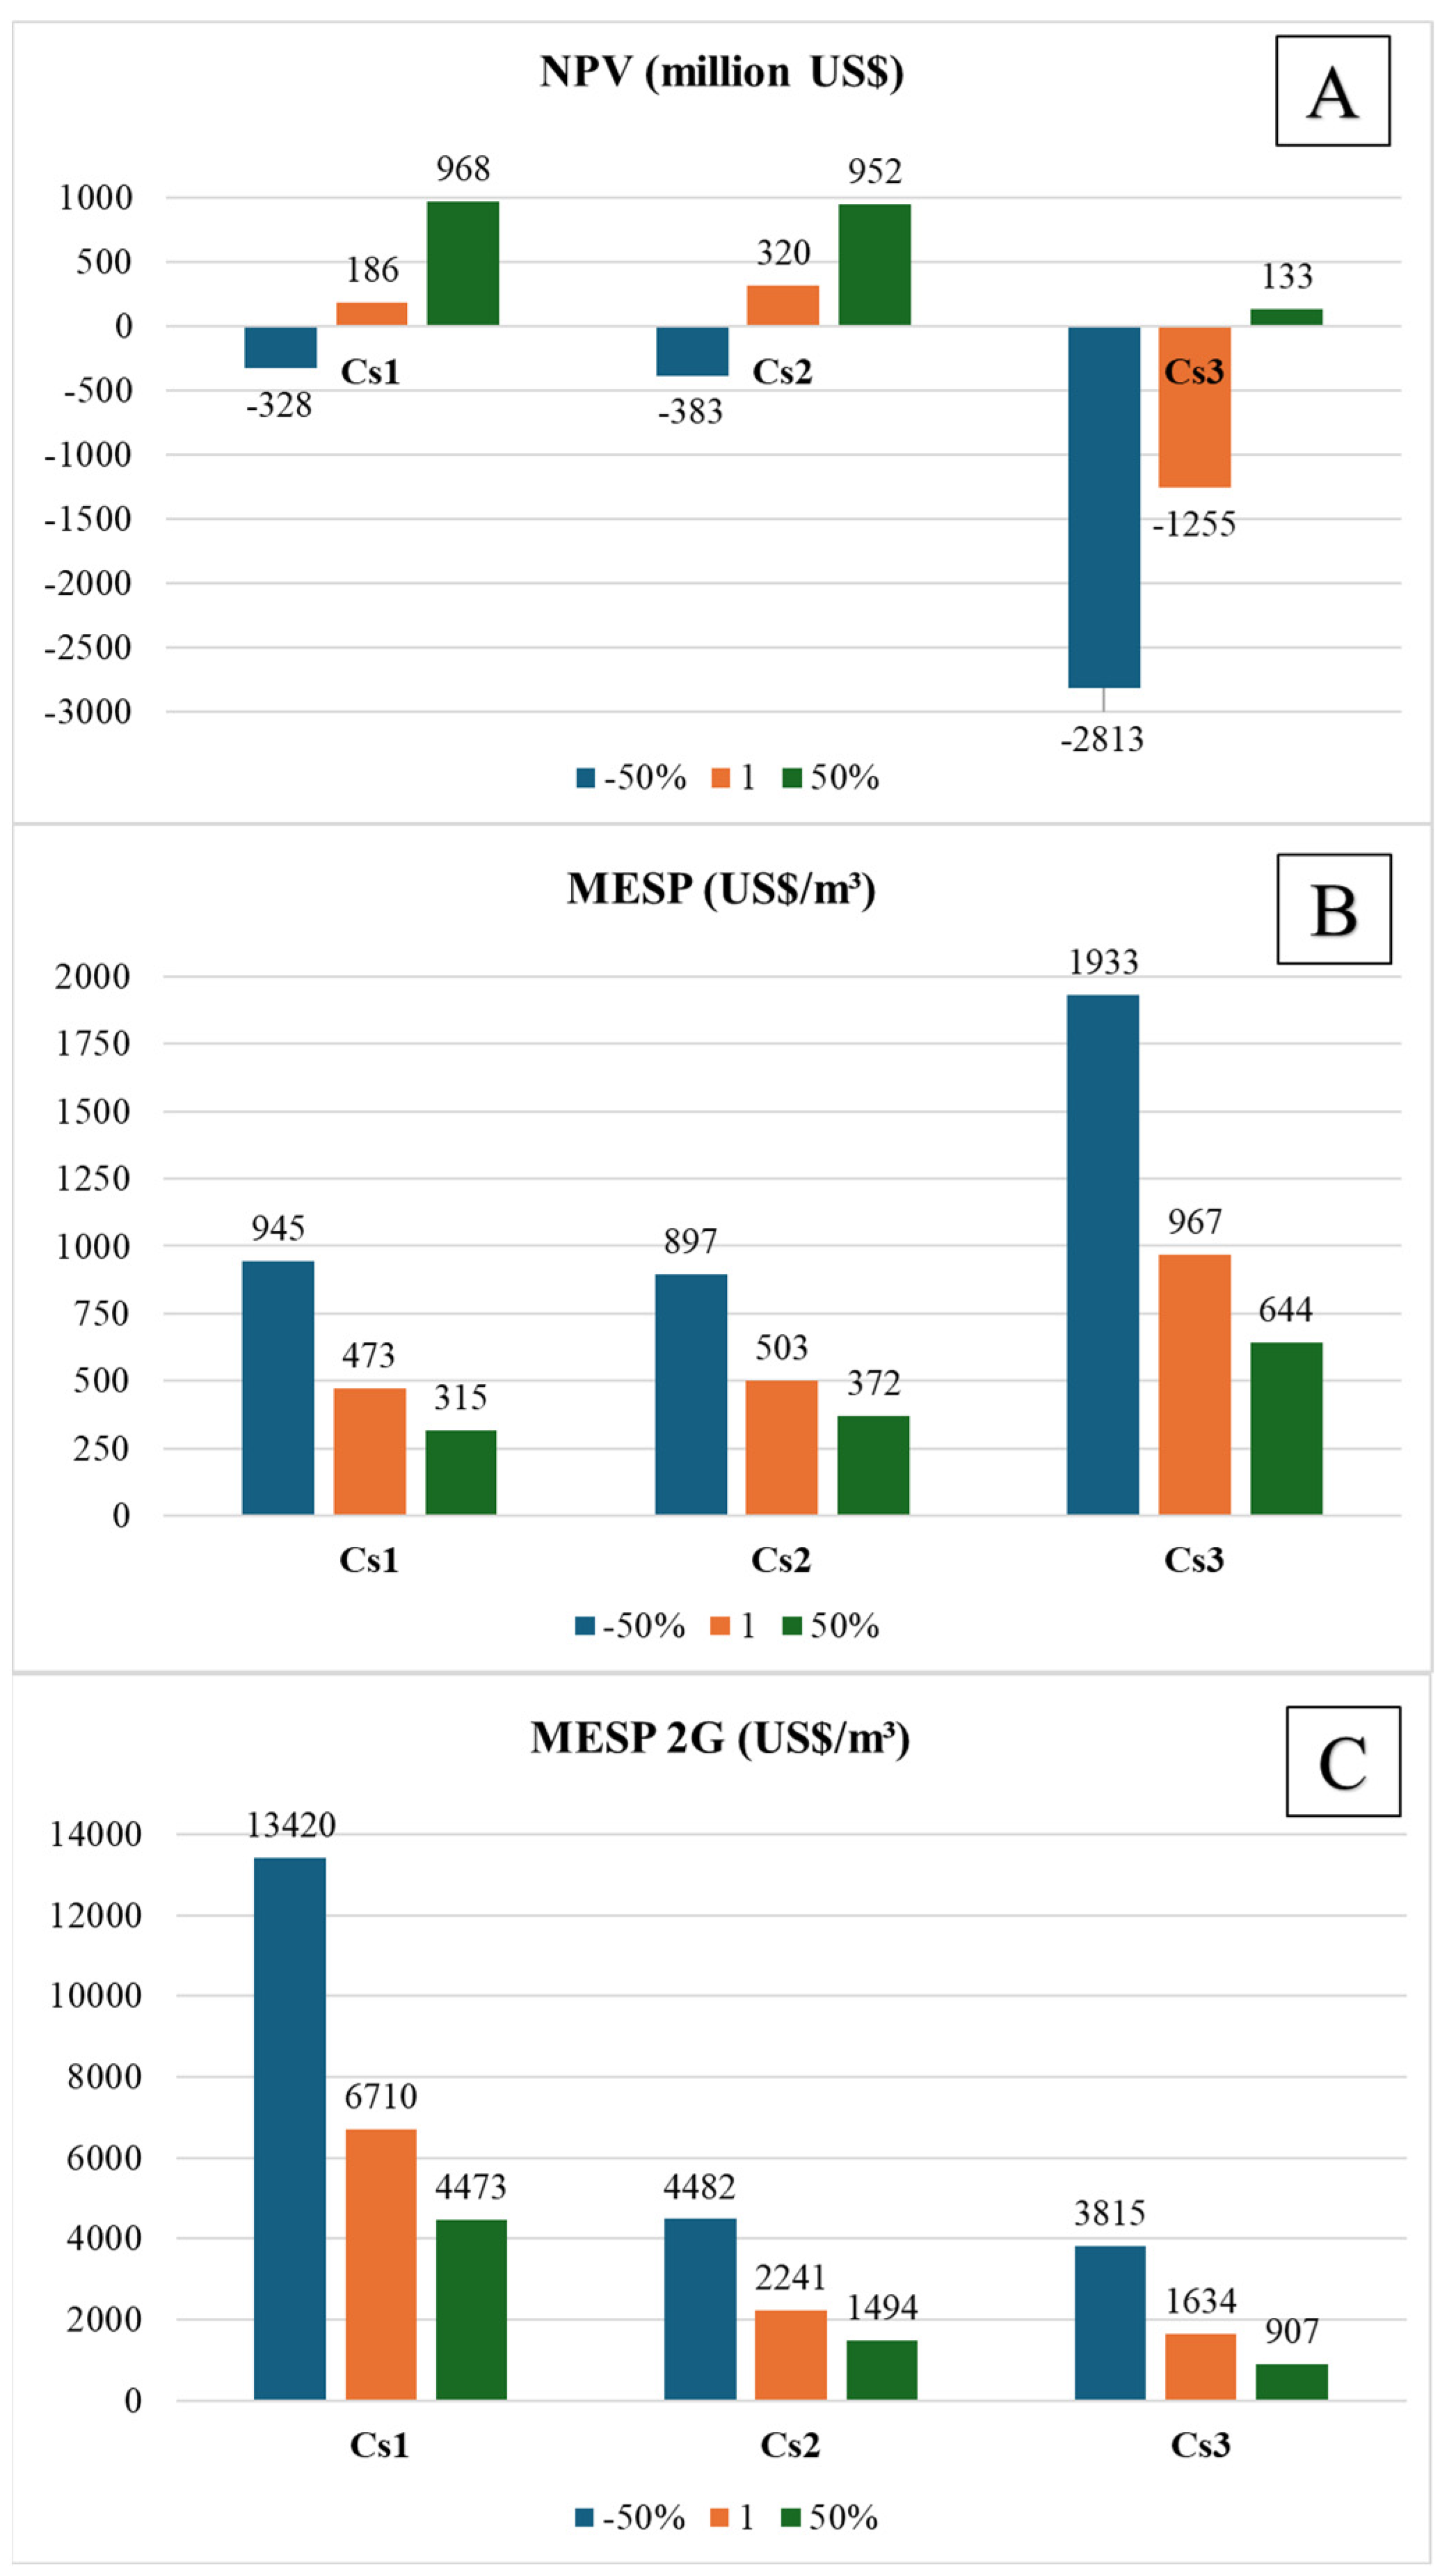
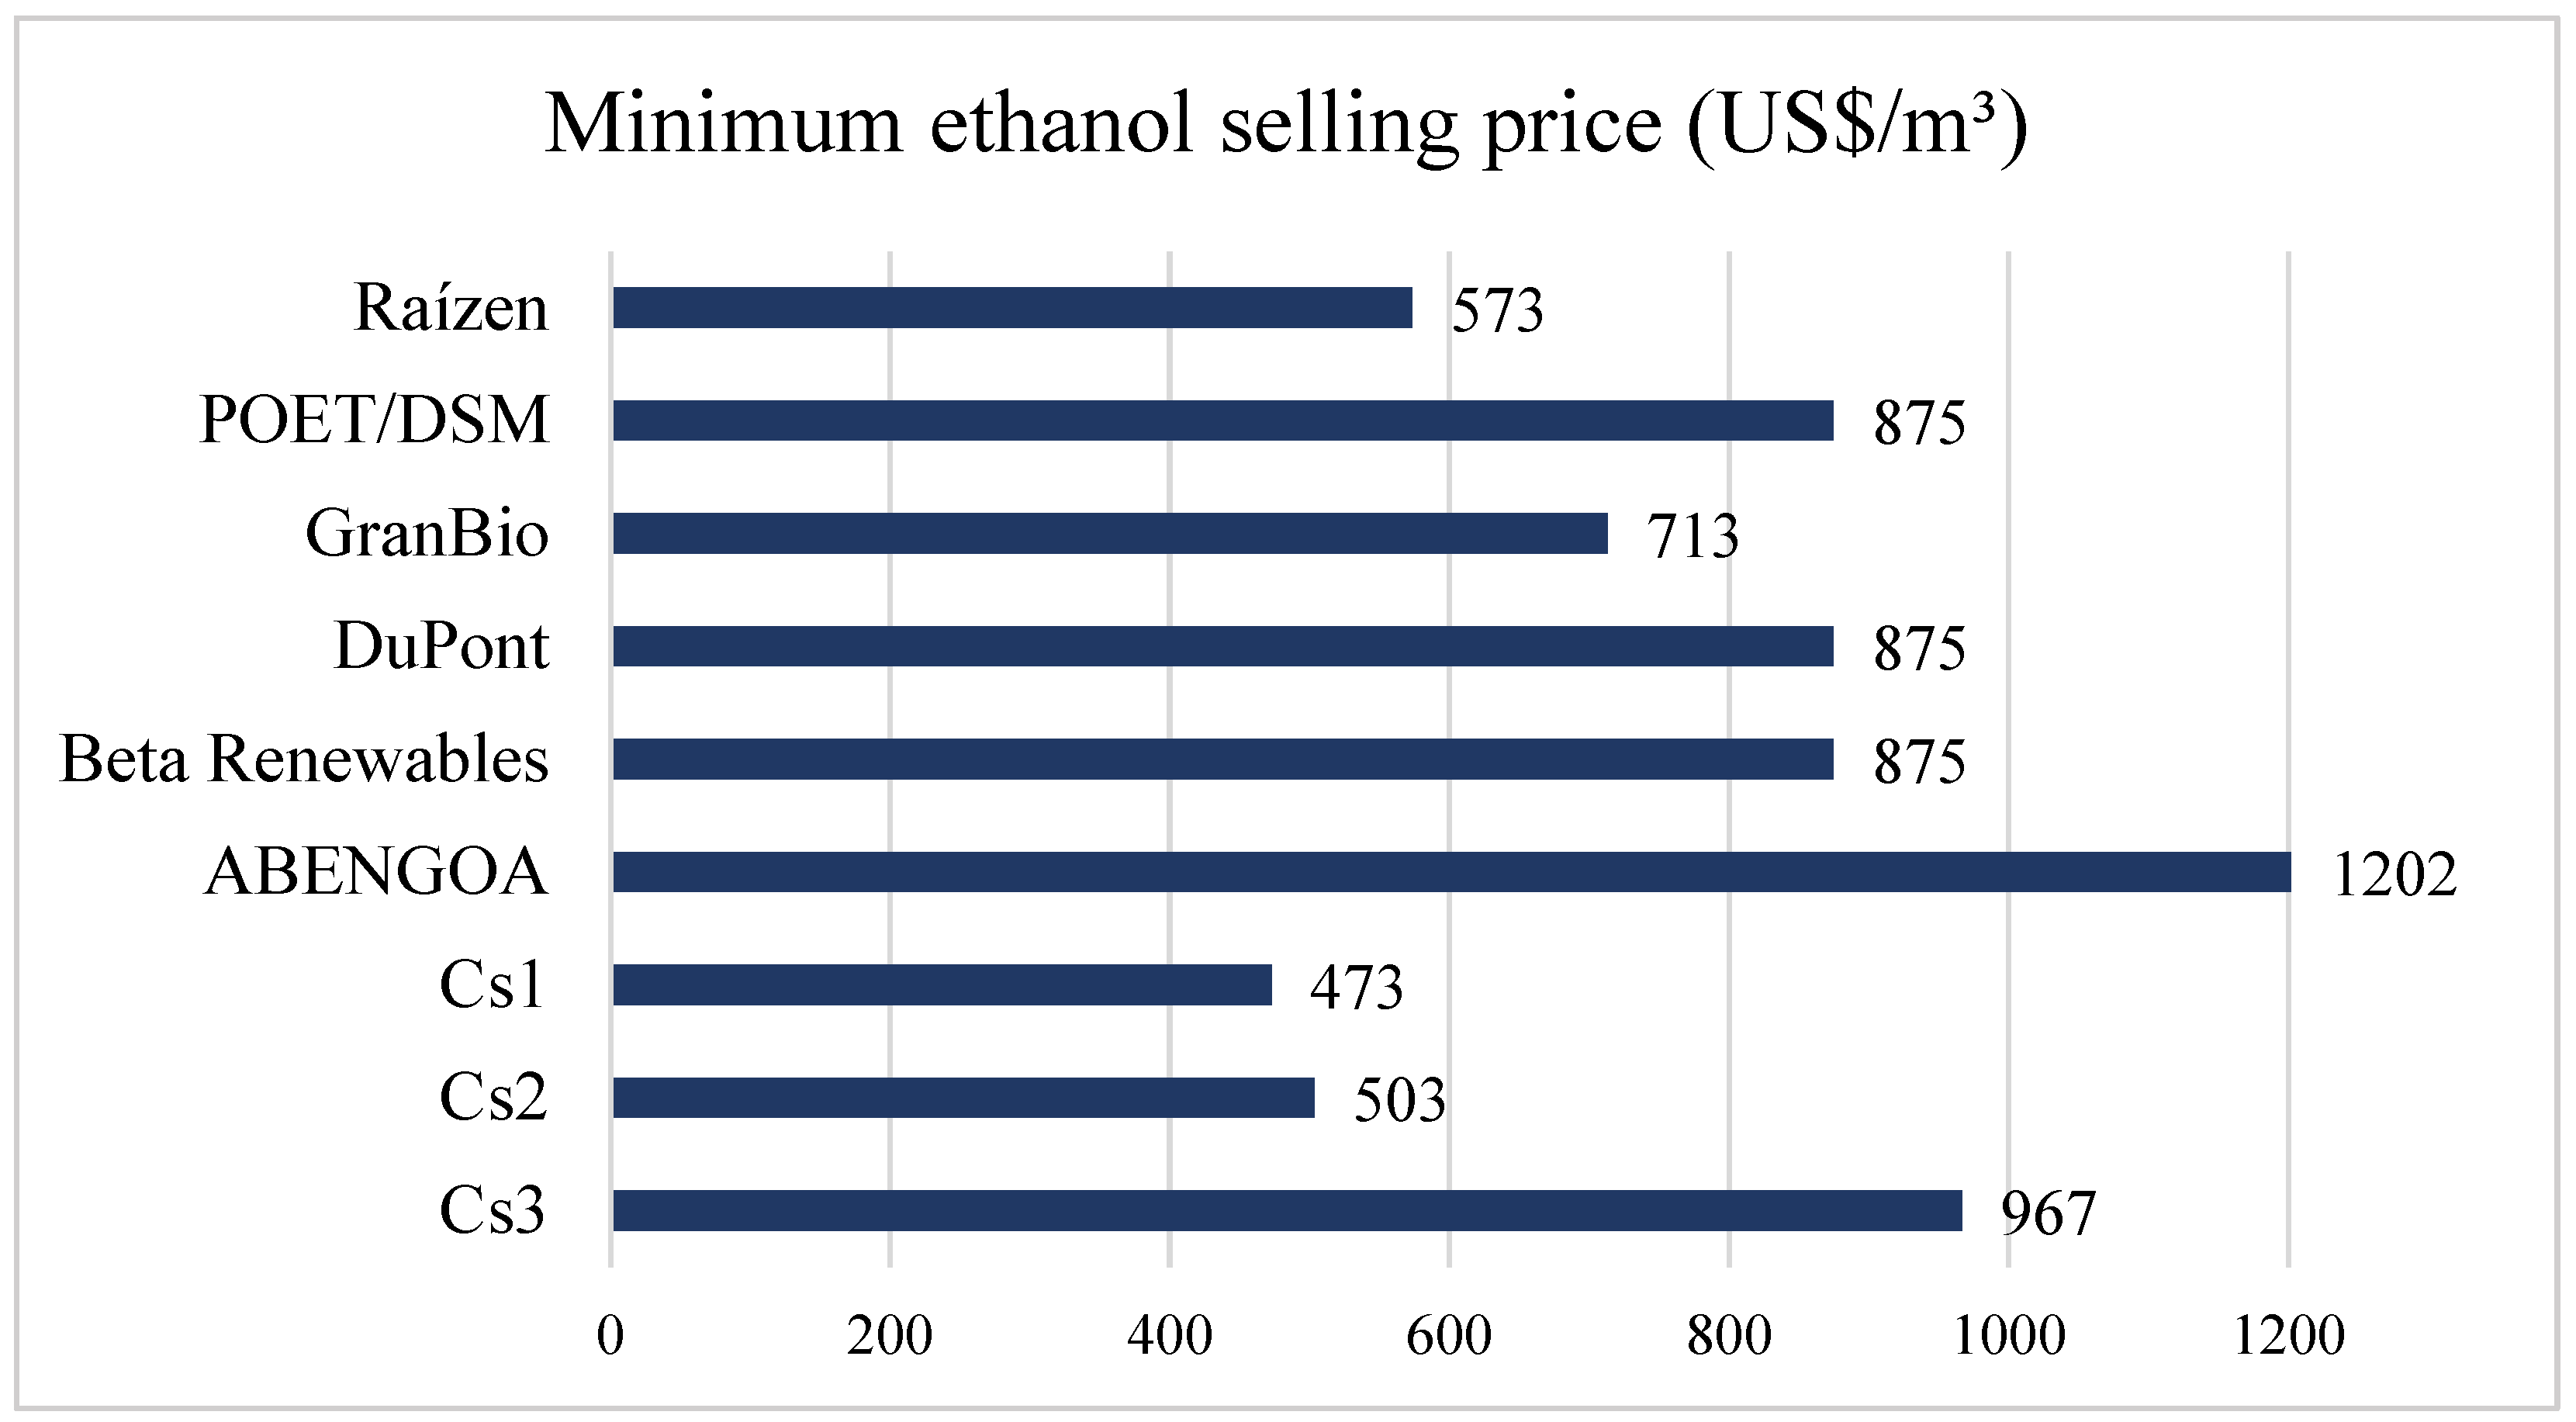
3.1. Economic Assessment

The economic evaluation was conducted to assess the feasibility of the different integrated biorefineries proposed. The main results of each case study are summarized in Table 2, where Cs1 and Cs2 present a positive economic performance, indicating that the integrated ethanol production process is a viable industrial option. It can also be observed that the Cs2 case shows a better economic performance than Cs1. The Cs2 case study has a NPV of 320 million dollars, 71.9% higher than Cs1, and 15.8% higher than the CsB base case. While Cs1 has an NPV of 186.13 million dollars, 8.2% higher than the CsA baseline. In contrast to these results, the Cs3 shows the worst economic performance among the three integrated case studies, with a negative NPV of 1254.91 million dollars, the third largest industrial investment, and the highest operating cost of this case study.
The industrial investment required for the integrated ethanol production process proposed is estimated at 189.60 million dollars for Cs1, 167.19 million dollars for Cs2, and 187.65 million dollars for Cs3. These values represent an increase in industrial investment from the base case study of 2.6%, 9%, and 22,3% for Cs1, Cs2, and Cs3, respectively. The cogeneration system is the main contributor to industrial investment in all case studies: 44.8% in the Cs1 case, 50% in the Cs2 case, and 41.4% in the Cs3 case. These values, although lower than the base scenarios, represent the high thermal demand of the plant (highlighted by the increase in steam consumption of 6 and 2.5 bar) and the lower electricity production (due to the lower amount of low-pressure steam not used in the process and the lower availability of bagasse in cogeneration system). The concentration and 1G fermentation sector correspond to the second largest contribution to the industrial investment in cases Cs2 and Cs3, respectively. In the Cs1 case, the sugar production sector is the second largest contributor to industrial investment with 27.3%, which is related to the equipment (and facilities) used in the sugar production stage.
Cs2 and Cs3 show similar estimated industrial investment in almost all stages of the industrial processes, except for the concentration and fermentation in the 1G sector and 2G fermentation stage. The first is related to the lower amount of 1G ethanol produced with sugarcane juice, which reduces the industrial investment in this stage by 32% (compared to the base scenario and Cs3). The purchase of molasses in the Cs3 resulted in a 27.4% increase in the 2G fermentation sector industrial investment and a 7.6% reduction in the cogeneration system compared to Cs2 since there are no sugar and molasse production units.
In terms of operational costs, the raw materials followed by labor and plant overhead are the main contributors to the operational expenditures. Among the raw materials, sugarcane stands out as one of the most important in the biorefinery, representing 40% of the operating costs in Cs1, 43% in Cs2, and 11% in Cs3 cases (Table 2). When comparing the integrated cases, the Cs3 has a raw material cost four times higher than the other case studies due to the purchase of molasses, which represents 72% of all raw materials and 56.3% of operating costs. These results show how much sugarcane and molasses influence the operating costs of a biorefinery.
Analyzing the revenues of integrated biorefineries, Cs1 presents sugar as the main revenue-generating product of the plant with 52% of sales, followed by ethanol (37%), electricity (9%), and CBIO (2%). This can be attributed to the valuation of sugar on the international market and the high demand for it. As a result, the price of sugar rises, which increases the product profitability in the biorefinery. In contrast, in the other integrated scenarios, ethanol is the main revenue-generating product for biorefineries, accounting for 89% of sales in Cs2 and 95.7% in Cs3. This underscores the importance of increasing ethanol productivity in biorefineries as a way to increase revenues and reduce ethanol production costs.
Observing the economic performance of the integrated case studies, Cs1 and Cs2 show a significant increase in ethanol production (as previously seen in the technical analysis, Table 1) and an improvement in the minimum selling price (MESP) to the base case studies, changing from 476.71 USD/m3 to 471.92 USD/m3 in Cs1 and from 511.08 USD/m3 to 503.15 USD/m3 in Cs2. The MESPs obtained in these scenarios are lower than the average ethanol price assumed in this work (673.48 USD/m3), highlighting the promising results of 1G2G integration. The Cs3, on the other hand, exhibits a 43.5% higher MESP (966.53 USD/m3) than the average ethanol prices and 89% higher than the CsB base case (511.08 USD/m3). Despite the similarity with Cs2, which has the same configuration except for the molasses production, the results of Cs3 highlighted that molasses purchase, even if it increases the ethanol production capacity, is not an industrially viable option. The high acquisition cost (610.56 USD/m3) influenced the negative economic performance of the biorefinery. As shown in the sensitivity analysis (Figure 3C), a 50% reduction in the value of the raw materials in this case study would be enough to make the Cs3 case study feasible, with an MESP of 555.14 USD/m3.
As seen in the economic sensitivity analysis of the integrated scenarios (Figure 3), the MESP is influenced by several variables with OPEX, raw materials, industrial investments, and sugarcane being the main variables that directly affect the economic feasibility of the biorefinery. OPEX has the greatest impact on MESP in the scenarios evaluated. In case study Cs1, the price of sugar is the second most influential variable on MESP, while in case study Cs3, the price of molasses is the second most influential variable. As OPEX increases, the MESP also increases because all of the costs associated with operating the biorefinery are reflected in the final price of the ethanol. Industrial investment, an important variable in the CAPEX, also has a considerable impact on MESP.
When comparing the integrated scenarios based on the values obtained in MESP 2G (Figure 4) (through the variation in MESP values), Cs3 shows the best results in the sensitivity analysis of the economic performance in almost all variations in the ethanol sales price. This contrasts with Cs1 and Cs2 case studies, which require an ethanol price increase of more than 122% to be economically viable.
Comparing the MESP values obtained in the simulations of the integrated case studies (Cs1, Cs2, and Cs3) with six operating cellulosic ethanol plants in the world (Figure 5) (without evaluating the plant configurations, processes, and raw materials used but only examining ethanol prices in general), it can be observed that the integrated case studies Cs1 and Cs2 obtained the lowest ethanol-selling prices, while for Cs3, MESP was 13.4% higher than the average price of the operating plants (852.05 USD/m3) and 24.4% lower than ABENGOA. In relation to the Brazilian plants (Raízen and GranBio), the Cs1 case study proposed by Perez et al. [33] stands out with the lowest price of 1G2G ethanol, 17% lower than Raízen, and 34% lower than GranBio [71].
As can be seen in Figure 4, the MESP of 2G ethanol produced in the stand-alone mode was higher than that of the 1G2G-integrated process, due to the complexity of its production process. This process is more costly (due to the numerous steps to transform lignocellulosic biomass into ethanol) and still faces challenges on an industrial scale (despite having 2G plants in operation), which makes it difficult to reduce prices. In the 1G2G-integrated process, the production of 1G ethanol provides inputs, raw-materials, utilities, infrastructure, and waste that can be used in the production of 2G ethanol, sharing costs, and reducing the overall costs of the 2G stage.
In this sense, the economic results show that the integration of 1G with 2G processes (as proposed by Perez et al. [33]) for ethanol production is a promising option to achieve the viability of the 2G process, support the industrial development of biorefineries, and increase the implementation of 2G processes.
Therefore, the advances in the 2G technology showed a process with positive economic performance, demonstrating that this biofuel can be feasible. Advances in biomass pretreatment and fermentation efficiency have significantly improved conversion rates while reducing production costs. Additionally, the process integration with the use of molasses, a by-product of the biorefinery, and the energy optimization have further enhanced economic feasibility, allowing for the competition of 2G ethanol with fossil fuels and 1G biofuels.
The integration of 1G and 2G ethanol production offers a number of long-term economic and operational benefits, including greater production efficiency through more extensive use of sugarcane, resulting in higher ethanol production without the need to expand planting areas [44]. Power cogeneration from bagasse and straw also helps reduce operating costs by making plants self-sufficient in electricity and steam, reducing dependence on external energy sources [72]. The portfolio products diversification is also attractive, as the biorefinery can generate income from surplus electricity, sugar, and carbon credits alongside ethanol.

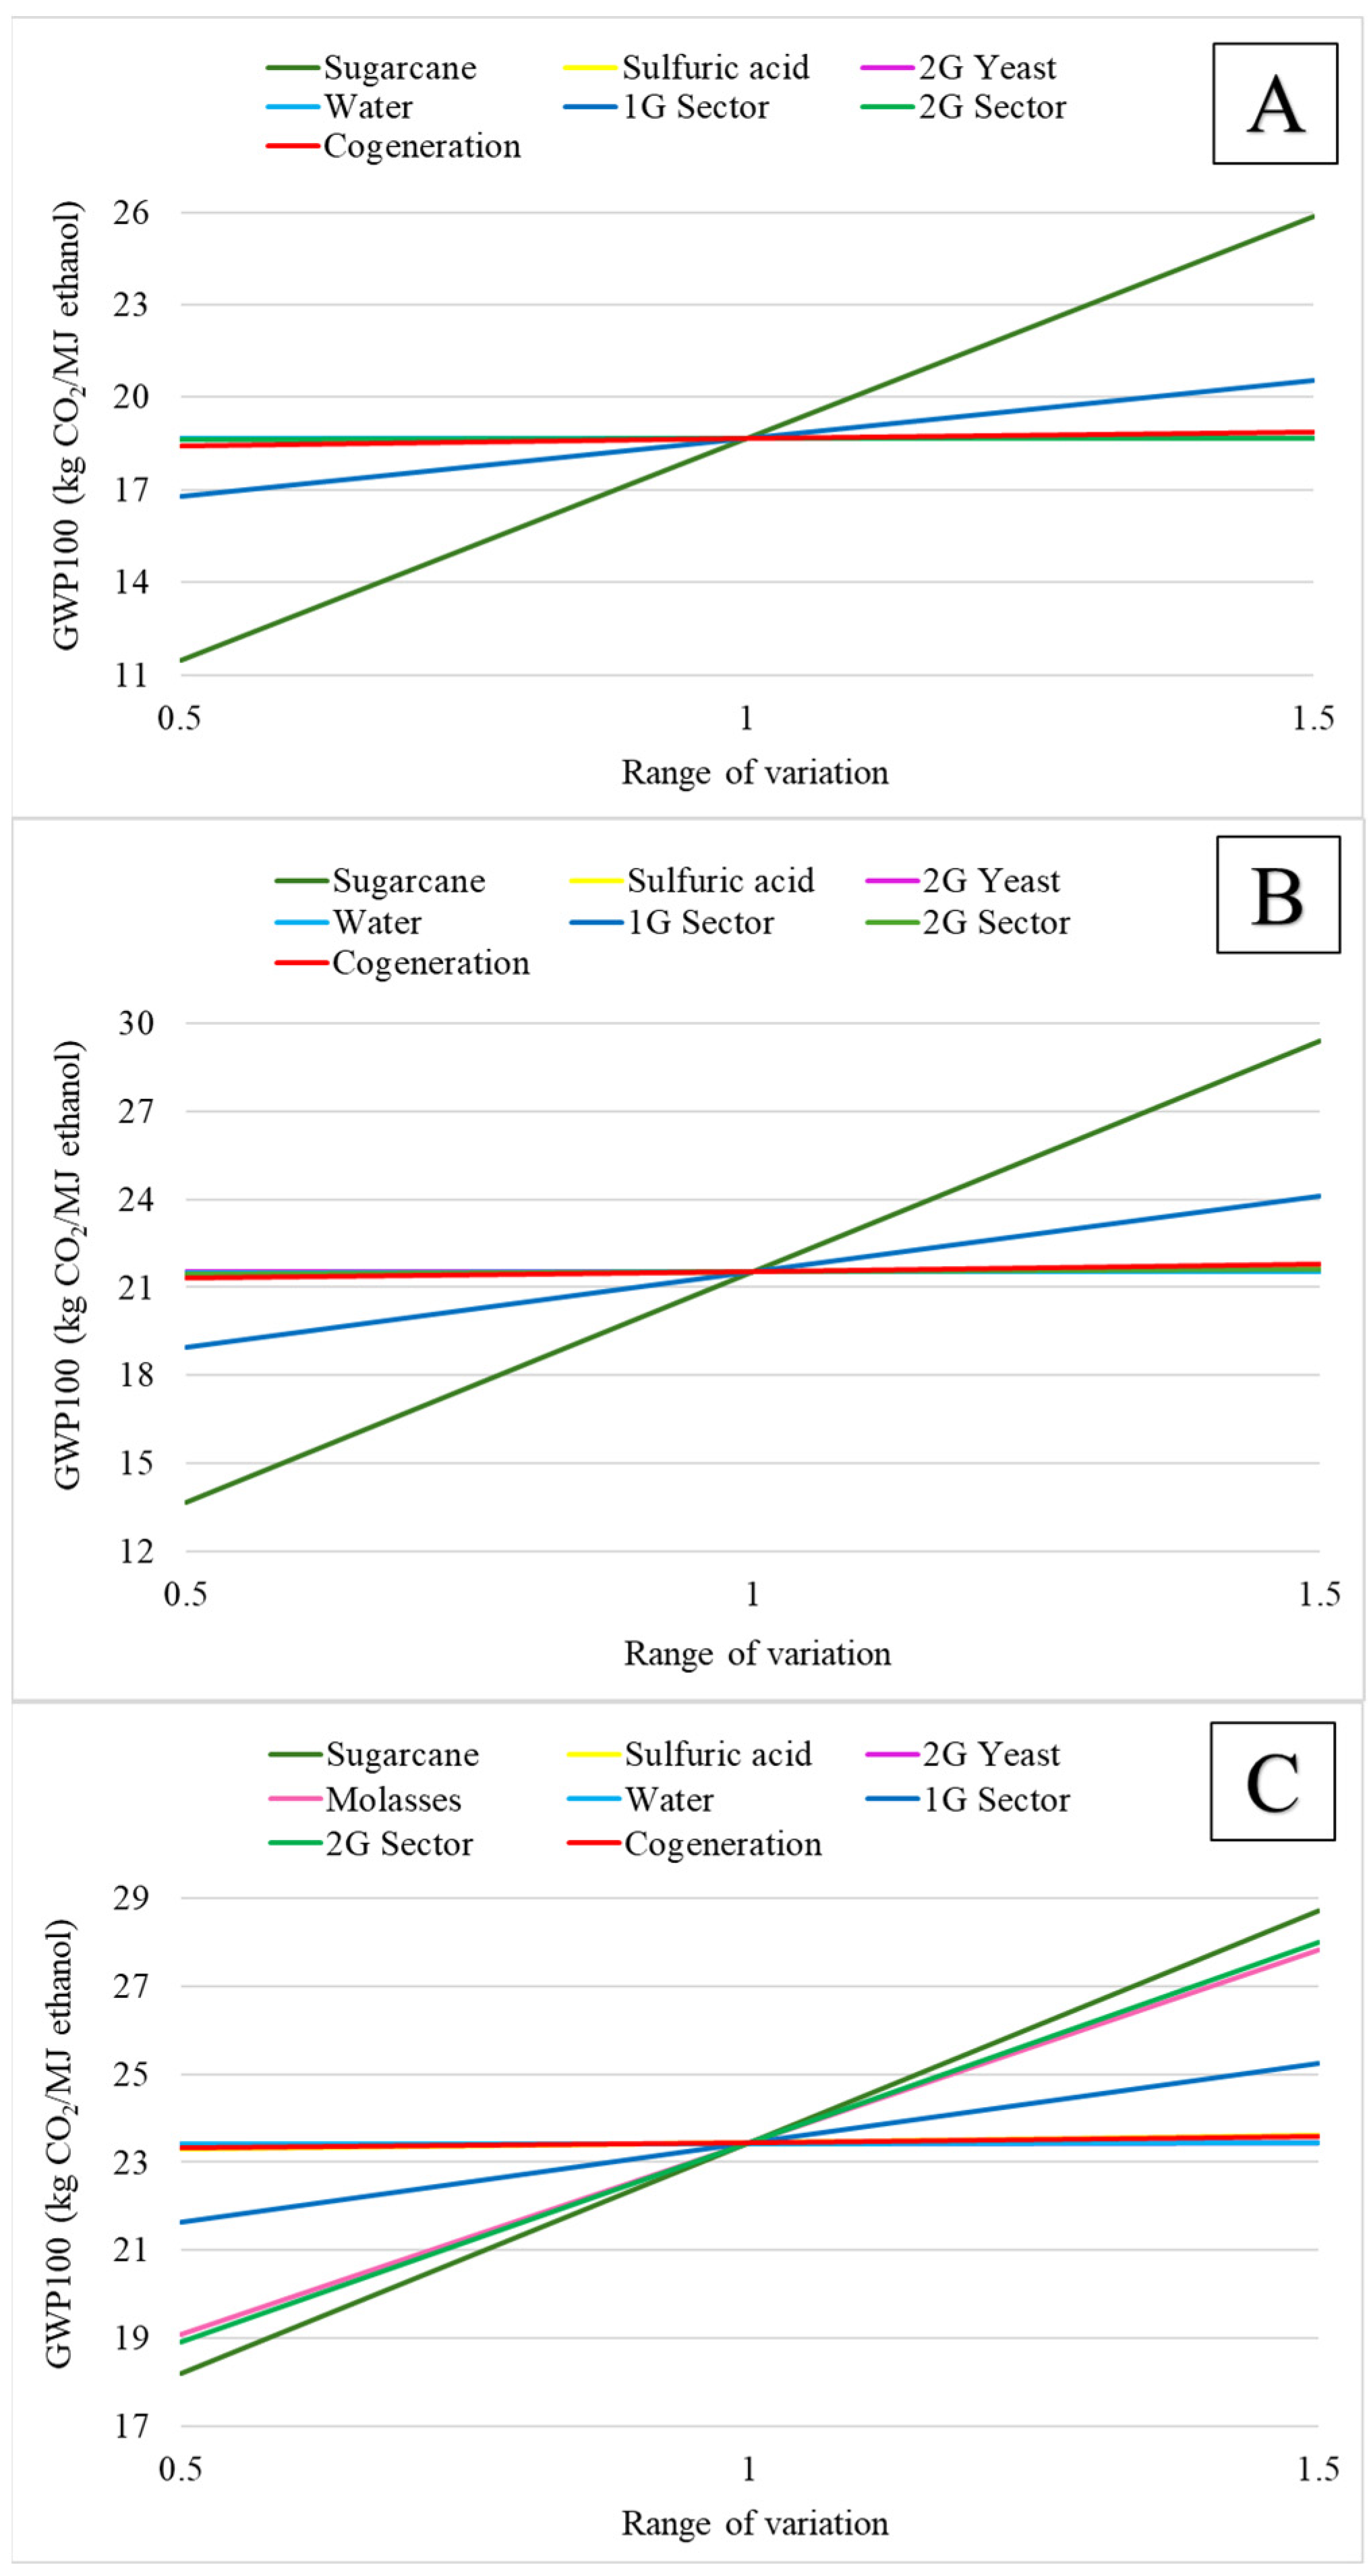
3.2. Environmental Assessment

The environmental results considering energetic allocation are presented in Table 3, where the energy allocation factors were calculated according to the products (ethanol, electricity and sugar) for each simulation to obtain a comparative environmental assessment. The total energy produced in each scenario of this work corresponds to the sum of energy from ethanol (considering LCV: 28.2609 MJ/kg [73]), sugar (LCV: 16.19 MJ/kg [73]) and electricity. The ethanol production corresponds to 38% of the total energy produced in the Cs1 case study, 83% in the Cs2 case study, and 90% in the Cs3 case study. These results are consistent with the technical analysis (Section 3.1), which showed an increase in ethanol and sugar production and a decrease in electricity production in the integrated case studies. In general, the integrated processes have a higher GWP footprint than the base case. The integration of 2G production into the 1G biorefinery increased the GWP from 2.4% (Cs1) to 10% (Cs3). The 2G process requires large amounts of steam, uses 2G solids as boiler fuel, and increases emissions from the cogeneration, distillation, and fermentation sectors. In addition, 2G processes use higher amounts of industrial chemical inputs: sulfuric acid in pretreatment and nutrients, chemicals, and yeast for immobilization and subsequent fermentation.
Between the integrated cases studied, Cs1 and Cs3 show the best environmental performance compared to their baseline scenarios. Cs1 reduces three of the environmental impact categories, GWP100, AD, and EU. These environmental impact categories represent the reduction in atmospheric emissions from the burning of bagasse in the biorefinery’s cogeneration system due to the reduced electricity generation (result proven in the technical analysis). The other categories, with values higher than CsA, are related to the addition of the 2G sector in the biorefinery, using sulfuric acid as an input in the acid pretreatment stage; the MAET impact category is because of the emission of gases from cogeneration system (electricity and steam production), as the pretreated solids are used as a boiler fuel. The Cs3 case study shows a reduction in almost all impact categories except the GWP100 and PO categories. GWP100 is related to atmospheric emissions from the 2G distillation and fermentation sectors due to the increase in ethanol production, while the PO category is related to the use of sulfuric acid in acid pretreatment.
Cs2 has the worst environmental performance, with all impact categories higher than the CsB baseline case. These values reflect the addition of the 2G sector and molasses production in the biorefinery, which requires large amounts of steam, uses 2G solids as boiler fuel, and increase the emissions from the cogeneration, distillation, and fermentation sectors. Sugarcane is the most important variable affecting the environmental performance (Figure 6) in all case studies due to the use of fossil fuels and fertilizers used in the agricultural operations, as supported by the literature [16,40].
The second main contributor to the environmental burden is the 1G process (for the Cs1 and Cs2 case studies). The industrial inputs of the 1G process are sulfuric acid, ammonia, phosphoric acid, calcium hydroxide (lime), and mono ethylene glycol (MEG) used especially in the purification stages (distillation and dehydration sector). Sulfuric acid is used in the acid treatment performed during yeast recycling to minimize or eliminate bacterial contamination of the fermentation process. Ammonia is used in the fermentation step (in stoichiometric balance). Phosphoric acid is the chemical used to increase the phosphate content of sugarcane juice and improve the clarification process (1G process step). Calcium hydroxide is used to neutralize the organic acids present in sugarcane juice in the juice treatment step, and MEG is used in the purification stage, as an extraction agent in dehydration columns.
In addition to sugarcane, the 2G sector is the most important variable affecting environmental performance in the Cs3 case study. The industrial inputs used in the 2G sector are sulfuric acid, water, calcium alginate, NaOH, calcium chloride, molasses, and yeast. Sulfuric acid is used in the acid pretreatment of bagasse to release the fermentable sugars. Water is used to dissolve the sulfuric acid in the pretreatment process. Calcium alginate is used in the immobilization process to encapsulate the yeast in beads for reuse and cell protection. Calcium chloride aids in the yeast immobilization process by inducing gelation of the alginate. Sodium hydroxide is used to neutralize the acids from the pretreatment process and to adjust the pH of the medium prior to the fermentation process. Recombinant yeasts are the essential microorganisms for the conversion of sugars to ethanol. Molasses are one of the main carbon sources for yeast in fermentation and is purchased in large quantities in this case study. Therefore, all impacts related to molasses (from sugarcane cultivation to transportation to the biorefinery) contributed to the increase in the environmental impact of ethanol production, mainly in the 2G sector (Figure 6C) compared to the other case study.
The Environmental Impact Score (Figure 7) simplifies the comparison process by standardizing different variables and dimensions into a common framework. This metric enables straightforward comparisons between different criteria or dimensions of the LCA.
In general, besides the addition of the 2G sector leading to an increase in emissions in almost all environmental impact categories (Table 3), the integrated scenarios Cs1 and Cs3 showed a promising environmental score, being significantly superior than CsB and similar to the environmental performance of CsA base cases. The Cs2 case study, on the other hand, received the worst score compared to the other scenarios (including the baseline case studies). This indicates that the addition of the 2G sector and molasses production without an annexed sugar production process in the 1G plant had an effect on the emission of pollutants to the environment, representing an 3% higher impact than the base scenario (CsB base case), which is the scenario with the second worst environmental performance. For the Cs1 case, although it is similar to the CsA base case (its score is less than 2% higher than CsA), it is the second highest score among the integrated scenarios, showing an interesting environmental performance. Finally, Cs3 obtained the best score among all the ethanol production scenarios (Figure 7). This indicates that, in terms of environmental analysis, this scenario was able to produce 2G ethanol with the same environmental performance of 1G ethanol. Thus, Cs3 stands out as an interesting scenario from an environmental point of view to be explored in the Brazilian ethanol production sector. Despite the environmental results, Cs3 is still an economically unfeasible scenario for implementation, requiring process improvements capable of making it economically interesting.
The process developed by Perez et al. [33] achieved interesting economic values compared to other 2G processes evaluated in the literature. Most importantly, it was possible to increase ethanol production per ton of sugarcane processed without a decrease in the sustainability of the process. Considering an industrial plant that co-produces ethanol and sugarcane (CsA), scenarios Cs1 and Cs3 had similar environmental performances but with higher ethanol production (3.4-fold higher in the case of Cs3) (Table 1). However, considering only the GWP emission, there is still a need to improve process sustainability to achieve lower values compared to 1G processes. In this sense, the development of efficient alternative pretreatment procedures that do not use sulfuric acid is of major environmental importance for the 2G technology. The acid pretreatment is extensively reported to release efficiently xylose monomers from hemicellulose [74,75], while other pretreatments, such as hydrothermal, generally can lead to hemicellulose solubilization in the form of xylooligomers due to its milder severity factor [31], compounds that are not assimilated by microorganisms, which makes the establishment of a pretreatment that reaches high xylose titers without using sulfuric acid an important task. Elias et al. [54] considered a scenario where part of hemicellulose was converted into monomers in the hydrothermal pretreatment and achieved interesting environmental indicators; however, this achievement has not been reported experimentally for sugarcane bagasse in the literature so far. On the other hand, the yeast pretreatment traditionally performed with sulfuric acid in 1G fermentation is crucial to eliminate contamination problems [76]. The replacement of sulfuric acid in this step has gained attention, not only due to environmental concerns but also due to economic insecurities, e.g., sulfuric acid prices increased by about 1.665% in 2021 due to the pandemic [77]. In addition, the use of recombinant yeast strains capable of producing and secreting cellulolytic enzymes [78] poses a promising alternative to improve the sustainability of the proposed 1G2G-integrated process and further increase biomass utilization without the need of a highly severe pretreatment for biomass solubilization.
Although the Cs1 case study still has room for improvement, especially in terms of environmental performance, the integration of 1G2G adds flexibility and therefore reliability to the system compared to the traditional plants. In addition, the highest utilization of biomass feedstock by the recombinant yeast (which efficiently assimilates xylose and sucrose at the high concentration provided by molasses) makes this strategy outstanding compared to 1G2G studies in the literature.
On the other hand, the integrated production of 1G/2G ethanol offers significant long-term environmental benefits in line with global sustainability goals. The production of 2G ethanol contributes to a significant reduction in CO2 emissions, helping to combat climate change. According to Junqueira et al. [44], the production of 2G ethanol can reduce greenhouse gas emissions by more than 80% compared to gasoline. In addition, the better use of biomass, with the use of sugarcane bagasse and straw, reduces agricultural waste, helps the plant to be energy-self-sufficient, and is less dependent on external energy sources. The process also has a reduced impact on land use, promoting more sustainable agriculture.

4. Conclusions

The economic and environmental benefits of integrating the 1G and 2G processes for ethanol production were evaluated in this work. The economic viability of the 2G process is confirmed in scenarios Cs1 and Cs2. For case study Cs3 to be profitable, the selling price of ethanol must increase by 43.5% compared to the average 1G ethanol price. From an environmental point of view, by integrating 2G ethanol production using recombinant immobilized cells, it was possible to increase ethanol production per ton of sugarcane processed without decreasing the environmental performance of the process. Cs3 had the best environmental impact score of all the scenarios considered in this work. Therefore, it is important to emphasize that the development of technologies that reduce the use of polluting inputs or that use less costly inputs are crucial alternatives to achieve sustainability and a scalable technology.

Supplementary Materials

The following supporting information can be downloaded at https://www.mdpi.com/article/10.3390/fermentation11030116/s1: Table S1: Main process parameters used in the simulation of the sugarcane biorefinery; Table S2: Main process inputs of economic assessment of 1G2G biorefinery; Table S3: Main inventories used during the life cycle assessment of the 1G2G biorefinery; Table S4: Ranges of the process variables used for economic sensitivy analysis in Cs1 case study; Table S5: Ranges of the process variables used for economic sensitivy analysis in Cs2 case study; Table S6: Ranges of the process variables used for economic sensitivy analysis in Cs3 case study; Table S7: Range of the process variables used for envorinmental sensitivity analysis in Cs1 case study; Table S8: Range of the process variables used for envorinmental sensitivity analysis in Cs2 case study; Table S9: Range of the process variables used for envorinmental sensitivity analysis in Cs2 case study. References [79,80,81,82,83,84,85,86,87,88,89,90] are cited in the Supplementary Materials.

Author Contributions

Conceptualization: T.S.M. and A.A.L.; methodology: A.A.L., A.M.E. and F.F.F.; software: L.P.P., A.A.L. and A.M.E.; validation: L.P.P., A.A.L. and A.M.E.; formal analysis: T.C.Z., R.d.C.G. and T.S.M.; investigation: L.P.P., C.L.P. and L.P.R.d.C.P.; resources: R.d.C.G. and T.S.M.; writing—original draft preparation: L.P.P.; writing—review and editing: A.A.L., A.M.E., T.C.Z., F.F.F., R.d.C.G. and T.S.M.; visualization: C.L.P., L.P.R.d.C.P. and F.F.F.; supervision: T.C.Z., R.d.C.G. and T.S.M.; project administration: R.d.C.G. and T.S.M.; funding acquisition: R.d.C.G. and T.S.M. All authors have read and agreed to the published version of the manuscript.

Funding

This research was funded by FAPESP (São Paulo State Research Foundation, Brazil), for the financial support (grant #2016/10636-8, #2019/15851-2, #2020/15450-5, and #2022/10900-8), ANP (Brazilian National Agency of Petroleum, Natural Gas and Biofuels) (grant number PRH-ANP n°46.1) and CNPq (National Council for Scientific and Technological Development, Brazil, grant #152289/2022-4). This study was financed in part by the Coordenação de Aperfeiçoamento de Pessoal de Nível Superior—Brasil (CAPES)—Finance Code 001.

Institutional Review Board Statement

Not applicable.

Informed Consent Statement

Not applicable.

Data Availability Statement

Data are contained within the article and Supplementary Materials.

Acknowledgments

The authors thank to FAPESP (São Paulo State Research Funding Agency, Brazil), for the financial support (grant #2016/10636-8, #2019/15851-2, #2020/15450-5, and #2022/10900-8), ANP (Brazilian National Agency of Petroleum, Natural Gas and Biofuels) (grant number PRH-ANP n°46.1) and CNPq (National Council for Scientific and Technological Development, Brazil, grant #152289/2022-4). This study was financed in part by the Coordenação de Aperfeiçoamento de Pessoal de Nível Superior—Brasil (CAPES)—Finance Code 001.

Conflicts of Interest

The authors declare no conflict of interest.

References

  1. IPCC. Summary for Policymakers. In Global Warming of 1.5 °C; Cambridge University Press: Cambridge, UK, 2022; pp. 1–24. [Google Scholar]
  2. Greenberg, M.R. Center for Geoeconomic Studies. Oil Price Volatility: Causes, Effects, and Policy Implications. 2016. Available online: https://www.cfr.org/report/oil-price-volatility-causes-effects-and-policy-implications (accessed on 1 February 2025).
  3. Min, H. Examining the Impact of Energy Price Volatility on Commodity Prices from Energy Supply Chain Perspectives. Energies 2022, 15, 7957. [Google Scholar] [CrossRef]
  4. Du, X.; Ouyang, T.; Shi, G.; Deng, L.; Gul, R. Role of Oil Price Volatility, Energy Efficiency, and Financial Stability on Sustainable Energy Production. Front. Environ. Sci. 2022, 10, 977733. [Google Scholar] [CrossRef]
  5. Lup, A.N.K.; Soni, V.; Keenan, B.; Son, J.; Taghartapeh, M.R.; Morato, M.M.; Poya, Y.; Montañés, R.M. Sustainable Energy Technologies for the Global South: Challenges and Solutions toward Achieving SDG 7. Environ. Sci. Adv. 2023, 2, 570–585. [Google Scholar] [CrossRef]
  6. Meramo, S.; Fantke, P.; Sukumara, S. Advances and Opportunities in Integrating Economic and Environmental Performance of Renewable Products. Biotechnol. Biofuels Bioprod. 2022, 15, 144. [Google Scholar] [CrossRef]
  7. Mignogna, D.; Szabó, M.; Ceci, P.; Avino, P. Biomass Energy and Biofuels: Perspective, Potentials, and Challenges in the Energy Transition. Sustainability 2024, 16, 7036. [Google Scholar] [CrossRef]
  8. Ou, L.; Dou, C.; Yu, J.H.; Kim, H.; Park, Y.C.; Park, S.; Kelley, S.; Lee, E.Y. Techno-Economic Analysis of Sugar Production from Lignocellulosic Biomass with Utilization of Hemicellulose and Lignin for High-Value Co-Products. Biofuels Bioprod. Biorefining 2020, 15, 404–415. [Google Scholar] [CrossRef]
  9. Souza, G.M.; Maciel Filho, R.; Nogueira, L.A.H.; Cantarella, H.; Rossetto, R.; Canabarro, I.; Silva-Ortiz, P.; Silva, J.F.L. Biofuels in Emerging Markets: Potential for Sustainable Production and Consumption; IEA Bioenergy: Rotorua, New Zealand, 2023. [Google Scholar]
  10. CONAB. Acompanhamento Da Safra Brasileira de Cana-de-Açúcar—Safra 2023/20224—4° Levantamento; CONAB: Brasília, Brazil, 2024.
  11. Vandenberghe, L.P.S.; Valladares-Diestra, K.K.; Bittencourt, G.A.; Zevallos Torres, L.A.; Vieira, S.; Karp, S.G.; Sydney, E.B.; de Carvalho, J.C.; Thomaz Soccol, V.; Soccol, C.R. Beyond Sugar and Ethanol: The Future of Sugarcane Biorefineries in Brazil. Renew. Sustain. Energy Rev. 2022, 167, 112721. [Google Scholar] [CrossRef]
  12. Guilherme, E.P.X.; Zanphorlin, L.M.; Sousa, A.S.; Miyamoto, R.Y.; Bruziquesi, C.G.O.; de Carvalho Mesquita, B.M.A.; Santos, S.H.S.; Aguiar-Oliveira, E.; Cota, J. Simultaneous Saccharification Isomerization and Co-Fermentation—SSICF: A New Process Concept for Second-Generation Ethanol Biorefineries Combining Immobilized Recombinant Enzymes and Non-GMO Saccharomyces. Renew. Energy 2022, 182, 274–284. [Google Scholar] [CrossRef]
  13. Iram, A.; Cekmecelioglu, D.; Demirci, A. Integrating 1G with 2G Bioethanol Production by Using Distillers’ Dried Grains with Solubles (DDGS) as the Feedstock for Lignocellulolytic Enzyme Production. Fermentation 2022, 8, 705. [Google Scholar] [CrossRef]
  14. Vasilakou, K.; Nimmegeers, P.; Thomassen, G.; Billen, P.; Van Passel, S. Assessing the Future of Second-Generation Bioethanol by 2030—A Techno-Economic Assessment Integrating Technology Learning Curves. Appl. Energy 2023, 344, 121263. [Google Scholar] [CrossRef]
  15. de Souza Queiroz, S.; Jofre, F.M.; dos Santos, H.A.; Hernández-Pérez, A.F.; Felipe, M.D.G.D.A. Xylitol and Ethanol Co-Production from Sugarcane Bagasse and Straw Hemicellulosic Hydrolysate Supplemented with Molasses. Biomass Convers. Biorefin. 2021, 13, 3143–3152. [Google Scholar] [CrossRef]
  16. Longati, A.A.; Lino, A.R.A.; Giordano, R.C.; Furlan, F.F.; Cruz, A.J.G. Biogas Production from Anaerobic Digestion of Vinasse in Sugarcane Biorefinery: A Techno-Economic and Environmental Analysis. Waste Biomass Valorization 2019, 11, 4573–4591. [Google Scholar] [CrossRef]
  17. Carpio, R.R.; de Carvalho Miyoshi, S.; Elias, A.M.; Furlan, F.F.; Giordano, R.C.; Secchi, A.R. Multi-Objective Optimization of a 1G-2G Biorefinery: A Tool towards Economic and Environmental Viability. J. Clean. Prod. 2021, 284, 125431. [Google Scholar] [CrossRef]
  18. da Silva Barreto, E.; da Fonseca, Y.A.; Adarme, O.F.H.; Silva, D.F.; Brandão, R.L.; Baêta, B.E.L.; Guimarães, V.M.; Gurgel, L.V.A. Optimization of 2G Ethanol Production from Sugarcane Bagasse: Upscaling of Soda Pretreatment with Redox Mediator Followed by Fed-Batch Enzymatic Hydrolysis and Co-Fermentation. Energy Convers. Manag. 2025, 323, 119225. [Google Scholar] [CrossRef]
  19. Fernandes Araújo, M.; Cardeal Volpi, M.P.; Mockaitis, G.; Morais Junior, M.A.; Carvalho da Costa, A.; Cândida Rabelo, S. Crude Glycerol Organosolv Pretreatment: Chain Integration for the Production of 2G Ethanol and Biogas. Fuel 2025, 379, 132984. [Google Scholar] [CrossRef]
  20. GranBio BioFlex. Available online: https://www.granbio.com.br/tecnologia/bioflex/ (accessed on 5 January 2024).
  21. Rosas-Vega, F.E.; Pozzan, R.; Martínez-Burgos, W.J.; Letti, L.A.J.; de Mattos, P.B.G.; Ramos-Neyra, L.C.; Spinillo Dudeque, G.; Amaro Bittencourt, G.; dos S. Costa, G.; Porto de Souza Vandenberghe, L.; et al. Enzymes Produced by the Genus Aspergillus Integrated into the Biofuels Industry Using Sustainable Raw Materials. Fermentation 2025, 11, 62. [Google Scholar] [CrossRef]
  22. GranBio. Individual and Consolidated Financial Statements; GranBio: São Paulo, Brazil, 2023. [Google Scholar]
  23. Raízen. The Journey. Available online: https://ri.raizen.com.br/e2g/ (accessed on 5 January 2024).
  24. Epbr. Começa a Operar Maior Usina de Etanol 2G Do Mundo. Available online: https://epbr.com.br/raizen-comeca-a-operar-maior-usina-de-etanol-2g-do-mundo/ (accessed on 5 January 2024).
  25. Raízen. Etanol de Segunda Geração: Potencial e Oportunidades. Available online: https://www.raizen.com.br/blog/etanol-de-segunda-geracao (accessed on 6 January 2024).
  26. Shibukawa, V.P.; Ramos, L.; Cruz-Santos, M.M.; Prado, C.A.; Jofre, F.M.; de Arruda, G.L.; da Silva, S.S.; Mussatto, S.I.; dos Santos, J.C. Impact of Product Diversification on the Economic Sustainability of Second-Generation Ethanol Biorefineries: A Critical Review. Energies 2023, 16, 6384. [Google Scholar] [CrossRef]
  27. Beig, B.; Riaz, M.; Raza Naqvi, S.; Hassan, M.; Zheng, Z.; Karimi, K.; Pugazhendhi, A.; Atabani, A.E.; Thuy Lan Chi, N. Current Challenges and Innovative Developments in Pretreatment of Lignocellulosic Residues for Biofuel Production: A Review. Fuel 2021, 287, 119670. [Google Scholar] [CrossRef]
  28. Hans, M.; Lugani, Y.; Chandel, A.K.; Rai, R.; Kumar, S. Production of First- and Second-Generation Ethanol for Use in Alcohol-Based Hand Sanitizers and Disinfectants in India. Biomass Convers. Biorefin. 2023, 13, 7423–7440. [Google Scholar] [CrossRef]
  29. Santana Júnior, D.B.; Kelbert, M.; De Araújo, P.H.H.; de Andrade, C.J. Application of Physical Pretreatment of Lignocellulosic Biomass to Produce Fermentable Sugars. 2025. Available online: https://sciety.org/articles/activity/10.20944/preprints202501.0170.v1 (accessed on 1 February 2025).
  30. Geng, B.; Jia, X.; Peng, X.; Han, Y. Biosynthesis of Value-Added Bioproducts from Hemicellulose of Biomass through Microbial Metabolic Engineering. Metab. Eng. Commun. 2022, 15, e00211. [Google Scholar] [CrossRef]
  31. Milessi, T.S.; Corradini, F.A.S.; Marçal, J.V.M.; Baldez, T.O.; Kopp, W.; Giordano, R.C.; Giordano, R.L.C. Xylooligosaccharides Production Chain in Sugarcane Biorefineries: From the Selection of Pretreatment Conditions to the Evaluation of Nutritional Properties. Ind. Crops Prod. 2021, 172, 114056. [Google Scholar] [CrossRef]
  32. Garcia-Ochoa, F.; Vergara, P.; Wojtusik, M.; Gutiérrez, S.; Santos, V.E.; Ladero, M.; Villar, J.C. Multi-Feedstock Lignocellulosic Biorefineries Based on Biological Processes: An Overview. Ind. Crops Prod. 2021, 172, 114062. [Google Scholar] [CrossRef]
  33. Perez, C.L.; Pereira, L.P.R.D.C.; Milessi, T.S.; Sandri, J.P.; Demeke, M.; Foulquié-Moreno, M.R.; Thevelein, J.M.; Zangirolami, T.C. Towards a Practical Industrial 2G Ethanol Production Process Based on Immobilized Recombinant S. Cerevisiae: Medium and Strain Selection for Robust Integrated Fixed-Bed Reactor Operation. Renew. Energy 2022, 185, 363–375. [Google Scholar] [CrossRef]
  34. Reis, V.R.; Bassi, A.P.G.; da Silva, J.C.G.; Ceccato-Antonini, S.R. Characteristics of Saccharomyces Cerevisiae Yeasts Exhibiting Rough Colonies and Pseudohyphal Morphology with Respect to Alcoholic Fermentation. Braz. J. Microbiol. 2013, 44, 1121–1131. [Google Scholar] [CrossRef]
  35. Rossi, L.M.; Gallo, J.M.R.; Mattoso, L.H.C.; Buckeridge, M.S.; Licence, P.; Allen, D.T. Ethanol from Sugarcane and the Brazilian Biomass-Based Energy and Chemicals Sector. ACS Sustain. Chem. Eng. 2021, 9, 4293–4295. [Google Scholar] [CrossRef]
  36. Milessi, T.S.; Perez, C.L.; Zangirolami, T.C.; Corradini, F.A.S.; Sandri, J.P.; Foulquié-Moreno, M.R.; Giordano, R.C.; Thevelein, J.M.; Giordano, R.L.C. Repeated Batches as a Strategy for High 2G Ethanol Production from Undetoxified Hemicellulose Hydrolysate Using Immobilized Cells of Recombinant Saccharomyces Cerevisiae in a Fixed-Bed Reactor. Biotechnol. Biofuels 2020, 13, 85. [Google Scholar] [CrossRef]
  37. Stojiljković, M.; Claes, A.; Deparis, Q.; Demeke, M.M.; Subotić, A.; Foulquié-Moreno, M.R.; Thevelein, J.M. Whole-Genome Transformation of Yeast Promotes Rare Host Mutations with a Single Causative SNP Enhancing Acetic Acid Tolerance. Mol. Cell Biol. 2022, 42, e00560-21. [Google Scholar] [CrossRef] [PubMed]
  38. Soares, R.C.; Zangirolami, T.C.; Giordano, R.L.C.; Demeke, M.M.; Thevelein, J.M.; Milessi, T.S. Cell Immobilization Using Alginate-Based Beads as a Protective Technique against Stressful Conditions of Hydrolysates for 2G Ethanol Production. Polymers 2022, 14, 2400. [Google Scholar] [CrossRef]
  39. Demeke, M.M.; Echemendia, D.; Belo, E.; Foulquie-Moreno, M.R.; Thevelein, J.M. Enhancing Xylose-Fermentation Capacity of Engineered Saccharomyces Cerevisiae by Multistep Evolutionary Engineering in Inhibitor-Rich Lignocellulose Hydrolysate. FEMS Yeast Res. 2024, 24, foae013. [Google Scholar] [CrossRef]
  40. Cavalett, O.; Junqueira, T.L.; Dias, M.O.S.; Jesus, C.D.F.; Mantelatto, P.E.; Cunha, M.P.; Franco, H.C.J.; Cardoso, T.F.; Maciel Filho, R.; Rossell, C.E.V.; et al. Environmental and Economic Assessment of Sugarcane First Generation Biorefineries in Brazil. Clean. Technol. Environ. Policy 2012, 14, 399–410. [Google Scholar] [CrossRef]
  41. Demichelis, F.; Laghezza, M.; Chiappero, M.; Fiore, S. Technical, Economic and Environmental Assessement of Bioethanol Biorefinery from Waste Biomass. J. Clean. Prod. 2020, 277, 124111. [Google Scholar] [CrossRef]
  42. Macrelli, S.; Galbe, M.; Wallberg, O. Effects of Production and Market Factors on Ethanol Profitability for an Integrated First and Second Generation Ethanol Plant Using the Whole Sugarcane as Feedstock. Biotechnol. Biofuels 2014, 7, 26. [Google Scholar] [CrossRef]
  43. Pratto, B.; dos Santos-Rocha, M.S.R.; Longati, A.A.; de Sousa Júnior, R.; Cruz, A.J.G. Experimental Optimization and Techno-Economic Analysis of Bioethanol Production by Simultaneous Saccharification and Fermentation Process Using Sugarcane Straw. Bioresour. Technol. 2020, 297, 122494. [Google Scholar] [CrossRef]
  44. Junqueira, T.L.; Chagas, M.F.; Gouveia, V.L.R.; Rezende, M.C.A.F.; Watanabe, M.D.B.; Jesus, C.D.F.; Cavalett, O.; Milanez, A.Y.; Bonomi, A. Techno-Economic Analysis and Climate Change Impacts of Sugarcane Biorefineries Considering Different Time Horizons. Biotechnol. Biofuels 2017, 10, 50. [Google Scholar] [CrossRef] [PubMed]
  45. Losordo, Z.; McBride, J.; Van Rooyen, J.; Wenger, K.; Willies, D.; Froehlich, A.; Macedo, I.; Lynd, L. Cost Competitive Second-Generation Ethanol Production from Hemicellulose in a Brazilian Sugarcane Biorefinery. Biofuels Bioprod. Biorefining 2016, 10, 589–602. [Google Scholar] [CrossRef]
  46. Sampaio, I.L.M.; Cardoso, T.F.; Souza, N.R.D.; Watanabe, M.D.B.; Carvalho, D.J.; Bonomi, A.; Junqueira, T.L. Electricity Production from Sugarcane Straw Recovered Through Bale System: Assessment of Retrofit Projects. Bioenergy Res. 2019, 12, 865–877. [Google Scholar] [CrossRef]
  47. Gnansounou, E.; Vaskan, P.; Pachón, E.R. Comparative Techno-Economic Assessment and LCA of Selected Integrated Sugarcane-Based Biorefineries. Bioresour. Technol. 2015, 196, 364–375. [Google Scholar] [CrossRef]
  48. Moonsamy, T.A.; Mandegari, M.; Farzad, S.; Görgens, J.F. A New Insight into Integrated First and Second-Generation Bioethanol Production from Sugarcane. Ind. Crops Prod. 2022, 188, 115675. [Google Scholar] [CrossRef]
  49. Soares, R.D.P.; Secchi, A.R. European Symposium on Computer Aided Process Engineering-13, 36th European Symposium of the Working Party on Computer Aided Process Engineering. Comput. Aided Chem. Eng. 2003, 14, 947–952. [Google Scholar] [CrossRef]
  50. CONAB. Perfil Do Setor Do Açúcar e Do Etanol No Brasil; CONAB: Brasília, Brazil, 2019.
  51. Filho, G.Z.; Piccirilli, J.P. O Processo de Fabricação Do Açúcar e Álcool: Desde a Lavoura Da Cana Até o Produto Acabado, 1st ed.; Mira, G.A., Ed.; Editora Viena: Santa Cruz do Rio Prado, Brazil, 2012; ISBN 978-85-371-0265-7. [Google Scholar]
  52. Santos, F.; Borém, A.; Caldas, C. Cana-de-Açúcar: Bioenergia, Açúcar e Etanol: Tecnologias e Perpectivas, 2nd ed.; Almeida, A.M.D.G., Ed.; Editora Folha de Viçosa Ltda: Viçosa, Brazil, 2011; ISBN 978-85-60249-39-8. [Google Scholar]
  53. Elias, A.M.; Giordano, R.D.C.; Secchi, A.R.; Furlan, F.F. Integrating Pinch Analysis and Process Simulation within Equation-Oriented Simulators. Comput. Chem. Eng. 2019, 130, 106555. [Google Scholar] [CrossRef]
  54. Elias, A.M.; Longati, A.A.; Giordano, R.D.C.; Furlan, F.F. Retro-Techno-Economic-Environmental Analysis Improves the Operation Efficiency of 1G-2G Bioethanol and Bioelectricity Facilities. Appl. Energy 2021, 282, 116133. [Google Scholar] [CrossRef]
  55. Marcelino, P.R.F.; Peres, G.F.D.; Terán-hilares, R.; Pagnocca, F.C.; Rosa, C.A.; Lacerda, T.M.; Santos, J.C.; Silva, S.S. Biosurfactants Production by Yeasts Using Sugarcane Bagasse Hemicellulosic Hydrolysate as New Sustainable Alternative for Lignocellulosic Biore Fineries. Ind. Crops Prod. 2019, 129, 212–223. [Google Scholar] [CrossRef]
  56. Humbird, D.; Davis, R.; Tao, L.; Kinchin, C.; Hsu, D.; Aden, A.; Schoen, P.; Lukas, J.; Olthof, B.; Worley, M.; et al. Process Design and Economics for Biochemical Conversion of Lignocellulosic Biomass to Ethanol; Technical Report; National Renewable Energy Lab (NREL): Golden, CO, USA, 2011; NREL/TP-51.
  57. Peters, M.S.; Timmerhaus, K.D.; West, R.E. Plant Design and Economics for Chemical Engineers, 5th ed.; McGraw-Hill: New York, NY, USA, 2003. [Google Scholar]
  58. Davis, R.; Grundl, N.; Tao, L.; Biddy, M.J.; Tan, E.C.D.; Beckham, G.T.; Humbird, D.; Thompson, D.N.; Roni, M.S. Process Design and Economics for the Conversion of Lignocellulosic Biomass to Hydrocarbon Fuels and Coproducts: 2018 Biochemical Design Case Update: Biochemical Deconstruction and Conversion of Biomass to Fuels and Products via Integrated Biorefinery Pathways; National Renewable Energy Lab (NREL): Golden, CO, USA, 2018.
  59. Aden, A.; Ruth, M.; Ibsen, K.; Jechura, J.; Neeves, K.; Sheehan, J.; Wallace, B.; Montague, L.; Slayton, A.; Lukas, J. Lignocellulosic Biomass to Ethanol Process Design and Economics Utilizing Co-Current Dilute Acid Prehydrolysis and Enzymatic Hydrolysis for Corn Stover; National Renewable Energy Lab (NREL): Golden, CO, USA, 2002.
  60. Davis, R.; Tao, L.; Scarlata, C.; Tan, E.C.D.; Ross, J.; Lukas, J.; Sexton, D. Process Design and Economics for the Conversion of Lignocellulosic Biomass to Hydrocarbons: Dilute-Acid and Enzymatic Deconstruction of Biomass to Sugars and Catalytic Conversion of Sugars to Hydrocarbons; National Renewable Energy Lab (NREL): Golden, CO, USA, 2015.
  61. B3. Dados Por Ativo. Available online: http://estatisticas.cetip.com.br/astec/series_v05/paginas/lum_web_v05_series_introducao.asp?str_Modulo=Ativo&int_Idioma=1&int_Titulo=6&int_NivelBD=2/ (accessed on 31 January 2024).
  62. CCEE. Painel de Preços. Available online: https://www.ccee.org.br/web/guest/precos/painel-precos (accessed on 31 January 2024).
  63. CEPEA/ESALQ. Consultas ao Banco de Dados do Site. Available online: https://www.cepea.esalq.usp.br/br/consultas-ao-banco-de-dados-do-site.aspx (accessed on 31 January 2024).
  64. Macrelli, S.; Mogensen, J.; Zacchi, G. Techno-Economic Evaluation of 2 Nd Generation Bioethanol Production from Sugar Cane Bagasse and Leaves Integrated with the Sugar-Based Ethanol Process. Biotechnol. Biofuels 2012, 5, 22. [Google Scholar] [CrossRef]
  65. Julio, A.A.V.; Milessi, T.S.; Maya, D.M.Y.; Lora, E.S.; Palacio, J.C.E. Assessment of the Sustainability and Economic Potential of Hydrotreated Vegetable Oils to Complement Diesel and Biodiesel Blends in Brazil. Biofuels Bioprod. Biorefining 2023, 17, 312–323. [Google Scholar] [CrossRef]
  66. IPCC. Climate Change 2023: Synthesis Report; Arias, P., Bustamante, M., Elgizouli, I., Flato, G., Howden, M., Méndez-Vallejo, C., Pereira, J.J., Pichs-Madruga, R., Rose, S.K., Saheb, Y., et al., Eds.; IPCC: Geneva, Switzerland, 2023. [Google Scholar]
  67. EPE. RenovaBio: Biocombustíveis 2030—Nota Técnica: Papel. Dos. Biocombustíveis Na Matriz; EPE: Rio de Janeiro, Brazil, 2017. [Google Scholar]
  68. Matsuura, M.I.D.S.F.; Seabra, J.E.A.; Ferreira Chagas, M.; Scachetti, M.T.; Morandi, M.A.B.; Moreira, M.M.R.; Novaes, R.M.L.; Ramos, N.P.; Cavalett, O.; Bonomi, A. Renovacalc: A calculadora do programa renovabio. In Proceedings of the VI Congresso Brasileiro Sobre Gestão do Ciclo de Vida; GCV: Brasília, Brazil, 2018; pp. 1–6. [Google Scholar]
  69. Furlan, F.F.; Filho, R.T.; Pinto, F.H.; Bb Costa, C.; Cruz, A.J.; Giordano, R.L.; Giordano, R.C. Bioelectricity versus Bioethanol from Sugarcane Bagasse: Is It Worth Being Flexible? Springer: Berlin/Heidelberg, Germany, 2013; Volume 6. [Google Scholar]
  70. Dias, M.O.S.; Junqueira, T.L.; Cavalett, O.; Cunha, M.P.; Jesus, C.D.F.; Mantelatto, P.E.; Rossell, C.E.V.; Maciel Filho, R.; Bonomi, A. Cogeneration in Integrated First and Second Generation Ethanol from Sugarcane. Chem. Eng. Res. Des. 2013, 91, 1411–1417. [Google Scholar] [CrossRef]
  71. Vand der Hoeven, D. Cellulosic Ethanol: Feedstock Costs Predominant, Sugar Cane Cheapest. Available online: https://www.biobasedpress.eu/2016/02/cellulosic-ethanol-feedstock-costs-predominant-sugar-cane-cheapest/ (accessed on 2 July 2024).
  72. Turboden Future Cogeneration: Energy Effiency and Sustainability. Available online: https://www.turboden.com/company/media/press/press-reviews/4581/future-of-cogeneration-energy-efficiency-and-sustainability#:~:text=Cogeneration%20plays%20a%20fundamental%20role,building%20heating%20or%20industrial%20processes (accessed on 1 February 2025).
  73. Brasil. Resolução N° 758 de 23 de Novembro de 2018; Ministério de Minas e Energia/Agência Nacional do Petróleo Gás Natural e Biocombustíveis: Brasília, Brazil, 2018.
  74. Hans, M.; Pellegrini, V.O.A.; Filgueiras, J.G.; de Azevedo, E.R.; Guimaraes, F.E.C.; Chandel, A.K.; Polikarpov, I.; Chadha, B.S.; Kumar, S. Optimization of Dilute Acid Pretreatment for Enhanced Release of Fermentable Sugars from Sugarcane Bagasse and Validation by Biophysical Characterization. Bioenergy Res. 2023, 16, 416–434. [Google Scholar] [CrossRef]
  75. Alves, L.A.; Felipe, M.G.A.; Silva, J.B.A.E.; Silva, S.S.; Prata, A.M.R. Pretreatment of Sugarcane Bagasse Hemicellulose Hydrolysate for Xylitol Production ByCandida Guilliermondii. Appl. Biochem. Biotechnol. 1998, 70–72, 89–98. [Google Scholar] [CrossRef]
  76. Carvalho, R.S.; Cruz, I.A.; Américo-Pinheiro, J.H.P.; Soriano, R.N.; de Souza, R.L.; Bilal, M.; Iqbal, H.M.N.; Bharagava, R.N.; Romanholo Ferreira, L.F. Interaction between Saccharomyces Cerevisiae and Lactobacillus Fermentum during Co-Culture Fermentation. Biocatal. Agric. Biotechnol. 2020, 29, 101756. [Google Scholar] [CrossRef]
  77. ComexStat. Exportação e Importação Geral. Available online: http://comexstat.mdic.gov.br/pt/geral (accessed on 9 October 2022).
  78. Claes, A.; Deparis, Q.; Foulquié-Moreno, M.R.; Thevelein, J.M. Simultaneous Secretion of Seven Lignocellulolytic Enzymes by an Industrial Second-Generation Yeast Strain Enables Efficient Ethanol Production from Multiple Polymeric Substrates. Metab. Eng. 2020, 59, 131–141. [Google Scholar] [CrossRef]
  79. Antunes, F.A.F.; Santos, J.C.; Chandel, A.K.; Milessi, T.S.S.; Peres, G.F.D.; da Silva, S.S. Hemicellulosic Ethanol Production by Immobilized Wild Brazilian Yeast Scheffersomyces shehatae UFMG-HM 52.2: Effects of Cell Concentration and Stirring Rate. Curr. Microbiol. 2015, 72, 133–138. [Google Scholar] [CrossRef]
  80. Bonomi, A.; Mariano, A.P.; de Jesus, C.D.F.; Cunha, M.P.; Mantelatto, P.E. The Virtual Sugarcane Biorefinery (VSB)—2011 Report; Issuu: Campinas, Brazil, 2012. [Google Scholar]
  81. Chandel, A.K.; Silveira, M.H.L. Advances in Sugarcane Biorefinery; Elsevier: Amsterdam, The Netherlands, 2018. [Google Scholar] [CrossRef]
  82. Chieppe Júnior, J.B. Tecnologia e Fabricação do Álcool; Instituto Federal de Educação, Ciência e Tecnologia: Inhumas, Brazil, 2012. [Google Scholar]
  83. Dantas, G.d.A. Alternativas de Investimento do Setor Sucroenergético Brasileiro para Aproveitamento de Bagaço e de Palha (Tese (Doutorado em Planejamento Energético)); Universidade Federal do Rio de Janeiro: Rio de Janeiro, Brazil, 2013. [Google Scholar]
  84. Elias Andrew, M.; Longati, A.A.; Ellamla, H.R.; Furlan, F.F.; Ribeiro, M.P.A.; Marcelino, P.R.F.; Dos Santos, J.C.; Da Silva, S.S.; Giordano, R.C. Techno-Economic-Environmental Analysis of Sophorolipid Biosurfactant Production from Sugarcane Bagasse. Ind. Eng. Chem. Res. 2021, 60, 9833–9850. [Google Scholar] [CrossRef]
  85. Gilpin, G.S. The Environmental Life Cycle Assessment of Selected 1 st Through 3 rd Generation Biofuels Within the Context of Sustainable Development (Tese (Doutorado em Filosofia)); Norwegian University of Life Sciences, Faculty of Environmental Science and Technology: Ås, Norway, 2016. [Google Scholar]
  86. Harding, K. A Generic Approach to Environmental Assessment of Microbial Bioprocesses through Life Cycle Assessment (LCA) (Tese (Doutorado em Filosofia)); University of Cape Town: Cape Town, South Africa, 2008. [Google Scholar]
  87. Oliveira, C.M.; Pavão, L.V.; Ravagnani, M.A.S.S.; Cruz, A.J.G.; Costa, C.B.B. Process integration of a multiperiod sugarcane biorefinery. Appl. Energy 2018, 213, 520–539. [Google Scholar] [CrossRef]
  88. Parra-Ramírez, D.; Martinez, A.; Cardona, C.A. Technical and economic potential evaluation of the strain Escherichia coli MS04 in the ethanol production from glucose and xylose. Biochem. Eng. J. 2018, 140, 123–129. [Google Scholar] [CrossRef]
  89. Pina, E.A.; Palacios-Bereche, R.; Chavez-Rodriguez, M.F.; Ensinas, A.V.; Modesto, M.; Nebra, S.A. Reduction of process steam demand and water-usage through heat integration in sugar and ethanol production from sugarcane–Evaluation of different plant configurations. Energy 2017, 138, 1263–1280. [Google Scholar] [CrossRef]
  90. Walter, A.; Dolzan, P.; U da Silva, C.R.; Piacente, F. A Sustainability Analysis of the Brazilian Ethanol Sustainable Development Potentials and Pathways for Biobased Economy Options: An Integrated Approach on Land Use, Energy System and Economy and Environment; View Project: Campinas, Brazil, 2008. [Google Scholar]
Figure 1. Block flow diagram for each base case of the sugarcane biorefinery scenarios: (A) CsA—1G ethanol–sugar plant; (B) CsB—1G ethanol plant. All process steam produced on cogeneration (dashed line) is used on-site.
Fermentation 11 00116 g001
Figure 2. Block flow diagram for each integrated cases studies of the sugarcane biorefinery based on the 2G process of Perez et al. [32]: (A) Cs1, (B) Cs2, (C) Cs3. All process steam produced on cogeneration (dashed line) is used on-site.
Fermentation 11 00116 g002
Figure 3. Economic sensitivity analysis of integrated cases studies (A) Cs1, (B) Cs2 and (C) Cs3. The range of variation in each item assessed is evaluated from −50% and +50% of the estimated values.
Fermentation 11 00116 g003
Figure 4. Sensitivity analysis of the economic parameters of the integrated scenarios: (A) NPV, (B) MESP, and (C) MESP 2G.
Fermentation 11 00116 g004
Figure 5. Comparison of the minimum ethanol-selling price of different ethanol plants worldwide and the case studies of the present work.
Fermentation 11 00116 g005
Figure 6. Sensitivity analysis of how the inputs of each sector affect the GWPT100: (A) Cs1, (B) Cs2, (C) Cs3. The range of variation in each item assessed is evaluated from −50% and +50% of the estimated values.
Fermentation 11 00116 g006
Figure 7. Final environmental impact score (τ) for ethanol production case studies.
Fermentation 11 00116 g007
Table 1. Key process results from the technical analysis for each 1G2G integrated case study evaluated.
Main Process ResultsCsACsBCs1Cs2Cs3
Specific anhydrous ethanol production (L/TC)47.4689.8149.0199.11161.26
Anhydrous ethanol production (m3/h)39.5574.8440.8582.59134.38
1G ethanol (%)100100725448.6
2G ethanol (%)--284651.4
Electricity (MW)154.82156.37145.84104.0788.63
Vinasse generated (m3/h)343.27681.67431.90803.381421.54
Specific vinasse production (m3vinasse/m3ethanol)8.689.1110.589.7310.58
Sugar production (t/h)58.15-60.05--
Specific sugar production (kg/TC)69.78-72.06--
Molasses production (t/h)38.75-40.0250.58-
Specific molasses production (kg/TC)46.50-48.0260.70-
Steam consumption
6 bar (t/h)2.935.5015.7126.1845.88
2.5 bar (t/h)263.95247.91300.25701.48601.22
0.1 bar (t/h) *453.71466.46397.16--
Total720.59719.86713.10727.66647.10
Specific steam consumption
6 bar (kg/TC)3.516.5918.8531.4155.06
2.5 bar (kg/TC)316.74297.49360.30841.78721.46
0.1 bar (kg/TC)544.88559.75476.59--
Boil fuel (t/h)
Bagasse (50% humidity)240.90240.90215.67170.2638.90
Straw (15% humidity)71.2271.2271.2271.2271.22
2G solids (50% humidity)--17.0547.90136.96
TC—tons of sugarcane, * steam in condensing turbine.
Table 2. Main economic results of the analysis of the 1G2G integrated case studies evaluated.
Main Process ResultsCsACsBCs1Cs2Cs3
Industrial investment
Total (USD × 106)184.74153.38189.60167.19187.65
Extraction2.032.032.032.032.03
Treatment11.9613.8711.9613.8713.87
Concentration/fermentation23.8639.3522.7026.7239.35
Crystallization50.69-51.68--
Cogeneration86.1786.1385.0083.6577.76
Distillation7.729.528.199.9711.83
Pretreatment--0.430.791.74
2G fermentation--4.5526.4336.43
Yeast immobilization--0.440.670.70
Other costs2.312.502.623.063.94
Operational costs
Total (USD × 106)145.30136.53147.81138.16565.48
Raw materials96.9792.2799.0998.73442.25
Sugarcane59.6059.6059.6059.6059.60
1G sector40.9036.2037.2236.2158.92
2G sector--0.511.444.08
Molasses----318.09
2G Yeast--1.741.651.71
Utilities10.399.7710.033.835.97
Labor20.7919.0521.1919.5768.12
Operating supplies0.590.490.600.530.60
Laboratory charges1.891.731.931.786.19
Plant overhead cost13.3511.9813.6312.4637.06
Patents and royalties1.321.251.341.265.28
Sales
Total (USD × 106)252.64226.01257.94235.45683.92
Ethanol95.01192.7897.35209.44654.61
Electricity23.9624.2322.6016.1313.74
Sugar128.62-132.81--
CBIO4.999.005.179.8815.58
Economic performance
Net present value (USD × 106)171.96276.23186.13320.00−1254.91
Minimum ethanol-selling price (MESP)476.71511.08472.92503.15966.53
Minimum 2G ethanol-selling price (MESP 2G)--6710.042240.761634.20
Table 3. Main results of the environmental analysis of the 1G2G-integrated case studies evaluated.
Energy Allocation Fraction
Case StudyEthanolElectricitySugar
CsA0.370.230.40
CsB0.740.26-
Cs10.380.210.41
Cs20.830.17-
Cs30.900.10-
Environmental Indicators
Case StudyGWP aAD bODP cHT dFWAET eMAET fTET gPO hAC iEU j
CsA18.225.221.901.496.0912.341.074.534.3517.83
CsB21.305.602.261.728.0816.911.215.484.7919.68
Cs118.655.171.911.486.1112.501.064.614.3217.61
Cs221.555.652.391.778.4418.041.205.944.9119.83
Cs323.443.781.611.145.6311.710.778.274.0316.91
a Global Warming Potentials 100 years’ horizon, in 103 kg CO2 eq./MJ ethanol; b Abiotic depletion, in 10 5 kg Sb eq./MJ ethanol; c Ozone layer depletion, in   10 9 kg CFC-11 eq./MJ ethanol; d Human toxicity, in   10 2 kg 1,4DB eq./MJ ethanol; e Fresh-water aquatic ecotoxicity, in   10 3 kg 1,4DB eq./MJ ethanol; f Marine aquatic ecotoxicity, in kg 1,4DB eq./MJ ethanol; g Terrestrial ecotoxicity, in   10 4 kg 1,4DB eq./MJ ethanol; h Photochemical oxidation, in   10 6 kg C2H4 eq./MJ ethanol; i Acidification, in   10 4 kg SO2 eq./MJ ethanol; j Eutrophication, in   10 5 kg PO4−3 eq./MJ ethanol.
Disclaimer/Publisher’s Note: The statements, opinions and data contained in all publications are solely those of the individual author(s) and contributor(s) and not of MDPI and/or the editor(s). MDPI and/or the editor(s) disclaim responsibility for any injury to people or property resulting from any ideas, methods, instructions or products referred to in the content.

