Article

Study of the Relationship Between Nitrogen, Phosphorus Content, and Microbial Community Changes in Deer Manure Compost with Different Conditioners

1
College of Ecology and Environment, Hainan Tropical Ocean University, Yazhou Bay Innovation Institute of Hainan Tropical Ocean University, Key Laboratory of Coastal Marine Ecological Environment Processes and Carbon Sequestration in Hainan Province, Sanya 572022, China
2
Key Laboratory of Wetland Ecology and Vegetation Restoration, Ministry of Ecology and Environment, Key Laboratory of Grassland Ecology, Ministry of Education, School of Environment, Northeast Normal University, Changchun 130017, China
3
Northeast Institute of Geography and Agroecology, Chinese Academy of Sciences, Changchun 130102, China
*
Author to whom correspondence should be addressed.
Fermentation 2025, 11(2), 66; https://doi.org/10.3390/fermentation11020066
Submission received: 1 December 2024 / Revised: 22 December 2024 / Accepted: 24 January 2025 / Published: 1 February 2025
(This article belongs to the Section Industrial Fermentation)

Abstract

Composting is an environmentally friendly method for disposing of solid waste. To enhance the fermentation rate and quality of deer manure composting, we investigated the effects of various conditioners (biochar, zeolite, biochar + zeolite) on the aerobic composting process of deer manure. The results indicated that the combination of biochar and zeolite significantly promoted the degradation of organic matter, resulting in a 34.83% decrease in total organic carbon (TOC) content. The addition of biochar was particularly beneficial for nitrogen retention in the compost, with the total nitrogen content reaching its highest level at 39.55 g/kg. Furthermore, the inclusion of zeolite and biochar altered the phosphorus content of the compost, with zeolite demonstrating a more favorable effect. The addition of a conditioner increased the relative abundance of Ascomycota and Proteobacteria and decreased the relative abundance of Firmicutes; the changes in Corynebacterium, Acinetobacter, and Glutamicibacter were positively correlated with the changes in the carbon-to-nitrogen ratio (C/N ratio) and negatively correlated with total nitrogen (TN) and total phosphorus (TP) levels. The mixed conditioner of biochar + zeolite used in composting exhibited low toxicity and the highest degree of decomposition. In summary, the combination of biochar + zeolite as a mixed conditioner is the optimal choice for reducing the toxicity of compost and promoting its maturation. Further research will be conducted in the future to promote the resource utilization of agricultural wastes such as deer manure.

1. Introduction

China generates over 4 billion tons of agricultural waste each year [1,2]. Most of the manures used in the composting of agricultural waste include cow, pig, and chicken manure, each supported by established composting technologies. However, due to the diverse characteristics of various fertilizers, there is a need to explore high-value organic fertilizers. The economic value of organic fertilizers derived from deer manure is significantly higher than that of other types of fertilizers [3]. In recent years, the growth rate of deer has outpaced that of other livestock species [4]. By the end of 2020, China was home to 260,000 sika deer, representing 50% of the Jilin province’s population and 30% of the country’s total [5]. As deer operations expand, the pollution generated by deer manure increasingly impacts the surrounding environment of factories [6]. Additionally, Northeast China experiences low average annual temperatures and a prolonged cold season, which complicates the management of livestock and poultry manure [7]. Therefore, researching pollution control measures for the livestock and poultry industry is of considerable importance.
Composting is a widely adopted practice due to its safety, reliability, cost-effectiveness, and ease of operation and maintenance [4,8]. However, conventional composting often suffers from low maturity and inadequate carbon sequestration, which can lead to significant nitrogen loss and reduced humus content. This substantially diminishes the quality of the final compost product [9,10]. Enhancing the composting process by minimizing carbon loss and increasing carbon fixation is crucial. The humification of composted products plays a pivotal role in carbon sequestration [11,12]. Proper management during the composting process can also mitigate excessive nitrogen leaching into the soil, thereby reducing nitrogen pollution by approximately 32.0% [13]. Consequently, it is imperative to minimize nitrogen loss and increase humus content during the composting process in order to improve the living conditions for both humans and livestock.
Biochar and zeolite are commonly used additives in composting processes. Biochar serves as a source of microbial nutrients and protects microorganisms from desiccation [14,15]. It also enhances environmental conditions that are conducive to microbial growth by promoting aeration in compost mixtures, thereby improving microaeration [16,17]. The addition of biochar significantly influences the physicochemical processes and microbial community diversity in composts made from tomato stems and chicken manure [18]. Zeolite is incorporated into compost as a conditioning agent due to its effective nitrogen retention and fixation properties [19,20]. Furthermore, zeolite alters the effectiveness of heavy metals and passivates them when added to compost [4]. Some studies have shown that combining zeolite with other additives can further enhance the composting process, reduce nitrogen loss, and improve compost quality [21]. The addition of a biochar and zeolite mixed conditioner can buffer the pondus hydrogenii (pH) and electrical conductivity (EC) changes during deer manure composting [22]. The inclusion of biochar, zeolite, and their combinations does not negatively impact the maturation of swine manure compost, but rather increases its nutrient content and overall quality [23]. In conclusion, the incorporation of biochar and zeolite can influence the microbial community, enhance the performance of the composting process, and improve the quality of the final product. However, the specific effects of biochar and zeolite on the microbial community structure and physicochemical properties during deer manure composting remain unclear.
As a kind of organic waste containing rich nutrients, the organic fertilizers produced by deer manure are widely used in farmland, woodland, flower gardening, vegetable garden planting, farming, and other fields, with great market potential. The composting of straw and deer manure can not only facilitate resource utilization but also address the issue of pollution caused by these materials. Consequently, this research employed deer manure and straw as composting and fermentation agents, while biochar and zeolite were used as conditioners in the composting experiments. The study aimed to investigate the mechanism of their impact on the humification process during aerobic deer manure composting. The primary research objectives included: (1) examining the influence of different conditioners on nutrient indices throughout the composting process; (2) exploring the effects of various conditioners on changes in microbial community structure during composting; and (3) assessing the impact of different conditioners on the degree of compost decomposition.

2. Materials and Methods

2.1. Compost Materials and Properties

Composted straw and deer manure were sourced from a location in Jilin Province. The deer manure was meticulously cleaned to remove bricks, stones, and other contaminants, while the straw was air-dried and subsequently cut into segments of 1–2 cm in length. The preparation of biochar was carried out through the pyrolysis of corn stover at temperatures ranging from 300 to 700 °C. The properties of biochar are shown in Table 1 [24]. Natural zeolite (AR grade) was acquired from an industrial zone and then ground to produce fine particles ranging from 1 to 5 mm. The zeolite type was clinoptilolite. Table 2 presents the water content, total organic carbon (TOC), total nitrogen (TN), and the carbon-to-nitrogen ratio (C/N) for each raw material used in the compost.

2.2. Experimental Design

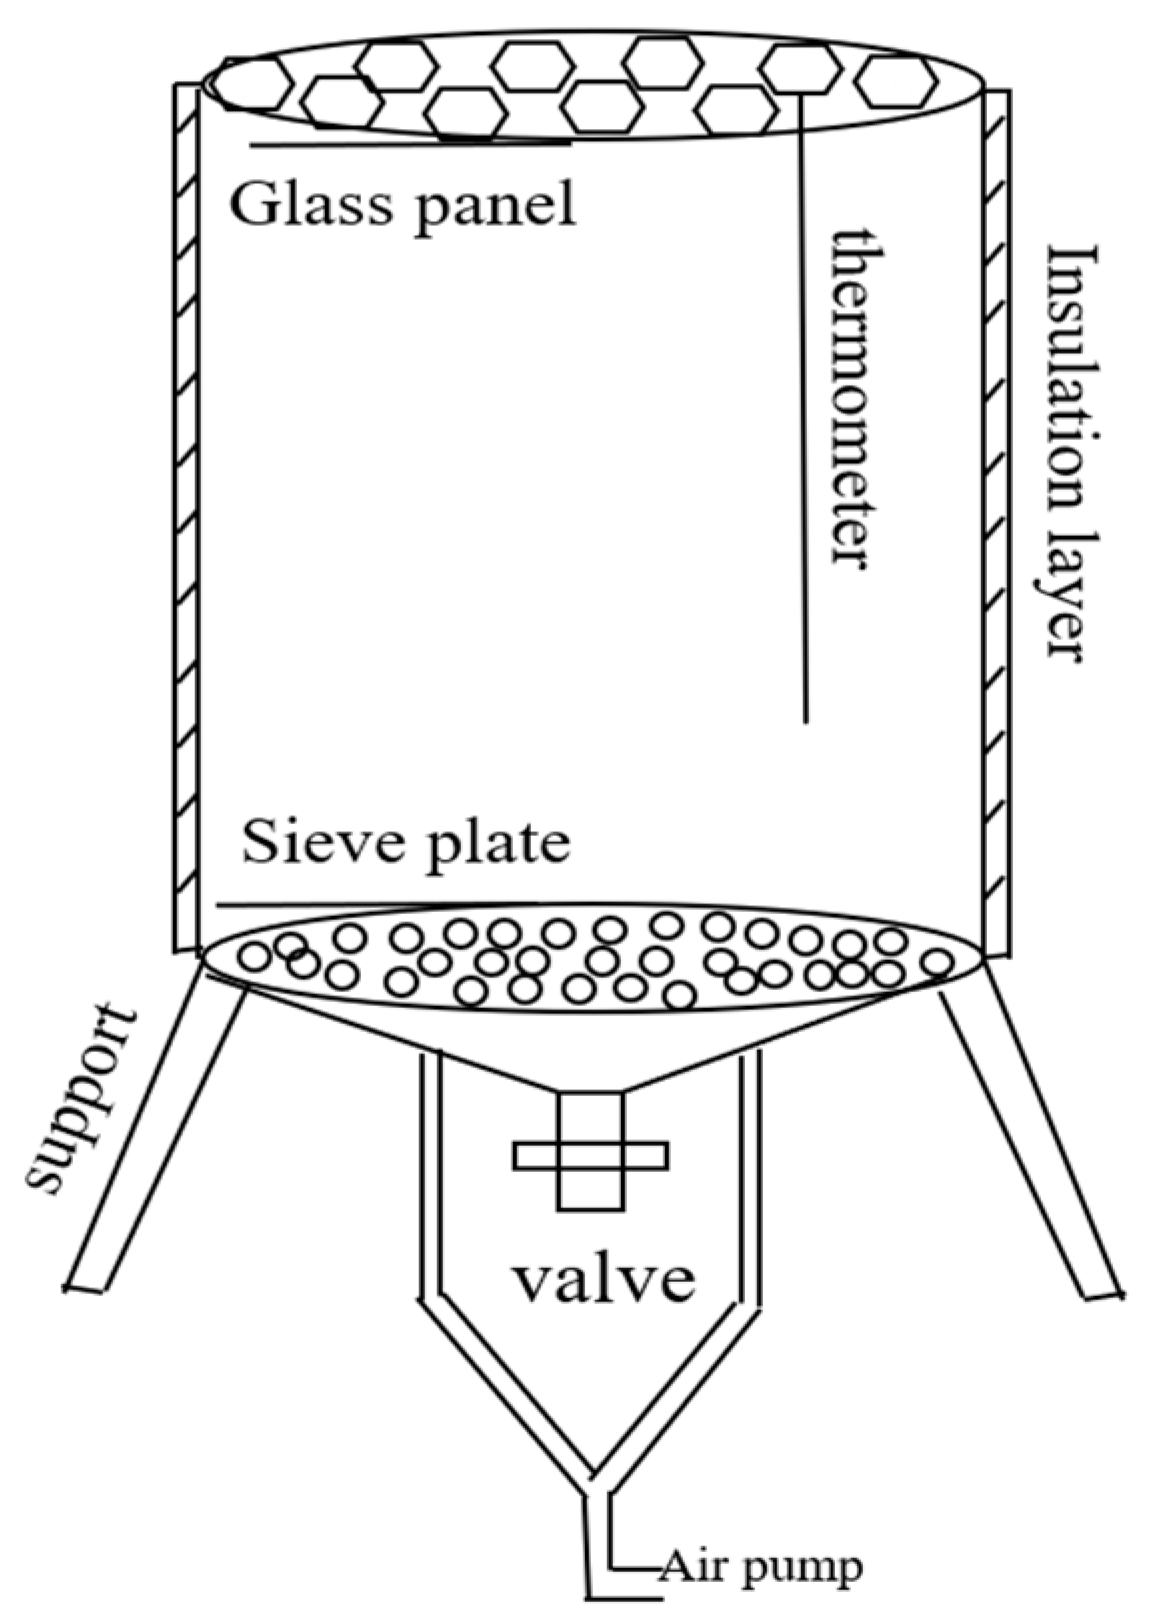
2.2.1. The Impact of Conditioners on the Aerobic Composting Process of Deer Manure

The experimental design comprised four groups (Table 3): compost without conditioner (CK), compost with biochar as a conditioner (B), compost with zeolite as a conditioner (Z), and compost with biochar and zeolite as a combined conditioner (BZ). We set three repetitions for each group. The initial carbon-to-nitrogen ratio was established at 30, the moisture content was maintained at 60%, the total weight was 4 kg, and the conditioner was incorporated at 12% of the total weight. Table 2 presents the specific compost material ratios. The fully mixed raw materials were then transferred to the composting reactor (Figure 1) for 36 days. The ventilation rate was set at 0.6 mL/min, with 15 min of ventilation per hour followed by 45 min of cessation [22].

2.2.2. The Impact of Conditioner on the Phytotoxicity and Decomposition of Deer Manure Compost

The samples were combined with deionized water at a 1:10 ratio, then shaken at 150 rpm for one hour in a thermostatic shaker [25]. Following this, they were centrifuged at 5000 rpm for ten minutes, and the supernatant was filtered through a qualitative filter. Two pieces of qualitative filter paper were placed in a petri dish, to which 5 mL of the filtered supernatant was added. Ten pak-choi (Brassica campestris L. ssp. chinensis Makino var.communis Tsen et Lee) seeds were evenly distributed in the petri dish. The dishes were then incubated in an environment with constant temperature and humidity (25 °C and 50% humidity) for 48 h. Deionized water served as a blank control. The length of the germinated seed sprouts was measured using Vernier calipers, and the seed germination index was calculated according to Equation (1).
G I   ( Germination   index ) = ( S e e d   g e r m i n a t i o n   r a t e   o f   c o m p o s t i n g   t r e a t m e n t × S e e d   r o o t   l e n g t h ) ( C o m p a r i s o n   o f   s e e d   g e r m i n a t i o n   r a t e × S e e d   r o o t   l e n g t h ) × 100 %

2.3. Methods for Determining Physicochemical Indicators

The determination of total organic carbon (TOC), total nitrogen (TN), and total phosphorus (TP) during the composting process was conducted according to the methods outlined in Organic Fertilizer (NY525-2021) [25]. The determination of ammonia nitrogen and nitrite nitrogen was conducted following the methods stipulated in “Soil-Determination of ammonium, nitrite and nitrate by extraction with potassium chloride solution -spectrophotometric methods” (HJ-634-2012) [26]. Nitrate nitrogen was measured using the dual-wavelength ultraviolet spectrophotometric method [27].
TOC content: The potassium dichromate volumetric method was employed to determine the TOC content. A quantitative potassium dichromate (AR, Beijing chemical works, Beijing, China)–sulfuric acid (AR, Xihua, Tianjin, China) solution was used under heated conditions to oxidize the organic carbon in air-dried samples. The excess potassium dichromate was then titrated with a ferrous sulfate (AR, Damao, Tianjin, China) standard solution, using silica (AR, Bailunsi, Tianjin, China) as a blank for comparison.
TN: In air-dried samples, nitrogen was converted to ammonium nitrogen through a sulfuric acid–hydrogen peroxide (AR, Beijing chemical works, Beijing, China) extraction process. The ammonia distilled during alkalization was absorbed by a boric acid (AR, Beijing chemical works, Beijing, China) solution and subsequently titrated with a standard acid solution to determine the total nitrogen content in the sample.
Ammonia nitrogen and nitrite nitrogen: We extracted them using a potassium chloride (GR, Damao, Tianjin, China) solution at a 1:5 mass/volume ratio by shaking at 20 ± 2 °C for 1 h. We then centrifuged at 3000 rpm for 10 min and collected the supernatant for measurement. For ammonia nitrogen, we combined 10 mL of sodium nitroprusside (AR, Aikeda, Chengdu, China)–phenol (AR, Beijing chemical works, Beijing, China) chromogen with 40 mL of the sample and added 1 mL of sodium dichloroisocyanurate (AR, Rhawn, Shanghai, China) chromogen. We allowed the color to develop for 15 min and then for an additional 5 h, after which the absorbance was measured at 630 nm, using water as the reference. For nitrite nitrogen, we took 1 mL of the test sample, added 20 mL of water, and mixed thoroughly. Then, we added 0.2 mL of the colorant and mix again. We allowed the mixture to stand for 60 to 90 min at room temperature and measured the absorbance at 543 nm, using water as the reference.
Nitrate nitrogen: We extracted nitrate nitrogen using a calcium chloride (AR, Beijing chemical works, Beijing, China) solution at a mass-to-volume ratio of 1:5. We shook the mixture and allowed it to extract for 1 h. Then, we filtered the solution through qualitative filter paper to obtain the test material. We diluted 0.4 mL of the test material to a final volume of 25 mL. Finally, we added 1 mL of 1:9 sulfuric acid, mixed thoroughly, and measured the absorbance at wavelengths of 210 nm and 275 nm.
TP: Organic fertilizer samples were treated with sulfuric acid and hydrogen peroxide. Under specific acidity conditions, phosphate ions in the test solution reacted with metavanadate and molybdate to form a yellow ternary heteropolyacid. Within a certain concentration range, the absorbance of the yellow solution was proportional to the phosphorus content and was measured spectrophotometrically at 440 nm.

2.4. Analysis of Microbial Community Structure

The hypervariable V3-V4 region of the bacterial 16S rRNA gene was amplified using primers 338F (5′-ACTCCTACGGGAGGCAGC-3′) and 806R (5′-GGACTACHVGGGTWTCTAAT-3′), The length of the amplified fragment was 480 bp. Similarly, the fungal ITS_V1 region was amplified with primers ITS5F (5′-GGAAGTAAAAGTCGTAACAAGG-3′) and ITS1R (5′-GCTGCGTTCTTCATCGATGC-3′), The length of the amplified fragment was 250 bp. PCR amplicons were purified with Vazyme VAHTSTM DNA Clean Beads (Vazyme, Nanjing, China) and quantified using the Quant-iT PicoGreen dsDNA Assay Kit (Invitrogen, Carlsbad, CA, USA). After the individual quantification step, amplicons were pooled in equal amounts, and pair-end 2 × 250 bp sequencing was performed using the Illlumina MiSeq platform with MiSeq Reagent Kit v3 at Shanghai Personal Biotechnology Co., Ltd. (Shanghai, China).

2.5. Statistical Analysis

Sequence data analyses were mainly performed using QIIME2; ASV class richness was calculated using the ASV table in QIIME2, then we exported the data. The structure of the microbial community was delineated using Prism 8, while structural tree diagrams were crafted utilizing the Genescloud V1.1 by Shanghai Personal Biotechnology Co., Ltd., Shanghai, China. The redundancy analysis was conducted with Canoco 5. Correlation analyses were executed using SPSS 24.0 software. The degree of decomposition was assessed through a gray analysis implemented in Matlab 2017. The formula for the gray correlation is presented in Equation (2).
L o i k = m i n k m i n i X 0 k X i k + ρ m a x i m a x k X 0 k X i k X 0 k X i k + ρ m a x i m a x k X 0 k X i k
In the given equation, X 0 k represents the value of the reference series; X i k denotes the value of the comparison series; and ρ stands for the resolution factor, which is typically set to 0.5.

3. Results

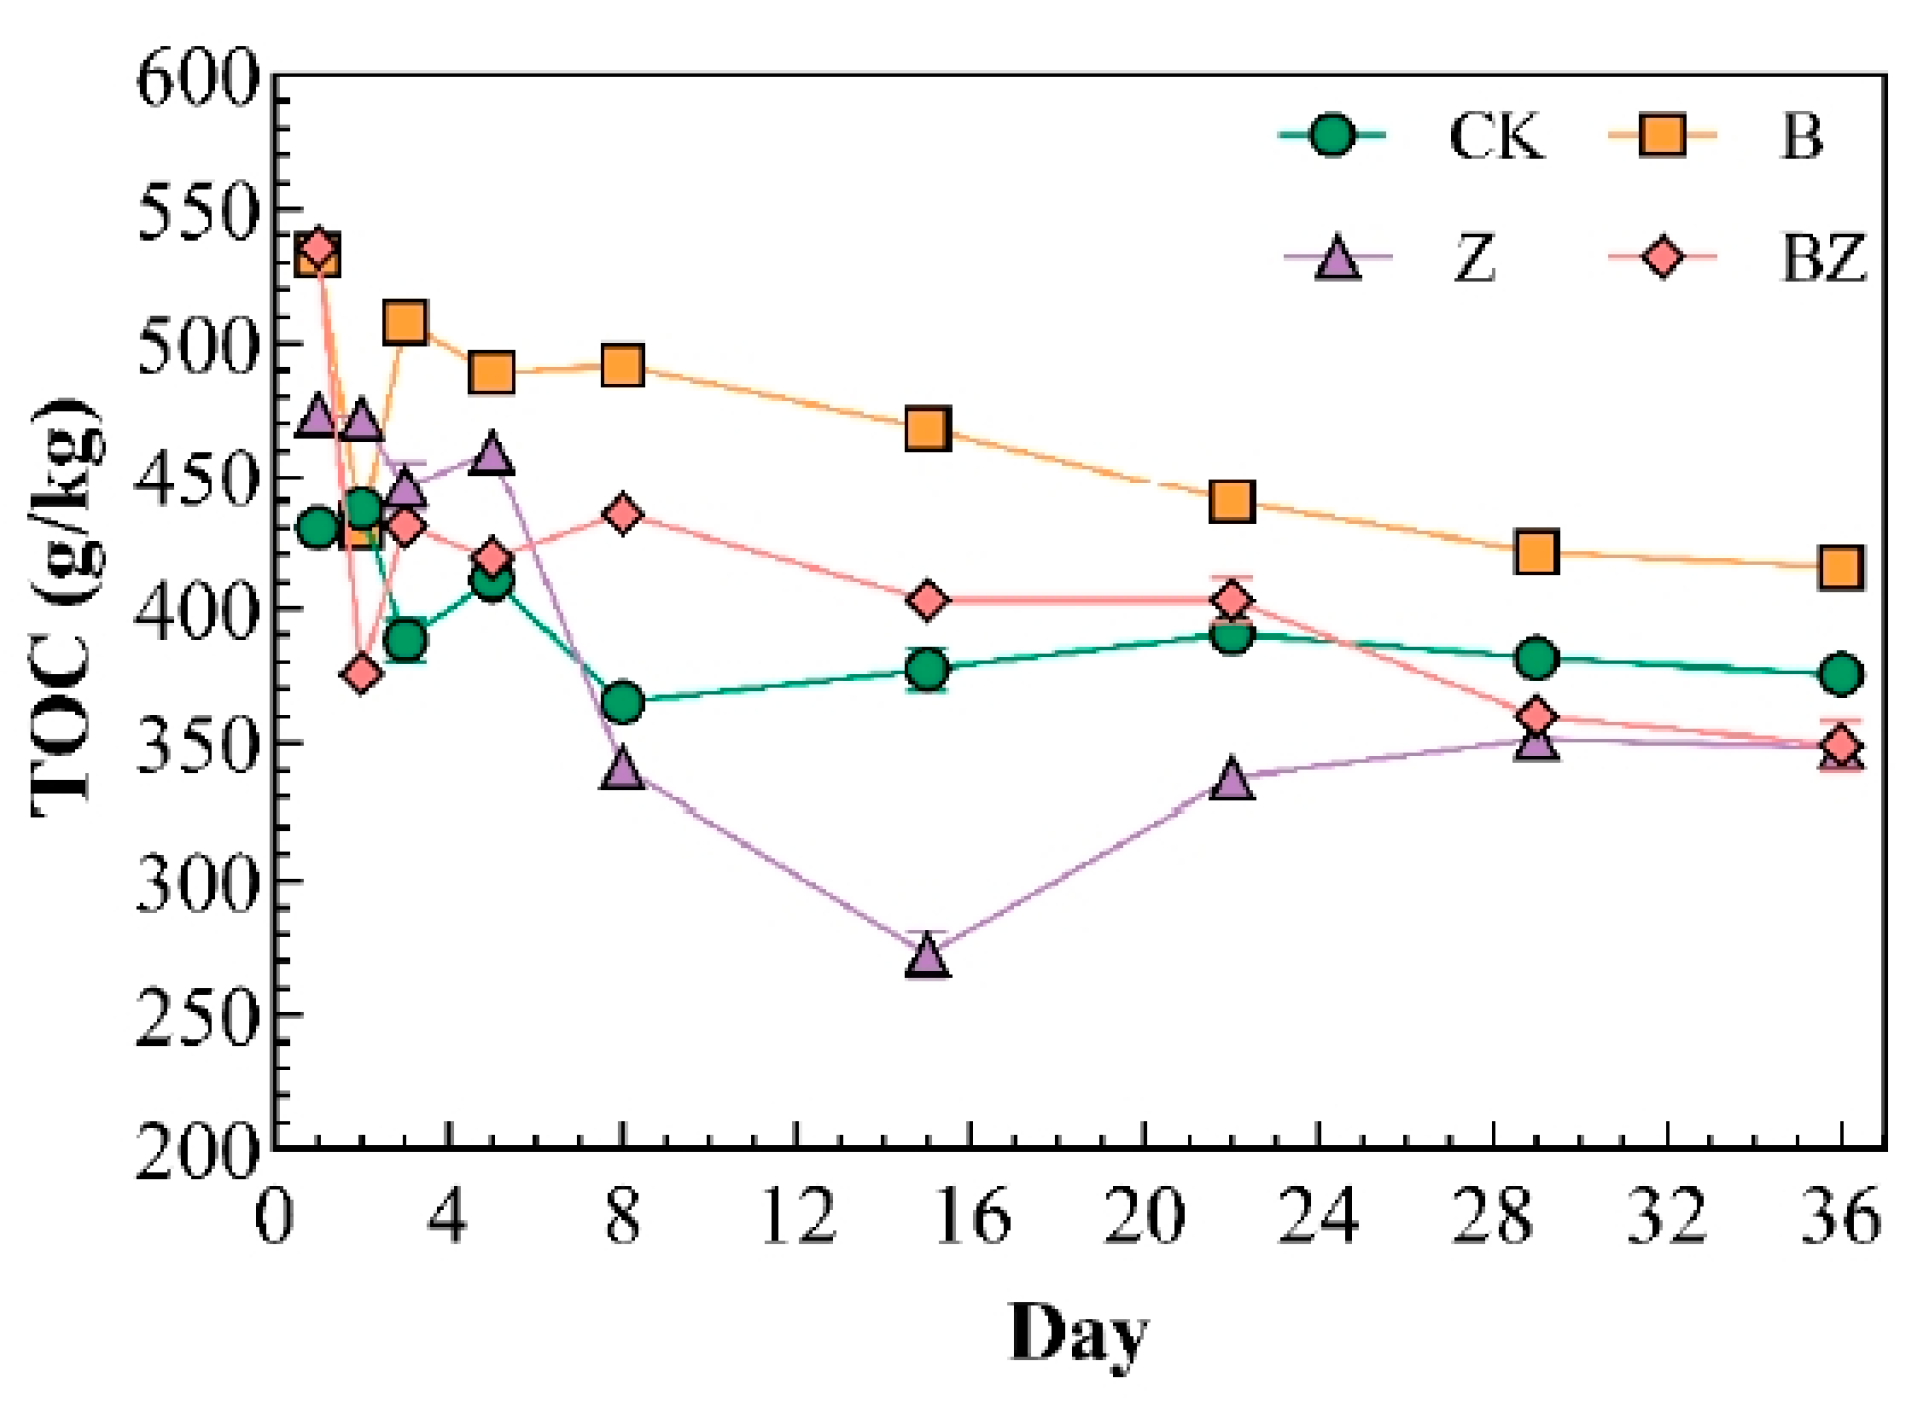
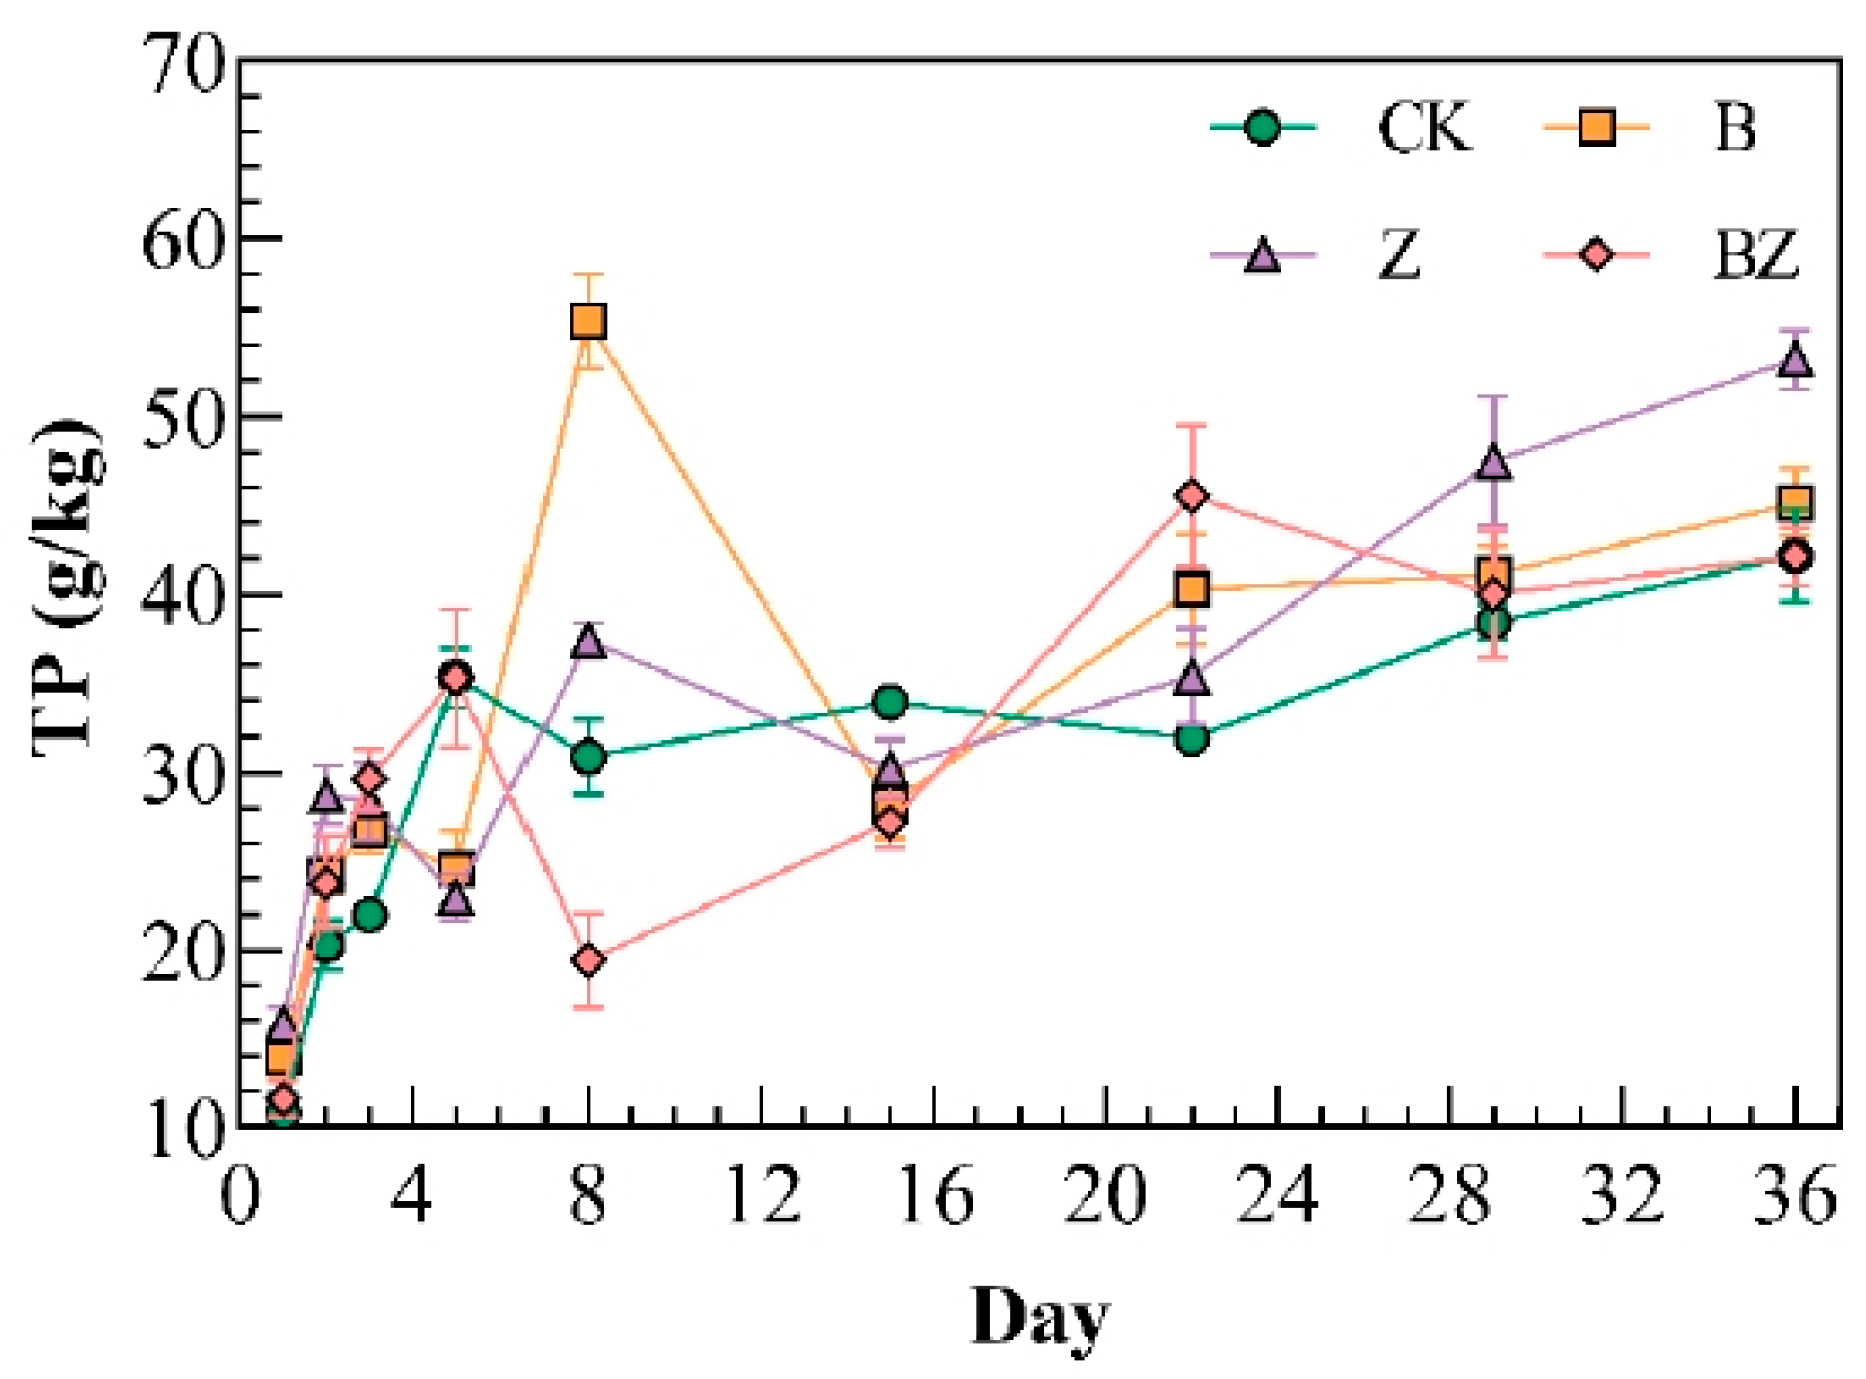
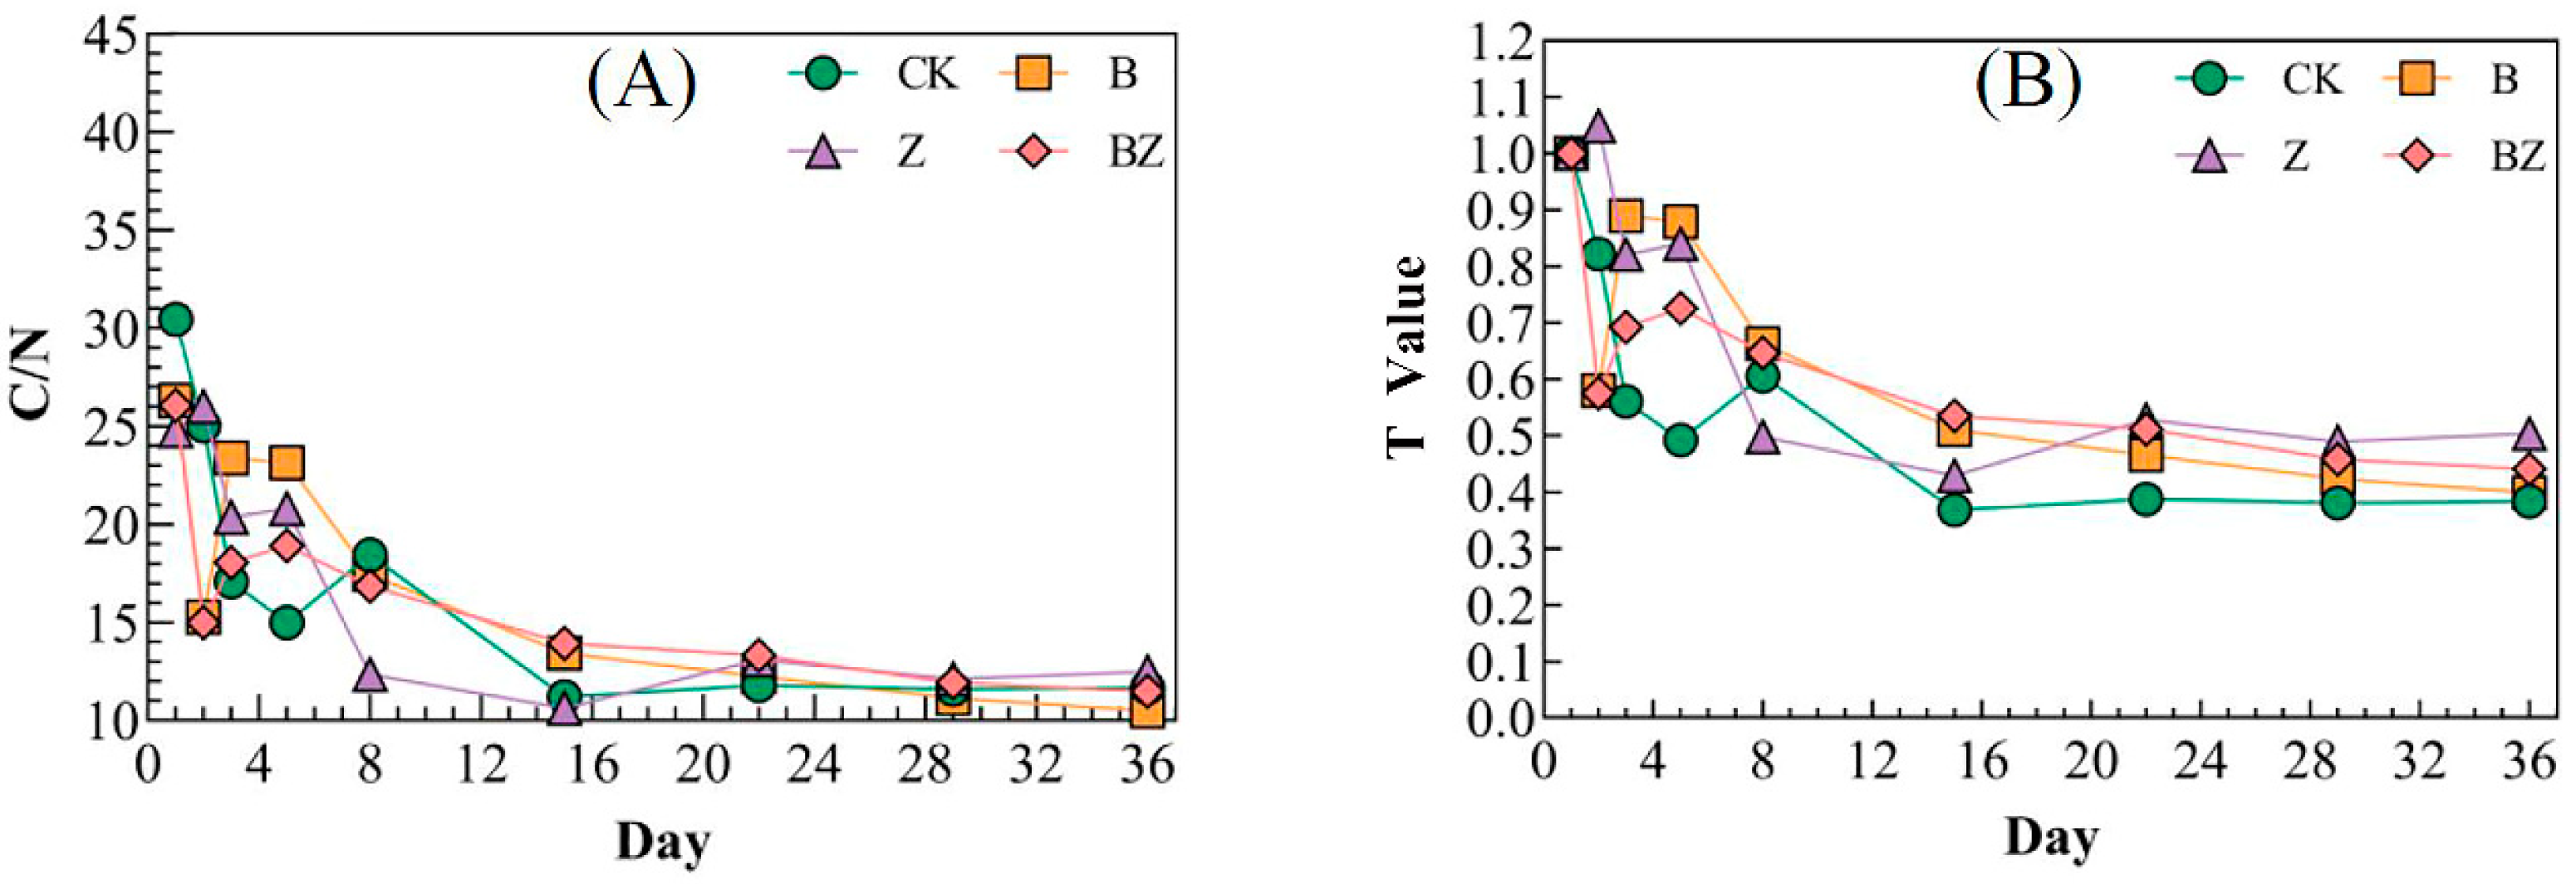
3.1. Variations in Carbon, Nitrogen, and Phosphorus Levels in Reactor Under Distinct Conditioning Agents

The dynamic alterations in TOC across the four composting process groups are illustrated in Figure 2. During the initial high-temperature phase (D2-D5), the TOC content in all groups initially decreased, then momentarily increased, before following distinct patterns: groups B and BZ exhibited a gradual decline; group CK stabilized post-D8; and group Z experienced a rapid reduction from D5 to D15, with a minor uptick after D15. Ultimately, the end TOC values for the compost groups were as follows: B (415.16 g/kg) > CK (375.55 g/kg) > BZ (349.16 g/kg) > Z (348.16 g/kg). Biochar, serving as a carbonaceous agent, was incorporated into the compost, influencing its TOC levels. Notably, group B consistently demonstrated higher TOC than the other groups, thereby impacting the C/N and T-values [18]. Compared to their initial values, the reduction percentages were as follows: BZ (34.83%) > Z (26.52%) > B (22.12%) > CK (12.69%). These results indicate that the conditioner significantly improved organic matter degradation. The order of effectiveness was B + Z > Z > B, which is consistent with the findings of Dias and Zhang et al. [20,28].
The trend of TN throughout the composting process is illustrated in Figure 3A. All four groups demonstrated an upward trend in TN, albeit with fluctuations during the high-temperature period. The final TN content for the four groups was as follows: B (39.55 g/kg) > CK (32.12 g/kg) > BZ (30.42 g/kg) > Z (27.90 g/kg). The application of biochar enhancement aided in the retention of nitrogen within the compost, resulting in a higher TN in group B compared to the other three groups. The primary reason for the reduction in nitrogen loss was the retention of NH3 in biochar-modified composting [29].
Figure 3B illustrates that the fluctuation and decline of ammonia nitrogen content throughout the composting process were consistent across all four pile groups. Notably, the BZ group exhibited a significant decrease on day 8. The reduction in ammonia nitrogen content was markedly higher in the experimental group compared to the CK group, with the B group showing a slightly greater decrease than the Z group. The BZ group experienced the most substantial reduction in ammonia nitrogen content, with a decrease of 92.52%. The control effect of the biochar conditioner on ammonia nitrogen emission is influenced by both the quantity of biochar added and its performance. Furthermore, it has been observed that ammonia volatilization decreases as the rate of biochar application increases [30]. The incorporation of biochar influenced the equilibrium between NH4+ and NH3, as well as the kinetics of nitrogen mineralization during the composting process. Biochar exhibits a significant adsorption capacity for NH4+-N, NH3, and other organic nitrogen compounds present in the compost mixture [31,32]. Concurrently, biochar facilitates the microbial degradation of organic matter, leading to the production of ammonium [33].
The alterations in nitrate nitrogen content across the four composting groups are illustrated in Figure 3C. Initially, the nitrate nitrogen content was low in all groups, and a downward trend was observed post-composting initiation. With the exception of group Z, which exhibited a significant increase to 8.35 g/kg at D15, the concentration remained stable at minimal levels from D2 to D22, subsequently decreasing to zero at D22 before rising again. In the end, the nitrate nitrogen content in the four composting groups was as follows: B (16.16 g/kg) > Z (15.19 g/kg) > BZ (14.16 g/kg) > CK (7.15 g/kg).
The variation in nitrite nitrogen content across the four compost groups is depicted in Figure 3D, exhibiting a trend similar to that of nitrate nitrogen. Upon reaching the high-temperature phase, the nitrite nitrogen content precipitously declined, nearing zero, before gradually rebounding to its initial levels post-D22. By the conclusion, the nitrite nitrogen concentrations across all groups aligned closely with their starting values. Specifically, the CK and Z groups witnessed marginal increases, transitioning from initial concentrations of 2126.12 mg/kg and 2139.33 mg/kg to final concentrations of 2343.33 mg/kg and 2777.67 mg/kg, respectively. Conversely, groups B and BZ experienced declines, moving from initial values of 2704.33 mg/kg and 3018.33 mg/kg to 1279.67 mg/kg and 2327.00 mg/kg, respectively. The enhanced ventilation within the biochar-amended compost mixture likely fostered a conducive environment for nitrifiers, potentially explaining the elevated nitrate nitrogen and reduced nitrite nitrogen levels in group B relative to the other groups [29,34]. Furthermore, biochar characteristics—including surface area, pore volume, total acid functional groups, and cation exchange capacity—play pivotal roles in influencing its nitrogen retention efficacy during composting [29,31].
The alterations in the total phosphorus (TP) content within the compost are illustrated in Figure 4. The phosphorus content and its variation in the heap were relatively consistent. During aerobic composting, phosphorus is more stable than nitrogen. Although different forms of phosphorus can be converted into each other, they do not evaporate or are lost; therefore, the absolute TP content remained almost unchanged [35]. However, due to the decomposition and transformation of a large amount of organic matter during the composting process, as well as the volatilization of carbon dioxide and ammonia, the total dry matter in the compost pile continuously decreased, leading to concentration effects and an increase in TP content [36]. By the conclusion of the composting process, the phosphorus content in the compost was ranked as follows: Z (47.47 g/kg) > B (41.08 g/kg) > BZ (40.00 g/kg) > CK (38.43 g/kg). With the continuous mineralization and decomposition of organic matter in the heap, the TP content also significantly increased due to the “concentration effect”. The introduction of zeolite and biochar had a quantitative impact on this effect, and zeolite has been proven to be more conducive to increasing the decomposition of organic matter and improving the TP content. The effect of mixed conditioning agents was not significant.

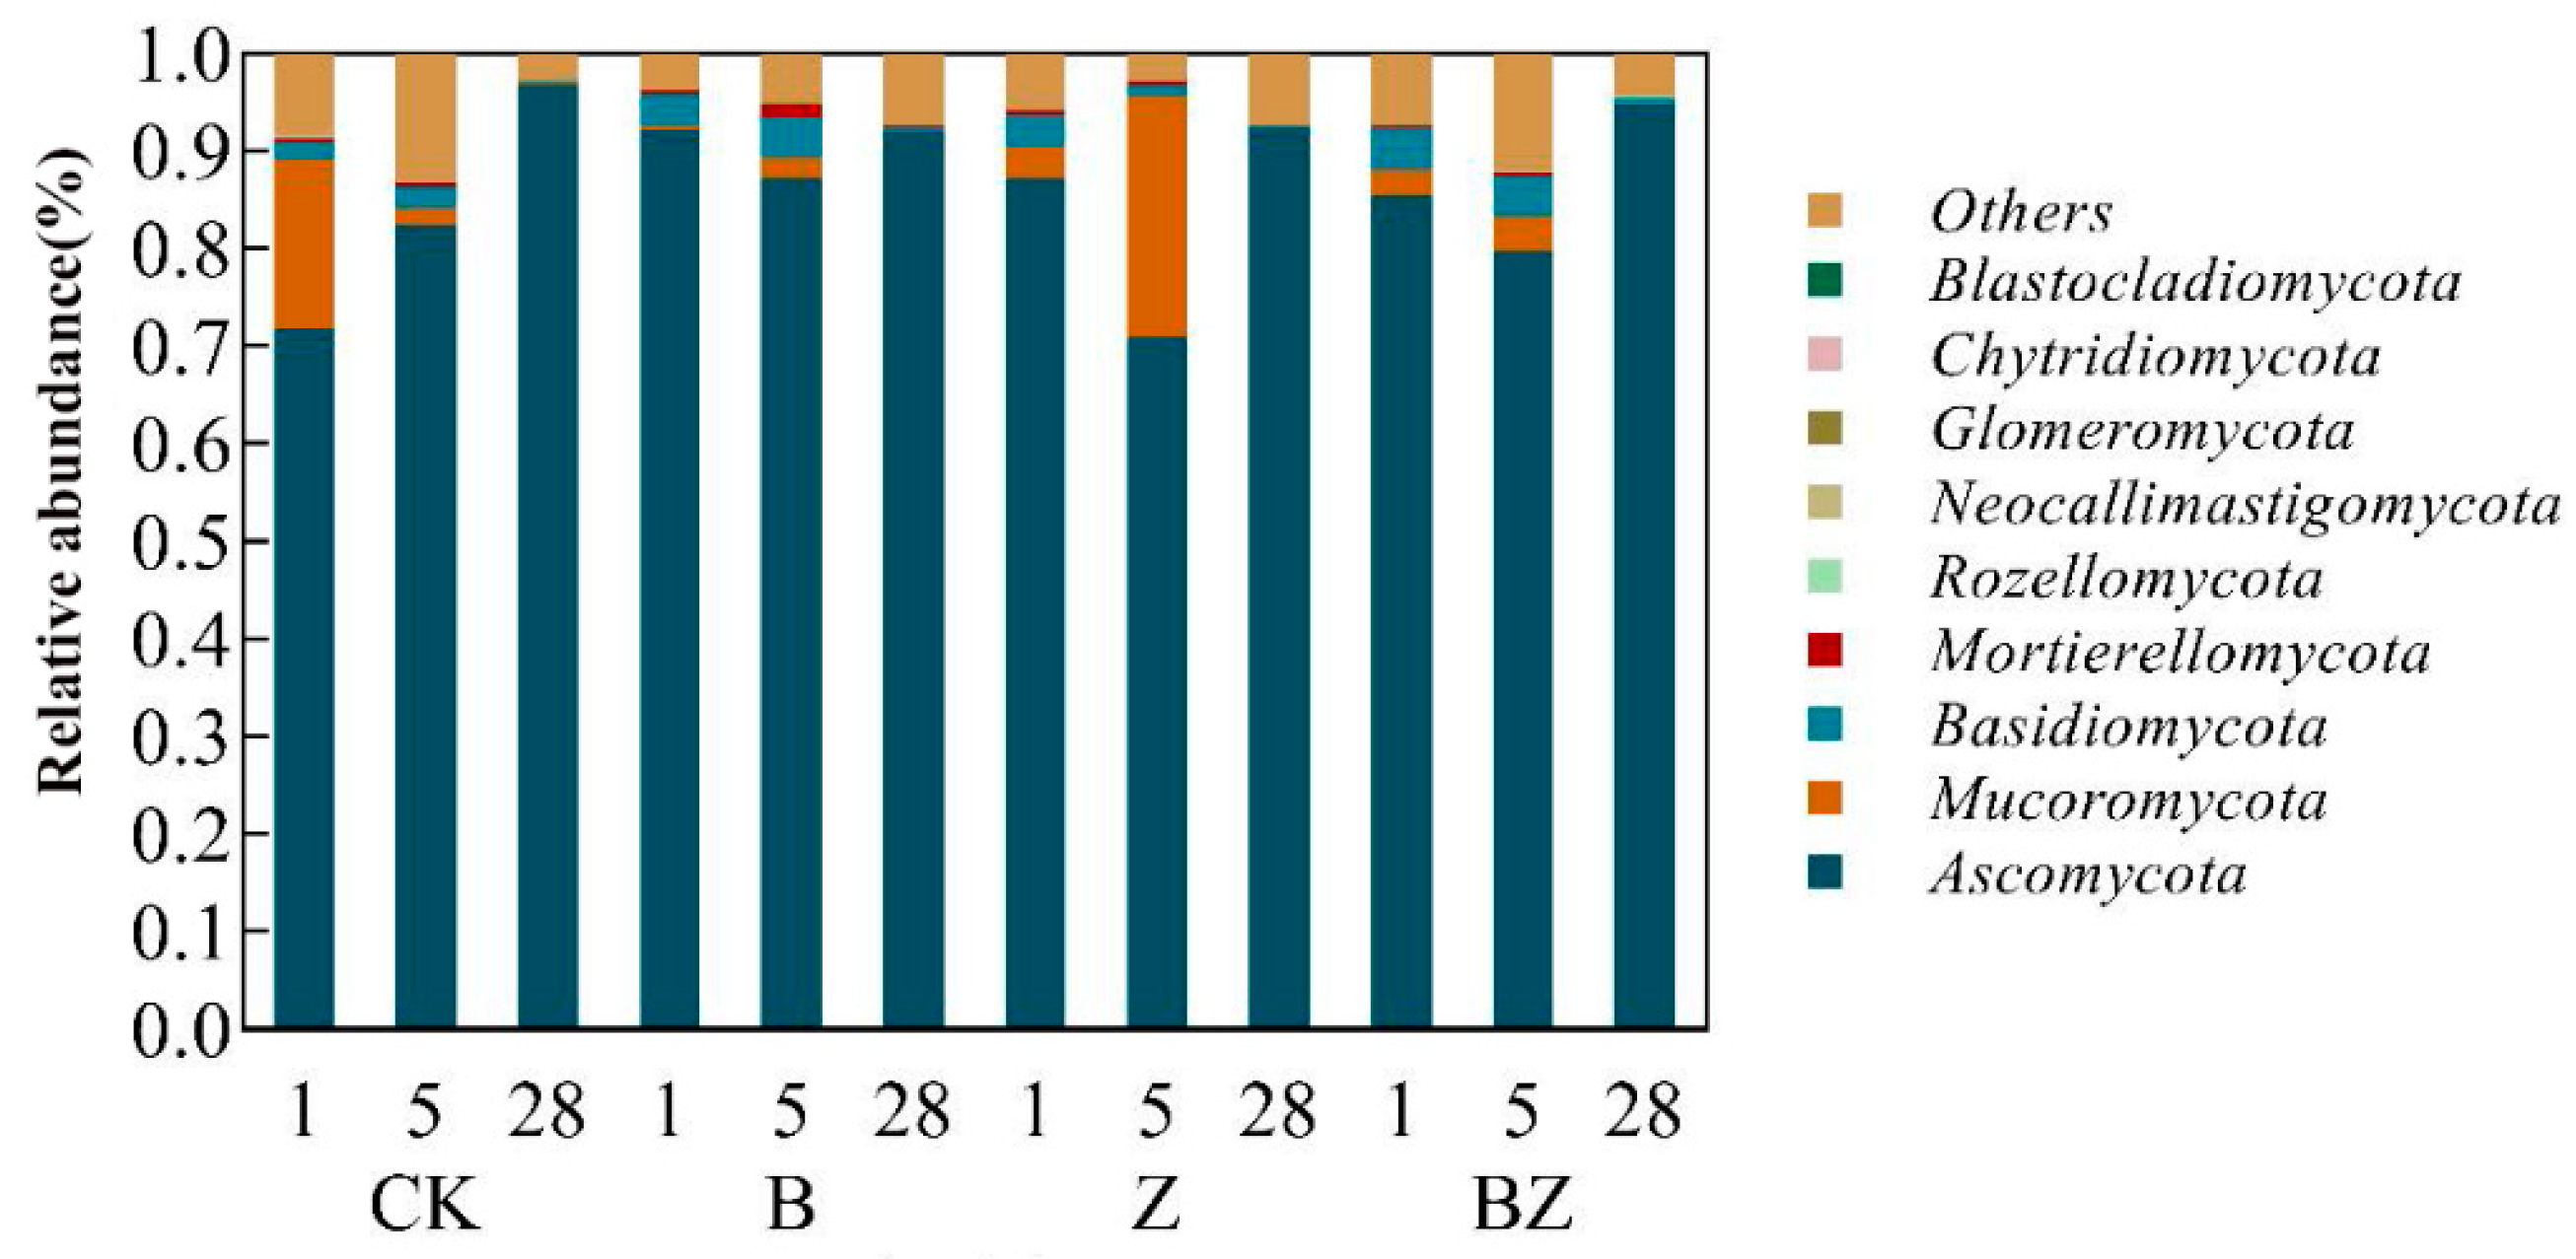
3.2. The Impact of Various Conditioners on Microbial Community Alterations in Reactors

The alterations in fungal populations at the phylum level are illustrated in Figure 5. At the phylum level, Ascomycota emerged as the predominant population throughout all stages of the four compost groups, followed by Mucoromycota and Basidiomycota. In the initial stage, the introduction of the conditioner led to an increase in the relative abundance of Ascomycota. The relative abundance of Ascomycota in group CK at D1 was 71.79%, while in group B, group Z, and group BZ D1 samples, it reached 92.17%, 87.22%, and 85.42%, respectively. The inclusion of biochar significantly augmented the relative abundance of Ascomycota in the reactor. This finding aligns with Mianshen Ge’s observation that biochar increased the relative abundance of Ascomycota in cow manure compost when biochar was used as a modifier [37]. In the CK group, Ascomycota’s relative abundance progressively increased throughout the composting process. Differently, in groups B, Z, and BZ, Ascomycota’s relative abundance initially declined before rising, with the final proportion exceeding that at the commencement of composting. The community structure of fungi was influenced by three types of conditioners. In the CK group, Mucoromycota’s relative abundance stood at 17.39% during the initial warming phase of composting. As composting progressed, this figure decreased to 1.70%, causing it to exit the dominant group during the cooling phase. The introduction of biochar and zeolite altered the trend for Mucoromycota during the high-temperature phase. Notably, the relative abundance of Mucoromycota increased during the high-temperature stage in group B, while in group Z, which included zeolite, the proportion reached 24.60%. The phase pair abundance of Mucoromycota at high temperatures was influenced by the conditioner’s addition. Similarly, the relative abundance of Basidiomycota and Mortierellomycota in groups B and BZ rose during the high-temperature period, showing a significant increase compared to group CK. However, Ascomycota remained the predominant strain during the cooling phase of compost.
Figure 6 illustrates the variations in bacterial phyla levels across different composts. The dominant phyla during the initial and high-temperature phases were Proteobacteria, Firmicutes, Actinobacteria, and Bacteroidetes. The introduction of the conditioner notably augmented the relative abundance of Proteobacteria while reducing that of Firmicutes. Specifically, the relative abundance of Proteobacteria during the biochar and zeolite as mixed conditioning agents reached 74.22% and 80.00%, respectively. Moreover, these conditioners altered the trends for Proteobacteria and Firmicutes during the high-temperature phase, reversing the decline observed in the CK group. In the cooling phase, the conditioning group saw a decrease in the relative abundance of Firmicutes, while there was an increase in Bacteroidetes and Chloroflexi.
The restrictive linear analysis incorporated the physicochemical index of the composting group as an environmental variable and the top ten dominant species as a response variable. The results are presented in Figure 7. The Redundancy Analysis (RDA) demonstrated that Axis 1 and Axis 2 accounted for 90.06% and 4.14% of the variance in the fungal community structure, respectively. The variables TN (p = 0.002), C/N (p = 0.006), and TP (p = 0.01) significantly influenced the alterations in fungal community structure, accounting for 64.0%, 60.6%, and 54.1% of the variance, respectively. The TOC’s impact on the microbial community structure was significant at p < 0.05, explaining 47.8% of the variation. Fungi such as Penicillum, Mucor, Aspergillus, Didymella, Microascus, Scopulariopsis, and Botryotrichum exhibited a positive correlation with TOC, TP, and C/N, while demonstrating a negative correlation with TN. The concentration of Mycother was predominantly influenced by the levels of TN and TP, exhibiting a positive correlation. The RDA revealed that Axis 1 and Axis 2 accounted for 91.23% and 2.44% of the variance in the bacterial community structure, respectively. The TN (p = 0.002), C/N (p = 0.004), TP (p = 0.006), and TOC (p = 0.008) significantly influenced the alterations in the bacterial community structure, contributing to 66.1%, 62.6%, 56.0%, and 49.4% of the changes, respectively. Turicibacter, Romboutsia, and Clostridium_sensu_stricto_1 exhibited similar patterns of change, which were positively correlated with the carbon-to-nitrogen ratio and negatively correlated with total nitrogen and total phosphorus. The genera Turicibacter, Romboutsia, and Clostridium may be influenced by variations in moisture content and conductivity. Similarly, the genera Corynebacterium, Acinetobacter, and Glutamicibacter could be affected by changes in temperature and pH levels.

3.3. The Impact of Conditioners on the Phytotoxicity and Maturation Process of Deer Manure Compost

The seed germination index (GI) has been widely used as a bio-indicator to assess the toxicity and maturity of composted plants [38]. Figure 8 illustrates the fluctuation in the GI of each treated seed throughout the composting process. Among the three compost groups, only BZ exhibited a GI value exceeding 100% on D29, theoretically indicating no detrimental impact on seed germination. The GI value for the compost with added conditioner was significantly higher than that of the CK group. Furthermore, the mixed conditioner GI value in the BZ group surpassed the GI values of single-conditioner composting in the B and Z groups. By the end of the composting period, as depicted in Figure 9, the GI of all four groups had increased, with the GIs for CK, B, Z, and BZ being 75.20%, 97.90%, 89.48%, and 98.5%, respectively. It is widely accepted that compost is essentially non-toxic when the GI exceeds 50% and is fully decomposed when the GI surpasses 80% [39]. Therefore, it can be inferred that the compost products in this study were relatively non-toxic and exerted minimal effects on seed germination. This suggests that adding conditioners to compost can enhance compost maturation and reduce toxicity to plants. Furthermore, a mixture of conditioners is more effective than using a single type of conditioner in compost.
The C/N is a crucial determinant of compost quality, reflecting the decomposition process. The T-value, defined as the ratio of the current C/N to its initial value, provides a more dynamic perspective on this change. As illustrated in Figure 10, the initial C/N ratios for the four compost groups ranged from 25 to 30, which aligned with the optimal initial range for composting. Upon the initiation of composting, a consistent decline was observed in the C/N ratios across all groups (Figure 10A). By the end of the composting period, the C/N ratios were ranked as follows: Z (12.48) > CK (11.69) > BZ (11.48) > B (10.50). In terms of the T-values, they mirrored the trend of the C/N ratios, with the final values being Z (0.50) > BZ (0.44) > B (0.40) > CK (0.38). Notably, by the conclusion of the composting phase, the T-values for all groups were below 0.6, indicating that the compost in each group had undergone significant decomposition.
A correlation analysis was conducted using SPSS to identify evaluation indicators, with the results presented in Table 4. The pH level demonstrated a significant correlation with several variables: TN, TP, electric conductivity (EC), C/N, and T-values at the 0.01 level. Additionally, it was significantly correlated with TOC at the 0.05 level. The C/N ratios and T-values were significantly associated with all indicators at the 0.01 level, except for EC and GI, where T-values were significantly associated with GI at the 0.05 level. While both C/N and T-values indicate changes in carbon and nitrogen, T-values specifically reflect the dynamics of the C/N ratio throughout the composting process. Additionally, moisture content serves as a representation of the stability of the composting degree [18,40]. Consequently, pH, GI, C/N ratio, T-value, and moisture content (MC) were selected as the evaluation indexes.
As indicated in Table 5, Matlab 2017 software was utilized to analyze the data of D36 post-composting. The findings are presented in Table 6 and Figure 11. The highest correlation between the four compost groups and the maturation level was reached by the BZ group, which demonstrated the strongest correlation coefficient at 0.8346, signifying the highest degree of maturation. The correlation coefficients for the remaining three groups were as follows: Z (0.8316) > B (0.8226) > CK (0.8102). The inclusion of a conditioner appeared to enhance compost maturation, with the combined addition of biochar and zeolite proving most effective. Furthermore, the impact of zeolite surpassed that of biochar.

4. Conclusions

This paper examined the aerobic composting process of deer manure and straw, utilizing biochar, zeolite, and their combination as conditioners. The study analyzed changes in basic physical and chemical properties, as well as the degradation process within the reactor, in conjunction with alterations in the microbial community structure. The primary conclusions drawn are as follows:
(1)
The conditioner significantly enhanced the degradation of organic matter, with the following order of effectiveness: BZ (34.83%) > Z (26.52%) > B (22.12%). The inclusion of biochar helped to mitigate nitrogen loss in the compost heap, with the peak TN content of composting reaching 39.55 g/kg. Additionally, the incorporation of zeolite and biochar modified is beneficial for the retention of phosphorus in the reactor, with the zeolite demonstrating a positive effect, resulting in a phosphorus content of 47.47 g/kg in the reactor.
(2)
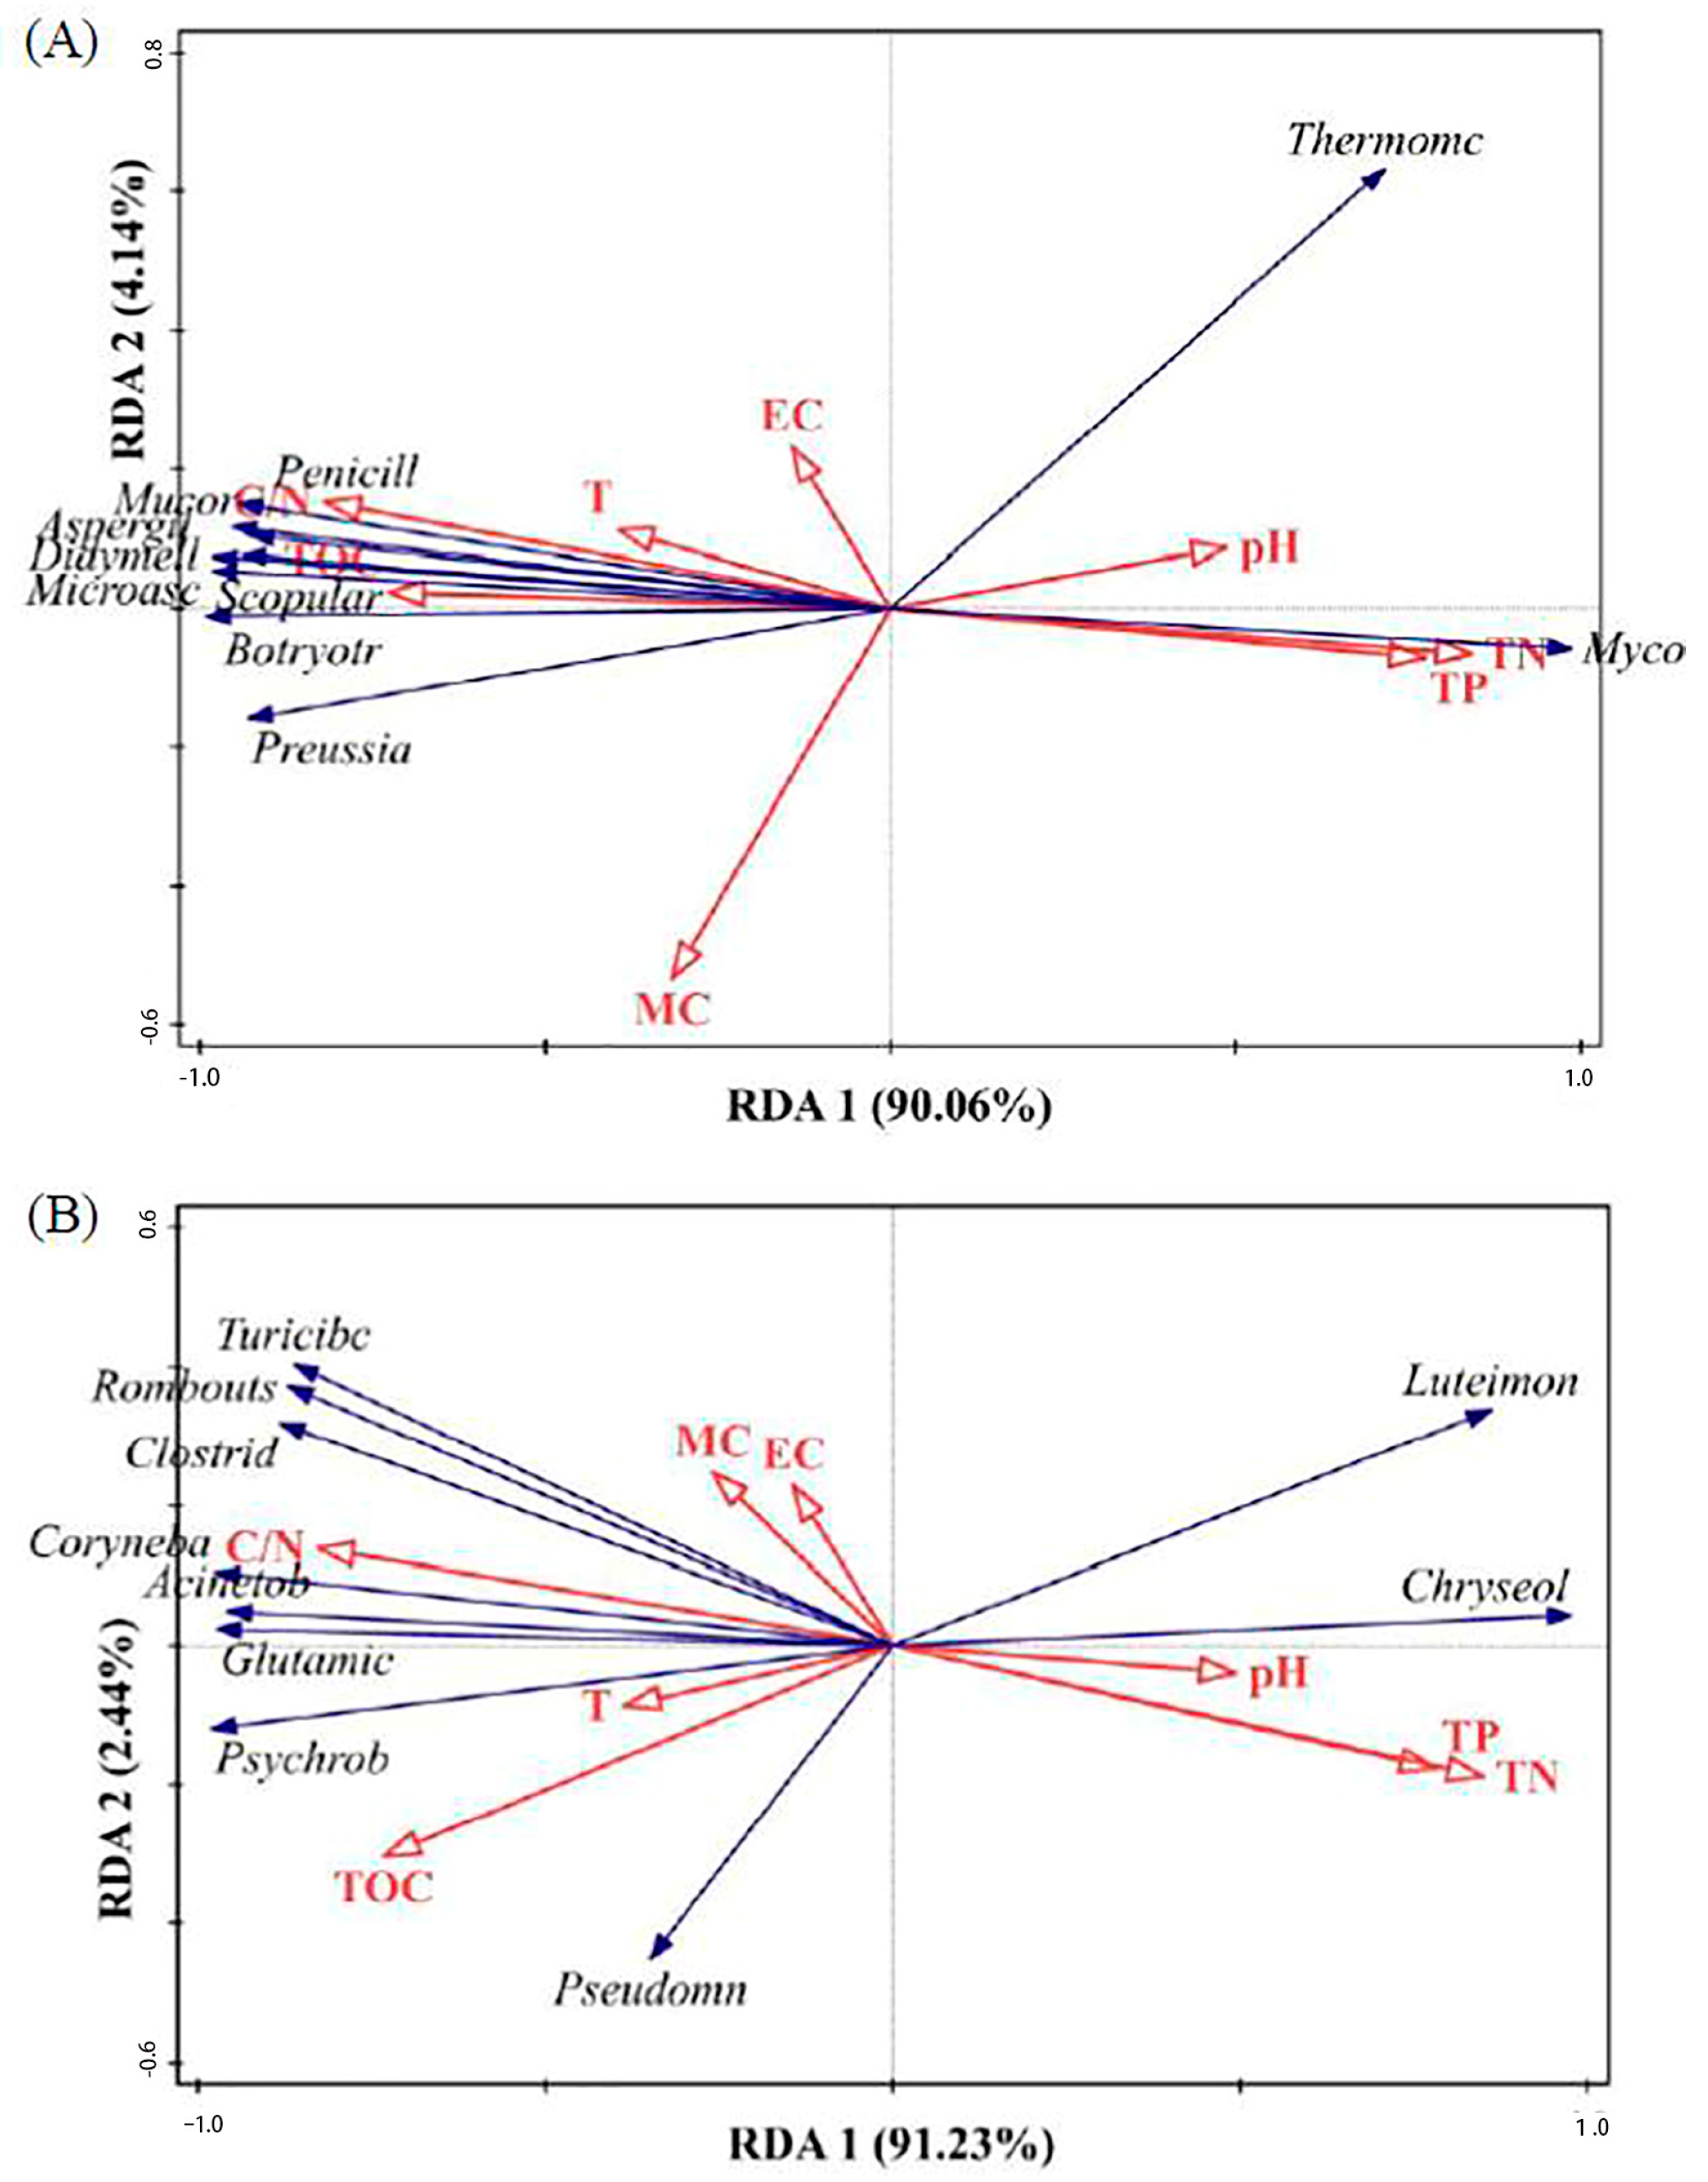
Dominant strains during the compost cooling phase differed markedly from those prevalent in the warming and high-temperature phases. During the warming and high-temperature stages, the dominant species were bacteria such as Psychrobacter, Tuicibacter, and Glutamicibacter, along with fungi like Botryotrichum, Aspergillus, and Mucor. In contrast, the cooling phase saw a shift to bacterial species including Luteimonas, Pseudomonas, Chryseolinea, and fungal species Mycothermus and Thermomyces.
(3)
The redundant analysis revealed that using biochar and zeolite as conditioners altered the bacterial community structure. Environmental factors influenced this change in microbial community structure; TN (p = 0.002), C/N (p = 0.004), TP (p = 0.006), and TOC (p = 0.008) had significant impacts on the bacterial community structure, accounting for 66.1%, 62.6%, 56.0%, and 49.4%, respectively. Notably, changes in Coryneba, Acinetob, and Glutamic were positively associated with alterations in the C/N ratio and negatively correlated with TN and TP.
(4)
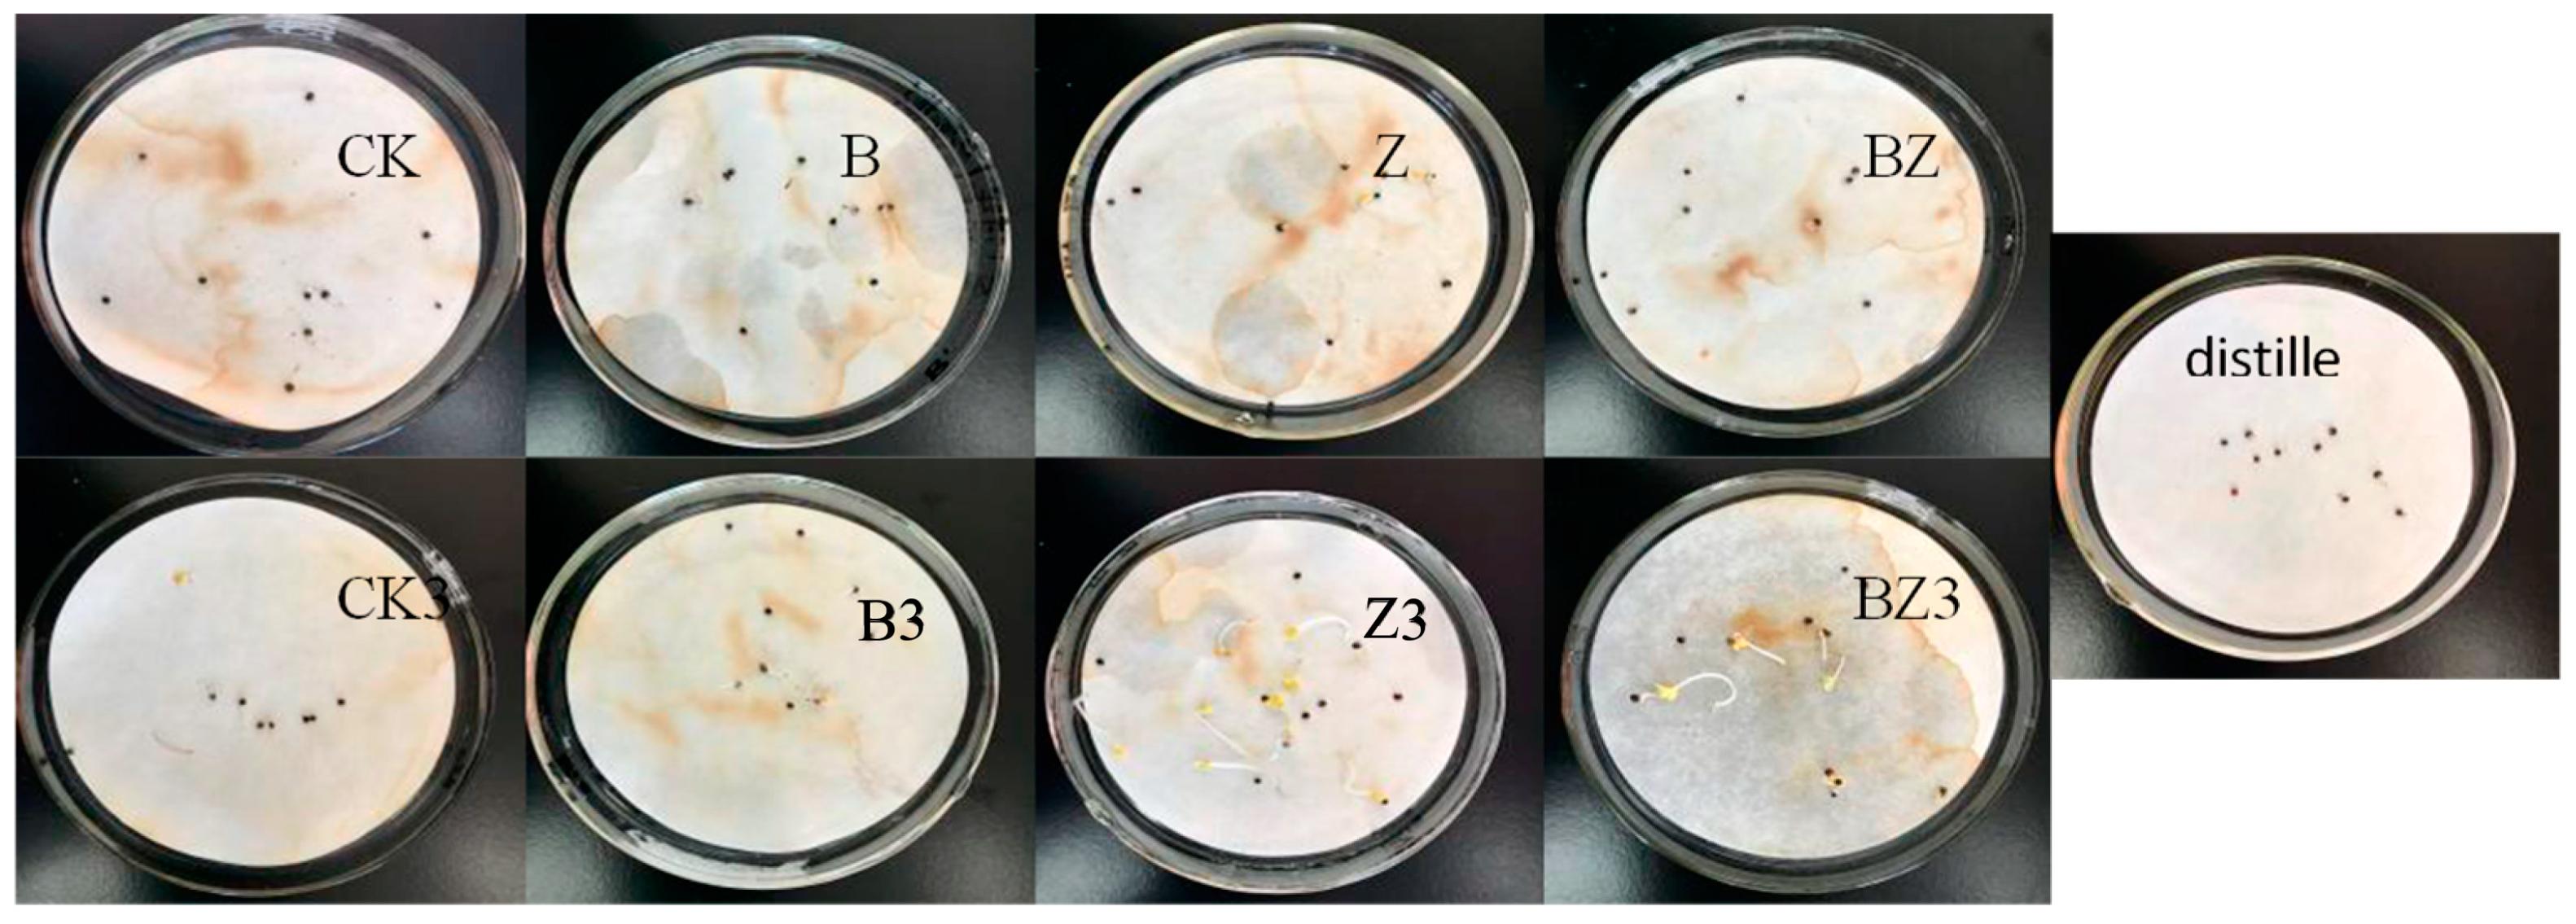
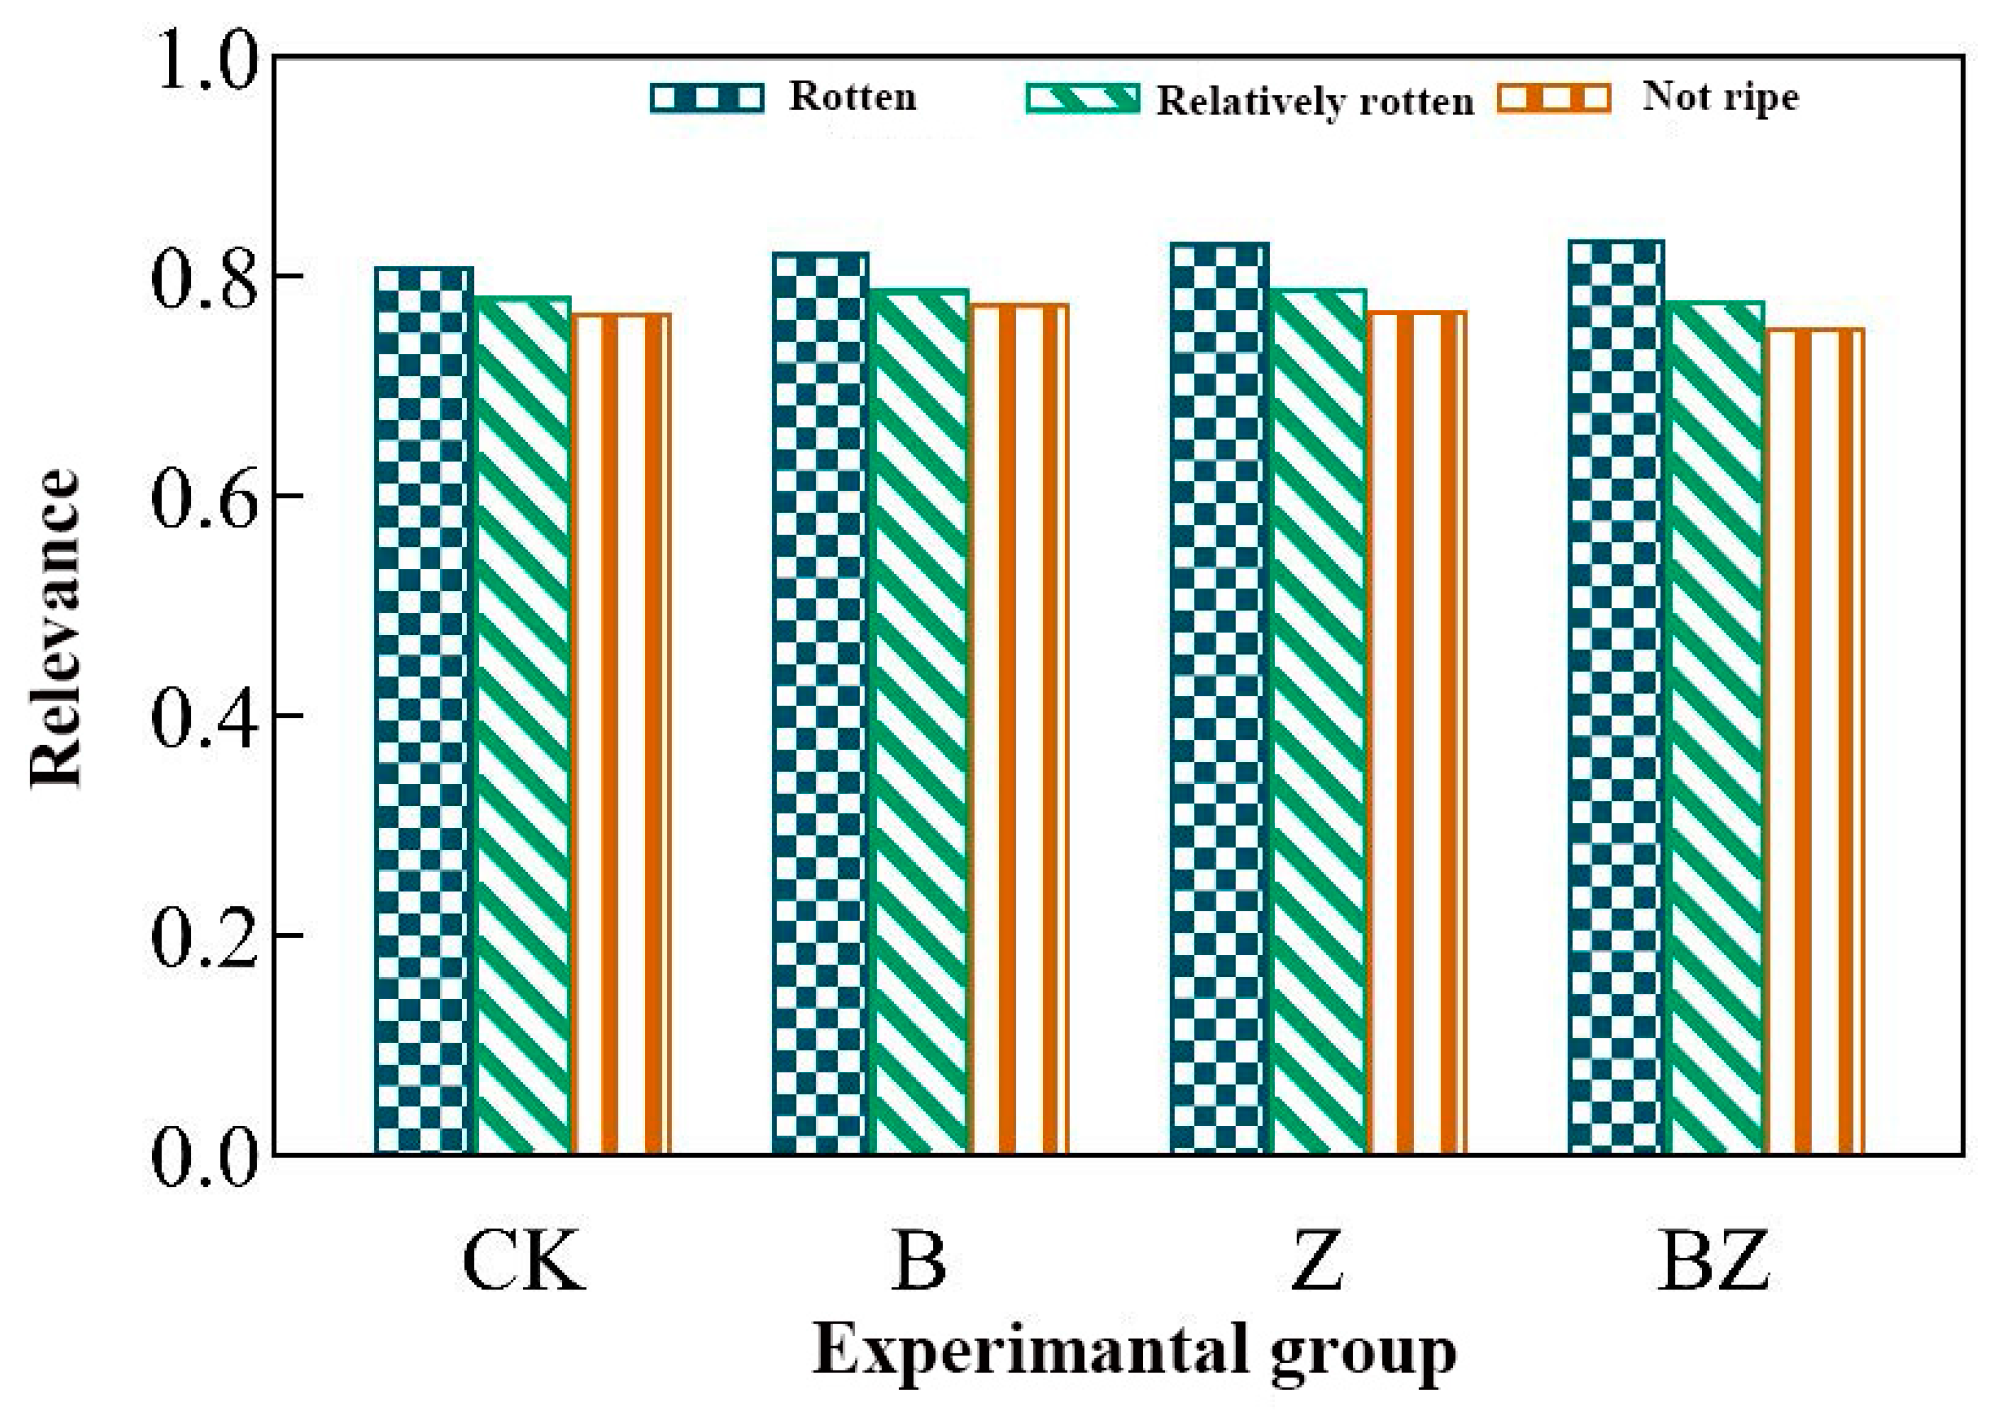
Composting effectively mitigated the phytotoxicity inherent in deer manure. The incorporation of compost products, when combined with biochar and zeolite conditioners, exhibited minimal toxicity, resulting in a negligible impact on seed germination, as evidenced by a GI value of 98.5%. Notably, the addition of a conditioner comprising a mixture of biochar and zeolite yielded the highest degree of composting decay. This mixture demonstrated the strongest correlation with the maturation process, evidenced by a correlation coefficient of 0.8346.

Author Contributions

Formal analysis, J.X. and J.F.; investigation, X.W. and J.S.; writing—original draft preparation, J.X. and J.F.; software, J.F.; data curation, W.Z. and J.S.; writing—review and editing, X.W. and W.Z.; supervision, J.X.; project administration, J.X.; funding acquisition, J.X. All authors have read and agreed to the published version of the manuscript.

Funding

This research was funded by National Natural Science Foundation of China (No. 42461013), Scientific Research Foundation of Hainan Tropical Ocean University (No. RHDRC202333), Strategic Priority Research Program of the Chinese Academy of Sciences (Grant No. XDA28020102), the Project of Changchun City Technology Bureau (No. 16SS06), and Strategic Research and Consulting Project of the Chinese Academy of Engineering (JL2024-18). The authors thank the editor for his efforts on this paper.

Institutional Review Board Statement

Not applicable.

Informed Consent Statement

Not applicable.

Data Availability Statement

The datasets presented in this article are not available because the data are part of an ongoing study. Requests to access the datasets should be directed to the corresponding author.

Conflicts of Interest

The authors declare no conflicts of interest.

References

  1. Ran, H.; Li, J. The current status and development of agricultural waste resourceization and the use of rural biomass energy use. Energy Conserv. Environ. Prot. 2019, 6, 75–76. [Google Scholar]
  2. Shi, K.; Xue, J.; Hu, S. Treatment and utilization of agricultural solid waste. World Environ. 2018, 5, 19–22. [Google Scholar]
  3. Wang, H.; Yao, D.; Xu, J.; Liu, X.; Sheng, L. Investigation of Technology for Composting Mixed Deer Manure and Straw. Environ. Sci. Pollut. Res. 2021, 28, 45805–45825. [Google Scholar] [CrossRef]
  4. Wang, H.; Lu, Y.; Xu, J.; Liu, X.; Sheng, L. Effects of Additives on Nitrogen Transformation and Greenhouse Gases Emission of Co-Composting for Deer Manure and Corn Straw. Environ. Sci. Pollut. Res. 2021, 28, 13000–13020. [Google Scholar] [CrossRef] [PubMed]
  5. Shuangyang District People’s Government of Changchun City. Available online: http://www.shuangyang.gov.cn/zjsy/tssy/sygk/ (accessed on 17 November 2024).
  6. Adesokan, H.K.; Ocheja, S.E. Knowledge, Attitudes and Practices of Traceability among Livestock Traders in South-Western Nigeria: Implications for Sustainable Livestock Industry. Trop. Anim. Health. Prod. 2014, 46, 159–165. [Google Scholar] [CrossRef] [PubMed]
  7. Wang, H.; Xu, J.; Liu, X.; Sheng, L.; Zhang, D.; Li, L.; Wang, A. Study on the Pollution Status and Control Measures for the Livestock and Poultry Breeding Industry in Northeastern China. Environ. Sci. Pollut. Res. 2018, 25, 4435–4445. [Google Scholar] [CrossRef] [PubMed]
  8. Wang, H.; Xu, J.; Sheng, L. Study on the Comprehensive Utilization of City Kitchen Waste as a Resource in China. Energy 2019, 173, 263–277. [Google Scholar] [CrossRef]
  9. Cao, Z.; Qin, X.; Wen, X.; Sun, R.; Fu, M.; Li, Q. Modified Illite/Smectite Clay Promoted Composting Humification and Maturation Mediated by Reducing Greenhouse Gas Emissions. Biomass Conv. Bioref. 2024, 14, 1–13. [Google Scholar] [CrossRef]
  10. Xu, Z.; Li, R.; KuoK Ho Tang, D.; Zhang, X.; Zhang, X.; Liu, H.; Quan, F. Enhancing Nitrogen Transformation and Humification in Cow Manure Composting through Psychrophilic and Thermophilic Nitrifying Bacterial Consortium Inoculation. Bioresour. Technol. 2024, 413, 131507. [Google Scholar] [CrossRef]
  11. Ye, P.; Fang, L.; Song, D.; Zhang, M.; Li, R.; Awasthi, M.K.; Zhang, Z.; Xiao, R.; Chen, X. Insights into Carbon Loss Reduction during Aerobic Composting of Organic Solid Waste: A Meta-Analysis and Comprehensive Literature Review. Sci. Total Environ. 2023, 862, 160787. [Google Scholar] [CrossRef] [PubMed]
  12. Yan, H.; Yang, H.; Li, K.; Zhu, P.; Li, X.; Li, Q. Biochar Addition Modified Carbon Flux and Related Microbiota in Cow Manure Composting. Waste Biomass Valor. 2023, 14, 847–858. [Google Scholar] [CrossRef]
  13. Gu, B.; Zhang, X.; Lam, S.K.; Yu, Y.; van Grinsven, H.J.M.; Zhang, S.; Wang, X.; Bodirsky, B.L.; Wang, S.; Duan, J.; et al. Cost-Effective Mitigation of Nitrogen Pollution from Global Croplands. Nature 2023, 613, 77–84. [Google Scholar] [CrossRef]
  14. Zhang, C.; Zeng, G.; Huang, D.; Lai, C.; Chen, M.; Cheng, M.; Tang, W.; Tang, L.; Dong, H.; Huang, B.; et al. Biochar for Environmental Management: Mitigating Greenhouse Gas Emissions, Contaminant Treatment, and Potential Negative Impacts. Chem. Eng. J. 2019, 373, 902–922. [Google Scholar] [CrossRef]
  15. López-Cano, I.; Roig, A.; Cayuela, M.L.; Alburquerque, J.A.; Sánchez-Monedero, M.A. Biochar Improves N Cycling during Composting of Olive Mill Wastes and Sheep Manure. Waste Manag. 2016, 49, 553–559. [Google Scholar] [CrossRef] [PubMed]
  16. Das, S.K.; Ghosh, G.K.; Avasthe, R. Biochar Application for Environmental Management and Toxic Pollutant Remediation. Biomass Conv. Bioref. 2023, 13, 555–566. [Google Scholar] [CrossRef]
  17. Sanchez-Monedero, M.A.; Cayuela, M.L.; Roig, A.; Jindo, K.; Mondini, C.; Bolan, N. Role of Biochar as an Additive in Organic Waste Composting. Bioresour. Technol. 2018, 247, 1155–1164. [Google Scholar] [CrossRef] [PubMed]
  18. Wei, L.; Shutao, W.; Jin, Z.; Tong, X. Biochar Influences the Microbial Community Structure during Tomato Stalk Composting with Chicken Manure. Bioresour. Technol. 2014, 154, 148–154. [Google Scholar] [CrossRef] [PubMed]
  19. Qu, C.; Chen, W.; Hu, X.; Cai, P.; Chen, C.; Yu, X.-Y.; Huang, Q. Heavy Metal Behaviour at Mineral-Organo Interfaces: Mechanisms, Modelling and Influence Factors. Environ. Int. 2019, 131, 104995. [Google Scholar] [CrossRef] [PubMed]
  20. Zhang, L.; Sun, X. Effects of Earthworm Casts and Zeolite on the Two-Stage Composting of Green Waste. Waste Manag. 2015, 39, 119–129. [Google Scholar] [CrossRef] [PubMed]
  21. Duan, M.; Zhang, Y.; Zhou, B.; Wang, Q.; Gu, J.; Liu, G.; Qin, Z.; Li, Z. Changes in Antibiotic Resistance Genes and Mobile Genetic Elements during Cattle Manure Composting after Inoculation with Bacillus Subtilis. Bioresour. Technol. 2019, 292, 122011. [Google Scholar] [CrossRef] [PubMed]
  22. Wang, X.; Feng, J.; Haider, M.A.; Xu, J.; Sun, J.; Chen, Y. Study on the Effect of Conditioners on the Degradation of Tetracycline Antibiotics in Deer Manure Composting. Fermentation 2024, 10, 575. [Google Scholar] [CrossRef]
  23. Wang, Q.; Awasthi, M.K.; Ren, X.; Zhao, J.; Li, R.; Wang, Z.; Chen, H.; Wang, M.; Zhang, Z. RETRACTED: Comparison of Biochar, Zeolite and Their Mixture Amendment for Aiding Organic Matter Transformation and Nitrogen Conservation during Pig Manure Composting. Bioresour. Technol. 2017, 245, 300–308. [Google Scholar] [CrossRef]
  24. Wang, H.; Xu, J.; Sheng, L.; Teng, H. Study on Treatment of City Tail Water by Constructed Wetland with Corn Straw Biochar Substrate. Environ. Technol. Innov. 2022, 28, 102855. [Google Scholar] [CrossRef]
  25. NY525-2021; Organic Fertilizer. China Agricultural Press: Beijing, China, 2021.
  26. HJ 634-2012; Soil-Determination of Ammonium, Nitrite and Nitrate by Extraction with Potassium Chloride Solution -Spectrophotometric Methods. China Agricultural Press: Beijing, China, 2012.
  27. Norman, R.J.; Edberg, J.C.; Stucki, J.W. Determination of Nitrate in Soil Extracts by Dual-wavelength Ultraviolet Spectrophotometry. Soil Sci. Soc. Am. J. 1985, 49, 1182–1185. [Google Scholar] [CrossRef]
  28. Dias, B.O.; Silva, C.A.; Higashikawa, F.S.; Roig, A.; Sánchez-Monedero, M.A. Use of Biochar as Bulking Agent for the Composting of Poultry Manure: Effect on Organic Matter Degradation and Humification. Bioresour. Technol. 2010, 101, 1239–1246. [Google Scholar] [CrossRef] [PubMed]
  29. Chen, W.; Liao, X.; Wu, Y.; Liang, J.B.; Mi, J.; Huang, J.; Zhang, H.; Wu, Y.; Qiao, Z.; Li, X.; et al. Effects of Different Types of Biochar on Methane and Ammonia Mitigation during Layer Manure Composting. Waste Manag. 2017, 61, 506–515. [Google Scholar] [CrossRef] [PubMed]
  30. Janczak, D.; Malińska, K.; Czekała, W.; Cáceres, R.; Lewicki, A.; Dach, J. Biochar to Reduce Ammonia Emissions in Gaseous and Liquid Phase during Composting of Poultry Manure with Wheat Straw. Waste Manag. 2017, 66, 36–45. [Google Scholar] [CrossRef]
  31. Agyarko-Mintah, E.; Cowie, A.; Van Zwieten, L.; Singh, B.P.; Smillie, R.; Harden, S.; Fornasier, F. Biochar Lowers Ammonia Emission and Improves Nitrogen Retention in Poultry Litter Composting. Waste Manag. 2017, 61, 129–137. [Google Scholar] [CrossRef]
  32. Agyarko-Mintah, E.; Cowie, A.; Singh, B.P.; Joseph, S.; Van Zwieten, L.; Cowie, A.; Harden, S.; Smillie, R. Biochar Increases Nitrogen Retention and Lowers Greenhouse Gas Emissions When Added to Composting Poultry Litter. Waste Manag. 2017, 61, 138–149. [Google Scholar] [CrossRef]
  33. Garcia-Rodríguez, A.; Matamoros, V.; Fontàs, C.; Salvadó, V. The Influence of Light Exposure, Water Quality and Vegetation on the Removal of Sulfonamides and Tetracyclines: A Laboratory-Scale Study. Chemosphere 2013, 90, 2297–2302. [Google Scholar] [CrossRef]
  34. Liu, N.; Zhou, J.; Han, L.; Ma, S.; Sun, X.; Huang, G. Role and Multi-Scale Characterization of Bamboo Biochar during Poultry Manure Aerobic Composting. Bioresour. Technol. 2017, 241, 190–199. [Google Scholar] [CrossRef] [PubMed]
  35. Yun, P.; Ma, Q.; Huang, M.; Yan, Y.; Yan, Z.; Wang, X. Carbon and Phosphorus Characteristics of Different Urban and Rural Organic Waste Composts. Southwest China J. Agric. Sci. 2023, 36, 1455–1464. [Google Scholar]
  36. Wang, Y.; Li, N.; Zhu, D.; Zhou, W.; Chen, Y.; Wu, Y. Influence of Straw Pretreatment on Phosphorus Forms during the Process of Pig Manure Thermophilic Composting. J. Plant Nutr. Fertil. 2019, 25, 963–971. [Google Scholar] [CrossRef]
  37. Ge, M.; Zhou, H.; Shen, Y.; Meng, H.; Zhou, J.; Dong, S.; Li, R.; Zhang, X.; Cheng, H.; Wang, J. Effect of Additives on the Succession of Fungal Community in Different Phases of Cattle Manure Composting. China Environ. Sci. 2019, 39, 5173–5181. [Google Scholar]
  38. Luo, Y.; Liang, J.; Zeng, G.; Chen, M.; Mo, D.; Li, G.; Zhang, D. Seed Germination Test for Toxicity Evaluation of Compost: Its Roles, Problems and Prospects. Waste Manag. 2018, 71, 109–114. [Google Scholar] [CrossRef]
  39. Yan, X.; Hou, M.; Li, B.; Wang, S.; Liang, Y. Effects of Microbial Inoculant, Biomass Charcoal and Mushroom Residue on Sludge Composting. CAB Rev. Perspect. Agric. Vet. Sci. Nutr. Nat. Resour. 2018, 31, 136–142. [Google Scholar] [CrossRef]
  40. Luangwilai, T.; Sidhu, H.S.; Nelson, M.I. One-Dimensional Spatial Model for Self-Heating in Compost Piles: Investigating Effects of Moisture and Air Flow. Food Bioprod. Process. 2018, 108, 18–26. [Google Scholar] [CrossRef]
  41. He, Y.; Inamori, Y.; Mizuochi, M.; Kong, H.; Iwami, N.; Sun, T. Nitrous Oxide Emissions from Aerated Composting of Organic Waste. Environ. Sci. Technol. 2001, 35, 2347–2351. [Google Scholar] [CrossRef]
  42. Mao, H.; Lv, Z.; Sun, H.; Li, R.; Zhai, B.; Wang, Z.; Awasthi, M.K.; Wang, Q.; Zhou, L. Improvement of Biochar and Bacterial Powder Addition on Gaseous Emission and Bacterial Community in Pig Manure Compost. Bioresour. Technol. 2018, 258, 195–202. [Google Scholar] [CrossRef]
  43. Sánchez-García, M.; Alburquerque, J.A.; Sánchez-Monedero, M.A.; Roig, A.; Cayuela, M.L. Biochar Accelerates Organic Matter Degradation and Enhances N Mineralisation during Composting of Poultry Manure without a Relevant Impact on Gas Emissions. Bioresour. Technol. 2015, 192, 272–279. [Google Scholar] [CrossRef] [PubMed]
  44. Seekins, W.; Hutchinson, M.; King, M.; MacDonald, G. Pile Structure in Large Animal Carcass Compost Piles: Zone Differences in Physical and Chemical Characteristics. Compost. Sci. Util. 2015, 23, 67–86. [Google Scholar] [CrossRef]
Figure 1. Composting unit diagram.
Fermentation 11 00066 g001
Figure 2. Changes in TOC when composting the four groups.
Fermentation 11 00066 g002
Figure 3. Changes in nitrogen content when composting the four groups: (A) TN; (B) Ammonia nitrogen; (C) Nitrate nitrogen; (D) Nitrous nitrogen.
Fermentation 11 00066 g003
Figure 4. Changes in TP during composting.
Fermentation 11 00066 g004
Figure 5. The relative abundance of fungal populations for four composts at the phylum level.
Fermentation 11 00066 g005
Figure 6. The relative abundance of bacterial populations for four composts at the phylum level.
Fermentation 11 00066 g006
Figure 7. The redundancy analysis of microbial community structure and environmental factors: (A) fungi, (B) bacteria.
Fermentation 11 00066 g007
Figure 8. Experimental results of seed germination.
Fermentation 11 00066 g008
Figure 9. Changes in the GI of compost samples.
Fermentation 11 00066 g009
Figure 10. Changes in C/N ratio and T value during composting. (A) C/N; (B) T Value.
Fermentation 11 00066 g010
Figure 11. Maturity gray analysis.
Fermentation 11 00066 g011
Table 1. Analysis of properties of biochar.
PropertiesApparent Density
(×103 kg·m−3)
Porosity (%)SSA (m2·g−1)Average Pore Size (nm)
Biochar0.257 ± 0.00660.94 ± 6.62305.52 ± 9.231.286 ± 0.231
Table 2. Basic physicochemical properties of composting raw materials.
Deer ManureStrawBiocharZeolite
TOC (g/kg)480.88559.07685.01-
TN (g/kg)20.324.8311.62-
C/N23.66115.8458.95-
Moisture content (%)8.586.371.100.14
Table 3. Compost material ratio.
Deer Manure (kg)Straw (kg)Charcoal (kg)Zeolite (kg)Water (kg)
CK3.050.95005.19
B2.980.540.4805.26
Z2.690.8300.485.29
BZ2.830.690.240.245.78
Table 4. The correlation analysis.
TOCTNTPpHECTGIMC
TN−0.331 *
TP−0.458 **0.661 **
pH−0.361 *0.472 **0.467 **
EC−0.1270.1410.1580.528 **
T0.732 **−0.845 **−0.675 **−0.617 **−0.239
GI−0.2220.503 **0.459 **0.102−0.097−0.355 *
MC0.190−0.518 **−0.487 **−0.1430.0580.446 **−0.274
C/N0.709 **−0.869 **−0.718 **−0.587 **−0.1590.971 **−0.508 **0.458 **
* At the 0.05 level (two-tailed), the correlation is significant; ** At the 0.01 level (two-tailed), the correlation is significant.
Table 5. The evaluation criterion.
Rotten EvaluationWater Content [41]GI Value [29]C/N [42]T-value [43]pH [44]
Rotten<40%>80%<10<0.68.0–9.0
Relatively rotten40–50%60–80%10–200.6–0.727.5–8.0
Not ripe>50%<60%>20>0.72<7.5
Table 6. The gray correlation analysis maturity evaluation results.
Correlation CoefficientCKBZBZ
Rotten0.81020.82260.83160.8346
Relatively rotten0.78240.78890.79100.7792
Not ripe0.76770.77590.77050.7542
Disclaimer/Publisher’s Note: The statements, opinions and data contained in all publications are solely those of the individual author(s) and contributor(s) and not of MDPI and/or the editor(s). MDPI and/or the editor(s) disclaim responsibility for any injury to people or property resulting from any ideas, methods, instructions or products referred to in the content.

