Article

Isolation and Purification of Extracellular Inhibitory Products from Bacillus velezensis YJ0-1 and Optimization of Fermentation Medium

Provincial Key Laboratory of Plant Resource Science and Green Production, Jilin Normal University, Siping 136000, China
*
Author to whom correspondence should be addressed.
Fermentation 2025, 11(10), 595; https://doi.org/10.3390/fermentation11100595
Submission received: 28 August 2025 / Revised: 30 September 2025 / Accepted: 14 October 2025 / Published: 16 October 2025
(This article belongs to the Section Microbial Metabolism, Physiology & Genetics)

Abstract

Soybean, as a globally important economic crop, is severely threatened by Sclerotinia sclerotiorum, the causative agent of Sclerotinia stem rot (SSR), a major disease in soybean production worldwide, leading to significant yield losses and quality deterioration. Traditional chemical control methods face challenges such as environmental pollution, pesticide resistance, and limited efficacy. Bacillus velezensis YJ0-1, identified through plate confrontation assays, demonstrated significant inhibitory effects on S. sclerotiorum via acid-precipitated crude extracts from its fermentation broth. A key antimicrobial substance, fengycin (C72H110N12O20, molecular weight 1463.8 Da), was isolated and characterized through acid precipitation, protein purification system separation, and mass spectrometry (MS). Further optimization of the PDB medium using single-factor experiments and Box–Behnken design yielded an optimal formulation: peptone 66.62 g/L, sucrose 32.68 g/L, and pH 6.5. Validation experiments showed an actual yield of 2.03 g/L, with a relative error of only 0.49% compared to the predicted yield of 2.04 g/L, significantly enhancing the synthesis efficiency of fengycin. This study provides novel microbial resources and a theoretical basis for the biological control of SSR in soybeans, while also laying a technical foundation for the industrial production of fengycin, contributing to the advancement of sustainable agriculture.

1. Introduction

Soybean, as one of the most important economic crops worldwide, frequently suffers significant yield reductions due to infection by Sclerotinia sclerotiorum. As a plant pathogenic fungus with broad host adaptability, S. sclerotiorum can infect 361 plant species belonging to 225 genera and 64 families, causing Sclerotinia stem rot that severely threatens global agricultural production [1]. The most severely affected commercial crops include rapeseed, soybean, green bean, lettuce, and carrot. The extensive host range of this pathogen limits control options, as the number of non-host crops available for rotation is restricted [2]. Due to its wide host range and the long-term survival (1–10 years) of sclerotia in soil, traditional crop rotation measures are ineffective for disease control [3], resulting in annual economic losses amounting to hundreds of millions of dollars in global agriculture [4]. Sclerotia are dormant structures that can persist in soil for many years. Under favorable conditions, they produce ascospores, which are disseminated by wind and rain. Thus, sclerotia serve as the primary source of infection [5]. Soybean Sclerotinia stem rot (SSR), also known as white mold, is prevalent throughout major soybean-producing regions of China [6]. It has also caused severe yield losses in other major global producers, including Brazil, the United States, and Canada. In epidemic years, the disease can lead to soybean yield reductions of 20–50% or even complete crop failure [7]. To mitigate economic losses, effective control strategies are required, with current approaches including chemical control, development of resistant soybean varieties, and biological control [8].
Current management of soybean Sclerotinia stem rot primarily relies on chemical fungicides (such as Fluazinam, Dimetachlone, Carbendazim, and Iprodione) [9,10,11], breeding of resistant varieties, and biological control. However, chemical control faces challenges including narrow application windows (e.g., during flowering), susceptibility to seasonal climate fluctuations, environmental residues, and pathogen resistance development [12]. The effectiveness of resistant varieties varies significantly across locations and years. For instance, the same soybean variety showed up to 58% difference in disease incidence across different regions in Wisconsin, USA, and requires multi-year field trials to verify stability [13].
Biological control has emerged as a research focus for replacing chemical pesticides due to its advantages of environmental friendliness, high compatibility, and cost-effectiveness. Over 100 bacterial and fungal biocontrol agents have been developed against Sclerotinia diseases, including Coniothyrium minitans, Clonostachys rosea, Fusarium oxysporum, Trichoderma harzianum, and Metarhizium anisopliae [14,15]. These biocontrol agents exhibit strong antagonistic effects by inhibiting mycelial growth of S. sclerotiorum and can reduce or kill sclerotia to protect plants from infection. Among them, Bacillus velezensis is considered one of the most promising biocontrol agents due to its ability to produce antibiotic lipopeptides (such as surfactin and fengycin), induce plant systemic resistance (ISR), and promote plant growth [16,17,18]. B. velezensis suppresses pathogens through multiple mechanisms: (1) antagonism: secretion of lipopeptides including fengycin (C72H110N12O20) and iturin that disrupt pathogen cell membranes [18,19]; (2) lytic activity: production of hydrolytic enzymes such as chitinase and β-1,3-glucanase that degrade pathogen cell wall [20]; (3) competition and colonization: occupation of rhizosphere ecological niches to inhibit pathogen proliferation [21]; and (4) induced resistance: activation of salicylic acid (SA) and jasmonic acid (JA) signaling pathways to enhance plant immunity [22].
The present study focuses on Bacillus velezensis YJ0-1, isolated from soil in Northeast China and exhibiting highly efficient antagonistic activity against Sclerotinia sclerotiorum. Preliminary experiments demonstrated that its crude extract possesses significant antifungal activity against S. sclerotiorum. This study aims to separate the active substances using a protein purification system, identify their structures via mass spectrometry (MS), and optimize the culture medium using Response Surface Methodology (Box–Behnken design) to enhance the yield of antimicrobial compounds. The research outcomes are expected to provide novel microbial resources and theoretical support for the biological control of soybean Sclerotinia stem rot, establish a theoretical and practical foundation for large-scale industrial production of the antifungal compounds, and offer insights for developing new biocontrol agents.

2. Materials and Methods

2.1. Isolation, Identification and Antimicrobial Activity of Active Compounds

2.1.1. Microbial Strains

The strain used in this study, Bacillus velezensis YJ0-1, was isolated by our laboratory from the rhizosphere soil of Dahurian larch (E 125°10″, N 40°52″) in Wudaojiang Town, Tonghua City, Jilin Province, China. The strain has been deposited in the China General Microbiological Culture Collection Center (CGMCC No. 20507). Previous studies demonstrated its significant antagonistic activity against Sclerotinia sclerotiorum [23]. The S. sclerotiorum strain was kindly provided by Prof. Xiangdong Yang from the Jilin Academy of Agricultural Sciences. B. velezensis YJ0-1 preserved at −80 °C was inoculated into Potato Dextrose Broth (PDB: 20 g/L glucose, 200 g/L potato, pH 7.0) and cultured at 28 °C with shaking (200 rpm) for 24 h to obtain fermentation broth. S. sclerotiorum was cultured on Potato Dextrose Agar (PDA: 20 g/L glucose,200 g/L potato, 15 g/L agar, pH 7.0) at 28 °C for 4 d before use.
The Bacillus velezensis YJ0-1 strain was cultured in Potato Dextrose Broth (PDB). This medium was chosen because it simulates the nutritional environment of its target pathogen, Sclerotinia sclerotiorum, which was originally isolated on Potato Dextrose Agar (PDA), thereby potentially inducing the production of more relevant antifungal metabolites.

2.1.2. Purification and Identification of Active Substances

One liter of B. velezensis YJ0-1 fermentation broth was acidified to pH 2.0 with 0.1 M HCl, maintained at 4 °C for 12 h, and centrifuged (12,000× g, 4 °C, 20 min). The resulting precipitate was collected, resuspended in deionized water, and filtered through a 0.22 μm sterile membrane. Subsequently, the filtrate (2 mL) was subjected to purification using a Clear First 3000Max (Shanghan Flash Spectrum Technology Co., Ltd., Shanghai, China) protein purification system equipped with an Elite G-10 Sephadex column (Cytiva, Marlborough, MA, USA), with deionized water as the mobile phase at a flow rate of 1 mL/min. Eluates were collected at 1-min intervals (yielding 36 fractions). Bioactive fractions were identified through full-wavelength scanning and antimicrobial activity assays. The purified fraction was lyophilized and subsequently analyzed by mass spectrometry at the Science Guide Testing Center (Hangzhou, China).
Mass spectrometric analysis was performed on a Q-Exactive instrument (Thermo Fisher Scientific, CA, USA) equipped with a heated electrospray ionization (HESI) source. The ion source temperature was set to 310 °C, the capillary temperature to 320 °C, with sheath gas and auxiliary gas flows of 30 and 10 arbitrary units, respectively. The spray voltage was set to 3.0 kV in positive ion mode and 2.8 kV in negative ion mode. Data-dependent acquisition (DDA) was employed with a loop count of 10 and stepped higher-energy collisional dissociation (HCD) energies of 10, 28, and 35 eV. Full-scan MS spectra were acquired over the *m/z* range of 100–1500 at a resolution of 70,000. The automatic gain control (AGC) target was set to 3 × 10⁶ with a maximum injection time of 200 ms. For MS/MS analysis, the resolution was set to 17,500, with an AGC target of 1 × 10⁵ and a maximum injection time of 50 ms.

2.1.3. Antimicrobial Activity and Thermal Stability Assays

Antimicrobial activity was evaluated using an agar well diffusion assay. Briefly, a mycelial plug (6 mm in diameter) of Sclerotinia sclerotiorum was inoculated at the center of a potato dextrose agar (PDA) plate. Two symmetrical wells (4 mm in diameter) were punched 2 cm away from the center. Each well was filled with 50 μL of the purified fraction. The plates were incubated at 28 °C for 3 days.
The inhibition rate was calculated as follows:
Inhibition rate (%) = [(Control colony diameter − Treated colony diameter)/(Control colony diameter − Plug diameter)] × 100
To assess the thermal stability, the purified fraction (100 mg/L) was subjected to two different conditions. One sample underwent heat treatment (HT) at 121 °C for 20 min. The other sample was kept at room temperature (25 ± 2 °C) and served as the untreated control (CK). The antimicrobial activity of both treated samples was assessed using the method described above.

2.2. Medium Optimization

2.2.1. Single-Factor Medium Optimization

All optimization experiments were initiated using the standard Potato Dextrose Broth (PDB) formulation as the basal medium. It is important to note that the native potato extract and glucose components of PDB contribute undefined amounts of carbon and nitrogen. Therefore, the following experiments aimed to evaluate the supplemental effects of additional nitrogen and carbon sources on top of this complex base, rather than strictly isolating their effects under nitrogen- or carbon-limited conditions.
Screening of Supplemental Nitrogen Sources
To evaluate the effect of additional nitrogen sources, various ratios of peptone and urea were supplemented to the standard PDB medium. The masses added were calculated to provide approximately equivalent amounts of supplemental nitrogen across treatments, assuming a nitrogen content of 15% (w/w) for peptone and 46.7% for urea. The treatments (now expressed as concentration per liter for standardization) were as follows: T1: Peptone 20.0 g/L + Urea 0 g/L; T2: Peptone 16.0 g/L + Urea 1.1 g/L; T3: Peptone 10.0 g/L + Urea 2.76 g/L; T4: Peptone 4.0 g/L + Urea 4.4 g/L; T5: Peptone 0 g/L + Urea 5.52 g/L. Each treatment was prepared in triplicate.
Screening of Supplemental Carbon Sources
To evaluate the combined effects of both the ratio of sucrose to glucose and the total concentration of supplemental carbon, various combinations were supplemented into the standard PDB medium. The treatments (expressed as g/L) were designed to test a range of ratios and total amounts of supplemental carbon: C1: Sucrose 20.0 g/L + Glucose 0 g/L; C2: Sucrose 10.0 g/L + Glucose 20.0 g/L; C3: Sucrose 4.0 g/L + Glucose 32.0 g/L; C4: Sucrose 16.0 g/L + Glucose 8.0 g/L; C5: Sucrose 0 g/L + Glucose 40.0 g/L; C6 (Control): No supplemental carbon added (Standard PDB only). Each treatment was prepared in triplicate. (The total amount of carbon added in C1–C5 is different).
Optimization of Supplemental Sucrose Concentration
Based on the results of the above screening, sucrose was selected for further concentration optimization. A gradient of sucrose (16, 20, 40, 60, 80, 100, 120 g/L) was supplemented to the standard PDB medium. The concentration of peptone and all other components remained at their standard levels as present in the unmodified PDB formulation. Each concentration was tested in triplicate.
Optimization of Supplemental Peptone Concentration
Similarly, a gradient of peptone (20, 40, 60, 80, 100, 120, 140, 160 g/L) was supplemented to the standard PDB medium. The carbon source was provided by the standard glucose and potato extract content of the PDB base, with no additional sucrose or other carbon sources added. Each concentration was tested in triplicate.
Optimization of Initial pH
The initial pH of the standard PDB medium (with no supplements) was adjusted to values ranging from 5.0 to 8.5 (in increments of 0.5). Each pH level was tested in triplicate.
Experimental Design
All single-factor experiments were conducted independently and concurrently. The optimal condition identified in one experiment was not carried over to the next until the final verification stage. This approach allowed for the assessment of each factor’s effect individually against the same complex background of the standard PDB medium.

2.2.2. Culture and Product Extraction

All cultures were incubated in 250 mL Erlenmeyer flasks containing 50 mL of production medium at 30 °C with shaking at 180 rpm for 72 h. After fermentation, the broth was acidified with HCl to a final concentration of 1 M for precipitation. The precipitate was separated using a ClearFirst-3000Max protein purification system and subsequently lyophilized (−80 °C, 0.1 mbar, 48 h). The dry weight of the extracted fengycin was accurately measured.

2.2.3. Standard Preparation and HPLC Analysis

Fengycin standard solutions (0.004–0.01 g/mL) were analyzed using an Elite G-10 column (4.6 × 250 mm, 5 μm; mobile phase: deionized water; flow rate: 1 mL/min; column temp.: 20 °C; injection: 100 μL). Calibration curves (peak area vs. concentration) were established. The fengycin content (W%) in samples was calculated using the following formula:
W (%) = (Asam × Cst × V)/(Ast × M) × 100
where Asam and Ast represent the peak areas of the sample and standard, respectively; Cst denotes the concentration of the standard solution (g/mL); V is the volume of the sample solution (mL); and M is the mass of the sample (g).
Relative deviation (RD%) between duplicates was calculated as:
RD (%) = |X1 − X2|/[(X1 + X2)/2] × 100
where X1 and X2 represent the measured values from two parallel quantitative determinations.

2.2.4. Determination of the Bacterial Growth Curve of Bacillus velezensis YJ0-1

To evaluate growth under optimized conditions, we first cultured Bacillus velezensis YJ0-1 on a PDA plate at 28 °C. A single colony was transferred to 50 mL of PDB and grown overnight at 37 °C and 200 rpm to generate a pre-culture. We then diluted this pre-culture with fresh PDB to an OD600 of 0.12. For the growth assay, we loaded 10 μL of this standardized inoculum into each well of a 100-well plate already containing 190 μL of the specific optimization medium. We included a cell-free blank control for each medium and performed all assays in triplicate. Finally, we recorded growth profiles automatically for 72 h at 30 °C using a Bioscreen analyzer (Version 1.0.6.5).

2.2.5. Optimization Using Response Surface Methodology

Based on the single-factor experimental results, a Box–Behnken design (BBD) with three factors and three levels (15 experimental runs) was implemented using Design-Expert software (Version 13.0, Stat-Ease Inc., Minneapolis, MN, USA). Each group was formulated according to the specified proportional combinations. After 3 days of fermentation, crude extracts were obtained through acid precipitation. The purified extracts were separated, and their weights were recorded. The interactions among factors were analyzed to predict the optimal medium formulation.

2.2.6. Validation Experiments

Based on the analysis of single-factor experiments and response surface optimization, the optimal medium formulation yielding the highest extract production was predicted using the response surface analysis module of Design-Expert 13. The medium was prepared according to the predicted optimal proportions. Fermentation was then carried out under the standard conditions as described in Section 2.2.2 (i.e., 72 h at 30 °C with shaking at 180 rpm). The results were statistically analyzed and validated by comparing the predicted values with the actual experimental yields of the extracted products.

3. Results

3.1. Purification, Identification, and Antimicrobial Activity Analysis of Active Compounds

3.1.1. Analysis of the Elution Profile of the Crude Extract

Analysis of the crude extract components using a protein purification system revealed two distinct peaks at retention times of 9 min and 17 min, respectively (Figure 1). The first peak (9 min) exhibited significantly higher relative abundance, with a peak area 2.33 times greater than that of the second peak. The sharper and taller peak shape suggested higher concentration and superior separation efficiency under the current chromatographic conditions. In contrast, the second peak (17 min) displayed a broader and lower profile, possibly due to lower concentration or suboptimal resolution.

3.1.2. Full-Spectrum Analysis of Crude Extracts

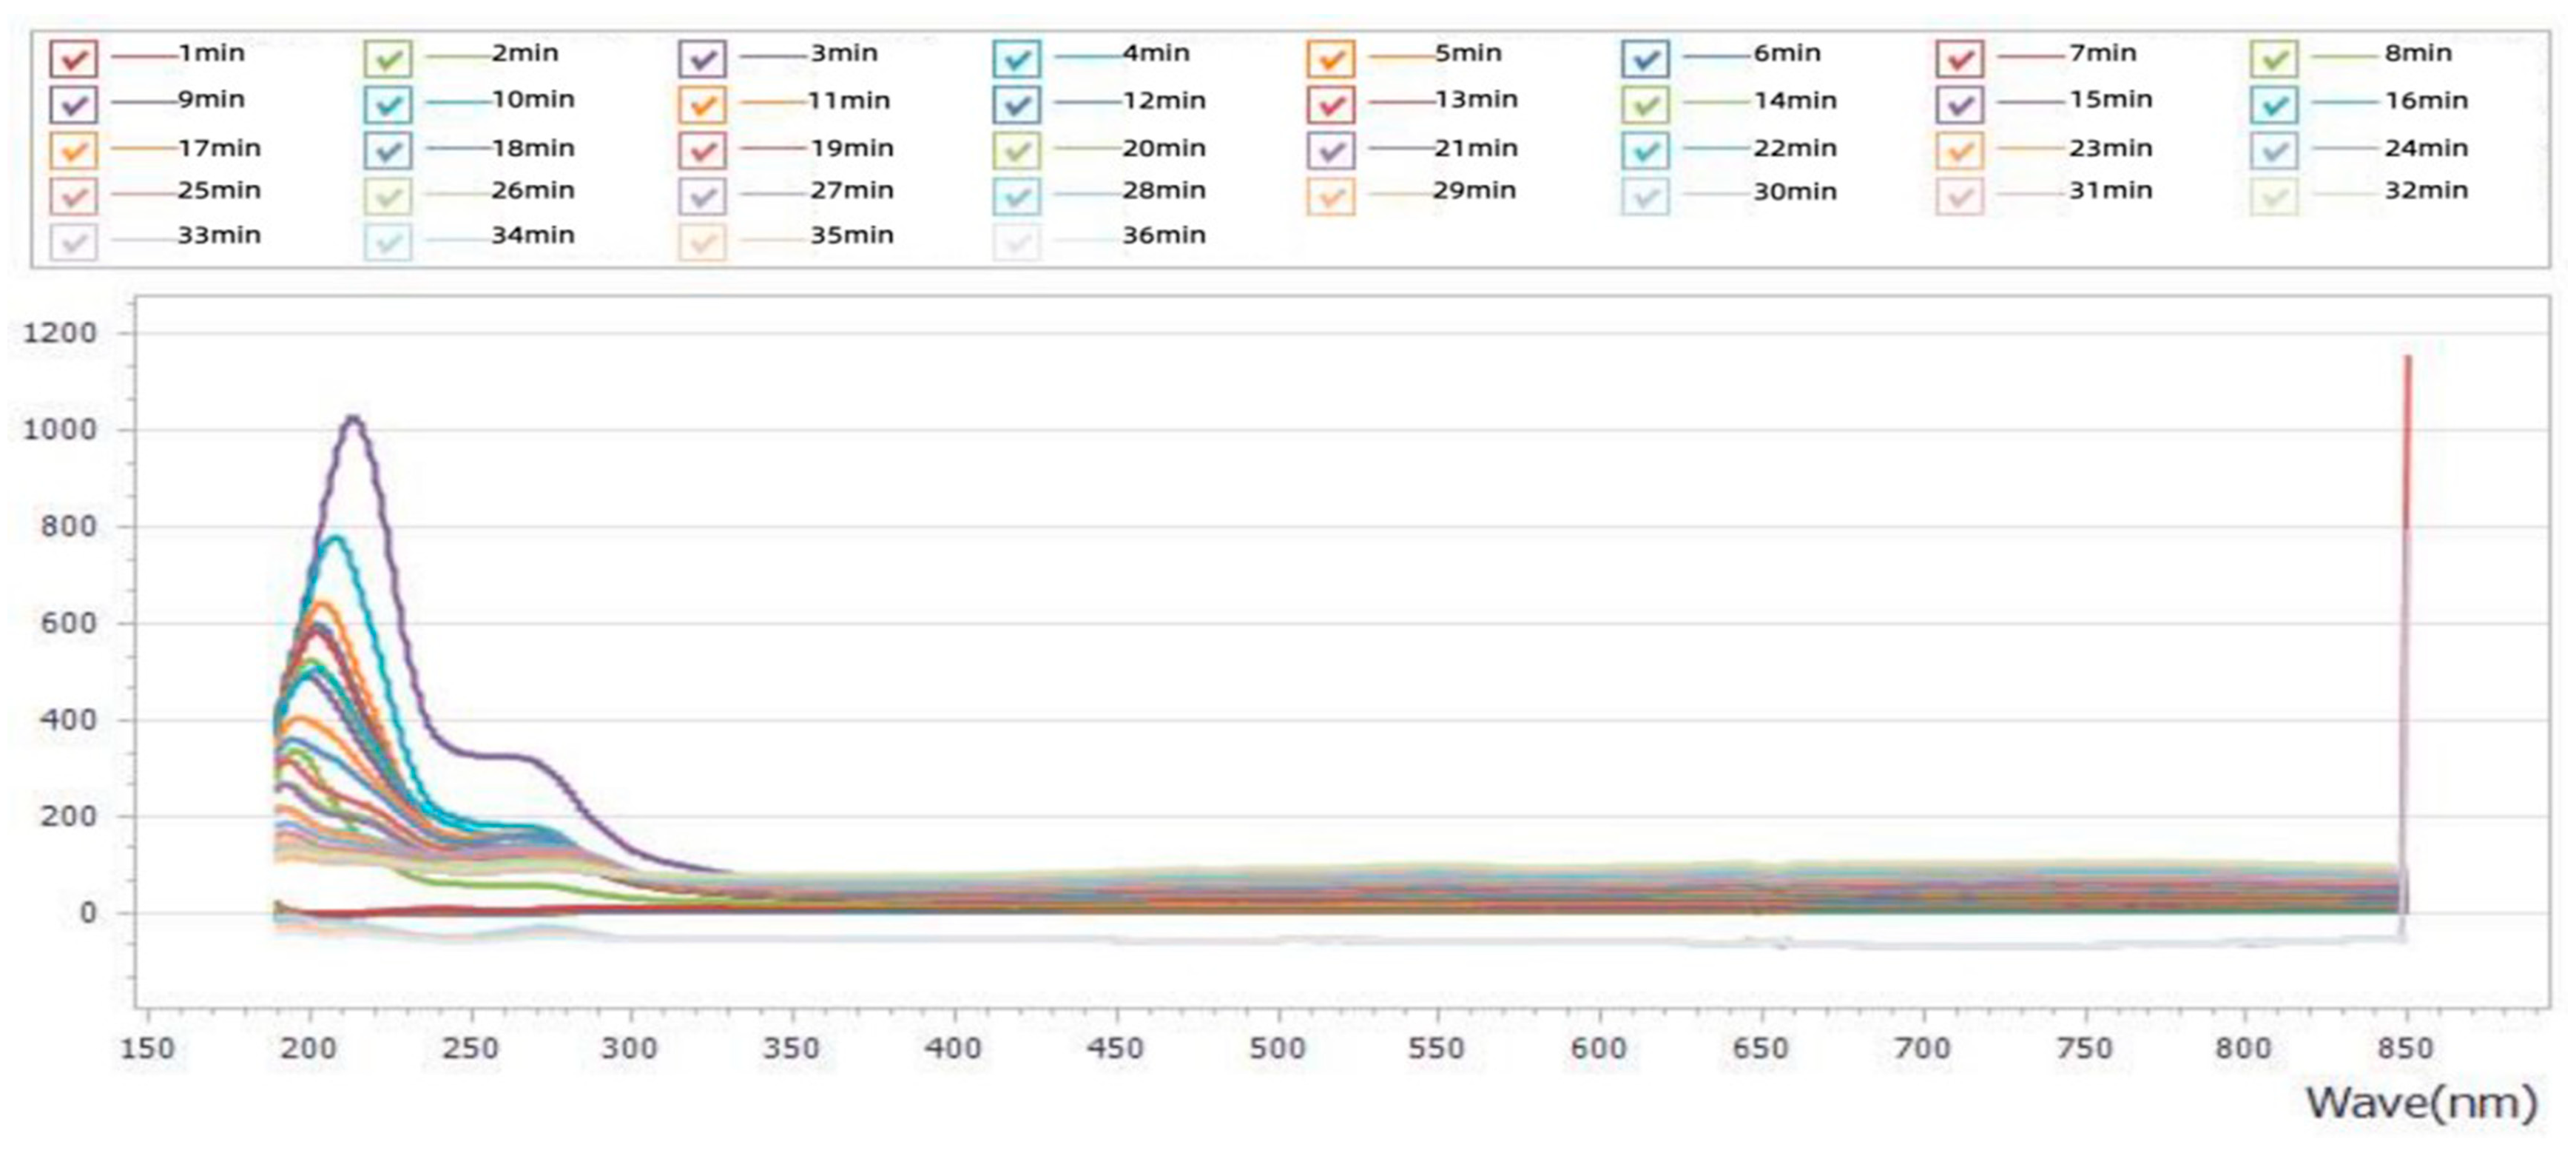
The UV visible spectral scan (150–850 nm) of the crude extract showed two distinct characteristic peaks (Figure 2). The first characteristic peak is located at 230 nm with an absorbance of approximately 1000; The second peak appears at 280 nm with an absorbance of approximately 300. Within 1–9 min, the peak intensity gradually increases, then gradually decreases and tends to stabilize within 10–36 min. Among them, the peak signals at 9, 10, and 11 min are strong, indicating dynamic changes in component concentration during the separation process of the sample.
Spectral analysis suggested 230 nm and 280 nm as optimal detection wavelengths for Peak 1 and Peak 2, respectively. These wavelengths were subsequently applied to HPLC parameter settings for accurate quantification.

3.1.3. Antimicrobial Activity Assay

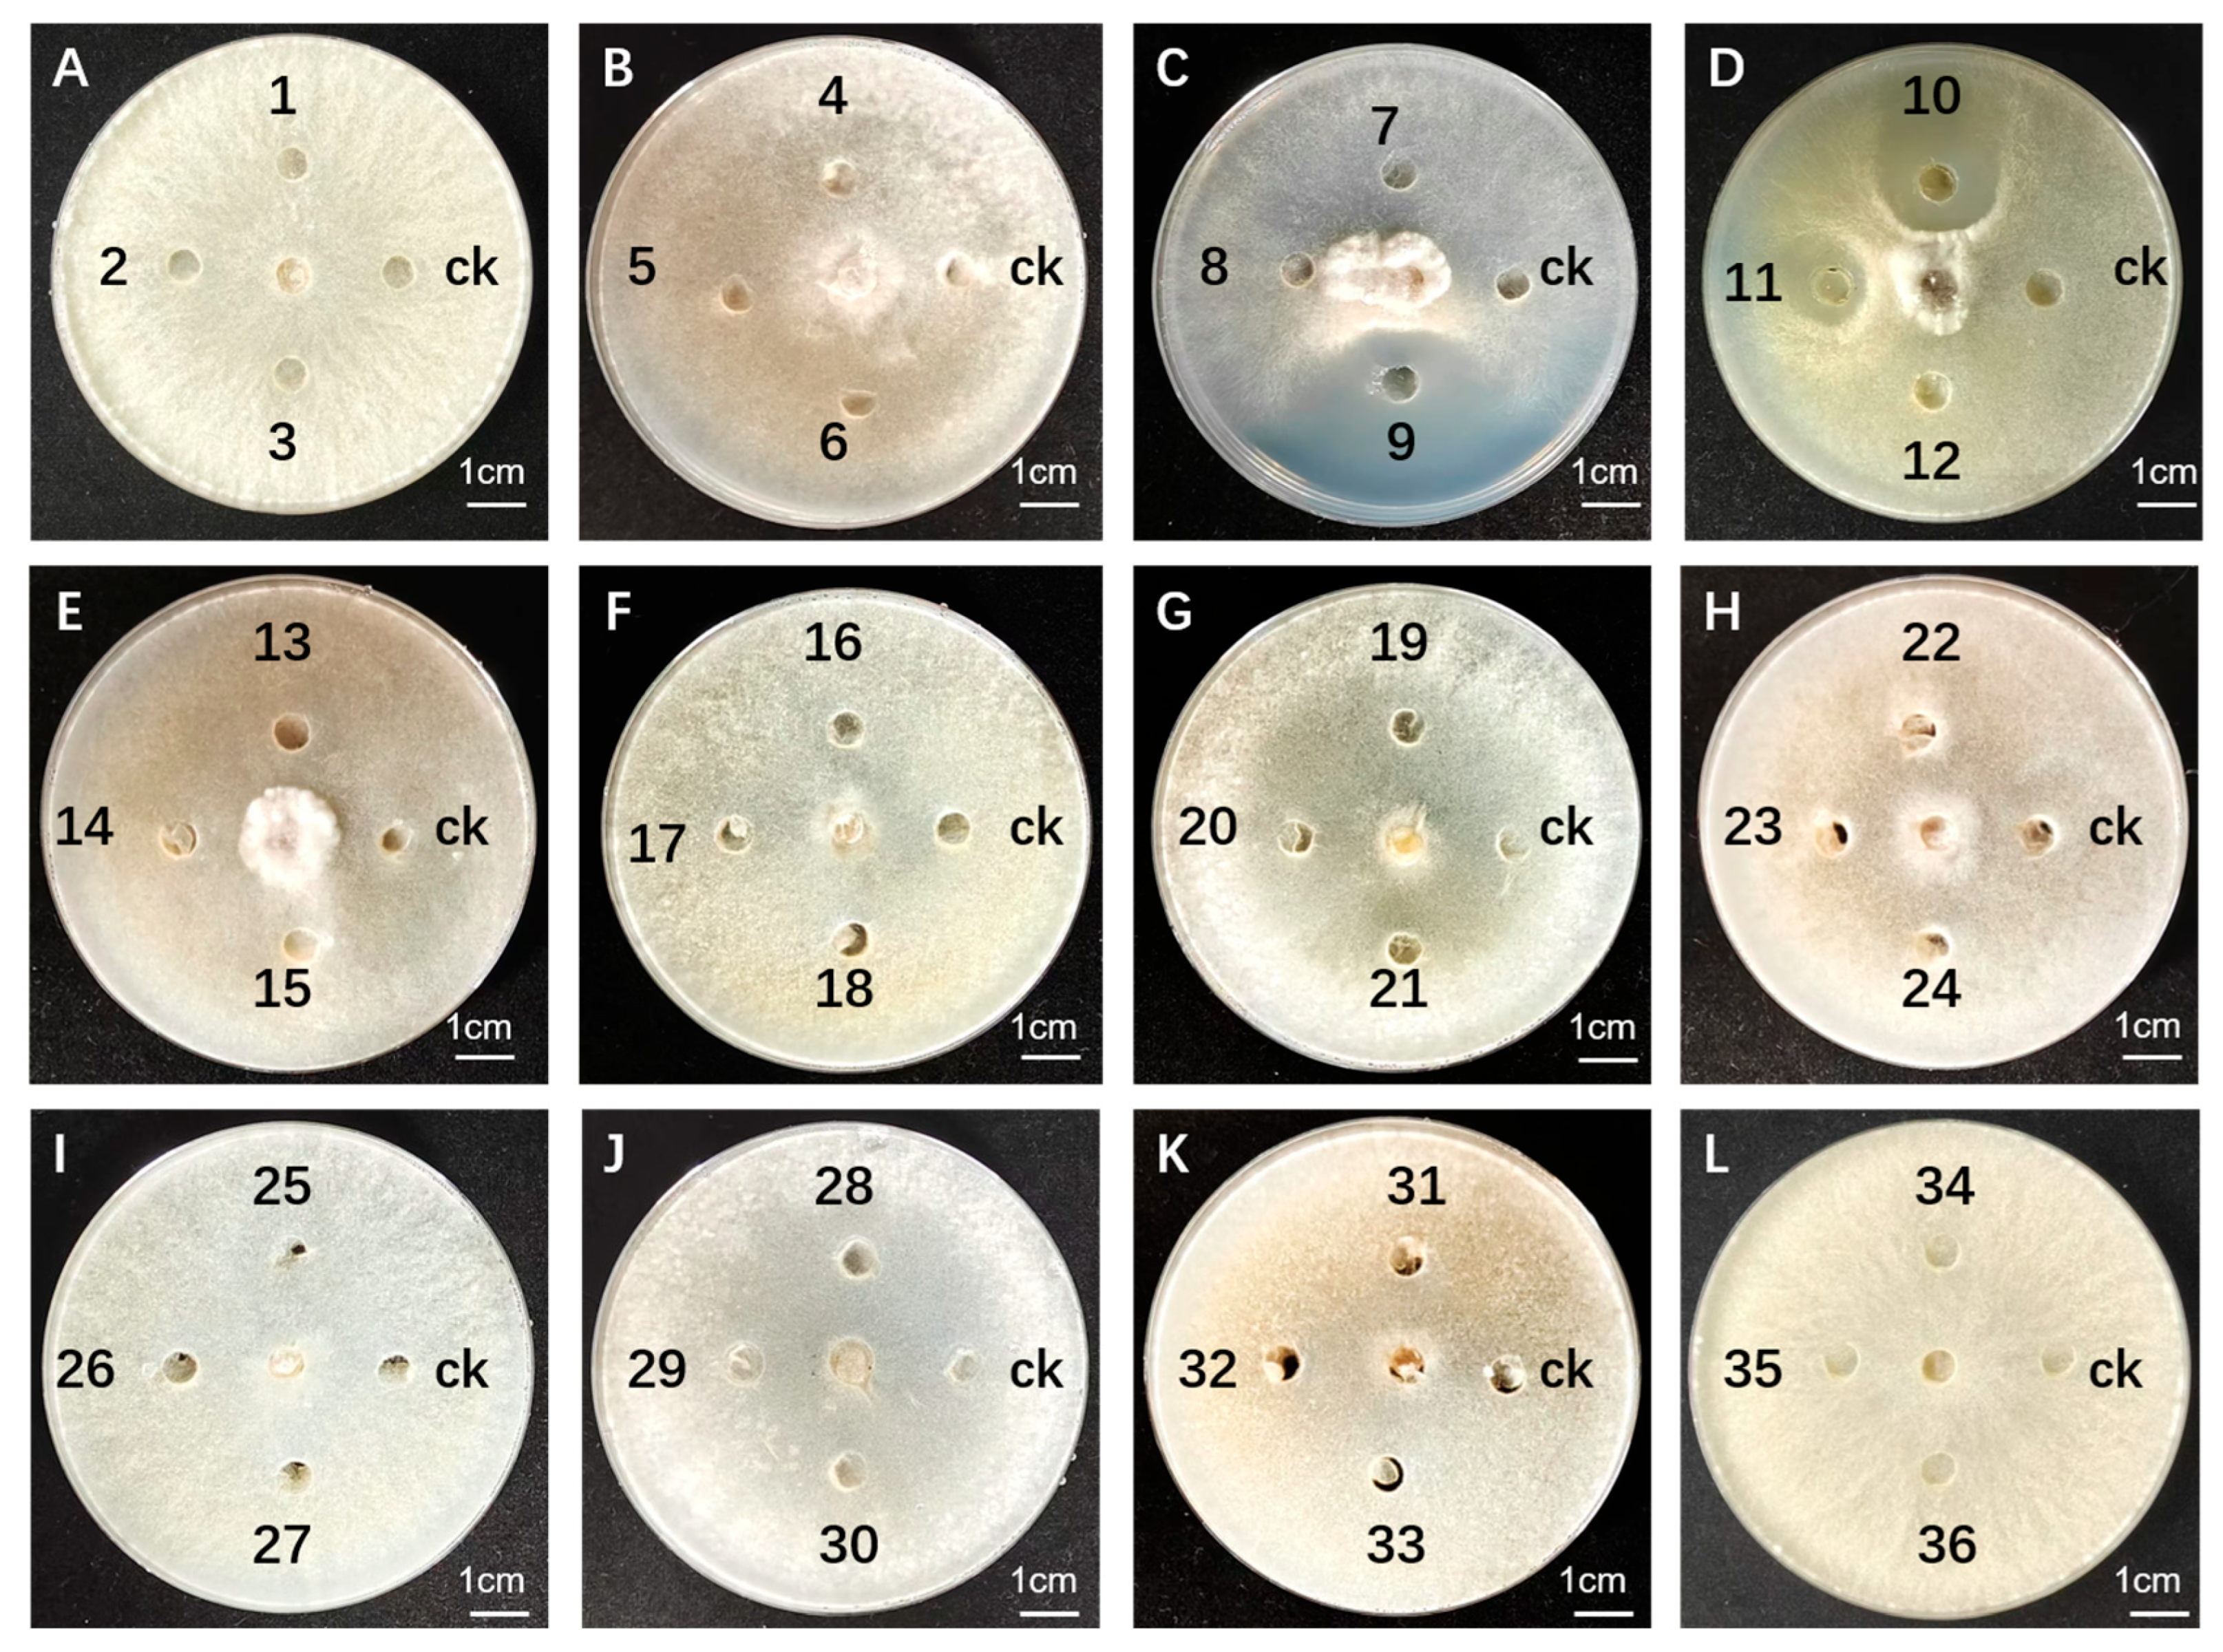
Fractions collected at 1-min intervals (1–36 min, quadruplicate) were concentrated and tested for antimicrobial activity. Fractions 9–11 exhibited significant inhibition, with Fraction 9 showing the largest inhibition zone (Figure 3). No activity was detected in other fractions, suggesting that bioactive compounds were enriched within 9–11 min.
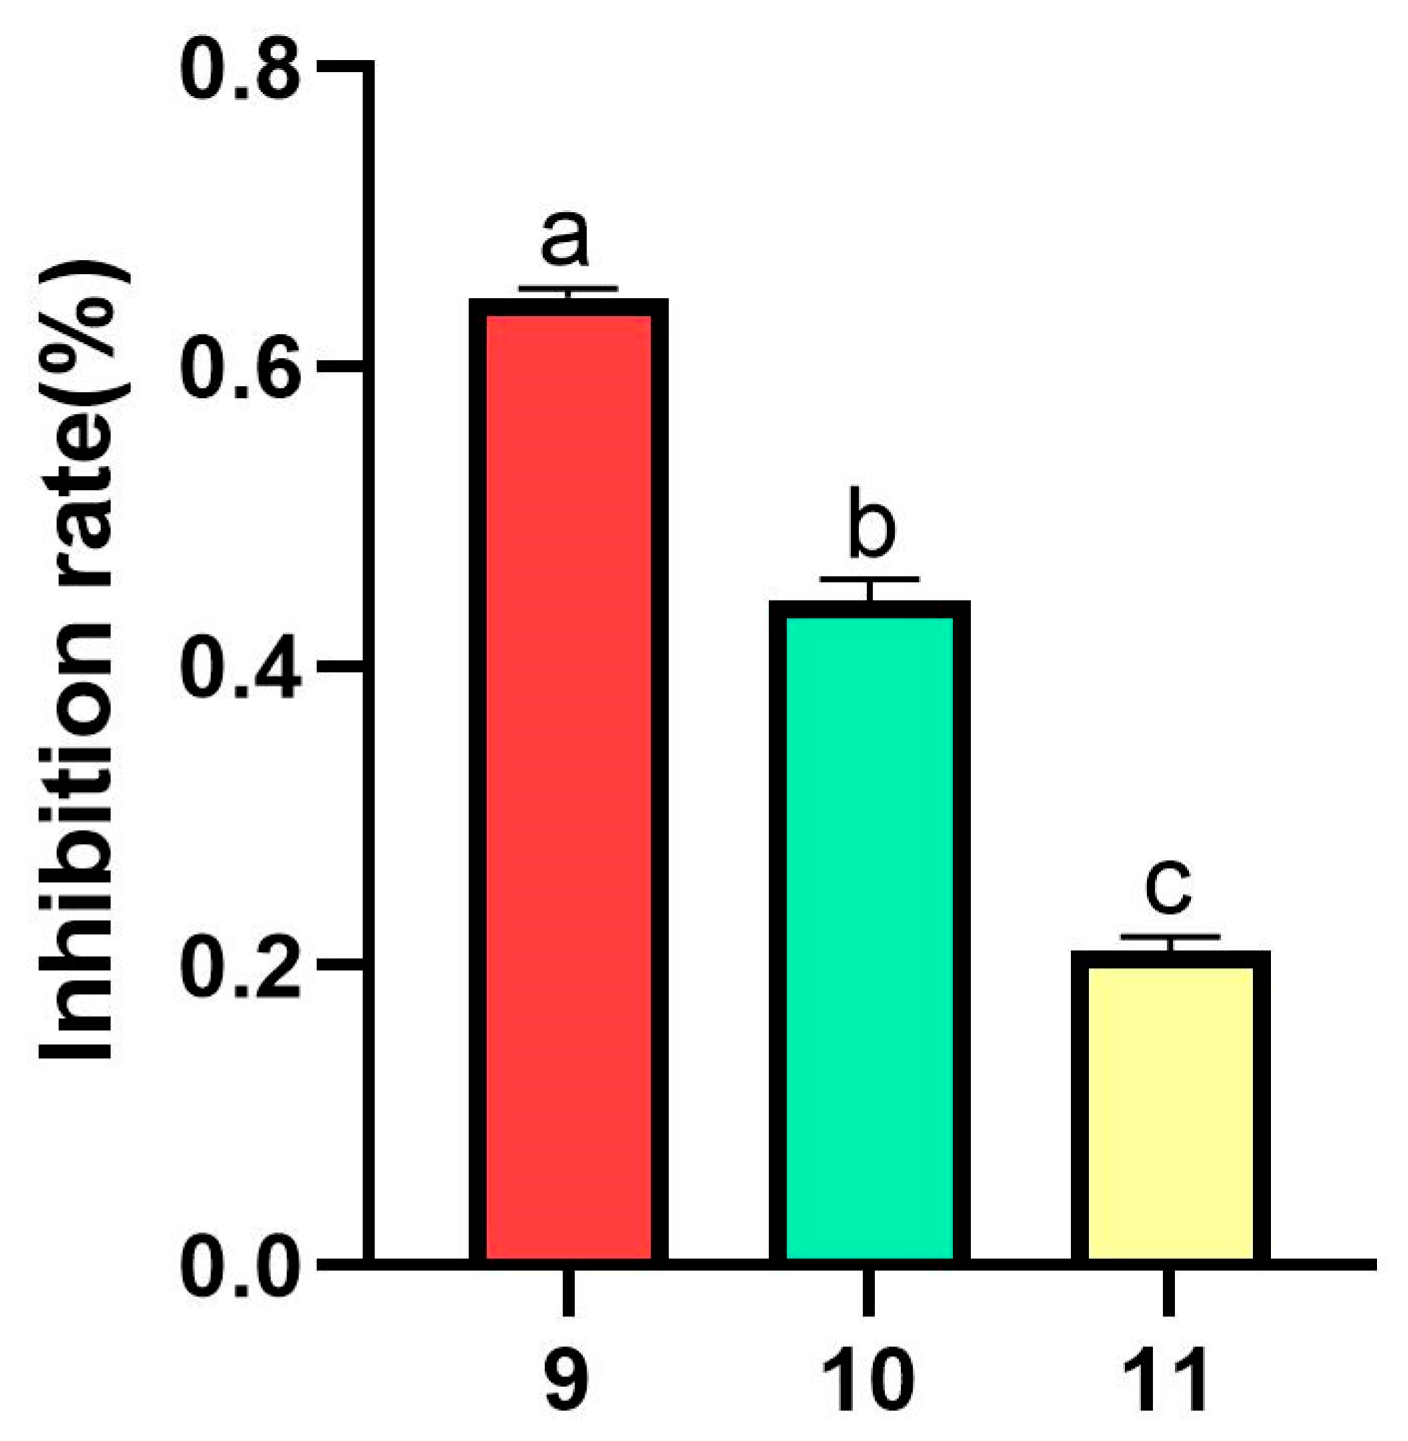
As shown in Figure 4, Fraction 9 demonstrated the highest inhibition rate (65%) against Sclerotinia sclerotiorum, significantly outperforming other fractions (p < 0.05). Fractions 10 and 11 showed rates of 46% and 22%, respectively. These results confirmed that antimicrobial activity was exclusively associated with Peak 1, while Peak 2 lacked inhibitory effects.

3.1.4. Optimization of Separation Conditions

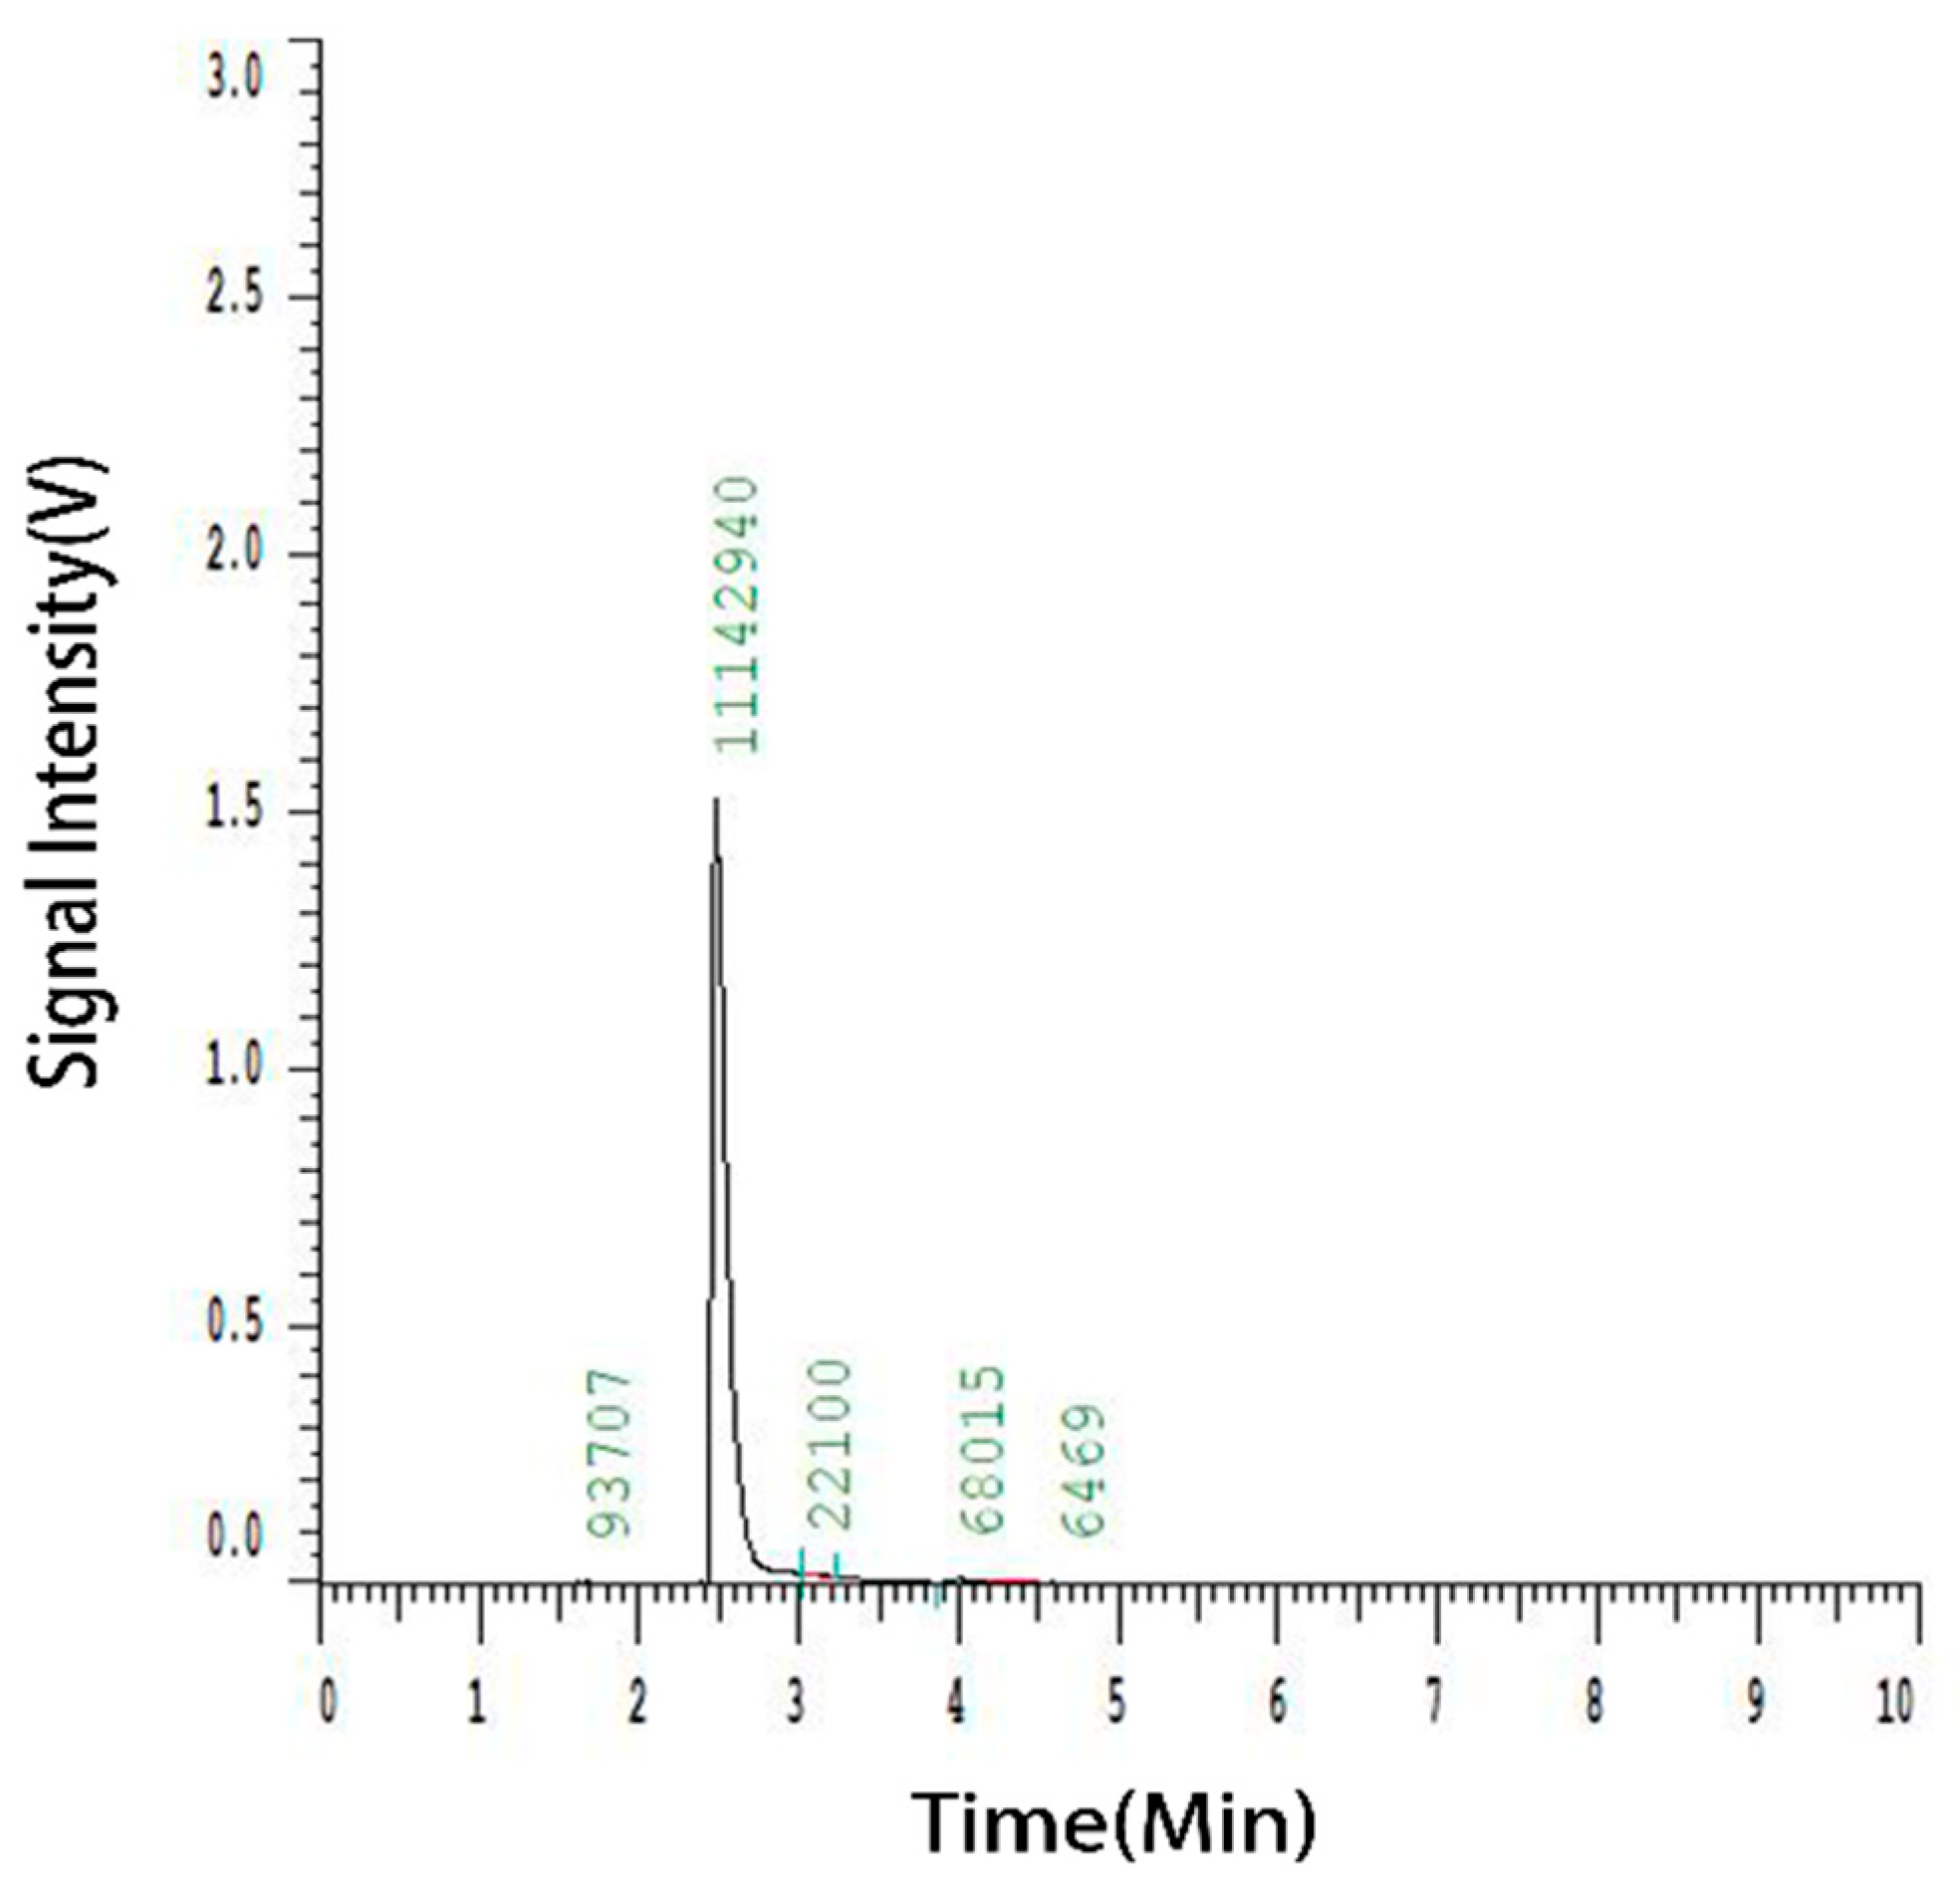
Freeze-dried Fraction 9 (0.02 g) was dissolved in 2 mL deionized water, and 100 µL was injected into HPLC. A sharp dominant peak (Peak 1) appeared at 2.4 min (peak height: 1.5 V; area: 11,142,940), while Peak 2 was undetected, indicating high purity and separation efficiency (Figure 5). The single, dominant peak observed in the HPLC chromatogram (Figure 5) was designated as purified fraction for further reference. This component is responsible for the antimicrobial activity isolated from Fraction 9. The discrepancy in retention time (9 min in the protein purification system) likely arose from differences in column length or system configuration. The results demonstrate that the optimized HPLC method effectively separates the target component.

3.1.5. Thermal Stability Analysis

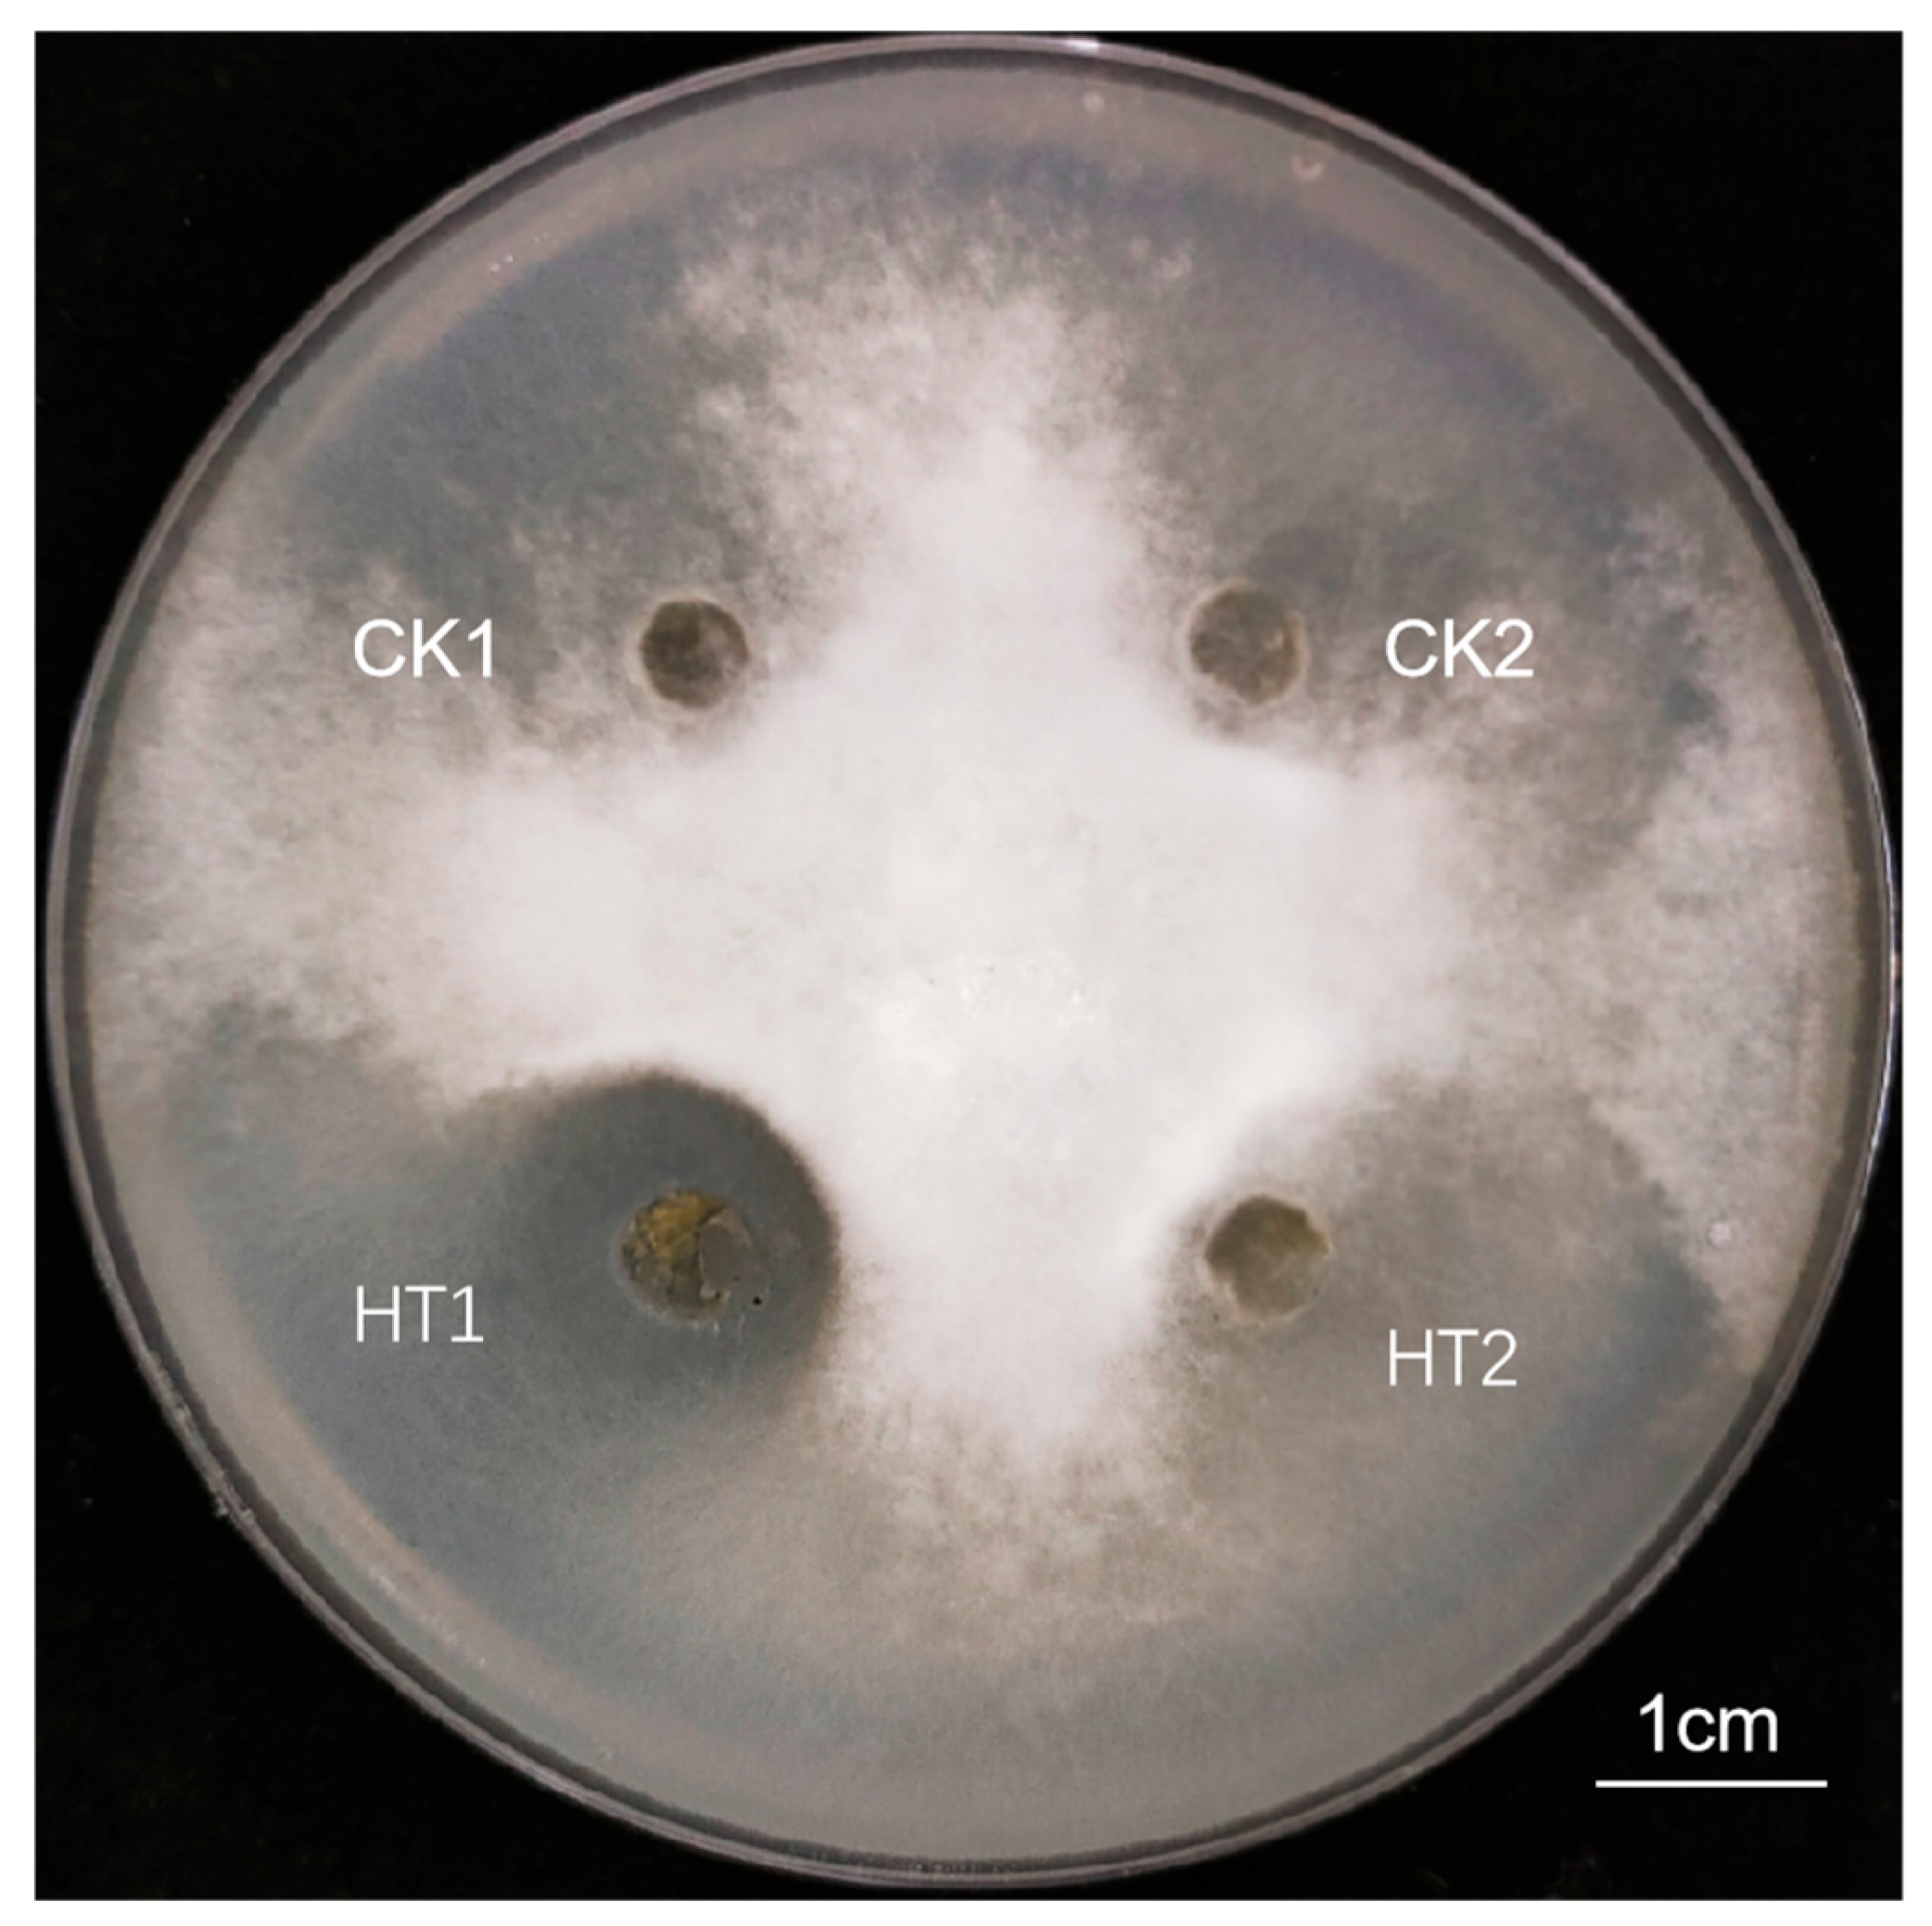
As shown in Figure 6, after incubation at 25 °C, no significant differences in the hyphal growth of Sclerotinia sclerotiorum were observed between the control groups (CK1, CK2) and the heat-treated groups (HT1, HT2) in the purified component plate antagonism test. These results indicate that the antimicrobial activity of the purified fraction remained unchanged after heat treatment at 121 °C for 20 min.
This study confirms that the purified fraction maintained both its chemical structure and biological activity under the applied heat treatment conditions. The retention of antimicrobial activity demonstrates the high thermal stability of the fraction, suggesting no decomposition, denaturation, or functional impairment occurred during the high-temperature treatment. This property indicates its potential value for antifungal applications requiring sterilization processes.

3.1.6. Mass Spectrometric Analysis of Purified Fraction

Mass spectrometric analysis of the purified fraction was performed to identify its molecular characteristics. Initially, the presence of a base peak and isotopic peaks was confirmed, with particular attention paid to abundance values and mass-to-charge ratios (m/z). Abundance values reflect not only isotopic distribution but also the stability of ionic structures and the tendency toward fragmentation. Generally, ions that form stable fragments exhibit higher abundance. Characteristic peaks indicative of typical structural features were carefully examined. The high-mass region was analyzed for the presence of molecular ions and neutral losses, while the low-mass region was scrutinized for characteristic fragment ions and ion series.
The nitrogen rule was applied to assess the existence of molecular ions by evaluating the parity of mass numbers and abundance distributions. These observations provided preliminary evidence for the presence of nitrogen in the compound. The degree of unsaturation was calculated for the molecular formula C72H110N12O20, where C = 72, H = 110, N = 12, O = 20, and X = 0 (no halogen atoms). Substitution into the formula yields:
U = (2 × 72 + 2 − 110 − 0 + 12)/2 = 48/2 = 24
This indicates 24 degrees of unsaturation, suggesting the presence of multiple double bonds, triple bonds, and/or ring structures.
The theoretical molecular mass of C72H110N12O20 was calculated as follows:
M = (72 × 12) + (110 × 1) + (12 × 14) + (20 × 16) = 1462 Da
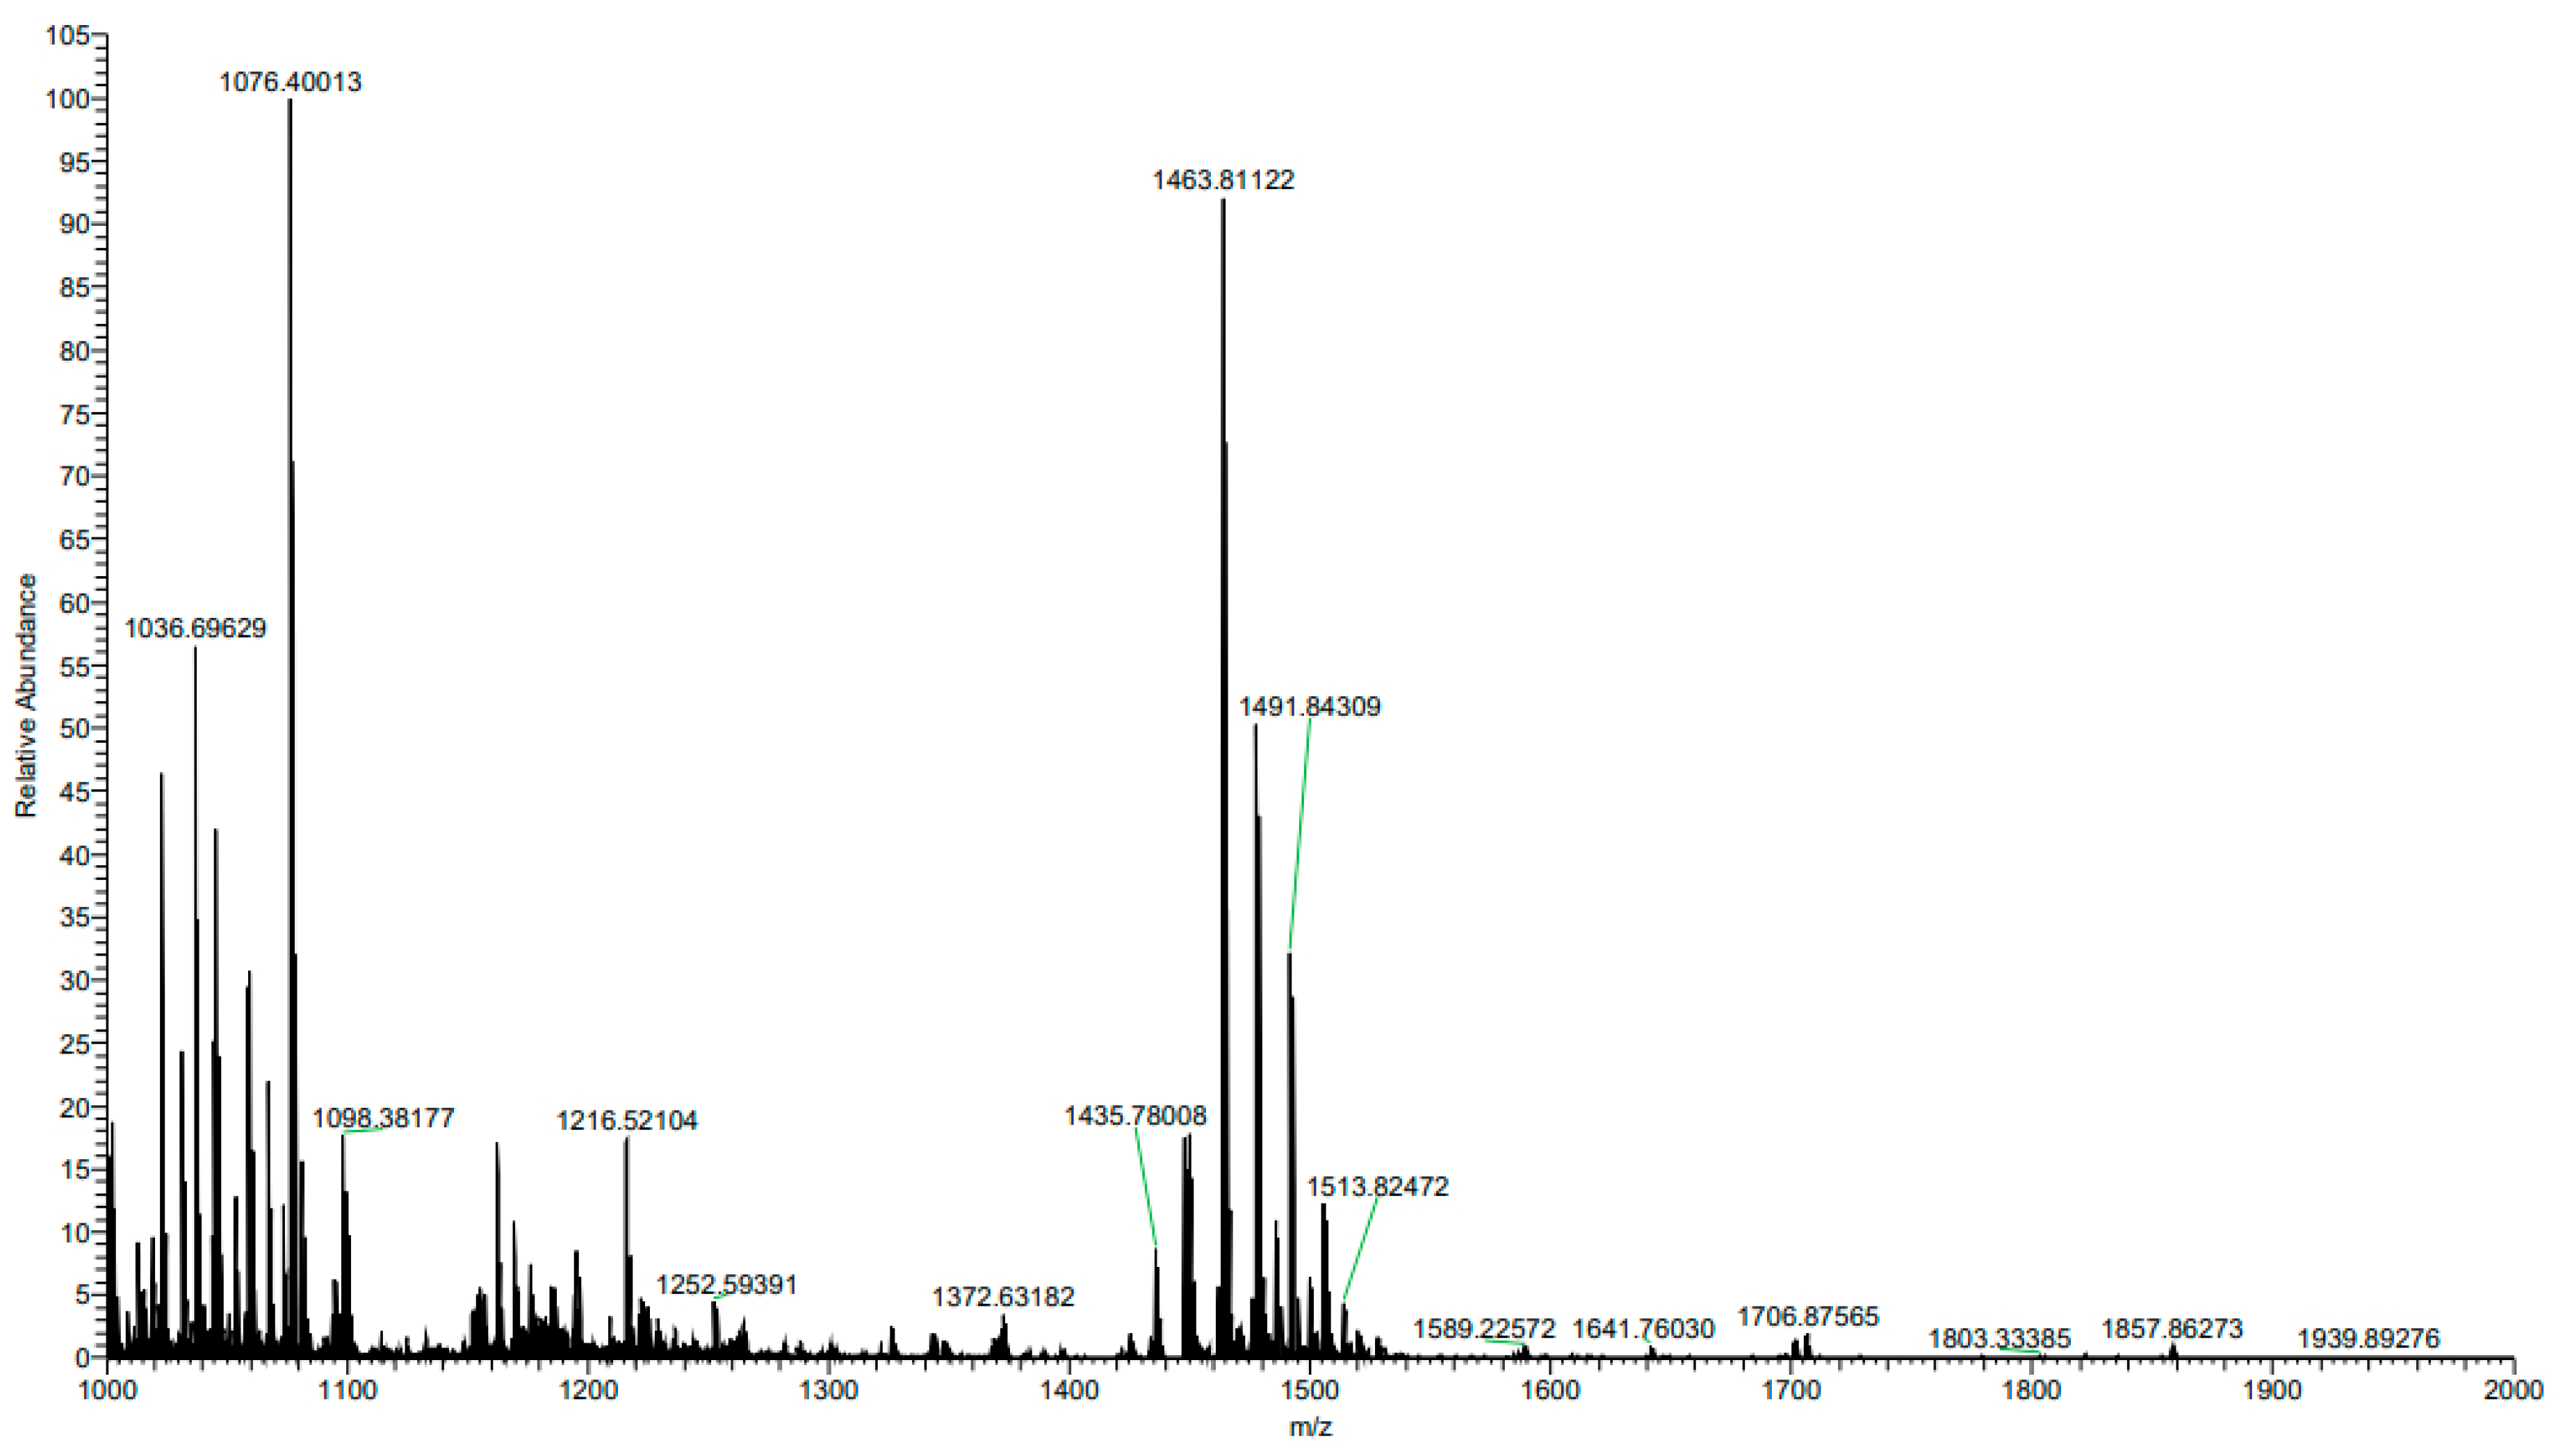
In the mass spectrum, the peak observed at m/z 1463.81122 closely matches the theoretical mass and is tentatively assigned as the molecular ion peak, considering permissible instrumental measurement error. Additional peaks, such as those at m/z 1076.40013, 1491.84309, and 1513.82472, likely correspond to fragment ions resulting from in-source decay or collision-induced dissociation.
Based on spectral data, purified fraction exhibited a mass-to-charge ratio of 1463.8, corresponding to a molecular mass of 1463.8 Da, which is consistent with the theoretical mass of fengycin (C72H110N12O20) (Figure 7).

3.2. Medium Optimization

3.2.1. Standard Calibration Curve

The linear working curve and correlation coefficient obtained from fengycin solutions at different concentrations are shown in Figure 8. The linear range of the curve was 0.001–0.01 g/mL, and the linear equation was determined as:
y = 1.00 × 10⁹x − 115,096
which demonstrated a good linear relationship within this concentration range (correlation coefficient r2 = 0.9992). The high slope value (m = 1.00 × 10⁹) indicates a high sensitivity of the HPLC method, meaning a small change in concentration within the linear range results in a large change in the detector response. The intercept b = −115,096; although the intercept is theoretically expected to be zero under ideal conditions, it may deviate from zero in practice due to factors such as instrumental background signals.
In conclusion, this HPLC standard curve exhibits excellent linearity within the concentration range of 0.001–0.01 g/mL and can be reliably used for the quantitative analysis of the analyte within this range.

3.2.2. Single-Factor Analyses

Screening of Supplemental Nitrogen Sources
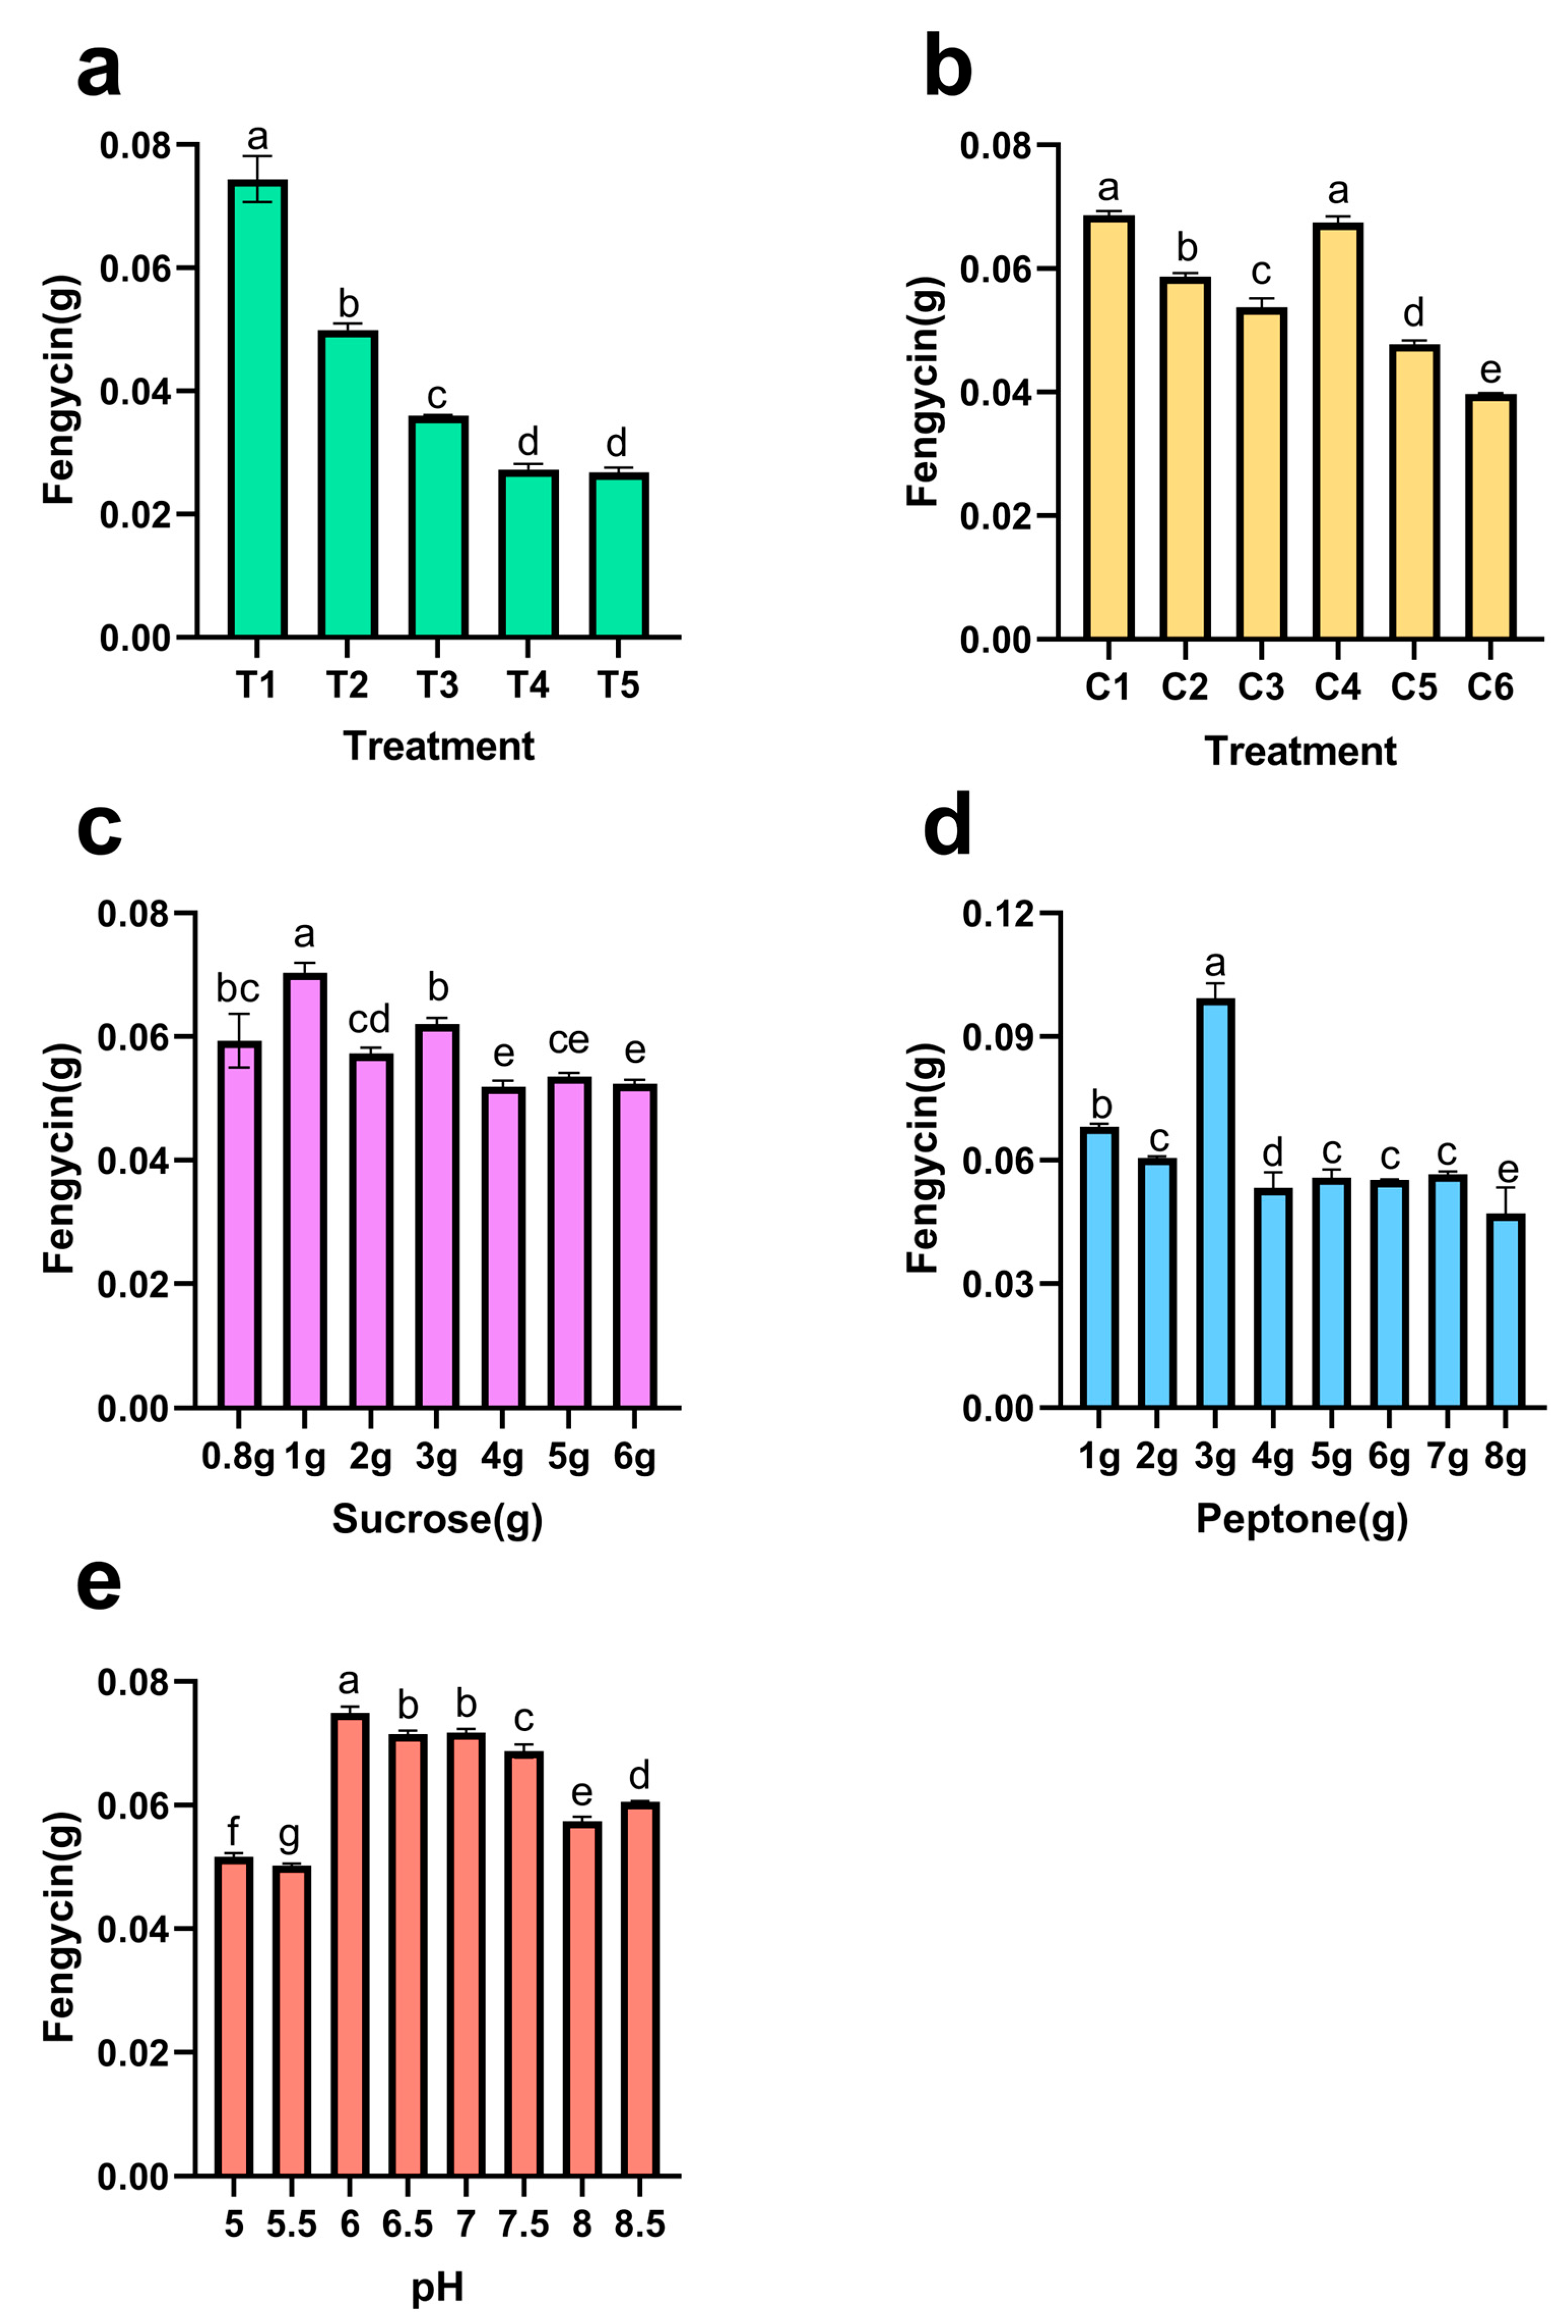
Peptone as the sole nitrogen source (T1) yielded the highest fengycin production (1.36 g/L) (Figure 9a). Urea supplementation (T2–T5) progressively reduced yields, with T5 (urea-only) showing the lowest output (0.78 g/L). This indicates that using urea as the sole nitrogen source resulted in the lowest fengycin yield, suggesting that urea is not an ideal nitrogen source. It can be concluded that peptone is more favorable than urea for fengycin production.
Screening of Supplemental Carbon Sources
Sucrose (C1, C4) enhanced fengycin synthesis, whereas glucose (C3, C5, C6) suppressed it (Figure 9b). These results suggest that a high proportion of glucose or the absence of a carbon source may inhibit fengycin production.
Optimization of Supplemental Sucrose Concentration
1 g sucrose maximized yield (0.0704 g). Higher concentrations (4–6 g) reduced production (0.05–0.06 g), suggesting metabolic inhibition (Figure 9c). This inhibition may be attributed to the high sucrose concentration itself, which could induce osmotic stress, promote the accumulation of metabolic byproducts, and/or alter other environmental conditions, ultimately impairing the capacity for fengycin biosynthesis.
Optimization of Supplemental Peptone Concentration
Yield peaked at 3 g peptone (Figure 9d). Further increases (4–8 g) led to declines, likely due to osmotic stress or byproduct accumulation. This suggests that excessive peptone supplementation may not enhance fengycin production but could instead lead to nitrogen catabolite repression or other metabolic constraints, such as an imbalance in the carbon-to-nitrogen (C/N) ratio or increased ammonium ion accumulation.
Optimization of Initial pH
Optimal production (0.075 g) occurred at pH 6 (Figure 9e). Acidic (pH 5–5.5) or alkaline (pH 8–8.5) conditions reduced yields.
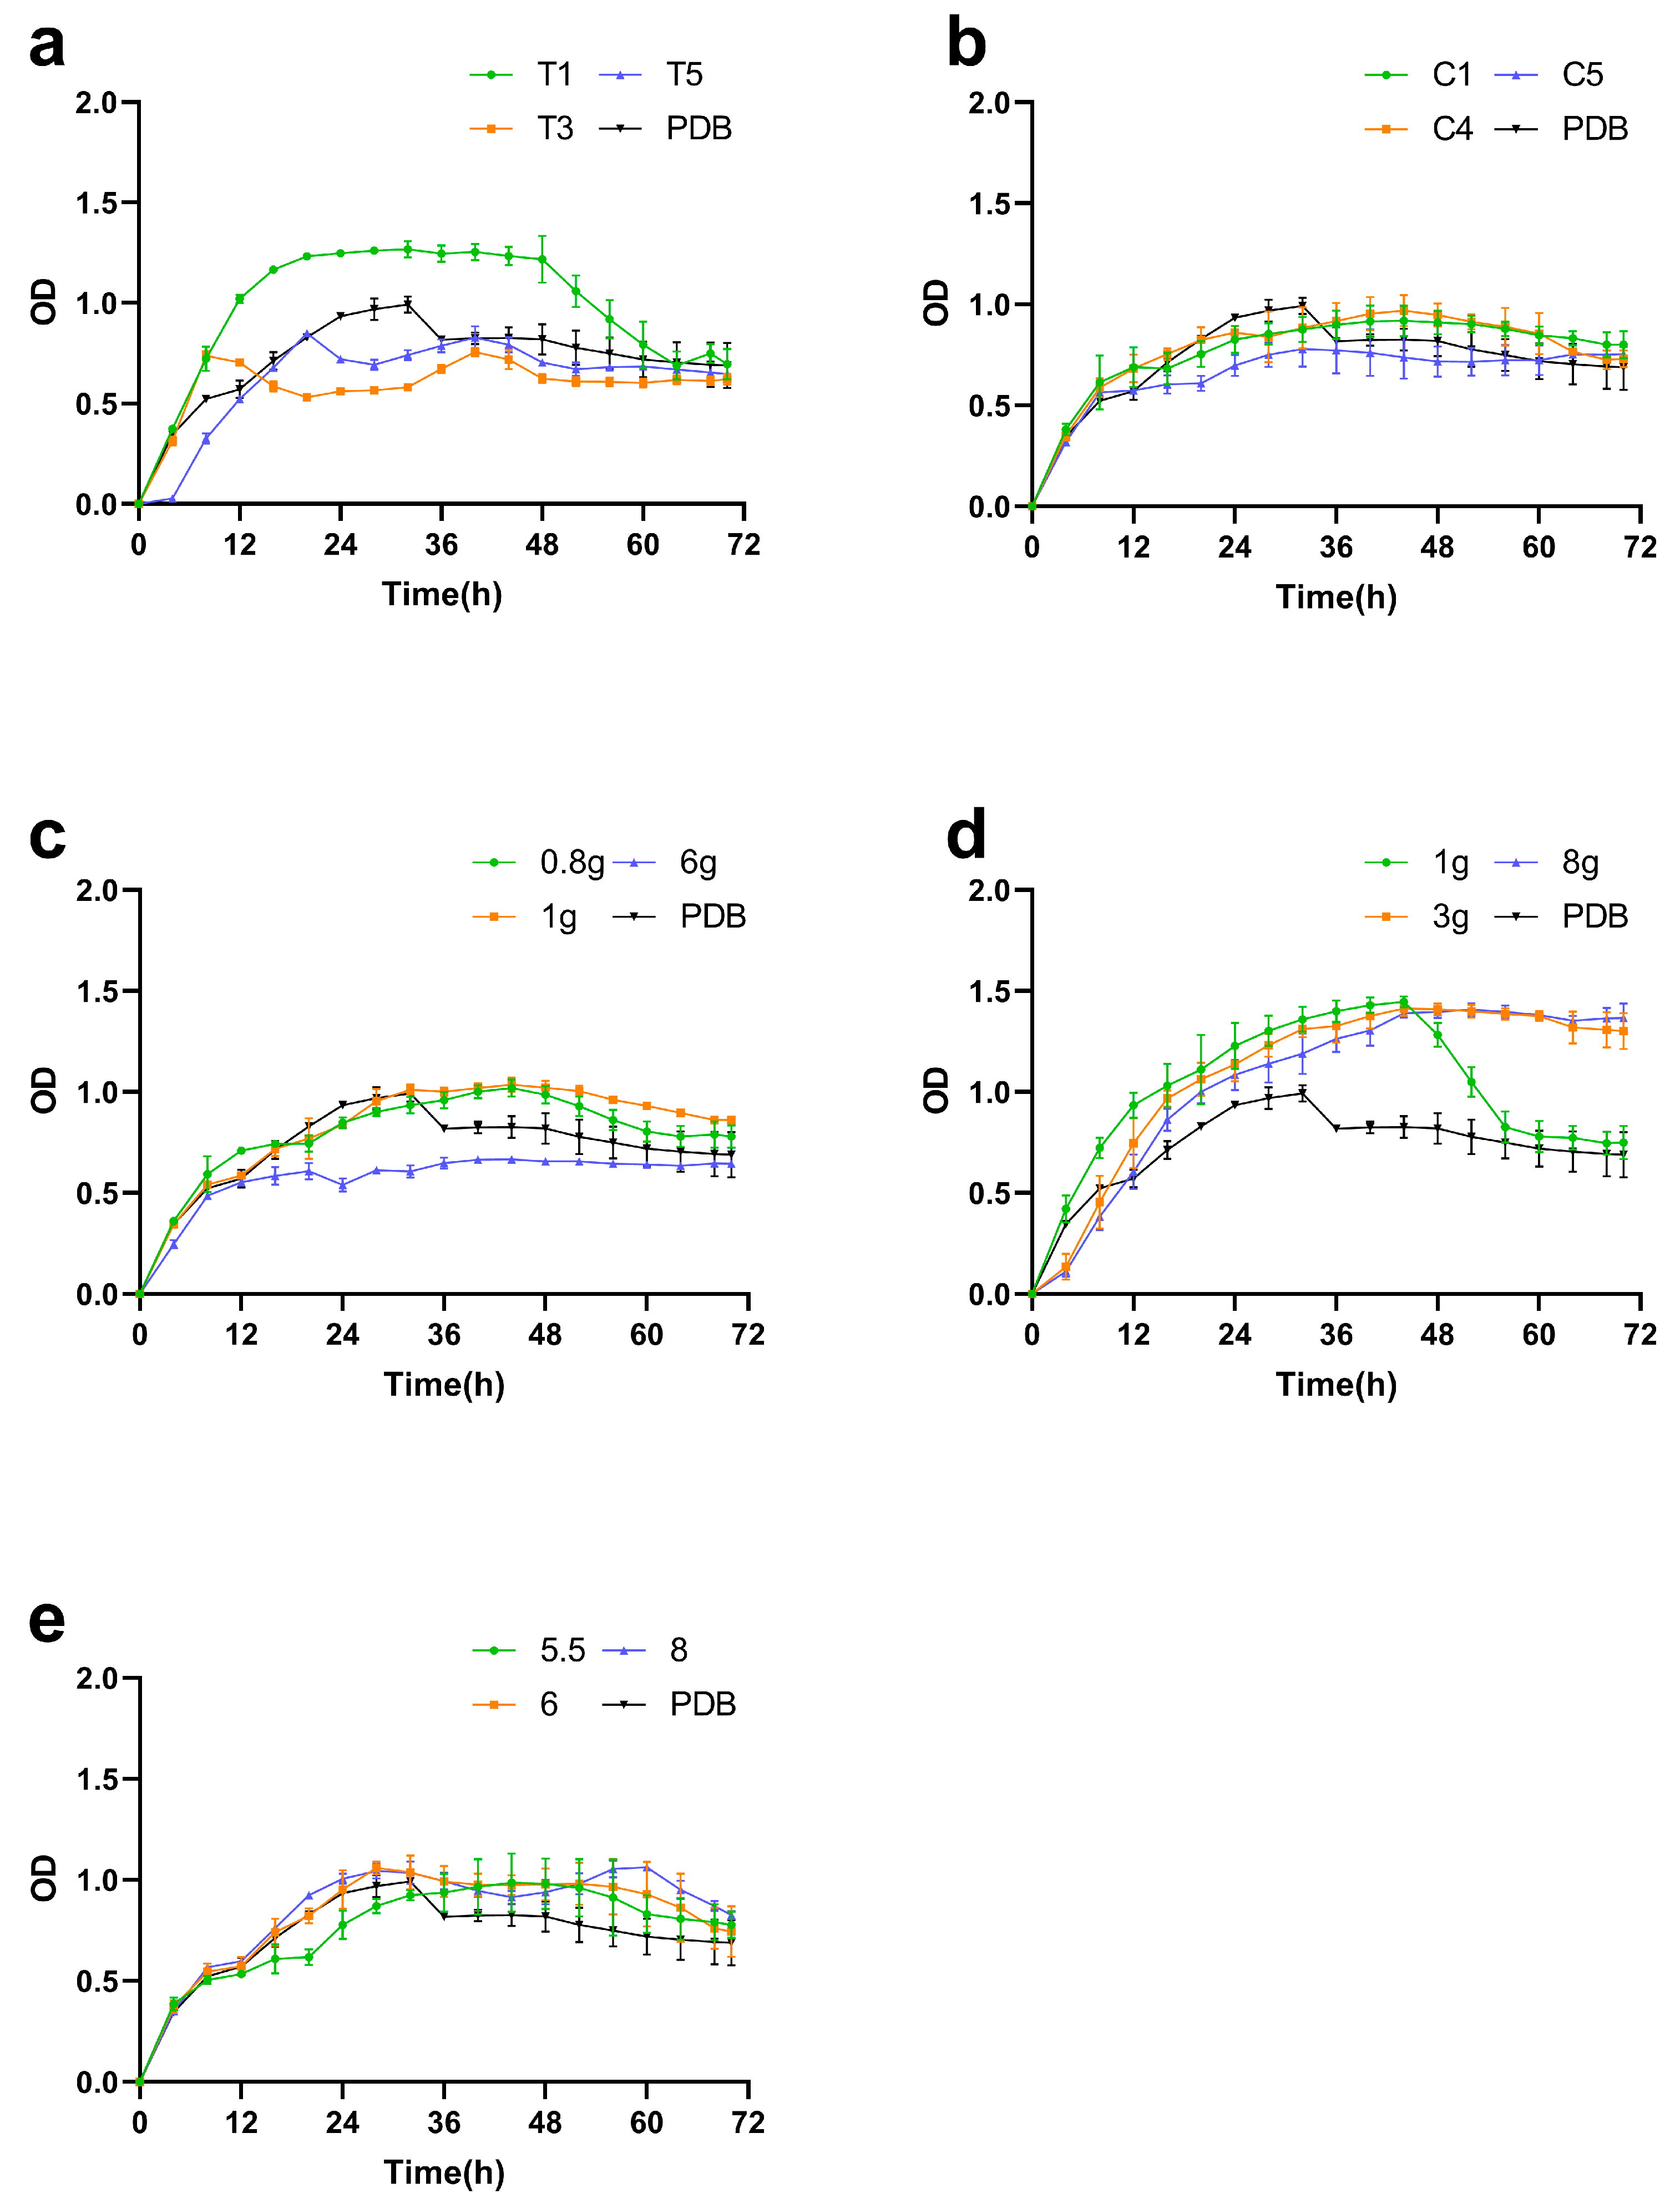
Figure 10. Growth curves of Bacillus velezensis YJ0-1 under various conditions based on single-factor optimization experiments. (a) Growth profiles with different nitrogen source ratios (peptone vs. urea): T1 (20.0 g/L peptone), T3 (10.0 g/L peptone + 2.76 g/L urea), T5 (5.52 g/L urea), compared with standard PDB medium. (b) Growth profiles with different carbon source ratios (sucrose vs. glucose): C1 (20.0 g/L sucrose), C4 (16.0 g/L sucrose + 8.0 g/L glucose), C5 (40.0 g/L glucose), compared with standard PDB medium. (c) Growth profiles with different total amounts of table sugar (sucrose) in 50 mL medium: 0.8 g, 1 g, and 6 g, compared with standard PDB medium. (d) Growth profiles with different total amounts of peptone in 50 mL medium: 1 g, 3 g, and 8 g, compared with standard PDB medium. (e) Growth profiles at different initial pH levels (5.0, 5.5, and 8.0), compared with standard PDB medium (pH 7.0).
Fermentation 11 00595 g010

3.2.3. Response Surface Methodology (RSM)

Based on the principles of response surface methodology (RSM) and single-factor experimental results, a three-factor, three-level RSM design was implemented (Table 1).
This set included 12 factorial experiment points and 3 replicates of center points, numbered 1 to 15 (Table 2).
The predicted R2 value of 0.6181 is in reasonable agreement with the adjusted R2 value of 0.8011, as their difference is less than 0.2. Adeq Precision, which measures the signal-to-noise ratio, is ideally greater than 4. A ratio of 8.481 was obtained in this study, indicating an adequate signal. The model demonstrates high applicability (Table 3).
The coefficient estimate represents the expected change in the response value per unit change in a specific factor, assuming all other factors remain constant. The intercept in an orthogonal design corresponds to the overall mean response across all experimental runs. The coefficients reflect adjustments of the factor settings relative to this mean. When factors are orthogonal, the variance inflation factor (VIF) equals 1. A VIF greater than 1 indicates the presence of multicollinearity, with higher values corresponding to stronger correlations among the factors. Generally, a VIF below 10 is considered acceptable (Table 4).
A regression model for fengycin production was developed using Design Expert 13 software based on the experimental data, resulting in the following equation:
Y = −0.147833 + 0.087742 × A + 0.030033 × B − 0.085748 × C + 0.0031 × AB
+ 0.022917 × AC + 0.006083 × BC − 0.010783 × A2 − 0.009021 × B2 − 0.025544 × C2
(where A = pH, B = peptone, C = sucrose; Table 5).
Analysis of variance (ANOVA) was employed to evaluate the overall validity of the model via the F-test. The obtained F-value of 7.27, with a corresponding probability of 2.09% (p < 0.05), indicates that the model is statistically significant. This low probability suggests that the observed relationships among the variables are unlikely to be due to random noise, confirming that the model is effective in explaining the experimental data.
Model terms with p-values less than 0.05 (AC, B2, C2) were considered statistically significant, whereas terms with p-values greater than 0.10 were deemed nonsignificant. The p-value serves as a key indicator in hypothesis testing to evaluate whether specific model terms (such as interaction terms AC or quadratic terms B2 and C2) have a significant effect on the dependent variable. Using the conventional significance threshold of 0.05, terms with p-values below this level are concluded to have a reliable and non-random influence on fengycin production. Conversely, terms with p-values above 0.10 are likely attributable to random variation and are not statistically significant. The presence of multiple nonsignificant terms (excluding those necessary to maintain model hierarchy) suggests that model simplification could be beneficial. Removing unimportant terms while preserving structural essentials may improve model efficiency and predictive accuracy without compromising interpretability.
The lack-of-fit F-value was used to assess model adequacy by comparing residual error to pure experimental error. With a probability of 89.16% that the observed lack-of-fit F-value (0.20) resulted from random noise, the nonsignificant lack-of-fit (p > 0.05) indicates satisfactory model fit. This implies that discrepancies between model predictions and experimental data fall within the range of expected experimental variation and do not reflect fundamental flaws in the model structure (Table 5). Therefore, the model provides a reliable basis for subsequent analysis and prediction.
pH-Peptone Interaction
Response surface analysis (Figure 11a,b) revealed that when sucrose content (C) was maintained at 0 and peptone concentration (B) held constant, fengycin production initially increased with rising pH (A), reaching maximum yields within the pH range of 5.9–6.1, followed by a gradual decrease. This pH range was identified as optimal for fengycin production. Similarly, at fixed pH levels, fengycin production exhibited a bell-shaped response to increasing peptone concentrations (B), with peak production occurring at 2.5–3.0 g peptone. These results demonstrate a concentration threshold effect of peptone as nitrogen source, where optimal production occurs within 2.5–3.0 g, beyond which potential nutrient imbalance or metabolic inhibition may reduce yields.
pH-Sucrose Interaction
As shown in Figure 11c,d, when peptone content (B) was maintained at baseline level (0) and pH (A) held constant, maximum fengycin production was achieved with sucrose concentrations (C) ranging from 0.8 to 1.4 g. Conversely, at fixed sucrose levels, production peaked when pH was maintained between 5.9 and 6.1.
Peptone-Sucrose Interaction
The response surface plots (Figure 11e,f) demonstrated that at baseline pH level (A = 0), fengycin production increased with sucrose concentration (C) within 1.1–1.7 g when peptone content (B) was held constant. Similarly, at fixed sucrose levels, maximum production was achieved with peptone concentrations ranging from 2.5 to 3.5 g.
As shown in Table 6, under a total of 22 predicted conditions, with a fixed pH value of 6.5, peptone and white sugar were regulated at 3.231–3.552 g and 1.510–1.797 g, respectively. The model predicted the mass distribution of the extract to be within the range of 0.100–0.102 g, and the Desirability values were generally higher than 0.9, indicating that all parameter combinations have high optimization potential. Among them, the experimental conditions numbered 1 (protein peptone 3.331 g, white sugar 1.634 g) were marked as “Selected”, with a consensus value of 0.928, which is the theoretical optimal solution recommended by the software. The actual experimental extract mass was 0.1015 g, with an absolute deviation of only 0.0005 g from the predicted value of No. 21 (0.101 g), and a relative error of 0.495% (RE = ∣0.1015 − 0.101∣/0.101 × 100%). Furthermore, t-test verification (t = −1.732, p > 0.05) showed no significant difference between the actual value and the predicted mean of the model, further confirming the reliability of the model. The consensus analysis shows that the consensus value corresponding to the actual experiment is 0.912, which is slightly lower than some high optimization groups (such as the consensus values of 0.925–0.928 for groups 1–20), but still in the high consensus range (>0.9), indicating that the process parameters are close to the global optimum. Overall, the response surface model can effectively guide the optimization of extraction processes, and the high agreement between actual results and predicted values (error < 0.5%) reflects the potential value of the model in industrial applications.

4. Discussion

The purification strategy of “acid precipitation–chromatographic separation–mass spectrometric identification” employed in this study effectively integrated and validated the core principles and techniques for fengycin purification reported in the literature. The initial acid precipitation step, based on the significant reduction in fengycin solubility under acidic conditions, is consistent with the principle of precipitation at pH 2.0 as applied in studies such as [24], successfully achieving efficient preliminary separation of the target product from the complex fermentation broth. The subsequent critical purification step relied on chromatographic techniques. As emphasized by [25], high-performance liquid chromatography (HPLC) is a powerful tool for the separation of fengycin homologs; accordingly, this study utilized a protein purification system, a form of efficient liquid chromatography, to accurately identify the active fraction of the target antifungal substance and achieve high-purity separation. Finally, fengycin was successfully identified as the key antifungal component through mass spectrometry and spectroscopic analysis. This complete technical workflow was not only successfully applied in this study but its high efficiency further confirms that a multi-step purification scheme based on the physicochemical properties of the target compound (such as solubility and hydrophobicity) is a reliable pathway for characterizing such microbial secondary metabolites.
This study reveals the antagonistic effect of fengycin (molecular formula: C72H110N12O20; molecular weight: 1463.8 Da) produced by Bacillus velezensis YJ0-1 against Sclerotinia sclerotiorum. The antifungal activity and mechanism of fengycin have been extensively investigated, and its mode of action can be summarized as follows: (1) reduction in cell wall integrity; (2) disruption of the cell membrane; (3) interference with intracellular metabolism; (4) induction of programmed cell death and autophagy; and (5) elicitation of plant defense responses [26]. Structurally, fengycin consists of a β-hydroxy fatty acid chain and a cyclic decapeptide. This unique cyclic lipopeptide architecture may contribute to its thermal stability under high-temperature conditions. It is noteworthy that variations in fatty acid chain length and amino acid sequences among fengycin homologs produced by different strains may influence their heat resistance [27,28]. Owing to its potent antifungal activity and environmentally benign nature, fengycin exhibits broad application prospects in biocontrol. For instance, Fan et al. (2017) demonstrated that fengycin from Bacillus subtilis 9407 plays a crucial role in controlling apple ring rot [29]. Similarly, Deng et al. (2024) purified ten distinct fengycin homologs from Bacillus subtilis FAJT-4 and identified C17 fengycin B as a key component inhibiting the growth of Fusarium oxysporum FJAT-31362 [30]. In addition, crude organic extracts from Bacillus amyloliquefaciens B157, rich in cyclic lipopeptides including fengycin, have also been applied to suppress tomato early blight caused by Alternaria linariae [31].
Through single-factor experiments and Box–Behnken response surface methodology optimization, the optimal PDB medium formulation was determined as follows: peptone 66.62 g/L, sucrose 32.68 g/L, and pH 6.5. Validation experiments confirmed that under these conditions, fengycin production reached 2.03 g/L, showing excellent agreement with the model-predicted value, with a relative error of only 0.49%. The growth profiles indicated (Figure 10) that the high-nutrient medium induced rapid exponential growth and high biomass in strain YJ0-1. This high-cell-density cultivation led to a sharp decline in the dissolved oxygen (DO) rate, risking a micro-oxic environment that could inhibit fengycin synthesis. This highlights a key limitation of our shake-flask optimization: it effectively manages metabolic precursors but cannot replicate the critical dissolved oxygen and mass transfer limitations of a bioreactor. The biosynthesis of fengycin is a complex process involving the nonribosomal peptide synthetase (NRPS) pathway [18]. Although its biosynthetic mechanism has attracted widespread attention, the yield in wild-type strains remains typically low, limiting large-scale application. Previous studies have attempted to overcome this limitation through various strategies. For instance, Wang et al. (2022) employed systematic genetic engineering of Bacillus amyloliquefaciens, where knocking out bdh blocked carbon overflow to enhance precursor supply of branched-chain amino acids, disruption of kinA inhibited sporulation to extend production phase, deletion of dhbF blocked siderophore synthesis to improve amino acid utilization, and removal of rapA increased Spo0A∼P levels, collectively enhancing fengycin production [32]. Genetic engineering techniques have been applied to improve fengycin production, Tan et al. (2022) tandemly integrated the P43 promoter, sfp, and degQ genes into the genome of Bacillus subtilis 168, successfully constructing the fengycin-producing engineered strain 168DS, which increased fengycin yield to 130.10 mg/L [33]. Similarly, Wang et al. (2025) demonstrated that engineering central carbon metabolism and blocking carbon overflow pathway in Bacillus subtilis increased fengycin titer to 1290.31 mg/L, 2.05-fold higher than the control [34]. In this context, our optimization strategy presents a complementary non-genetic approach that achieves comparable success through extracellular parameter modulation. The remarkable fengycin titer of 2.03 g/L attained in this study aligns with the production levels reported in several genetic engineering studies, yet was achieved solely through medium optimization. Specifically, the optimized peptone concentration (66.62 g/L) ensures abundant amino acid precursors, functionally mimicking the effect of bdh knockout in Wang et al. (2022) by providing direct precursor supply without triggering carbon overflow [32]. Meanwhile, the optimized sucrose level (32.68 g/L) and pH 6.5 create metabolic conditions that potentially redirect carbon flux toward fengycin synthesis, analogous to the central carbon metabolic engineering employed by Wang et al. (2025) [34]. Furthermore, our findings resonate with other regulatory mechanisms reported in the literature. The transcriptional reprogramming of amino acid synthesis, fatty acid metabolism, and energy metabolism observed by Lu et al. (2022) following fructose addition [35] suggests that carbon source manipulation fundamentally alters cellular metabolism. Our successful use of sucrose similarly likely induces comparable metabolic shifts, demonstrating that carefully designed nutritional environments can emulate the effects of specific genetic modifications. However, as highlighted by Pererva et al. (2024), industrial production requires comprehensive consideration of cost-effectiveness [36]. The composition and ratio of carbon and nitrogen sources significantly influence the growth of Bacillus species and the synthesis of their lipopeptide products [37]. Although the current yield (2.03 g/L) is relatively high at the laboratory scale, future efforts should integrate the nutritional optimization strategy developed here with targeted genetic modifications to further enhance production efficiency and economic viability of fengycin. Such an integrated approach could potentially combine the precision of metabolic engineering with the scalability and cost-effectiveness of medium optimization.
The field application strategy proposed in this study aligns with the “reducing chemical use while enhancing efficiency” initiative advocated by the Food and Agriculture Organization of the United Nations (FAO, 2024). Further exploration of the synergistic effects of combining the YJ0-1 bacterial agent with adjuvants such as humic acid and chitosan is warranted, drawing on the integrated application of “humic acid–chitosan–Bacillus subtilis” proposed by Qiu et al. (2025) for tomato growth promotion and disease control [38]. It is recommended to incorporate big data and artificial intelligence technologies to establish a plant disease monitoring and prevention platform, similar to the “China Intelligent Infectious Disease Active Surveillance and Early Warning System” developed by Kang et al. (2024), thereby achieving integrated biocontrol and intelligent monitoring [39]. Comprehensive plant disease management strategies can be developed with reference to the Integrated Pest Management (IPM) framework proposed by Tiwari (2024), which incorporates multidisciplinary approaches from biology, ecology, and agricultural science [40]. Future work should prioritize the establishment of a standardized evaluation system for the field stability of biopesticides, to facilitate the implementation of registration policies and promote practical application.

Author Contributions

X.Z.: writing—original draft preparation, writing—review and editing, data analysis. Y.D.: methodology, writing—review and editing. S.Y. review of information, data analysis, writing—review and editing, Y.L.: writing—review and editing. All authors have read and agreed to the published version of the manuscript.

Funding

This research received no external funding.

Institutional Review Board Statement

Not applicable.

Informed Consent Statement

Not applicable.

Data Availability Statement

Data are available upon reasonable request from the corresponding author.

Conflicts of Interest

The authors declare no conflicts of interest.

References

  1. Wang, Y. Progress in the Study of Pathogenic Factors of Sclerotinia sclerotiorum. Theor. Nat. Sci. 2024, 59, 138–145. [Google Scholar] [CrossRef]
  2. Willbur, J.; McCaghey, M.; Kabbage, M.; Smith, D.L. An Overview of the Sclerotinia sclerotiorum Pathosystem in Soybean: Impact, Fungal Biology, and Current Management Strategies. Trop. Plant Pathol. 2018, 44, 3–11. [Google Scholar] [CrossRef]
  3. Zamani-Noor, N.; Jedryczka, M. Inoculum and Inoculation Techniques: Key Steps in Studying Pathogenicity and Resistance to Sclerotinia Stem Rot in Oilseed Rape. Front. Plant Sci. 2025, 16, 1610049. [Google Scholar] [CrossRef] [PubMed]
  4. Sarenqimuge, S.; Koopmann, B.; von Tiedemann, A. Long-Term Survival of Sclerotinia sclerotiorum Sclerotia and Verticillium longisporum Microsclerotia in Soil and the Effects of Soil Depth, Soil Temperature, and a Biocontrol Agent. Appl. Soil Ecol. 2025, 210, 106101. [Google Scholar] [CrossRef]
  5. Ding, L.-N.; Li, T.; Guo, X.-J.; Li, M.; Liu, X.-Y.; Cao, J.; Tan, X.-L. Sclerotinia Stem Rot Resistance in Rapeseed: Recent Progress and Future Prospects. J. Agric. Food Chem. 2021, 69, 2965–2978. [Google Scholar] [CrossRef]
  6. Zhang, Z.-J.; Yang, Q.; Wei, D.; Yang, L.; Zhang, X.-L.; Chen, X.-L. Research on Destructive of Sclerotinia sclerotiorum to Host Soybean in Black Soil Area of Northeast China. Soybean Sci. 2008, 27, 633–636. [Google Scholar]
  7. Antwi-Boasiako, A.; Zheng, L.; Begum, N.; Amoah, S.; Zhao, T. Progress towards Germplasm Evaluation and Genetic Improvement for Resistance to Sclerotinia White Mold in Soybean. Euphytica 2021, 217, 178. [Google Scholar] [CrossRef]
  8. Zhu, G.-Y.; Shi, X.-C.; Wang, S.-Y.; Wang, B.; Laborda, P. Antifungal Mechanism and Efficacy of Kojic Acid for the Control of Sclerotinia sclerotiorum in Soybean. Front. Plant Sci. 2022, 13, 845698. [Google Scholar] [CrossRef] [PubMed]
  9. Yu, S.-F.; Wang, C.-L.; Hu, Y.-F.; Wen, Y.-C.; Sun, Z.-B. Biocontrol of Three Severe Diseases in Soybean. Agriculture 2022, 12, 1391. [Google Scholar] [CrossRef]
  10. Morais, E.M.; Silva, A.A.R.; de Sousa, F.W.A.; de Azevedo, I.M.B.; Silva, H.F.; Santos, A.M.G.; Beserra Júnior, J.E.A.; de Carvalho, C.P.; Eberlin, M.N.; Porcari, A.M.; et al. Endophytic Trichoderma Strains Isolated from Forest Species of the Cerrado-Caatinga Ecotone Are Potential Biocontrol Agents against Crop Pathogenic Fungi. PLoS ONE 2022, 17, e0265824. [Google Scholar] [CrossRef]
  11. Rodriguez, M.C.; Sautua, F.; Scandiani, M.; Carmona, M.; Asurmendi, S. Current Recommendations and Novel Strategies for Sustainable Management of Soybean Sudden Death Syndrome. Pest Manag. Sci. 2021, 77, 4238–4248. [Google Scholar] [CrossRef] [PubMed]
  12. Sumida, C.H.; Canteri, M.G.; Peitl, D.C.; Tibolla, F.; Orsini, I.P.; Araújo, F.A.; Chagas, D.F.; Calvos, N.S. Chemical and Biological Control of Sclerotinia Stem Rot in the Soybean Crop. Cienc. Rural. 2015, 45, 760–766. [Google Scholar] [CrossRef]
  13. O’Sullivan, C.A.; Belt, K.; Thatcher, L.F. Tackling Control of a Cosmopolitan Phytopathogen: Sclerotinia. Front. Plant Sci. 2021, 12, 707509. [Google Scholar] [CrossRef]
  14. Dickman, M. Approaches for Improving Crop Resistance to Soilborne Fungal Diseases through Biotechnology Using Sclerotinia sclerotiorum as a Case Study. Australas. Plant Pathol. 2007, 36, 116–123. [Google Scholar] [CrossRef]
  15. Saharan, G.S.; Mehta, N. Sclerotinia Diseases of Crop Plants: Biology, Ecology and Disease Management; Springer: Berlin/Heidelberg, Germany, 2008. [Google Scholar] [CrossRef]
  16. Raaijmakers, J.M.; De Bruijn, I.; Nybroe, O.; Ongena, M. Natural Functions of Lipopeptides from Bacillus and Pseudomonas: More than Surfactants and Antibiotics. FEMS Microbiol. Rev. 2010, 34, 1037–1062. [Google Scholar] [CrossRef]
  17. Rabbee, M.F.; Ali, M.S.; Choi, J.; Hwang, B.S.; Jeong, S.C.; Baek, K. Bacillus velezensis: A Valuable Member of Bioactive Molecules within Plant Microbiomes. Molecules 2019, 24, 1046. [Google Scholar] [CrossRef]
  18. Valenzuela Ruiz, V.; Gándara-Ledezma, A.; Villarreal-Delgado, M.F.; Villa-Rodríguez, E.D.; Parra-Cota, F.I.; Santoyo, G.; Gómez-Godínez, L.J.; Cira Chávez, L.A.; de los Santos-Villalobos, S. Regulation, Biosynthesis, and Extraction of Bacillus-Derived Lipopeptides and Its Implications in Biological Control of Phytopathogens. Stresses 2024, 4, 107–132. [Google Scholar] [CrossRef]
  19. Yuan, Q.-S.; Yang, P.; Liu, Y.-K.; Tabl, K.M.; Guo, M.-W.; Zhang, J.-B.; Wu, A.-B.; Liao, Y.-C.; Huang, T.; He, W.-J. Iturin and Fengycin Lipopeptides Inhibit Pathogenic Fusarium by Targeting Multiple Components of the Cell Membrane and Their Regulative Effects in Wheat. J. Integr. Plant Biol. 2025, 67, 2184–2197. [Google Scholar] [CrossRef]
  20. Xu, T.; Zhu, T.; Li, S. β-1,3-1,4-Glucanase Gene from Bacillus velezensis ZJ20 Exerts Antifungal Effect on Plant Pathogenic Fungi. World J. Microbiol. Biotechnol. 2016, 32, 26. [Google Scholar] [CrossRef]
  21. Tyagi, A.; Lama Tamang, T.; Kashtoh, H.; Mir, R.A.; Mir, Z.A.; Manzoor, S.; Manzar, N.; Gani, G.; Vishwakarma, S.K.; Almalki, M.A.; et al. A Review on Biocontrol Agents as Sustainable Approach for Crop Disease Management: Applications, Production, and Future Perspectives. Horticulturae 2024, 10, 805. [Google Scholar] [CrossRef]
  22. Tsvetkov, V.; Yarullina, L.; Sorokan, A.; Khabibullina, V.; Mardanshin, I. Activity of Hydrolases and Their Inhibitors in Potato Plants Treated with Bacillus subtilis, Salicylic, and Jasmonic Acids and Affected by the Combined Effect of the Late Blight and the Lack of Moisture. Int. J. Plant Biol. 2023, 14, 329–338. [Google Scholar] [CrossRef]
  23. Gao, X. Mechanism Analysis of Bacillus Velezensis YJ0-1 Inhibiting Sclerotinia sclerotiorum. Master’s Thesis, Jilin Normal University, Siping, China, 2023. [Google Scholar]
  24. Wei, Y.-H.; Wang, L.-C.; Chen, W.-C.; Chen, S.-Y. Production and Characterization of Fengycin by Indigenous Bacillus Subtilis F29-3 Originating from a Potato Farm. Int. J. Mol. Sci. 2010, 11, 4526–4538. [Google Scholar] [CrossRef]
  25. Roy, A.; Mahata, D.; Paul, D.; Korpole, S.; Franco, O.L.; Mandal, S.M. Purification, Biochemical Characterization and Self-Assembled Structure of a Fengycin-like Antifungal Peptide from Bacillus thuringiensis Strain SM1. Front. Microbiol. 2013, 4, 66994. [Google Scholar] [CrossRef] [PubMed]
  26. Chen, M.; Wang, H.; Zhang, C.; Zhang, Y.; Sun, H.; Yu, L.; Zhang, Q.; Chen, X.; Xiao, H. Recent Advances in Antimicrobial Lipopeptide Fengycin Secreted by Bacillus: Structure, Biosynthesis, Antifungal Mechanisms, and Potential Application in Food Preservation. Food Chem. 2025, 489, 144937. [Google Scholar] [CrossRef]
  27. Medeot, D.; Sannazzaro, A.; Estrella, M.J.; Torres Tejerizo, G.; Contreras-Moreira, B.; Pistorio, M.; Jofré, E. Unraveling the Genome of Bacillus velezensis MEP218, a Strain Producing Fengycin Homologs with Broad Antibacterial Activity: Comprehensive Comparative Genome Analysis. Sci. Rep. 2023, 13, 22168. [Google Scholar] [CrossRef] [PubMed]
  28. Ait Kaki, A.; Smargiasso, N.; Ongena, M.; Kara Ali, M.; Moula, N.; De Pauw, E.; Kacem Chaouche, N. Characterization of New Fengycin Cyclic Lipopeptide Variants Produced by Bacillus Amyloliquefaciens (ET) Originating from a Salt Lake of Eastern Algeria. Curr. Microbiol. 2020, 77, 443–451. [Google Scholar] [CrossRef]
  29. Fan, H.; Ru, J.; Zhang, Y.; Wang, Q.; Li, Y. Fengycin Produced by Bacillus subtilis 9407 Plays a Major Role in the Biocontrol of Apple Ring Rot Disease. Microbiol. Res. 2017, 199, 89–97. [Google Scholar] [CrossRef]
  30. Deng, Y.; Chen, Z.; Chen, Y.; Wang, J.; Xiao, R.; Wang, X.; Liu, B.; Chen, M.; He, J. Lipopeptide C17 Fengycin B Exhibits a Novel Antifungal Mechanism by Triggering Metacaspase-Dependent Apoptosis in Fusarium oxysporum. J. Agric. Food Chem. 2024, 72, 7943–7953. [Google Scholar] [CrossRef]
  31. da Silva Junior, A.L.; Borges, Á.V.; da Silva, H.A.O.; Leite, I.C.H.L.; Alves, K.S.; de Medeiros, L.S.; Abreu, L.M. de Lipopeptide-Enriched Extracts of Bacillus Velezensis B157 for Controlling Tomato Early Blight. Crop Prot. 2023, 172, 106317. [Google Scholar] [CrossRef]
  32. Wang, S.; Wang, R.; Zhao, X.; Ma, G.; Liu, N.; Zheng, Y.; Tan, J.; Qi, G. Systemically Engineering Bacillus amyloliquefaciens for Increasing Its Antifungal Activity and Green Antifungal Lipopeptides Production. Front. Bioeng. Biotechnol. 2022, 10, 961535. [Google Scholar] [CrossRef]
  33. Tan, W.; Yin, Y.; Wen, J. Increasing Fengycin Production by Strengthening the Fatty Acid Synthesis Pathway and Optimizing Fermentation Conditions. Biochem. Eng. J. 2022, 177, 108235. [Google Scholar] [CrossRef]
  34. Wang, D.-J.; Ding, M.-Z.; Hou, Z.-J.; Zhang, Y.; Shang, W.; Duan, T.-X.; Xu, Q.-M.; Cheng, J.-S. Carbon Metabolism Modification in Bacillus subtilis for Improving Fengycin Production and Investigating Antifungal Activity of Its Homologous Components. ACS Synth. Biol. 2025, 14, 2644–2656. [Google Scholar] [CrossRef]
  35. Lu, H.; Xu, H.; Yang, P.; Bilal, M.; Zhu, S.; Zhong, M.; Zhao, L.; Gu, C.; Liu, S.; Zhao, Y.; et al. Transcriptome Analysis of Bacillus amyloliquefaciens Reveals Fructose Addition Effects on Fengycin Synthesis. Genes 2022, 13, 984. [Google Scholar] [CrossRef]
  36. Pererva, P.; Kobielieva, T.; Keršys, R.; Nagy, S.; Kosenko, O.; Tkachova, N.; Marchuk, L.; Kosenko, A.; Tkachov, M.; Pohorielov, S. Development of Methods for Forming the Cost of Production and Assessment of Its Impact on the Efficiency of an Industrial Enterprise. Technol. Audit. Prod. Reserves 2025, 3, 26–33. [Google Scholar] [CrossRef]
  37. Zhai, Y.; Guo, H.; Wei, H.; Zhang, D.; Yao, S.; Hao, H.; Bie, X. Current State in Fermentation, Isolation, and Purification of Lipopeptide Antibiotics from Bacillus sp. Chin. J. Biotechnol. 2011, 31, 114–122. [Google Scholar]
  38. Qiu, C.; Bao, Y.; Lü, D.; Yan, M.; Li, G.; Liu, K.; Wei, S.; Wu, M.; Li, Z. The Synergistic Effects of Humic Acid, Chitosan and Bacillus Subtilis on Tomato Growth and against Plant Diseases. Front. Microbiol. 2025, 16, 1574765. [Google Scholar] [CrossRef] [PubMed]
  39. Kang, L.; Hu, J.; Cai, K.; Jing, W.; Liu, M.; Liang, W. The Intelligent Infectious Disease Active Surveillance and Early Warning System in China: An Application of Dengue Prevention and Control. Glob. Transit. 2024, 6, 249–255. [Google Scholar] [CrossRef]
  40. Tiwari, A.K. IPM Essentials: Combining Biology, Ecology, and Agriculture for Sustainable Pest Control. J. Adv. Biol. Biotechnol. 2024, 27, 39–47. [Google Scholar] [CrossRef]
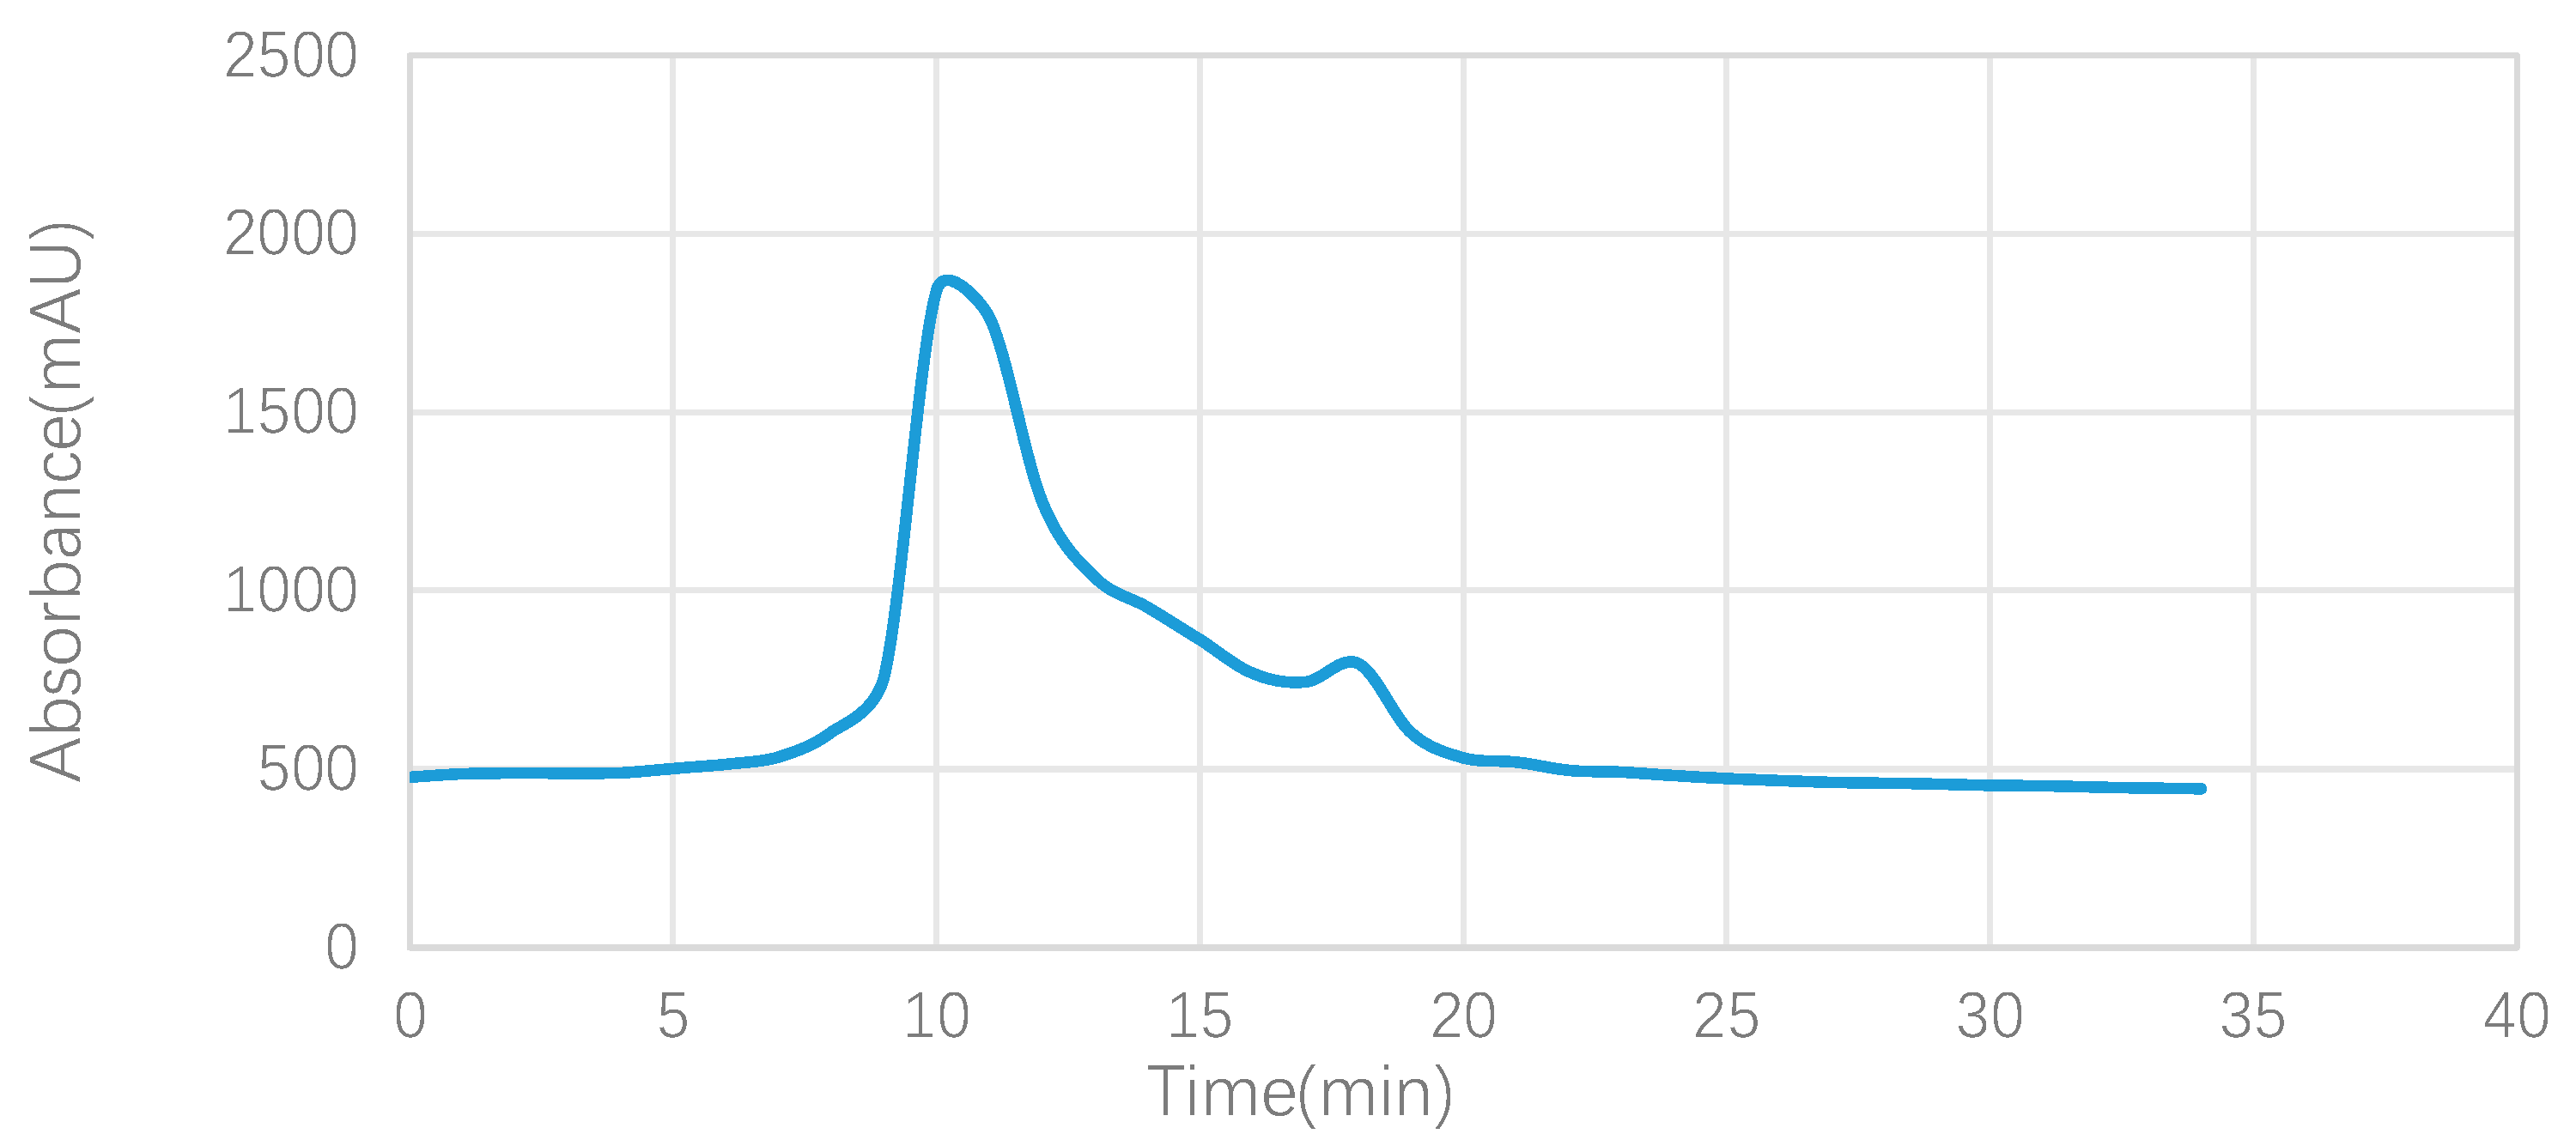
Figure 1. Peak of crude extract of Bacillus velezensis YJ0-1.
Fermentation 11 00595 g001
Figure 2. Full spectrum of crude extract of Bacillus velezensis YJ0-1. The abscissa Wave (nm) represents the wavelength in nanometers, and the ordinate represents the absorbance of the substance. The different-colored curves in the figure correspond to the measurement results at different time points (1–36 min) checked above.
Fermentation 11 00595 g002
Figure 3. The antibacterial effect of the isolated products at different time on Sclerotinia sclerotiorum. ck: control is water; The numbers 1–36 represent the different separated liquids collected, arranged in panels (A)–(L) for layout purposes. Scale = 1 cm, for reference to colony growth range. The experiment was carried out at 28 °C for 3 days.
Fermentation 11 00595 g003
Figure 4. Inhibitory effects of fractions collected at different time points against Sclerotinia sclerotiorum. Fractions were collected during purification at three different time intervals (labeled as 9, 10, and 11). The antifungal activity of each fraction was measured and is presented as the inhibition rate (%). Data are shown as mean ± SD (n = 3). Bars sharing the same lowercase letter are not significantly different according to LSD test (p ≤ 0.05).
Fermentation 11 00595 g004
Figure 5. HPLC chromatogram of the purified antimicrobial purified fraction from Fraction 9, showing a single dominant peak at 2.4 min. The horizontal coordinate “retention time (min)” indicates the time for each substance to stay in the liquid chromatographic column, the unit is minute; The ordinate “Signal strength (V)” indicates the signal strength of each substance detected in volts. The values marked in the figure (such as 937.07, 11,142.640, etc.) are the signal strength values of the peaks corresponding to the retention time. The chromatographic column model was Ellitec G-10 glucan gel column (4.6 mm × 250 mm × 5 μm), the mobile phase was pure water, and the detection wavelength was 230 nm.
Fermentation 11 00595 g005
Figure 6. Purified fraction plate antagonism test. CK1: Purified fraction at room temperature; CK2: Purified fraction at room temperature (replicate); HT1: Purified fraction heated at 121 °C for 20 min; HT2: Purified fraction heated at 121 °C for 20 min (replicate); Scale bar = 1 cm (indicating colony growth range). The experiment was conducted at 28 °C for 3 days.
Fermentation 11 00595 g006
Figure 7. Mass spectrum of Purified fraction. The horizontal coordinate “m/z” represents the mass-charge ratio, which is the ratio of the mass of the ion to the charge it carries; The ordinate “Relative Abundance” represents the relative abundance, expressed in percentage, reflecting the relative relationship between the contents of ions with different mass-charge ratios. The values marked in the figure (such as 1076.40013, 1463.81122, etc.) are the relative abundance values at the corresponding mass-charge ratio.
Fermentation 11 00595 g007
Figure 8. Standard curve of Purified fraction concentration.
Fermentation 11 00595 g008
Figure 9. The content of Fengycin extracted from culture media with (a) different nitrogen source combinations, (b) carbon source combinations, (c) content of Sucrose, (d) content of peptone and (e) pH values. The letters a, b, c, d, e and f marked on the top of the bar chart indicate significant differences. Differences between groups sharing the same letter are not significant, while those with different letters are significant (p ≤ 0.05, LSD test). All experiments were conducted in a 50 mL culture medium, and the weights shown in the figure represent the amounts added per 50 mL.
Fermentation 11 00595 g009
Figure 11. Response surface and contour map of interaction. (a,b) Response surface and contour map of interaction between peptone content and pH value. (c,d) Response surface and contour map of interaction between sucrose content and pH value. (e,f) Response surface and contour map of interaction between sucrose content and peptone content. The numerical marks correspond to different levels of fengycin yield, sucrose content, peptone content and pH value. All experiments were conducted in a 50 mL culture medium. The mass values indicated in the figure correspond to the content in 50 mL. The color gradient represents the predicted yield of fengycin (g/L).
Fermentation 11 00595 g011
Table 1. Level table of response surface factors of medium.
FactorsVariable and Level
−101
pH5.566.5
Peptone234
Sucrose0.81.42
Table 2. Experimental design and results of medium.
StdRunA: pHB: Peptone (g)C: Sucrose (g)Response (g)
1155.521.40.0919
296.521.40.0866
3135.541.40.093
426.541.40.0939
5105.530.80.0977
676.530.80.0856
755.5320.083
846.5320.0984
96620.80.0859
1011640.80.0865
1186220.0759
12146420.0911
1312631.40.1057
141631.40.1064
153631.40.0971
Table 3. Fit statistics for the stock model.
Std. Dev.MeanR2Adjusted R2Predicted R2C.V %Adeq Precision
0.00370.09190.9290.80110.61814.058.4807
Table 4. Coefficients of coded factors in the medium.
FactorCoefficient EstimatedfStandard Error95% CI Low95% CI HighVIF
Intercept0.103110.00220.09750.1086
A-pH−0.000110.0013−0.00350.00321.0000
B-Peptone0.003010.0013−0.00040.00641.0000
C-Sucrose−0.000910.0013−0.00430.00251.0000
AB0.001610.0019−0.00320.00631.0000
AC0.006910.00190.00210.01171.0000
BC0.003710.0019−0.00110.00841.0000
A2−0.002710.0019−0.00770.00231.01
B2−0.009010.0019−0.0140−0.00401.01
C2−0.009210.0019−0.0142−0.00421.01
Table 5. Variance analysis of the medium model.
SourceSun of SquaresdfMean SquareF-Valuep-Value
Model0.000990.00017.270.0209significant
A-pH1.512 × 10−711.512 × 10−70.01090.9209
B-Peptone0.000110.00015.270.0701
C-Sucrose6.661 × 10−616.661 × 10−60.47970.5194
AB9.610 × 10−619.610 × 10−60.69200.4434
AC0.000210.000213.610.0141
BC0.000110.00013.840.1074
A20.000010.00001.930.2232
B20.000310.000321.640.0056
C20.000310.000322.480.0051
Residual0.000150.0000
Lack of Fit0.000035.263 × 10−60.19620.8916not significant
Pure Error0.000120.0000
Cor Total0.001014
Table 6. Predicted Optimal Conditions with Desirability.
NumberpHPeptone (g)Sucrose (g)Extract (g)Desirability
16.5003.3311.6340.1020.928Selected
26.5003.3401.6350.1020.928
36.5003.3391.6310.1020.928
46.5003.3251.6380.1020.928
56.5003.3321.6410.1020.928
66.5003.3161.6260.1020.928
76.5003.3451.6450.1020.928
86.5003.3541.6430.1020.928
96.5003.3101.6370.1020.928
106.5003.3531.6190.1020.928
116.5003.2931.6250.1020.928
126.5003.3441.6680.1020.927
136.5003.3901.6410.1020.927
146.5003.3921.6170.1020.927
156.5003.2761.6630.1020.927
166.5003.2881.6700.1020.927
176.5003.3191.6810.1020.927
186.5003.2311.6140.1020.926
196.5003.2731.5620.1020.925
206.5003.4791.7870.1020.916
216.5003.5521.7970.1010.912
226.5002.9121.5100.1000.898
Disclaimer/Publisher’s Note: The statements, opinions and data contained in all publications are solely those of the individual author(s) and contributor(s) and not of MDPI and/or the editor(s). MDPI and/or the editor(s) disclaim responsibility for any injury to people or property resulting from any ideas, methods, instructions or products referred to in the content.