Article

Adding Condensed Tannins to High-Concentrate Diets: Effects on Rumen Fermentation and Tympanism in Goats

1
Institute of Modern Agriculture, Leshan Vocational and Technical College, Leshan 614000, China
2
Institute of Animal Nutrition, Sichuan Agricultural University, Chengdu 611130, China
*
Author to whom correspondence should be addressed.
Fermentation 2025, 11(10), 581; https://doi.org/10.3390/fermentation11100581
Submission received: 16 February 2025 / Revised: 21 March 2025 / Accepted: 22 March 2025 / Published: 10 October 2025

Abstract

The primary aim of this study was to identify key factors causing high-concentrate diet (HCD)-induced rumen tympanism in goats and to assess the impact of condensed tannin (CT) supplementation (at 1%, 2%, and 3% CT content, w/v) on rumen fluid foam characteristics. Additionally, we explored the feasibility of incorporating CT into HCDs to prevent rumen tympanism. Two trials were conducted to achieve this goal. Trial 1 focused on 15 HCD-fed goats, measuring foaming production, retention, protein fractions, and total protein concentrations. A positive correlation was found between total protein concentration and foaming characteristics (p < 0.05). Protein Component 3 (P3) also correlated with foam (p < 0.05). Five tympanitic goats were further analyzed, with four treatment groups (Control, 1%, 2%, and 3% CT). CT supplementation significantly reduced foaming (p < 0.05). Trial 2 explored CT incorporation into HCDs using 18 goats and three treatment groups (Control, 1% CT, 2% CT). The 2% CT group showed significant foam reduction (p < 0.01). CT did not affect goat health, digestibility, or rumen flora. In conclusion, the addition of 2% CT to HCDs significantly reduces the occurrence of rumen tympanism in goats.

1. Introduction

Under the modern intensive farming paradigm, farmers often prioritize increasing the proportion of concentrates in ruminant diets to enhance production performance. Consequently, the use of high-concentrate diets (HCDs) has become increasingly prevalent [1,2,3]. However, HCDs can lead to the formation of substantial amounts of stable foam within the rumen, which may trigger frothy tympanism and result in significant losses in ruminant productivity [4,5,6]. To date, the mechanisms by which a HCD induces rumen foam remain unclear, complicating efforts to effectively prevent rumen tympanism during HCD feeding. The formation of large quantities of stable foams in the rumen necessitates two conditions: first, a foaming agent must be present to facilitate foam generation from ruminal fluid; second, a foam stabilizer is essential to ensure that these foams persist without collapsing. Proteins are among the substances most likely to function as both foaming agents and foam stabilizers when animals are fed HCDs [7]. Previous studies have demonstrated that incorporating condensed tannin (CT) into diets can reduce protein degradation within the rumen [8,9], suggesting a potential role for CT in preventing rumen tympanism. However, if the content of CTs in forage exceeds 3%, adverse effects on nutrient absorption and utilization in ruminants may occur [10]. Therefore, it remains uncertain whether CT can effectively mitigate frothy tympanism when added to HCDs without adversely affecting their health. The primary aim of this study was to identify key factors causing HCD-induced rumen tympanism in goats, to assess the impact of CT supplementation on rumen fluid foam characteristics, and to explore the feasibility of incorporating CT into HCDs to prevent rumen tympanism. We hypothesize that there was a positive correlation between the protein content and the foam characteristics of rumen fluid. The addition of CT significantly reduced the foam characteristics, thereby lowering the incidence of bloat in goats fed HCDs.

2. Materials and Methods

2.1. Trial 1: The Study on the Relationship Between Protein Concentration and Foam Characteristics of Rumen Fluid

Experimental Animals, Design, and Diet. The study involved 15 healthy black goats, 4–6 months old and weighing approximately 24 kg ± 2.5 kg. Throughout the experiment, the goats were housed together and fed an HCD formulated according to the Chinese Feeding Standard of Meat-producing Sheep and Goats (NY/T816-2021). The proportion of concentrate was gradually increased until the concentrate-to-roughage ratio reached 75:25, after which the goats were switched to the HCD for a 30-day formal experiment. The final diet composition is presented in Table 1. The goats were fed twice daily at 09:00 and 17:00.
Rumen contents were collected from each goat at the 2 h post-morning feeding on days 12, 14, 16, 18, and 20 of the experiment. A clean stomach tube, connected to a vacuum pump, was gently inserted into the rumen via the esophagus and adjusted continuously until in the correct position. The initial 30 mL of rumen contents collected were discarded. Subsequently, the remaining contents were immediately filtered through four layers of gauze to obtain rumen fluid, which was then aliquoted and labeled accordingly. Following the experiment, the rumen fluids from each goat, collected over 5 days, were pooled and stored at −20 °C to assess foam production, retention, and the concentrations of total protein and protein fractions. Bloat scores were recorded daily during the last 6 days of the experiment through visual inspection, and the average tympanism score (BS) per goat was calculated using the method described by Min et al. [11]. Goats were scored based on the severity of tympanism as follows: a score of 0 for those with no visible signs of tympanism; 1 for goats with mild tympanism on the left side of the abdomen; 2 for those with pronounced tympanism on the left side, with rumen distension extending upward toward the back; and 3 for goats with severe tympanism visible from the right side, causing a pronounced asymmetry in appearance when walking. The rumen fluids of the 5 goats with the highest tympanism scores (BS = 3) were selected for further analysis to investigate the effects of CT addition on foam characteristics. The rumen fluids were randomly assigned to 4 treatment groups: control group C (no CT added), group T1 (1% CT added, w/v), group T2 (2% CT added, w/v), and group T3 (3% CT added, w/v), with 5 replicates per treatment (one replicate per goat’s rumen fluid). The appropriate doses of CT were weighed and added to 30 mL of rumen fluid, which was then thoroughly mixed and centrifuged at 10,000 rpm for 10 min. The supernatant was used for the determination of foam characteristics, protein, and protein fraction concentrations.
Indicators measurement. Foam production and retention of rumen fluid were measured by a modified version of the Roche and Rudin methods [12]. Prior to assaying, rumen fluid samples were treated in a 39 °C water bath for 30 min. The specific assay steps involved introducing 30 mL of rumen fluid into a 100 mL closed dispensing funnel tube and slowly bubbling CO2 gas into it to produce foam. This was done under consistent aeration pressure and time (1 Pa for 60 s). After inflation, the volume of foam formed at 30 s, 1 min, and 5 min post-flow stop was recorded, and the average of these three measurements represented the foaming production (in ml). Additionally, the time taken for the foam to completely disappear was noted to calculate foaming retention (in minutes). Both measurements were repeated three times per sample and averaged. The total protein concentration in rumen fluid was determined using the method of Rongkun Cao [13] using an enzyme marker (SpectraMax-190, Molecular Devices, Cal. USA). Protein fractions were analyzed by SDS-PAGE electrophoresis (DYY-6C, Beijing Liuyi Instrument Factory, Beijing, China) following the previously described method [14]. Quantification of protein fractions was performed using ImageJ 1.5.4 software, with each band representing a protein group.

2.2. Trial 2: The Study of the Effects of Adding Different Doses of CT into HCDs on Rumen Tympanism, Health, Fermentation, and the Structural Composition of Rumen Microorganisms

Experimental Animals, Design, and Diet. Eighteen adult healthy black goats weighing 24 kg ± 2.84 kg were selected and randomly assigned to three treatment groups (six replicates per group). The dietary treatments consisted of a basal diet supplemented with 0% (CON), 1% (T1), and 2% (T2) CT. The ingredients and chemical composition of the diets are presented in Table 2. Each goat was individually housed in a metabolic cage with access to drinking water. The trial lasted for 30 days, comprising an initial feeding trial period of 22 days, followed by 7 days of digestion testing. Centralized sampling was conducted on day 30. During the digestion test, the goats were scored daily by visually inspecting for tympanism, as in Trial 1.
Sample Collection. During the metabolic trial, adequate feed samples were collected daily, crushed through a 1 mm sieve, encapsulated in sealed bags, and stored at −20 °C for subsequent determination of dietary nutrient content. All feces, antisepticised with 10% formaldehyde (w/w, based on 3% of feces) from each goat during the trial, was gathered and stored at −20 °C for later analysis.
On the 30th day of the experiment, blood was collected from each goat before the morning feeding. Three tubes of blood samples were drawn from the jugular vein using 5 mL vacuum blood collection tubes. Two tubes were centrifuged at 3000 rpm for 10 min at 4 °C to obtain serum, which was then stored in a refrigerator at −20 °C for future use. The remaining tube, containing EDTA, was used for immediate routine blood measurements.
Two hours after morning feeding on the 30th day of the trial, rumen contents were collected. Ten milliliters of rumen contents were placed in a sterile tube, labeled, and stored in axenic self-sealing bags. These samples were then immersed in liquid nitrogen for rapid freezing and stored in a −80 °C refrigerator for microbiological determinations. Additionally, 120 mL of rumen contents were collected from each goat, filtered through four layers of gauze, and the pH was measured immediately using an acidity meter (PHBJ-260, Shanghai Precision Instrument Co., Ltd., China). These samples were then separated, labeled, and stored at −20 °C for the determination of rumen fermentation parameters and foaming characteristics.
Chemical analyses and calculations. All feed and fecal samples were analyzed according to the protocols outlined in the AOAC [15]. The dry matter (DM) and crude ash used methods No. 930.15 and 942.05, respectively. The organic matter (OM) content of the feed and feces was calculated by DM subtracting crude ash content. The crude protein (CP) was analyzed using the Kjeldahl method No. 984.13. The ether extract (EE) used method 920.39B via Soxhlet extraction. Neutral Detergent Fiber (NDF) and Acid Detergent Fiber (ADF) were determined using the methodology described by Van Soest et al. [16]. The apparent digestibility of nutrients was calculated using the following formula:
A p p a r e n t   d i g e s t i b i l i t y   o f   n u t r i e n t   % = i n g e s t e d   n u t r i e n t e x c r e t e d   n u t r i e n t   i n   f e c e s i n g e s t e d   n u t r i e n t × 100
The concentration of microbial proteins (MCP) was determined using the BCA kit from Biyuntian Biotechnology Co., Ltd. (Jiangsu, China). The concentrations of VFAs (acetic acid, propionic acid, and butyric acid) were measured via gas chromatography using a Varian CP-3800 instrument (USA). The NH3-N level was assessed following the method outlined by Broderick and Kang [17]. Immunoglobulins (IgM, IgG, and IgA) and cytokines (IL-1β, IL-6, IL-10, and TNF-α) as well as Malondialdehyde (MDA), Total Antioxidant Capacity (T-AOC), Glutathione Peroxidase (GSH-PX), and Superoxide Dismutase (SOD) were all quantified using kits from ZhongshengBeikong Biotechnology Co., Ltd. (Beijing, China). Furthermore, biochemical markers, including Alanine aminotransferase (ALT), aspartate aminotransferase (AST), total protein (TP), albumin (ALB), globulin (GLO), creatinine (CREA), urea nitrogen (BUN), uric acid (UA), glucose (GLU), triglycerides (TG), high-density lipoprotein (HDL), and low-density lipoprotein (LDL), and hematological indices such as white blood cell count (WBC), red blood cell count (RBC), hemoglobin concentration (HGB), neutrophil percentage (NEUT), mean hemoglobin content (MCH), mean corpuscular volume (MCV), and hematocrit (HCT) were measured by a fully automated biochemical analyzer, the Bechman AU5800 (USA).
Determination of rumen microorganisms. Bacterial 16S rRNA gene sequencing was employed to analyze the rumen microbiota, focusing on α-diversity, β-diversity, and the relative abundance of phyla and genera, per Mao et al.’s method [18].

2.3. Statistics and Analysis

All data were initially pre-collated using Excel 2016, and gray scale values of rumen fluid protein fractions were calculated with ImageJ software. Subsequently, a correlation analysis was conducted using the Pearson method in SPSS 23.0. An ANOVA (one-way) was performed to assess differences between treatments according to the following model:
Y i j k = μ + T i + e i j k
where Y i j k is the dependent variable, μ is the overall mean, T i is the fixed treatment effect, and e i j k is random error. This was followed by multiple comparisons using the LSD method. Statistical results were presented as Mean ± SD, with statistical significance set at p < 0.05. GraphPad Prism 7.0 was utilized to illustrate the comparison of differences. Furthermore, the relative abundance of microorganisms was analyzed for between-group differences using a non-parametric test, with significance levels set at p < 0.05 and p < 0.01 for moderate and high significance, respectively.

3. Results

3.1. Trial 1

3.1.1. The Concentrations and Foaming Characteristics of Rumen Fluid Protein

The descriptive statistics for total protein concentration and foaming characteristics in goat rumen fluid are presented in Table 3. The mean values for total protein concentration, foam production, and foam retention were 2.56 ± 0.26 g/L, 46.07 ± 8.03 mL, and 12.11 ± 2.77 min, respectively. Using SDS-PAGE electrophoresis, four major protein fractions were isolated from the rumen fluid, with molecular weights of 105–140 kDa (P1), 66–105 kDa (P2), 38–52 kDa (P3), and 13–20 kDa (P4), respectively. The gray values for these four protein fractions across 15 rumen fluid samples are listed in Table 4, exhibiting a normal distribution with a maximum value of 443,605 and a minimum of 10,523, indicating considerable individual variations.

3.1.2. Analysis of the Correlation Between the Concentration of Rumen Fluid Protein Fractions and Foaming Characteristics

The correlation analysis results between protein fractions and foaming characteristics in goat rumen fluid are presented in Table 5. Notably, the correlations between three of the protein groups (P1, P2, and P4) and the foaming properties of rumen fluid were found to be non-significant (p > 0.05). In contrast, P3 demonstrated a significant positive correlation with both foam production and retention (p < 0.05). Furthermore, the total protein concentration exhibited a highly significant positive correlation with both foam production and retention (p < 0.01).

3.1.3. Total Protein and P3 Concentrations as Well as Foaming Characteristics After Addition of Different Doses of CT to Rumen Fluid

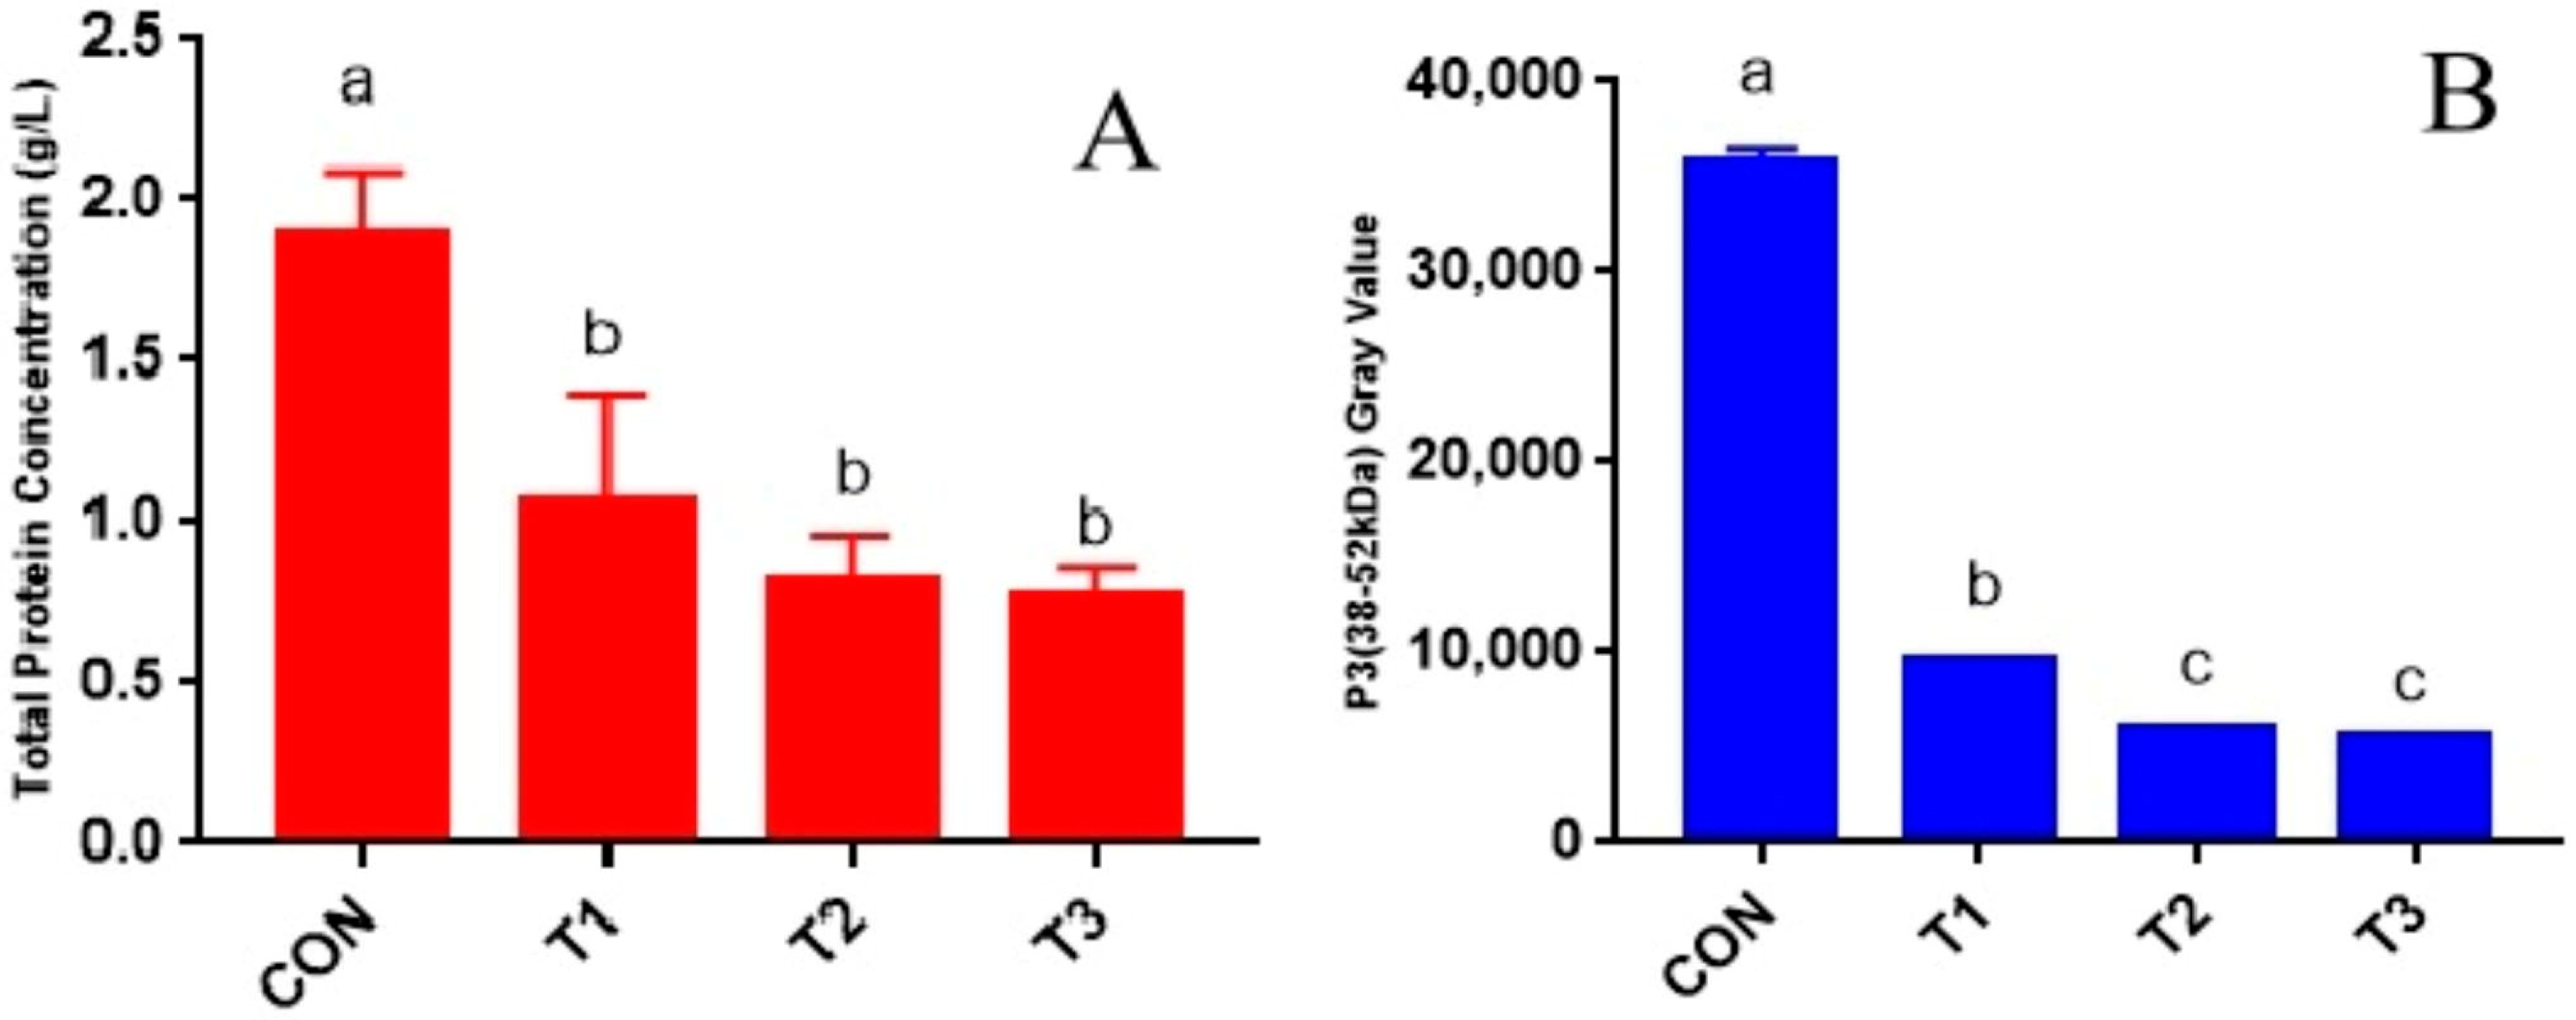
As illustrated in Figure 1, the gray value of P3 was significantly higher in the CON group compared to the group with added CT (p < 0.05). Additionally, the 1% CT group exhibited a significantly higher gray value than both the 2% CT and 3% CT groups (p < 0.05), while no significant difference was observed between the 2% CT and 3% CT groups (p > 0.05). The total protein concentration of rumen fluid in the CON group was markedly greater than that in the CT-added group (p < 0.05). Furthermore, treatment comparisons revealed that the total protein concentration in the 1% CT group surpassed that of the 3% CT group (p < 0.05) and was also higher than that of the 2% CT group. However, the differences were not statistically significant (p > 0.05).
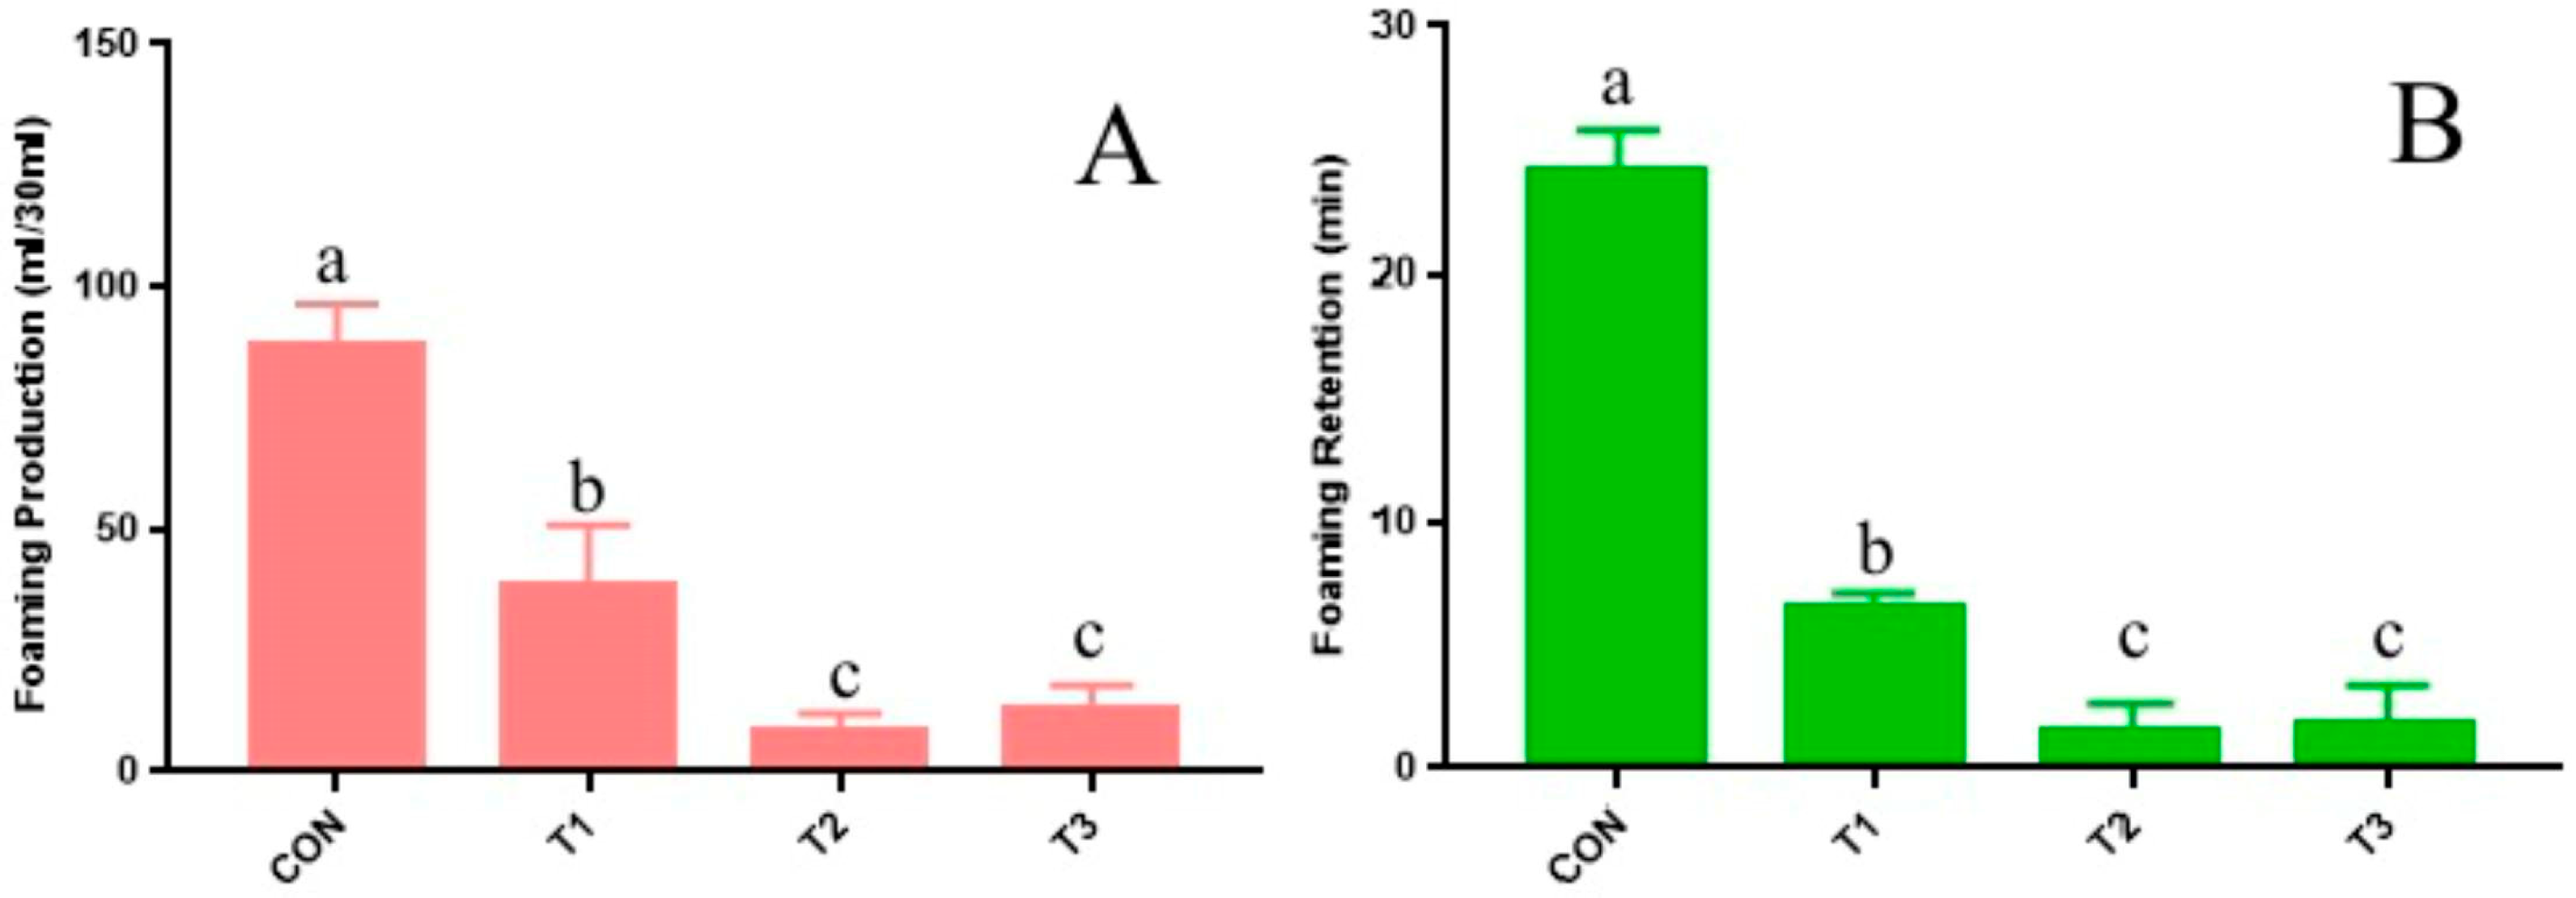
The results regarding foaming characteristics of rumen fluid across each treatment are presented in Figure 2. When compared to the CON group, all foaming characteristics in the CT-added group were significantly reduced (p < 0.01). Moreover, when contrasted with data from the added 1% CT group, both foaming characteristics for groups 2% CT and 3% CT showed substantial reductions as well (p < 0.05). Notably, at a dosage of 3% CT addition, there was no further reduction observed compared to that recorded for 2% CT addition (p > 0.05), indicating a dose-dependent effect where saturation may occur at an additive level of 2%.

3.1.4. Correlation Analysis Between P3 Concentration and Foaming Characteristics After Addition of Different Doses of CT to Rumen Fluid

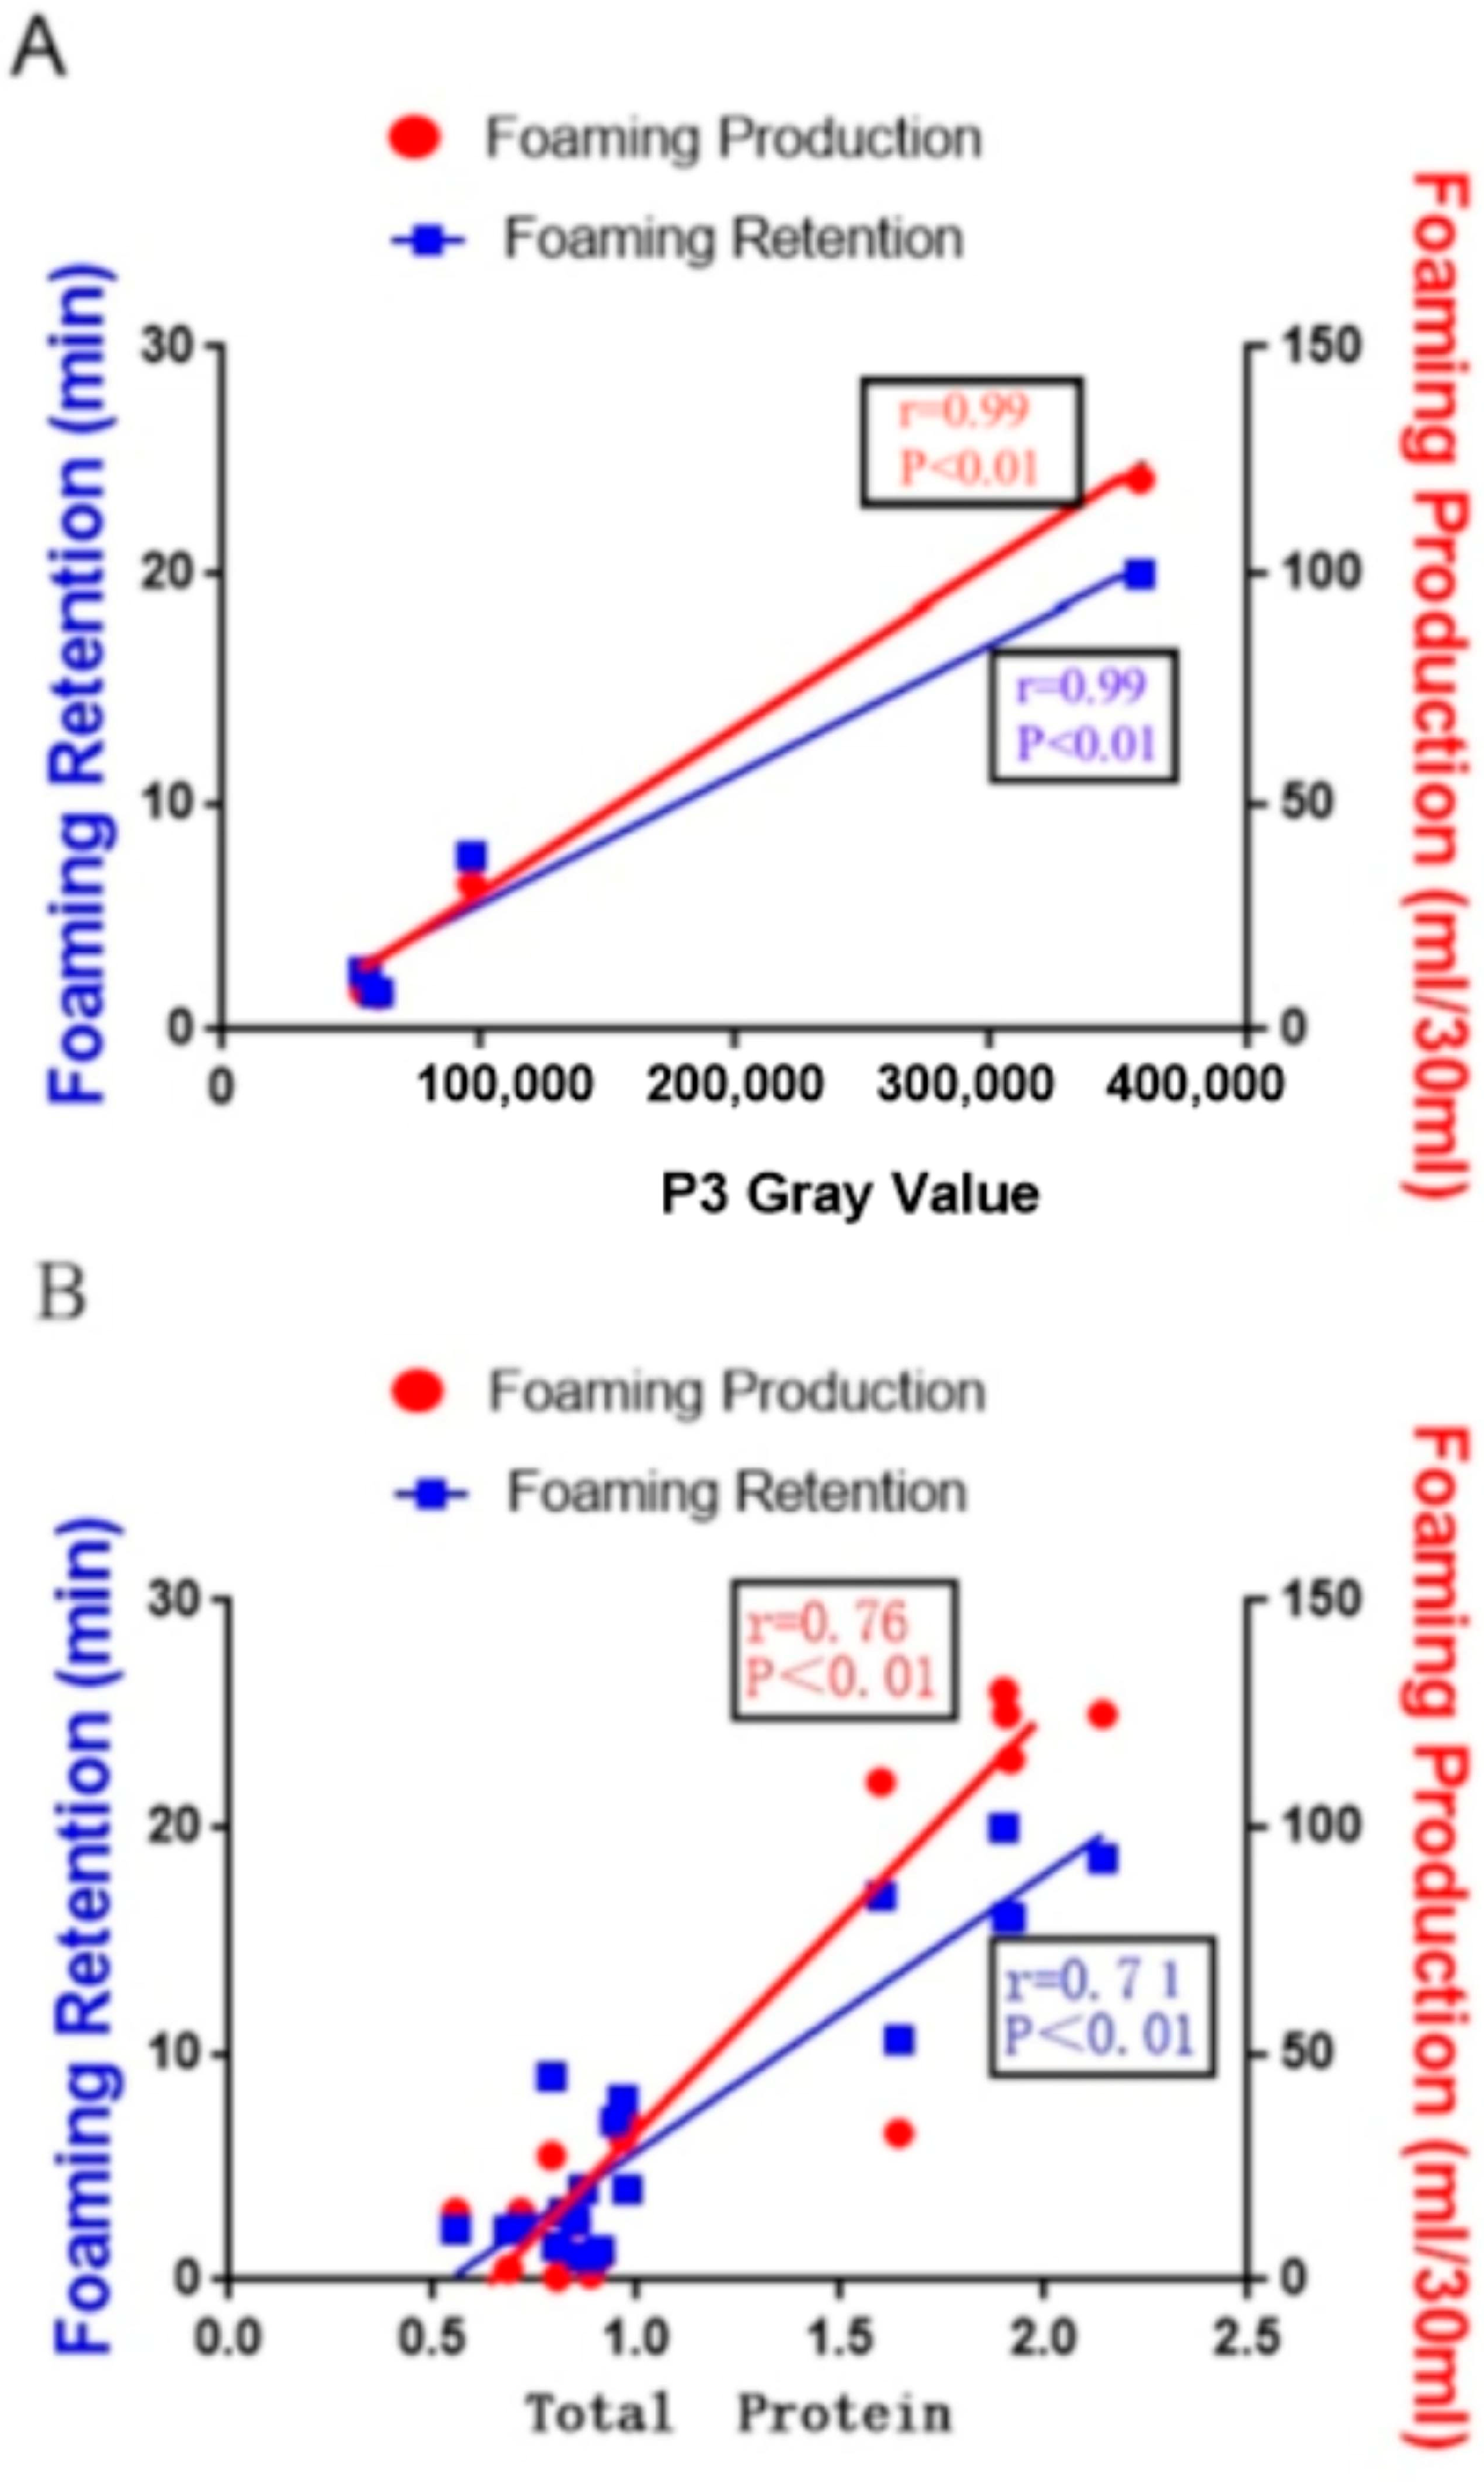
Through SDS-PAGE electrophoresis analysis conducted on rumen fluid samples from four treatments and subsequent evaluation of P3’s gray value, it became evident that adding CT resulted in a highly significant positive correlation between P3 values and foaming characteristics within rumen fluid samples (p < 0.01). The total protein concentration demonstrated a strong positive correlation with foaming characteristics as well (p < 0.05) (Figure 3).

3.2. Trial 2

3.2.1. Tympanism Scoring During the Digestive Trial in Goats

As shown in Table 6, during the digestion trial, the tympanism scores of the 2% CT group were significantly lower than those of the other groups, with the average score being significantly lower than that of the CON group (p < 0.05).

3.2.2. Digestibility of Nutrients

As can be seen from Table 7, there was no significant difference (p > 0.05) in the apparent digestibility of nutrients DM, OM, CP, NDF, ADF, and EE among treatment groups, and the addition of CT to the diets did not have a significant effect on nutrient digestibility.

3.2.3. Foaming Characteristics of Rumen Fluid

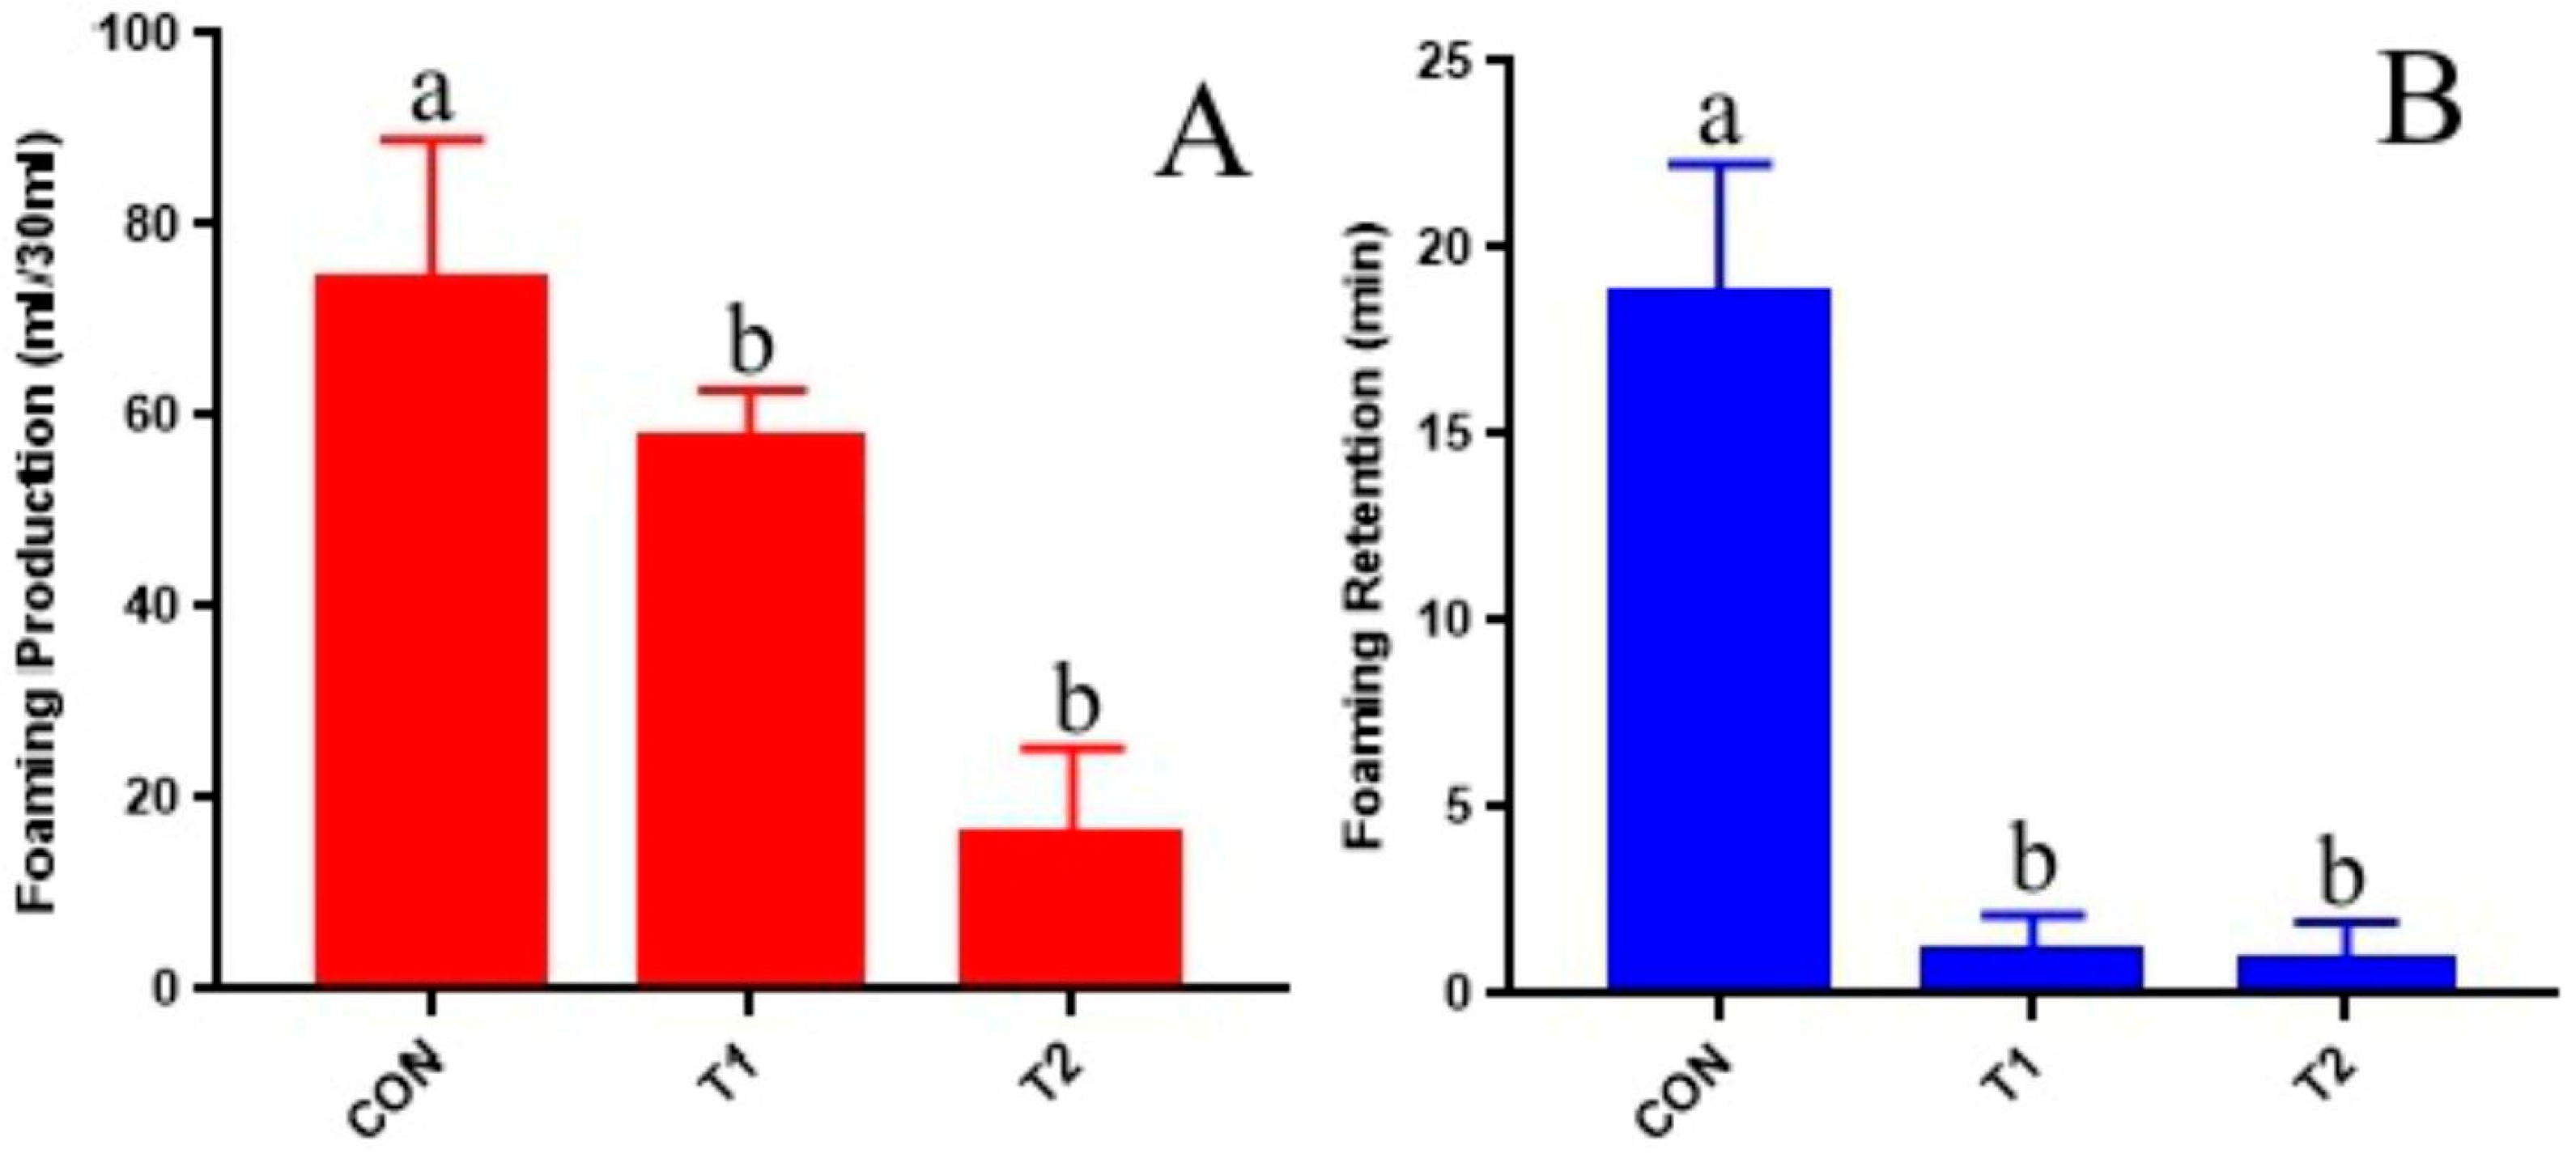
The results regarding foaming characteristics of rumen fluid across each treatment group are presented in Figure 4. The foam production from rumen fluid in the 2% CT group was markedly reduced compared to both the CON and T1 groups (p < 0.05), while no significant difference was observed between the T1 and CON groups (p > 0.05). When compared with the CON group, foam retention across all CT-added groups showed a highly significant reduction (p < 0.01); however, differences among CT-added groups themselves did not reach significance (p > 0.05).

3.2.4. Rumen Fermentation Parameters

From Table 8, it can be seen that the pH values for both the 1% CT and 2% CT groups were significantly higher compared to those of the CON group (p < 0.05). Furthermore, concentrations of acetic acid, propionic acid, butyric acid, and valeric acid in both the 1% CT and 2% CT groups were found to be significantly lower than those in the CON group (p < 0.01). Notably, isovaleric acid concentration was lowest in the CON group; this value was significantly lower than that observed in the 2% CT group (p < 0.05), although no significant difference existed when comparing it with the 1% CT group (p > 0.05). The ratio of acetic acid to propionic acid was significantly higher in the 2% CT group as opposed to the 1% CT group (p < 0.05), while differences in NH3-N levels, as well as MCP and isobutyric acid concentrations among treatment groups, remained non-significant (p > 0.05).

3.2.5. Blood Indicators

The concentration of ALT in the 2% CT group was significantly lower than in the remaining two groups (p < 0.05) (Table 9). Compared with the CON group, the AST concentration in the 2% CT group was significantly lower (p < 0.05), but the difference with the 1% CT group was not significant (p > 0.05). GLU concentration in the 1% CT group was significantly lower than in the remaining two groups (p < 0.05). TG concentration in the 2% CT group was significantly higher than in the remaining two groups (p < 0.05). Other biochemical indicators did not differ significantly among the three groups (p > 0.05).
The concentrations of IL-1β and IL-6 in the CON group were significantly higher than the remaining two groups (p < 0.05) (Table 10). The concentration of TNF-α in the 2% CT group was significantly lower than that in the CON and 1% CT groups (p < 0.05). The concentration of GSH-PX in the 2% CT group was significantly higher than that in the remaining two groups (p < 0.05). Other immune and antioxidant indices did not differ significantly among the three groups (p > 0.05).
Erythrocyte-related indices MCV, RBC, and HCT in the 1% CT group were the highest among the three groups (p < 0.05) (Table 11), but MCH was the lowest among the three groups (p < 0.05); WBC values in group 2% CT were significantly higher than those in the remaining two groups (p < 0.05). Other blood routine indices did not differ significantly among the three groups (p > 0.05).

3.2.6. Analysis of Rumen Microbial Composition and Intergroup Differences

The 16S rRNA sequencing of 18 rumen fluid samples produced a total of 2,440,767 original sequences, 2,390,415 sequences after splicing, 2,345,557 valid sequences after quality control filtering, and finally, 1,740,987 sequences after filtering chimeras for subsequent analysis. The basic percentages of Q20 and Q30 for each sample were above 97.41% and 92.69%, respectively. The average GC content was 53.43% (Table S1).
A total of 32 microbial phyla and 447 bacterial genera were detected in the rumen via this sequencing. Based on the average relative abundance of bacterial phylum > 0.1% in at least one group as the major bacterial phylum and the average relative abundance of bacterial genus > 1% in at least one group as the major bacterial genus, a total of 10 bacterial phyla and 10 bacterial genera were screened, as shown in Table 12. Among rumen microorganisms, Bacteroidetes had the highest relative abundance; Proteobacteria ranked second; the third was Firmicutes. This was followed by Euryarchaeota, Spirochaetota, and others. At the genus level, the highest relative abundance of Pseudomonas and Prevotella was found in the rumen, which also included Methanobacter and Ralstonia.

4. Discussion

Effects of protein concentration in rumen fluid on rumen tympanism. Under high-concentrate feeding conditions, goats’ rumens produce substantial amounts of stable foam [19]. Trial 1 demonstrated a significant positive correlation between the total protein concentration in rumen fluid and its foaming properties (Table 5). As the protein content in rumen fluid increased, foam production per unit volume also rose, but foam stability may not always improve. Protein acts as a surfactant, significantly influencing the liquid’s foaming properties when dissolved [20]. Rumen microorganisms ferment feed, producing gas that can become trapped in rumen contents, forming bubbles that may accumulate into foam [6]. During the ascent, hydrolyzed protein peptides unfold at the liquid surface, facilitating intermolecular forces that create a viscoelastic film adhering to bubble edges. The hydrophobic side stabilizes the gas, while the hydrophilic side stabilizes the aqueous phase [21,22], reducing surface tension and enhancing foam stability by preventing bubble collapse and rupture [23].
Furthermore, protein hydrolysis may induce peptide chain cross-linking and increase viscosity, further contributing to foam stabilization. This phenomenon elucidates the observed positive correlation between protein concentration in rumen fluid and foam stability identified in this study. To our knowledge, this is the first report on the impact of rumen fluid’s protein concentration on its foaming performance. Research on beer foam has shown that barley hordein, poorly soluble in water, forms soluble proteins after microbial hydrolysis, significantly improving beer foam’s performance [24]. However, not all proteins enhance liquid foaming [25]. This study found that only a protein component with a molecular weight of 38–52 kDa positively correlates with rumen fluid’s foaming power and bubble retention (Table 5). Previous beer foam studies identified a 40 kDa protein, Protein Z, as a key factor affecting beer foam volume and stability, termed “beer foam protein” [26,27]. It binds with sugar groups during wort boiling, significantly enhancing beer foam stability [28,29]. Since the rumen of ruminants lacks a secretory function, it is postulated that the proteins forming foam in the rumen primarily originate from dietary and microbial sources. Most proteins in ruminant feed ingredients, including gluten and prolamins in corn, wheat, and rice, as well as globulins in soybeans and cottonseeds, are largely insoluble in water and possess ordered structures [30]. Consequently, proteins in natural grain feeds exhibit poor foaming properties. However, microbial fermentation in the rumen alters feed proteins, increasing their hydrophobicity and potentially enhancing foaming ability. Additionally, hydrolysis may increase peptide chain cross-linking and lamellar viscosity, thereby improving foam stability. Rumen microorganisms are capable of synthesizing substantial amounts of secretory proteins. If ruminal foam formation is associated with microbial secretory proteins and high-concentrate diets are the primary inducer of ruminal foam, it can be inferred that such diets may modify the structure and composition of rumen microorganisms, affecting the type or quantity of secretory proteins produced and ultimately inducing ruminal foam formation [31]. Therefore, the amino acid composition and spatial structure of the 38–52 kDa protein component in rumen fluid remain unclear, and its origin—whether from feed or de novo synthesis by rumen microorganisms—requires further investigation. On the other hand, studies [32] have demonstrated that polysaccharides in rumen fluid can bind to proteins via electrostatic interactions, forming protein–polysaccharide complexes. These complexes, stabilized by hydrophobic forces as well as electrostatic interactions, contribute to maintaining foam stability.
Effects of CT on rumen tympanism. The results of Trial 1 reveal that adding CT significantly diminishes the foaming power and bubble retention of rumen fluid (Figure 2). It is important to note that CT itself does not function as an anti-foaming agent; rather, the reduction in foaming performance can be attributed to its interaction with proteins, leading to the formation of insoluble substances that lower protein concentrations in rumen fluid (Figure 1). These in vitro findings suggest that CT may alleviate the risk of ruminal tympanism by binding to soluble proteins. Subsequent animal trials confirmed this hypothesis. Specifically, Trial 2 demonstrated that, compared to the CON group, goats in the 1% CT and 2% CT groups exhibited a significant reduction in the incidence and severity of ruminal tympanism (Table 6). Furthermore, the foaming power and bubble retention of rumen fluid in the 2% CT group were significantly decreased (Figure 4), indicating that an appropriate dosage of CT incorporated into a high-concentrate diet effectively prevents ruminal tympanism. The phenolic hydroxyl groups and aromatic ring structures present in CT exhibit a strong binding affinity for protein carbonyl groups [33], facilitating the formation of stable tannin–protein complexes through surface adsorption [34]. These complexes are insoluble and resistant to microbial degradation within the typical rumen pH range (5.0–7.0) [11,35], maintaining stability in the ruminal environment. Previous studies have shown that CT efficacy in ruminants is influenced by various factors, including dosage, source, animal species, microorganism, and basal diet composition [34,36]. In Trial 1, it was observed that 3% CT did not further decrease the foaming properties of rumen fluid. This may be due to the fact that proteins with a molecular weight of 38–52 kDa are crucial in determining these properties, and CT reduces them by binding to these proteins. However, at higher CT concentrations, the available proteins within this molecular weight range in the rumen fluid may already be fully saturated, thereby preventing any further reduction in foam characteristics from additional CT. The current study preliminarily explores the feasibility of adding CT to HCDs to prevent ruminal tympanism and finds that 2% CT effectively prevents ruminal tympanism in goats. Further research is needed to investigate the impact of other additives and nutrient levels on CT efficacy.
Effects of CT on rumen fermentation and nutrient digestibility in goats. The results of Trial 2 indicate that adding 1% CT and 2% CT to HCDs had no significant impact on the digestibility of nutrients such as DM, CP, NDF, and ADF in goat diets. This finding is consistent with previous research by Xiaofeng [37], where the addition of 3% poplar CT did not alter the digestibility of DM, NDF, and ADF in dairy cattle diets. However, contrasting studies have shown that the inclusion of argan tannins in Holstein cow diets significantly reduced the apparent digestibility of fiber [38]. This inconsistency may stem from the varying doses of CT used in different trials. High doses of CT in the diet can disrupt rumen fermentation, thereby affecting the digestibility of fiber and other nutrients. The CT utilized in this study originated from bayberry extract, suggesting that bayberry CT at concentrations of 1% and 2% has no effect on nutrient digestibility in goats.
The stability of the rumen environment can be visually evaluated by measuring the pH value of rumen fluid. A fermentation environment is deemed more stable when the pH ranges between 6.2 and 7.0 [39]. In our animal experiment, all groups exhibited a normal pH range for rumen fluid, yet the CON group displayed a significantly lower pH compared to both the 1% CT and 2% CT groups. Research conducted by Chengyun [40] has indicated that enhancing the diet of Yanbian yellow cattle with higher concentrations of hazelnut-leaf condensed tannins (CT) results in an increase in rumen pH, which aligns with our experimental results.
Volatile fatty acids (VFAs), crucial products stemming from ruminal fermentation, primarily consist of acetic, propionic, and butyric acids [41], serve as pivotal energy sources for the host organism. Post-feeding with HCDs, VFAs concentrations in the rumen progressively rise until peaking, fueled by accelerated fermentation processes. Of note, in the treatment groups that received CT supplementation during our animal trial, concentrations of acetic, propionic, and butyric acids were notably lower than those recorded in the CON group. This implies that CT supplementation may effectively mitigate VFA concentrations, aligning with previous findings [42,43] which observed a reduction in acetic and propionic acid concentrations within VFAs upon CT addition.
On the other hand, during foamy tympanism, the significant accumulation of foam in the rumen can impede the interaction between VFAs and the rumen wall. This results in reduced VFA absorption efficiency and subsequent accumulation within the rumen. The inclusion of CT acts to bind with proteins and curb foam formation in the rumen, thereby enhancing VFA absorption by minimizing obstacles. Consequently, this minimized the accumulation of VFAs in the rumen, resulting in a significant reduction in their concentration in rumen fluid, which effectively prevents ruminal acidosis. Additionally, the decrease in foam enhances the absorption surface area of VFAs on the rumen wall, potentially boosting their contribution to energy supply in goats. Additionally, this explains why pH values in CT-supplemented groups were markedly higher compared to the control group. In Trial 2, although the 1% CT group exhibited a significantly higher relative abundance of the rumen-dominant bacterial phylum Fibrobacterota compared to the other groups, its overall abundance remained relatively low, potentially having a minor impact on VFA production. Consequently, the more pronounced reduction in VFA concentration observed in the CT groups was more likely due to the dissipation of rumen foam.
Effects of CT on goat health. Interleukins play a crucial role in information transmission, as well as the activation and regulation of immune cells and inflammatory responses. IL-1β, IL-6, and TNF-α are categorized as pro-inflammatory factors that stimulate or amplify inflammatory responses. Conversely, IL-10 serves as an anti-inflammatory factor, mitigating or even halting such responses. In Trial 2, we observed an elevated concentration of IL-10 in the 2% CT group compared to the CON group, while levels of pro-inflammatory factors such as IL-1β, IL-6, and TNF-α were notably reduced relative to the CON group. These findings imply that the addition of 2% CT may enhance the immune status of goats. Furthermore, previous research has demonstrated that plant-derived CTs possess anti-inflammatory properties [44], supporting our experimental observations.
Blood routine analysis serves as a vital indicator for assessing animal health. White blood cells (WBCs), functioning as defense cells within the organism, reflect changes in immune status and directly signify immunity levels, particularly cellular immunity and overall immune health [45]. As evident from Table 10, WBC counts in all three groups remained within normal ranges [46]. Notably, however, the 2% CT group demonstrated significantly elevated WBC levels compared to the other two groups. This finding indicates that the addition of 2% CT may enhance goats’ immune status.
Effects of CT on dominant rumen flora in goats. In the present study, Bacteroidetes, Proteobacteria, and Firmicutes were identified as the dominant microflora present in goats’ rumens. Analysis of microbial relative abundance (Table 12) failed to uncover any significant differences among treatment groups, either at the phylum or genus levels, in terms of the composition of the dominant flora. Consequently, it can be inferred that supplementing with 1–2% CT does not alter the structural composition of the dominant flora within goats’ rumens.
Some studies [47] have shown that long-term consumption of high levels of condensed tannins may impair animals’ absorption of certain minerals, such as iron and zinc. However, the extent of these antinutritional effects varies greatly depending on the source and dose of the condensed tannins, as well as the animal species and their physiological state. This trial, conducted over a period of one month, aimed to investigate whether tannins can eliminate rumen foam induced by high-concentrate diets during intensive fattening periods. Current research indicates that supplementing with 2% bayberry condensed tannins does not adversely affect goats’ metabolic health. Nevertheless, the long-term impacts of condensed tannin supplementation on feed efficiency and animal growth remain to be fully explored.
5. Conclusions

This study’s findings reveal that feeding goats with HCDs leads to the formation of stable foam in the rumen, predisposing the goats to foamy rumen tympanism. The foaming properties of rumen fluid are positively correlated with the concentration of specific proteins or protein fractions within a molecular weight range of 38–52 kDa. Notably, the incorporation of 2% condensed tannins into HCDs significantly reduces the foaming capabilities of rumen fluid while enhancing both pH levels and the immune response in goats. Importantly, this supplementation does not show adverse effects on nutrient digestibility or animal health within the conditions tested, suggesting its potential as a preventive strategy against rumen tympanism.

Supplementary Materials

The following supporting information can be downloaded at https://www.mdpi.com/article/10.3390/fermentation11100581/s1, Table S1: Overview of sequencing results.

Author Contributions

Conceptualization, Y.W. and L.W.; methodology, Y.W.; software, Y.W.; validation, Y.W.; formal analysis, Y.W.; investigation, Y.W.; resources, L.W.; data curation, Y.W.; writing—original draft preparation, Y.W.; writing—review and editing, Y.W. and L.W.; visualization, Z.W., B.X., Q.P., R.H. and J.X.; supervision, Z.W., B.X., Q.P., R.H. and J.X.; project administration, Z.W., B.X., Q.P., R.H. and J.X.; funding acquisition, L.W. All authors have read and agreed to the published version of the manuscript.

Funding

This work was financial supported by the Innovation and Demonstration of Industry and Education Integration in Feed Industrial Chain Transformation and Upgradation, Sichuan Province, China.

Institutional Review Board Statement

The research protocol employed in this study received approval from the Animal Policy and Welfare Committee of the Sichuan Provincial Agricultural Research Organization, China, and adhered to the guidelines set forth by the Animal Care and Ethical Committee of Sichuan Agricultural University (Ethics Approval Code: 20220415).

Informed Consent Statement

Not applicable.

Data Availability Statement

Original data are available from the corresponding author upon reasonable request.

Conflicts of Interest

The authors declare no conflicts of interest.

Abbreviations

The following abbreviations are used in this manuscript:
CTcondensed tannin
HCDhigh-concentrate diet
P3protein component 3
BStympanism score
SDS-PAGEsodium dodecyl sulfate polyacrylamide gel electropheresis
EDTAEthylene Diamine Tetraacetic Acid
VFAsvolatile fatty acids

References

  1. Domingues, J.L.; Nuñez, A.J.C.; Gomes, R.C.; Valinote, A.C.; Silva, S.L.; Pereira, A.S.C.; Leme, P.; Filho, J.N. Effect of high oil corn in the diets of Nellore steers on growth performance, carcass characteristics, meat quality, and longissimus muscle fatty acid profile. Livest. Sci. 2015, 174, 31–38. [Google Scholar] [CrossRef]
  2. Gekara, O.J.; Prigge, E.C.; Bryan, W.B.; Schettini, M.; Nestor, E.L.; Townsend, E.C. Influence of pasture sward height and concentrate supplementation on intake, digestibility, and grazing time of lactating beef cows. J. Anim. Sci. 2001, 79, 745–752. [Google Scholar] [CrossRef]
  3. Hang, T.T.T.; Kha, P.T.T.; Thanh, L.P. High concentrate diet improves intake, milk yield without affecting milk composition in early lactating dairy goats. In Proceedings of the Third International Conference on Sustainable Agriculture and Environment, Ho Chi Minh City, Vietnam, 18 November 2020. [Google Scholar]
  4. Khafipour, E.; Li, S.; Plaizier, J.C.; Krause, D.O. Rumen Microbiome Composition Determined Using Two Nutritional Models of Subacute Ruminal Acidosis. Appl. Environ. Microbiol. 2009, 75, 7115–7124. [Google Scholar] [CrossRef] [PubMed]
  5. Loneragan, G.H.; Dargatz, D.A.; Morley, P.S.; Smith, M.A. Trends in mortality ratios among cattle in US feedlots. J. Am. Vet. Med. Assoc. 2001, 219, 1122–1127. [Google Scholar] [CrossRef]
  6. Majak, W.; McAllister, T.A.; McCartney, D.; Stanford, K.; Cheng, K.J. Bloat in Cattle; Alberta Agriculture and Rural Development: Edmonton, AB, Canada, 2003. [Google Scholar]
  7. Tan, Z.; Liu, J.; Wang, L. Factors affecting the rumen fluid foaming performance in goat fed high concentrate diet. Front. Vet. Sci. 2024, 11, 1299404. [Google Scholar] [CrossRef] [PubMed]
  8. Jones, W.T.; Mangan, J.L. Complexes of the condensed tannins of sainfoin (Onobrychis viciifolia Scop.) with fraction 1 leaf protein and with submaxillary mucoprotein, and their reversal by polyethylene glycol and pH. J. Sci. Food Agric. 1977, 28, 126–136. [Google Scholar] [CrossRef]
  9. Sayd, T.; Chambon, C.; Popova, M.; Morgavi, D.P.; Torrent, A.; Blinet, S.; Theron, L.; Niderkorn, V. Impact of tannin supplementation on proteolysis during post-ruminal digestion in wethers using a dynamic in vitro system: A plant (Medicago sativa) digestomic approach. J. Agric. Food Chem. 2022, 70, 2221–2230. [Google Scholar] [CrossRef]
  10. Provenza, F.D. Postingestive feedback as an elementary determinant of food preference and intake in ruminants. Rangel. Ecol. Manag./J. Range Manag. Arch. 1995, 48, 2–17. [Google Scholar] [CrossRef]
  11. Min, B.R.; Pinchak, W.E.; Fulford, J.D.; Puchala, R. Effect of feed additives on in vitro and in vivo rumen characteristics and frothy bloat dynamics in steers grazing wheat pasture. Anim. Feed. Sci. Technol. 2005, 123, 615–629. [Google Scholar] [CrossRef]
  12. Miles, R.; Zhu, Z. Measurement of surfactant-foam power by a modified Roche method. Sci. Househ. Chem. 1981, 4, 61–65. [Google Scholar]
  13. Cao, R. Influence of Beer Excipients on Beer Foam. Master’s Thesis, Jiangnan University, Wuxi, China, 2018. (In Chinese). [Google Scholar]
  14. Du, F. Isolation and Identification of Beer Foam Proteins and In Silico Application in Beer Production. Master’s Thesis, Qilu University of Technology, Jinan, China, 2013. (In Chinese). [Google Scholar]
  15. AOAC. Official Methods of Analysis of the Association of Official’s Analytical Chemists; Association of Official Analytical Chemists: Arlington, VA, USA, 2003. [Google Scholar]
  16. Van Soest, P.V.; Robertson, J.B.; Lewis, B.A. Methods for dietary fiber, neutral detergent fiber, and nonstarch polysaccharides in relation to animal nutrition. J. Dairy Sci. 1991, 74, 3583–3597. [Google Scholar] [CrossRef] [PubMed]
  17. Broderick, G.A.; Kang, J.H. Automated simultaneous determination of ammonia and total amino acids in ruminal fluid and in vitro media. J. Dairy Sci. 1980, 63, 64–75. [Google Scholar] [CrossRef] [PubMed]
  18. Mao, J.; Wang, Y.; Wang, W.; Duan, T.; Yin, N.; Guo, T.; Guo, H.; Liu, N.; An, X.; Qi, J. Effects of Taraxacum mongolicum Hand.-Mazz. (dandelion) on growth performance, expression of genes coding for tight junction protein and mucin, microbiota composition and short chain fatty acids in ileum of broiler chickens. BMC Vet. Res. 2022, 18, 180. [Google Scholar] [CrossRef]
  19. Wang, Y.; Majak, W.; McAllister, T.A. Frothy bloat in ruminants: Cause, occurrence, and mitigation strategies. Anim. Feed Sci. Technol. 2012, 172, 103–114. [Google Scholar] [CrossRef]
  20. Stanislava, G. Barley grain non-specific lipid-transfer proteins (ns-LTPs) in beer production and quality. J. Inst. Brew. 2007, 113, 310–324. [Google Scholar] [CrossRef]
  21. Euston, S.R.; Hughes, P.; Naser, M.A.; Westacott, R.E. Molecular dynamics simulation of the cooperative adsorption of barley lipid transfer protein and cis-isocohumulone at the Vacuum−water interface. Biomacromolecules 2008, 9, 3024–3032. [Google Scholar] [CrossRef]
  22. Morales, R.; Martínez, K.D.; Pizones Ruiz-Henestrosa, V.M.; Pilosof, A.M.R. Modification of foaming properties of soy protein isolate by high ultrasound intensity: Particle size effect. Ultrason. Sonochemistry 2015, 26, 48–55. [Google Scholar] [CrossRef]
  23. Tada, N.; Inui, T.; Kageyama, N.; Takaoka, S.; Kawasaki, Y. The influence of malt acrospires on beer taste and foam quality. Tech. Q.-Master Brew. Assoc. Am. 2004, 3, 305–309. [Google Scholar]
  24. Sheehan, M.C.; Skerritt, J.H. Identification and characterisation of beer polypeptides derived from barley hordeins. J. Inst. Brew. 1997, 103, 297–306. [Google Scholar] [CrossRef]
  25. Iimure, T.; Sato, K. Beer proteomics analysis for beer quality control and malting barley breeding. Food Res. Int. 2013, 54, 1013–1020. [Google Scholar] [CrossRef]
  26. Hughes, P.S.; Simpson, W.J. Interaction between hop bitter acids and metal cations assessed by ultra-violet spectrophotometry. Belg. J. Brew. Biotechnol. 1995, 2, 35–39. [Google Scholar]
  27. Maeda, K.; Yokoi, S.; Kamada, K.; Kamimura, M. Foam Stability and Physicochemical Properties of Beer1. J. Am. Soc. Brew. Chem. 1991, 49, 14–18. [Google Scholar]
  28. Curioni, A.; Pressi, G.; Furegon, L.; Peruffo, A.D.B. Major Proteins of Beer and their Precursors in Barley: Electrophoretic and Immunological Studies. J. Agric. Food Chem. 1995, 43, 2620–2626. [Google Scholar] [CrossRef]
  29. Hejgaard, J.; Kaersgaard, P. Purification and properties of the major antigenic beer protein of barley origin. J. Inst. Brew. 1983, 6, 402–410. [Google Scholar] [CrossRef]
  30. Cheng, K.; Hironaka, R.; Jones, G.A.; Nicas, T.; Costerton, J.W. Frothy feedlot bloat in cattle: Production of extracellular polysaccharides and development of viscosity in cultures of Streptococcus bovis. Can. J. Microbiol. 1976, 22, 450–459. [Google Scholar] [CrossRef]
  31. Xu, F.; Wang, L. Advances in the Mechanism of Rumen Bloat Induced by High-Concentrate Diets. J. Anim. Nutr. 2021, 33, 118–123. (In Chinese) [Google Scholar]
  32. Tan, Z.; Wang, L.; Wang, Z.; Xue, B.; Hu, R.; Peng, Q.; Xiao, J. Supplementing NSP enzymes in high concentrate diets can prevent foamy rumen bloat in goats. Sci. Rep. 2025, 15, 5127. [Google Scholar] [CrossRef] [PubMed]
  33. Zucker, W.V. Tannins: Does Structure Determine Function? An Ecological Perspective. Am. Nat. 1983, 121, 335–365. [Google Scholar] [CrossRef]
  34. Naumann, H.; Tedeschi, L.; Zeller, W.; Huntley, N. The role of condensed tannins in ruminant animal production: Advances, limitations and future directions. Rev. Bras. De Zootec. 2017, 46, 929–949. [Google Scholar] [CrossRef]
  35. Kumar, R.; Singh, M. Tannins: Their adverse role in ruminat nutrition. J. Agric. Food Chem. 1984, 32, 447–453. [Google Scholar] [CrossRef]
  36. Fabbrini, M.; D’Amico, F.; Barone, M.; Conti, G.; Mengoli, M.; Brigidi, P.; Turroni, S. Polyphenol and Tannin Nutraceuticals and Their Metabolites: How the Human Gut Microbiota Influences Their Properties. Biomolecules 2022, 7, 875. [Google Scholar] [CrossRef] [PubMed]
  37. Xu, X.; Zhang, L. Research Progress on the Nutritional Promoting Effects of Tannins on Ruminants. Anim. Nutr. 2011, 23, 2084–2089. (In Chinese) [Google Scholar]
  38. Henke, A.; Westreicher-Kristen, E.; Molkentin, J.; Dickhoefer, U.; Knappstein, K.; Hasler, M.; Susenbeth, A. Effect of dietary quebracho tannin extract on milk fatty acid composition in cows. J. Dairy Sci. 2017, 100, 6229–6238. [Google Scholar] [CrossRef]
  39. Wang, Y.Y.; Zhao, Z.Y.; Wang, X.T.; Chen, Y.L.; Yang, Y.X. Effects of dietary nutritional levels on the numbers of rumen-related microbial flora, pH, and VFA content in Tan sheep aged 150–180 days. Acta Vet. Zootech. Sin. 2016, 47, 2060–2070. (In Chinese) [Google Scholar]
  40. Li, C.; Yuan, Y.; Park, G.-I. Effects of condensed tannins on ruminal volatile fatty acids and microbial growth. Feed. Res. 2010, 5–7. (In Chinese) [Google Scholar] [CrossRef]
  41. Li, H.; Yang, Z.; Yang, W.; Jiang, S.; Zhang, G.; Zhang, Q.; Zhang, C. The Effects of Different Diet Types on Rumen pH, Ammonia Nitrogen, and Volatile Fatty Acid Concentrations in Dorper Sheep. Chin. J. Anim. Husb. 2017, 53, 67–72. (In Chinese) [Google Scholar]
  42. Singh, B.; Bhat, T.K.; Singh, B. Potential therapeutic applications of some antinutritional plant secondary metabolites. J. Agric. Food Chem. 2003, 19, 5579–5597. [Google Scholar] [CrossRef]
  43. Ding, X. The Effects of Tannic Acid on Rumen Fermentation Characteristics and Methane Production. Master’s Thesis, Gansu Agricultural University, Lanzhou, China, 2006. (In Chinese). [Google Scholar]
  44. Park, M.; Cho, H.; Jung, H.; Lee, H.; Hwang, K.T. Antioxidant and anti-inflammatory activities of tannin fraction of the extract from black raspberry seeds compared to grape seeds. J. Food Biochem. 2013, 38, 93–97. [Google Scholar] [CrossRef]
  45. Liu, G. Modern Medical Immunology; Jiangsu Science and Technology Publishing House: Nanjing, China, 2000. (In Chinese) [Google Scholar]
  46. Wei, J.; Li, P. Experimental Manual for Veterinary Medicine; China Agricultural University Press: Beijing, China, 2010. (In Chinese) [Google Scholar]
  47. Delimont, N.M.; Fiorentino, N.M.; Kimmel, K.A.; Haub, M.D.; Rosenkranz, S.K.; Lindshield, B.L. Long-term dose-response condensed tannin supplementation does not affect iron status or bioavailability. Curr. Dev. Nutr. 2017, 1, e001081. [Google Scholar] [CrossRef]
Figure 1. The effect of adding condensed tannins to the rumen fluid on the concentration of total protein (A) and the gray value of P3 (38–52 kDa) (B). CON = adding no CT to rumen fluid, T1 = adding 1% (w/v) condensed tannin to rumen fluid, T2 = adding 2% (w/v) condensed tannin to rumen fluid, and T3 = adding 3% (w/v) condensed tannin to rumen fluid. a,b—means with different superscripts within the same column differ significantly (p < 0.05).
Fermentation 11 00581 g001
Figure 2. The effect of adding condensed tannins to the rumen fluid on foaming production (A) and foaming retention (B). CON = adding no CT to rumen fluid, T1 = adding 1% (w/v) condensed tannin to rumen fluid, T2 = adding 2% (w/v) condensed tannin to rumen fluid, T3 = adding 3% (w/v) condensed tannin to rumen fluid. a–c—means with different superscripts within the same column differ significantly (p < 0.05).
Fermentation 11 00581 g002
Figure 3. Correlation analysis of the P3 (38–52 kDa) gray value (A) and the concentration of total protein (B) with the foaming characteristics of rumen fluid in goats fed with a high-concentrate diet.
Fermentation 11 00581 g003
Figure 4. The effect of adding condensed tannins to a high-concentrate diet on the foaming production (A) and foaming retention (B) of rumen fluid in goats. CON = high-concentrate diet + 0% condensed tannin, T1 = high-concentrate diet + 1% condensed tannin, and T2 = high-concentrate diet + 2% condensed tannin. a, b—means with different superscripts within the same column differ significantly (p < 0.05).
Fermentation 11 00581 g004
Table 1. The ingredients and chemical composition of basal diets (%, DM basis).
IngredientsContent (%)Chemical CompositionContent (%)
Wheat40.00Crude protein15.16
Corn9.00Ether extract3.18
Soybean meal10.00ME (MCal·kg−1)2.41
DDGS6.00Neutral detergent fiber23.11
Alfalfa meal25.00Acid detergent fiber12.94
Corn bran5.00Calcium0.84
CaCO30.80Total phosphorus0.38
Bentonite2.00Concentrate: roughage75:25
NaCl0.40
Premix 10.55
NaHCO30.80
Antioxidants0.05
MgO0.40
Total100.00
1 The premix provided the following per kg of diet: vitamin A 2200 IU, vitamin D 250 IU, vitamin E 20 IU, Fe 40 mg, Cu 10 mg, Zn 30 mg, Mn 40 mg, I 0.8 mg, Se 0.2 mg, and Co 0.11 mg.
Table 2. The ingredients and chemical composition of diets (%, DM basis).
ItemsCON 2T1T2
Ingredients
Wheat404040
Corn999
Soybean meal101010
DDGS666
Alfalfa meal252525
Corn bran555
CaCO30.80.80.8
NaCl0.40.40.4
Bentonite210
1 Premix0.550.550.55
Antioxidants0.050.050.05
NaHCO30.80.80.8
MgO0.40.40.4
Condensed tannins012
Total100100100
Concentrate: roughage75:2575:2575:25
Chemical composition
Crude protein15.1614.7715.63
Ether extract3.183.324.13
ME (MCal·kg−1)2.412.462.52
Neutral detergent fiber23.1132.4526.75
Acid detergent fiber12.9416.0411.64
Calcium0.840.790.77
Total phosphorus0.380.360.37
1 The premix provided the following per kg of diet: vitamin A 2200 IU, vitamin D 250 IU, vitamin E 20 IU, Fe 40 mg, Cu 10 mg, Zn 30 mg, Mn 40 mg, I 0.8 mg, Se 0.2 mg, and Co 0.11 mg. 2 CON = high-concentrate diet + 0% condensed tannin, T1 = high-concentrate diet + 1% condensed tannin, and T2 = high-concentrate diet + 2% condensed tannin.
Table 3. Descriptive statistics for the concentration of total protein and foaming characteristics in the rumen fluid of goats fed with a high-concentrate diet.
ItemNumberMinimumMedianMaximumMeanSD
Total protein (g/L)150.952.674.282.560.26
Foam production (mL/30 mL)1510.0033.33100.0046.078.03
Foam retention (min)150.1693112.112.77
Table 4. Descriptive statistics for the SDS-PAGE electrophoretic gray values of protein fractions in the rumen fluid of goats fed with a high-concentrate diet.
Items 1MinimumMedianMaximumMean ± SD
Protein fraction 1(105–140 kDa)59,596264,767.5326,984245,576.5 ± 97,660.33
Protein fraction 2 (66–105 kDa)54,576285,380403,472247,809.3 ± 177,456.39
Protein fraction 3 (38–52 kDa)10,52358,464443,605133,926.7 ± 151,019.14
Protein fraction 4 (13–20 kDa)132,069173,732269,861187,348.5 ± 61,318.15
1 SDS-PAGE gel electrophoresis bands were analyzed in grayscale using ImageJ software, and each band was used as a group of proteins for quantification of the protein fractions.
Table 5. Correlation analysis of the protein fractions with the foaming characteristics in the rumen fluid of goats fed with a high-concentrate diet.
Items 1Foam Production
(mL/30 mL, 25 °C) 2
Foam Retention
(min, 25 °C)
Protein fraction 1 (105–140 kDa)0.330.34
Protein fraction 2 (66–105 kDa)0.230.29
Protein fraction 3 (38–52 kDa)0.80 **0.82 **
Protein fraction 4 (13–20 kDa)0.420.44
Total protein (g/L)0.83 **0.95 **
1 SDS-PAGE gel electrophoresis bands were analyzed in gray value using ImageJ software, and each band was used as a group of proteins for quantification of the protein fractions. 2 Correlation analysis using Pearson’s method, ** p < 0.01.
Table 6. Effects of adding condensed tannins into a high-concentrate diet on the average tympanism score in goats.
ScoreCON 1T1T2
Average1.67 ± 0.42 a0.89 ± 0.61 ab0.50 ± 0.53 b
1 CON = high-concentrate diet + 0% condensed tannin, T1 = high-concentrate diet + 1% condensed tannin, and T2 = high-concentrate diet + 2% condensed tannin. a, b means with different superscripts within the same column differ significantly (p < 0.05).
Table 7. Effects of adding condensed tannins into a high-concentrate diet on apparent digestibility of nutrients in goats.
Items (%)CON 1T1T2
Dry matter60.49 ± 3.1161.32 ± 2.1960.63 ± 3.08
organic matter77.32 ± 3.1379.41 ± 2.4876.51 ± 3.19
Ether extract50.67 ± 9.2952.84 ± 8.1353.39 ± 5.95
Crude protein63.96 ± 1.3064.62 ± 1.2864.46 ± 1.41
Neutral detergent fiber51.36 ± 3.5252.15 ± 1.5052.92 ± 5.17
Acid detergent fiber45.21 ± 13.5646.77 ± 10.1346.84 ± 8.35
1 CON = high-concentrate diet + 0% condensed tannin, T1 = high-concentrate diet + 1% condensed tannin, and T2 = high-concentrate diet + 2% condensed tannin.
Table 8. Effects of adding condensed tannins into a high-concentrate diet on rumen fermentation parameters in goats.
ItemsCON 1T1T2
NH3-N (mg/dL)65.04 ± 11.5156.12 ± 7.6155.07 ± 4.91
pH value6.27 ± 0.13 b6.69 ± 0.13 a6.62 ± 0.19 a
Microbial protein (mg/dL)26.12 ± 3.2527.93 ± 5.7229.41 ± 7.02
Acetate (mmol/L)83.44 ± 29.97 a30.79 ± 7.12 b33.83 ± 4.80 b
ProPionic (mmol/L)35.10 ± 17.63 a12.92 ± 3.41 b11.16 ± 0.93 b
Butyrate (mmol/L)10.71 ± 3.16 a4.24 ± 0.96 b5.12 ± 0.88 b
Valeric (mmol/L)1.21 ± 0.23 a0.85 ± 0.25 b0.70 ± 0.24 b
Isobutyric (mmol/L)1.37 ± 0.391.05 ± 0.451.17 ± 0.45
Isovaleric (mmol/L)1.65 ± 0.14 b2.05 ± 0.40 ab2.56 ± 0.63 a
Acetate/propionic2.54 ± 0.50 ab2.40 ± 0.26 b3.02 ± 0.31 ab
a, b Means with different superscripts within the same column differ significantly (p < 0.05). 1 CON = high-concentrate diet + 0% condensed tannin, T1 = high-concentrate diet + 1% condensed tannin, and T2 = high-concentrate diet + 2% condensed tannin.
Table 9. Effects of adding condensed tannins into a high-concentrate diet on serum biochemical indices in goats.
ItemsCON 1T1T2
Total protein (g/L)69.37 ± 4.2467.05 ± 2.1767.03 ± 4.12
Albumin (g/L)36.37 ± 1.7536.10 ± 2.1134.42 ± 1.98
Globulin (g/L)33.00 ± 4.3030.95 ± 0.5232.62 ± 3.51
Albumin/globulin1.12 ± 0.161.17 ± 0.071.07 ± 0.13
Creatinine (μmol/L)72.50 ± 10.4875.83 ± 9.4562.00 ± 16.80
Brea nitrogen (mmol/L)8.56 ± 1.407.37 ± 0.898.65 ± 3.83
Uric acid (μmol/L)2.50 ± 0.551.67 ± 0.522.00 ± 1.26
Alanine aminotransferase (U/L)22.65 ± 1.70 a22.48 ± 5.32 a15.85 ± 2.48 b
Aspartate aminotransferase (U/L)105.80 ± 24.36 a85.80 ± 13.78 ab73.73 ± 9.16 b
Glucose (mmol/L)2.02 ± 0.19 a1.25 ± 0.43 b2.05 ± 0.57 a
Triglycerides (mmol/L)0.17 ± 0.05 b0.18 ± 0.04 b0.26 ± 0.06 a
High-density lipoprotein (mmol/L)1.26 ± 0.261.37 ± 0.161.40 ± 0.31
Low-density lipoprotein (mmol/L)0.53 ± 0.150.57 ± 0.130.81 ± 0.53
a, b Means with different superscripts within the same column differ significantly (p < 0.05). 1 CON = high-concentrate diet + 0% condensed tannin, T1 = high-concentrate diet + 1% condensed tannin, and T2 = high-concentrate diet + 2% condensed tannin.
Table 10. Effects of adding condensed tannins into a high-concentrate diet on serum immunological and antioxidant indices in goats.
ItemsCON 1T1T2
Immunoglobulin M (g/L)69.37 ± 4.2467.05 ± 2.1767.03 ± 4.12
Immunoglobulin G (g/L)36.37 ± 1.7536.10 ± 2.1134.42 ± 1.98
Immunoglobulin A (g/L)33.00 ± 4.3030.95 ± 0.5232.62 ± 3.51
Interleukin 1β (pg/mL)96.64 ± 9.98 a78.89 ± 5.43 b68.66 ± 8.33 b
Interleukin 10 (pg/mL)25.60 ± 5.9225.71 ± 3.4828.90 ± 5.53
Tumour necrosis factor α (pg/mL)145.56 ± 12.88 a152.66 ± 10.91 a119.92 ± 7.90 b
Interleukin 6 (pg/mL)107.64 ± 6.41 a69.64 ± 8.23 b79.35 ± 8.80 b
Malondialdehyde (nmol/mL)0.91 ± 0.240.90 ± 0.600.88 ± 0.43
Total antioxidant capacity (U/mL)0.28 ± 0.030.29 ± 0.020.30 ± 0.04
Protein carbonyls (μmol/mL)0.03 ± 0.010.03 ± 0.010.03 ± 0.01
Glutathione peroxidase (U/mL)3.76 ± 1.16 b5.44 ± 4.68 b13.16 ± 6.57 a
Superoxide dismutase (U/mL)0.92 ± 0.391028 ± 0.992.33 ± 1.52
a, b Means with different superscripts within the same column differ significantly (p < 0.05). 1 CON = high-concentrate diet + 0% condensed tannin, T1 = high-concentrate diet + 1% condensed tannin, and T2 = high-concentrate diet + 2% condensed tannin.
Table 11. Effects of adding condensed tannins to a high-concentrate diet on routine blood indices in goats.
ItemsCON 1T1T2
White blood cell count (109/L)11.56 ± 2.93 b11.35 ± 1.71 b16.97 ± 5.27 a
Neutrophil percentage (%)15.85 ± 5.3512.60 ± 5.2317.25 ± 14.11
Mean hemoglobin content (pg)43.5 ± 1.41 a39.08 ± 2.30 b44.38 ± 1.62 a
Mean corpuscular volume (fL)35.68 ± 0.38 b36.98 ± 0.73 a35.58 ± 0.51 b
Red blood cell count (1012/L)2.44 ± 0.43 ab2.82 ± 0.44 a2.35 ± 0.34 b
Hemoglobin concentration (g/L)102.50 ± 11.95110.50 ± 7.01100.00 ± 6.54
Hematocrit (%)8.78 ± 1.38 ab10.40 ± 1.89 a8.42 ± 1.38 b
a, b Means with different superscripts within the same column differ significantly (p < 0.05). 1 CON = high-concentrate diet + 0% condensed tannin, T1 = high-concentrate diet + 1% condensed tannin, and T2 = high-concentrate diet + 2% condensed tannin.
Table 12. Effects of adding condensed tannins to a high-concentrate diet on the relative abundance of ruminal dominant microorganisms (top 10) at the phylum and genus level in goats.
ItemsCON 1T1T2
Phylum
Bacteroidota42.20 ± 0.1949.90 ± 0.1245.80 ± 0.18
Proteobacteria16.90 ± 0.205.60 ± 0.037.20 ± 0.09
Firmicutes29.70 ± 0.1129.10 ± 0.082.97 ± 0.10
Euryarchaeota5.40 ± 0.048.90 ± 0.0910.80 ± 0.11
Patescibacteria0.30 ± 0.000.20 ± 0.002.20 ± 0.03
Spirochaetota3.30 ± 0.033.80 ± 0.022.50 ± 0.02
Cyanobacteria0.50 ± 0.010.02 ± 0.000.09 ± 0.00
Actinobacteriota0.80 ± 0.010.50 ± 0.000.60 ± 0.01
Fibrobacterota0.10 ± 0.00 b0.60 ± 0.00 a0.10 ± 0.00 b
Halobacterota0.20 ± 0.000.50 ± 0.000.10 ± 0.00
Others0.70 ± 0.000.90 ± 0.000.70 ± 0.00
Genus
Pseudomonas10.60 ± 0.161.26 ± 0.014.80 ± 0.07
Prevotella150 ± 0.082.02 ± 0.1414.3 ± 0.09
Prevotellaceae_YAB2003_group4.70 ± 0.110.20 ± 0.000. 07 ± 0.00
Methanobrevibacter5.30 ± 0.048.80 ± 0.0910.70 ± 0.11
Rikenellaceae_RC9_gut_group5.40 ± 0.037.20 ± 0.0614.40 ± 0.07
F0829.50 ± 0.099.40 ± 0.077.10 ± 0.07
Christensenellaceae_R-7_group3.25 ± 0.052.00 ± 0.012.70 ± 0.01
Muribaculaceae2.80 ± 0.024.70 ± 0.044.40 ± 0.05
Ralstonia3.50 ± 0.041.20 ± 0.010. 90 ± 0.01
Clostridia_UCG-0141.80 ± 0.030.70 ± 0.021.70 ± 0.03
Others38.10 ± 0.0544.80 ± 0.0638.90 ± 0.06
1 CON = high-concentrate diet + 0% condensed tannin, T1 = high-concentrate diet + 1% condensed tannin, and T2 = high-concentrate diet + 2% condensed tannin. a, b Means with different superscripts within the same column differ significantly (p < 0.05).
Disclaimer/Publisher’s Note: The statements, opinions and data contained in all publications are solely those of the individual author(s) and contributor(s) and not of MDPI and/or the editor(s). MDPI and/or the editor(s) disclaim responsibility for any injury to people or property resulting from any ideas, methods, instructions or products referred to in the content.