Article

Biochar Enhanced Anaerobic Digestion of Chicken Manure by Mitigating Ammonium Inhibition and Improving Methane Production

1
Shanxi Institute of Organic Dryland Farming, Shanxi Agricultural University, Taiyuan 030031, China
2
Key Laboratory of Sustainable Dryland Agriculture (Co-Construction by Ministry of Agriculture and Rural Affairs and Shanxi Province), Taiyuan 030031, China
3
Shanxi Province Key Laboratory of Sustainable Dryland Agriculture, Taiyuan 030031, China
4
College of Resources and Environment, Shanxi Agricultural University, Taiyuan 030031, China
*
Author to whom correspondence should be addressed.
Fermentation 2025, 11(10), 549; https://doi.org/10.3390/fermentation11100549
Submission received: 14 August 2025 / Revised: 18 September 2025 / Accepted: 19 September 2025 / Published: 23 September 2025
(This article belongs to the Section Industrial Fermentation)

Abstract

Anaerobic digestion (AD) is a mature industrial fermentation technology for converting organic matter into renewable bioenergy, and chicken manure (CM) is a promising feedstock due to its high organic content. However, the industrial-scale AD of CM is often hindered by ammonium inhibition, particularly under high organic loading rates (OLRs). Biochar has emerged as a sustainable additive that can enhance microbial activity, buffer pH, and improve system stability. In this study, the effects of biochar on the methane production and fermentation performance of CM in terms of AD were evaluated under both batch and continuous conditions, where batch experiments were conducted at different biochar-to-CM ratios. Ammonium nitrogen and methane production were monitored to determine the optimal biochar addition ratio. Continuous stirred-tank reactors (CSTRs) were then operated with the optimal biochar addition ratio under stepwise-increasing OLR conditions to assess methane production, fermentation parameters, and methanogen community composition. The results showed that an optimal biochar addition of 9% reduced total ammonium nitrogen (TAN) by 31.75% and increased cumulative methane production by 25.93% compared with the control. In continuous operation, biochar addition mitigated ammonium inhibition, stabilized pH, enhanced system stability and organic loading capacity, and improved methane production by 21.15%, 27.78%, and 83.33% at OLRs of 2.37, 4.74, and 7.11 g volatile solids (VS)/(L·d), respectively, compared to the control. Biochar also inhibited the growth of methylotrophic methanogen of RumEn_M2. These findings provide scientific and technical support for applying biochar as a process enhancer during the AD of CM.

1. Introduction

Chicken manure (CM) is being produced in increasing quantities due to the expansion of the poultry breeding industry. The random discharge or direct land application of CM leads to various environmental problems, including water pollution (groundwater pollution and eutrophication), air pollution, biosafety risk (pathogen transmission and antibiotic residue), and greenhouse gas emissions [1]. Therefore, treatment or resource recycling is necessary to minimize the environmental impacts of CM.
CM is rich in nutrients and organic matter, which makes it a high-quality feedstock for anaerobic digestion (AD). AD is a mature industrial fermentation technology for converting organic matter into biogas and digestate via anaerobic microorganisms under oxygen-free conditions. Digestate can be used as a bio-fertilizer on land due to its high nutrient content, while biogas can be used as a fuel to produce electricity and heat. Although AD offers many benefits, its effectiveness remains challenging due to the high accumulation of intermediate metabolites, such as volatile fatty acids (VFAs), ammonium nitrogen, and other refractory compounds. Because of the high nitrogen content in CM, ammonium inhibition caused by excess ammonium accumulation has been a major challenge in the AD of CM, particularly under high organic loading rates (OLRs). Such an ammonium inhibition can lead to process instability and a reduction in biogas and methane production during AD. Niu et al. [2] observed that biogas production ranged from 0.35 to 0.40 L/g volatile solids (VS)add in the AD system of CM, where the total ammonium nitrogen (TAN) was around 3000 mg/L. However, biogas production reduced to 0.10 L/g VSadd as the TAN concentration increased to 7000 mg/L, and a further increase in ammonia caused failure of the AD process.
Many approaches have been investigated to decrease ammonium inhibition, enhance process stability, and increase biogas production, but a widely used approach is to dilute the substrate. To avoid ammonia inhibition, substrates are normally diluted to a low total solids (TS) concentration of 0.5–3% [3]. However, the dilution of substrates will lead to lower biogas and methane production efficiency. Adding carbonaceous additives within anaerobic digesters has been proven to be more efficient, which can enhance process stability and biogas production. Several experiments have been conducted to investigate the effects of the application of various carbonaceous additives on different AD processes. Fazzino et al. [4] found that the addition of four different carbonaceous conductive materials (granular activated carbon, graphite, graphene oxide, and carbon nanotubes) in a semi-continuous organic fraction of municipal solid waste and waste activated sludge (WAS) all improved CH4 yield. Duan et al. [5] and Jin et al. [6] showed that the addition of digested sludge-derived biochar and magnetic biochar enhanced the methane production by 48% and 22.1% during the AD of WAS, respectively. Furthermore, they both found that biochar addition enhanced efficient methanogenesis in the anaerobic system by promoting extracellular electron transfer. Casabella-Font et al. [7] reported that the addition of graphene oxide in the AD of WAS improved the removal of most pharmaceuticals that were detected. In addition to numerous laboratory-scale studies, evidence from pilot-/industrial-scale investigations has demonstrated the feasibility of integrating carbonaceous additives into AD systems. Kalantzis et al. [8] reported an increase in biogas production of 32% in a pilot-scale anaerobic digester (180 L), where granular activated carbon was added for the treatment of agro-industrial wastewater. One pilot-scale (1000 L) study on the thermophilic semi-continuous AD of food waste reported that supplementing 7.5–15 g/L of biochar markedly increased methane yields (0.465–0.543 L/g VS) compared with control digesters [9]. This study also verified the technical and economic feasibility of this strategy, underscoring its potential for practical engineering implementation. Collectively, these studies confirm that carbonaceous additives can be effectively incorporated into large-scale AD systems to enhance biogas production efficiency and operational stability, reinforcing their promise for practical engineering applications.
Among the currently available carbonaceous additives, biochar has recently attracted significant attention due to its simple production process, high adsorption capacity, multi-functionality, wide variety of raw materials, and environmental friendliness [10]. Biochar is a stable carbon-based material produced by the pyrolysis process of biomass, including agricultural waste, forest residues, and livestock manure in an oxygen-starved environment. Biochar has various physical and chemical properties, including a large surface area, multi-porosity, high absorptive capacity, and electrical conductivity [1], which have proven to be effective in mitigating ammonium inhibition and enhancing AD performance. The significant roles of biochar in the AD system can be categorized as follows: (1) acting as an adsorbent to alleviate the toxic effects of inhibitory compounds, (2) functioning as a buffer to enhance AD system buffering capacity, (3) serving as a carrier that offers microhabitats for microorganisms, and (4) acting as a conductive medium to facilitate the direct interspecies electron transfer (DIET) process [11].
Several scholars have reported the impact of biochar application on the AD of CM. Pan et al. [12] investigated the effects of different types of biochar (wheat straw biochar, fruit-wood biochar, and air-dried CM biochar) on the AD of CM. The results showed that fruit-wood biochar pyrolyzed at 550 °C showed the highest TAN reduction capacity and achieved the highest cumulative methane yield. The average TAN concentration was 25% lower, and the cumulative methane production was 69% higher than that of the control. Lower ammonia nitrogen and higher methane production were found in the nano-Fe3O4 biochar treatment during the AD of CM, and it was proven that nano-Fe3O4 biochar promoted syntrophic acetate oxidation and facilitated DIET between microorganisms [13]. Ngo et al. [14] showed that the addition of acid–alkali-treated biochar into the AD of CM exhibited an 8.4-fold enhancement of methane production compared to the control. Furthermore, lower ammonia nitrogen and higher chemical oxygen demand removal rates were found in the biochar-amended treatment. However, to the best of our knowledge, the impacts of different biochar addition concentrations on the AD of CM have rarely been reported. The negative impact on methane production enhancement with excessive addition of biochar has also been reported for the AD of other substrates, including aqueous carbohydrate food waste, wastewater, and sludge [15,16,17]. Thus, considering efficiency and the economy, it is essential to investigate the optimal biochar addition ratio. Moreover, most previous studies were carried out under batch experimental conditions, as the effects of biochar addition on AD performance and microbial community structure under continuous experimental conditions were rarely reported, especially with different OLRs.
Considering the above, this study showed the results of the AD of CM under mesophilic conditions using biochar in both batch and continuous experiments. A batch experiment was carried out to evaluate the positive effects of different biochar addition ratios on ammonia inhibition mitigation and methane production and determine the optimal biochar addition ratio. The continuous experiment was subsequently conducted under the optimal biochar addition ratio to (1) further examine the AD performance of CM with biochar addition under different OLRs and (2) investigate the dynamic changes in the methanogen community in AD with biochar addition under different OLRs.

2. Materials and Methods

2.1. Sources and Characteristics of Chicken Manure and Inoculum

Fresh chicken manure (CM) was obtained from an individual chicken breeding farm located in Jinzhong City, Shanxi Province, China. Inoculum used to start up digesters was derived from the activated sludge generated during the anaerobic digestion (AD) of CM, which was obtained from the Biogas Technology Laboratory of Shanxi Agricultural University, Taiyuan City, Shanxi Province, China. CM and inoculum were maintained in a refrigerator at 4 °C until needed. The characteristics of both CM and inoculum are presented in Table 1.

2.2. Sources and Characteristics of Biochar

As previously mentioned, biochar was added to the anaerobic digester of CM to (1) mitigate ammonia inhibition and enhance AD performance and (2) evaluate its effects on the AD performance of CM under different organic loading rates (OLRs). Applewood biochar was selected for this study. It was sourced from Xinsilu Biotechnology Co., Ltd. (Xianyang, China) and made from the pyrolysis of applewood at 550 °C for 2 h. Characteristics of the biochar are shown in Table 2.
The Fourier-transform infrared spectroscopy (FTIR) spectrum of the biochar is shown in Figure 1, demonstrating peaks at 873, 1034, 1426, and 3416 cm−1. The peak at 873 cm−1 is attributed to the bending vibration of the C-H bond in the benzene ring. The absorption peak at 1030 cm−1 is the stretching vibration of the C-O bond in polysaccharides and polysaccharide-like substances. The absorption peak at approximately 1426 cm−1 is mainly attributed to the deformation vibration of the C-H bond in aliphatic compounds. The broad peak at 3416 cm−1 is mainly attributed to the stretching vibration of the associated -OH in carboxylic acids, alcohols, and phenolic compounds in organic matter [18].

2.3. Experimental Device

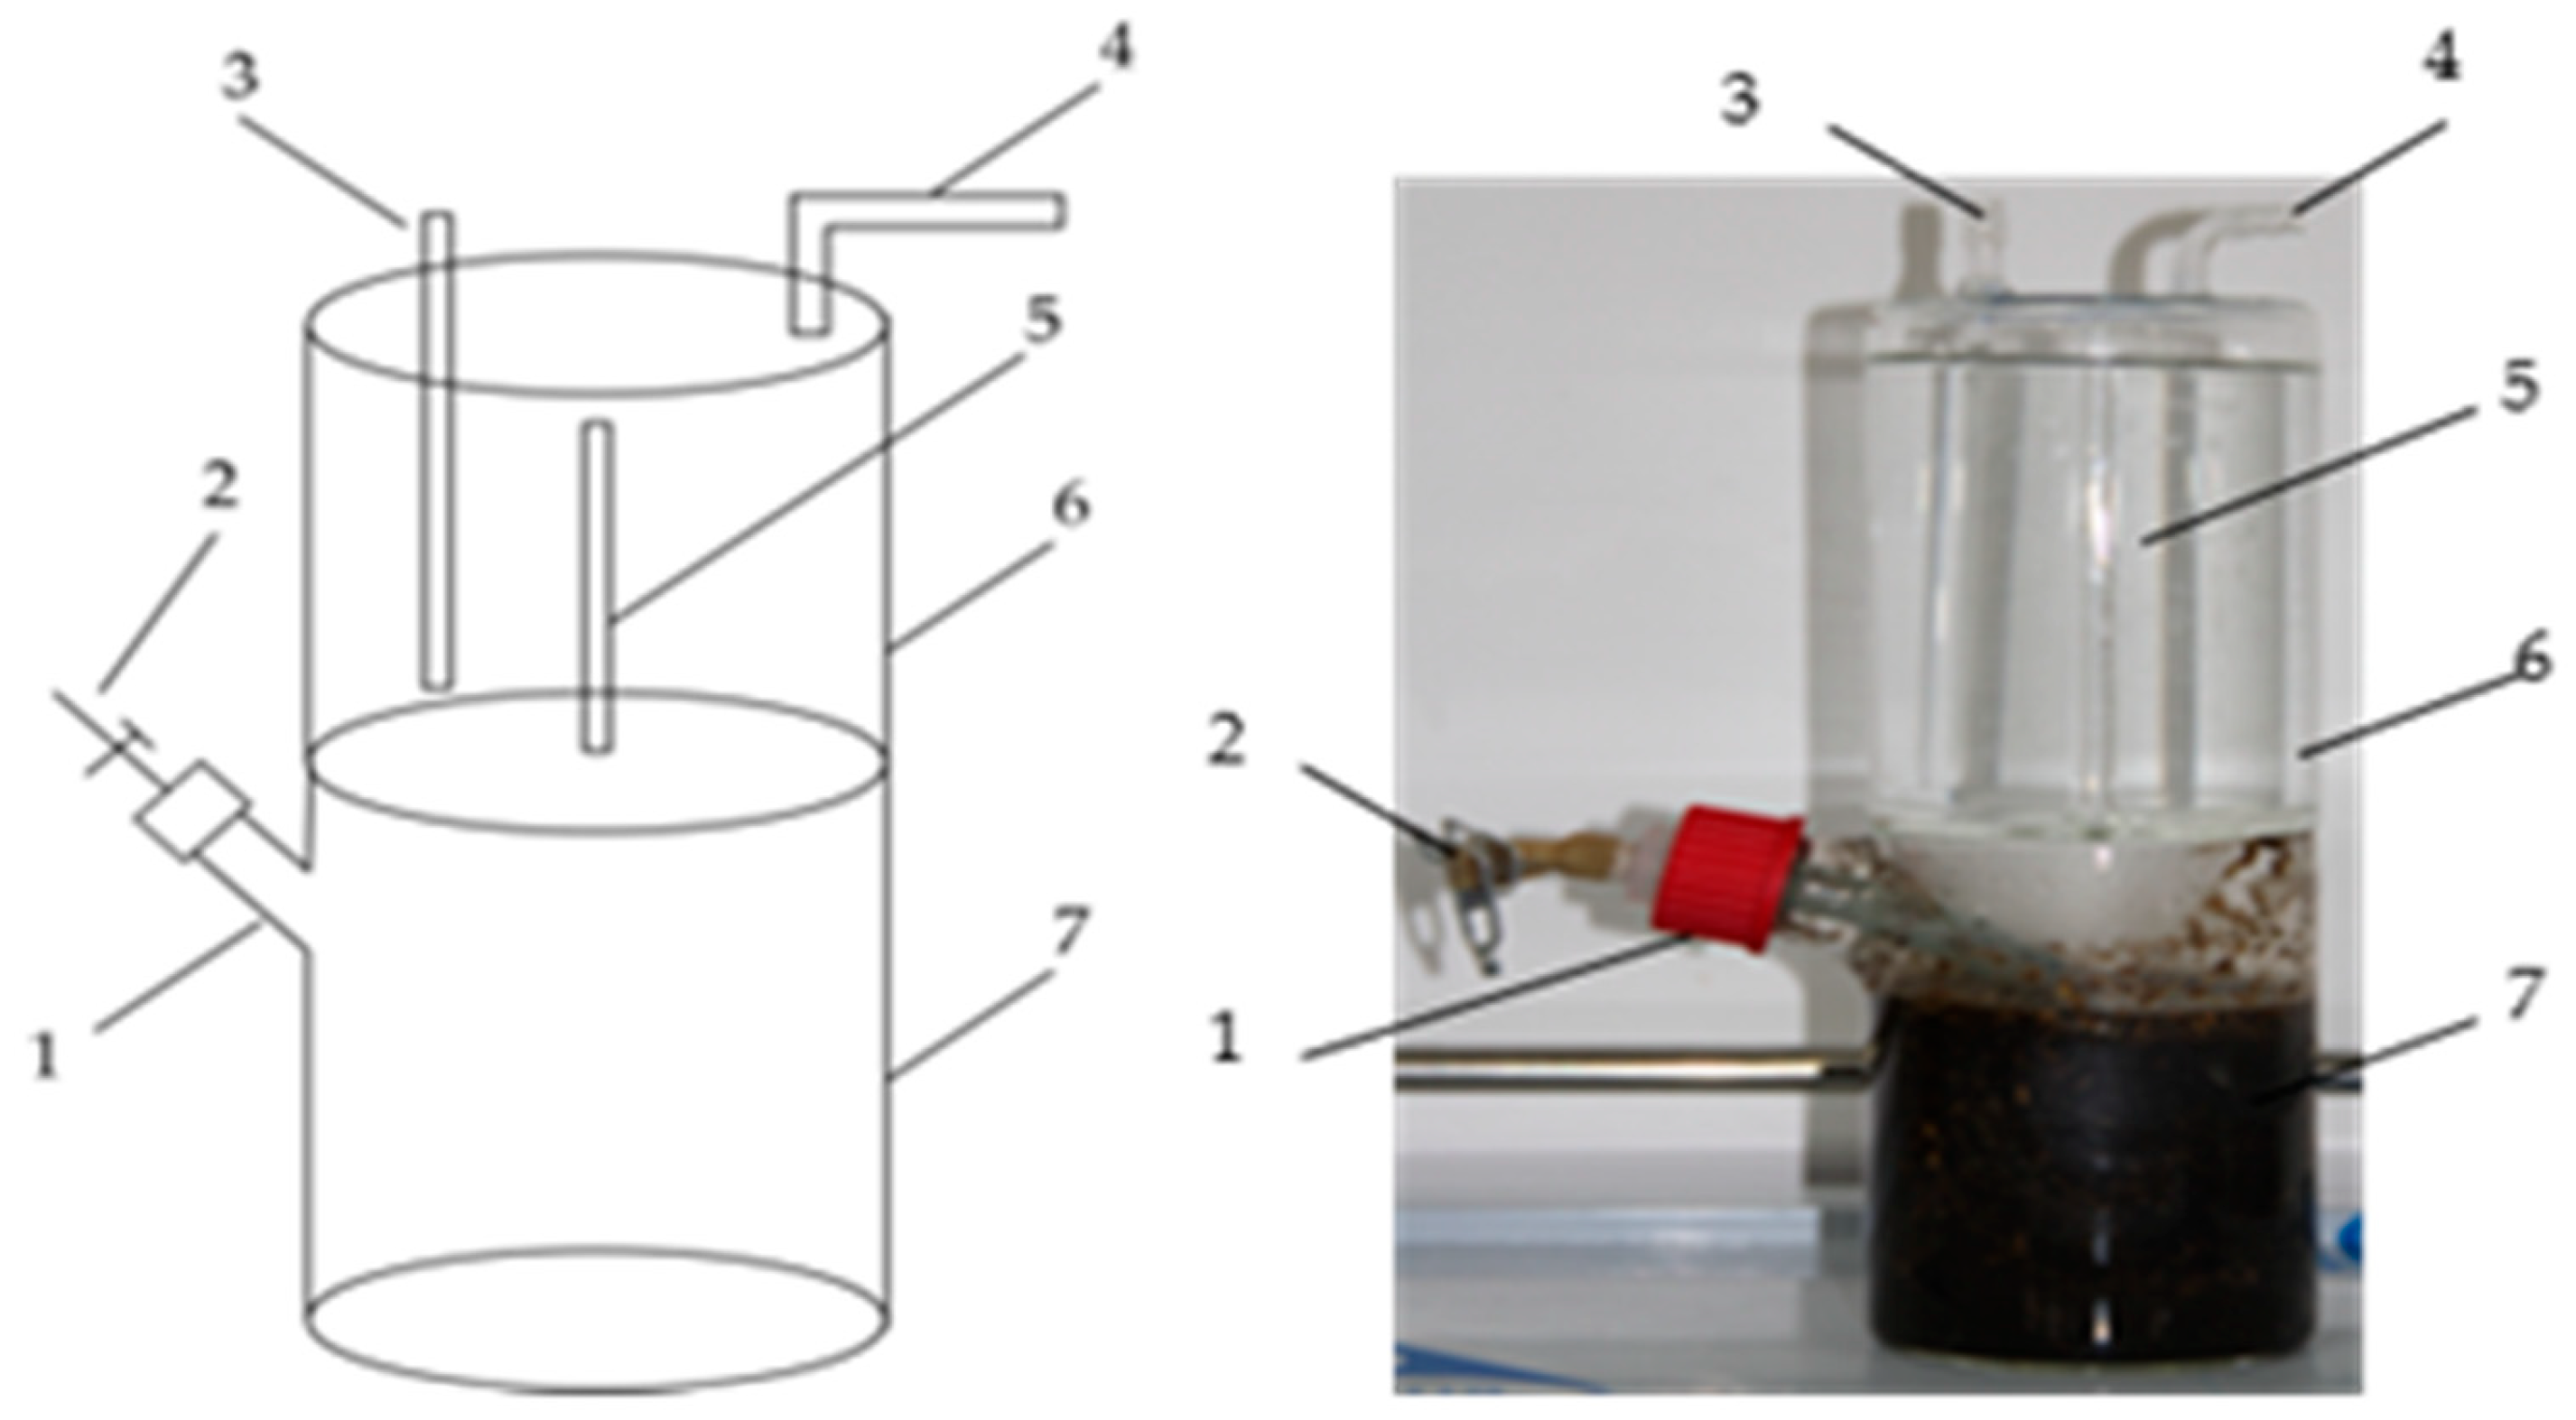
A laboratory-scale 1 L batch anaerobic digester—manufactured by the Biogas Technology Laboratory of Shanxi Agricultural University, Taiyuan, China—was used for a batch experiment with a working volume of 800 mL, as illustrated in Figure 2. The digester consists of two parts: the lower reaction zone and the upper biogas collection zone. Feedstocks are loaded into the reaction zone via the feeding inlet, and a sampling port is connected to the feeding inlet. The biogas generated in the reaction zone is directed via the biogas guide pipe into the biogas collection zone, which is filled with water. Water within the biogas collection zone is then transported via the water guide pipe into a water collection bottle externally connected to the digester. At the top of the digester, a biogas collection port is fitted with a gas storage bag to capture the produced biogas.
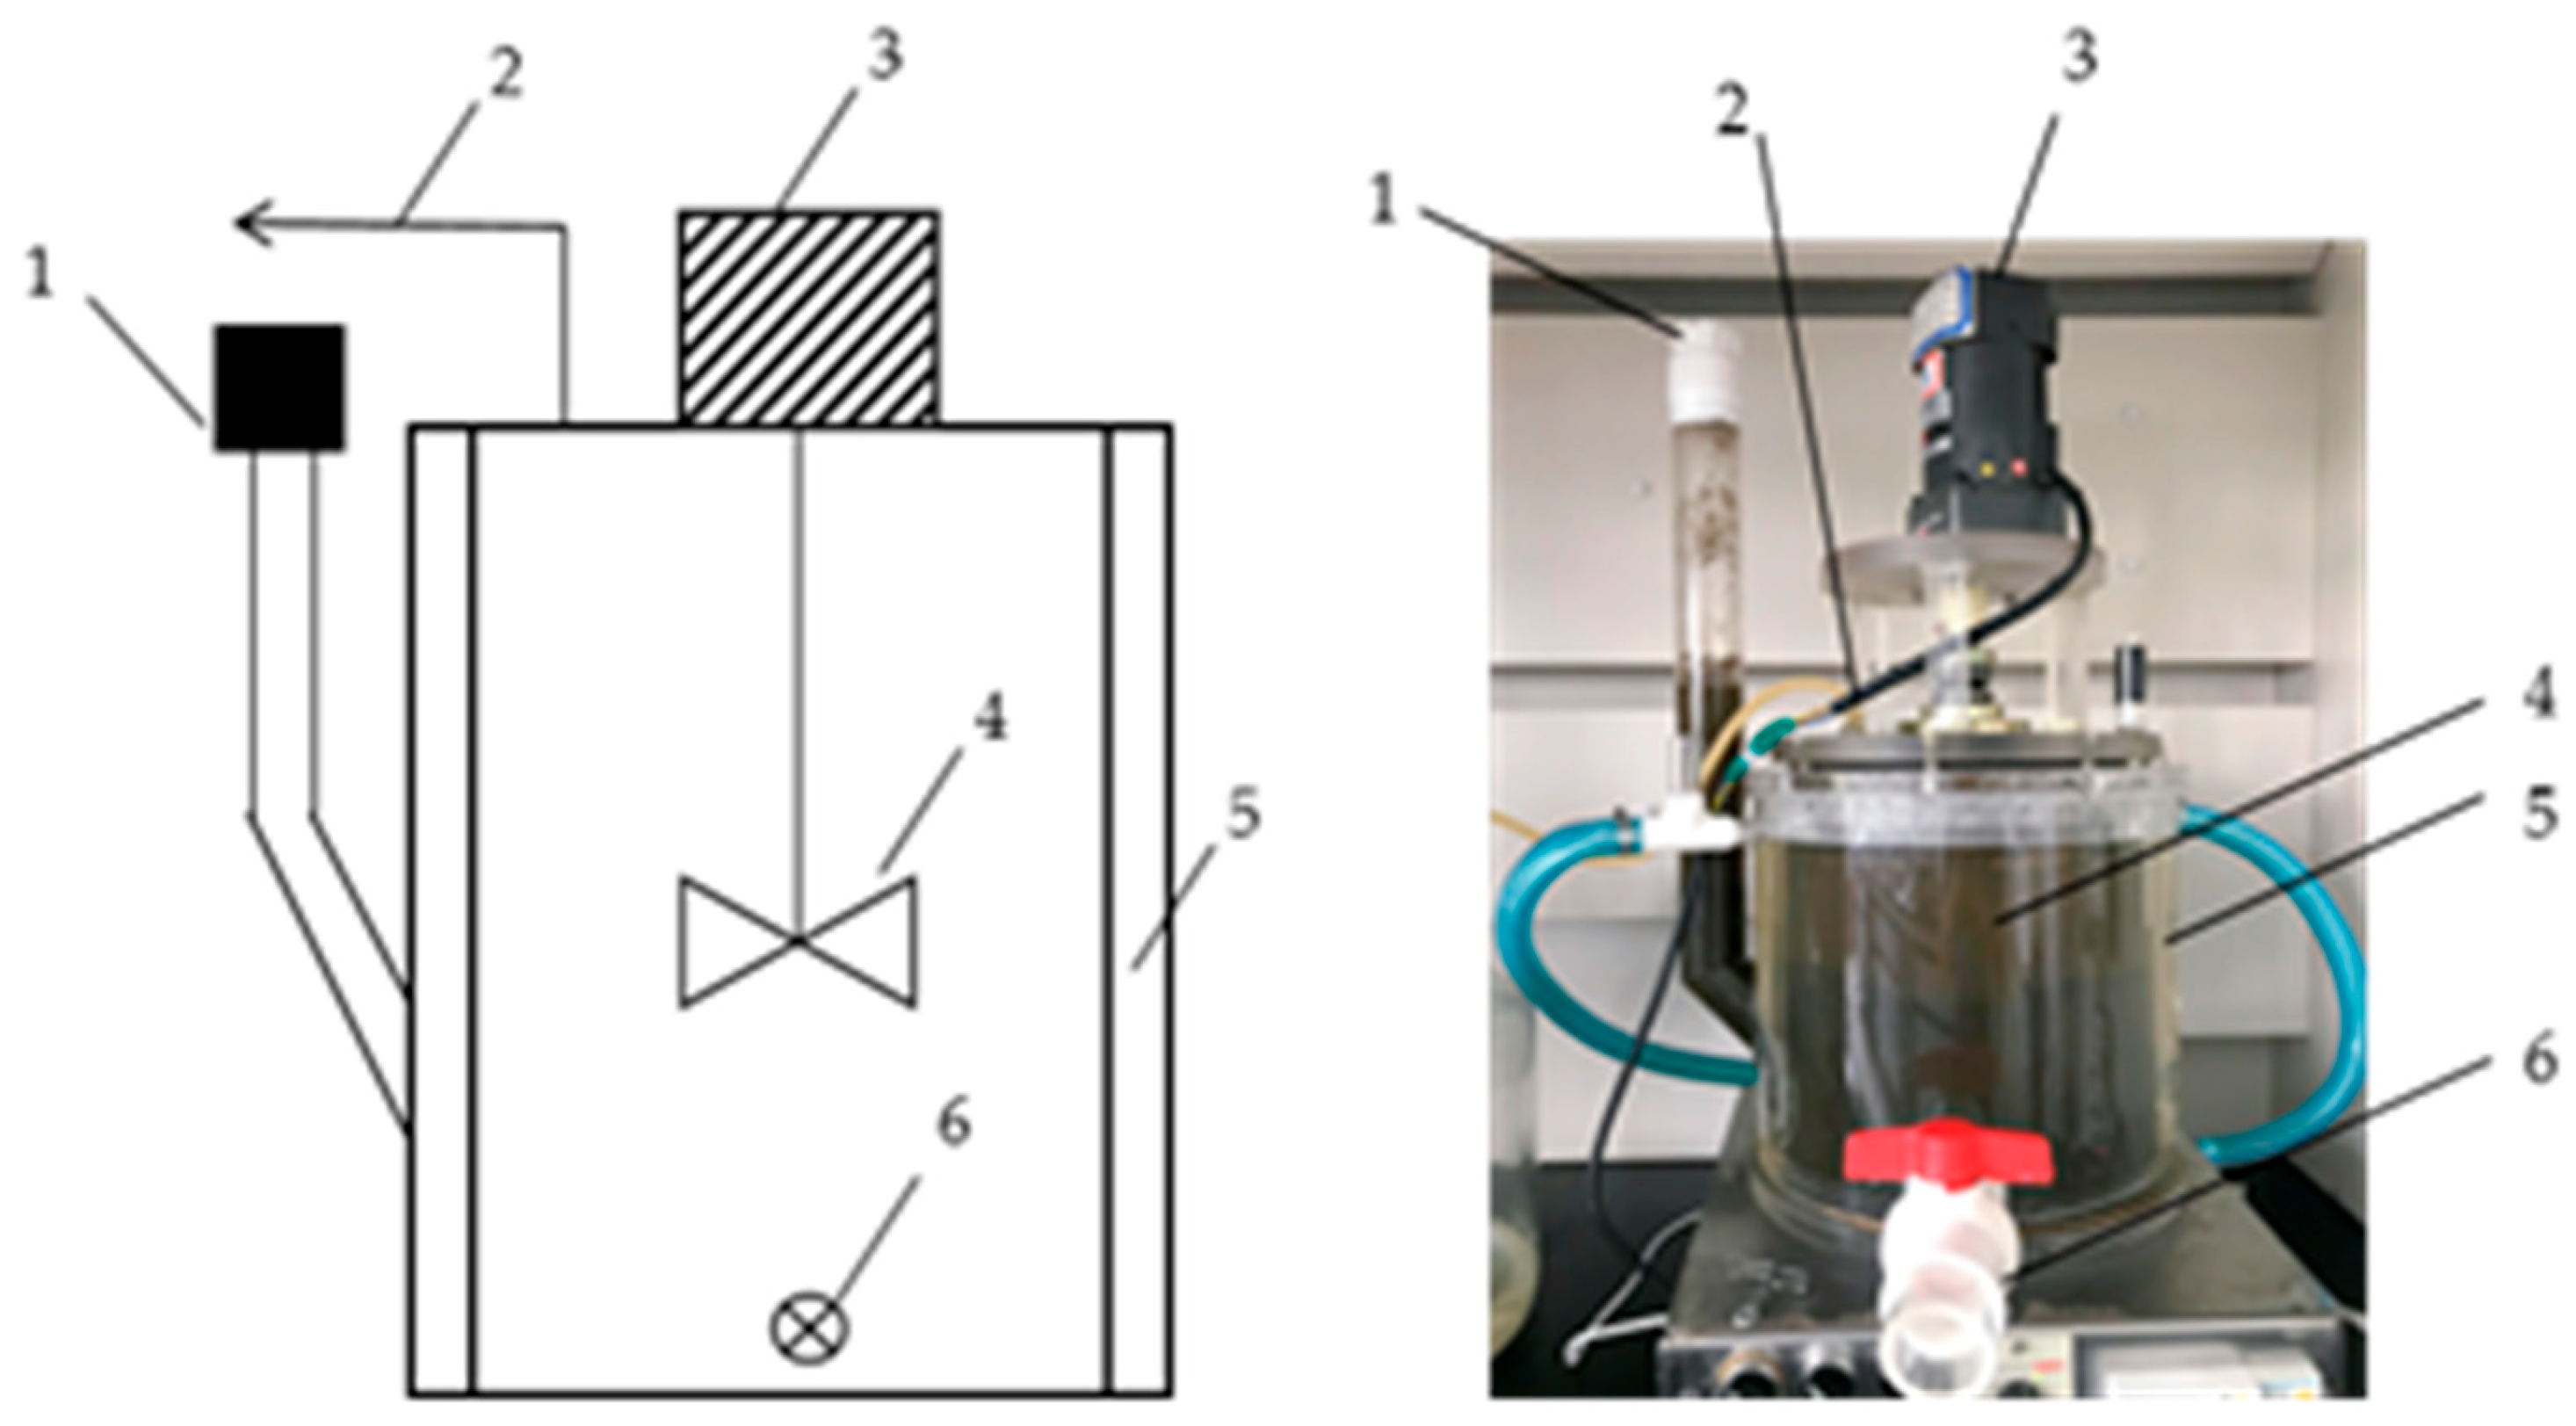
A continuous experiment was conducted using two laboratory-scale continuous stirred-tank reactors (CSTRs), each having a total volume of 10 L and a working volume of 8 L (Figure 3). The structure of the CSTR is the same as that described in our earlier report [19].

2.4. Experimental Design

2.4.1. Batch Experiment

Based on our previous research, a substrate concentration of 8% and a substrate-to-inoculum (S:I) ratio of 4:1 based on total solids (TS) were selected. The relatively higher substrate-to-inoculum ratio of 4:1 was selected to increase the amount of chicken manure in the digester. This ensured the formation of high total ammonia nitrogen concentrations, which could induce ammonia inhibition in order to facilitate the evaluation of biochar’s effect on mitigating ammonia nitrogen inhibition [1]. The higher S:I also allows for the investigation into the ability of biochar to reduce the lag phase of methane production, because a high S:I often results in a delay in methane production [20]. Biochar was added at different ratios (3%, 6%, 9%, 12%, and 15%, in terms of TS) to CM, marked as G1, G2, G3, G4, and G5, respectively. The digester without biochar addition served as the control, and all digesters were maintained at 35 ± 1 °C in a water bath. All batch experiments were run in triplicate and lasted for a total of 42 days. During the batch experiment process, biogas production was measured daily, methane content was analyzed every other day, and the total ammonium nitrogen (TAN) and pH of the digestate were measured every three days.

2.4.2. Continuous Experiment

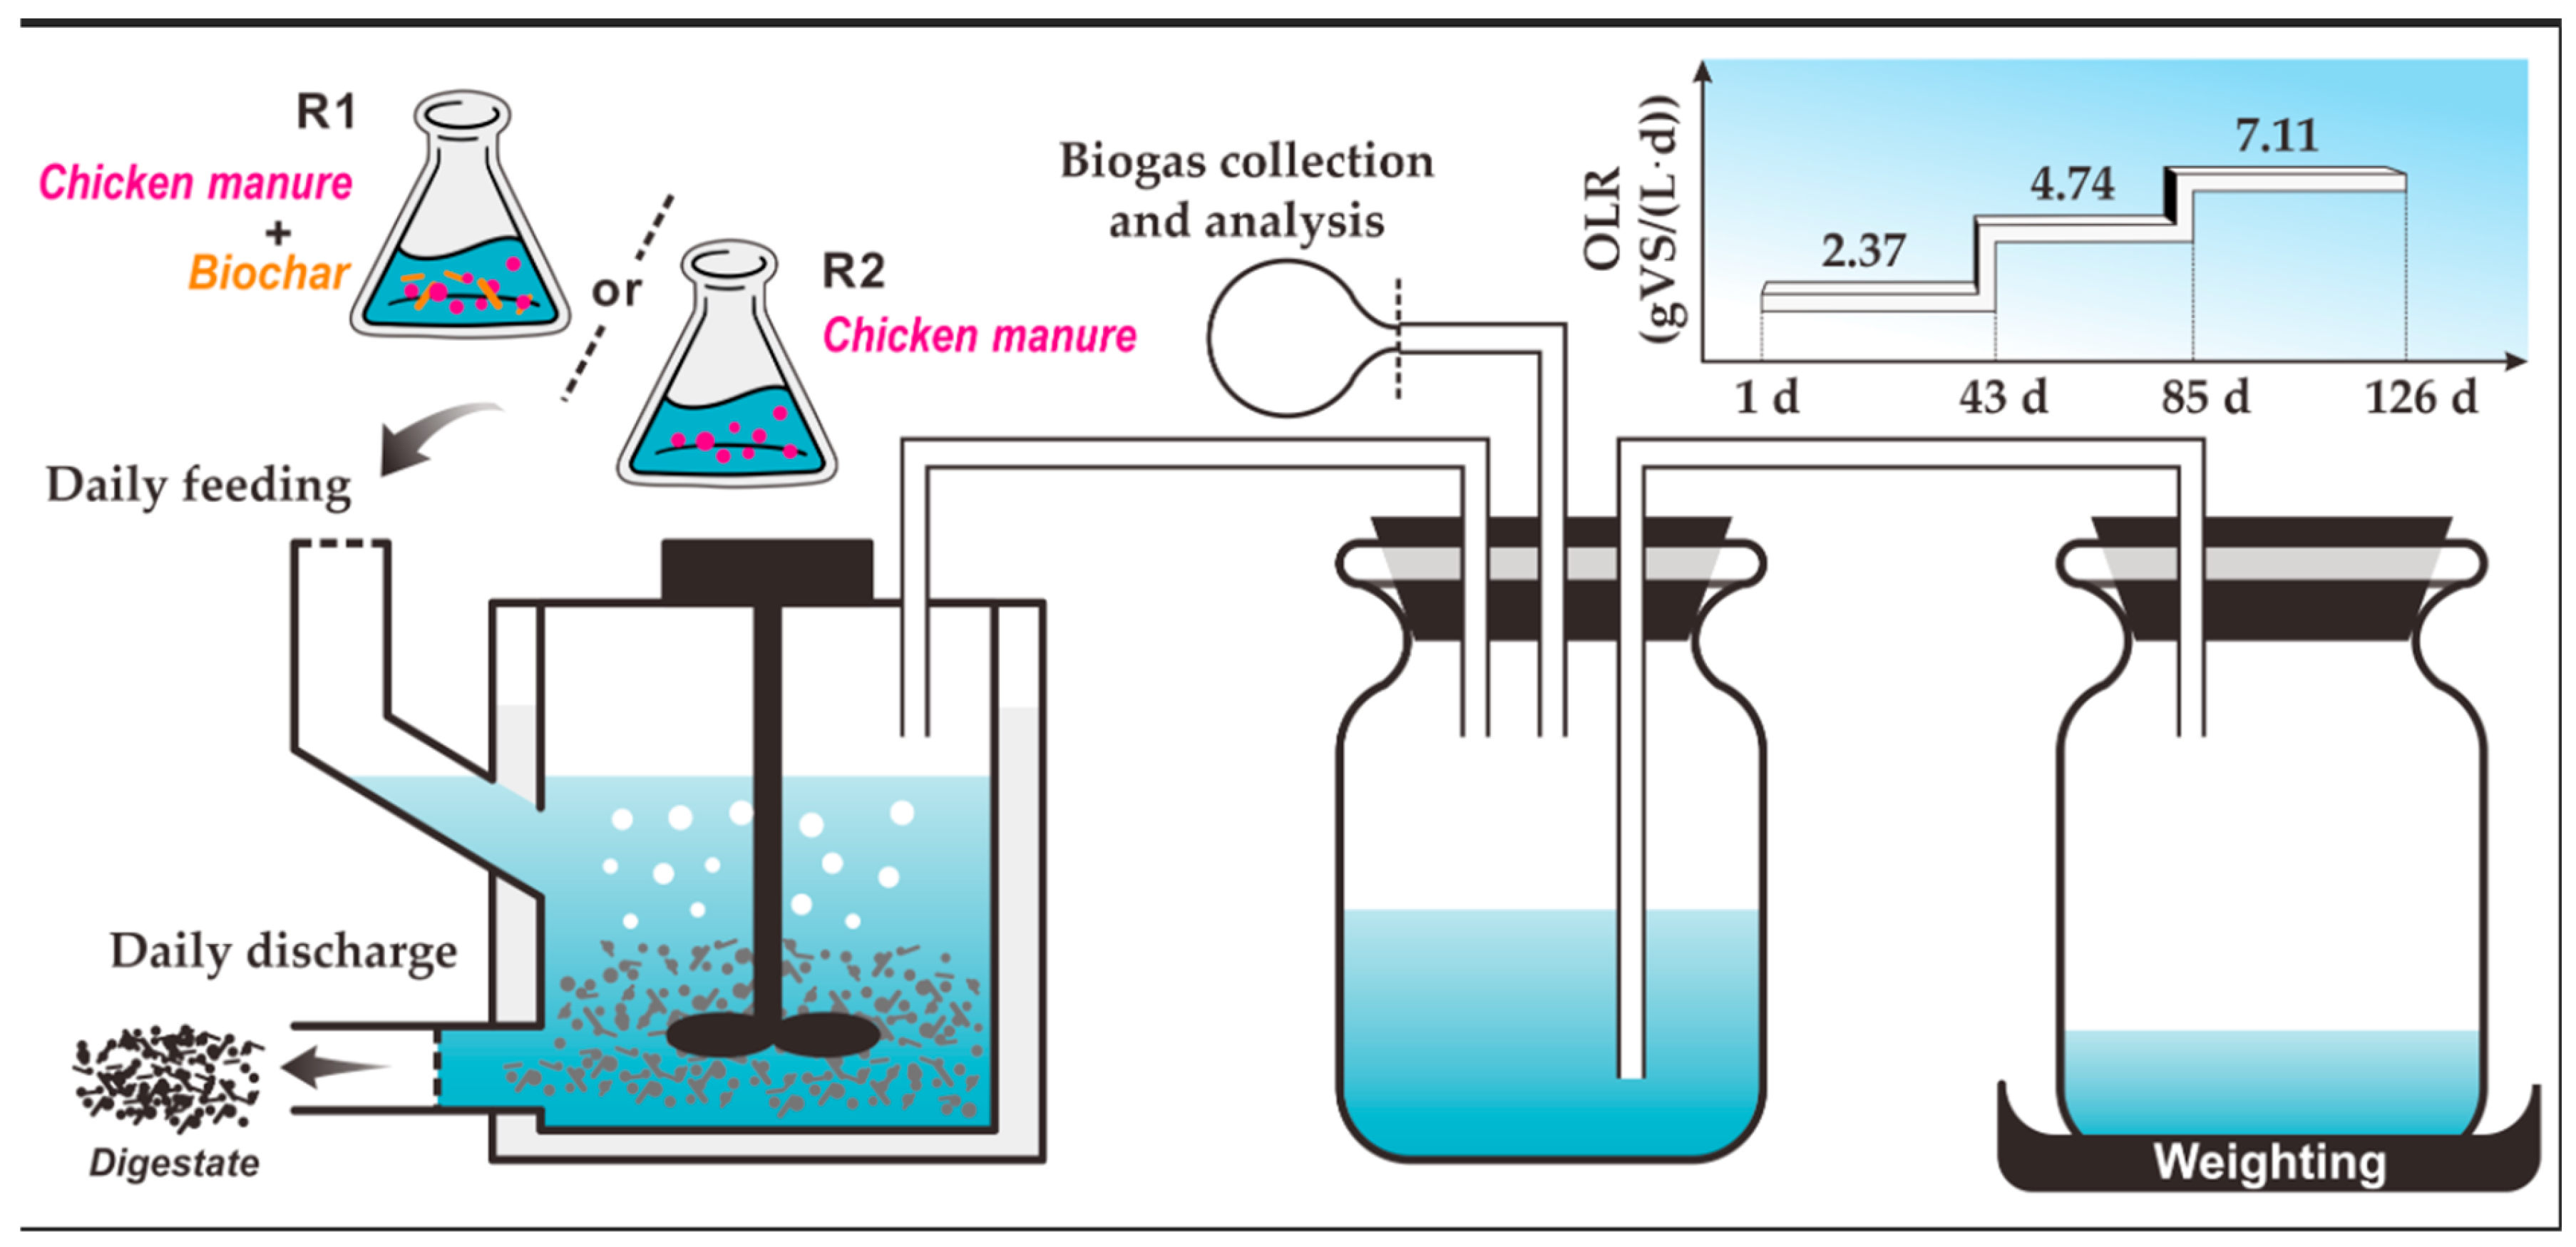
Based on the results of the batch experiment, biochar was added to the CSTR daily at a ratio of 9% to CM in the continuous experiment, marked as R1. The reactor without biochar addition was operated under the same conditions and served as the control (R2). The continuous experiments were divided into three stages with gradually increasing OLRs of 2.37, 4.74, and 7.11 g volatile solids (VS)/(L·d). The hydraulic retention time (HRT) was maintained at 21 days, with each OLR stage lasting for 2 HRTs (42 days). The operation conditions and process flow are presented in Table 3 and Figure 4. The reactor temperature was controlled by the water bath at 35 ± 1 °C. Intermittent mechanical stirring was applied to achieve homogeneous mixing of the digestate, and the stirring parameters included an intensity of 60 rpm, a stirring cycle of every 6 h, and a duration of 20 min. During the continuous digestion, biogas production and the methane content were measured daily. Volatile fatty acids (VFAs), TAN, pH, and total alkalinity (TA) of the digestate were measured weekly. Digestate samples in R1 and R2 were collected on the final day of each OLR stage (days 42, 84, and 126) for the methanogen community analysis (in triplicate). They were stored at −80 °C until further analysis.
Each laboratory-scale CSTR experiment was conducted as a single long-term trial under each operating condition, following the common practice in similar studies due to the extended time required to achieve steady-state performance [3,4,21,22,23]. Although parallel replicates were not included, the reliability of the results was supported by the stable performance during the 42-day operation and by the preceding triplicate batch experiments.

2.5. Analytical Methods and Calculations

2.5.1. Biogas Production

Biogas production was evaluated daily using the water displacement gas collection method.

2.5.2. Methane Content

Methane content was analyzed using a gas chromatograph (Agilent 7890B, Santa Clara, CA, USA), and detailed chromatography conditions can be found in our previous report [24].

2.5.3. Methane Production

For the batch experiment, daily specific methane production (DSMP) was calculated using Equation (1), and cumulative methane production was calculated using Equation (2):
S n = B n × C n M t
Qn = S1 + S2 + S3 + S4 + ...... + Sn
where Sn represents the DSMP (mL/g VS) on the nth day; Bn and Cn represent the biogas production (mL) and methane content (%) on the nth day, respectively; Mt represents the total vs. mass (g) of CM added in the digester; and Qn represents the cumulative methane production on the nth day (mL/g VS).
For the continuous experiment, the volumetric methane production rate (VMPR) was calculated using Equation (3), and DSMP was calculated using Equation (4):
P = B × C 8
S = B × C M d
where P represents the VMPR (L/(L·d)); B and C represent the daily biogas production (L/d); C represents the daily methane content (%); 8 is the working volume (L) of the digester; S represents the DSMP (mL/g VSadd); and Md represents the daily vs. mass (g) of CM added in the digester.

2.5.4. Biochar

The pH of biochar was determined with a pH meter (Leici PHS-3C, Shanghai, China) at 5% (w/v) suspension in distilled water. The ash content was determined by the ignition method [25]. The element determination of C and S was carried out using a CS analyzer (HIR-944, Wuxi, China); the element determination of H, O, and N was carried out using an ONH analyzer (HORIBA EMGA-830, Kyoto, Japan); FTIR was determined with an FTIR analyzer (Thermo Fisher Scientific Nicolet iS20, Waltham, MA, USA); and the specific surface area and pore size were tested using the Brunauer–Emmett–Teller (BET) method (Micromeritics ASAP 2460, Norcross, GA, USA).

2.5.5. CM, Inoculum, and Digestate

TS, VS, TOC, and total nitrogen (TN) were analyzed using standard methods [26]. The pH value was determined with a pH meter (Leici PHS-3C, Shanghai, China). A small amount of digestate sample (approximately 10 mL) was collected and subsequently centrifuged at 8000 rpm for 20 min. After centrifugation, the supernatant was used to measure physicochemical parameters such as TAN, pH, VFAs, and TA. The TAN concentration was determined in accordance with the Chinese Environmental Industry Standard (HJ537-2009), and the concentration of free ammonia nitrogen (FAN) was determined using Equation (5). The concentration of VFAs was measured using the colorimetric method [26] with the aid of a spectrophotometer (UV-5200PC, Shanghai, China), while the concentration of TA was analyzed by the potentiometric titration method [26], using an automatic titrator (Leici ZDJ-4B, Shanghai, China).
F A N = T A N 1 + 10 ( p K a p H )
where Ka is the dissociation equilibrium constant for NH3. Temperature has a significant effect on Ka, and the pKa was determined to be 8.9 at 35 °C.

2.5.6. Methanogen Community Analysis

Microbial DNA was extracted using a TGuide S96 Magnetic Universal DNA kit (Tiangen DP812, Beijing, China). An enzyme-linked immunosorbent assay (ELISA) reader (Synergy HTX, Hong Kong, China) was used to measure the concentration of DNA. Based on the concentration and amplification region, detection and amplification were performed on the BL1000 automated PCR system (Revvity Co., Ltd., Walpole, MA, USA). The double-ended primer sets Arch349F (5′-GYGCASCAGKCGMGAAW-3′) and Arch806R (5′-GGACTACVSGGGTATCTAAT-3′) were used for amplification of methanogenic archaea. The sequences were obtained on the Illumina Novaseq 6000 sequencing platform (Biomarker Co., LTD., Beijing, China) with a paired-end (PE) 250 sequencing strategy.

2.6. Kinetic Analysis of Methane Production

We used the modified Gompertz model to analyze the kinetics of methane production, which is presented in Equation (6):
Y ( t ) = Y 0 × e x p e x p R m a x × e Y 0 × ( r t ) + 1
where Y (t) represents the predicted cumulative methane production (mL/g VS) at any time t (d), Y0 represents the final cumulative methane production (mL/g VS), Rmax represents the maximum methane production rate (mL/(g VS·d)), e is the mathematical constant taken as 2.71828, and r represents the duration of the lag phase (d).

2.7. Data Processing

IBM SPSS Statistics 22 was used for data analysis, and OriginPro 2025 was used for graphical drawings. An analysis of variance (ANOVA) was employed to assess the significance of variance in batch experiments, and a t-test was used to assess the significance of the relative abundance of methanogen communities. The probability level p<0.05 was considered significant.

3. Results and Discussion

3.1. Batch Experiment

3.1.1. Effect of Different Biochar Ratios on pH, Total Ammonium Nitrogen (TAN), and Free Ammonia Nitrogen (FAN)

Ammonia nitrogen can provide essential macro-nutrients for the growth of anaerobic microorganisms and serve as a buffer to neutralize acidogenesis, thereby enhancing the stability of the anaerobic digestion (AD) system [27]. However, excessive ammonia nitrogen will cause a significant decrease in the growth of microorganisms and an instability in the AD system [28].
As shown in Figure 5A, overall, the TAN in the treatments with biochar addition was lower than that in the control throughout the entire digestion process. The TAN concentration decreased with increasing biochar addition ratios. The average TAN concentrations of G1, G2, G3, G4, and G5 were 2811.93, 2562.52, 2334.24, 2230.85, and 2162.63 mg/L, respectively, which amounts to percentages of 17.78%, 25.07%, 31.75%, 34.77%, and 36.76% lower than that of the control (3419.97 mg/L). TAN is a combination of ionized ammonium nitrogen (NH4+) and FAN, where FAN is regarded as the main factor inhibiting methanogenic microorganisms [29,30]. As illustrated in Figure 5B, the concentrations of FAN in biochar-amended treatments were lower than those of the control: the average FAN concentrations in G1-G5 were 119.01, 116.07, 102.68, 141.84, and 152.64 mg/L, respectively, whereas the control treatment exhibited a concentration of 214.84 mg/L, which exceeded the commonly reported inhibition threshold of 200 mg/L [31,32,33]. Moreover, during the anaphase of AD, the concentrations of FAN in the control increased sharply with rising pH levels (Figure 5C), whereas FAN in the biochar-amended treatments exhibited only minor fluctuations. This indicated that biochar could increase the AD system buffering capacity and moderate the variation in pH and FAN [33]. Notably, FAN concentrations in G4 and G5 were higher than in other biochar-amended treatments throughout the entire AD process, exceeding 200 mg/L after day 33 and reaching peak values of 310.25 and 327.01 mg/L, respectively, on day 42. This increase in FAN can be attributed to the high alkalinity of biochar, as excessive addition led to elevated pH levels [34], with average pH values in G1, G2, G3, G4, and G5 being 7.51, 7.56, 7.53, 7.70, and 7.75, respectively. Thus, although G4 and G5 had lower TAN concentrations, FAN concentrations in G4 and G5 were still higher than those of G1, G2, and G3.

3.1.2. Effect of Different Biochar Ratios on Methane Production

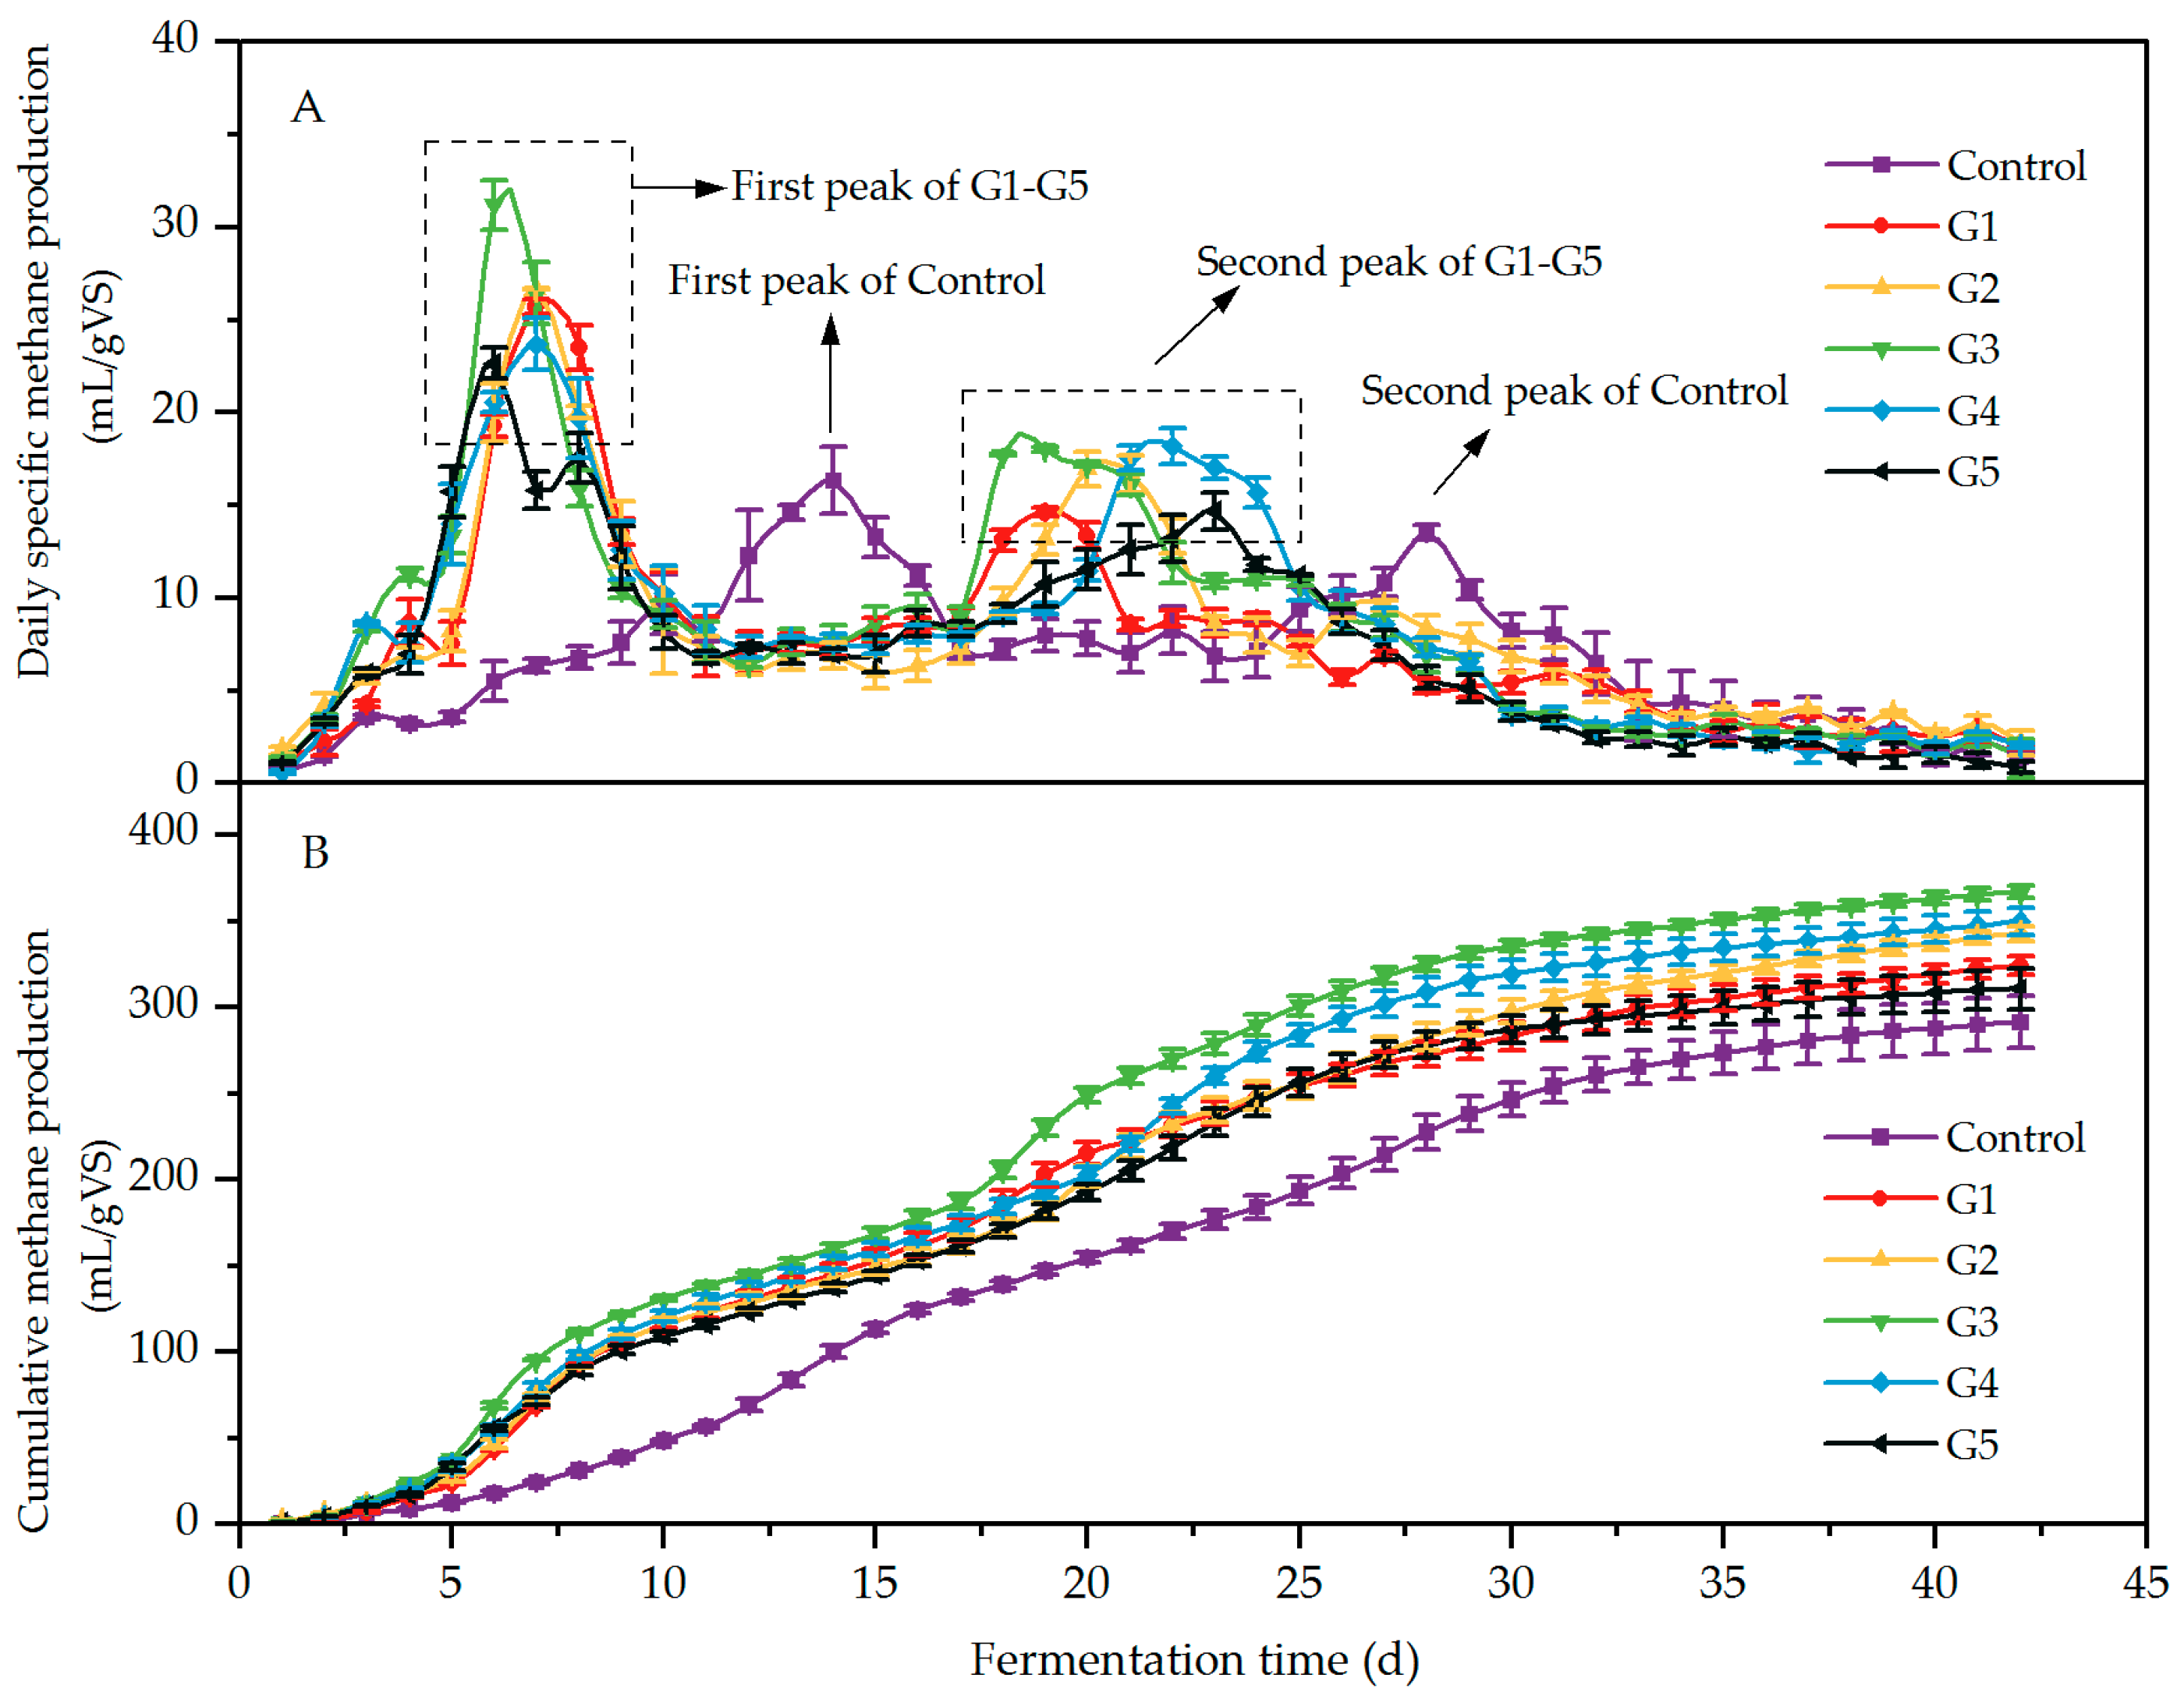
The daily specific methane production (DSMP) is shown in Figure 6A. The DSMP of all treatments exhibited two distinct peaks, but the occurrence time and amount of methane production of these peaks were different. During the initial stage of AD, the DSMP of all the biochar-amended treatments increased rapidly and reached the first methane production peak between days 6 and 7. However, the first peak of the control occurred on day 14, which is later than that of the biochar-amended treatments. The occurrence of the first peak was primarily due to the assimilation of easily dissolved and degradable substances into methane by methanogens. Furthermore, the magnitude of the first peak was higher in the biochar addition digesters than in the control. Subsequently, an increasing amount of macromolecular organic matter was broken down into micromolecular organic acids. Rapid production of these organic acids disrupted the equilibrium between acidogenic bacteria activity and methanogen activity, which led to a decrease in methane production after the first peak.
Methane production reached a second peak as organic acids were gradually consumed by methanogens. Biochar, with its high ammonium adsorption capacity (Figure 5), alleviated ammonium inhibition and promoted methanogen activity [35]. Consequently, the second methane peak occurred earlier and was higher in biochar-amended digesters (G1–G5: days 19–23, 14.63–18.18 mL/g volatile solids (VS)) compared to the control, which remained inhibited until day 25, with its second peak delayed to day 28 (13.52 mL/g VS). These results clearly highlight the role of biochar in accelerating methane production and mitigating ammonium inhibition.
Overall, biochar addition enhanced cumulative methane production (Figure 6B). The highest final cumulative methane production was observed in G3, reaching 366.76 mL/g VS, which was 25.93% higher than the control (p < 0.05). Notably, further increasing the biochar addition to 12% (G4) and 15% (G5) resulted in decreased methane production, with G4 and G5 being significantly lower than G3 (p < 0.05). This indicates that excessive biochar does not provide additional benefits for methane enhancement, which is consistent with the findings of Pan et al. [34] and Wang et al. [36]. As discussed previously, excessive biochar can elevate FAN levels, inhibiting anaerobic bacterial activity, which likely explains the reduced methane production in G4 and G5.
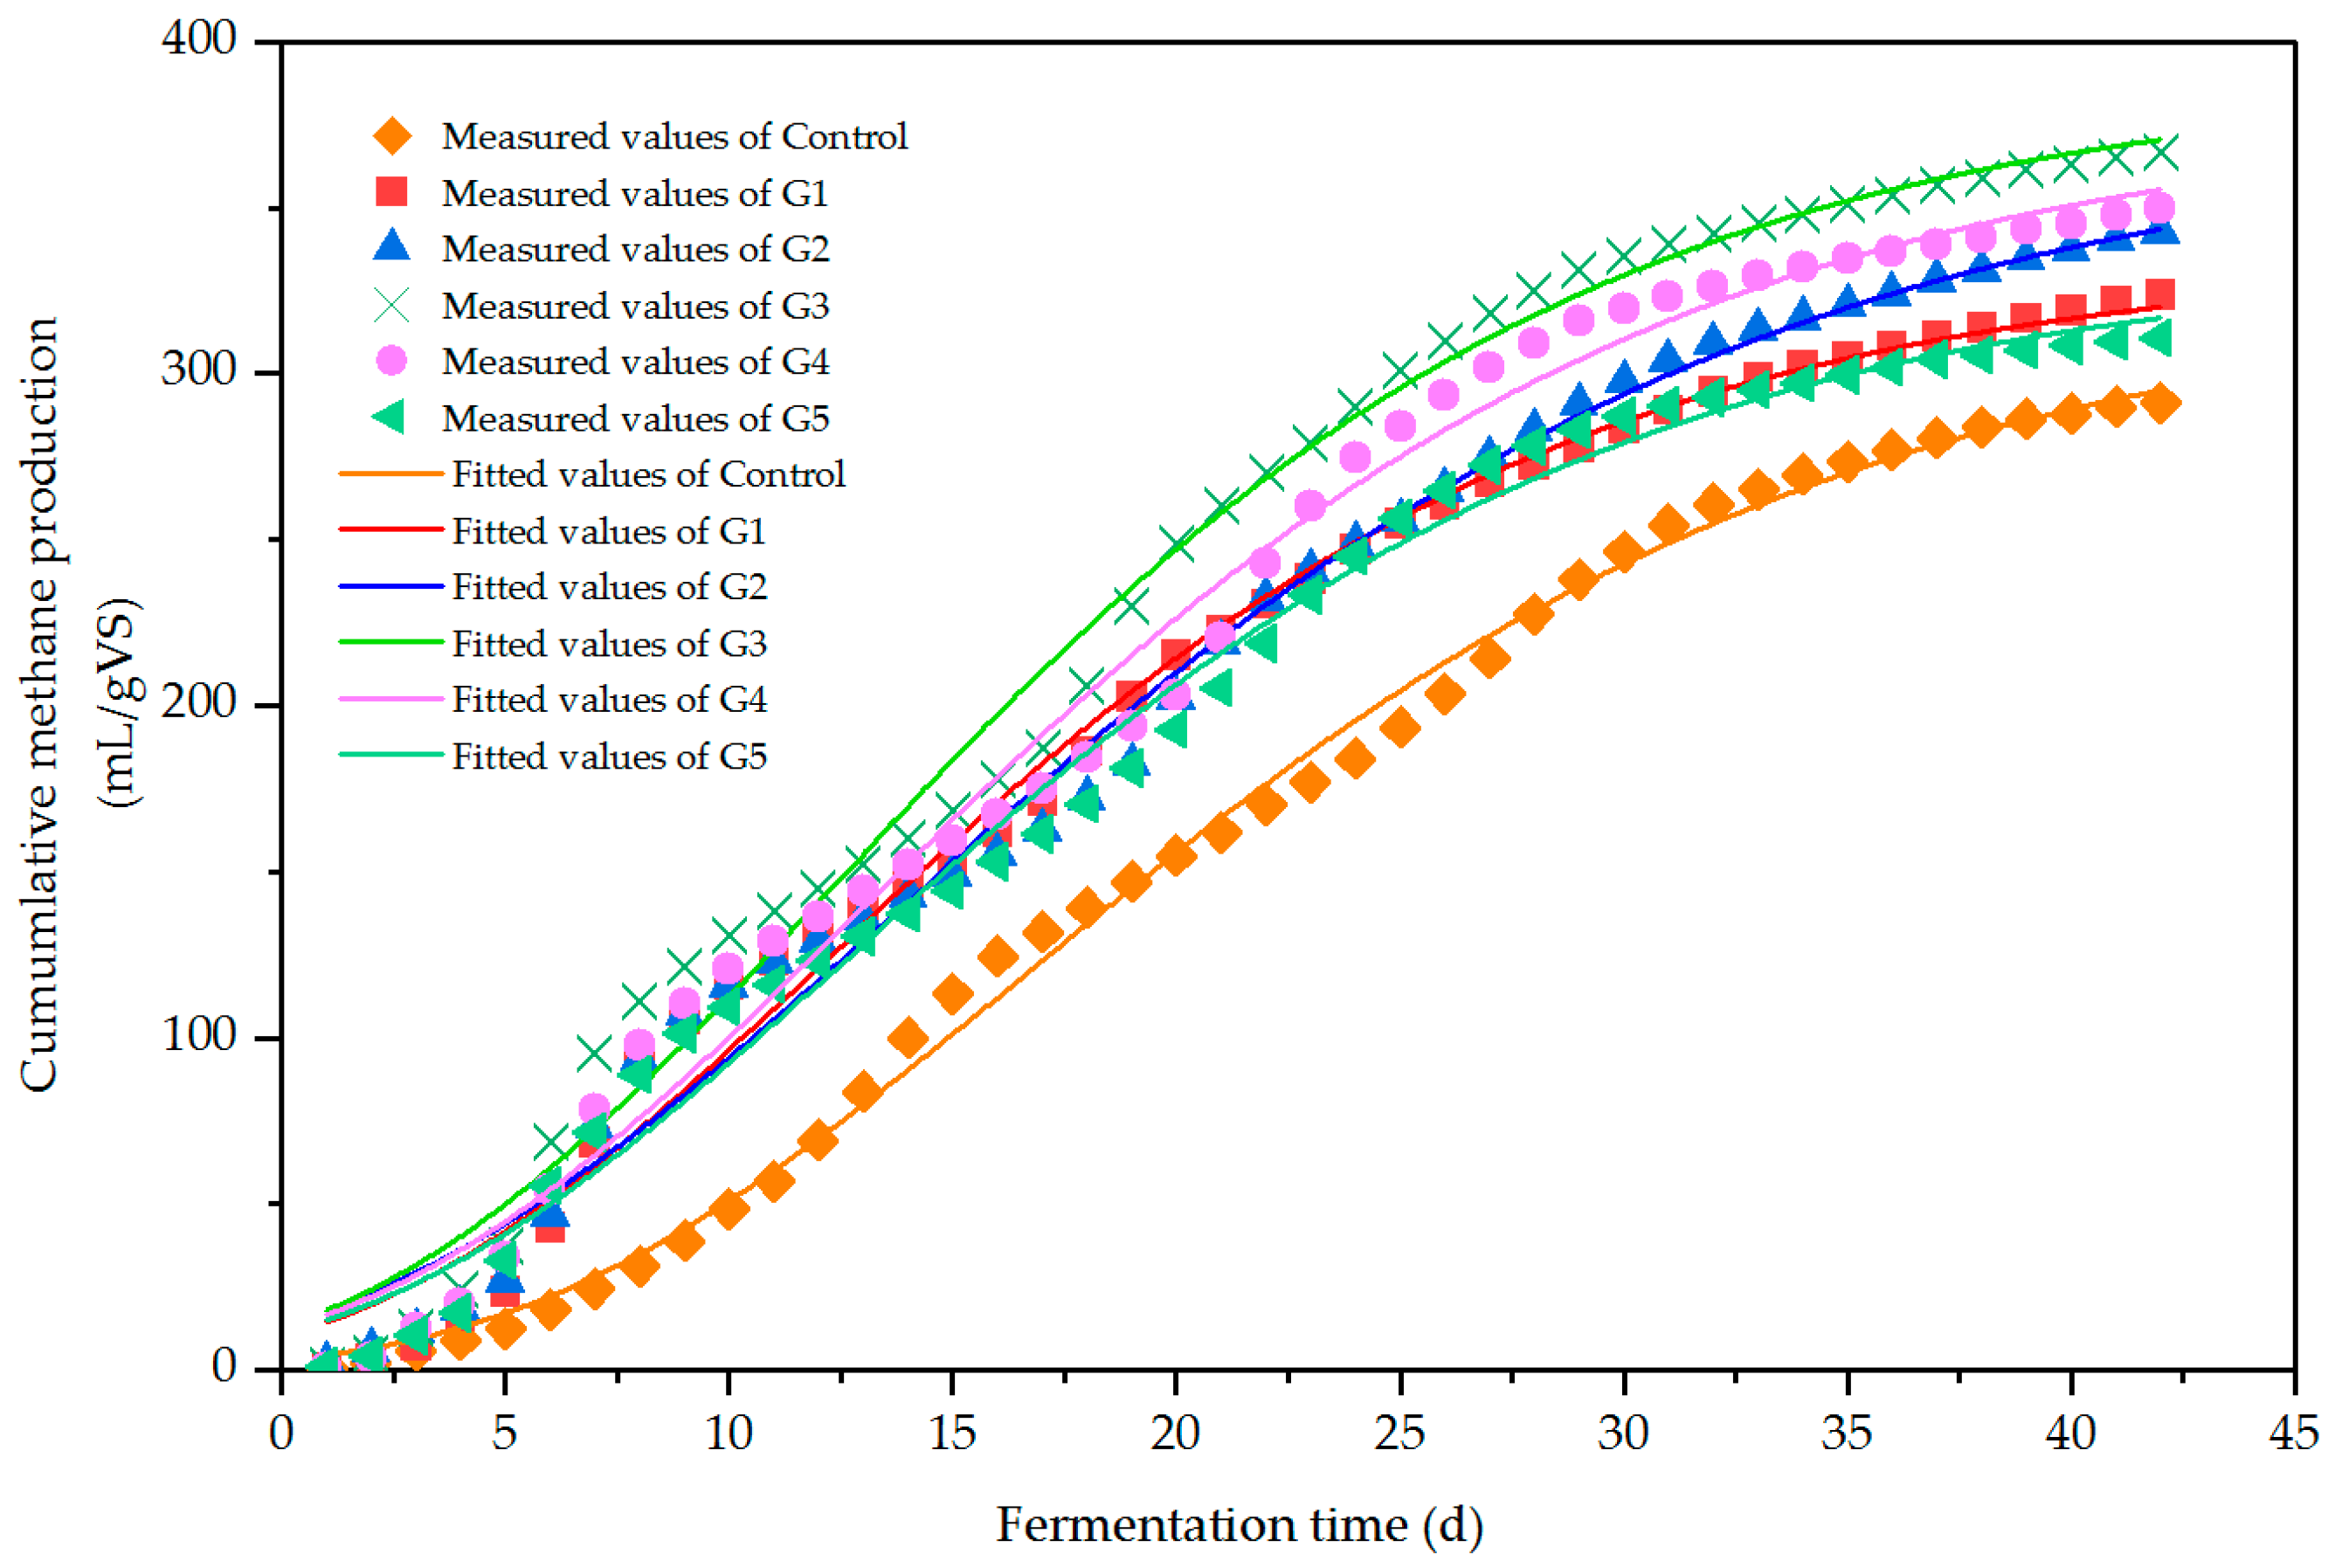
The modified Gompertz model was used to simulate cumulative methane production (Figure 7), with regression coefficients ranging from 0.989 to 0.997, indicating an excellent fit to the experimental data (Table 4). As shown in Table 4, biochar addition reduced the lag phase and increased the maximum methane production rate. The highest production rate (14.39 mL/(g VS·d)) was observed in G3, followed by G4, G1, G5, G2, and the control (13.22, 12.64, 12.03, 11.94, and 11.04 mL/(g VS·d), respectively). Similarly, G3 had the shortest lag phase of 2.22 days, followed by G2 (2.26 days), G5 (2.36 days), G1 (2.41 days), G4 (2.47 days), and the control (5.86 days). These results highlight that an optimal biochar addition (G3) accelerates methanogen activity and enhances methane production, while excessive or insufficient biochar reduces the benefit. The lag phase length is associated with methanogen activity, which is significantly influenced by the ammonia concentration in the digester [37]. Yu et al. [38] found that treatments with high ammonia exhibited a longer lag phase compared to those with low ammonia. Akindele et al. [39] also demonstrated that the higher the ammonia concentration, the longer the lag phase time, which is consistent with the results of this study. As mentioned in the previous section, digesters with biochar addition showed lower ammonium concentrations than the control, which corresponded to the shorter lag phase duration.
It can be inferred from the above results that biochar can alleviate ammonium inhibition, shorten the lag phase duration, and enhance the methane production. The optimum biochar addition ratio was 9%, and excessive biochar addition did not provide further benefits in methane production enhancement.

3.2. Continuous Experiment

3.2.1. Methane Production

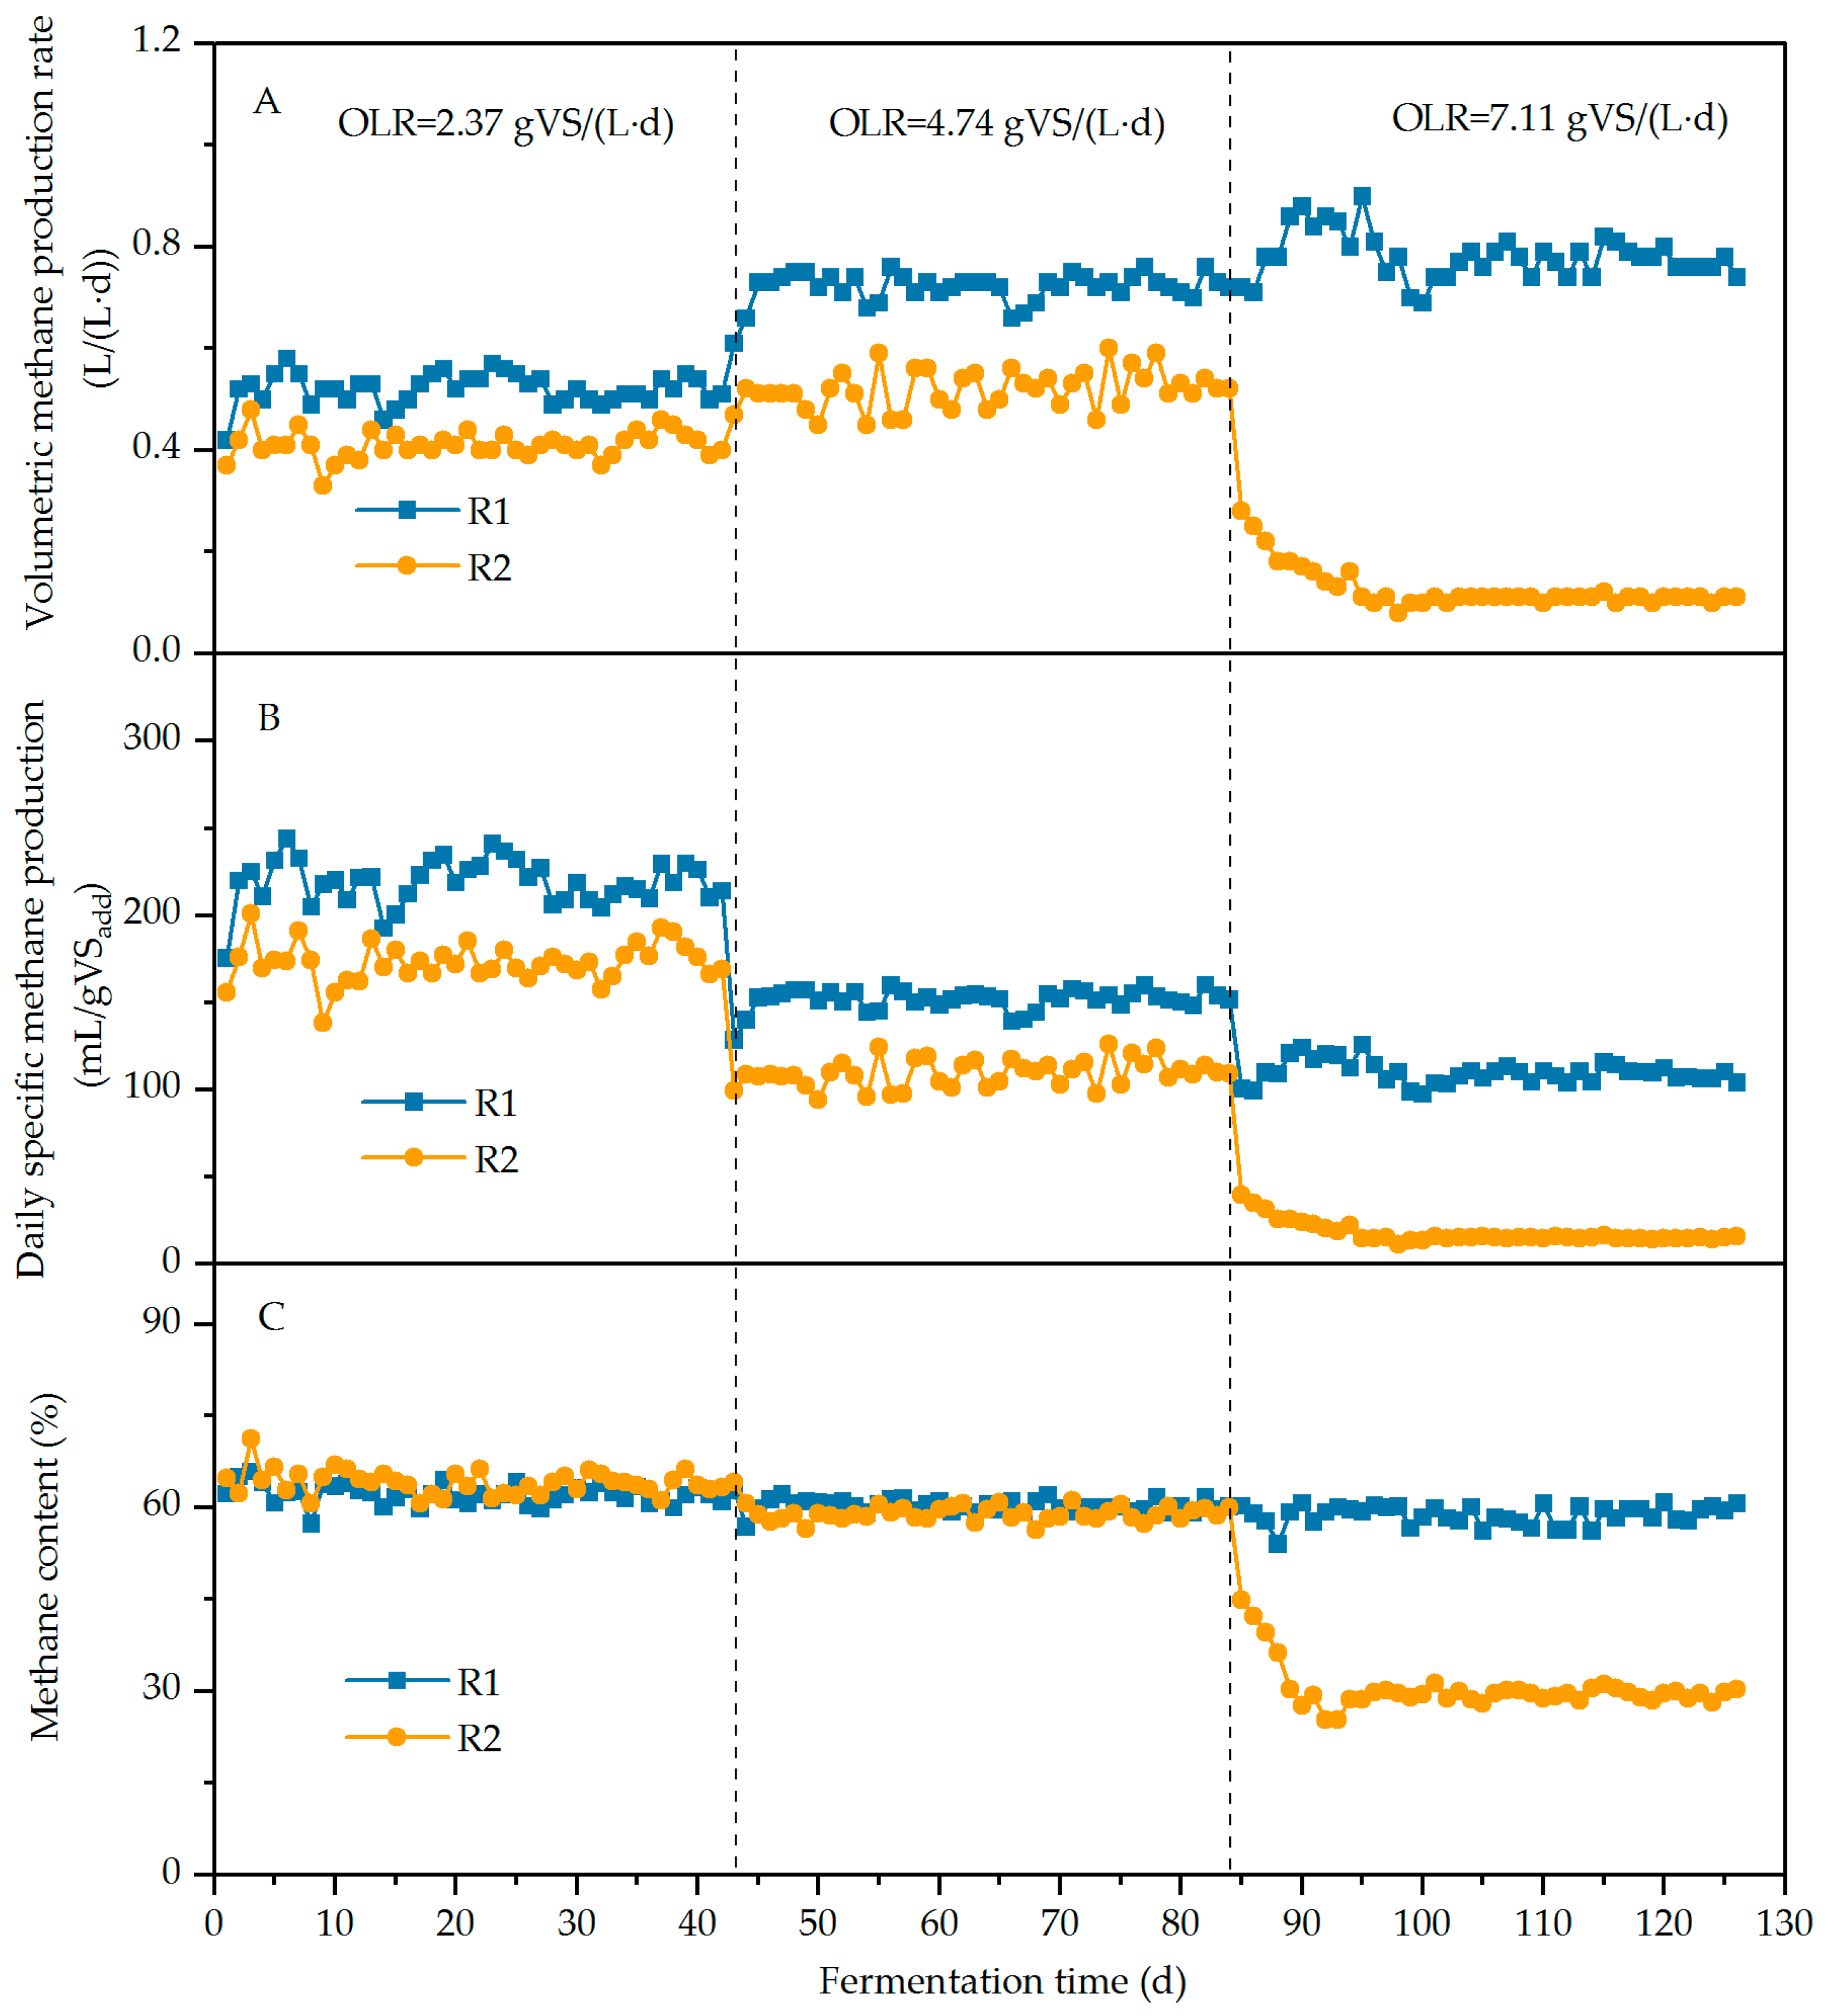
As shown in Figure 8A,B, biochar enhanced both the volumetric methane production rate (VMPR) and daily specific methane production (DSMP) of chicken manure (CM) during anaerobic digestion. The enhancement efficiency increased with rising organic loading rates (OLRs). In R1, VMPR increased with the OLR, reaching average values of 0.52, 0.72, and 0.78 L/(L·d) at OLRs of 2.37, 4.47, and 7.11 g VS/(L·d), respectively. In R2, VMPR initially increased from 0.41 to 0.52 L/(L·d) as the OLR rose from 2.37 to 4.74 g VS/(L·d), but then sharply decreased to 0.13 L/(L·d) at 7.11 g VS/(L·d).
An increase in the OLR caused a decline in DSMP for both reactors. The highest DSMP was observed in R1 at an OLR of 2.37 g VS/(L·d), with an average of 218.90 mL/g VSadd, compared to 172.84 mL/g VSadd in R2. When the OLR increased to 4.74 g VS/(L·d), DSMP decreased in both reactors to 151.89 and 109.39 mL/g VSadd for R1 and R2, respectively. At 7.11 g VS/(L·d), DSMP in R2 dropped sharply to 17.63 mL/g VSadd, representing reductions of 89.80% and 83.88% relative to 2.37 and 4.74 g VS/(L·d), respectively. In contrast, DSMP in R1 showed a more stable decline, averaging 109.83 mL/g VSadd, corresponding to reductions of 49.83% and 27.69%.
Overall, biochar addition increased VMPR and DSMP by 21.15%, 27.78%, and 83.33% compared to the control at OLRs of 2.37, 4.74, and 7.11 g VS/(L·d), respectively. Figure 8C showed that methane content in R2 at 7.11 g VS/(L·d) dropped sharply to 25.28–44.80% (average: 30.28%), indicating system failure [40]. In contrast, methane content in R1 remained relatively high, ranging from 54.05% to 60.84% (average: 58.75%), demonstrating better process stability with biochar addition.
It should be noted that, consistent with common practice in laboratory-scale continuous experiment studies [3,4,21,22,23], only one long-term trial was carried out under each operating condition in this study. Although parallel replicates were not performed, the stable performance achieved during the 42-day operation supports the reliability of the results, and the findings are further supported by our preliminary batch experiments conducted in triplicate.

3.2.2. TAN and FAN

The variations in TAN and FAN are shown in Figure 9. TAN increased with rising OLRs in both R1 and R2, but biochar addition reduced TAN concentrations. In R1, the average TAN values were 2456.41, 3215.29, and 4626.77 mg/L at OLRs of 2.37, 4.74, and 7.11 g VS/(L·d), respectively, which were 16.33%, 21.89%, and 17.91% lower than in R2. A rapid TAN increase was observed in R2 at 7.11 g VS/(L·d), rising from 4846.96 mg/L (day 91) to 7088.13 mg/L (day 126), indicating ammonium accumulation. In contrast, TAN in R1 increased moderately and remained relatively low, showing that biochar effectively mitigated TAN accumulation under high OLRs.
FAN in R1 also increased with the OLR, with average values of 93.41, 156.35, and 225.71 mg/L at 2.37, 4.74, and 7.11 g VS/(L·d), respectively. In R2, FAN increased from 185.84 to 355.74 mg/L as the OLR rose from 2.37 to 4.74 g VS/(L·d), but then decreased when the OLR further increased to 7.11 g VS/(L·d). According to Equation (5), this decrease in FAN was attributed to the reduction in pH (Figure 10A). Although a low level of FAN (37.95–198.74 mg/L) was observed in R2 at an OLR of 7.11 g VS/(L·d), system failure still occurred. This was because ammonia accumulation inhibited the activity of the methanogen to consume volatile fatty acids (VFAs), which led to VFA accumulation and a subsequent pH reduction (Figure 10A,B). These interactions between pH, FAN, and VFAs shifted the AD system into an “inhibited steady-state” [41,42]. In this state, FAN remained within an acceptable range, but methane production was at a lower level.
The continuous experiment further confirmed that the application of biochar alleviated ammonium inhibition, thereby promoting greater methane production and enhancing the organic loading capacity of CM in AD.

3.2.3. pH, VFAs, and Total Alkalinity (TA)

At an OLR of 2.37 g VS/(L·d), VFAs were maintained at relatively low levels, ranging from 0.84 to 1.27 g/L in R1 and 1.61 to 2.80 g/L in R2 (Figure 10B), indicating a dynamic equilibrium between acidification and methanogenesis [22]. As the OLR increased, VFA concentrations rose. At 4.74 g VS/(L·d), VFAs in R2 increased sharply from 3.49 g/L (day 49) to 15.33 g/L (day 84), whereas R1 exhibited a more moderate variation (2.90–6.85 g/L). When the OLR further increased to 7.11 g VS/(L·d), VFAs in R2 accumulated dramatically, from 17.66 g/L (day 91) to 35.94 g/L (day 126), indicating process instability. In contrast, VFAs in R1 remained comparatively low (7.96–16.37 g/L), demonstrating more stable digestion with biochar addition.
Correspondingly, the pH in R2 increased from 7.77 to 7.92 as the OLR rose from 2.37 to 4.74 g VS/(L·d), due to the buffering capacity provided by total alkalinity (TA) (Figure 10C). However, at 7.11 g VS/(L·d), the pH in R2 declined from 7.58 (day 91) to 6.68 (day 126), reflecting VFA accumulation and disruption of the acidity–alkalinity balance. In contrast, the pH in R1 remained relatively stable throughout the AD process, fluctuating between 7.43 and 7.73.
TA in R1 had ranges of 11.25–13.37, 15.87–25.65, and 27.14–45.52 g/L at OLRs of 2.37, 4.74, and 7.11 g VS/(L·d), respectively, compared to 9.90–11.60, 13.07–21.59, and 25.64–33.81 g/L in R2. Biochar increased TA by 16.59%, 11.50%, and 20.67% compared to the control at the respective OLRs, which was reflected in lower VFAs/TA ratios in R1 (Figure 10D).
The VFAs/TA ratio serves as a key indicator for evaluating the stability of the AD system [35]. It is generally recognized that an AD system is considered stable when the VFAs/TA ratio is below 0.40, exhibits signs of instability when the ratio is in the range of 0.40–0.80, and is completely inhibited when the ratio is beyond 0.80 [35,41,43]. The VFAs/TA ratio increased as the OLR increased in both R1 and R2. In R2, the ratio ranged from 0.15 to 0.26 at an OLR of 2.37 g VS/(L·d) and increased to 0.27–0.73 at 4.74 g VS/(L·d), indicating that some instability occurred. At an OLR of 7.11 g VS/(L·d), the ratio further increased to 0.69–0.97, suggesting the complete inhibition of the AD system. In contrast, the VFAs/TA ratio in R1 remained within the range of 0.07–0.36 throughout the entire process, demonstrating the stability of the system. Consequently, it can be inferred that adequate alkalinity and improvement in VFA degradation attributed to biochar addition resulted in a stable pH and a lower VFAs/TA ratio in the AD system [15,44]. This improved stability was directly associated with the higher methane production observed (Figure 8).
These results highlight that biochar effectively stabilizes the AD system by mitigating VFA accumulation and maintaining pH and alkalinity balance under high-OLR conditions.

3.2.4. Microbial Community Analysis

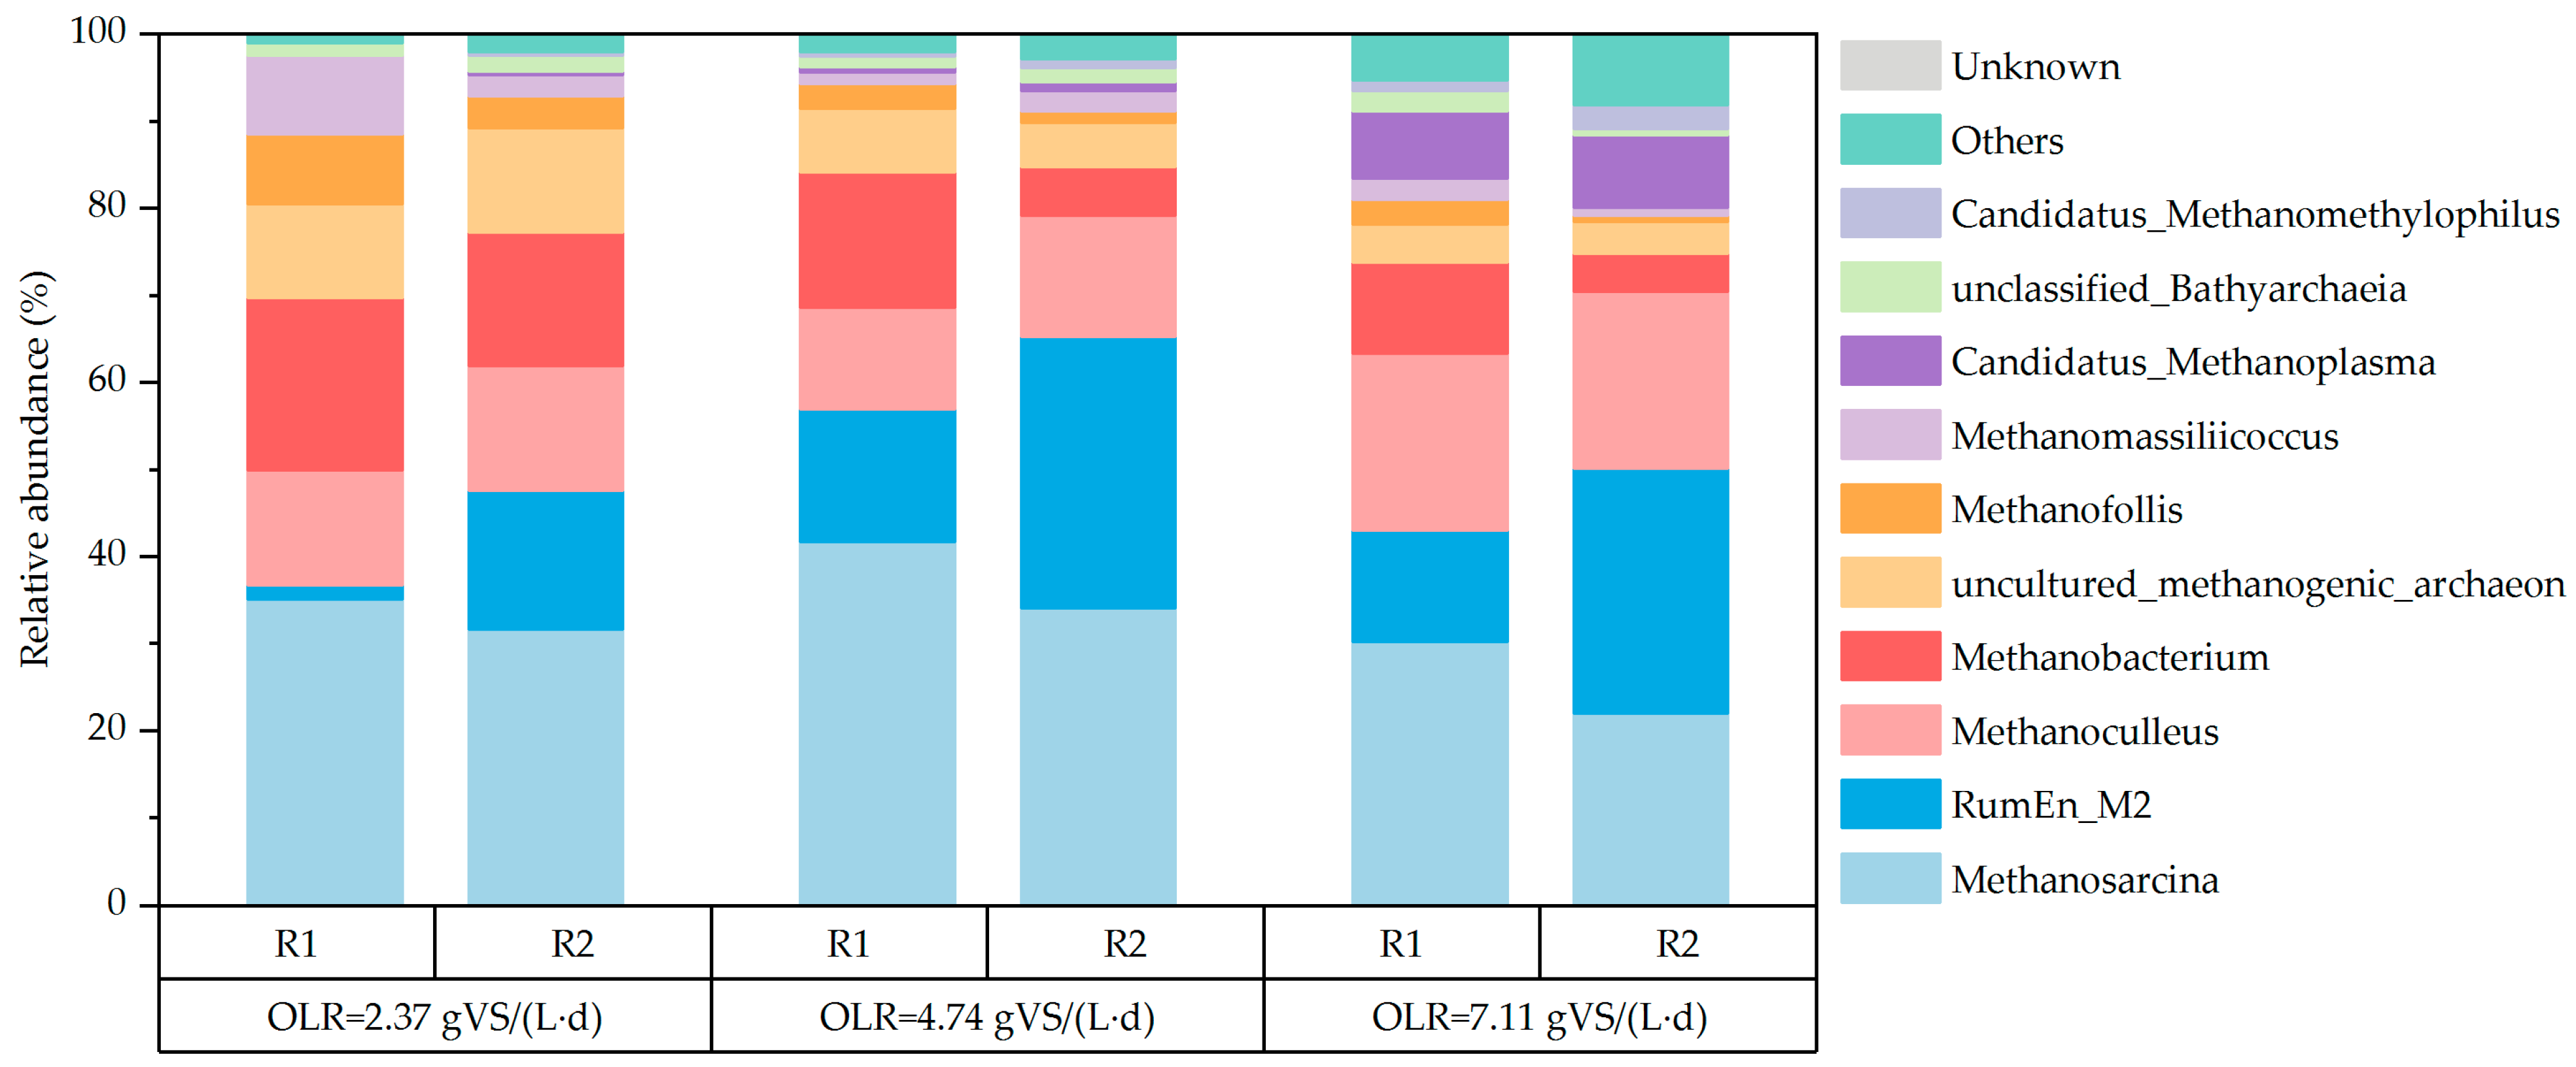
Methanogens are archaea that are generally considered to be more sensitive to ammonium and VFA inhibition compared to hydrolytic bacteria [45,46]. Figure 11 presents the compositions of the methanogen community (at the genus level). The dominant methanogens included Methanosarcina, Methanoculleus, Methanobacterium, RumEn_M2, and uncultured_methanogenic_archaeon. The relative abundances of RumEn_M2 in R2 were 16.02%, 31.18%, and 28.13% at OLRs of 2.37, 4.74, and 7.11 g VS/(L·d), respectively, compared to 1.67%, 15.28%, and 12.74% in R1. Biochar significantly reduced RumEn_M2 abundance in R1 by 54.73–89.56% compared to R2 (p < 0.05). RumEn_M2 belongs to the seventh order of methanogens (Methanomassiliicoccales) and has been identified as a methylotrophic methanogen that thrives only on methanol and methylamines [47,48,49]. It is typically enriched in AD systems where methylamines are the main substrates or where acetoclastic and hydrogenotrophic pathways are inhibited [50,51]. In conventional anaerobic fermentation systems, methanol is typically not produced in quantities comparable to those of acetate, CO2, and H2, resulting in a relatively minor contribution to methane production via methylotrophic methanogens [52]. Thus, the reduction in the abundance of RumEn_M2 reflected that biochar alleviated the inhibition on acetoclastic and hydrogenotrophic pathway of methanogen, contributing to improved methane production. It was noted that, when the OLR was elevated from 4.74 to 7.11 g VS/(L·d), the dominant methanogen in R2 shifted from Methanosarcina to RumEn_M2. This shift indicated the inhibition of both acetoclastic and hydrogenotrophic methanogenic pathways in the system and correlates with the observed failure of the AD system as discussed in the previous section.
Biochar did not induce significant changes in Methanosarcina, Methanoculleus, Methanobacterium, and uncultured_methanogenic_archaeon (p > 0.05). Nevertheless, biochar appeared a improving effect on Methanosarcina growth at each OLR. Biochar amendment in R1 increased the abundance of Methanosarcina by 9.82–27.34% relative to R2 across different OLRs. Methanosarcina can produce methane utilizing diverse substrates, including acetate, H2/CO2, and methylamine, via the acetoclastic and hydrogenotrophic pathways [53,54]. Moreover, Methanosarcina has been shown to be able to perform direct interspecies electron transfer (DIET) [55]. Thus, the improvement in biochar on Methanosarcina likely enhanced acetate degradation, balanced acidification, and enhanced DIET contributing to improved methane production, even though the relative abundance did not show statistically significant differences.

4. Further Prospects

The positive effects of biochar addition observed in our 10 L laboratory-scale continuous stirred-tank reactor (CSTR) experiments suggest promising potential for application in larger-scale anaerobic digestion systems. Previous pilot- and bench-scale studies have demonstrated that biochar can enhance methane yields, improve process stability, and mitigate inhibition under semi-continuous operation, confirming both the technical and economic feasibility of this approach [9,56]. These findings support the scalability of our laboratory-scale results and indicate that biochar-assisted anaerobic digestion has strong potential for implementation in pilot- and industrial-scale reactors.
When scaling up, factors such as mixing efficiency, mass transfer, biochar particle distribution, and organic loading rate may influence reactor performance and need to be carefully optimized. Additionally, the economic and operational feasibility of large-scale applications should be evaluated, including biochar sourcing, cost–benefit analysis, and integration with existing infrastructure. Nevertheless, the consistent positive effects observed in both batch and continuous laboratory-scale experiments, together with supporting evidence from larger-scale studies, provide a strong basis for considering biochar addition as a practical strategy for enhancing biogas production and process stability in real-world anaerobic digestion systems.

5. Conclusions

This study demonstrated that biochar significantly enhanced the performance of the anaerobic digestion (AD) of chicken manure (CM). The results of the batch experiment indicated that biochar reduced total ammonium nitrogen, shortened the lag phase duration, and increased methane production. The optimum biochar addition ratio was determined to be 9%, and excessive biochar addition had no further positive effect on methane production enhancement. Continuous experiment further confirmed that biochar mitigated the inhibition of ammonium and volatile fatty acids, thereby enhancing system stability and methane production efficiency. Moreover, with biochar application, stable operation was maintained at a higher organic loading rate of 7.11 g volatile solids (VS)/(L·d), while the control digester failed, indicating that biochar improved the organic loading capacity. The analysis of methanogen community composition demonstrated that biochar increased the abundance of acetoclastic/hydrogenotrophic Methanosarcina and reduced the abundance of methylotrophic RumEn_M2, thereby enhancing the AD performance of CM.

Author Contributions

Conceptualization, J.Z. and Y.L.; methodology, J.Z., Q.M. and X.Z. (Xiaoyuan Zhang); formal analysis, Y.T. and X.Z. (Xiaochen Zhang); investigation, Y.L. and X.Z. (Xiaoyuan Zhang); writing—original and draft preparation, J.Z., Q.M. and X.Z. (Xiaochen Zhang); writing—review and editing, J.Z. and X.Z. (Xiaoyuan Zhang); supervision, J.Z. and Y.L. All authors have read and agreed to the published version of the manuscript.

Funding

This research was funded by grants from the Science and Technology Innovation Enhancement Project of Shanxi Agricultural University, Grant No. CXGC202411; the Central Guidance on Local Science and Technology Development Fund of Shanxi Province, Grant No. YDZJSX20231B008; the National Key Research and Development Plan, Grant No. 2021YFD1901105; and the Major Science and Technology Project “Unveiled” in Shanxi Province, Grant No. 202101140601026.

Institutional Review Board Statement

Not applicable.

Informed Consent Statement

Not applicable.

Data Availability Statement

The data presented in this study are available upon request from the corresponding author.

Conflicts of Interest

The authors declare no conflicts of interest.

References

  1. Ngo, T.; Khudur, L.S.; Krohn, C.; Hassan, S.; Jansriphibul, K.; Hakeem, I.G.; Shah, K.; Surapaneni, A.; Ball, A.S. Wood biochar enhances methanogenesis in the anaerobic digestion of chicken manure under ammonia inhibition conditions. Heliyon 2023, 9, e21100. [Google Scholar] [CrossRef] [PubMed]
  2. Niu, Q.; Qiao, W.; Qiang, H.; Hojo, T.; Li, Y. Mesophilic methane fermentation of chicken manure at a wide range of ammonia concentration: Stability, inhibition and recovery. Bioresour. Technol. 2013, 137, 358–367. [Google Scholar] [CrossRef]
  3. Nie, H.; Jacobi, H.F.; Strach, K.; Xu, C.; Zhou, H.; Liebetrau, J. Mono-fermentation of chicken manure: Ammonia inhibition and recirculation of the digestate. Bioresour. Technol. 2015, 178, 238–246. [Google Scholar] [CrossRef]
  4. Fazzino, F.; Frontera, P.; Malara, A.; Pedullà, A.; Calabrò, P.S. Effects of carbon-based conductive materials on semi-continuous anaerobic co-digestion of organic fraction of municipal solid waste and waste activated sludge. Chemosphere 2024, 357, 142077. [Google Scholar] [CrossRef]
  5. Duan, S.; He, J.; Xin, X.; Li, L.; Zou, X.; Zhong, Y.; Zhang, J.; Cui, X. Characteristics of digested sludge-derived biochar for promoting methane production during anaerobic digestion of waste activated sludge. Bioresour. Technol. 2023, 384, 129245. [Google Scholar] [CrossRef]
  6. Jin, H.; Yang, L.; Ren, Y.; Tang, C.; Zhou, A.; Liu, W.; Li, Z.; Wang, A.; He, Z. Insights into the roles and mechanisms of a green-prepared magnetic biochar in anaerobic digestion of waste activated sludge. Sci. Total Environ. 2023, 896, 165170. [Google Scholar] [CrossRef]
  7. Casabella-Font, O.; Zahedi, S.; Gros, M.; Balcazar, J.; Radjenovic, J.; Pijuan, M. Graphene oxide addition to anaerobic digestion of waste activated sludge: Impact on methane production and removal of emerging contaminants. Environ. Pollut. 2023, 324, 121343. [Google Scholar] [CrossRef]
  8. Kalantzis, D.; Daskaloudis, I.; Lacoere, T.; Stasinakis, A.S.; Lekkas, D.F.; VriezeJo, D.; Fountoulakis, M.S. Granular activated carbon stimulates biogas production in pilot-scale anaerobic digester treating agro-industrial wastewater. Bioresour. Technol. 2023, 376, 128908. [Google Scholar] [CrossRef]
  9. Zhang, L.; Lim, E.; Loh, K.; Ok, Y.; Lee, J.; Shen, Y.; Wang, C.; Dai, Y.; Tong, Y. Biochar enhanced thermophilic anaerobic digestion of food waste: Focusing on biochar particle size, microbial community analysis and pilot-scale application. Energy Convers. Manag. 2020, 209, 112654. [Google Scholar] [CrossRef]
  10. Nie, W.; He, S.; Lin, Y.; Cheng, J.; Yang, C. Functional biochar in enhanced anaerobic digesiton: Synthesis, performances, and mechanisms. Sci. Total Environ. 2024, 906, 167681. [Google Scholar] [CrossRef]
  11. Chiappero, M.; Norouzi, O.; Hu, M.; Demichelis, F.; Berruti, F.; Di Maria, F.; Mašek, O.; Fiore, S. Review of biochar role as additive in anaerobic digestion processes. Renew. Sust. Energy Rev. 2020, 131, 110037. [Google Scholar] [CrossRef]
  12. Pan, J.; Ma, J.; Liu, X.; Zhai, L.; Ouyang, X.; Liu, H. Effects of different types of biochar on the anaerobic digestion of chicken manure. Bioresour. Technol. 2019, 275, 258–265. [Google Scholar] [CrossRef]
  13. Di, L.; Wang, F.; Li, S.; Wang, H.; Zhang, D.; Yi, W.; Shen, X. Influence of nano-Fe3O4 biochar on the methanation pathway during anaerobic digestion of chicken manure. Bioresour. Technol. 2023, 377, 128979. [Google Scholar] [CrossRef] [PubMed]
  14. Ngo, T.; Khudur, L.; Hassan, S.; Jansriphibul, K.; Ball, A.S. Enhancing microbial viability with biochar for increased methane production during the anaerobic digestion of chicken manure. Fuel 2024, 368, 131603. [Google Scholar] [CrossRef]
  15. Sunyoto, N.; Zhu, M.; Zhang, Z.; Zhang, D. Effect of biochar addition on hydrogen and methane production in two-phase anaerobic digestion of aqueous carbohydrates food waste. Bioresour. Technol. 2016, 219, 29–36. [Google Scholar] [CrossRef] [PubMed]
  16. Zhou, N.; Wang, T.; Chen, S.; Hu, Q.; Cheng, X.; Sun, D.; Vupputuri, S.; Qiu, B.; Liu, H. Conductive polyaniline hydrogel enhanced methane production from anaerobic wastewater treatment. J. Colloid Interface Sci. 2021, 581, 314–322. [Google Scholar] [CrossRef]
  17. Shen, Y.; Linville, J.; Urgun-Demirtas, M.; Schoene, R.; Snyder, S. Producing pipeline-quality biomethane via anaerobic digestion of sludge amended with corn stover biochar with in-situ CO2 removal. Appl. Energy 2015, 158, 300–309. [Google Scholar] [CrossRef]
  18. Zhang, X. Effect and Mechanism of Different Organic Amendments on Soil Aggregates and Splash Erosion. Ph.D. Thesis, Northwest A&F University, Xianyang, China, 2023. [Google Scholar]
  19. Zhu, J.; Zhang, J.; Tang, Y.; Zhang, X.; Shi, X.; Wang, X.; Li, Y. Enhancement of Fermentation Performance in the Anaerobic Co-Digestion of Chicken Manure and Corn Straw under Biogas Slurry Reflux via Air Stripping of the Digestate. Agronomy 2024, 14, 1794. [Google Scholar] [CrossRef]
  20. Córdoba, V.; Fernández, M.; Santalla, E. The effect of substrate/inoculum ratio on the kinetics of methane production in swine wastewater anaerobic digestion. Environ. Sci. Pollut. Res. 2018, 25, 21308–21317. [Google Scholar] [CrossRef]
  21. Shao, Z.; Chen, H.; Zhao, Z.; Yang, Z.; Qiu, L.; Guo, X. Combined effects of liquid digestate recirculation and biochar on methane yield, enzyme activity, and microbial community during semi-continuous anaerobic digestion. Bioresour. Technol. 2022, 364, 128042. [Google Scholar] [CrossRef]
  22. Li, Y.; Zhao, J.; Achinas, S.; Zhang, Z.; Krooneman, J.; Willem, G. The biomethanation of cow manure in a continuous anaerobic digester can be boosted via a bioaugmentation culture containing Bathyarchaeota. Sci. Total Environ. 2020, 745, 141042. [Google Scholar] [CrossRef]
  23. Chen, R.; Li, Z.; Feng, J.; Zhao, L.; Yu, J. Effects of digestate recirculation ratios on biogas production and methane yield of continuous dry anaerobic digestion. Bioresour. Technol. 2020, 316, 123963. [Google Scholar] [CrossRef] [PubMed]
  24. Li, Y.; Zhu, J.; Tang, Y.; Shi, X.; Anwar, S.; Wang, J.; Gao, L.; Zhang, J. Impact of varying mass concentrations of ammonia nitrogen on biogas production and system stability of anaerobic fermentation. Agriculture 2023, 13, 1645. [Google Scholar] [CrossRef]
  25. Su, Y. Detection Technology of Biogas Fermentation; Metallurgical Industry Press: Beijing, China, 2011. [Google Scholar]
  26. APHA. Standard Methods for the Examination of Water and Wastewater, 21st ed.; American Public Health Association and Water Environment Federation: Washington, DC, USA, 2005. [Google Scholar]
  27. Jiang, Y.; McAdam, E.; Zhang, Y.; Heaven, S.; Banks, C.; Longhurst, P. Ammonia inhibition and toxicity in anaerobic digestion: A critical review. J. Water Process. Eng. 2019, 32, 100899. [Google Scholar] [CrossRef]
  28. Yellezuome, D.; Zhu, X.; Wang, Z.; Liu, R. Mitigation of ammonia inhibition in anaerobic digestion of nitrogen-rich substrates for biogas production by ammonia stripping: A review. Renew. Sustain. Energy Rev. 2022, 157, 112043. [Google Scholar] [CrossRef]
  29. Fernandes, T.V.; Keesman, K.J.; Zeeman, G.; Van Lier, J.B. Effect of ammonia on the anaerobic hydrolysis of cellulose and tributyrin. Biomass Bioenergy 2012, 47, 316–323. [Google Scholar] [CrossRef]
  30. Ho, L.; Ho, G. Mitigating ammonia inhibition of thermophilic anaerobic treatment of digested piggery wastewater: Use of pH reduction, zeolite, biomass and humic acid. Water Res. 2012, 46, 4339–4350. [Google Scholar] [CrossRef]
  31. Niu, Q.; Qiao, W.; Qiang, H.; Li, Y. Microbial community shifts and biogas conversion computation during steady, inhibited and recovered stages of thermophilic methane fermentation on chicken manure with a wide variation of ammonia. Bioresour. Technol. 2013, 146, 223–233. [Google Scholar] [CrossRef]
  32. Wu, S.; Ni, P.; Li, J.; Sun, H.; Wang, Y.; Luo, H.; Dach, J.; Dong, R. Integrated approach to sustain biogas production in anaerobic digestion of chicken manure under recycled utilization of liquid digestate: Dynamics of ammonium accumulation and mitigation control. Bioresour. Technol. 2016, 205, 75–81. [Google Scholar] [CrossRef]
  33. Fagbohungbe, M.; Herbert, B.; Hurst, L.; Li, H.; Usmani, S.; Semple, K. Impact of biochar on the anaerobic digestion of citrus peel waste. Bioresour. Technol. 2016, 216, 142–149. [Google Scholar] [CrossRef]
  34. Pan, J.; Ma, J.; Qiu, L.; Guo, X.; Gao, T. The performance of biochar-mediated anaerobic digestion of chicken manure. China Environ. Sci. 2016, 36, 2716–2721. [Google Scholar]
  35. Kizito, S.; Jiagwe, J.; Mdondo, S.W.; Nagawa, C.B.; Bah, H.; Tumutegyereize, P. Synergetic effects of biochar addition on mesophilic and high total solids anaerobic digestion of chicken manure. J. Environ. Manag. 2022, 315, 115192. [Google Scholar] [CrossRef]
  36. Wang, G.; Li, Q.; Gao, X.; Wang, X. Synergetic promotion of syntrophic methane production from anaerobic digestion of complex organic wastes by biochar: Performance and associated mechanisms. Bioresour. Technol. 2018, 250, 812–820. [Google Scholar] [CrossRef] [PubMed]
  37. Ye, W.; Li, L.; Tang, Z.; Peng, Y.; Yang, P.; Peng, X.; Zhen, F. Biochar and modified magnetic biochar enhanced anaerobic digestion of swine wastewater under ammonia stress: Performance and microbial dynamics. J. Environ. Chem. Eng. 2024, 12, 111969. [Google Scholar] [CrossRef]
  38. Yu, D.; Zhang, J.; Chulu, B.; Yang, M.; Nopens, I.; Wei, Y. Ammonia stress decreased biomarker genes of acetoclastic methanogenesis and second peak of production rates during anaerobic digestion of swine manure. Bioresour. Technol. 2020, 317, 124012. [Google Scholar] [CrossRef] [PubMed]
  39. Akindele, A.A.; Sartaj, M. The toxicity effects of ammonia on anaerobic digestion of organic fraction of municipal solid waste. Waste Manag. 2018, 71, 757–766. [Google Scholar] [CrossRef]
  40. Chen, Y.; Cheng, J.; Creamer, K. Inhibition of anaerobic digestion process: A review. Bioresour. Technol. 2008, 99, 4044–4064. [Google Scholar] [CrossRef]
  41. Li, D.; Liu, S.; Mi, L.; Li, Z.; Yuan, Y.; Yan, Z.; Liu, X. Effects of feedstock ratio and organic loading rate on the anaerobic mesophilic co-digestion of rice straw and cow manure. Bioresour. Technol. 2015, 189, 319–326. [Google Scholar] [CrossRef]
  42. Angelidaki, I.; Ahring, B.K. Thermophilic anaerobic-digestion of livestock waste-the effect of ammonia. Appl. Microbiol. Biotechnol. 1993, 38, 560–564. [Google Scholar] [CrossRef]
  43. Li, Y.; Zhang, R.; Liu, X.; Chen, C.; Xiao, X.; Feng, L.; He, Y.; Liu, G. Evaluating methane production from anaerobic mono- and co-digestion of kitchen waste, corn stover, and chicken manure. Energy Fuels 2013, 27, 2085–2091. [Google Scholar] [CrossRef]
  44. AJohnravindar, D.; Wong, J.W.C.; Chakraboty, D.; Bodedla, G.; Kaur, G. Food waste and sewage sludge co-digestion amended with different biochars: VFA kinetics, methane yield and digestate quality assessment. J. Environ. Manag. 2021, 290, 112457. [Google Scholar] [CrossRef]
  45. Schnürer, A.; Nordberg, Å. Ammonia, a selective agent for methane production by syntrophic acetate oxidation at mesophilic temperature. Water Sci. Technol. 2008, 57, 735–740. [Google Scholar] [CrossRef]
  46. Chen, L.; Li, D.; Wen, H.; Feng, L.; Huang, Y.; Liu, X. Screening of early warming indicators of instability in anaerobic digestion of vegetable waste under mesophilic condition. Trans. Chin. Soc. Agric. Eng. 2017, 33, 225–230. [Google Scholar]
  47. Shi, J.; Zhang, G.; Zhang, H.; Qiao, F.; Fan, J.; Bai, D.; Xu, G. Effect of Thermal Hydrolysis Pretreatment on Anaerobic Digestion of Protein-Rich Biowaste: Process Performance and Microbial Community Structures Shift. Front. Environ. Sci. 2022, 9, 805078. [Google Scholar] [CrossRef]
  48. Faisal, S.; Almutairi, A.; Saif, I.; Ting, L.; Wang, Q.; Mustafa, A.; Ebaid, R. Seaweed valorization as anaerobic co-substrate with fat, oil, and grease: Biomethane potential and microbial dynamics. Bioresour. Technol. 2025, 421, 132155. [Google Scholar] [CrossRef] [PubMed]
  49. Zhou, Y.; Yin, L.; Jin, W.; Cheng, Y.; Zhu, W. Progress of Methanomassiliicoccales in the rumen. Acta Microbiol. Sin. 2020, 60, 1–12. [Google Scholar]
  50. DeVrieze, J.; Arends, J.; Verbeeck, K.; Gildemyn, S.; Rabaey, K. Interfacing anaerobic digestion with (bio)electrochemical systems: Potentials and challenges. Water Res. 2018, 146, 244–255. [Google Scholar] [CrossRef]
  51. Liu, Y.; Chen, J.; Liu, Z.; Hou, Z.; Liang, B.; Wang, L.; Zhou, L.; Shou, L.; Lin, D.; Yang, S.; et al. Long-Term cultivation and meta-omics reveal methylotrophic methanogenesis in hydrocarbon-impacted habitats. Engineering 2023, 24, 264–275. [Google Scholar] [CrossRef]
  52. Conrad, R. Importance of hydrogenotrophic, aceticlastic and methylotrophic methanogenesis for methane production in terrestrial, aquatic and other anoxic environments: A mini review. Pedosphere 2020, 30, 25–39. [Google Scholar] [CrossRef]
  53. Johnravindar, D.; Kaur, G.; Liang, J.; Lou, L.; Zhao, J.; Manu, M.K.; Kumar, R.; Varjani, S.; Wong, J. Impact of total solids content on biochar amended co-digestion of food waste and sludge: Microbial community dynamics, methane production and digestate quality assessment. Bioresour. Technol. 2022, 361, 127682. [Google Scholar] [CrossRef]
  54. Bassani, I.; Kougias, P.G.; Treu, L.; Angelidaki, I. Biogas upgrading via hydrogenotrophic methanogenesis in two-stage continuous stirred tank reactors at mesophilic and thermophilic conditions. Environ. Sci. Technol. 2015, 49, 12585–12593. [Google Scholar] [CrossRef]
  55. Lu, T.; Zhang, J.; Wei, Y.; Shen, P. Effects of ferric oxide on the microbial community and functioning during anaerobic digestion of swine manure. Bioresour. Technol. 2019, 287, 121393. [Google Scholar] [CrossRef]
  56. Zhang, J.; Liu, H.; Wu, J.; Chen, C.; Ding, Y.; Liu, H.; Zhou, Y. Rethinking the biochar impact on the anaerobic digestion of food waste in bench-scale digester: Spatial distribution and biogas production. Bioresour. Technol. 2025, 420, 132115. [Google Scholar] [CrossRef]
Figure 1. Fourier-transform infrared spectroscopy (FTIR) spectrum of biochar.
Fermentation 11 00549 g001
Figure 2. Schematic diagram and picture of anaerobic digester (1 L) for batch experiment: 1: feeding inlet; 2: sampling port; 3: water guide pipe; 4: biogas collection port; 5: biogas guide pipe; 6: biogas collection zone; 7: reaction zone.
Fermentation 11 00549 g002
Figure 3. Schematic diagram and picture of anaerobic digester (10 L) for continuous experiment: 1: feeding inlet; 2: biogas outlet; 3: mixing motor; 4: stirrer; 5: water heating jacket; 6: discharge outlet.
Fermentation 11 00549 g003
Figure 4. Process flow diagram of continuous experiment.
Fermentation 11 00549 g004
Figure 5. Effect of different biochar ratios on total ammonium nitrogen (A), free ammonia nitrogen (B), and pH (C).
Fermentation 11 00549 g005
Figure 6. Effect of different biochar ratios on daily specific methane production (A) and cumulative methane production (B).
Fermentation 11 00549 g006
Figure 7. Cumulative methane production of modified Gompertz equation, fitted and measured.
Fermentation 11 00549 g007
Figure 8. Variations in volumetric methane production rate (A), daily specific methane production (B), and methane content (C) in different treatments with and without biochar addition.
Fermentation 11 00549 g008
Figure 9. Variations in total ammonium nitrogen (A) and free ammonia nitrogen (B) in different treatments with and without biochar addition.
Fermentation 11 00549 g009
Figure 10. Variations in pH (A), volatile fatty acids (VFAs) (B), total alkalinity (TA) (C), and VFAs/TA ratio (D) in different treatments with and without biochar addition.
Fermentation 11 00549 g010
Figure 11. Relative abundance of methanogen communities (at the genus level) in different treatments with and without biochar addition.
Fermentation 11 00549 g011
Table 1. Characteristics of chicken manure and inoculum.
MaterialspHTS/%VS/%TOC/%TN/%C/N
Chicken manure7.73 ± 0.0225.84 ± 0.2316.41 ± 0.3829.64 ± 0.312.41 ± 0.0712.30
Inoculum7.66 ± 0.047.85 ± 0.513.56 ± 0.27NDNDND
Note: ND: no detection; TS: total solids; VS: volatile solids; TOC: total organic carbon, based on dry matter; TN: total nitrogen, based on dry matter; C/N: the ratio of TOC to TN.
Table 2. Characteristics of biochar.
pHEC
/(ms/cm)
C/%H/%O/%N/%S/%TOC
/%
AC/%SSA
/(m2/g)
APD
/nm
9.35 ± 0.040.42 ± 0.0371.31 ± 0.832.09 ± 0.0221.24 ± 0.030.38 ± 0.030.02 ± 0.00219.57 ± 0.114.96 ± 0.09187 ± 9.123.27 ± 0.09
Note: EC: electrical conductivity; C: carbon; H: hydrogen; O: oxygen; N: nitrogen; S: sulfur; TOC: total organic carbon; AC: ash content; SSA: specific surface area; APD: average pore diameter.
Table 3. Operation conditions of continuous experiment.
DigesterHRT/dBiochar AdditionOLR/g VS/(L·d)
1~42 d43~84 d85~126 d
R121Y2.374.747.11
R221N2.374.747.11
Note: HRT: hydraulic retention time; OLR: organic loading rate; Y: the digester with biochar addition; N: the digester without biochar addition.
Table 4. Fitting results of methane production kinetics of treatments with different ratios of biochar addition.
TreatmentG1G2G3G4G5Control
Y0/mL/g VS335.49374.66389.45378.85335.26324.78
Rmax/mL/(g VS·d)12.6411.9414.3913.2212.0311.04
r/d2.402.262.222.472.365.86
R 20.9920.9910.9900.9890.9900.997
Note: Y0: final cumulative methane production; Rmax: maximum methane production rate; r: duration of the lag phase; R2: regression coefficients.
Disclaimer/Publisher’s Note: The statements, opinions and data contained in all publications are solely those of the individual author(s) and contributor(s) and not of MDPI and/or the editor(s). MDPI and/or the editor(s) disclaim responsibility for any injury to people or property resulting from any ideas, methods, instructions or products referred to in the content.