Article

Melanoidin Content Determines the Primary Pathways in Glucose Dark Fermentation: A Preliminary Assessment of Kinetic and Microbial Aspects

by
Carolina Nemeth Comparato
1,
Matheus Neves de Araujo
1,
Isabel Kimiko Sakamoto
1,
Lucas Tadeu Fuess
1,*,
Márcia Helena Rissato Zamariolli Damianovic
1 and
Ariovaldo José da Silva
2
1
Biological Processes Laboratory (LPB), São Carlos School of Engineering (EESC), University of São Paulo (USP), Av. João Dagnone, 1100, Santa Angelina, São Carlos 13563-120, SP, Brazil
2
School of Agricultural Engineering (FEAGRI), University of Campinas (Unicamp), Av. Cândido Rondon, 501, Barão Geraldo, Campinas 13083-875, SP, Brazil
*
Author to whom correspondence should be addressed.
Fermentation 2024, 10(6), 272; https://doi.org/10.3390/fermentation10060272
Submission received: 17 April 2024 / Revised: 12 May 2024 / Accepted: 20 May 2024 / Published: 23 May 2024

Abstract

:
Melanoidins are heterogeneous polymers with a high molecular weight and brown color formed during the Maillard reaction by the combination of sugars and amino acids at high temperatures with the potential to inhibit the microbial activity in bioprocesses. This study assessed the impacts of melanoidins on the kinetic of substrate conversion and production of organic acids via dark fermentation using microbial consortia as inoculum. The investigations were carried out in fed-batch reactors using synthetic melanoidins following glucose-to-melanoidin ratios (G/M; g-glucose g−1 melanoidins) of 0.50, 1.50, 1.62, 1.67, and 5.00, also considering a melanoidin-free control reactor. The results showed that melanoidins negatively impacted the kinetics of glucose fermentation by decreasing the first-order decay constant (k1): when dosing equivalent initial concentrations of glucose (ca. 3 g L−1), the absence of melanoidins led to a k1 of 0.62 d−1, whilst dosing 2 g L−1 (G/M = 1.5) and 6.0 g L−1 (G/M = 0.5) of melanoidins produced k1 values of 0.37 d−1 and 0.27 d−1, respectively. The production of butyric and acetic acids was also negatively impacted by melanoidins, whilst the lactic activity was not impaired by the presence of these compounds. Lactate production reached ca. 1000 mg L−1 in G/M = 1.67, whilst no lactate was detected in the control reactor. The presence of melanoidins was demonstrated to be a selective metabolic driver, decreasing the microbial diversity compared to the control reactor and favoring the growth of Lactobacillus. These results highlight the importance of further understanding the impacts of melanoidins on melanoidin-rich organic wastewater bioconversion, such as sugarcane vinasse, which are abundantly available in biorefineries.

1. Introduction

Melanoidins are dark-colored recalcitrant compounds formed during the Maillard reaction. They are found in many industrial wastewaters, including those from coffee processing, fermentation-derived products (bread, beer), vinasses, and other effluents showing high concentrations of sugars and amino acids that have been heated [1] as well as after thermal pretreatment of wastewater [2]. Melanoidin characterization is complex due to the different amino acids reacting at different proportions. Furthermore, process conditions, such as temperature, heating time, and pH, directly influence the reaction products [3]. At high temperatures and heating time, unsaturated melanoidins with a high molecular weight are formed, presenting a dark coloration and high carbon content [4]. Regarding the pH, under alkaline conditions, the pathway for melanoidin formation is favored, leading to the production of water-soluble melanoidins with an intense brown color [5]. Thus, melanoidins obtained from different processes present different molecular structures and properties.
When discharged in the environment, melanoidins present a great risk due to their chelating ability with other environmental pollutants such as heavy metals, mutagenic and carcinogenic compounds, and phenolic compounds [6,7]. High concentrations of melanoidins can directly affect the quality of water bodies and soils, owing to their anionic nature, odor, dark color, and high organic matter content and low pH levels [6]. Furthermore, melanoidins have antimicrobial properties associated with three different mechanisms: [i] by interfering with substrate utilization due to the inhibition of transporter enzymes or their antioxidant potential, [ii] by limiting metal ion availability due to the binding of these species into the macromolecule structure, and [iii] by damaging cell membranes [8,9,10].
Melanoidins have been reported to show a significant inhibitory effect when their concentration exceeded 4%, exhibiting a bactericidal effect against Clostridium perfringens and a significant reduction in the initial count of Weissella viridescens, Leuconostoc mesenteroides, Staphylococcus aureus, Listeria monocytogenes, Escherichia coli, Salmonella spp., Campylobacter jejuni, and Pseudomonas putida. Additionally, they displayed a bacteriostatic effect against Enterococcus faecalis and Lactobacillus brevis [11]. Melanoidins obtained from coffee and biscuit in concentrations ranging between 7.5 and 50 g L−1 have also been reported to show inhibitory effect against Escherichia coli [9], while melanoidins obtained from controlled systems (glycine/glucose; histidine/glucose; alanine/glucose; and lysine/glucose) showed inhibitory effect in concentrations of 100 mg L−1 against Geobacillus stearothermophilus [12].
Meanwhile, there are no clear conclusions about the effects of melanoidins on biological treatment processes such as anaerobic digestion. Some studies indicated that high concentrations of melanoidins inhibit anaerobic consortia, as evidenced by decreases in biogas/volatile fatty acids (VFA) production [13,14,15,16,17]. On the other hand, melanoidins, like humic acids, are characterized as acidic, polymeric, and highly dispersed colloids and can act as electron acceptors during fermentation. They can accept electrons from VFA-producing microorganisms, which helps to maintain the redox balance of fermentative pathways. This enables fermentation to take place more efficiently [18].
Recent investigations show the relevance of using melanoidin-containing substrates, such as sugarcane molasses [19,20,21] and sugarcane vinasse [22,23,24], in fermentative processes toward the recovery of value-added products such as biohydrogen and VFA. However, focus is always given to the impacts of primary fermentable compounds (e.g., sugars and glycerol) on process performance, which limits understanding of how negatively (or positively) the presence of melanoidins may impact the fermentative activity. As a preliminary approach to understanding the impacts of melanoidins on the production of organic acids, this study assessed the performance of fed-batch fermentative reactors subjected to different glucose-to-melanoidin ratios based on variations in the content of both glucose (3–10 g L−1) and melanoidins (2–6 g L−1). Furthermore, 16S rRNA gene amplicon sequencing was also utilized to assess the shifts in the microbial consortia subjected to different melanoidin contents, providing robust insights to elucidate the role of melanoidins in dark fermentative processes.

2. Materials and Methods

2.1. Synthetic Melanoidin Preparation

The synthetic melanoidin solution was prepared using the glycine–glucose model system adding 4.55 g of glucose (0.025 mol L−1), 1.88 g of glycine (0.025 mol L−1), and 0.42 g of sodium bicarbonate (0.005 mol L−1) to 100 mL of distilled water, which was further heated to 80 °C for 7 h. The melanoidin-containing solution was then cooled to room temperature and 100 mL of distilled water was added, obtaining a solution with a theoretical melanoidin concentration of 28.5 g L−1 [25].

2.2. Lab-Made Glucose-Based Wastewater

The lab-made wastewater was based on compositional characteristics reported elsewhere [26,27], containing SeO2 (0.036 mg L−1), CaCl2·6H2O (2.06 mg L−1), KH2PO4 (5.36 mgL−1), K2HPO4 (1.30 mg L−1), Na2HPO4·2H2O (2.70 mg L−1), NiSO4·6H2O (0.50 mg L−1), FeSO4·7H2O (2.50 mg L−1), CoCl2·6H2O (0.04 mg L−1), and FeCl3·6H2O (0.25 mg L−1). Melanoidins (2–6 g L−1) and glucose (3–10 g L−1) were added to obtain different glucose-to-melanoidin ratios (see Section 2.3) following a central composite experimental design consisting of two factors at two levels, plus a central point. Urea was used as the nitrogen source to maintain an optimal carbon-to-nitrogen ratio of 140 [28].

2.3. Experimental Approach: Reactor Design, Operating Conditions, and Inoculation Protocol

The investigations were carried out in fed-batch mode using 1000 mL Duran flasks as reactors, which were placed in a shaker (model Multitron PRO Incubator Shaker-Infors HT, Infors AG, Bottmingen, Basel, Switzerland) to maintain controlled temperature (37 ± 0.1 °C) and agitation (150 ± 1 rpm) conditions. The experimental conditions investigated were derived from a central composite experimental design, resulting in five glucose-to-melanoidin (G/M; g-glucose g−1 melanoidins) ratios, namely, 0.50, 1.50, 1.62, 1.67, and 5.00. Table 1 shows the concentrations of glucose and melanoidins utilized in each experimental condition.
Granular methanogenic sludge collected from a full-scale upflow anaerobic sludge blanket (UASB) reactor treating poultry slaughterhouse wastewater was used as the inoculum. The sludge was subjected to acidic pretreatment as a strategy to inhibit methanogenic Archaea following the protocol described elsewhere [29]. After the acid shock, the inoculum was ground and subjected to immobilization into polyurethane 1-cm3 cubic pieces by immersion for a period of two hours under refrigeration (4 °C) as described elsewhere [30]. Afterward, the polyurethane matrices were transferred to a sieve to drain off the excess sludge. Finally, equivalent quantities of support material containing immobilized biomass were carefully placed in the reactors.
Initially, a working volume of 300 mL of lab-made wastewater was added to each reactor, followed by periodic monitoring of the concentration of total carbohydrates (CHt) in the liquid phase. A CHt removal efficiency of 95% was adopted as the threshold for refeeding the reactors, always maintaining the same G/M level. During the investigations, the reactors were refed twice at least, resulting in three experimental phases, namely, phase I, phase II and phase III, except for condition G/M = 1.67, which showed a 95%-removal of CHt only once during the entire incubation period. The maximum incubation period was defined as 60 d. This refeeding strategy was based on the hypothesis of maintaining a sufficient substrate availability to cover possible changes in metabolic profiles and microbial communities for the different G/M ratios. At the end of each phase, aliquots of the liquid phase were sampled and analyzed for the chemical oxygen demand (COD), volatile solids (VS), pH, VFA, and solvents.

2.4. Analytical Methods

Total carbohydrates measured as glucose were determined according to the phenol-sulfuric acid described by Dubois et al. [31]. The monitoring of soluble metabolic products was based on the determination of VFA (acetic acid, HAc; propionic acid, HPr; butyric acid, HBu; valeric acid, HVa; caproic acid, HCa) and solvents (ethanol, EtOH; methanol, MeOH; acetone-AcO) using a gas chromatography set equipped with a flame ionization detector (model GC-2010, Shimadzu Scientific Instruments, Kyoto, Japan), a COMBI-PAL autosampler, and using hydrogen, synthetic air, and nitrogen as the carrier, flame, and make-up gases, respectively [32]. pH, COD, and VS measurements were based on the Standard Methods for the Examination of Water and Wastewater [33], whilst lactic acid (HLa) concentrations were measured according to Taylor [34].

2.5. Performance Assessment: Kinetic Assessment, Substrate Conversion, and Metabolic Products

The experimental conditions were compared based on the kinetic profiles of CHt consumption (considered as the primary fermentable substrate) during the incubation periods, CHt overall conversion, and the profiles of soluble metabolites measured at the end of Phases I, II, and III, except for the G/M ratio 1.67, characterized by only two phases (Phases I and II). The kinetic analysis was carried out considering only the data obtained for the last phase of each experimental condition (Phase III) and using a first-order kinetic model with residual as the mathematical approach [35]. The kinetic model (Equation (1)) was fitted to the experimental data using the software Origin 2020 (OriginLab Corporation, Northampton, MA, USA) with the aid of a nonlinear fitting tool by the Levenberg Marquardt iteration algorithm. In Equation (1), CS(t) is the substrate concentration as a function of the incubation period (mg L−1), CRS is the residual substrate concentration when reaction rates approach zero (mg L−1), CS0 is the initial substrate concentration (t = 0) (mg L−1), and k1 is the apparent kinetic constant (d−1). The kinetic parameters k1 and CRS were used to compare the performance of the experimental conditions.
C S ( t ) = C R S + C S 0 C R S · e ( k 1 · t ) ,
Additionally, the reactors were compared using the CHt conversion efficiency (ECCHt; %) (Equation (2)), in which [CHt]i is the initial CHt concentration (mg L−1) and [CHt]f is the final CHt concentration in each phase (mg L−1). The COD removal efficiency (ERCOD; %) was also obtained using a calculation analogous to that shown in Equation (2) by simply replacing [CHt] values with the initial and terminal COD levels in each phase. Finally, the distribution of soluble metabolites measured at the end of each phase was compared to verify the establishment of distinct metabolic pathways under the experimental conditions investigated.
E C C H t = C H t i C H t f C H t i 100 ,

2.6. Molecular Analyses

Genomic DNA extraction from biomass samples collected from selected incubation conditions (CR, G/M = 1.67 and G/M = 5.00) was carried out using the FastDNATM SPIN Kit for Soil (MP Biomedicals, LLC, Irvine, CA, USA) following the manufacturer’s recommendations. Microbial samples from conditions relative to G/M ratios of 1.67 and 5.00 were selected due to the amount of soluble metabolites produced, while the biomass in the control condition (reactor CR) was not subjected to the interference of melanoidins, characterizing, therefore, a reference group. The quality of the extracted DNA was checked using 0.8% agarose gel electrophoresis and quantification (ng µL−1) was carried out using a Nanodrop 2000 Spectrophotometer (ThermoFisher Scientific, Waltham, MA, USA). The samples were sequenced using the 341F–785R primer set for amplification of the 16S rRNA gene in a MiSeqTM System (Illumina, Inc., San Diego, CA, USA) owned by NGS Soluções Genômicas (Piracicaba, SP, Brazil). The data generated during sequencing were analyzed using the DADA2 program [36]. The DADA2 package has a complete pipeline implemented to transform the sequencer’s fastq files into inferred, dismembered, chimera-free sample sequences. Filtering of fastq files was performed to cut out PCR primer sequences and filter out the 3’ ends of reads due to quality decay (ng µL−1). After the initial processing of the sequencing data by DADA2, taxonomies were assigned to each ASV (amplicon sequence variant). The SILVA database was used as a reference [37]. Sequencing data were also used to obtain relevant ecological indices, including Shannon–Wiener diversity, Simpson dominance, and Chao-1.

3. Results and Discussion

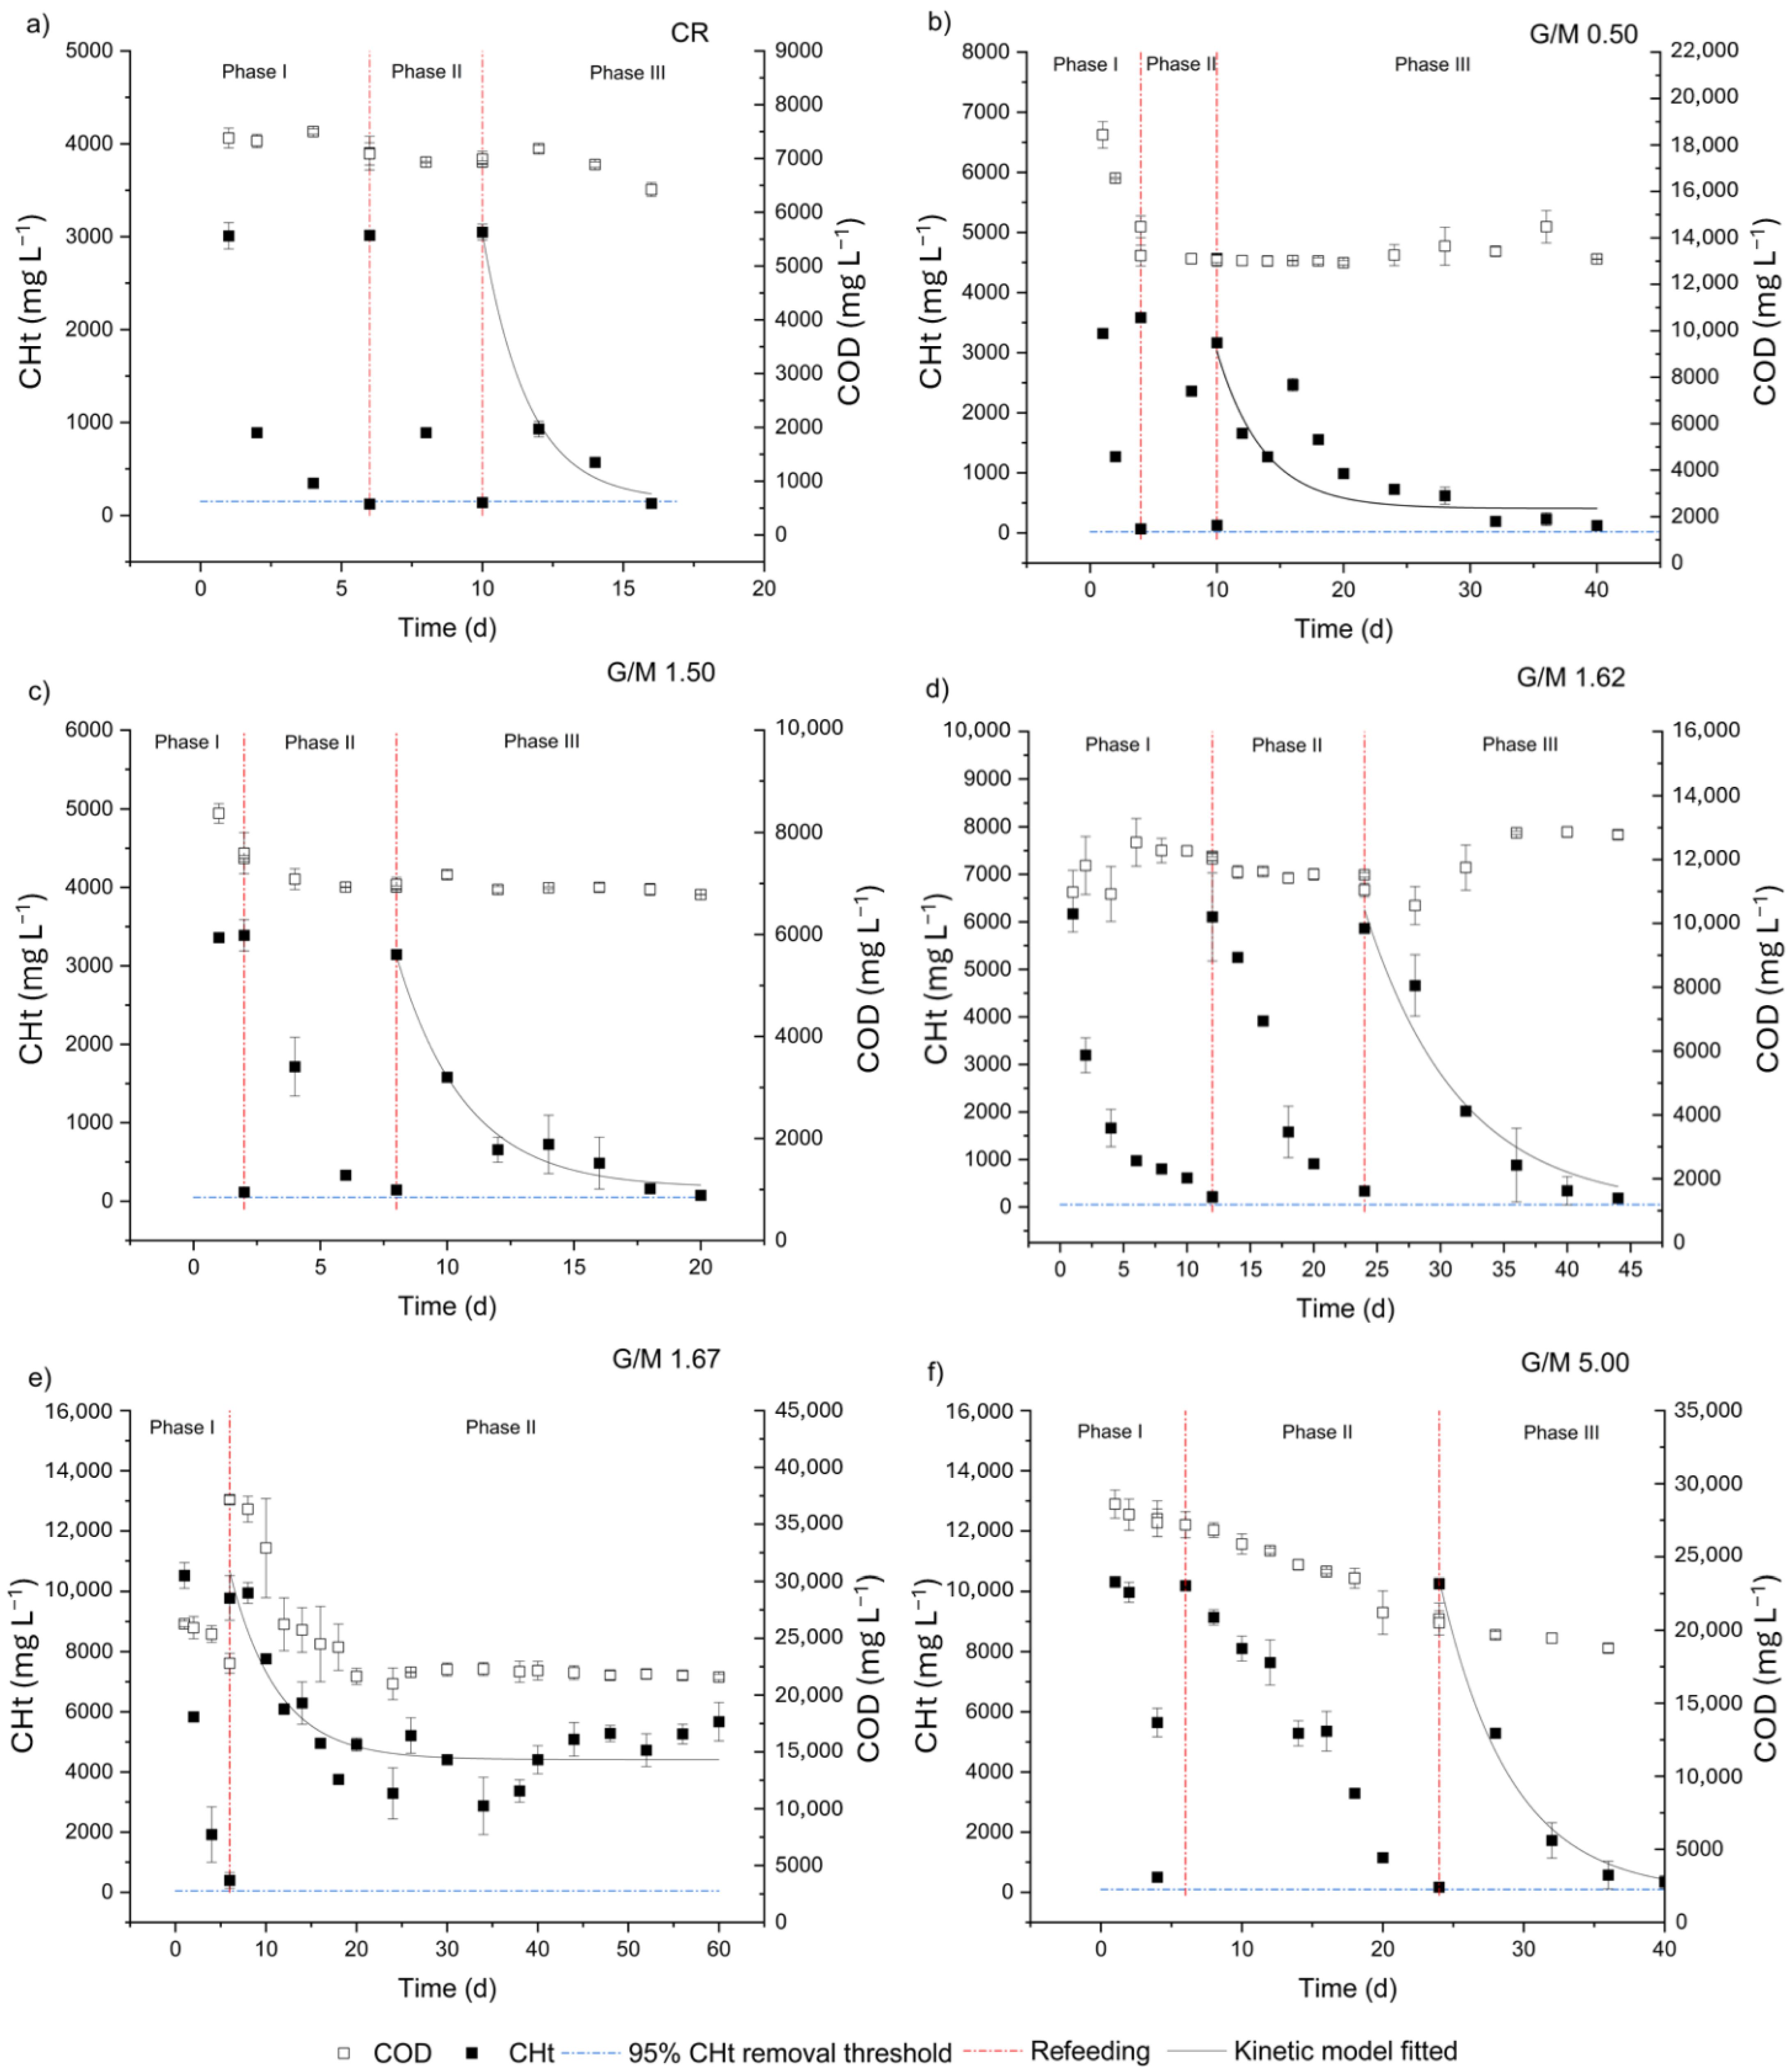
3.1. Impacts of Melanoidins on Substrate Conversion and Kinetic Patterns

Different kinetic patterns of substrate consumption and distinct metabolic profiles were observed for the experimental conditions investigated. The impact of different melanoidin proportions on the kinetic patterns was assessed considering Phase III of each condition (Figure 1) except for the G/M ratio of 1.67, in which data from Phase II were used in the kinetic analysis. In this case, an ECCHt of 96.3% (Table 2) was achieved only once during the incubation period (on day 6; Figure 1). After refeeding the reactor on day 6, the lowest ECCHt (42.1%; Table 2) was achieved among all experimental conditions assessed, reaching a mean CHt concentration of 5670 ± 640 mg L−1 at the end of the incubation period on day 60 (Figure 1e, Phase II) and demonstrating a loss of fresh substrate conversion efficiency of ca. 50%. It is worth noting that the highest concentrations of melanoidins (6 g L−1, theoretical value) and glucose (10,150 ± 580 mg L−1 as CHt, experimental value) were simultaneously applied in the G/M of 1.67 (Table 1), most likely characterizing stressing conditions in terms of recalcitrance and overload of biodegradable substrate. On the other hand, in the case of G/M = 5.00 (Figure 1f), characterized by an equivalent glucose concentration (10,260 ± 130 mg L−1 as CHt, experimental value) and a 3-fold lower melanoidin level (Table 1) compared to G/M = 1.67, ECCHt ≥ 95% was observed in all Phases (I, II, and III). Analyzing the kinetic parameters, when G/M = 1.67 (Figure 1e, Phase II) and G/M = 5.00 (Figure 1f, Phase III), equivalent k1 values were obtained (0.19 ± 0.04 vs. 0.20 ± 0.01 d−1; Table 2), while very different CRS (4410 ± 220 vs. 0 mg L−1; Table 2) values were observed, respectively. In this case, the higher supply of melanoidins in G/M = 1.67 negatively impacted the substrate conversion efficiency, which is evidenced by the higher CRS observed.
Interestingly, comparing G/M = 0.50 with G/M = 1.50, which also received equivalent dosages of CHt (3025 ± 80 vs. 3300 ± 110 mg L−1; Table 1) and different amounts of melanoidins (3-fold higher in G/M = 0.50; Table 1), adverse effects of melanoidins were also observed, particularly on the kinetic parameters. Although equivalent ECCHt were observed in both conditions (96.1–97.6%; Table 2) when G/M = 1.50 (Figure 1c, Phase III), a 27%-higher k1 was estimated compared to G/M = 0.50 (Figure 1b, Phase III), as well as a 2.4-fold lower CRS (170 vs. 410 mg L−1; Table 2). Furthermore, the adverse effects of higher melanoidin contents can also be observed by analyzing the incubation period required for condition G/M = 0.50 (Figure 1b, Phase III) to achieve the threshold of ECCHt ≥ 95%, which was 2-fold longer compared to G/M = 1.50 (Figure 1c, Phase III) (30 vs. 12 d, respectively).
A different pattern was observed at the central point of the experimental design, i.e., in condition G/M = 1.62 (Figure 1d). Compared to the other conditions (except for CR), intermediate concentrations of both glucose (6050 ± 450 mg L−1; experimental value) and melanoidins (4 g L−1; theoretical value) were utilized when G/M = 1.62 (Table 1). In this case, even with an initial substrate concentration ca. 2-fold higher compared to G/M = 0.5 and 1.50 (6050 vs. 3025–3300 mg L−1; Table 1), which theoretically should result in a higher reaction rate for the substrate uptake, G/M = 1.62 showed a k1 (0.13 ± 0.02 d−1) up to 3-fold-lower compared to G/M = 0.50 (0.27 ± 0.05 d−1) and G/M = 1.50 (0.37 ± 0.06 d−1), respectively (Table 2). Additionally, the incubation period required to achieve ECCHt ≥ 95% when G/M = 1.62 was intermediate (20 d; Figure 1d) relative to G/M = 0.50 (30 d; Figure 1b) and G/M = 1.50 (12 d; Figure 1c), which again points to the inhibitory role of melanoidins on substrate conversion.
A comprehensive assessment using the control condition (CR) as the reference system clearly revealed the adverse effects of melanoidins on the kinetics of substrate fermentation. ECCHt reached 95.8% in CR (Table 2, Phase III), leading to a final CHt concentration of 129 ± 5 mg L−1 on day 16 (Figure 1a; Table 2). In this context, the absence of melanoidins in CR was demonstrated to not significantly impact ECCHt when compared to the other conditions containing melanoidins, except for the previously reported G/M of 1.67. Considering the equivalent initial CHt concentrations in CR (3360 ± 30 mg L−1; Table 1), G/M = 0.50 (3025 ± 80 mg L−1; Table 1), and G/M = 1.50 (3300 ± 110 mg L−1; Table 1), a head-to-head comparison underpinned by equivalent substrate availability under these conditions is reliable. In this context, CR provided a k1 (0.62 ± 0.09 d−1; Table 2) 1.7- and 2.3-fold higher than in G/M = 0.50 (0.27 ± 0.05 d−1; Table 2) and G/M = 1.50 (0.37 ± 0.06 d−1; Table 2), respectively. At the same time, it is worth highlighting the total incubation period for CR (16 days) as well as the total period needed to reach the 95% threshold for CHt conversion in Phase III (6 days), which was significantly shorter compared to all the other melanoidin-containing conditions (12–54 d considering the last phase of each experimental condition). Overall, the findings presented herein revealed that melanoidins play a key role in the kinetic patterns established in dark fermentative systems.
It is important to stress the low-to-negligible COD removal efficiency levels (usually <10%, with potential interference of microbial biomass losses in the measurements in some cases; Table 2) observed in most of the incubation conditions. Fermentative systems are characterized primarily by the conversion (and not removal) of organic carbon, i.e., the COD is simply transformed (as it is mostly kept in the liquid phase) while microbes obtain energy for cell maintenance. The minor COD removal levels could be associated with assimilation by fermentative bacteria. The only exception was observed in condition G/M = 1.67, characterized by the highest ERCOD (41.9%; Table 2) among all conditions. In this case, both the COD and CHt decays followed very similar patterns (Figure 1e) right after the reactors were refed at the beginning of Phase II, which suggests the utilization of CHt in enhanced cell growth. This result might indicate a particular behavior of the fermentative community when exposed to a harsh environment characterized by both an “organic overload” (resulting from the high CHt concentration, i.e., 10,150 ± 580 mg L−1; Table 1) and the exposure to potential inhibitory effects derived from the high melanoidin content (6 g L−1; Table 1). The occurrence of only one of these factors, namely, the high CHt availability (10,260 ± 130 mg L−1; Table 1) in condition G/M = 5.00 did not trigger enhanced cell synthesis, suggesting that metabolic pathways directed to obtain energy only for cell maintenance (substrate fermentation) were not inhibited.

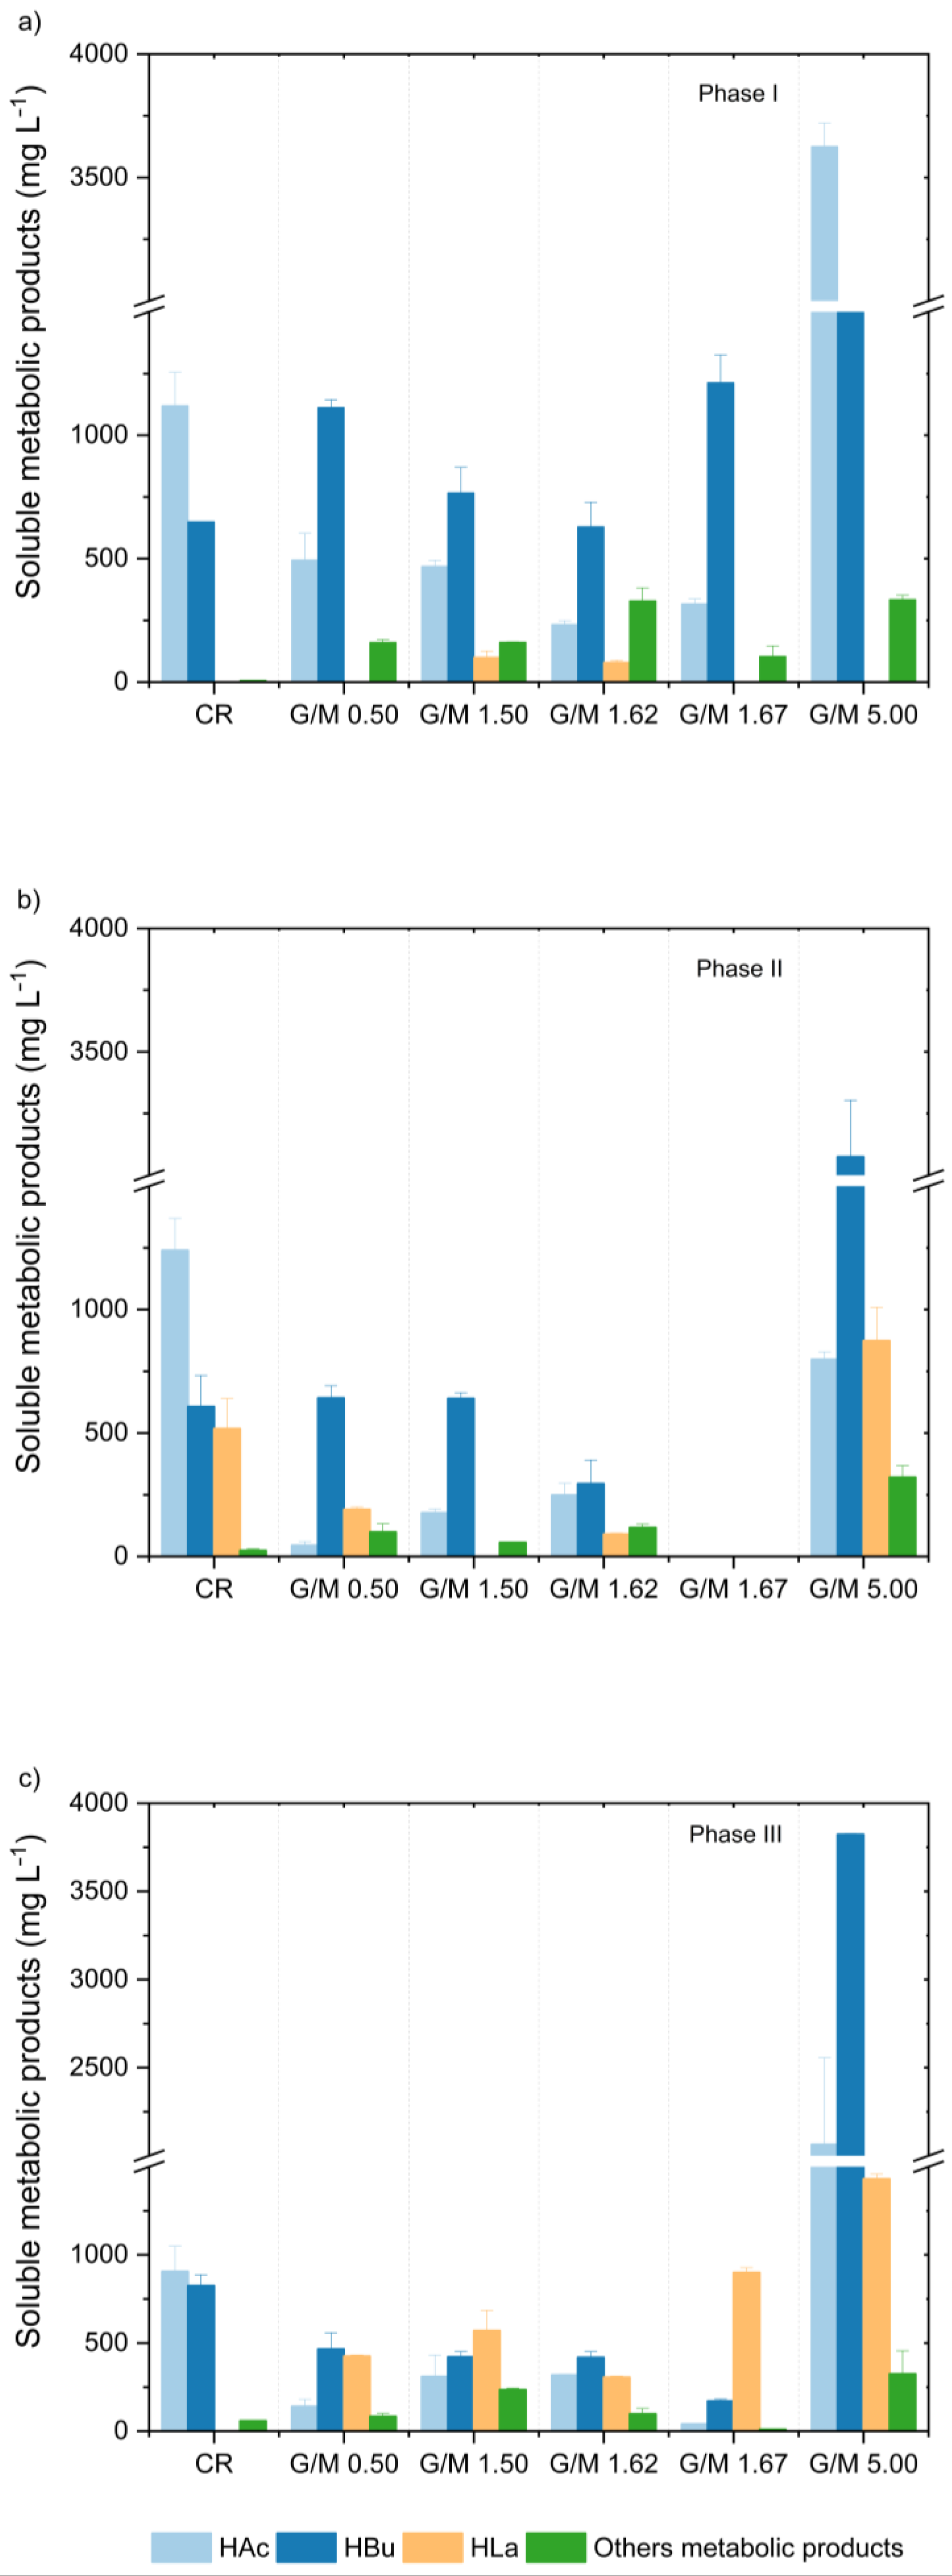
3.2. Distribution of Soluble Phase Metabolites

Besides impacting the kinetic parameters, adding different levels of melanoidin has been revealed to drive and shift the metabolic pathways in glucose fermentation. Analyzing Phase I (Figure 2a,b), different distribution patterns of soluble fermentation intermediates were accessed. Considering the CR, G/M = 0.50, and G/M = 1.50, all characterized by equivalent initial concentrations of CHt (Table 1), the presence of melanoidins was shown to markedly impact HAc production. HAc concentration in CR (1200 ± 150 mg-COD L−1) was more than 2-fold higher than in G/M = 0.50 (530 ± 115 mg-COD L−1) and G/M = 1.50 (500 ± 30 mg-COD L−1), indicating a possible inhibitory role of melanoidins on the acetic-type fermentation. A higher HAc concentration was observed only when G/M = 5.00 (3900 ± 30 mg-COD L−1). However, this pattern may be directly related to the amount of fresh substrate available and the lower proportion of melanoidins added in condition G/M = 5.00 (2 g L−1; Table 1), especially compared to G/M = 1.67 (6 g L−1; Table 1). Considering that both conditions (G/M = 1.67 and 5.00) were characterized by equivalent initial CHt concentrations (ca. 10,000 mg L−1; Table 1), the lower concentration of HAc determined in G/M = 1.67 (340 ± 20 mg-COD L−1) compared to G/M = 5.00 (3900 ± 30 mg-COD L−1) underpins the hypothesis of the inhibition of acetate production triggered by melanoidins.
Regarding butyric-type fermentation, CR showed the lowest concentrations of HBu (1180 ± 3 mg-COD L−1), which were ca. half that observed in G/M = 0.50 (2020 ± 60 mg-COD L−1) and slightly lower compared to G/M = 1.50 (1395 ± 190 mg-COD L−1). Interestingly, comparing HBu concentrations in G/M = 0.50 (2023 ± 58 mg-COD L−1) and G/M = 1.67 (2220 ± 60 mg-COD L−1), which received equivalent amounts of melanoidins (6 g L−1) with different fresh substrate availability (ca. 3000 vs. 10,000 mg L−1; Table 1), shows slightly higher levels in the latter. Meanwhile, a direct comparison between HBu concentrations in G/M = 1.67 and G/M = 5.00 (5215 ± 30 mg-COD L−1), which received equivalent initial levels of CHt (ca. 10,000 mg L−1; Table 1), associated with different melanoidin concentrations (6.0 vs. 2.0 g L−1; Table 1), also indicates a possible inhibitory effect of melanoidins on the butyric-type fermentation depending on the amount of available fresh substrate.
A distinct metabolite distribution pattern was observed when comparing CR with the melanoidin-containing conditions in Phases II and III (Figure 2b,c). At the end of Phase II (Figure 2b), a prominent increase in HLa concentration (550 mg-COD L−1) associated with a slight increase in HAc (130 mg-COD L−1) and decrease in HBu (80 mg-COD L−1) concentrations were observed in CR compared to Phase I (Figure 2a). On the other hand, reductions in the overall concentrations of HAc and HBu were observed in the other conditions investigated, again supporting the hypothesis of the inhibitory role of melanoidins on acetic- and butyric-type fermentation pathways.
The determination of soluble metabolic products in Phase III (CR, G/M = 0.50, 1.50, 1.62, and 5.00; Figure 1c) and Phase II (G/M = 1.67; Figure 1b) revealed the key role of melanoidins to trigger shifts in the metabolic pathways. In the case of CR, the total consumption of HLa (550 mg-COD L−1) accumulated during Phase II occurred in association with a decrease in HAc (357 mg-COD L−1) and an increase in HBu (400 mg-COD L−1) concentrations, suggesting the establishment of the cofermentation of HLa and HAc as a relevant HBu-producing pathway [38]. The cofermentation of HLa and HAc, also referred to as the reverse β-oxidation of acetate using lactate as a complementary carbon source, is commonly reported in several fermentative systems, playing a key role in biohydrogen production from melanoidin-containing wastewaters, namely, sugarcane molasses [19,20], and vinasse [22,24]. On the other hand, increasing HLa concentrations (in association with slight increases in HAc levels) were observed in melanoidin-containing conditions, namely 100 mg-COD L−1 (G/M = 0.50), 140 mg-COD L−1 (G/M = 1.50), 75 mg-COD L−1 (G/M = 1.62), and 1355 mg-COD L−1 (G/M = 5.00), while a decrease in HAc concentration (300 mg-COD L−1) was observed in G/M = 1.67. Still analyzing G/M = 1.67, characterized by the highest initial amounts of CHt and melanoidins (Table 1), the decrease in HBu (1900 mg-COD L−1) and increase in HLa (940 mg-COD L−1) concentrations were the greater ones compared to any other experimental condition.
The shifts observed in the distribution of the soluble metabolites in the sequential phases suggest the continuous adaptation of the microbial communities to the imposed incubation conditions. The results clearly show that the presence of melanoidins changed the “natural fate” of the fermentative consortia, which shifted from an HLa-consuming (toward HBu production) condition (as observed in CR) to an HLa-accumulating one. When this particular result is transferred to the fermentation of real wastewaters, the impacts may be significant depending on the target metabolite to be recovered or exploited. For instance, biohydrogen production is frequently associated with the build-up of HAc and HBu in the liquid phase [39], so inhibiting the production of the latter metabolites would (certainly in the case of HBu and most likely in the case of HAc) imply losses in the hydrogenogenic activity. Considering another perspective, exploiting the production and recovery of HLa can be an interesting approach to managing melanoidin-containing wastewaters once the inhibitory capacity of these macromolecular compounds can be positively utilized to prevent the consumption of HLa. Great effort has recently been dedicated to obtaining HLa from fossil fuel-non-dependent alternative sources, considering potential applications in food and chemical industries as well as within the medicinal context [40,41,42,43]. Hence, melanoidins can be an ally or an enemy in the field of dark fermentation.

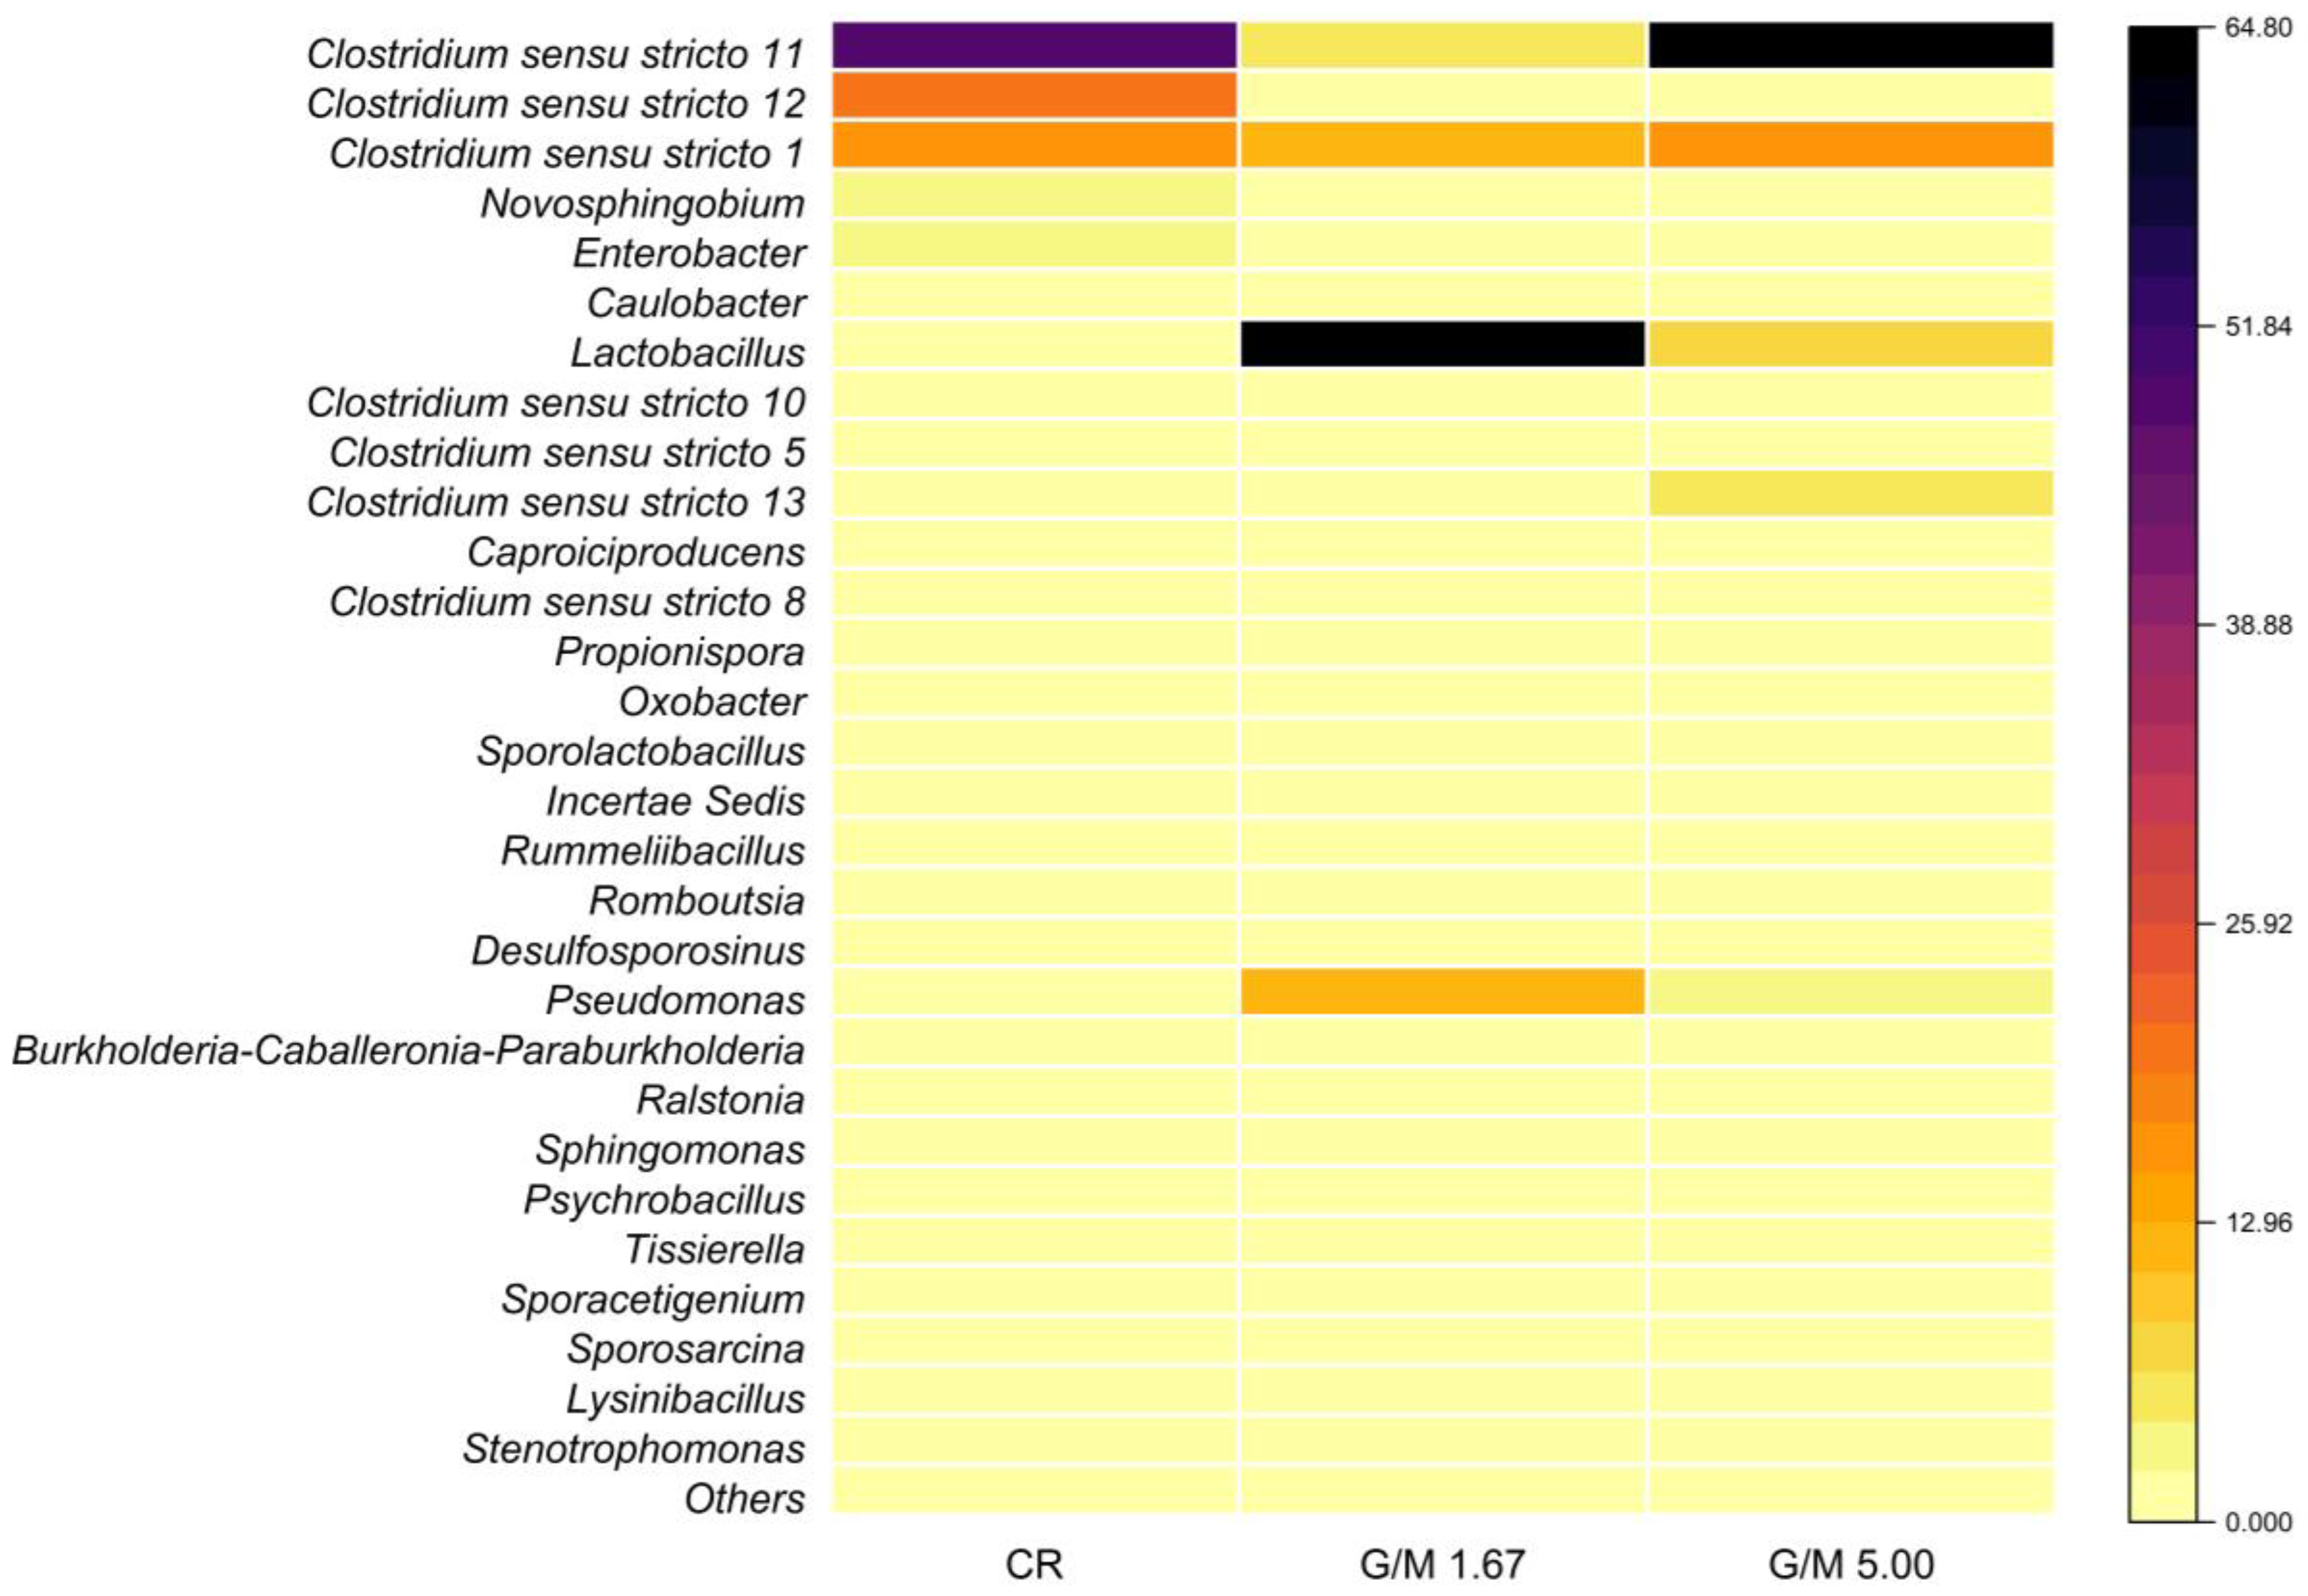
3.3. Microbial Community Characterization

The characterization of the microbial community involved in the fermentation of the melanoidin-containing lab-made wastewater was assessed by sequencing the 16S rRNA gene. Selecting the samples referring to the G/M ratios of 1.67 and 5.00 was based on the marked differences observed in their metabolite profiles (Figure 2), suggesting the occurrence of equally marked variations in the composition of the microbial community. Meanwhile, analyzing the consortia in CR provided an understanding of a melanoidin-free fermentation. Ecological diversity indices were calculated for the selected samples (Table 3), showing a decrease in bacterial diversity in the tests in which melanoidins were added: 1.62 (CR), 1.31 (G/M = 1.67), and 1.28 (G/M = 5.00). However, a clear relation between the melanoidin content and the bacterial diversity was not observed once no marked differences were observed in the indices calculated for the G/M ratios of 1.67 and 5.00 (1.31–1.28). This result suggests that, regardless of the melanoidin concentration, the bacterial diversity is impacted to a similar extent.
The bacteria domain represented 99.97, 99.97, and 100% of the microorganisms in conditions CR, G/M = 1.67, and G/M = 5.00, respectively, indicating that the acid pretreatment was effective in removing Archaea and consequently inhibiting the consumption of VFA by methanogens. The composition of the bacterial community for the most abundant genera (≥0.1%) is shown in Figure 3. Firmicutes and Proteobacteria were the most abundant phyla in the samples: while the relative abundance (RA) of Firmicutes reached 92.6% (CR), 84.6% (G/M = 1.67), and 95.6% (G/M = 5.00), Proteobacteria corresponded to 7.3% (CR), 15.3% (G/M = 1.67), and 4.4% (G/M = 5.00) (Figure 3). Microorganisms from the Firmicutes phylum are widely recognized for their syntrophic relationships in anaerobic reactors as well as for their capability to produce and degrade organic acids [44]. The dominance of the Firmicutes phylum in bacterial communities was an expected condition because this phylum generally prevails in fermentative reactors [45], while Proteobacteria is another important phylum found in anaerobic environments [46]. Similar results were obtained by Wang et al. [47], who identified an increase in the dominance of bacteria belonging to Firmicutes in four microbial samples characterized by the presence of different substrates: glucose, tryptophan, and two types of melanoidins prepared from glucose and tryptophan heated at 80 °C during different periods, namely 7 and 14 days.
Bacteria like the Clostridium genus, which belongs to the Firmicutes phylum, were identified in the three samples analyzed, with RA of 89.7%, 19.6%, and 88.3% in CR and in the G/M ratios of 1.67 and 5.00, respectively (Figure 3). The Clostridium genus comprises Gram-positive bacilli capable of producing butyric, acetic, formic, lactic, and succinic acids and ethanol from carbohydrates and other organic compounds [44]. The absence of a low-permeability external barrier, such as the outer membrane, in Gram-positive microorganisms may make them more susceptible to the antimicrobial effect of melanoidins, which may be related to their chelating properties.
It is worth noting a marked drop in the RA of the genus Clostridium sensu stricto 11 in the G/M ratio of 1.67 (4.7%) when compared to CR (49.0%) and the G/M ratio of 5.00 (64.7%) (Figure 3). In general, species of the genus Clostridium can produce butyric acid as their main fermentation product, such as Clostridium acetobutyricum (Clostridium sensu stricto 11) [48], suggesting a strong correlation between the decrease in the presence of this genus and the low butyric acid production when G/M = 1.67. Some species belonging to the Clostridium genus are also involved in homoacetogenesis, producing acetic acid from H2/CO2, and mostly belong to the Clostridium sensu stricto 12 genus [49]. The RA of this genus also markedly decreased in melanoidin-containing reactors, dropping from 20.6% in CR to 1.3% and 1.4% in the G/M ratios of 1.67 and 5.00, respectively (Figure 3).
The presence of melanoidins considerably favored the growth of the Lactobacillus genus, which showed an RA of 63.6% when G/M = 1.67 versus only 2.0% in CR and 6.7% in condition G/M = 5.00 (Figure 3). The Lactobacillus genus comprises non-spore-forming lactate-producing bacteria that utilize a wide spectrum of sugars as substrates to produce lactate as the only metabolite (homofermentation) or lactate, acetate, and ethanol (heterofermentation) [50,51]. In addition, this genus is known for tolerating low pH [52]. Bacteria belonging to the Lactobacillus genus were not inhibited by the addition of melanoidins prepared from D-xylose and L-phenylalanine or L-proline in the study presented by Kukuminato et al. [53]. Similar results were reported when testing digested glycoconjugates produced by the Maillard reaction, which stimulated the growth of some species of bacteria belonging to the Lactobacillus genus. In addition, according to Pérez-Burillo et al. [54], melanoidins can act as prebiotics, which are types of dietary fiber that serve as food for bacteria such as Lactobacillus and Bifidobacterium. Therefore, it is possible to infer that the increase in the RA of Lactobacillus in the G/M ratios of 1.67 and 5.00, when compared to CR, is related to the presence of melanoidins in the fermentative environment.
Pseudomonas from the Proteobacteria phylum was the third most abundant genus identified in the G/M ratio of 1.67, with an RA of 12.8% (Figure 3), whilst a much lower RA was observed in the G/M of 5.00 (2.9%; Figure 3) and the group was virtually absent in CR. Pseudomonas species are known to exhibit mechanisms that allow them to adapt to environmentally toxic conditions, using various pathways to degrade aromatic organic compounds [55,56]. Like the genus Pseudomonas, bacteria belonging to the genus Ralstonia, which showed RA of 1.3% in the G/M ratios of 1.67 and 5.00 and were absent in CR (Figure 3), can carry out denitrification. In addition, organisms of this genus can use organic and inorganic compounds alternatively and are, therefore, defined as facultative chemolithotrophs. Thus, bacteria of the Ralstonia genus are strongly influenced by the availability of the type of substrate fed to reactors [57]. The decrease in the interspecies competition for substrate in reactors containing melanoidins, as inferred from both the decrease in the Shannon–Wiener diversity index and the increase in the dominance index (Table 3), most likely favored the growth of Ralstonia in the G/M ratios of 1.67 and 5.00.
Novosphingobium showed an RA of 2.6% in CR, which decreased to 0.08% when G/M = 1.67 and was absent when G/M = 5.00 (Figure 3). Bacteria belonging to this genus can use polycyclic aromatic hydrocarbons as a carbon source [58] and are, therefore, considered potential decomposers of contaminants. However, these organisms are sensitive to compounds with antimicrobial action. He et al. [59] studied the impact of the antibiotic tetracycline on fermentation and reported a decrease in the presence of Novosphingobium.
Enterobacter and Caulobacter were identified with an RA of 2.4% and 2.1% in CR, respectively, but were absent in conditions containing melanoidins (Figure 3). Bacteria of the genus Enterobacter are capable of fermenting carbohydrates to organic acids and are present in samples of water, soil, sewage sludge, vegetables, and fruit [60]. Summa et al. [61] investigated the antibacterial effect of melanoidins (concentrations ranging between 100 and 12.5 μg mL−1) on Enterobacter cloaceae, reporting a significant reduction in the bacterial growth in all E. cloaceae strains exposed to 100 μg mL−1 of melanoidins, regardless of the fraction or roasting process. The Caulobacter genus comprises aerobic or facultative anaerobic mesophilic bacteria which are responsible for part of the mineralization of organic matter in environments with high or low nutrient concentrations [62]. The incubation conditions tested in the experiments carried out in this study most likely did not favor the growth of this group.
Regarding the inhibitory potential of melanoidins due to their bactericidal and bacteriostatic effects [9,11,12], some studies point to impacts on certain bacterial genera/species, whereas others have not demonstrated harmful effects, bringing a scenario of uncertainty. For instance, melanoidins were demonstrated to directly inhibit cell growth due to different mechanisms, such as by chelating metal ions or by sequestrating nitrogen-containing compounds (e.g., ammonia and amino acids) [17]. On the other hand, the results obtained herein suggest that cell growth was stimulated to the detriment of fermentation when the microbial consortium was subjected to high melanoidin content in condition G/M = 1.67 (please refer to Section 3.1). These conflicting results are supported by the findings of Kukuminato et al. [53], who observed no clear pattern in the antimicrobial activity of melanoidins produced from the combination of glucose and xylose with eleven isomers of amino acids against different bacteria. Nevertheless, from an overall perspective, the decrease in microbial diversity resulting from the acid shock applied in the anaerobic sludge used as the inoculum most likely provided a consortium more vulnerable (or less resilient) to the different inhibitory mechanisms of melanoidins in this study. The use of alternative inoculation strategies that diversify the selection of fermentative microbes may attenuate inhibitory effects. Within this context, the use of more diverse inoculum sources in terms of fermentative microbial consortium may result in a more robust and resilient dark fermentative system processing melanoidin-rich wastewater. For instance, the natural fermentation of melanoidin-rich sugarcane vinasses, an established protocol used to obtain fermentative consortia [20,22,23,24], is a good example of obtaining “melanoidin-acclimatized” consortia.

3.4. Melanoidins in Real Wastewaters: Needs and Challenges

The results obtained in this study clearly show that melanoidins directly impact the performance of fermentative microbial consortia, which highlights the pressing need to understand their role in fermentative reactors fed with real wastewaters. For instance, the systematic study on the performance of sugarcane vinasse fermentation toward biohydrogen and VFA production presented by numerous authors, as compiled elsewhere [39], did not consider the potential effects of melanoidins on the microbial activity. Hence, potential performance losses derived from variations in melanoidin content and type may have been masked by the parameters and operating conditions commonly assessed, such as the pH, organic loading rate, hydraulic retention time, among others. In the case of sugarcane processing plants, seasonal shifts in the biorefinery product portfolio (considering variations in the production rates of sugar and ethanol driven by market preferences) directly impact the quality of vinasse: high production rates of sugar increase the amount of melanoidin-containing molasses directed to fermentation, which further generates melanoidin-rich vinasse streams [39]. Meanwhile, vinasses produced directly from sugarcane juice when ethanol prevails as the primary product have a much lower organic content, including melanoidin levels [39]. Therefore, there is a great chance that melanoidins impact the bioconversion of vinasse as well as other types of organic-rich substrates.
However, the detection and quantification of melanoidins in real matrices is still a challenging aspect to be addressed, which brings limitations to planning experiments with real melanoidin-containing wastewaters. In practical aspects, developing analytical methodologies that allow the type and concentration of melanoidins in wastewater to be accurately determined should be the first objective of coming studies, after which the clear impacts of melanoidins on biological processes, such as fermentation, can be assessed. In parallel, experimental approaches can focus on removing melanoidins prior to applying biological processes, and using established physical-chemical processes, such as coagulation/flocculation can make this approach technically feasible. The macromolecular nature of melanoidins makes them susceptible to coagulation/flocculation-driven removal, such as in the case of colloidal particles and natural organic matter [63,64], suggesting that vinasses, as well as other melanoidin-containing wastewaters, could undergo such a physical-chemical pretreatment prior to fermentation. The anionic character of melanoidins also makes them susceptible to removal by adsorption [1,65], characterizing another non-biological pretreatment option.
Theoretically, these approaches are strategies with the potential to minimize or eliminate the inhibitory effects of melanoidins in biological systems despite their low specificity (considering the removal of well-defined compounds). Assessing the removal of color would be used as an indirect strategy to assess the removal of melanoidins in such cases [66,67]. Nevertheless, the unwanted removal of fermentable compounds (which can be converted into value-rich products) is a side-effect of adopting such pretreatment methods, representing another challenge to be addressed.

4. Conclusions

The results presented herein reveal important effects of melanoidins on the performance of dark fermentation depending on the relative amounts of glucose (fermentable substrate) and melanoidins. From a kinetic perspective, glucose (measured as total carbohydrates) consumption was negatively impacted by melanoidins, considering decreases in the first-order decay constant relative to a melanoidin-free fermentation medium. The findings also highlighted the role of melanoidins as drivers of shifts in microbial diversity and, consequently, in the prevailing metabolic pathways established during glucose fermentation. Overall, the presence of melanoidins changed the fermentative environment from a lactate-consuming (toward the production of acetate and butyrate) to a lactate-accumulating one. In practical aspects, defining whether this shift is adverse or not depends on the target metabolites: when biohydrogen production is aimed, which is usually associated with acetate and butyrate production, melanoidins definitely act as hindering agents. Meanwhile, they can act as natural inhibitors of lactate consumption in lactate-producing systems, favoring the growth of Lactobacillus, as observed in this study.

Author Contributions

Conceptualization, C.N.C., M.N.d.A. and L.T.F.; methodology, C.N.C., M.N.d.A., I.K.S. and L.T.F.; formal analysis, C.N.C., M.N.d.A. and L.T.F.; investigation, C.N.C.; writing—original draft preparation, C.N.C., M.N.d.A. and L.T.F.; writing—review and editing, C.N.C., M.N.d.A., L.T.F., I.K.S., M.H.R.Z.D. and A.J.d.S.; visualization, C.N.C., M.N.d.A. and L.T.F.; supervision, A.J.d.S.; funding acquisition, M.H.R.Z.D. and A.J.d.S. All authors have read and agreed to the published version of the manuscript.

Funding

This research was funded by the FUNDAÇÃO DE AMPARO À PESQUISA DO ESTADO DE SÃO PAULO (FAPESP), grant number 2015/06246-7, by the CONSELHO NACIONAL DE DESENVOLVIMENTO CIENTÍFICO E TECNOLÓGICO (CNPq), grant number 131601/2020-2, and the COORDENAÇÃO DE APERFEIÇOAMENTO DE PESSOAL DE NÍVEL SUPERIOR (CAPES) under the Finance Code 001. The APC was waived by the journal.

Institutional Review Board Statement

Not applicable.

Informed Consent Statement

Not applicable.

Data Availability Statement

The raw data supporting the conclusions of this article will be made available by the authors on request.

Acknowledgments

The authors thank Carolina A.S. Mirandola and Maria A.T. Adorno for their help and support during the laboratory work.

Conflicts of Interest

The authors declare no conflicts of interest.

References

  1. Liakos, T.I.; Lazaridis, N.K. Melanoidin removal from molasses effluents by adsorption. J. Water Process Eng. 2016, 10, 156–164. [Google Scholar] [CrossRef]
  2. Ortega-Martínez, E.; Chamy, R.; Jeison, D. Thermal pre-treatment: Getting some insights on the formation of recalcitrant compounds and their effects on anaerobic digestion. J. Environ. Manag. 2021, 282, 111940. [Google Scholar] [CrossRef] [PubMed]
  3. Zhang, D.; Feng, Y.; Huang, H.; Khunjar, W.; Wang, Z.W. Recalcitrant dissolved organic matter formation in thermal hydrolysis pretreatment of municipal sludge. Environ. Int. 2020, 138, 105629. [Google Scholar] [CrossRef] [PubMed]
  4. Echavarría, A.P.; Pagán, J.; Ibarz, A. Kinetics of color development of melanoidins formed from fructose/amino acid model systems. Food Sci. Technol. Int. 2014, 20, 119–126. [Google Scholar] [CrossRef]
  5. Borrelli, R.C.; Fogliano, V.; Monti, S.M.; Ames, J.M. Characterization of melanoidins from a glucose-glycine model system. Eur. Food Res. Technol. 2002, 215, 210–215. [Google Scholar] [CrossRef]
  6. Singh, K.; Tripathi, S.; Chandra, R. Maillard reaction product and its complexation with environmental pollutants. Bioresour. Technol. Rep. 2021, 15, 100779. [Google Scholar]
  7. Tripathi, S.; Sharma, P.; Singh, K.; Purchase, D.; Chandra, R. Translocation of heavy metals in medicinally important herbal plants growing on complex organometallic sludge of sugarcane molasses-based distillery waste. Environ. Technol. Innov. 2021, 22, 101434. [Google Scholar] [CrossRef]
  8. Ibarz, A.; Garza, S.; Pagán, J. Inhibitory effect of melanoidins from glucose-asparagine on carboxypeptidases activity. Eur. Food. Res. Technol. 2008, 226, 1277–1282. [Google Scholar] [CrossRef]
  9. Rufián-Henares, J.A.; De La Cueva, S.P. Antimicrobial activity of coffee melanoidins—A study of their metal-chelating properties. J. Agric. Food Chem. 2009, 57, 432–438. [Google Scholar] [CrossRef]
  10. Rurián-Henares, J.A.; Morales, F.J. Antimicrobial activity of melanoidins against Escherichia coli is mediated by a membrane-damage mechanism. J. Agric. Food Chem. 2008, 56, 2357–2362. [Google Scholar] [CrossRef]
  11. Diaz-Morales, N.; Ortega-Heras, M.; Diez-Maté, A.M.; Gonzalez-SanJose, M.L.; Muñiz, P. Antimicrobial properties and volatile profile of bread and biscuits melanoidins. Food Chem. 2022, 373, 131648. [Google Scholar] [CrossRef] [PubMed]
  12. Rufián-Henares, J.A.; Morales, F.J. Antimicrobial activity of melanoidins. J. Food Qual. 2007, 30, 160–168. [Google Scholar] [CrossRef]
  13. Dwyer, J.; Starrenburg, D.; Tait, S.; Barr, K.; Batstone, D.J.; Lant, P. Decreasing activated sludge thermal hydrolysis temperature reduces product colour, without decreasing degradability. Water Res. 2008, 42, 4699–4709. [Google Scholar] [CrossRef] [PubMed]
  14. Li, W.; Guo, J.; Cheng, H.; Wang, W.; Dong, R. Two-phase anaerobic digestion of municipal solid wastes enhanced by hydrothermal pretreatment: Viability, performance and microbial community evaluation. Appl. Energy 2017, 189, 613–622. [Google Scholar] [CrossRef]
  15. Liu, H.; Wang, J.; Liu, X.; Fu, B.; Chen, J.; Yu, H.Q. Acidogenic fermentation of proteinaceous sewage sludge: Effect of pH. Water Res. 2012, 46, 799–807. [Google Scholar] [CrossRef] [PubMed]
  16. Xue, Y.; Liu, H.; Chen, S.; Dichtl, N.; Dai, X.; Li, N. Effects of thermal hydrolysis on organic matter solubilization and anaerobic digestion of high solid sludge. Chem. Eng. J. 2015, 264, 174–180. [Google Scholar] [CrossRef]
  17. Yin, J.; Liu, J.; Chen, T.; Long, Y.; Shen, D. Influence of melanoidins on acidogenic fermentation of food waste to produce volatility fatty acids. Bioresour. Technol. 2019, 284, 121–127. [Google Scholar] [CrossRef]
  18. Arfaioli, P.; Ristori, G.G.; Bosetto, M.; Fusi, P. Humic-like compounds formed from L-tryptophan and D-glucose in the presence of Cu (II). Chemosphere 1997, 35, 575–584. [Google Scholar] [CrossRef]
  19. Oliveira, C.A.; Fuess, L.T.; Soares, L.A.; Damianovic, M.H.R.Z. Thermophilic biohydrogen production from sugarcane molasses under low pH: Metabolic and microbial aspects. Int. J. Hydrogen Energy 2020, 45, 4182–4192. [Google Scholar] [CrossRef]
  20. Fuess, L.T.; Fuentes, L.; Bovio-Winkler, P.; Eng, F.; Etchebehere, C.; Zaiat, M.; Nascimento, C.A.O. Full details on continuous biohydrogen production from sugarcane molasses are unraveled: Performance optimization, self-regulation, metabolic correlations and quanti-qualitative biomass characterization. Chem. Eng. J. 2021, 414, 128934. [Google Scholar] [CrossRef]
  21. Rasmey, A.H.M.; Abd-Alla, M.H.; Tawfik, M.A.; Bashandy, S.R.; Salah, M.; Liu, R.; Sun, C.; Hassan, E.A. Synergistic strategy for the enhancement of biohydrogen production from molasses through coculture of Lactobacillus brevis and Clostridium saccharobutylicum. Int. J. Hydrogen Energy 2023, 48, 25285–25299. [Google Scholar] [CrossRef]
  22. Fuess, L.T.; Zaiat, M.; Nascimento, C.A.O. Novel insights on the versatility of biohydrogen production from sugarcane vinasse via thermophilic dark fermentation: Impacts of pH-driven operating strategies on acidogenesis metabolite profiles. Bioresour. Technol. 2019, 286, 121379. [Google Scholar] [CrossRef] [PubMed]
  23. Sánchez, F.E.; Fuess, L.T.; Cavalcante, G.S.; Adorno, M.A.T.; Zaiat, M. Value-added soluble metabolite production from sugarcane vinasse within the carboxylate platform: An application of the anaerobic biorefinery beyond biogas production. Fuel 2021, 286, 119378. [Google Scholar] [CrossRef]
  24. Rogeri, R.C.; Fuess, L.T.; Eng, F.; Borges, A.V.; Araujo, M.N.; Damianovic, M.H.R.Z.; Silva, A.J. Strategies to control pH in the dark fermentation of sugarcane vinasse: Impacts on sulfate reduction, biohydrogen production and metabolite distribution. J. Environ. Manag. 2023, 325, 116495. [Google Scholar] [CrossRef] [PubMed]
  25. Rafigh, S.M.; Rahimpour Soleymani, A. Melanoidin removal from molasses wastewater using graphene oxide nanosheets. Sep. Sci. Technol. 2020, 55, 2281–2293. [Google Scholar] [CrossRef]
  26. Del Nery, V. Utilização de Lodo Anaeróbio Imobilizado Em Gel No Estudo de Partida de Reatores de Fluxo Ascendente Com Manta de Lodo. Master’s Thesis, University of São Paulo, São Carlos, SP, Brazil, 1987. [Google Scholar]
  27. Fernandes, B.S.; Saavedra, N.K.; Maintinguer, S.I.; Sette, L.D.; Oliveira, V.M.; Varesche, M.B.A.; Zaiat, M. The effect of biomass immobilization support material and bed porosity on hydrogen production in an upflow anaerobic packed-bed bioreactor. Appl. Biochem. Biotechnol. 2013, 170, 1348–1366. [Google Scholar] [CrossRef] [PubMed]
  28. Anzola-Rojas, M.P.; Fonseca, S.G.; Silva, C.C.; Oliveira, V.M.; Zaiat, M. The use of the carbon/nitrogen ratio and specific organic loading rate as tools for improving biohydrogen production in fixed-bed reactors. Biotechnol. Rep. 2015, 5, 46–54. [Google Scholar] [CrossRef] [PubMed]
  29. Chang, S.; Li, J.Z.; Liu, F. Evaluation of different pretreatment methods for preparing hydrogen-producing seed inocula from waste activated sludge. Renew. Energy 2011, 36, 1517–1522. [Google Scholar] [CrossRef]
  30. Zaiat, M.; Cabral, A.K.A.; Foresti, E. Reator anaeróbio de leito fixo para tratamento de águas residuárias: Concepção e avaliação preliminar de desempenho. Rev. Bras. Eng.—Cad. Eng. Quím. 1994, 11, 33–42. [Google Scholar]
  31. Dubois, M.; Gilles, K.A.; Hamilton, J.K.; Rebers, P.A.; Smith, F. Colorimetric methods for determination of sugar and related substance. Anal. Chem. 1956, 28, 350–356. [Google Scholar] [CrossRef]
  32. Adorno, M.A.T.; Hirasawa, J.S.; Varesche, M.B.A. Development and validation of two methods to quantify volatile acids (C2-C6) by GC/FID: Headspace (automatic and manual) and liquid-liquid extraction (LLE). Am. J. Anal. Chem. 2014, 5, 406–414. [Google Scholar] [CrossRef]
  33. APHA; AWWA; WEF. Standard Methods for the Examination of Water and Wastewater, 22nd ed.; APHA: Washington, DC, USA, 2012. [Google Scholar]
  34. Taylor, K.A.C.C. A simple colorimetric assay for muramic acid and lactic acid. Appl. Biochem. Biotechnol. 1996, 56, 49–58. [Google Scholar] [CrossRef]
  35. Camargo, E.F.M.; Ratusznei, S.M.; Rodrigues, J.A.D.; Zaiat, M.; Borzani, W. Treatment of low-strength wastewater using immobilized biomass in a sequencing batch external loop reactor: Influence of the medium superficial velocity on the stability and performance. Braz. J. Chem. Eng. 2002, 19, 267–275. [Google Scholar] [CrossRef]
  36. Gentleman, R.C.; Carey, V.J.; Bates, D.M.; Bolstad, B.; Dettling, M.; Dudoit, S.; Ellis, B.; Gautier, L.; Ge, Y.; Gentry, J.; et al. Bioconductor: Open software development for computational biology and bioinformatics. Genome Biol. 2004, 5, R80. [Google Scholar] [CrossRef] [PubMed]
  37. Glöckner, F.O.; Yilmaz, P.; Quast, C.; Gerken, J.; Beccati, A.; Ciuprina, A.; Bruns, G.; Yarza, P.; Peplies, J.; Westram, R.; et al. 25 years serving the community with ribosomal RNA gene reference databases and tools. J. Biotechnol. 2017, 261, 169–176. [Google Scholar] [CrossRef] [PubMed]
  38. Matsumoto, M.; Nishimura, Y. Hydrogen production by fermentation using acetic acid and lactic acid. J. Biosci. Bioeng. 2007, 103, 236–241. [Google Scholar] [CrossRef] [PubMed]
  39. Fuess, L.T. Fermentative biohydrogen production in sugarcane biorefineries: Advances, challenges and prospects. Int. J. Hydrogen Energy 2024, 49, 532–553. [Google Scholar] [CrossRef]
  40. Bahry, H.; Abdalla, R.; Pons, A.; Taha, S.; Vial, C. Optimization of lactic acid production using immobilized Lactobacillus rhamnosus and carob pod waste from the Lebanese food industry. J. Biotechnol. 2019, 306, 81–88. [Google Scholar] [CrossRef]
  41. Chen, H.; Chen, B.; Su, Z.; Wang, K.; Wang, B.; Wang, Y.; Si, Z.; Wu, Y.; Cai, D.; Qin, P. Efficient lactic acid production from cassava bagasse by mixed culture of Bacillus coagulans and Lactobacillus rhamnosus using stepwise pH controlled simultaneous saccharification and co-fermentation. Ind. Crop. Prod. 2020, 146, 112175. [Google Scholar] [CrossRef]
  42. de la Torre, I.; Ladero, M.; Santos, V.E. D-lactic acid production from orange waste enzymatic hydrolysates with L. delbrueckii cells in growing and resting state. Ind. Crop. Prod. 2020, 146, 112176. [Google Scholar] [CrossRef]
  43. Zhang, C.; Yang, H.Q.; Wu, D.J. Study on the reuse of anaerobic digestion effluent in lactic acid production. J. Clean. Prod. 2019, 239, 118028. [Google Scholar] [CrossRef]
  44. De Vos, P.; Garrity, G.M.; Jones, D.; Krieg, N.R.; Ludwig, W.; Rainey, F.A.; Schleifer, K.H.; Whitman, W.B.; Whitman, W.B. (Eds.) Bergey’s Manual of Systematic Bacteriology, 2nd ed.; Volume 3: The Firmicutes; Springer: New York, NY, USA, 2009. [Google Scholar]
  45. Etchebehere, C.; Castelló, E.; Wenzel, J.; Anzola-Rojas, M.P.; Borzacconi, L.; Buitrón, G.; Cabrol, L.; Carminato, V.M.; Carrillo-Reyes, J.; Cisneros-Pérez, C.; et al. Microbial communities from 20 different hydrogen-producing reactors studied by 454 pyrosequencing. Appl. Microbiol. Biotechnol. 2016, 100, 3371–3384. [Google Scholar] [CrossRef] [PubMed]
  46. Chen, Y.; Yu, B.; Yin, C.; Zhang, C.; Dai, X.; Yuan, H.; Zhu, N. Biostimulation by direct voltage to enhance anaerobic digestion of waste activated sludge. RSC Adv. 2016, 6, 1581–1588. [Google Scholar] [CrossRef]
  47. Wang, S.; Hu, Z.Y.; Geng, Z.Q.; Tian, Y.C.; Ji, W.X.; Li, W.T.; Dai, K.; Zeng, R.J.; Zhang, F. Elucidating the production and inhibition of melanoidins products on anaerobic digestion after thermal-alkaline pretreatment. J. Hazard. Mater. 2022, 424, 127377. [Google Scholar] [CrossRef] [PubMed]
  48. Zhao, W.; Yan, B.; Ren, Z.J.; Wang, S.; Zhang, Y.; Jiang, H. Highly selective butyric acid production by coupled acidogenesis and ion substitution elecrodialysis. Water Res. 2022, 226, 119228. [Google Scholar] [CrossRef] [PubMed]
  49. Pan, X.; Zhao, L.; Li, C.; Angelidaki, I.; Lv, N.; Ning, J.; Cai, G.; Zhu, G. Deep insights into the network of acetate metabolism in anaerobic digestion: Focusing on syntrophic acetate oxidation and homoacetogenesis. Water Res. 2021, 190, 116774. [Google Scholar] [CrossRef]
  50. Hatti-Kaul, R.; Chen, L.; Dishisha, T.; El Enshasy, H. Lactic acid bacteria: From starter cultures to producers of chemicals. FEMS Microbiol. Lett. 2018, 365, fny213. [Google Scholar] [CrossRef]
  51. Wiegel, J.; Tanner, R.; Rainey, F.A. An Introduction to the Family Clostridiaceae. In The Prokaryotes, 3rd ed.; Dworkin, M., Falkow, S., Rosenberg, E., Schleifer, K.H., Stackebrandt, E., Eds.; Springer: New York, NY, USA, 2006; pp. 654–678. [Google Scholar]
  52. Costa, O.Y.A.; Souto, B.M.; Tupinambá, D.D.; Bergmann, J.C.; Kyaw, C.M.; Kruger, R.H.; Barreto, C.C.; Quirino, B.F. Microbial diversity in sugarcane ethanol production in a Brazilian distillery using a culture-independent method. J. Ind. Microbiol. Biotechnol. 2015, 42, 73–84. [Google Scholar] [CrossRef] [PubMed]
  53. Kukuminato, S.; Koyama, K.; Koseki, S. Antibacterial Properties of Melanoidins Produced from Various Combinations of Maillard Reaction against Pathogenic Bacteria. Microbiol. Spectr. 2021, 9, e0114221. [Google Scholar] [CrossRef]
  54. Pérez-Burillo, S.; Rajakaruna, S.; Pastoriza, S.; Paliy, O.; Rufián-Henares, J.A. Bioactivity of food melanoidins is mediated by gut microbiota. Food Chem. 2020, 316, 126309. [Google Scholar] [CrossRef] [PubMed]
  55. Heipieper, H.J.; Neumann, G.; Cornelissen, S.; Meinhardt, F. Solvent-tolerant bacteria for biotransformation in two-phase fermentation systems. Appl. Microbiol. Biotechnol. 2007, 74, 961–973. [Google Scholar] [CrossRef]
  56. Poblete-Castro, I.; Becker, J.; Dohnt, K.; Santos, V.M.; Wittmann, C. Industrial biotechnology of Pseudomonas putida and related species. Appl. Microbiol. Biotechnol. 2012, 93, 2279–2290. [Google Scholar] [CrossRef] [PubMed]
  57. Schmidell, W.; Soares, H.M.; Etchebehere, C.; Javier Menes, R.; Bertola, N.C.; Martín Contreras, E. Tratamento Biológico de Águas Residuárias, 1st ed.; Gráfica PaperPrint: Florianópolis, SC, Brazil, 2007. [Google Scholar]
  58. Chen, A.; Huang, Y. Acyl homoserine lactone based quorum sensing affects phenanthrene removal by Novosphingobium pentaromativorans US6-1 through altering cell surface properties. Int. Biodeterior. Biodegrad. 2020, 147, 104841. [Google Scholar] [CrossRef]
  59. He, D.; Xiao, J.; Wang, D.; Liu, X.; Li, Y.; Fu, Q.; Li, C.; Yang, Q.; Liu, Y.; Ni, B.J. Understanding and regulating the impact of tetracycline to the anaerobic fermentation of waste activated sludge. J. Clean. Prod. 2021, 313, 127929. [Google Scholar] [CrossRef]
  60. Carbone, S.R.; Silva, F.M.; Tavares, C.R.G.; Dias Filho, B.P. Bacterial population of a two-phase anaerobic digestion process treating effluent of cassava starch factory. Environ. Technol. 2002, 23, 591–597. [Google Scholar] [CrossRef] [PubMed]
  61. Summa, C.; McCourt, J.; Cämmerer, B.; Fiala, A.; Probst, M.; Kun, S.; Anklam, E.; Wagner, K.H. Radical scavenging activity, anti-bacterial and mutagenic effects of Cocoa bean Maillard Reaction products with degree of roasting. Mol. Nutr. Food Res. 2008, 52, 342–351. [Google Scholar] [CrossRef] [PubMed]
  62. Song, N.; Cai, H.Y.; Yan, Z.S.; Jiang, H.L. Cellulose degradation by one mesophilic strain Caulobacter sp. FMC1 under both aerobic and anaerobic conditions. Bioresour. Technol. 2013, 131, 281–287. [Google Scholar] [CrossRef]
  63. Liang, Z.; Wang, Y.; Zhou, Y.; Liu, H.; Wu, Z. Variables affecting melanoidins removal from molasses wastewater by coagulation/flocculation. Sep. Purif. Technol. 2009, 68, 382–389. [Google Scholar] [CrossRef]
  64. Liang, Z.; Wang, Y.; Zhou, Y.; Liu, H.; Wu, Z. Stoichiometric relationship in the coagulation of melanoidins-dominated molasses wastewater. Desalination 2010, 250, 42–48. [Google Scholar] [CrossRef]
  65. Yu, J.; Hu, N.; Hou, L.; Hang, F.; Li, K.; Xie, C. Extraction methods of melanoidins and its potential as a natural pigment. Food Sci. Technol. 2023, 43, e113322. [Google Scholar] [CrossRef]
  66. Pant, D.; Adholeya, A. Biological approaches for treatment of distillery wastewater: A review. Bioresour. Technol. 2007, 98, 2321–2334. [Google Scholar] [CrossRef] [PubMed]
  67. Mohana, S.; Acharya, B.K.; Madamwar, D. Distillery spent wash: Treatment, technologies and potential applications. J. Hazard. Mater. 2009, 163, 12–25. [Google Scholar] [CrossRef] [PubMed]
Figure 1. Glucose and COD consumption profiles in the fed-batch experiments: (a) control reactor, (b) glucose-to-melanoidin (G/M) = 0.50, (c) G/M = 1.50, (d) G/M = 1.62, (e) G/M = 1.67, (f) G/M = 5.00.
Fermentation 10 00272 g001
Figure 2. Concentration of soluble metabolites in the control reactor (CR) and in the different glucose-to-melanoidin (G/M) ratios according to the experimental phase: (a) Phase I, (b) Phase II, and (c) Phase III. Nomenclature: HAc—acetic acid, HBu—butyric acid, HLa—lactic acid. Other metabolites include n-butanol, ethanol, propionic acid, iso-butyric acid, iso-valeric acid, valeric acid, and caproic acid.
Fermentation 10 00272 g002
Figure 3. Heat map of the relative abundance (RA; %) of the different genera detected in biomass samples collected from the control reactor (CR) and from reactors subjected to glucose-to-melanoidin (G/M) ratios of 1.67 and 5.00 based on amplicon sequencing of the 16S rRNA gene. Criterion for presenting the genera: RA ≥ 0.1% in at least one sample. Shades of black and yellow indicate higher and lower abundances, respectively.
Fermentation 10 00272 g003
Table 1. Concentrations of melanoidins and glucose according to each glucose-to-melanoidin (G/M) ratio.
G/M
(g Glucose g−1 Melanoidin)
Melanoidins 1
(g L−1)
Glucose 1
(g L−1)
CHt 2
(mg L−1)
CR 30.003.003360 ± 30
0.506.003.003025 ± 80
1.502.003.003300 ± 110
1.62 44.006.506050 ± 450
1.676.0010.0010,150 ± 580
5.002.0010.0010,260 ± 130
1 Theoretical concentration of the solutions used in the experiments. 2 Mean initial concentrations of total carbohydrates (CHt) measured in the experimental phases, considering Phases I, II, and III in CR and in G/M ratios of 0.5, 1.50, 1.62, and 5.00, and Phases I and II in the G/M ratio of 1.67. 3 Control reactor. 4 Experimental design central point.
Table 2. Kinetic parameters related to substrate consumption and performance assessment according to each glucose-to-melanoidin (G/M) ratio.
G/MCR
(Phase III) 1
0.50
(Phase III) 1
1.50
(Phase III) 1
1.62 2
(Phase III) 1
1.67
(Phase II) 1
5.00
(Phase III) 1
Kinetic parametersCS0 (mg L−1)3040 ± 1003030 ± 1853130 ± 1556265 ± 43010,650 ± 61510,415 ± 50
CRS (mg L−1)160 ± 120410 ± 90170 ± 1200 34410 ± 2200 3
k1 (d−1)0.62 ± 0.090.27 ± 0.050.37 ± 0.060.13 ± 0.020.19 ± 0.040.20 ± 0.01
R20.990.930.960.930.760.99
ECCHt (%)95.8 ± 0.396.1 ± 0.497.6 ± 0.196.8 ± 1.542.1 ± 2.296.6 ± 2.0
ERCOD (%)8.1 ± 0.1−0.5 ± 1.9 42.8 ± 2.0−15.7 ± 3.5 441.9 ± 1.28.4 ± 2.2
1 Refers to the experimental phase used to estimate the kinetic parameters and calculate ECCHt and ERCOD values reported in the table. 2 Experimental design central point. 3 Fixed values. 4 Negative values indicate final COD levels higher than the initial ones, most likely because of the interference of microbial biomass in the COD measurements. Nomenclature: CS0—initial substrate (CHt) concentration, CRS—residual substrate (CHt) concentration, k1—apparent kinetic constant, R2—coefficient of determination used to assess the quality of the fitting, ECCHt—total carbohydrate conversion efficiency, ERCOD—COD removal efficiency, CR—control reactor.
Table 3. Ecological indices of the sequences obtained from the massive sequencing of the 16S rRNA gene for samples collected from the control reactor (CR) and from reactors subjected to glucose-to-melanoidin (G/M) ratios of 1.67 and 5.00.
Ecological IndicesCRG/M = 1.67G/M = 5.00
Shannon–Wiener diversity1.621.311.28
Simpson dominance0.310.440.45
Chao-1352821
Disclaimer/Publisher’s Note: The statements, opinions and data contained in all publications are solely those of the individual author(s) and contributor(s) and not of MDPI and/or the editor(s). MDPI and/or the editor(s) disclaim responsibility for any injury to people or property resulting from any ideas, methods, instructions or products referred to in the content.

