Abstract
The ability to model the kinetics of wine fermentation enables the early detection of abnormal, sluggish or stuck fermentations, and the prediction of present and future rates of energy, CO2 and ethanol vapor release. While several wine fermentation models have been published, there are only a few that have been successfully adopted for commercial practice. In this work, the mathematical descriptions of wine fermentation are reviewed and compared. The common features of these include descriptions for the kinetics of yeast growth; substrate and nutrient consumption; product formation; and total and viable cell mass. Additional features include the inhibition of growth by ethanol; competitive inhibition of glucose and fructose uptake; glycerol formation; and the calculation of density from solution composition and solute properties. Three models were selected to compare their ability to describe the sugar, ethanol, biomass and nitrogen of benchtop fermentations at four temperatures, previously published. The models are assessed for their goodness of fit to the data in synthetic-medium fermentations and their suitability for analyzing and predicting commercial wine fermentations.
1. Introduction
Alcoholic fermentation is a critical bioprocessing step in the production of wine in that there are significant resources—labor, water, energy, chemistries—utilized in a short period of time each year and the wine can undergo significant irreversible chemical changes that impact the final quality and value. The fermentation season of wine usually occurs for between 6 to 8 weeks during the wine grape harvest, unlike that of beer, sake or other grain-based, ethanol fermentation products.
Wines of the highest value are usually made in small volumes, (2000 to 20,000 L) from small lots of grapes that capture characteristic aroma and flavor impact components, color and mouthfeel attributes from the cultivar. The value placed on such wines is related to the vineyard site from which the grapes were grown and the biochemistry that developed in the berries during the season. The capturing of the most valuable of the natural distribution in these components is achieved by keeping the grapes from small vineyards (or blocks within a vineyard) separate and fermenting them in small volumes, so that the resulting wine features can be classified. The use of larger fermenters implies that the grapes from several vineyards will be blended and that the potential uniqueness of each resulting wine is lost into an average of the grape loads before fermentation begins.
The segregated, small-volume approach to winemaking can lead to significant differences in the concentrations of nutrients such as amino acids, ammonia, and vitamins such as thiamine and pantothenate between the juices. In some cases, this can result in deficiencies that can lead to undesirable byproduct formation, altered yeast-growth patterns and residual, unfermented sugars at the end of the fermentation. The variation in the initial conditions becomes a major factor that distinguishes the fermentations and the need for adaptive models and parameter estimation for the characterization and health of each wine fermentation. In larger fermentation volumes, these deficiencies are effectively averaged out and rarely influence the fermentation pattern; this can lead to some confusion about scale effects on fermentation outcomes that are due to the initial conditions of composition.
The economic significance of the wine sector and the brief fermentation season would suggest that automated and accurate measurement, modeling and control strategies are utilized for optimal outcomes; however, in most wine fermentations, only temperature is measured and controlled in real time. In most cases, wine fermentations are monitored through manually drawn samples of density, once or twice each day. In some cases, density is measured in real time through techniques such as differential pressure [1,2]. In combination with sensors, kinetic models of fermentation should be able to identify abnormal patterns that can lead to sluggish and incomplete fermentations; characterize each fermentation in terms of a set of model parameters; predict the rates of energy, CO2 and ethanol vapor release; and be sensitive to the effects of winemaking operations such as temperature changes, the addition of nutrient supplements or added yeast inoculations.
The features of wine fermentations that provide the background for the development of models include the understanding that poor fermentation performance can be attributed to the combined effects of temperature and ethanol concentrations [3,4]; that nitrogen added in the form of ammonia salts can increase the rate of fermentation [3,4,5]; that amino acids were taken up at different rates in a sequential preferential manner in juice [6]; that the nitrogen assimilated was proportional to the amount of yeast growth [4]; and that additions to the juice of iron, copper or ascorbic acid can slow the fermentation development in some cases [3]; and early indications that there might be a role of redox potential in fermentation outcomes.
The history of models of wine fermentation can be traced to the growth description proposed by Monod [7] and the recognition of non-growth associated metabolism [8] or “maintenance energy” [9,10,11] and the recognition of cell viability [12]. All these descriptions were developed using bacterial fermentations. The corresponding evolution of models for yeast fermentations in the ethanol fermentation is based on the contributions of Aiba et al. (1965 and 1973) [13], Aiyar and Leudeking (1966) [14], Frederickson et al. (1970) [15], Pirt (1974) [16], Sawada et al. (1974) [17] and Mukataka and Kobayashi (1976) [18]. These yeast fermentation models generally consider the transport of sugar to be growth-rate limiting, the rate expression to be akin to the Michaelis–Menten form of sugar binding to a receptor and a function of the sugar concentration in the fermentation medium. These models also implied that internal metabolism was not controlling the growth rate; rather, it was the rate of substrate binding at the receptor–medium interface. An early text that provides this understanding of ethanol fermentations and the models available is by Aiba et al. [13].
The extension of these models to wine fermentations is due to Boulton and addresses initial sugar concentrations of 200 to 220 g/L, final ethanol concentrations of 100 to 110 g/L, substrate competition between glucose and fructose, the cell viability and age of the cell population, and fermentation temperature, all of which are characteristic of wine fermentations [19,20]. This included temperature functions for growth and maintenance activities and a time and ethanol term for cell viability. This model was subsequently modified to include the ethanol and water vapor emissions and density properties [21,22] and the dual-substrate nature of the carbon and nitrogen uptake [23], based on the proposals of Wright and Lockhart 1965 [24], Megee et al. 1972 [25], Tsao and Hansen 1975 [26], Bader 1978 [27], Lee et al. 1984 [28], and, subsequently, Egli 1991 [29]. The modified model can be written as a tri-substrate form with a term for vitamin limitation to describe juices that have been depleted by microbial modifications such as Botrytis cinerea or subjected to heat treatments.
In the last four decades, many model descriptions have been presented to describe the dynamics of ethanol and wine fermentation as well as beer [30], agave [31] and cider fermentations [32]. Two descriptive reviews of published wine fermentation models are provided elsewhere [33,34]. Several models are based on the sugar transport descriptions as the growth rate-limiting substrate(s) [35,36,37,38,39,40,41,42,43,44,45,46,47,48] while others have been expressed in terms of assimilable nitrogen as the growth-rate-limiting substrate [49,50,51,52,53,54,55,56,57]. There are alternative descriptions of the inhibition of growth by ethanol [36,58,59,60], differing temperature functions of specific growth, death and maintenance rates [45,61,62,63]; however, none have adopted the dual-substrate description for carbon and nitrogen limited growth or addressed the effect of time on cell viability other than as a first order decay.
The nitrogen-based growth equations are simply special cases of the dual-substrate form, where the sugar transporter is saturated, and its binding term is unity. Yeast cannot grow on nitrogen alone and so the role of sugar as the backbone of carbon and the source of energy in the cell is disguised but still present. While some models can fit the shape of the fermentation curves, their yeast properties, such as cell yield based on either carbon or nitrogen, or substrate preference between hexoses and nitrogen sources, are not in line with known and reported values. A number of models have focused on growth and total cell mass but do not address cell viability, which is a key component of the viable cell mass in the later stage of fermentation, where the sluggish nature is revealed. This is compounded in some cases where the decline in cell viability due to elevated temperature or cell age is attributed to, and sometimes compensated for, ethanol inhibition of growth or changing values in the cell yield. All the models based on assimilable nitrogen are unable to describe the observed hexose uptake preference during either the growth or maintenance phase because they do not include the sugar uptake term. Only a few models include a kinetic description of cell death, and most do not address cell age as a factor in either viability or the maintenance rates in non-growing cells. Only two models [64,65] include equations for the modeling of density, the primary measurement of all commercial fermentations.
The selective uptake of glucose and fructose, described by the expressions for enzyme–substrate binding, implies that hexose transport is substrate-controlling throughout the growth and maintenance stages of wine fermentations. The binding and uptake of nitrogen, while modeled by a similar binding function using the pool of assimilable nitrogen, is not the energy source, nor is it selective in its binding activity, although it determines the rate of growth, the extent of the growth period and the resulting cell mass.
The purpose of this work is to quantitatively compare the models by Boulton [20], Coleman [62] and the Australian Wine Research Institute (AWRI) [65] and their performance across a range of conditions experienced in actual wine fermentations. These three models were chosen for their features as the first wine-specific model (Boulton), widely cited models (Boulton, Coleman) and known models that have been applied to commercial fermentations (Boulton, AWRI). All three models are compared in terms of their descriptions of cell growth kinetics, substrate consumption kinetics, product formation kinetics, cell death kinetics and their ability to calculate density from solution properties. In this paper, the original Boulton model includes the updates for the dual-substrate-limited growth of carbon and nitrogen sources and additional terms of an exponential series expansion for cell viability as a function of cell age in the presence of ethanol.
1.1. Cell Growth Kinetics
In a biochemical model, the cell concentration or biomass is conventionally represented by the variable . Microorganisms grow under a variety of physical and chemical conditions and the rate of biomass growth is expressed by the specific growth rate, as follows:
where is the biomass concentration (kg/m3), is the time (h), and is the specific growth rate (1/h). Generally, the specific growth rate depends on the concentration of nutrients in the medium and is described by Monod’s equation [7]. While Monod’s equation is utilized, the same equation form is used to describe the enzyme-catalyzed reactions of one substrate and one product [66] and the attachment and release of a molecules to a surface [67]. In wine fermentations, “assimilable nitrogen”, as if it were a single substrate, is typically considered the limiting growth nutrient, yielding:
where is the maximum specific growth rate, is the concentration of the substrate (assimilable nitrogen [68,69]) and is the half-saturation constant for nitrogen. When the substrate is at a concentration of , the specific growth rate is 0.5 . The use of nitrogen instead of sugar implies that the limiting nutrient for cell growth is nitrogen. Since the growth rate is temperature-dependent, the temperature dependency of the maximum specific growth rate can be written as the Arrhenius equation:
where is the activation energy for cell growth (J/mol), is the universal gas constant (J/Kmol), and is the absolute temperature (K). The Arrhenius equation determines that the maximum specific growth rate increases exponentially as temperature increases. In reality, the specific growth rate of microorganisms decreases above a certain temperature, which is the temperature that yields their maximum growth rate [20]. This feature, originally proposed by Topiwala and Sinclair [12], was modified for wine yeast and introduced into the Boulton model as a second decaying exponential term, yielding:
In wine and all alcoholic fermentations, ethanol is known to inhibit cell growth. While alternative descriptions have been proposed [70,71] there are conflicting values of the inhibition constants between batch and continuous culture experiments, suggesting that other factors are involved. The Boulton model utilizes the following equation:
where is the ethanol concentration and is the ethanol concentration where cell division is ceased. The AWRI model uses an exponential self-inhibition written as follows:
where k is the product inhibition constant.
Monod’s equation assumes a balanced growth condition. The growth-limiting carbon substrates in wine are the hexose sugars (glucose and fructose). At higher sugar concentrations, the Monod growth term can be modified for self or substrate inhibition, by analogy with formulations from enzyme kinetics, written as:
where is the concentration of sugar, is the saturation constant for sugar and is the substrate inhibition constant. It is known that grape juice is made up of glucose and fructose in equal concentrations, and that these sugars are transported into the cell at different rates.
The growth rate, based on the transport of each sugar in the presence of their competitive inhibition, can be written as:
where and are constants that determine the substrate preference between glucose and fructose transport. Different wine yeast are known to display different substrate preferences [72], but in general, the commonly used strains are glucophylic in nature. The substrate preference in the Boulton model is based on the Montrachet strain (UCD# 522, ATCC# 36025).
The cell growth kinetics for the models in this study are tabulated in Table 1 below. In the Coleman and AWRI model, only nitrogen is utilized for biomass formation, while the Boulton model includes the dual-substate growth description of Bader [27] that incorporates both carbon and nitrogen terms with specific growth rates based on the fructose and glucose concentrations. All models include an Arrhenius temperature function that increases the maximum specific growth rate as temperatures increase; however, only the Boulton model also includes an Arrhenius temperature function to account for the observation that above a certain temperature (33 °C), the net yeast growth rate begins to decline, eventually becoming negative above 39 °C. The Coleman model uses an nth order polynomial for the death temperature function. The AWRI model incorporates an effect of vessel geometry and fermentation volume on the growth rate by estimating the shear stress through mixing from CO2 evolution.

Table 1.
Comparison of description of cell growth kinetics between the three models.
1.2. Substrate Consumption Kinetics
In wine fermentation, the major substrates are hexose sugars—fructose and glucose—and assimilable forms of nitrogen. The consumption of sugars can be attributed to the formation of biomass, maintenance of biomass and/or the formation of ethanol. The consumption of ethanol can be described by the stoichiometric formation from the sugars. When related to ethanol production, the sugar consumption can be written as:
The yield term () is included to account for the mass of ethanol produced per mass of sugar consumed. When the consumption of sugar is attributed to the formation of biomass, the specific growth rate can be used, yielding:
where is the mass of biomass formed per mass of carbon (sugars) consumed. A maintenance term is included to describe the consumption of sugar for the maintenance of viable biomass. Of the three models, only the Boulton model includes a maintenance term. The specific maintenance rate of the Boulton model is temperature-dependent with an Arrhenius form and is related to observations from continuous culture studies.
Assimilable nitrogen is considered a growth-limiting substrate in wine fermentation and is often related directly to growth rate; the cell yield based on nitrogen, , can be used to account the mass of biomass produced per mass of nitrogen consumed, resulting in a differential equation tied directly to the rate of change of the viable biomass, as follows:
The negative sign accounts for the fact that nitrogen is consumed while the biomass is formed. Table 2 shows the substrate consumption features for the three models. The Coleman and AWRI model describe the consumption of total sugars only in the formation of ethanol, while the Boulton model also includes a maintenance term and differentiates between fructose and glucose consumption. All three models utilize a yield term to relate the nitrogen consumption directly to biomass formation.
Table 2.
Comparison of description of substrate consumption kinetics between the three models.
1.3. Product Formation Kinetics
Microorganisms produce and export several substances under different conditions such as nutrition, redox potential, pH or dissolved oxygen. The general goal of fermentation is to make the microorganisms produce valuable products while minimizing the cost of the input substrates and related capital and operational expenses. For the purposes of modeling, typically only products that can be measured extracellularly are described. When the product formation occurs only during cell growth, the specific rate of product formation is as follows:
When the product can be made while cells are not growing, the specific rate of product formation is as follows:
When the product is both growth and non-growth associated, the specific rate of product formation is as follows:
An important product in wine fermentation is ethanol. Both the AWRI and Coleman model utilize a non-growth Monod-style sugar consumption rate. The specific utilization rate for sugar is:
where is the maximum specific utilization rate of sugar, is the sugar, and is the half-saturation constant for sugar. The specific utilization rate of sugar is then multiplied by the concentration of viable or active cells to give the following differential equation description for sugar:
Table 3 summarizes the descriptions of ethanol formation in the three models. The Boulton model relates the production of ethanol to the consumption of sugar, with a theoretical ratio of 92 g of ethanol produced per 180 g of hexose sugars consumed. The EYLD term accounts for the observation that the actual yield is 95% of the theoretical yield [20], with glycerol formation being the largest secondary product of these fermentations.
Table 3.
Comparison of descriptions of product formation kinetics between the three models.
1.4. Cell Death Kinetics
A unique feature of wine fermentations compared to beer fermentations, or similar lower-sugar fermentations, is that yeast growth has ceased approximately halfway through the fermentation. This means that the second half of wine fermentation is performed by the surviving yet dying yeast population, fermenting at a rate which is determined by their maintenance activity.
The simplest description of yeast death in wine fermentation is to assume 100% viability through the end of growth. From the maximum biomass X0, the viable cell mass () would decrease with an exponential decay, described as:
An addition variable, typically or can be used to describe the total biomass vs. viable or active biomass separately from the total biomass. The active biomass variable is used to acknowledge that not all viable cells are active in the consumption of substrates and formation of products [6]. Table 4 summarizes the description of cell death kinetics between the three models.
Table 4.
Comparison of descriptions of cell death kinetics between the three models.
1.5. Fermentation Energy Accumulation
The rise or fall of temperature during fermentation depends on the relative rate of heat generated by the volume compared to that transferred from the volume by intentional cooling or transfer to the surroundings. The rate of heat generation is proportional to the rate of fermentation and the fermentation volume, while the rate of heat removal depends on the heat exchange area(s) of the fermenter and the conduction properties of the materials through which energy is transferred. Wine fermentations can take place in wooden, concrete, or stainless steel fermenters and these display slightly different natural temperature profiles for the same fermentation volume and geometry. As a result, any fermentation model capable of analyzing such fermentations will need to have temperature functions incorporated into the rate equations. The Boulton model describes the rate of energy accumulation as the difference between the rate of energy generation and the rate of energy dissipation [73]. The rate of energy generation is related to the rate of sugar consumption and the enthalpy of the conversion of sugars to ethanol, generally accepted as 101.2 kJ/mole. The rate of energy dissipation is estimated by the energy transfer between the juice or must and a heat exchange area. While other cooling contributions, such as the removal of energy from water and ethanol vapors and radiated heat transfer from the ambient air and surroundings, the intentional cooling equipment, typically jacketed tanks or external heat exchangers, provides a good first approximation. The most common variation will be for fermentations performed outside, as the solar radiation and large diurnal temperature variations may be significant. Table 5 summarizes the descriptions of energy accumulation between the three models.
Table 5.
Description of rate of energy accumulation of Boulton model. The AWRI and Coleman model do not include a description of energy accumulations.
1.6. Juice Density from Solution Properties
The density of any liquid is equal to its mass () divided by its volume (). In grape juice, the mass can be estimated by the sum of contributions from water, glucose, fructose, ethanol, glycerol and a non-sugar extract in the fermenting mixture. The volume is estimated by the molar volume of the same components. Before fermentation begins the volume of water is as follows:
where is the molar volume of sugar, is the non-sugar extract and is the molar volume of the non-sugar extract. The volume at any point in time is written as:
where is the volume of glucose, fructose, ethanol, glycerol (estimated as 6.6% ethanol) and non-sugar extract.
Finally, the change of density is written as:
Table 6 summarizes the density calculations for the three models.
Table 6.
Comparison of calculations of density from solution properties between the three models. The Coleman model does not include a calculation of density.
Specific gravity is calculated from the ratio of the juice density to the density of water at a reference temperature. Weight loss is calculated from the change in mass of the solution compared to that of the initial juice, volume change is calculated from the corresponding solution and initial volumes. The following equations show the various specific gravity scales used in winemaking [74]:
Corrections of the density to 20 °C are based on the correction tables for sucrose solutions [75], as these are the tables that have generally been used for the correction of hydrometer and hand-held densitometer measurements. A set of equations for this temperature correction can be found in [1].
1.7. Calculation from Carbon Dioxide and Ethanol Release Rates
Due to environmental and worker safety concerns, it is also important to model the emission of carbon dioxide and ethanol vapor during fermentation. The volume of carbon dioxide released is estimated by the stoichiometric relationship between sugar and CO2 and the volume influenced by the gas temperature. Yeast metabolism produces two moles of CO2 per mole of sugar corresponding to 55 to 60 L CO2 per L, depending on the initial sugar concentration of the juice. The emissions of ethanol and water vapors in this carbon dioxide has previously been estimated from an assumption that the gas released is saturated in the vapor pressure of ethanol and water at the temperature of the fermenting juice [64]. These model predictions [64] provide the basis for the ethanol emission factors of 6.2 lb/Kgal for red wine fermentations and 2.5 lb/Kgal for white wine fermentations, used by the California Air Resources Board and the Environmental Protection Agency in the United States. The release of carbon dioxide from fermentation is the largest component of the carbon dioxide footprint of wineries and may be of more importance in direct carbon dioxide sequestration systems and carbon footprint reporting requirements in the future.
2. Materials and Methods
Models and Multi-Objective Optimization
Three models were programmed in MATLAB 2020b (MathWorks, Natick, MA USA). The three models were chosen for their features as the first wine-specific model [20], widely cited models [20,62] and models applied to commercial fermentations [20,65]. The multi-objective function solver in MATLAB 2020b was used to generate a Pareto front. The Pareto front is a set of solutions that show the best trade-off between multiple objective functions. For example, shifting a parameter set on the Pareto front to improve the sugar fit might make the nitrogen fit worse. The population size of the solver was set to 400 and no linear constraints were applied. Since multiple solutions on the Pareto front exist, the technique for order of preference by similarity to ideal solutions was used to select a solution from the Pareto front [76].
The states for the three models are shown in Table 7. All models include descriptions for total biomass, total sugar, assimilable nitrogen, and ethanol. Only models by Boulton and AWRI include an estimate of the solution density. Only the current version of the Boulton model differentiates the sugars by fructose and glucose, uses a dual-substrate growth equation and estimates the concentration of glycerol, weight loss as well as the rates of carbon dioxide, heat and ethanol and water-vapor release. These changes in physical attributes are important when the model is to be interfaced to measurements from alternative fermentation sensors at full scale.
Table 7.
States present in the models including total biomass, active/viable biomass, fructose, glucose, total sugar, nitrogen, ethanol, glycerol, density, weight loss and volume change.
The models contain unknown parameters that cannot be determined a priori and must be estimated by fitting the model to measurements. The Boulton parameter set is as follows:
where is the maximum specific growth rate (1/hr), is the lag time (hr), is the viability constant, is the ethanol inhibition constant and is the yield of biomass for nitrogen (dimensionless). The lower upper bounds used are and , respectively. In the Coleman model, temperature or nitrogen relationships are derived to estimate the parameters a priori. To compare equally with the other models, the derived temperature relationships are not used, and the parameters are estimated with the same method as the other models. The Coleman parameter set is as follows:
where is the maximum specific growth rate, is the death constant, is the yield of biomass per unit nitrogen and is the maximum specific rate of sugar utilization. The lower and upper bound used are and , respectively.
In the AWRI model, the biomass yield per unit of nitrogen () is fixed at 12 g/g. To equally compare with the Boulton and AWRI model, is estimated as an unknown parameter, yielding a parameter set of:
where is a factor of the pre-exponential factor of the Arrhenius function for maximum specific growth rate, is a factor of the pre-exponential factor of the Arrhenius function for death rate, is the Monod half-saturation constant for nitrogen, is the is a factor of the pre-exponential factor of the Arrhenius function for maximum specific growth rate, is the mixing (or consistency) coefficient and is the biomass yield per unit of nitrogen. The lower and upper bounds used are and , respectively.
In most analysis of fermentation models, the focus of the acceptability of the fit is dominated by a numerical measure, typically the root mean square error of the sum of squared residuals for the sugar state, as this is thought to be a direct relationship to the density or Brix, the measured variable of choice in commercial practice. The limitation in this type of analysis is that most fermentations models are a set of ordinary differential equations that are coupled. In a rigorous interpretation of a first-principle model, all states should have acceptable fits to the measured data. If no such solution exists, then the model is missing features that can describe the dataset or assumed constants need to be adjusted for the particular dataset. For this reason, a dataset that provides measurements of multiple states and a constant temperature was used. This is the dataset presented by Coleman et al. [62], which provides the sugar, ethanol, assimilable nitrogen, and cell mass concentrations with time for the temperatures, sugar and initial nitrogen concentrations shown in Table 8. In this juice-modified medium used, ammonium accounted for more than 85% of the assimilable nitrogen, in a background of amino nitrogen, at 45 mg/L.
Table 8.
Features of the dataset used in the multi-objective optimization. Dataset shown is the “high nitrogen” juices from [62].
3. Results
The model outcomes and original data for the temperatures of 11, 15, 30 and 35 °C are shown in Figure 1 through 4, respectively.
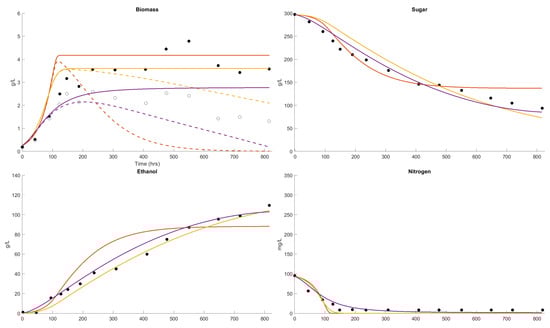
Figure 1.
Dataset 1 Fit. Fermentation was performed at 11 °C and the sugar, biomass, nitrogen, ethanol (closed circle) and viable biomass (open circle) were measured [62]. The fits of the Boulton model (purple), Coleman model (orange) and AWRI model (yellow) were compared. The parameter solution sets were and .
In Figure 1, the fermentation would be classified as stuck or incomplete, with 90 g/L of sugar remaining after 800 h (33.3 days). The growth in cell mass has finished after 250 h (10.4 days), yielded 3.6 g/L and not all the assimilable nitrogen was consumed. This is an extreme case, and an expected outcome, with the initial conditions of 300 g/L sugar and 100 mg/L of assimilable nitrogen and at 11 °C. The Boulton model provides the best description of this fermentation outcome in terms of all the variables. The Coleman model consumes all the nitrogen and terminates growth, sugar consumption and ethanol formation earlier and indicates that less sugar is consumed with the active cell mass declining to zero at 500 h (20.8 days). The AWRI model indicates delayed sugar consumption and ethanol formation, all the nitrogen consumed and cell viability showing little decline with time. None of the models describe the residual of assimilable nitrogen in this low-nitrogen example, although the Boulton model has a residual assimilable nitrogen.
In Figure 2, the conditions are similar to those shown in Dataset 1 except that the initial sugar is 265 g/L, the initial assimilable nitrogen is 80 mg/L and the temperature is 15 °C. The fermentation would be classified as stuck or incomplete, with 50 g/L sugar remaining after 700 h (29.1 days). The growth in cell mass has finished after 200 h (8.3 days), yielded 3.5 g/L and not all the assimilable nitrogen was consumed. This is a cold white wine fermentation temperature, and an expected outcome, with the initial conditions of 265 g/L sugar and 80 mg/L of assimilable nitrogen. The Boulton model provides the best description for the sugar consumption and ethanol formation. The Coleman model indicates slower sugar consumption and ethanol formation. The Coleman and AWRI models estimate similar cell mass formation and early termination of growth at 100 h (4.2 days) when all the nitrogen has been depleted. The Boulton model suggests no active cell mass after 550 h (22.9 days). The AWRI model indicates little decline in the active cell mass. None of the models describe the residual assimilable nitrogen of 10 mg/L, although the Boulton model shows a residual assimilable nitrogen greater than 0.
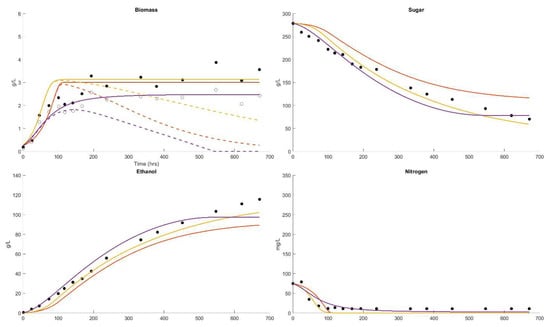
Figure 2.
Dataset 2 Fit. Fermentation was performed at 15 °C and the sugar, biomass, viable biomass, nitrogen and ethanol were measured [62]. The fits of the Boulton model (purple), Coleman model (orange) and AWRI model (yellow) were compared. The parameter solution sets were and .
The third example (Figure 3) is with 265 g/L sugar, a high initial nitrogen concentration of 330 mg/L and a fermentation temperature of 30 °C. This fermentation would also be classified as incomplete, with the sugar at 30 g/L after 250 h (10.4 days) at a common red wine fermentation temperature. The cell mass formed is 5 g/L and all the assimilable nitrogen is consumed. The ethanol formation reported (140 g/L) is higher than might be expected (115 g/L) from the sugar consumed. The Boulton and Coleman models describe sugar consumption better than the AWRI model. The AWRI model overestimates the final cell mass, suggesting a higher-than-expected cell yield based on nitrogen. The two other models describe the highest values they are slightly higher than the average of 5 g/L in the data. None of the models describes the ethanol formation of 140 g/L but the Coleman model describes the ethanol formation of 140 g/L, while the Boulton and AWRI models underestimate the ethanol formation. All the models describe the complete consumption of the high initial nitrogen concentrations at similar times.
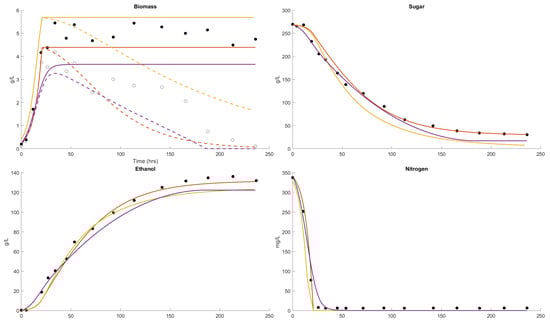
Figure 3.
Dataset 3 Fit. Fermentation was performed at 30 °C and the sugar, biomass, viable biomass, nitrogen and ethanol were measured [62]. The fits of the Boulton model (purple), Coleman model (orange) and AWRI model (yellow) were compared. The parameter solution sets were and .
The fourth example is for similar conditions to Dataset 2 but with an initial sugar concentration of 300 g/L and a fermentation temperature of 35 °C. This temperature is an upper temperature limit for some red wine fermentations, above the temperature for maximum growth rate (33 °C) and yet below the maximum temperature for growth (39 °C). The fermentation outcome is stuck or incomplete, essentially arrested after 200 h (8.3 days), with 100 g/L residual sugar after 300 h (12.5). The cell mass was formed of 3 g/L, with growth ceasing after 40 h, leaving a residual of unused nitrogen of 15 mg/L. All models estimate similar cell mass curves to the reported values. The Coleman and AWRI models both predict complete consumption of the nitrogen, while the Boulton model predicts the residual nitrogen outcome that is observed. Dataset 4 displays active fermentation at the beginning of the experiment. All models predict an initial lag period that is not observed.
Apart from predicting the ultimate outcome, the conditions at the point of the cessation of growth provide an early indication of later fermentation performance. In this regard the Boulton model provides an early diagnosis based on sugar concentration, for all cases. The Coleman model fails in this regard in the 11 °C case, while the AWRI fails in all these cases.
The temperature relationships of the Coleman and AWRI models do not appear to capture the effect of elevated temperature on yeast growth rate in the supra-optimal temperature range shown in Figure 4. They both continue growth until all assimilable nitrogen is consumed, when it appears that growth is terminated due to temperature in this case.
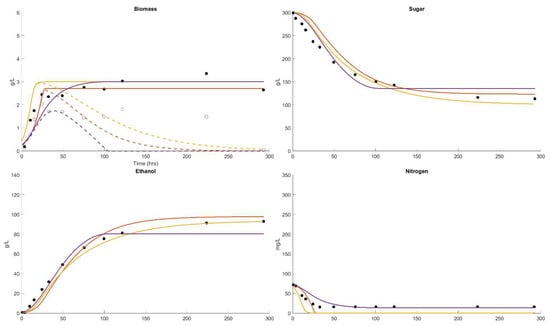
Figure 4.
Dataset 4 Fit. Fermentation was performed at 35 °C and the sugar, biomass, viable biomass, nitrogen and ethanol were measured [62]. The fits of the Boulton model (purple), Coleman model (orange) and AWRI model (yellow) were compared. The parameter solution sets were and .
4. Discussion
The Coleman et al. study [62] used the Methylene blue staining technique to count viable cell mass and the term active biomass. Anecdotal evidence exists that the viability measured by this method can be as high as 50% at the end of some stuck fermentations. The term “viable, non-culturable” is now used to describe conditions in which intact cells cannot grow yet they still display viability according to this assay. A more relevant description might be “viable, non-fermenting” when viability assays are used for the assessment of cell activity in the secondary, survival stage of wine fermentation. Methylene blue is a pH-sensitive dye that can penetrate yeast cells, but it is also a redox dye, meaning that its color is a function of the internal cell potential. Variations in viable cell mass due to staining measurement inaccuracies has led to the introduction of the term “vitality” [77], which is defined as the compromising of a cell’s ability to divide but not die, and has been estimated using impedance measurements [78]. In contrast, the term “viability” is used to describe that cell death has occurred and this is more effectively measured than yeast “activity”. Due to the potential measurement inaccuracies of the Methylene blue staining technique used in the dataset, the reported viable cell concentrations were not used in the multi-objective optimization.
The loss in viability with cell age is probably one of the reasons why earlier studies could not rationalize the different uptake constants or ethanol-inhibition expressions derived from continuous culture with those from batch culture [70]. Incorporating an expression to account for viability is essential, rather than simply adopting a first order death due to the ethanol concentration, is needed in future models. The role of temperature in cell viability throughout a wine fermentation [79] demonstrates the nature of this decline with time. This decline cannot be explained by a first order decay, as most models for cell death have proposed [40,44,45,51,56,62]. In contrast, the simple expression involving both ethanol concentration and time (indirectly a measure of cell age) originally suggested in [20] still provides a better description of observed cell death. The temperature function for this decline is included in the current Boulton model.
The wine-like medium used in this study contains primarily ammonia as the nitrogen source. In actual wines, the “assimilable nitrogen” will be a combination of nitrogen from most amino acids, except proline, as well as that from ammonia, often in similar proportions. All the models being compared are using this assimilable nitrogen variable. Further work is needed to evaluate the precision to which the nitrogen uptake by different yeast strains from different juices is described by this lumped nitrogen variable approach. The transport of ammonia is known to differ from that of amino acids, and is under different regulatory control than that of amino acids, especially the general acid permease, which accounts for the uptake of most of the amino acids. One logical extension of these models would be to consider developing two parallel uptake equations, one for ammonia nitrogen and the other for the most preferred amino acids, based on the general acid permease or GAP [80]. Nitrogen preference among the amino acids and ammonia is known to be different [5,6,81], as is the cell mass yield per unit of nitrogen [82,83,84]; however, the amino acid concentration information that would be required to evaluate such terms in future models is considerable. A good dataset that could be used to test such models already exists [21]. Reports covering transport properties and gene expression in Saccharomyces cerevisiae in the presence of different medium compositions and as a result of nitrogen depletion [85,86,87,88,89,90,91] demonstrate the regulation and control of the nitrogen flux into cells, but the kinetics and modeling of this aspect of cell growth in wine fermentations remains nonexistent.
Since the current models do not distinguish between the nitrogen sources, it might be concluded that nitrogen uptake, while linked to the controlling metabolic flux that determines the growth rate, is not selective, which is why their uptake and contribution to growth rate are not related to their individual concentrations in the medium. The use of YAN as a measure of nitrogen for nitrogen-limited growth provides a satisfactory approximation in juice fermentation; this is to be expected, due to the limitation of cell mass development. However the non-selective nature of this uptake points towards the transport being coupled or synchronized to the hexose transport; it is not growth rate-limiting by itself, as several models consider it to be [50,51,56,57,92].
Ammonium transport involves proton co-transport [93] and the transporter is thought to also be a sensor for the external concentration [94], yet several models use cell mass relationships that lead to unnatural cell-yield estimates, even though the nitrogen requirements for desirable fermentation rates are known to vary by a factor of two between wine yeast strains [95,96]. The difference in uptake preference between juice fermentation [68], where it is depleted quickly, to that in wort, approximately one pH unit higher, where it is among the last [83], remains to be explained, but may be related to proton and potassium gradients across the cell membrane, typically by a cation-swapping ATPase.
Early studies showed that either carbon- or nitrogen-limited growth could occur at different growth rates [24], where one was a carbon source (glucose) and the other was a nitrogen source (ammonia). The mathematical description of dual-substrate growth was proposed by Bader in 1976 [27] using a product of the Monod-like expressions for each substrate. In the case of wine fermentation, the dual substrates are carbon (hexoses) and nitrogen (amino acids and ammonia). The Boulton model was modified to include such a dual-substrate growth expression for carbon and nitrogen interaction in 1986 and as such the first model to account for the role of assimilable nitrogen in wine fermentations. It could be expanded as a three-term expression with one for ammonia and another for amino nitrogen, even though the lumped YAN concentration seems to be an acceptable approximation at this time.
The role of assimilable nitrogen is to determine how long growth can be sustained and as a result, the final cell mass formed. This results in the maximum rate of fermentation near the end of growth when the viable cell concentration is maximal and establishes the fermentation rate going into the non-growing phase of fermentation, where the cell viability and maintenance rate determine the tailing rates and extent. The assimilable nitrogen concentration plays no significant role in the fermentation once growth has ceased. When the growth rate is reduced by thermal death at temperatures above 33 °C, there can be a residual of unused nitrogen, and this can be seen in Figure 4. Only the Boulton model can describe this high-temperature, incomplete fermentation outcome satisfactorily.
Yield based on carbon and nitrogen from a cellular perspective should be essentially constant, but some modes have used cell yield as a variable property, at odds with the knowledge of cell composition. Cell numbers and cell mass are directly proportional to the assimilable nitrogen consumed [4]. The molar ratio of carbon to nitrogen in cells of Saccharomyces cerevisiae is known to be 6.33 [96,97]. While several model cell mass relationships that are based on the initial nitrogen concentration, at higher concentrations, not all of it is taken up, leading to unnatural cell yield estimates.
It should also be noted that models describing the metabolic pathways [98,99,100,101], behavior of yeast population [102] and data-based models [103,104] have also been explored, but their application to density measurements in commercial fermentation appears limited or non-existent. Models describing the metabolic pathways or behavior of yeast populations utilize many unknown parameters and constants, making their estimation more challenging. Additionally, modeling the internal behavior of the cell becomes irrelevant if the transfer of substrates/products across the cell membrane is the rate-limiting step, as it appears to be. Data-based models in which data are used in lieu of differential equations describing the process typically fail to identify abnormal fermentations and cannot predict the response to future events that influence the dynamics of fermentations such as temperature changes, nutrient additions, aerations, or the control of redox potential. Simple models that describe the fermentation as a sigmoidal or Gompertz curve with unknown parameters to adjust the shape of the curve, such as the kinetic description by Haloui et. al. [105,106], lack a description of the underlying physical phenomena. These models fail to describe fermentations that are not perfectly sigmoidal, as is common in commercial wine fermentation due to temperature variations, changes in nutrient status and other extracellular changes such as redox potential or pH. Hybrid first-principle models have also been developed [55]. Hybrid models combine features of multiple models and/or select features of different models to use in certain conditions such as temperature, starting sugar or initial nitrogen concentration. A significant limitation of hybrid models is reconciling when and which model best describes the current stage of fermentation. Additionally, many models have contradictions in their descriptions, making first-principle interpretation of the fermentation challenging.
While most models include estimates for sugar, ethanol, nitrogen, and biomass, none of these variables are measured as a function of time during commercial fermentation. In practice, density is used as an indirect measurement of the consumption of sugars. To our knowledge, the only models that include a calculation density from solution properties are by Boulton and AWRI. The calculation of density by the AWRI model is limited in that it is a function of only the sugar concentration. It does not account for the formation of the less dense ethanol that is formed from the sugar nor the formation of glycerol.
None of the published models consider vitamin-limitation of growth, maintenance, or cell viability in the fermentation medium. Unfortunately, there is a limited understanding of the role of cell age and characteristics in the non-growing maintenance phases of wine fermentations. Although the vitamin requirements of each yeast strain (or estimates of them) will be needed, the three-term version of the current Boulton model that includes the vitamin limitation term is able to describe the slow and sluggish fermentation of juices where the vitamin pool has been modified by Botrytis cinerea or thermal treatments. It is the only model that is capable of describing such situations now that examples of vitamin deficiencies in the incomplete fermentations of natural juices have been reported [107]. Yeasts are considered to have a defined lifetime that is strain-dependent. This suggests a strong genetic component related to cAMP metabolism and the accumulation of certain rDNA molecules [11].
The other compositional factor that has yet to be incorporated into any of these fermentation models is dissolved oxygen. While the growth and fermentation are generally described as being anaerobic, there are several examples in which periodic aeration or increases in dissolved oxygen have shown a stimulatory effect, reducing the length or extent of the fermentation [4,108,109,110]. These results appear to be due to changes in the redox potential of the medium that are causing changes in either growth, non-growing activity or cell viability [110]. The change in the redox potential due to an increase in dissolved oxygen will depend on the iron (II) and tartaric acid concentrations of the medium and the redox buffering of the reactive couples in the medium, in particular, that of glutathione. Most of the increase in dissolved oxygen in juice-like media will be unreactive; the changes in redox potential will become independent of the concentration. The limited understanding and inability to calculate the redox potential in such a reactive mixture prevents the modification of yeast properties and wine fermentation models in order to account for the oxygen effect.
All models used in this work rely on an incomplete description to predict the complex biochemical process in aging cells that is influenced by many variables such as vitamin concentrations, pH, and redox potential. Additionally, all models assume that properties of growth, maintenance and viability are not age-related. The yeast population is known to be a distribution of different ages, made up of cells from between four and five generations. For future improvements to these models, the number of bud scars on each cell, or any other observable measure of past divisions, would be an indicator of cell age and might be expected to account for changes in the number or efficiency of transport channels or carriers in the cell membrane.
All existing models consider cell populations to have uniform properties, a single transport system for assimilable nitrogen, and, in most cases, a single transport system for the sugars, without regard for the differential uptake of glucose and fructose [72,111]. This is in the presence of knowledge of high- and low- affinity transporters, and other hexose transporters [112,113,114,115,116,117], a general amino acid permease [80,118,119,120], secondary selective amino acid transport systems [120,121,122,123,124] and a separate ammonium transporter [93,94]. Future models should focus on describing parallel, multiple transporter systems for hexose sugars and nitrogen sources that have been elucidated from genetic research on yeast.
5. Conclusions
Wine fermentation is a complex biochemical process with unique features such as highly variable initial chemistries, high ethanol, high sugar, long fermentation times and seasonal resource constraints. The features describing alcoholic fermentations were compared and discussed, and three models were evaluated using an available dataset across temperature, initial nitrogen, and initial sugar. While all models lack a complete description, the Boulton model appears to best describe the coupled relationships of sugar and nitrogen consumption, ethanol production and cell death. Further work is needed to differentiate between nitrogen sources and to quantify variations between the transport properties of different yeast strains.
Author Contributions
Conceptualization, J.N. and R.B.; methodology, J.N.; software, J.N.; validation, J.N. and R.B.; formal analysis, J.N. and R.B.; investigation, J.N. and R.B.; data curation, J.N.; writing—original draft preparation, J.N.; writing—review and editing, J.N. and R.B.; visualization, J.N.; supervision, R.B. All authors have read and agreed to the published version of the manuscript.
Funding
This research received no external funding.
Institutional Review Board Statement
Not applicable.
Informed Consent Statement
Not applicable.
Data Availability Statement
The raw data supporting the conclusions of this article will be made available by the authors on request.
Acknowledgments
Rodgers University Fellowship in Electrical and Computer Engineering.
Conflicts of Interest
The authors declare no conflicts of interest.
References
- Nelson, J.; Boulton, R.; Knoesen, A. Automated Density Measurement with Real-Time Predictive Modeling of Wine Fermentations. IEEE Trans. Instrum. Meas. 2022, 71, 1–7. [Google Scholar] [CrossRef]
- Jaywant, S.A.; Singh, H.; Arif, K.M. Low-Cost Sensor for Continuous Measurement of Brix in Liquids. Sensors 2022, 22, 9169. [Google Scholar] [CrossRef] [PubMed]
- Schanderl, H. Mikrobiologie Des Mostes Und Weines. Handbuch Der Kellerwitschaft II; Verlag Eugen Ulmer: Stuttgart, Germany, 1959. [Google Scholar]
- Ribéreau-Gayon, J.; Peynaud, E. Traite d’Oenologie I.; Librairie Polytechnique Beranger: Paris, France, 1964. [Google Scholar]
- Castor, J.G.B.; Archer, T.E. The Free Amino Acids of Musts and Wines. III. Effect of Added Ammonia and of Fermentation Temperature on the Fate of Amino Acids During Fermentation. J. Food Sci. 1959, 24, 167–175. [Google Scholar] [CrossRef]
- Castor, J.G.B. The Free Amino Acids of Musts and Wines. II. The Fate of Amino Acids of Must During Alcoholic Fermentation. J. Food Sci. 1953, 18, 146–151. [Google Scholar] [CrossRef]
- Monod, J. The Growth of Bacterial Cultures. Annu. Rev. Microbiol. 1949, 3, 371–394. [Google Scholar] [CrossRef]
- Luedeking, R.; Piret, E.L. A Kinetic Study of the Lactic Acid Fermentation. Batch Process at Controlled pH. Biotechnol. Bioeng. 1959, 1, 393–412. [Google Scholar] [CrossRef]
- Marr, A.G.; Nilson, E.H.; Clark, D.J. The Maintenance Requirement of Escherichia Coli. Ann. N.Y. Acad. Sci. 1963, 102, 536–548. [Google Scholar] [CrossRef]
- Pirt, S.J. The Maintenance Energy of Bacteria in Growing Cultures. Proc. R. Soc. Lond. B. 1965, 163, 224–231. [Google Scholar] [CrossRef]
- Sinclair, D.; Mills, K.; Guarente, L. Aging in Saccharomyces Cerevisiae. Annu. Rev. Microbiol. 1998, 52, 533–560. [Google Scholar] [CrossRef]
- Topiwala, H.; Sinclair, C.G. Temperature Relationship in Continuous Culture. Biotech. Bioeng. 1971, 13, 795–813. [Google Scholar] [CrossRef]
- Aiba, S.; Humphrey, A.E.; Millis, N.F. Biochemical Engineering, 1st ed.; Academic Press: New York, NY, USA, 1965; ISBN 978-0-12-045052-7. [Google Scholar]
- Aiyar, A.S.; Luedeking, R. A Kinetic Study of the Alcoholic Fermentation of Glucose by Saccharomyces Cerevisiae. Chem. Eng. Prog. Symp. Ser. 1966, 62, 55–59. [Google Scholar]
- Fredrickson, A.G.; Megee, R.D.; Tsuchiya, H.M. Mathematical Models for Fermentation Processes. In Advances in Applied Microbiology; Elsevier: Amsterdam, The Netherlands, 1970; Volume 13, pp. 419–465. ISBN 978-0-12-002613-5. [Google Scholar]
- Pirt, S.J. Principles of Microbe and Cell Cultivation; Wiley: New York, NY, USA, 1975; ISBN 978-0-470-69038-3. [Google Scholar]
- Sawada, T.; Kojima, Y.; Takamatsu, T. Growth Model and Control of Biochemical Reaction. J. Chem. Eng. Jpn. 1974, 7, 368–373. [Google Scholar] [CrossRef]
- Mukataka, S.; Kobayashi, J. A Kinetic Model in Alcohol Fermentation. Kagaku Kogaku Ronbunshu 1976, 2, 572–576. [Google Scholar] [CrossRef]
- Boulton, R. Kinetic Model for the Control of Wine Fermentations. Biotechnol. Bioeng. Symp. 1979, 9, 167–177. [Google Scholar]
- Boulton, R. The Prediction of Fermentation Behavior by a Kinetic Model. Am. J. Enol. Vitic. 1980, 31, 40–45. [Google Scholar] [CrossRef]
- Williams, L.A.; Boulton, R. Modeling and Prediction of Evaporative Ethanol Loss During Wine Fermentations. Am. J. Enol. Vitic. 1983, 34, 234–242. [Google Scholar] [CrossRef]
- Williams, L.A. Heat Release in Alcoholic Fermentation: A Critical Reappraisal. Am. J. Enol. Vitic. 1982, 33, 149–153. [Google Scholar] [CrossRef]
- Hansen, H.D. A Study of Fermentation Behavior and Alcohol Dehydrogenase Activity in the Yeast Saccharomyces Cerevisiae; University of California: Davis, CA, USA, 1986. [Google Scholar]
- Wright, D.N.; Lockhart, W.R. Environmental Control of Cell Composition in Escherichia Coli. J. Bacteriol. 1965, 89, 1026–1031. [Google Scholar] [CrossRef] [PubMed]
- Megee Iii, R.D.; Drake, J.F.; Fredrickson, A.G.; Tsuchiya, H.M. Studies in Intermicrobial Symbiosis. Saccharomyces Cerevisiae and Lactobacillus Casei. Can. J. Microbiol. 1972, 18, 1733–1742. [Google Scholar] [CrossRef]
- Tsao, G.T.; Hanson, T.P. Extended Monod Equation for Batch Cultures with Multiple Exponential Phases. Biotech. Bioeng. 1975, 17, 1591–1598. [Google Scholar] [CrossRef]
- Bader, F.G. Analysis of Double-substrate Limited Growth. Biotech. Bioeng. 1978, 20, 183–202. [Google Scholar] [CrossRef] [PubMed]
- Lee, A.L.; Ataai, M.M.; Shuler, M.L. Double-substrate-limited Growth of Escherichia Coli. Biotech. Bioeng. 1984, 26, 1398–1401. [Google Scholar] [CrossRef] [PubMed]
- Egli, T. On Multiple-Nutrient-Limited Growth of Microorganisms, with Special Reference to Dual Limitation by Carbon and Nitrogen Substrates. Antonie Van Leeuwenhoek 1991, 60, 225–234. [Google Scholar] [CrossRef] [PubMed]
- De Andrés-Toro, B.; Girón-Sierra, J.M.; Fernández-Conde, C.; Peinado, J.M.; Garcia-Ochoa, F. A Kinetic Model for Beer Production: Simulation Under Industrial Operational Conditions. IFAC Proc. Vol. 1997, 30, 203–208. [Google Scholar] [CrossRef]
- Arellano-Plaza, M.; Herrera-López, E.J.; Diaz-Montaño, D.; Moran, A.; Ramírez-Córdova, J. Unstructured Kinetic Model for Tequila Batch Fermentation. Int. J. Math. Comput. Simul. 2007, 1, 1–6. [Google Scholar]
- Kelkar, S.; Dolan, K. Modeling the Effects of Initial Nitrogen Content and Temperature on Fermentation Kinetics of Hard Cider. J. Food Eng. 2012, 109, 588–596. [Google Scholar] [CrossRef]
- Marín, M.R. Alcoholic Fermentation Modelling: Current State and Perspectives. Am. J. Enol. Vitic. 1999, 50, 166–178. [Google Scholar] [CrossRef]
- Miller, K.V.; Block, D.E. A Review of Wine Fermentation Process Modeling. J. Food Eng. 2020, 273, 109783. [Google Scholar] [CrossRef]
- Yamané, T.; Shiotani, T. Interrelationship among Specific Rates of Cell Growth, Substrate Consumption, and Metabolite Formation in Some Simple Microbial Reactions Producing Primary Metabolites. Biotech. Bioeng. 1981, 23, 1373–1387. [Google Scholar] [CrossRef]
- Novak, M.; Strehaiano, P.; Moreno, M.; Goma, G. Alcoholic Fermentation: On the Inhibitory Effect of Ethanol. Biotech. Bioeng. 1981, 23, 201–211. [Google Scholar] [CrossRef]
- Bovee, J.P.; Strehaiano, P.; Goma, G.; Sevely, Y. Alcoholic Fermentation: Modelling Based on Sole Substrate and Product Measurement. Biotech. Bioeng. 1984, 26, 328–334. [Google Scholar] [CrossRef] [PubMed]
- Shukla, H.; Viswanathan, L.; Shukla, N.P. Reaction Kinetics of D-Glucose Fermentation by Saccharomyces Cerevisiae. Enzym. Microb. Technol. 1984, 6, 560–564. [Google Scholar] [CrossRef]
- Nanba, A.; Nishizawa, Y.; Tsuchiya, Y.; Nagai, S. Kinetic Analysis for Batch Ethanol Fermentation of Saccharomyces Cerevisiae. J. Ferment. Technol. 1987, 65, 277–283. [Google Scholar] [CrossRef]
- Gòdia, F.; Casas, C.; Solà, C. Batch Alcoholic Fermentation Modelling by Simultaneous Integration of Growth and Fermentation Equations. J. Chem. Tech. Biotech. 1988, 41, 155–165. [Google Scholar] [CrossRef]
- Caro, I.; Pérez, L.; Cantero, D. Development of a Kinetic Model for the Alcoholic Fermentation of Must. Biotechnol. Bioeng. 1991, 38, 742–748. [Google Scholar] [CrossRef] [PubMed]
- Thatipamala, R.; Rohani, S.; Hill, G.A. Effects of High Product and Substrate Inhibitions on the Kinetics and Biomass and Product Yields during Ethanol Batch Fermentation. Biotech. Bioeng. 1992, 40, 289–297. [Google Scholar] [CrossRef] [PubMed]
- Starzak, M.; Kryzstek, L.; Nowicki, L.; Michalski, H. Macroapproach Kinetics of Ethanol Fermentation by Saccharomyces Cerevisiae: Experimental Studies and Mathematical Modelling. Chem. Eng. J. Biochem. Eng. J. 1994, 54, 221–240. [Google Scholar] [CrossRef]
- Scaglia, G.J.E.; Aballay, P.M.; Mengual, C.A.; Vallejo, M.D.; Ortiz, O.A. Improved Phenomenological Model for an Isothermal Winemaking Fermentation. Food Control 2009, 20, 887–895. [Google Scholar] [CrossRef]
- Aballay, P.M.; Vallejo, M.D.; Scaglia, G.J.E.; Serrano, M.; Romoli, S.; Ortiz, O.A. Phenomenological Modeling for Non-Isothermal Wine Fermentation; Centro de Convenciones de la Torre de los Profesionales: Montevideo, Uruguay, 2012. [Google Scholar]
- Francesca Venturi, A.Z. The Kinetics of Alcoholic Fermentation by Two Yeast Strains in High Sugar Concentration Media. J. Bioprocess. Biotech. 2013, 3, 1–5. [Google Scholar] [CrossRef]
- Báleš, V.; Timár, P.; Baláž, J.; Timár, P. Wine Fermentation Kinetic Model Verification and Simulation of Refrigeration Malfunction during Wine Fermentation. Acta Chim. Slovaca 2016, 9, 58–61. [Google Scholar] [CrossRef]
- Donaton, M.C.V.; Holsbeeks, I.; Lagatie, O.; Van Zeebroeck, G.; Crauwels, M.; Winderickx, J.; Thevelein, J.M. The Gap1 General Amino Acid Permease Acts as an Amino Acid Sensor for Activation of Protein Kinase A Targets in the Yeast Saccharomyces Cerevisiae. Mol. Microbiol. 2003, 50, 911–929. [Google Scholar] [CrossRef] [PubMed]
- Bely, M.; Sablayrolles, J.-M.; Barre, P. Automatic Detection of Assimilable Nitrogen Deficiencies during Alcoholic Fermentation in Oenological Conditions. J. Ferment. Bioeng. 1990, 70, 246–252. [Google Scholar] [CrossRef]
- Bely, M.; Sablayrolles, J.M.; Barre, P. Description of Alcoholic Fermentation Kinetics: Its Variability and Significance. Am. J. Enol. Vitic. 1990, 41, 319–324. [Google Scholar] [CrossRef]
- Cramer, A.C.; Vlassides, S.; Block, D.E. Kinetic Model for Nitrogen-Limited Wine Fermentations. Biotechnol. Bioeng. 2002, 77, 49–60. [Google Scholar] [CrossRef] [PubMed]
- Malherbe, S.; Fromion, V.; Hilgert, N.; Sablayrolles, J.-M. Modeling the Effects of Assimilable Nitrogen and Temperature on Fermentation Kinetics in Enological Conditions. Biotechnol. Bioeng. 2004, 86, 261–272. [Google Scholar] [CrossRef] [PubMed]
- Colombié, S.; Latrille, E.; Sablayrolles, J.-M. Online Estimation of Assimilable Nitrogen by Electrical Conductivity Measurement during Alcoholic Fermentation in Enological Conditions. J. Biosci. Bioeng. 2007, 103, 229–235. [Google Scholar] [CrossRef] [PubMed]
- Charnomordic, B.; David, R.; Dochain, D.; Hilgert, N.; Mouret, J.-R.; Sablayrolles, J.-M.; Vande Wouwer, A. Two Modelling Approaches of Winemaking: First Principle and Metabolic Engineering. Math. Comput. Model. Dyn. Syst. 2010, 16, 535–553. [Google Scholar] [CrossRef]
- Assar, R.; Vargas, F.A.; Sherman, D.J. Reconciling Competing Models: A Case Study of Wine Fermentation Kinetics. In Algebraic and Numeric Biology; Horimoto, K., Nakatsui, M., Popov, N., Eds.; Lecture Notes in Computer Science; Springer: Berlin/Heidelberg, Germany, 2012; Volume 6479, pp. 98–116. ISBN 978-3-642-28066-5. [Google Scholar]
- David, R.; Dochain, D.; Mouret, J.-R.; Vande Wouwer, A.; Sablayrolles, J.-M. Nitrogen-Backboned Modeling of Wine-Making in Standard and Nitrogen-Added Fermentations. Bioprocess. Biosyst. Eng. 2014, 37, 5–16. [Google Scholar] [CrossRef] [PubMed]
- Rapaport, A.; David, R.; Dochain, D.; Harmand, J.; Nidelet, T. Consideration of Maintenance in Wine Fermentation Modeling. Foods 2022, 11, 1682. [Google Scholar] [CrossRef]
- Levenspiel, O. The Monod Equation: A Revisit and a Generalization to Product Inhibition Situations. Biotech. Bioeng. 1980, 22, 1671–1687. [Google Scholar] [CrossRef]
- Moulin, G.; Boze, H.; Galzy, P. Inhibition of Alcoholic Fermentation by Substrate and Ethanol. Biotech. Bioeng. 1980, 22, 2375–2381. [Google Scholar] [CrossRef]
- Luong, J.H.T. Kinetics of Ethanol Inhibition in Alcohol Fermentation. Biotech. Bioeng. 1985, 27, 280–285. [Google Scholar] [CrossRef] [PubMed]
- Phisalaphong, M.; Srirattana, N.; Tanthapanichakoon, W. Mathematical Modeling to Investigate Temperature Effect on Kinetic Parameters of Ethanol Fermentation. Biochem. Eng. J. 2006, 28, 36–43. [Google Scholar] [CrossRef]
- Coleman, M.C.; Fish, R.; Block, D.E. Temperature-Dependent Kinetic Model for Nitrogen-Limited Wine Fermentations. Appl. Env. Environ. Microbiol. 2007, 73, 5875–5884. [Google Scholar] [CrossRef] [PubMed]
- Lip, K.Y.F.; García-Ríos, E.; Costa, C.E.; Guillamón, J.M.; Domingues, L.; Teixeira, J.; Van Gulik, W.M. Selection and Subsequent Physiological Characterization of Industrial Saccharomyces Cerevisiae Strains during Continuous Growth at Sub- and- Supra Optimal Temperatures. Biotechnol. Rep. 2020, 26, e00462. [Google Scholar] [CrossRef] [PubMed]
- Williams, L.A. Theory and Modelling of Ethanol Evaporative Losses during Batch Alcoholic Fermentation. Biotechnol. Bioeng. 1983, 25, 1597–1612. [Google Scholar] [CrossRef]
- Australian Wine Research Institute the AWRI Ferment Simulator. Available online: https://www.awri.com.au/industry_support/winemaking_resources/wine_fermentation/awri-ferment-simulator/ (accessed on 12 December 2023).
- Johnson, K.A.; Goody, R.S. The Original Michaelis Constant: Translation of the 1913 Michaelis–Menten Paper. Biochemistry 2011, 50, 8264–8269. [Google Scholar] [CrossRef] [PubMed]
- Langmuir, I. The Adsorption of Gases on Plane Surfaces of Glass, Mica and Platinum. J. Am. Chem. Soc. 1918, 40, 1361–1403. [Google Scholar] [CrossRef]
- Jiranek, V.; Langridge, P.; Henschke, P.A. Amino Acid and Ammonium Utilization by Saccharomyces Cerevisiae Wine Yeasts from a Chemically Defined Medium. Am. J. Enol. Vitic. 1995, 46, 75–83. [Google Scholar] [CrossRef]
- Butzke, C.E. Survey of Yeast Assimilable Nitrogen Status in Musts from California, Oregon, and Washington. Am. J. Enol. Vitic. 1998, 49, 220–224. [Google Scholar] [CrossRef]
- Aiba, S.; Shoda, M.; Nagatani, M. Kinetics of Product Inhibition in Alcohol Fermentation. Biotech. Bioeng. 1968, 10, 845–864. [Google Scholar] [CrossRef]
- Aiba, S.; Shoda, M. Reassessment of the Product Inhibitionin Aloohol Fermentation. J. Ferment. Technol. 1969, 47, 790–794. [Google Scholar]
- Johnston, J. Substrate Preference in Wine Yeast; University of California: Davis, CA, USA, 1983. [Google Scholar]
- Boulton, R. The Heat Transfer Characteristics of Wine Fermentors. Am. J. Enol. Vitic. 1979, 30, 152–156. [Google Scholar] [CrossRef]
- Boulton, R.B.; Singleton, V.L.; Bisson, L.F.; Kunkee, R.E. Principles and Practices of Winemaking; Springer: Berlin/Heidelberg, Germany, 2013; ISBN 978-1-4757-6255-6. [Google Scholar]
- Bates, F.J. Circular of the Bureau of Standards No. 440: Polarimetry, Saccharimetry and the Sugars; National Bureau of Standards: Gaithersburg, MD, USA, 1942; p. NBS CIRC 440. [Google Scholar]
- Hwang, C.-L.; Yoon, K. Multiple Attribute Decision Making; Lecture Notes in Economics and Mathematical Systems; Springer: Berlin/Heidelberg, Germany, 1981; Volume 186, ISBN 978-3-540-10558-9. [Google Scholar]
- Kwolek-Mirek, M.; Zadrag-Tecza, R. Comparison of Methods Used for Assessing the Viability and Vitality of Yeast Cells. FEMS Yeast Res. 2014, 14, 1068–1079. [Google Scholar] [CrossRef] [PubMed]
- Martínez-Moreno, R.; Morales, P.; Gonzalez, R.; Mas, A.; Beltran, G. Biomass Production and Alcoholic Fermentation Performance of Saccharomyces Cerevisiae as a Function of Nitrogen Source. FEMS Yeast Res. 2012, 12, 477–485. [Google Scholar] [CrossRef] [PubMed]
- Torija, M. Effects of Fermentation Temperature on the Strain Population of Saccharomyces Cerevisiae. Int. J. Food Microbiol. 2003, 80, 47–53. [Google Scholar] [CrossRef] [PubMed]
- Grenson, M.; Hou, C.; Crabeel, M. Multiplicity of the Amino Acid Permeases in Saccharomyces Cerevisiae IV. Evidence for a General Amino Acid Permease. J. Bacteriol. 1970, 103, 770–777. [Google Scholar] [CrossRef] [PubMed]
- Carter, B.L.A.; Halvorson, H.O. Periodic Changes in Rate of Amino Acid Uptake During Yeast Cell Cycle. J. Cell Biol. 1973, 58, 401–409. [Google Scholar] [CrossRef] [PubMed]
- Thorne, R.S.W. Nitrogen Metabolism of Yeast. A Consideration of the Mode of Assimilation of Amino Acids. J. Inst. Brew. 1949, 55, 201–222. [Google Scholar] [CrossRef]
- Jones, M.; Pierce, J.S. Absorption of Amino Acids from Word by Yeasts. J. Inst. Brew. 1964, 70, 307–315. [Google Scholar] [CrossRef]
- Jones, M.; Pragnell, M.J.; Pierce, J.S. Absorption of Amino Acids by Yeasts from a Semi-Defined Medium Simulation Wort. J. Inst. Brew. 1969, 75, 520–536. [Google Scholar] [CrossRef]
- Busturia, A.; Lagunas, R. Catabolite Inactivation of the Glucose Transport System in Saccharomyces Cerevisiae. Microbiology 1986, 132, 379–385. [Google Scholar] [CrossRef]
- Salmon, J.M. Effect of Sugar Transport Inactivation in Saccharomyces Cerevisiae on Sluggish and Stuck Enological Fermentations. Appl. Environ. Microbiol. 1989, 55, 953–958. [Google Scholar] [CrossRef] [PubMed]
- Salmon, J.M.; Vincent, O.; Mauricio, J.C.; Bely, M.; Barre, P. Sugar Transport Inhibition and Apparent Loss of Activity in Saccharomyces Cerevisiae as a Major Limiting Factor of Enological Fermentations. Am. J. Enol. Vitic. 1993, 44, 56–64. [Google Scholar] [CrossRef]
- Backhus, L.E.; DeRisi, J.; Brown, P.O.; Bisson, L.F. Functional Genomic Analysis of a Commercial Wine Strain of Saccharomyces Cerevisiae under Differing Nitrogen Conditions. FEMS Yeast Res. 2001, 1, 111–125. [Google Scholar] [CrossRef] [PubMed]
- Bianchi, F.; Van’T Klooster, J.S.; Ruiz, S.J.; Poolman, B. Regulation of Amino Acid Transport in Saccharomyces Cerevisiae. Microbiol. Mol. Biol. Rev. 2019, 83, e00024–e19. [Google Scholar] [CrossRef] [PubMed]
- Jiménez-Martà , E.; Del Olmo, M. Addition of Ammonia or Amino Acids to a Nitrogen-Depleted Medium Affects Gene Expression Patterns in Yeast Cells during Alcoholic Fermentation. FEMS Yeast Res. 2008, 8, 245–256. [Google Scholar] [CrossRef] [PubMed]
- Tesnière, C.; Brice, C.; Blondin, B. Responses of Saccharomyces Cerevisiae to Nitrogen Starvation in Wine Alcoholic Fermentation. Appl. Microbiol. Biotechnol. 2015, 99, 7025–7034. [Google Scholar] [CrossRef] [PubMed]
- Sainz, J.; Pizarro, F.; Pérez-Correa, J.R.; Agosin, E. Modeling of Yeast Metabolism and Process Dynamics in Batch Fermentation: Modeling Yeast Metabolism. Biotechnol. Bioeng. 2003, 81, 818–828. [Google Scholar] [CrossRef]
- Marini, A.-M.; Soussi-Boudekou, S.; Vissers, S.; Andre, B. A Family of Ammonium Transporters in Saccharomyces Cerevisiae †. Mol. Cell. Biol. 1997, 17, 4282–4293. [Google Scholar] [CrossRef]
- Van Nuland, A.; Vandormael, P.; Donaton, M.; Alenquer, M.; Lourenço, A.; Quintino, E.; Versele, M.; Thevelein, J.M. Ammonium Permease-based Sensing Mechanism for Rapid Ammonium Activation of the Protein Kinase A Pathway in Yeast. Mol. Microbiol. 2006, 59, 1485–1505. [Google Scholar] [CrossRef] [PubMed]
- Manginot, C.; Roustan, J.L.; Sablayrolles, J.M. Nitrogen Demand of Different Yeast Strains during Alcoholic Fermentation. Importance of the Stationary Phase. Enzym. Microb. Technol. 1998, 23, 511–517. [Google Scholar] [CrossRef]
- Gutiérrez, A.; Chiva, R.; Sancho, M.; Beltran, G.; Arroyo-López, F.N.; Guillamon, J.M. Nitrogen Requirements of Commercial Wine Yeast Strains during Fermentation of a Synthetic Grape Must. Food Microbiol. 2012, 31, 25–32. [Google Scholar] [CrossRef]
- Von Stockar, U.; Liu, J.-S. Does Microbial Life Always Feed on Negative Entropy? Thermodynamic Analysis of Microbial Growth. Biochim. Biophys. Acta (BBA)–Bioenerg. 1999, 1412, 191–211. [Google Scholar] [CrossRef]
- Steinmeyer, D.E.; Shuler, M.L. Structured Model for Saccharomyces Cerevisiae. Chem. Eng. Sci. 1989, 44, 2017–2030. [Google Scholar] [CrossRef]
- Pizarro, F.; Varela, C.; Martabit, C.; Bruno, C.; Pérez-Correa, J.R.; Agosin, E. Coupling Kinetic Expressions and Metabolic Networks for Predicting Wine Fermentations. Biotechnol. Bioeng. 2007, 98, 986–998. [Google Scholar] [CrossRef]
- Varela, C.; Pizarro, F.; Agosin, E. Biomass Content Governs Fermentation Rate in Nitrogen-Deficient Wine Musts. Appl. Environ. Microbiol. 2004, 70, 3392–3400. [Google Scholar] [CrossRef]
- Galazzo, J.L.; Bailey, J.E. Fermentation Pathway Kinetics and Metabolic Flux Control in Suspended and Immobilized Saccharomyces Cerevisiae. Enzym. Microb. Technol. 1990, 12, 162–172. [Google Scholar] [CrossRef]
- Schenk, C. Modeling, Simulation and Optimization of Wine Fermentation; Universität Trier: Trier, Germany, 2018. [Google Scholar]
- Florea, A.; Sipos, A.; Stoisor, M.-C. Applying AI Tools for Modeling, Predicting and Managing the White Wine Fermentation Process. Fermentation 2022, 8, 137. [Google Scholar] [CrossRef]
- Vlassides, S.; Ferrier, J.G.; Block, D.E. Using Historical Data for Bioprocess Optimization: Modeling Wine Characteristics Using Artificial Neural Networks and Archived Process Information. Biotechnol. Bioeng. 2001, 73, 55–68. [Google Scholar] [CrossRef]
- El Haloui, N.E.; Corrieu, G.; Cleran, Y.; Cheruy, A. Method for On-Line Prediction of Kinetics of Alcoholic Fermentation in Wine Making. J. Ferment. Bioeng. 1989, 68, 131–135. [Google Scholar] [CrossRef]
- Crépin, L.; Nidelet, T.; Sanchez, I.; Dequin, S.; Camarasa, C. Sequential Use of Nitrogen Compounds by Saccharomyces Cerevisiae during Wine Fermentation: A Model Based on Kinetic and Regulation Characteristics of Nitrogen Permeases. Appl. Environ. Microbiol. 2012, 78, 8102–8111. [Google Scholar] [CrossRef] [PubMed]
- Maisonnave, P.; Sanchez, I.; Moine, V.; Dequin, S.; Galeote, V. Stuck Fermentation: Development of a Synthetic Stuck Wine and Study of a Restart Procedure. Int. J. Food Microbiol. 2013, 163, 239–247. [Google Scholar] [CrossRef] [PubMed]
- Julien, A.; Roustan, J.-L.; Dulau, L.; Sablayrolles, J.-M. Comparison of Nitrogen and Oxygen Demands of Enological Yeasts: Technological Consequences. Am. J. Enol. Vitic. 2000, 51, 215–222. [Google Scholar] [CrossRef]
- Blateyron, L.; Sablayrolles, J.M. Stuck and Slow Fermentations in Enology: Statistical Study of Causes and Effectiveness of Combined Additions of Oxygen and Diammonium Phosphate. J. Biosci. Bioeng. 2001, 91, 184–189. [Google Scholar] [CrossRef] [PubMed]
- Killeen, D.J.; Boulton, R.; Knoesen, A. Advanced Monitoring and Control of Redox Potential in Wine Fermentation. Am. J. Enol. Vitic. 2018, 69, 394–399. [Google Scholar] [CrossRef]
- Tronchoni, J.; Gamero, A.; Arroyo-López, F.N.; Barrio, E.; Querol, A. Differences in the Glucose and Fructose Consumption Profiles in Diverse Saccharomyces Wine Species and Their Hybrids during Grape Juice Fermentation. Int. J. Food Microbiol. 2009, 134, 237–243. [Google Scholar] [CrossRef] [PubMed]
- Bisson, L.F.; Fraenkel, D.G. Involvement of Kinases in Glucose and Fructose Uptake by Saccharomyces Cerevisiae. Proc. Natl. Acad. Sci. USA 1983, 80, 1730–1734. [Google Scholar] [CrossRef] [PubMed]
- Gould, G.W.; Bell, G.I. Facilitative Glucose Transporters: An Expanding Family. Trends Biochem. Sci. 1990, 15, 18–23. [Google Scholar] [CrossRef]
- Bisson, L.F.; Coons, D.M.; Kruckeberg, A.L.; Lewis, D.A. Yeast Sugar Transporters. Crit. Rev. Biochem. Mol. Biol. 1993, 28, 259–308. [Google Scholar] [CrossRef]
- Lagunas, R. Sugar Transport in Saccharomyces Cerevisiae. FEMS Microbiol. Lett. 1993, 104, 229–242. [Google Scholar] [CrossRef]
- Coons, D.M.; Boulton, R.B.; Bisson, L.F. Computer-Assisted Nonlinear Regression Analysis of the Multicomponent Glucose Uptake Kinetics of Saccharomyces Cerevisiae. J. Bacteriol. 1995, 177, 3251–3258. [Google Scholar] [CrossRef] [PubMed]
- Perez, M.; Luyten, K.; Michel, R.; Riou, C.; Blondin, B. Analysis of Hexose Carrier Expression during Wine Fermentation: Both Low- and High-Affinity Hxt Transporters Are Expressed. FEMS Yeast Res. 2005, 5, 351–361. [Google Scholar] [CrossRef] [PubMed]
- Woodward, J.R.; Cirillo, V.P. Amino Acid Transport and Metabolism in Nitrogen-Starved Cells of Saccharomyces Cerevisiae. J. Bacteriol. 1977, 130, 714–723. [Google Scholar] [CrossRef] [PubMed]
- Regenberg, B.; Düring-Olsen, L.; Kielland-Brandt, M.C.; Holmberg, S. Substrate Specificity and Gene Expression of the Amino-Acid Permeases in Saccharomyces Cerevisiae. Curr. Genet. 1999, 36, 317–328. [Google Scholar] [CrossRef]
- Garrett, J.M. Amino Acid Transport through the Saccharomyces Cerevisiae Gap1 Permease Is Controlled by the Ras/cAMP Pathway. Int. J. Biochem. Cell Biol. 2008, 40, 496–502. [Google Scholar] [CrossRef] [PubMed]
- Grenson, M. Chapter 7 Amino Acid Transporters in Yeast: Structure, Function and Regulation. In New Comprehensive Biochemistry; Elsevier: Amsterdam, The Netherlands, 1992; Volume 21, pp. 219–245. ISBN 978-0-444-89562-2. [Google Scholar]
- Schreve, J.L.; Garrett, J.M. Yeast Agp2p and Agp3p Function as Amino Acid Permeases in Poor Nutrient Conditions. Biochem. Biophys. Res. Commun. 2004, 313, 745–751. [Google Scholar] [CrossRef] [PubMed]
- Chiva, R.; Baiges, I.; Mas, A.; Guillamon, J.M. The Role of GAP1 Gene in the Nitrogen Metabolism of Saccharomyces Cerevisiae during Wine Fermentation. J. Appl. Microbiol. 2009, 107, 235–244. [Google Scholar] [CrossRef]
- Jauniaux, J.; Grenson, M. GAP1, the General Amino Acid Permease Gene of Saccharomyces Cerevisiae: Nucleotide Sequence, Protein Similarity with the Other Bakers Yeast Amino Acid Permeases, and Nitrogen Catabolite Repression. Eur. J. Biochem. 1990, 190, 39–44. [Google Scholar] [CrossRef]
Disclaimer/Publisher’s Note: The statements, opinions and data contained in all publications are solely those of the individual author(s) and contributor(s) and not of MDPI and/or the editor(s). MDPI and/or the editor(s) disclaim responsibility for any injury to people or property resulting from any ideas, methods, instructions or products referred to in the content. |
© 2024 by the authors. Licensee MDPI, Basel, Switzerland. This article is an open access article distributed under the terms and conditions of the Creative Commons Attribution (CC BY) license (https://creativecommons.org/licenses/by/4.0/).