Article

Specific Organic Loading Rate Control for Improving Fermentative Hydrogen Production

by
Mélida del Pilar Anzola-Rojas
*,
Lucas Tadeu Fuess
and
Marcelo Zaiat
Biological Processes Laboratory, São Carlos School of Engineering, University of São Paulo, 1100 João Dagnone Ave., Santa Angelina, São Carlos 13563-120, SP, Brazil
*
Author to whom correspondence should be addressed.
Fermentation 2024, 10(4), 213; https://doi.org/10.3390/fermentation10040213
Submission received: 12 March 2024 / Revised: 9 April 2024 / Accepted: 12 April 2024 / Published: 14 April 2024
(This article belongs to the Special Issue Fermentative Biohydrogen Production)

Abstract

:
Inhibiting homoacetogens is one of the main challenges in fermentative hydrogen production because these hydrogen consumers have similar growth features to hydrogen producers. Homoacetogens have been related to the excessive accumulation of biomass in fermentative reactors. Therefore, a suitable food/microorganism ratio has the potential to minimize the homoacetogenic activity. In this work, the specific organic loading rate (SOLR) was controlled in two fermentative fixed-bed up-flow reactors through scheduled biomass discharges. Reactors were differentiated by the bed arrangement, namely, packed and structured conformation. The SOLR decay along the time in both reactors was previously simulated according to the literature data. The volume and volatile suspended solids (VSS) concentration of discharges was estimated from the first discharge, and then additional discharges were planned. Biomass discharges removed 21% of the total biomass produced in the reactors, maintaining SOLR values of 3.0 ± 0.4 and 3.9 ± 0.5 g sucrose g−1 VSS d−1 in the packed-bed and structured-bed reactors, respectively. Such a control of the SOLR enabled continuous and stable hydrogen production at 2.2 ± 0.2 L H2 L−1 d−1 in the packed-bed reactor and 1.0 ± 0.3 L H2 L−1 d−1 in the structured-bed one. Controlling biomass was demonstrated to be a suitable strategy for keeping the continuous hydrogen production, although the fermentative activity was impaired in the structured-bed reactor. The homoacetogenic was partially inhibited, accounting for no more than 30% of the total acetic acid produced in the reactor. Overall, the high amount of attached biomass in the packed-bed reactor provided more robustness to the system, offsetting the periodic suspended biomass losses via the planned discharges. Better characterizing both the VSS composition (aiming to differentiate cells from polymeric substances) and the bed hydrodynamics could be useful to optimize the online SOLR control.

1. Introduction

Currently, with the global objective of limiting the increase in global temperature to 1.5 °C [1], hydrogen has re-emerged as a key fuel to achieve the goal of net zero emissions by 2050 [2]. Although hydrogen is a zero-carbon energy at the point of end use, this characteristic depends on the cleanliness of the production path and the energy used to produce it. Thus, guaranteeing the origin of hydrogen is fundamental to considering hydrogen as clean energy [3]. Hydrogen can be obtained from various raw materials using different process technologies. Currently, the majority of hydrogen produced worldwide is obtained from fossil fuels, with ca. 96% of global production, resulting in high carbon dioxide emissions that contribute to climate change [4]. Conventional hydrogen production releases around 900 Mt of CO2 per year worldwide [5].
Recently, the International Energy Agency (IEA) differentiated hydrogen production methods in terms of contributions to greenhouse gas (GHG) mitigation. Therefore, hydrogen has been labeled by color depending on its production process: brown and gray for that obtained from charcoal and natural gas, respectively, without including carbon capture, utilization, and sequestration (CCU) technologies; blue for hydrogen obtained from natural gas with the inclusion of CCU technologies; green for that produced from renewable sources; and moss color for that produced from biomass, biofuels, and dark fermentation [6].
During dark fermentation, anaerobic bacteria degrade the complex organic matter to simple molecules such as organic acids, releasing hydrogen and carbon dioxide in an oxygen-free environment [7]. Therefore, hydrogen can be produced from several substrates such as domestic, industrial, and agro-industrial wastewater and wastes, which are widely available. This technology is appealing due to its low energy requirements and its compatibility with mild processing conditions of pressure and temperature. However, fermentative hydrogen production is not yet applied at a commercial scale due to the low yield of hydrogen [8] and unstable performance [9]. Hydrogen production is affected by inorganic compounds, i.e., metals, ammonia, sulfate; organics, i.e., high concentration of volatile fatty acids, furan derivatives, and phenolic compounds; biological such as bacteriocins, and the presence of archaea, sulfate-reducing bacteria (SRB), and homoacetogens; in addition to the partial pressure of hydrogen [10,11].
Among these factors, homoacetogenesis has been reported to consume at least 43% of hydrogen yield in batch fermentation [12] and between 25% and 60% in continuous-mode fermentation [13,14,15,16,17,18]. Homoacetogens are Gram-positive bacteria able to convert saccharolytic and gaseous substrates into acetate through the Acetil-CoA pathway. Since homoacetogens belong mainly to the genera Clostridium, inoculum pre-treatments can be ineffective to guarantee their inhibition [19]. The occurrence of homoacetogenesis during dark fermentation was associated with excess accumulation of microbial biomass, a condition in which the amount of organic substrate is not sufficient for supplying the heterotrophic metabolism of fermentative bacteria [14,20]. In practical aspects, the food/microorganism ratio is unbalanced, forcing bacteria to use metabolic pathways other than saccharolytic ones, such as homoacetogenesis [21], or even methanogenic pathways [22].
On the one hand, the excess accumulation of biomass can be associated with the stimulus to enhanced cell growth as a result of high nutrient concentrations, such as N and Ca [20,23]. On the other hand, this accumulation can also be triggered by the physical configuration of the reactors. For instance, in fixed-bed reactors, the amount of biomass retained is directly associated with the bed porosity. Empty spaces between the media forming the bed are progressively filled with microbial agglomerations, consequently, decreasing the food/microorganism ratio along the time. In fixed-bed up-flow reactors under continuous operation, the biomass accumulation between the interstices of the bed reached up to 32% of the total biomass produced within 60 days of operation. Such accumulation caused a drastic fall in the hydrogen production rate and yield, and values as low as 50 mL H2 h−1 and 0.2 mol H2 mol−1 sucrose were obtained, respectively, despite complete substrate conversion [20,23].
This situation is more frequently observed in reactors with low porosity beds formed by small-sized particles (e.g., 10 mm diameter), which can lead to void indices of less than 65%. Some strategies to regulate the F/M ratio included mechanisms for controlling biomass growth through the nutrient dosage in relation to the substrate as N [20] and Ca [23]. Other approaches included the control of biomass accumulation by the augmentation of the bed porosity increasing the size of the media and replacing the conventional packed-bed systems with structured-bed ones [24,25,26,27], as well as by increasing the amount of biomass naturally washed out from the reactor by flow inversion [13]. However, despite some promising results associated with the application of structured-bed reactors in fermentative hydrogen production [13,28], maintaining an ideal amount of biomass in the reactors is still challenging. Assessing the specific organic loading rate (SOLR), a parameter that shows a dynamic portrait of the F/M ratio on the course of continuous fermentation, provided important insights related to this issue. Numerous studies [20,23,26,28,29] have associated maximum hydrogen production rates from different substrates with SOLR values of ca. 6.0 g COD g−1VSS d−1 (COD = chemical oxygen demand, VSS = volatile suspended solids). Hence, SOLR values below the optimized one indicate conditions of excess biomass accumulation and, therefore, should be prevented in fermentative reactors as a strategy to inhibit homoacetogenesis. Meanwhile, when SOLR is less than 6.0 g COD g−1VSS d−1, the occurrence of organic overloads is characterized, negatively impacting hydrogen-producing bacteria [30] and, in some cases, also triggering homoacetogenesis due to the inhibition of heterotrophic pathways [23].
The SOLR has been recurrently used simply to understand biomass accumulation-related failures in hydrogen-producing reactors [20,23,28,30]. This trend results from the methodology used to calculate this parameter, which is feasible only after the reactor operation has ended. In other words, the calculation depends on variables (e.g., total amount of biomass retained and substrate consumption throughout the operation, biomass growth factor) that can be accessed once the reactor has been disassembled. This study proposes an online strategy to control the SOLR during fermentation by using scheduled biomass discharges in two fixed-bed reactors, namely, a packed- and a structured-bed system. The literature data were initially used to simulate the temporal profile of the SOLR, and once an approximately optimal SOLR (6.0 g COD g−1VSS d−1) was expected to occur, the consecutive biomass discharges were carried out. The impacts of the planned biomass discharges on the occurrence of homoacetogenesis, hydrogen evolution, and soluble fermentation product distribution were assessed, contributing to an overall understanding of refined operating strategies toward the maximization of fermentative hydrogen production.

2. Materials and Methods

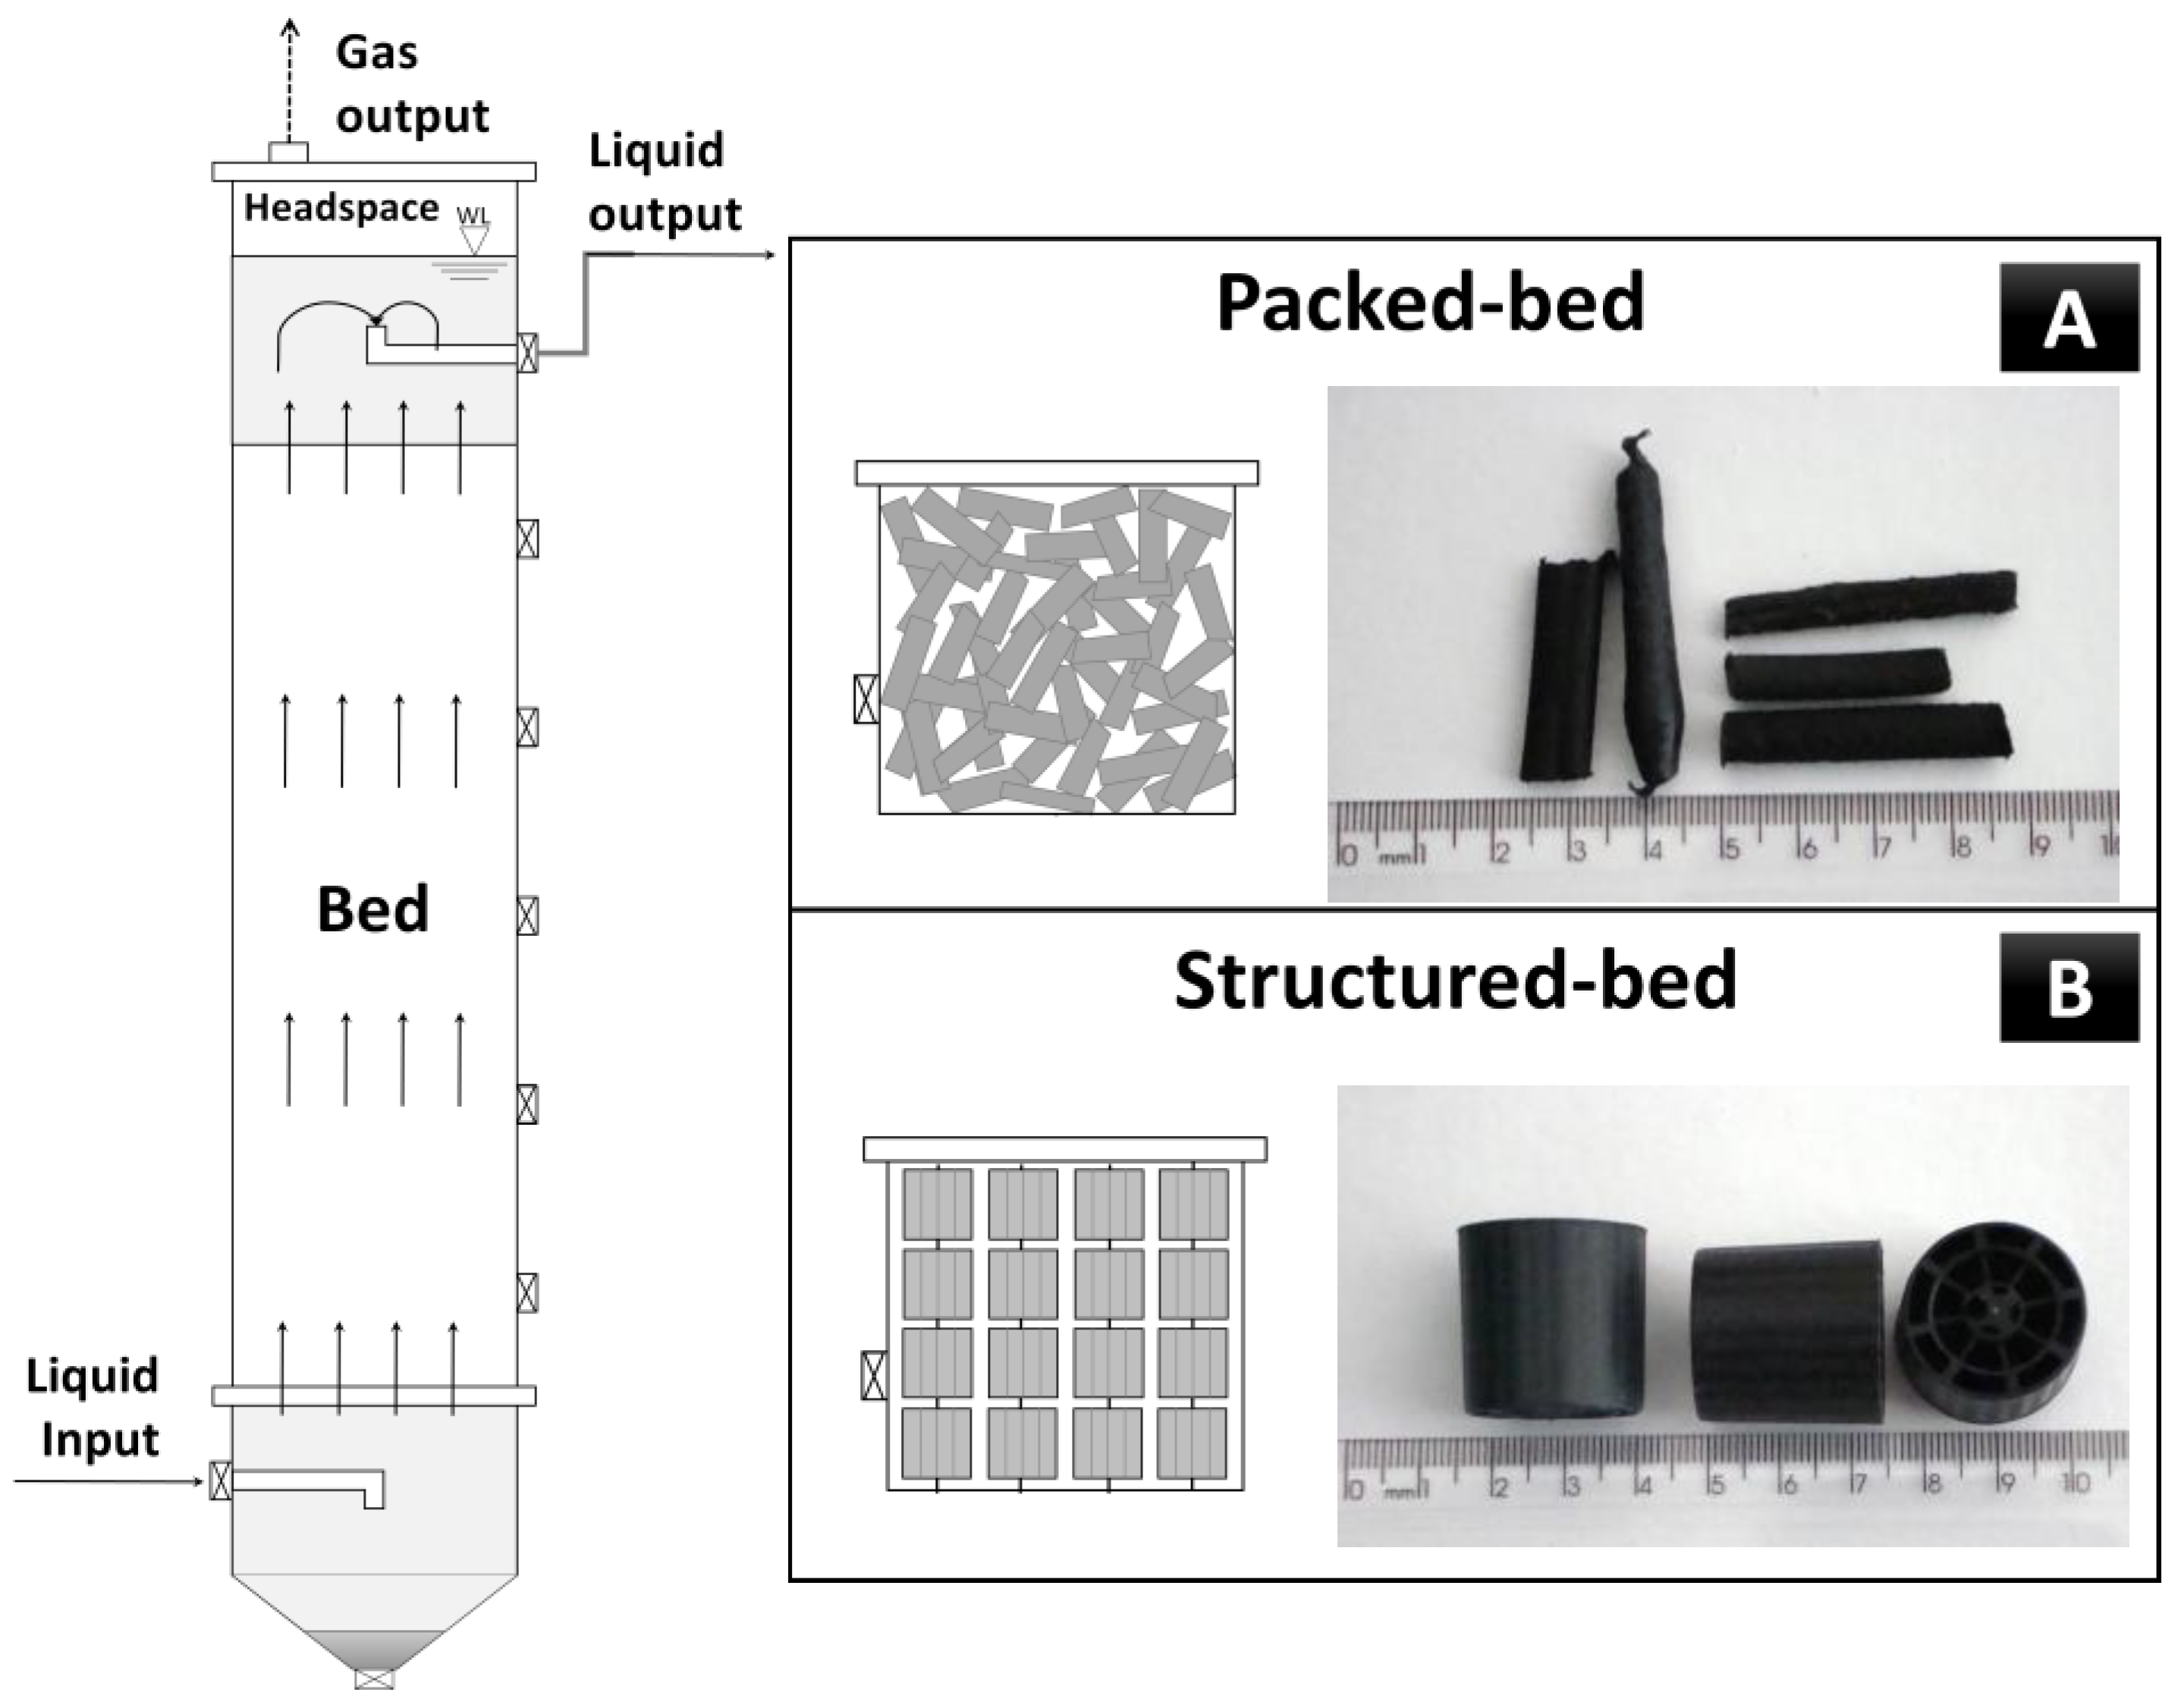
2.1. Fixed-Bed Up-Flow Reactors

Each reactor consisted of three chambers made with acrylic tubes of 80 mm internal diameter, 88 mm external diameter, and 810 mm length, making a total volume of 4.1 L (Figure 1). Circular stainless steel meshes were used for separating chambers. The inferior chamber was used for liquid inlet and biomass accumulation. The bottom was cone-shaped to promote the sedimentation of excess biomass. A valve was installed at the bottom for the biomass discharges, and another valve was placed at one side for the liquid inlet. The superior chamber was used as headspace and liquid outlet. The liquid level was controlled through an internal siphon in the middle of the chamber. At one side, a valve was placed for liquid outlet. The gas outlet was located on the top of the chamber.
The middle chamber was used for bed placing. The packed-bed reactor was randomly filled with cylinder-shaped particles of recycled low-density polyethylene with size of 5 mm diameter and length between 25 and 35 mm (Figure 1A). The void index of the packed bed was 50% (porosity bed). Therefore, the useful volume of the packed-bed reactor was 2.8 L. The structured-bed reactor was filled with small regular-shaped cylinders of recycled low-density polyethylene 20 mm in diameter and 25 mm in length (Figure 1B) organized in columns through stainless steel rods. The void index of the structured bed was 85% (porosity bed). Therefore, the useful volume of the structured-bed reactor was 3.6 L.
Both reactors were fed in continuous up-flow mode with a hydraulic retention time (HRT) of 2 h, organic loading rate (OLR) of 24 g COD L−1 d−1, and controlled temperature of 25 °C.

2.2. Substrate and Inoculum

Synthetic wastewater with 2 g COD L−1 based on sucrose (1.79 g L−1) was used as the substrate. Urea was added as nitrogen source keeping a carbon/nitrogen ratio of 140 (11.5 mg L−1) [20]. Micronutrients were added as NiSO4·6H2O (0.5 mg L−1), FeSO4·7H2O (2.5 mg L−1), FeCl3·6H2O (0.25 mg L−1), CoCl2·2H2O (0.04 mg L−1), CaCl2·6H2O (2.06 mg L−1), SeO2 (0.036 mg L−1), KH2PO4 (5.36 mg L−1), K2HPO4 (1.3 mg L−1), and Na2HPO4·2H2O (2.7 mg L−1). The pH was maintained at ca. 6.5 by the addition of NaHCO3 and/or HCl.
Indigenous microorganisms presented in the commercial sugar of sugarcane were grown on the synthetic wastewater as reported by Anzola-Rojas et al. [20]. That is, for each reactor, synthetic wastewater was left in an open plastic basin at 25 °C for five days until acidification, stimulating the interaction between microorganisms and substrate. Subsequently, in order to promote the biomass attachment on the bed, the acidified solution was re-circulated into the reactor on batch mode for one week. After that, fresh synthetic wastewater was supplied for each reactor in continuous mode.

2.3. Physical–Chemical Analyses

The biogas flow was measured by a Type TG1 gas meter (Dr-Ing. Ritter Apparatebau GMBH & Co. KG, Bochum, Germany), which was coupled to the gas outlet of the reactor. Biogas was sampled just at the gas meter entrance using a VICI Precision Sampling syringe, and the biogas composition (H2, CH4, and CO2) was determined by gas chromatography (GC-2021, Shimadzu, Columbia, MD, USA) using a thermal conductivity detector (TCD) [31].
The concentration of sucrose was determined through the phenol–sulfuric method as proposed by Dubois et al. [32]. Such a method consists of dehydrating the sugars in a sample by the action of concentrated sulfuric acid, followed by the complexation of the compounds formed with phenol, which results in the production of an orange-colored substance, with a maximum absorbance peak of 490 nm [32]. The chemical oxygen demand (COD), concentration of volatile suspended solids (VSS), and pH were analyzed according to the Standard Methods for the Examination of Water and Wastewater [33]. The concentrations of volatile fatty acids (VFA; acetic, propionic, isobutyric, isovaleric, valeric, and caproic), acetone, and alcohols (ethanol, methanol, and n-butanol) were measured by gas chromatography (Shimadzu GC-2010) using a Flame Ionization Detector (FID) [34].

2.4. Calculation of the Specific Organic Loading Rate (SOLR)

The SOLR is defined as the amount of the substrate available per amount of biomass in the reactor per time (g COD g−1 VSS d−1) such as represented by Equation (1), in which O L R (g substrate L−1 d−1) is the organic loading rate and x (g VSS L−1) is the concentration of biomass inside the reactor.
S O L R = O L R x
However, in continuous systems, the SOLR is not a fixed value since biomass is constantly produced and accumulated inside the reactor. Therefore, SOLR at a given time “n”, S O L R n , could be estimated according to Equation (2), in which x n (g VSS L−1) is the amount of biomass inside the reactor at given time “n”.
S O L R n = O L R x n
For estimating x n , the following calculations were adapted from Anzola-Rojas et al. [20]. In order to assess the biomass growth per consumed substrate factor Y x / s (g VSS g−1 substrate), the total biomass produced x T (g) and the total substrate consumed S c (g) during the entire operation were calculated. Therefore, Y x / s was calculated from Equation (3), whilst x T is given by Equation (4), in which x a (g) is the biomass attached to the bed, x s (g) is the suspended biomass in the bulk liquid (g), x e (g) is the biomass washed out in the liquid effluent during the operation and x d (g) is the biomass drained out of the bottom of the reactor.
Y x / s = x T S c
x T = x a + x s + x e + x d
To obtain x a , at the end of the experimental uptime, part of the bed was removed and washed with distilled water until total biomass detachment. Thus, the VSS of the washing solution was estimated by the gravimetric method as described elsewhere [33]. On the other hand, the support material was dried at 55 °C for 48 h. The ratio between the VSS of the washing solution and the support material weight was multiplied by the total weight of the support material in each bed to estimate x a . Similarly, for x s , the final concentration of VSS of the bulk sample was multiplied for the useful volume of the reactor.
The value of x e was determined by the integral of the mass flow of biomass effluent as a function of the time as shown in Equation (5), in which w ˙ x (g VSS h−1) is the mass flow of the biomass effluent, which is obtained from the concentration of VSS in the effluent ( V S S e ) in g L−1 and the volumetric flow ( Q ) in L h−1 (Equation (6)).
x e = 0 t w ˙ x · d t
w ˙ x = V S S e · Q
Finally, x d was determined as the sum of the biomass drained through all bottom discharges. That is, the concentration of VSS of each discharge multiplied by the volume of each one.
The total substrate consumed S c was calculated as described in Equation (7), in which Q s (g h−1) is the flow rate of substrate as COD (Equation (8)). The term C S 0 (g COD L−1) is the influent substrate concentration and C s (g COD L−1) is the effluent substrate concentration. Once Y x / s was calculated, the mass flow of biomass Q w ˙ (g VSS h−1) was obtained according to Equation (9).
S c = 0 t Q s · d t
Q s = Q · C S 0 C s
Q w ˙ = Q s · Y x / s
Therefore, x n (g VSS L−1) when there were no biomass discharges was estimated according to Equation (10), whilst x n when there were biomass discharges was estimated according to Equation (11). In Equations (10) and (11), d is the VSS (g) of the discharge at the time n , V u is the useful volume of the reactor (L); and x a + x s x T and x a + x s + x d x T refer the percentage of biomass inside the reactor. In n = 0 , i.e., once the inoculation was finalized and continuous operation started, x 0 was calculated according to Equation (12), in which V 0 is the volume of synthetic wastewater prepared for the natural inoculation, i.e., 34 L for packed-bed and 43 L for structured-bed reactors.
x n = Q w ˙ t V u · x a + x s x T + x n 1
x n = Q w ˙ t V u · x a + x s + x d x T + x n 1 d V u
x 0 = C s 0 · Y x / s · V 0 V u

2.5. Estimating the SOLR along the Time and Scheduling Discharges of Biomass

For estimating the SOLR along the time in both reactors, the considerations presented in Table 1 were taken in account. Beginning the discharges was planned to occur when the SOLR in simulation reached 6 g sucrose g−1 VSS d−1, which is the value suggested in the literature as the most suitable for hydrogen production [20,23,28,29].

2.6. Quantification of Hydrogen Consumption

A hydrogen balance was made in order to identify the hydrogen losses. The amount of hydrogen produced was assessed according to the theoretical production expected when considering specific metabolic pathways. According to the stoichiometry, acetic and butyric acids could imply high hydrogen production with 8 and 4 mol H2 mol−1 sucrose, respectively [35]. However, acetic acid can be produced together with hydrogen (R1), via the hydrogen-consuming homoacetogenic pathway (R2), or both [12]. Thus, the molar flow of acetic acid can be defined as the sum of both production pathways, as presented in Equation (13), in which H A c is the total molar flow of acetic acid, H A c H 2 is the molar flow of acetic acid produced via the saccharolytic pathway (R1), and H A c H c is the molar flow of acetic acid produced via homoacetogenesis (R2). Therefore, the theoretical hydrogen production considering the SFP identified in this work can be defined as described in Equation (14), which is an adaptation from Arooj et al. [16] and Luo et al. [17]. By substituting Equation (13) into Equation (14), the portion of acetic acid produced by the homoacetogenic pathway can be finally estimated through Equation (15). The term H B u is the molar flow of butyric acid, H P r is the molar flow of propionic acid, and H C a is the molar flow of caproic acid. The term H 2 t (Equation (14)) represents the total molar flow of hydrogen produced and was replaced by H 2 E (Equation (15)), which is the molar flow of hydrogen measured experimentally. It is worth mentioning that this approach does not include additional pathways, which might have contributed to hydrogen production and/or acetate consumption, such as the reverse β-oxidation of acetate into butyrate assisted by lactate [36] and capnophilic lactic fermentation [37]. Nevertheless, the assessment provides a good understanding on both the occurrence of homoacetogenesis and evolution of hydrogen.
C 6 H 12 O 6 + 2 H 2 O 2 C H 3 C O O H + 4 H 2 + 2 C O 2 G 0 = 206.0   k J
4 H 2 + 2 C O 2 C H 3 C O O H + 2 H 2 O G 0 = 104.0   k J
H A c = H A c H 2 + H A c H c
H 2 t = 2 H A c H 2 + 2 H B u H P r 4 H A c H c 6 H C a
H A c H c = 2 H A c H 2 + 2 H B u H P r 6 H C a H 2 E 6

3. Results and Discussion

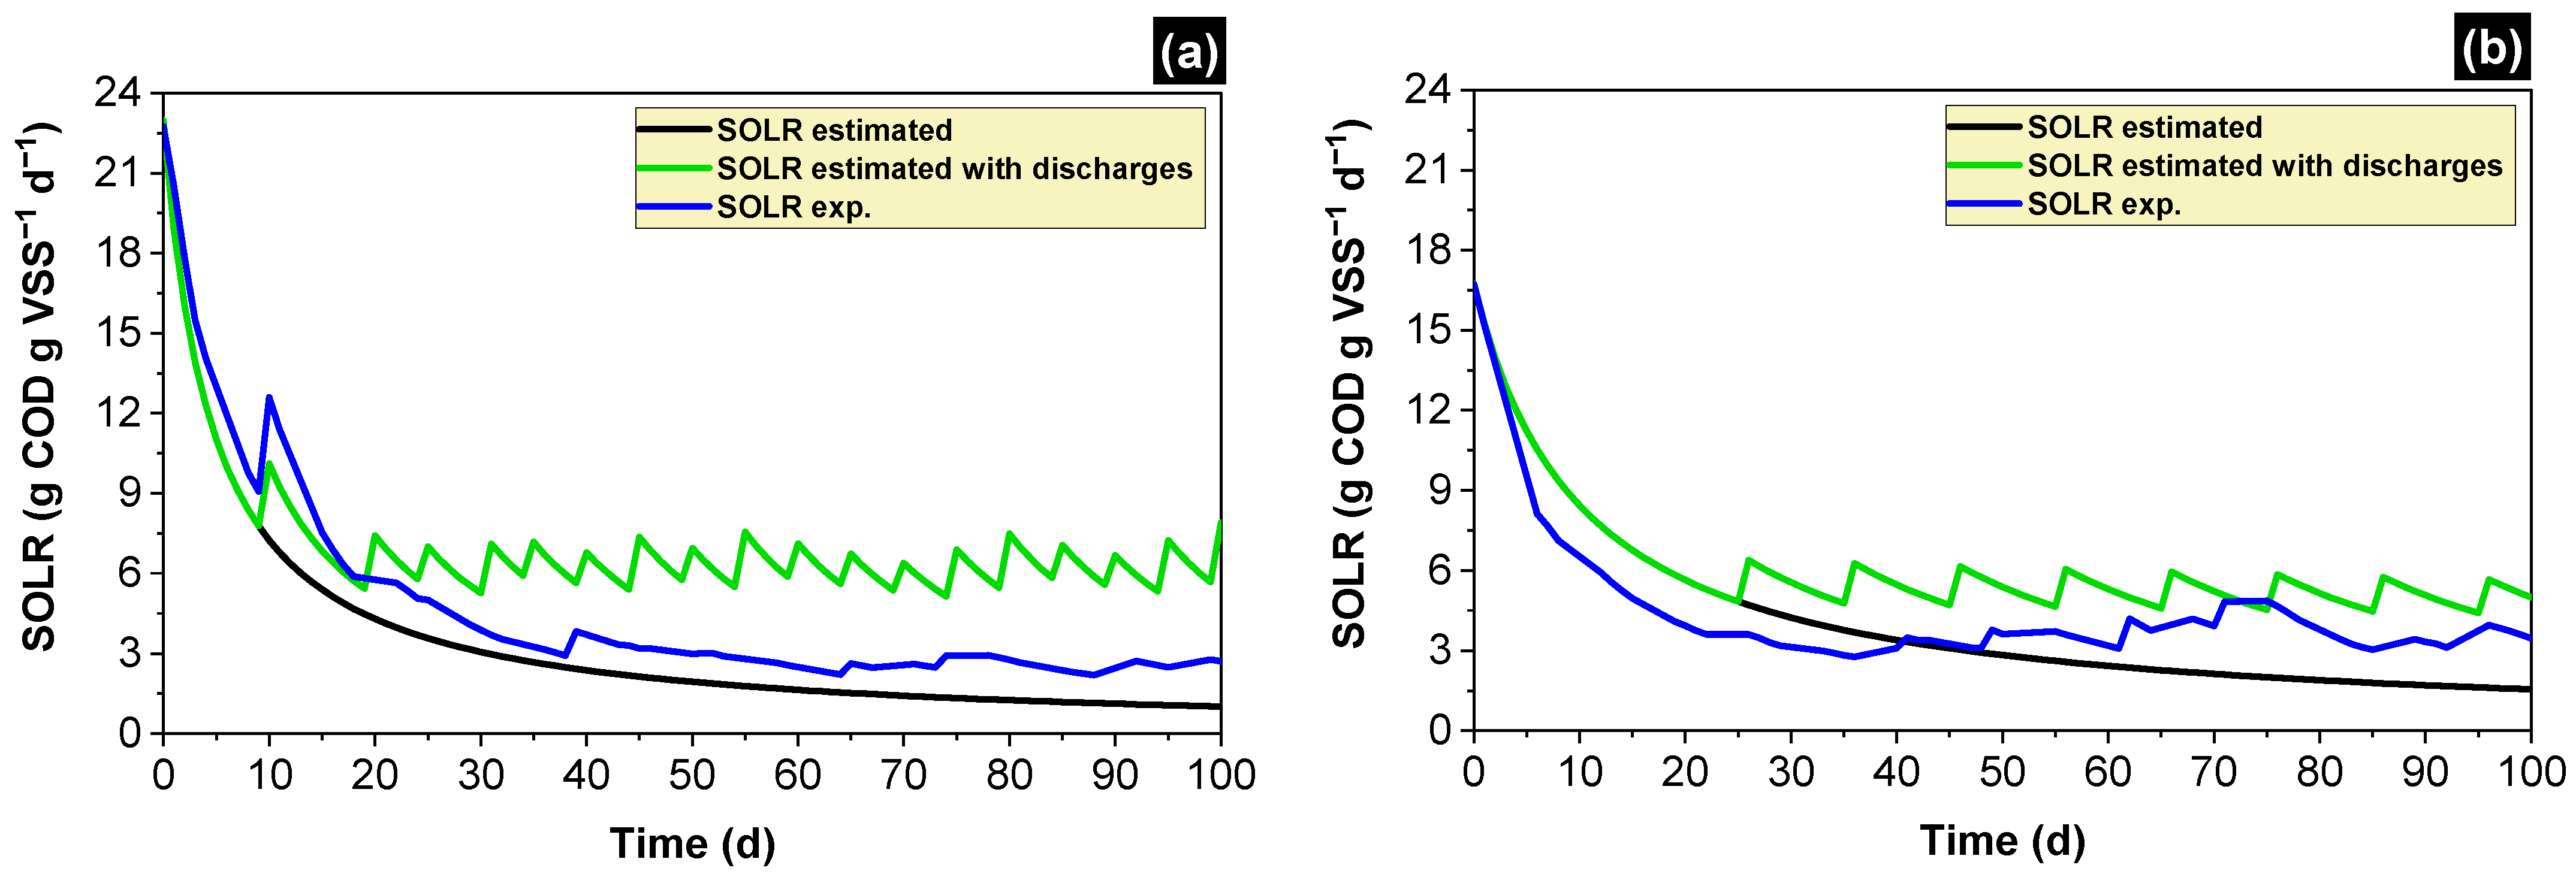
3.1. Simulated and Experimental SOLR

The SOLR was estimated for 100 days of continuous operation in both reactors, as presented in Figure 2 (black dashed line). A SOLR of 6 g sucrose g−1 VSS d−1 was reached around day 10 in the packed-bed reactor and around day 20 in the structured-bed reactor. Thus, a sample of 200 mL from the bottom was dragged in each reactor on days 10 and 26, respectively. The VSS concentrations were 11.8 g L−1 and 21.6 g L−1 in the packed-bed and structured-bed reactors, respectively (Figure 3a). Subsequently, discharges were simulated as shown in Figure 2 (green line), in order to maintain a steady SOLR.
After 103 days of continuous operation, both reactors were disassembled, and the total biomass produced was obtained (Table 2). Compared with the initial considerations in Table 1, the percentage of the biomass washed out in the effluent stream was coincident in the packed-bed reactor, and 9% less in the structured-bed reactor. That observation was related to the up-flow feeding mode, which decreases the natural biomass wash out compared with the down-flow mode. The flow of washed-out biomass (Figure 3c,d) was approximately constant, with a slight increase in the structured-bed reactor between days 35 and 65. That is, the biomass washed out from the structured-bed reactor was just 2.2% higher than that observed in the packed-bed reactor. Considering the retained fraction of biomass, the attached biomass corresponded to 7.2% of the total biomass in the packed-bed reactor against 3.8% in the structured-bed reactor, indicating a better adhesion property of the irregular cylinder-shaped particles than the regular ones. On the other hand, around 21% of the total produced biomass was removed by the discharges in both reactors. That is, the percentage of suspended biomass was not affected by the differences in the bed arrangement.
The sedimentation of biomass in the bottom was shown to be decreasing in both reactors, as presented in Figure 3a,b. Consequently, the volume of the experimental discharges was increased in order to remove biomass enough to reach the stated SOLR, from 200 mL to the useful volume of each reactor (Figure 3a,b). That is, discharges embraced all the settled biomass and eventually suspended biomass when the volume of the discharge was equal to the useful volume of the reactor. With the new data, experimental SOLR was calculated, as presented in Figure 2 (blue line). Although discharges attenuated the drop of the SOLR in both reactors, those were not enough to reach the adequate value. That is, for increasing SOLR, forced biomass detachment may be required. In any case, the curves of the experimental SOLR and the estimated SOLR with periodic discharges in the structured-bed reactor (Figure 2b) showed a greater proximity, indicating that controlling the amount of biomass may be more easily achieved in that system. The conformation of the bed, which provides a higher porosity, most likely facilitates the forced removal of microbial biomass. However, excess removal of biomass may negatively impact the performance of fermentation, as discussed in Section 3.2.

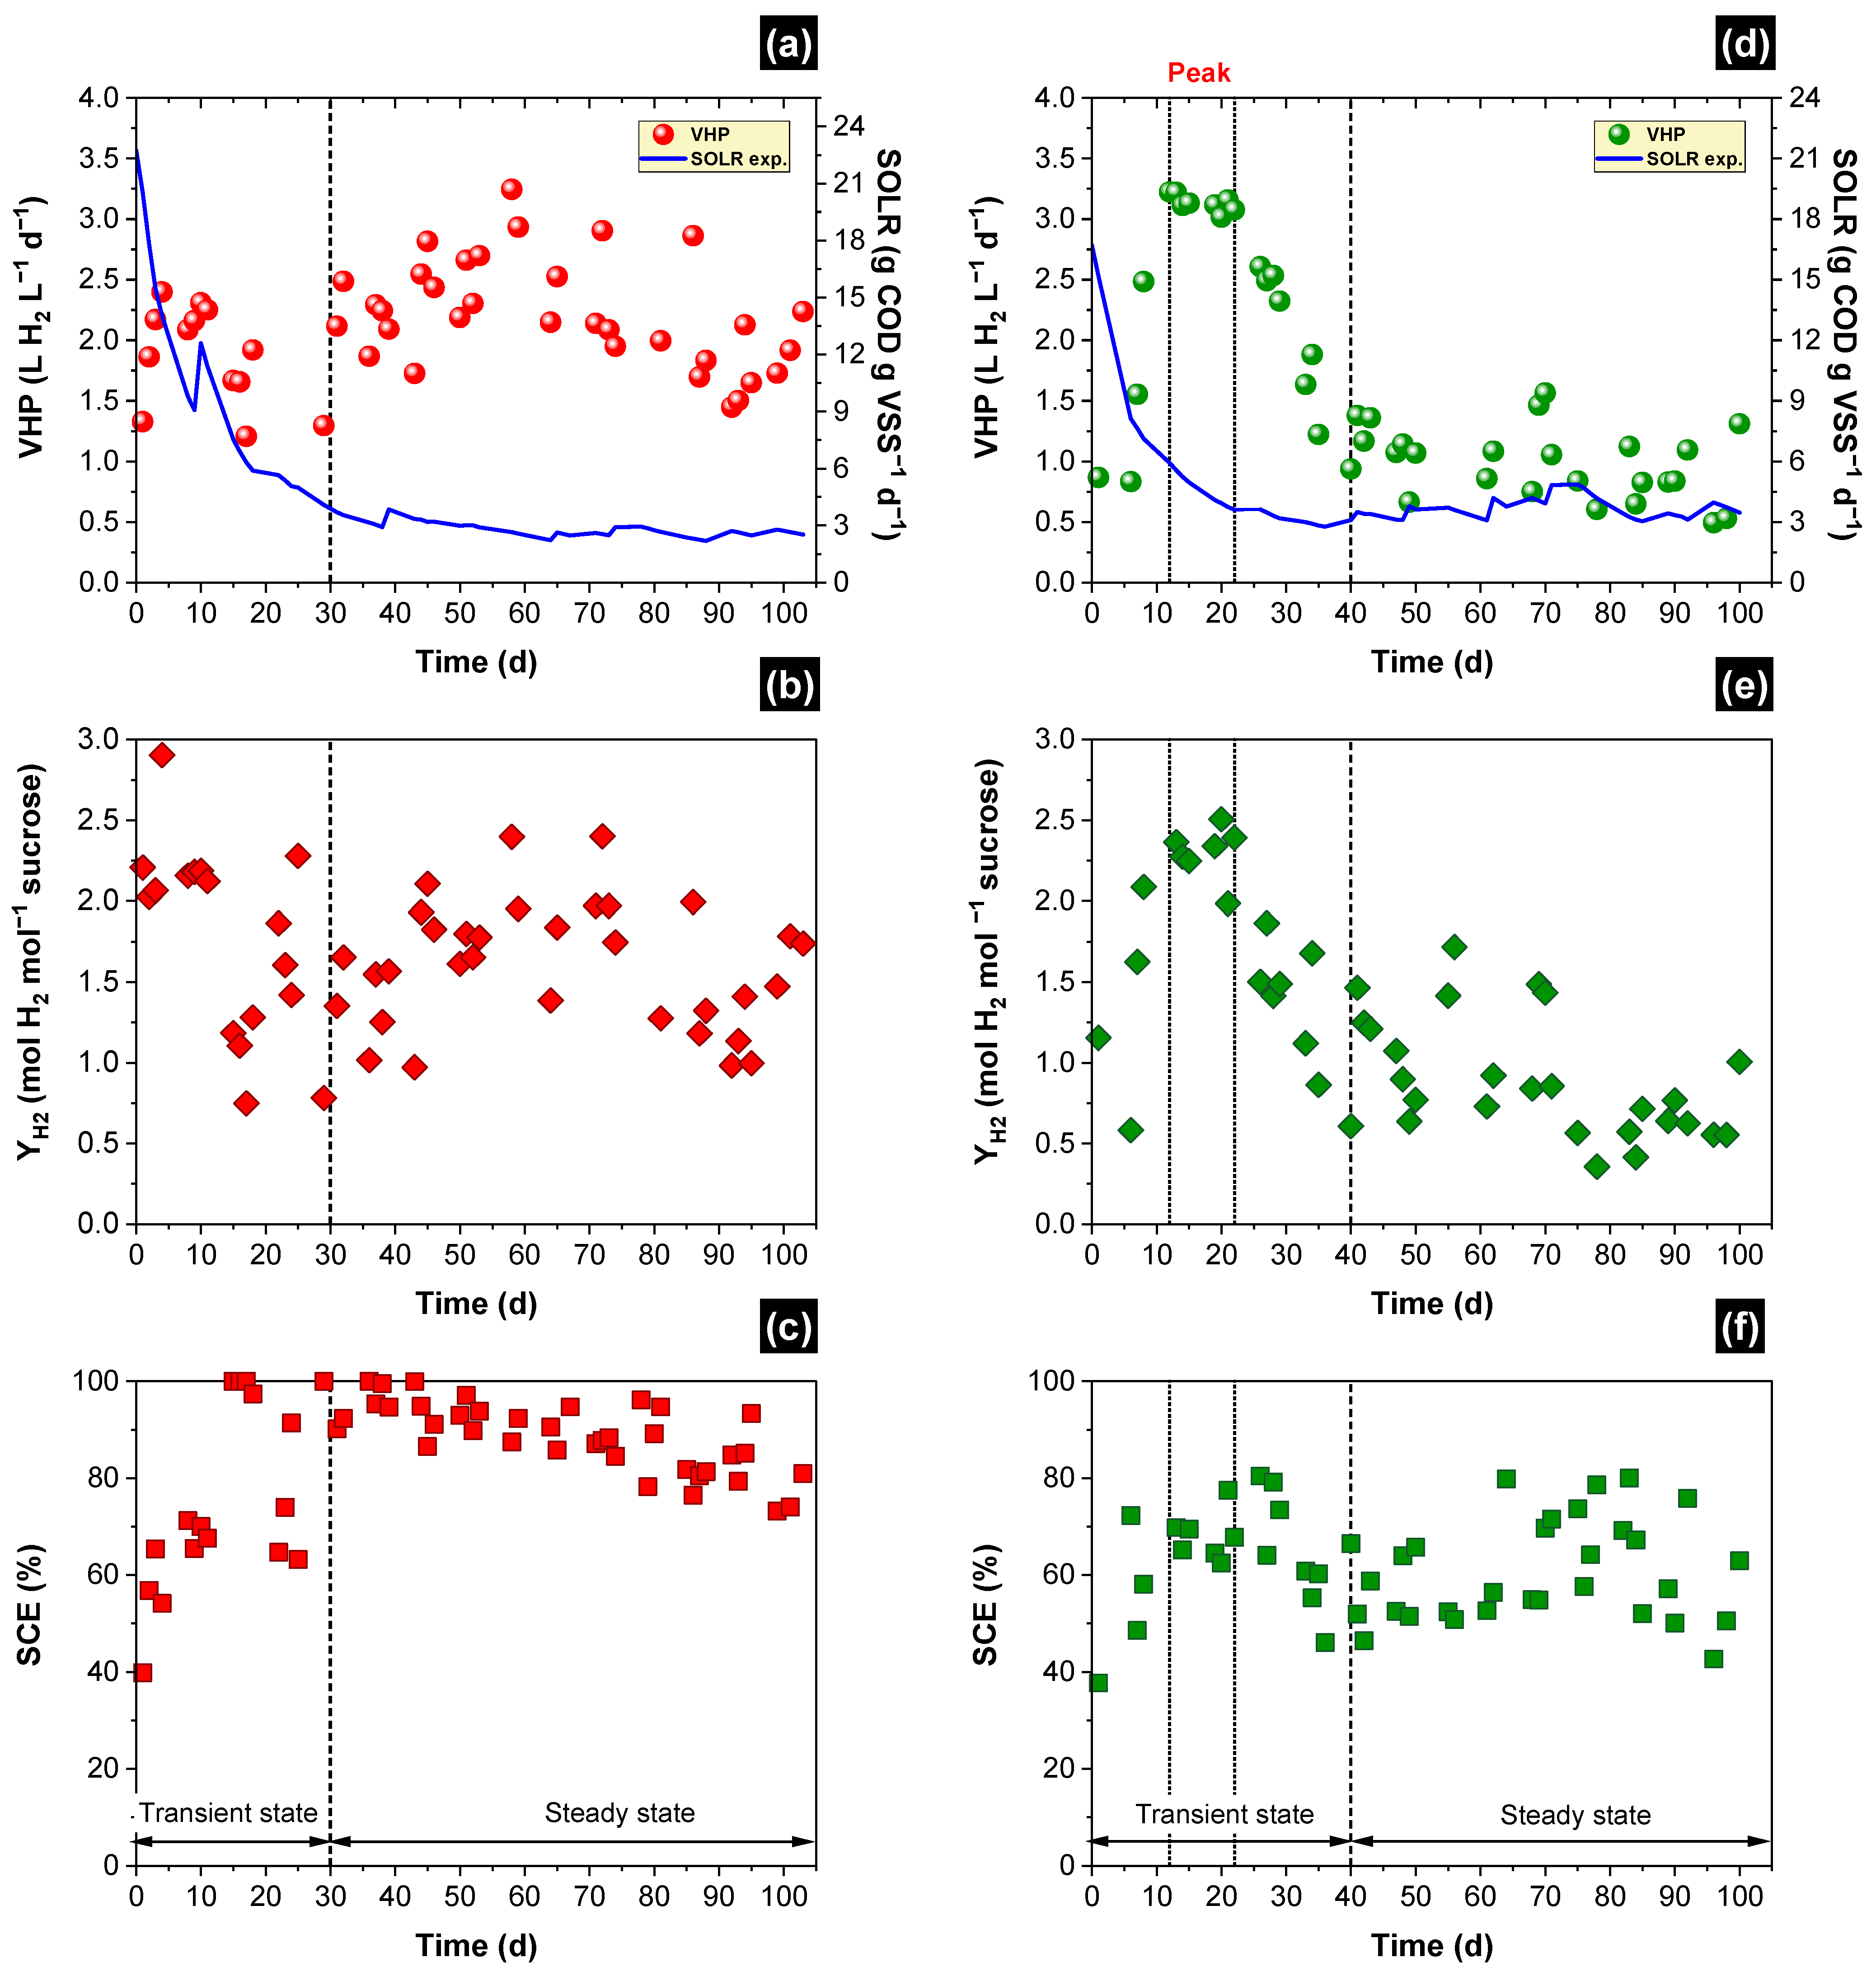
3.2. Hydrogen Production

The profile of hydrogen production and overall performance were markedly different for both reactors as presented in Figure 4. The stability criterion was based on a standard deviation of less than 25% in at least one of the following parameters: volumetric hydrogen production (VHP), hydrogen yield (HY), or sucrose conversion efficiency (SCE). The packed-bed reactor reached the total conversion of sucrose on approximately day 15, with subsequent instability by 15 days (Figure 4c). The steady state was assumed from day 30 onwards, with an SCE of 89 ± 7% (Table 3). However, the conversion efficiency showed a slight decreasing tendency, which coincided with the frequent biomass discharges. Hydrogen and carbon dioxide were produced from the first day of operation, with average molar fractions of 62 ± 2% and 38 ± 2%, respectively, during the entire operating time. Methane was not detected, which shows an efficient selection of strictly hydrolytic/fermentative bacteria during the inoculum preparation. During the steady-state period, VHP was kept continuous at 2.2 ± 0.2 L H2 L−1 d−1 (Table 3), with an associated HY of 1.6 ± 0.4 mol H2 mol−1 converted sucrose (Table 3), whereas the SOLR was maintained between 4.1 and 2.2 g sucrose g−1 VSS d−1.
On the other hand, the sucrose conversion efficiency achieved a maximum of 80% on day 25 in the structured-bed reactor (Figure 4f). The steady-state was considered from day 40 onwards. However, the sucrose conversion fluctuated at 61 ± 10% (Table 3), i.e., showing a coefficient of variation of ca. 17%. Similarly to the packed-bed reactor, hydrogen with carbon dioxide was produced from the first day of operation, with average molar fractions of 65 ± 4% and 35 ± 4%, respectively, and methane was not detected. However, the VHP peaked at 3.2 L H2 L−1 d−1 on day 12 and reached a mean value of 3.1 ± 0.1 L H2 L−1 d−1 for only ten days (Figure 4d). Subsequently, biogas production decreased constantly until nearly 1.0 L H2 L−1 d−1 on day 40. A hypothesis was proposed that the relatively low SOLR (3.1 ± 0.4 g sucrose g−1 VSS d−1) between days 26 and 39 resulted in a decrease in biogas production. However, this period coincided with the beginning of the periodic biomass discharges on day 26, when the decline in the SCE was also observed, indicating that, in this case, discharges were harmful to the overall performance.
It is remarkable that, although the SOLR was lower than the optimum value (≈6 g sucrose g−1 VSS d−1), the biogas production was uninterrupted. This result is opposite to the ones observed in previous experiences with packed-bed reactors, in which the production of hydrogen did not achieve a steady-state behavior, as presented in Table 4. In most cases, hydrogen production continuously decreased after an initial peak, with eventual complete cessation after a short period. Noteworthy, the steady VHP reached in this work using the packed- and structured-bed reactors was, respectively, almost four-fold and two-fold higher than the value reported using bed structuration and flow inversion as improving strategies [13]. Furthermore, eventual discharges of biomass were shown to favor the recovery of hydrogen but were not enough to maintain continuous production [28]. Despite the unsatisfactory control of the SOLR, as discussed in Section 3.1, the controlling biomass discharges most likely positively impacted the hydrogenogenic activity, once no enhanced fermentative activity losses were observed. The low porosity of the bed most likely retained a “back-up amount of biomass” which was capable of maintaining the hydrogen production regardless of the biomass losses.
Differently from the packed-bed reactor, the amount of biomass retained in the structured bed most likely was not capable of offsetting the suspended biomass losses triggered by the discharges. Comparatively, the amount of attached biomass quantified in the packed-bed reactor (15,504 mg VSS; Table 2) was roughly 50% higher than that attached in the structured-bed system (10,207 mg VSS; Table 2), which corroborates this hypothesis. Moreover, the amount of suspended biomass discharged from the structured-bed reactor (60,798 mg VSS; Table 2) exceeds that of the packed-bed one (46,429 mg VSS; Table 2) by 30%. Recent studies on the dark fermentation of sugarcane molasses using structured-bed reactors showed that carbohydrate conversion occurs primarily in the feeding chamber of the reactors [26]. Hence, the periodic biomass discharges most likely hindered the growth of the primary fermenters in the structured-bed reactor assessed in this study.

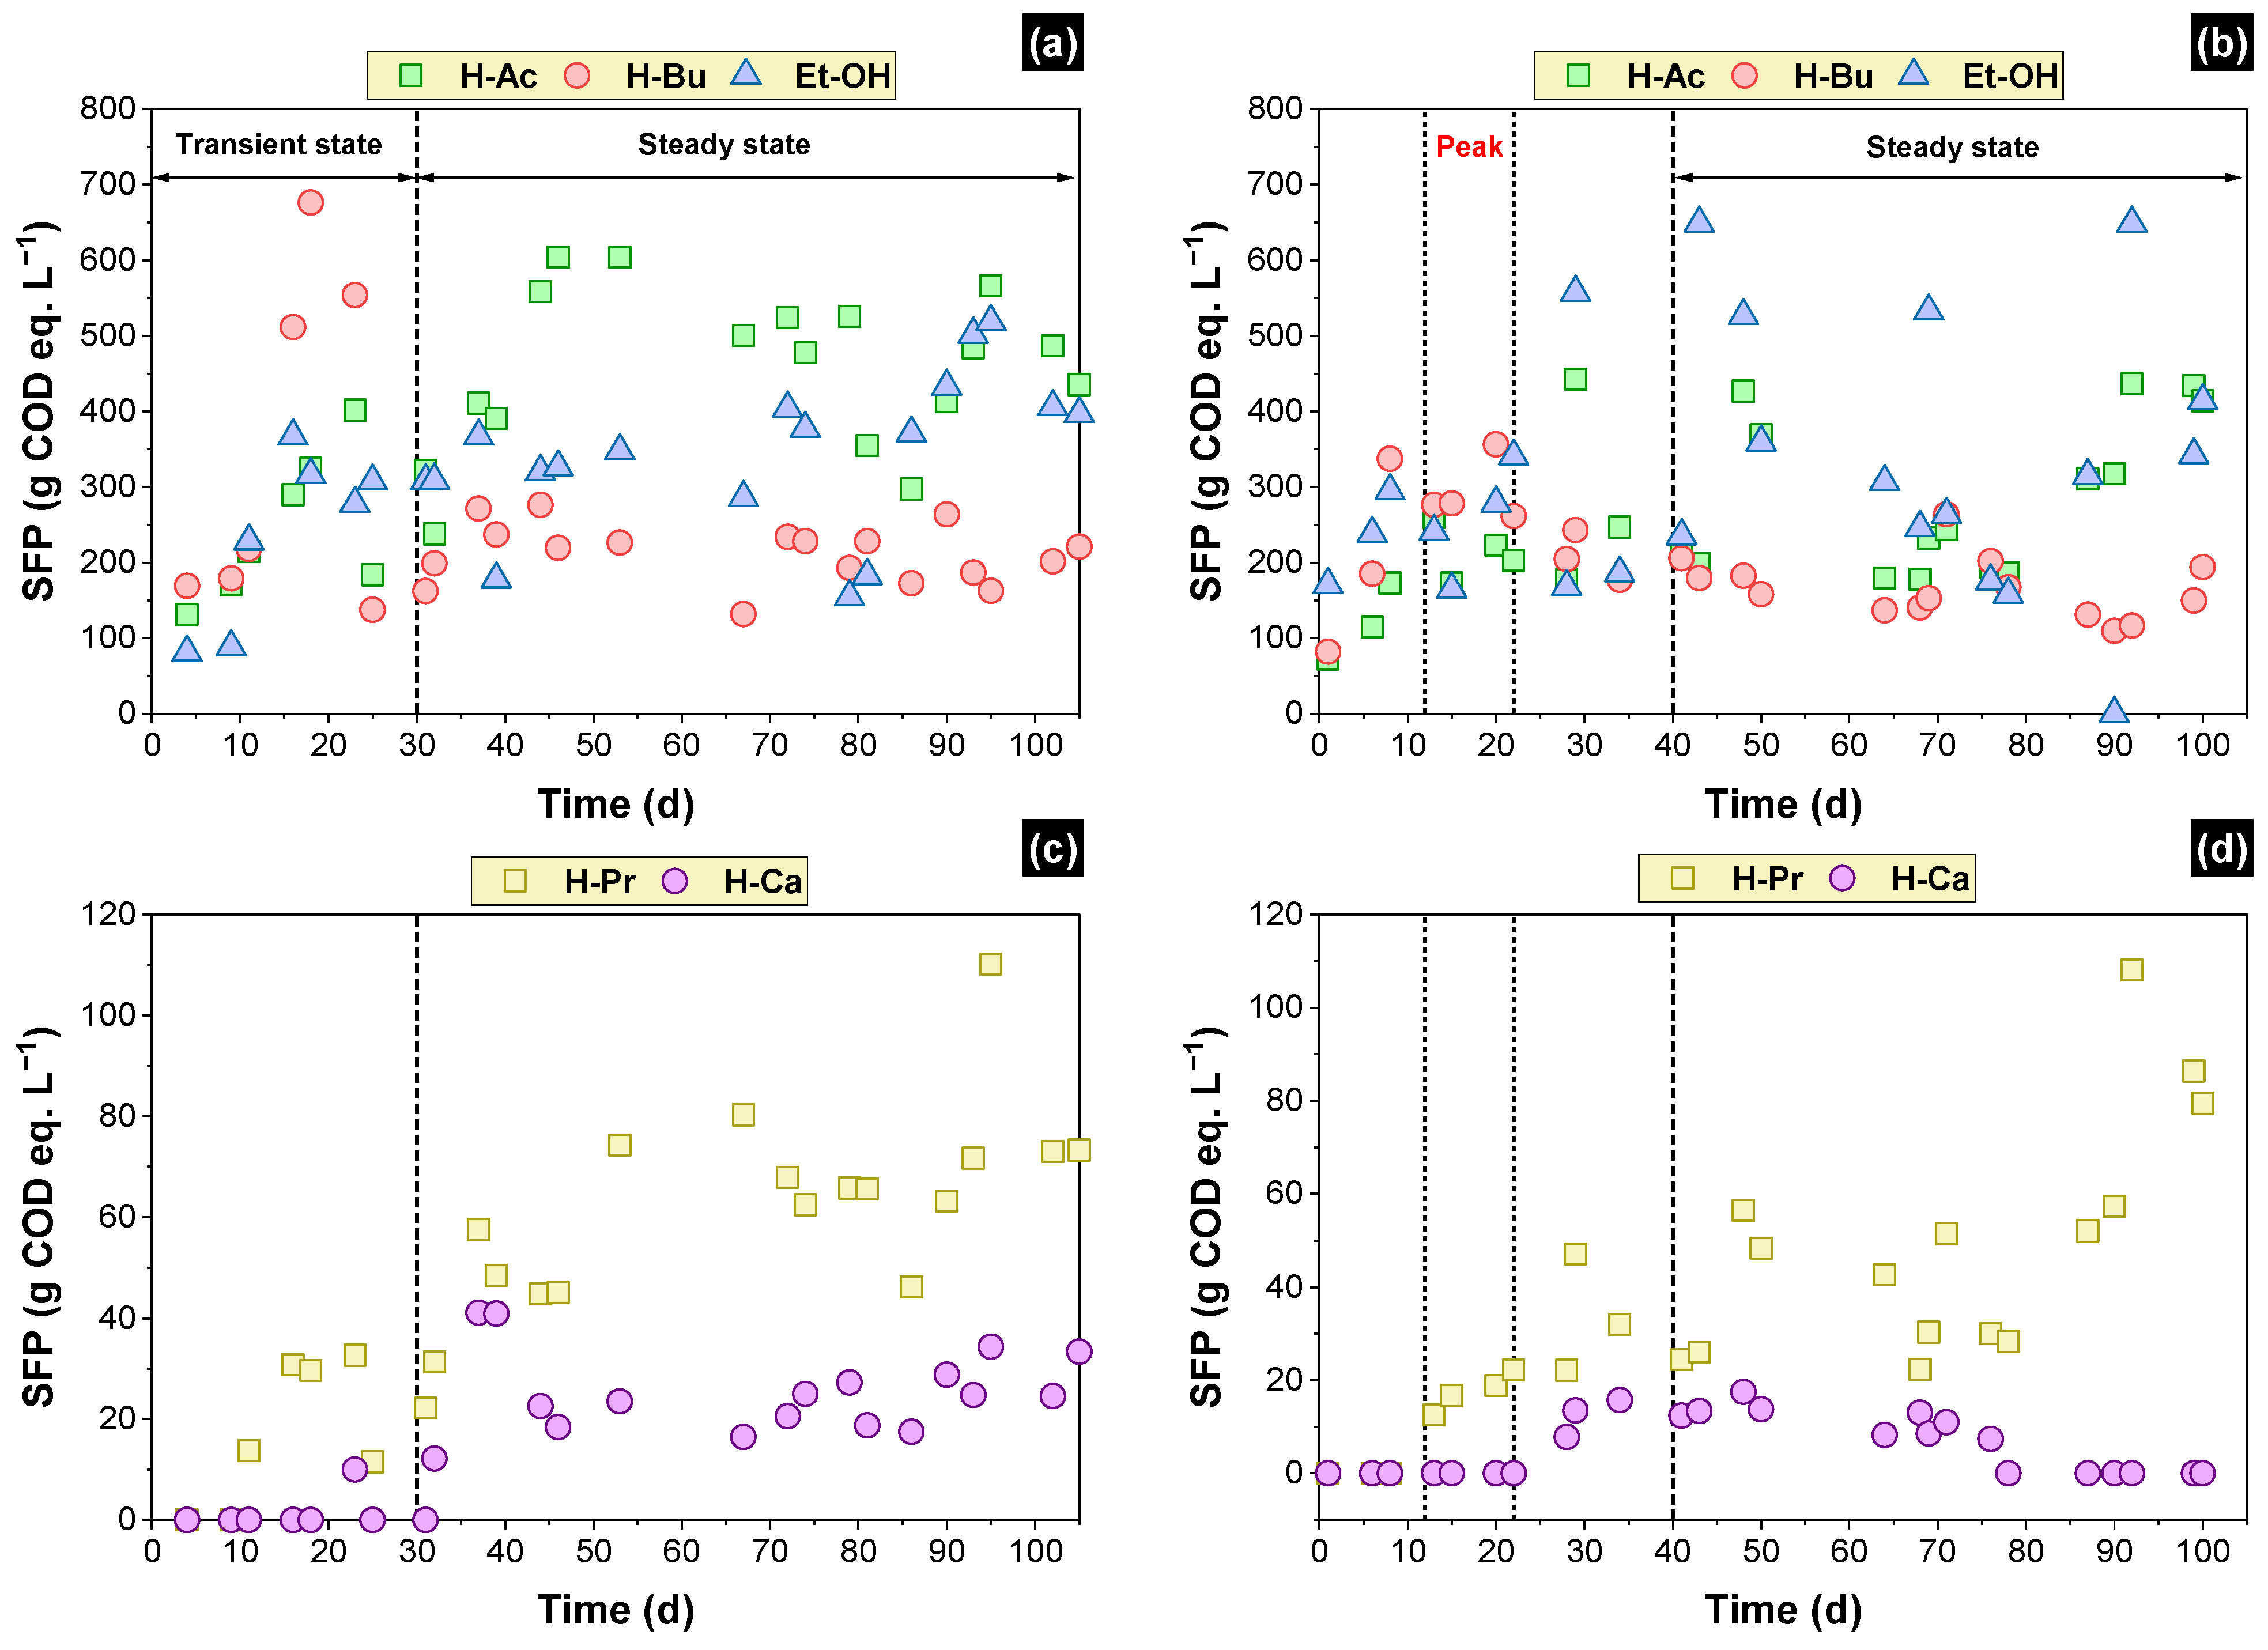
3.3. Soluble Fermentation Products (SFP)

The SFP indicated the microbial pathways. In both reactors, sucrose was converted mainly into acetic and butyric acids and ethanol but with different production spectra, as presented in Figure 5 (temporal profiles) and summarized in Table 5. Secondarily, propionic and caproic acids were observed in concentrations lower than 100 g COD L−1. Butyric acid dominated the transient state in the packed-bed reactor (Figure 5a). However, acetic acid achieved 24% of the converted COD during steady-state operation (Table 4), indicating a shift in the prevailing pathway. Conversely, no preferential metabolic pathway was observed in the structured-bed reactor during the transient stage, with the production of similar concentrations of acetic and butyric acids and ethanol (Figure 5). Subsequently, ethanol production increased, reaching 20% of the COD converted during the steady-state operation (Table 5).
Acetic and butyric acids and ethanol have been related to hydrogen production from several substrates [15,38]. Ferreira et al. [39] observed that sucrose was converted mainly into acetic acid (between 31% and 46%), butyric acid (between 0.5% and 21%), and ethanol (23%) in an anaerobic fluidized bed reactor studied to obtain hydrogen from synthetic wastewater (5 g COD L−1) under different HRTs (1–8 h). When assessing the hydrogen production from cassava starch wastewater (8 g COD L−1) in a fixed-bed reactor, Torres et al. [25] observed acetic acid (180–587 mg L−1), butyric acid (275–672 mg L−1), and ethanol (97–925 mg L−1) as the main metabolites. Similarly, Fuess et al. [28] observed a mean production of acetic acid of 1355 mg L−1 and butyric acid of 1378 mg L−1 concomitantly with the hydrogen production from sugarcane stillage. However, a fraction of those SFP (except for butyric acid) could have been produced through hydrogen-consuming or even non-hydrogen-producing pathways, such as homoacetogenesis or ethanol-type fermentation from sugars [9].
On the other hand, propionic and caproic acid production is directly related to hydrogen consumption, according to R3 and R4, respectively [12]. The production of propionic acid in both reactors started on day 10th with ca. 20 mg COD L−1, after which an increasing pattern was observed up to ca. 80 mg COD L−1 (Figure 5c,d). In addition, traces of caproic acid were observed during the transient stage in the packed-bed reactor, and later with a mean concentration of 24 ± 7 mg COD L−1 from day 35 onwards (Figure 5c). Meanwhile, caproic acid was identified between days 28 and 76 in the structured-bed reactor, showing a mean concentration of 12 ± 3 mg COD L−1. After that, caproic acid was not detected anymore. Different from the primary SFP, the production of propionic and caproic acids started once their precursors started to build up in the bulk liquid. That is, the accumulation of H2 and butyric acid affected the microbial community, which led to the formation of secondary SFP [40]. A marked decrease in the hydrogenogenic activity was observed by Fuess et al. [28] with the concomitant report of propionic acid production (ca. 720 mg L−1), which could have inhibited acetic acid production. Menezes et al. [14] and Ferreira et al. [39] reported higher percentages of influent COD conversion into propionic acid in comparison with this work, with values ranging between 8 and 23% and 14 and 48%, respectively. Caproic acid, observed with less frequency in this study, has been related to the use of H2 as an electron donor, accounting for 16% [39] and between 3% and 56% [41] of the available COD in previous studies.
C 6 H 12 O 6 + 2 H 2 2 C H 3 C H 2 C O O H + 2 H 2 O G 0 = 279.4   k J
C H 3 C H 2 2 C O O + 2 C O 2 + 6 H 2 C H 3 C H 2 4 C O O + 4 H 2 O G 0 = 143.3   k J

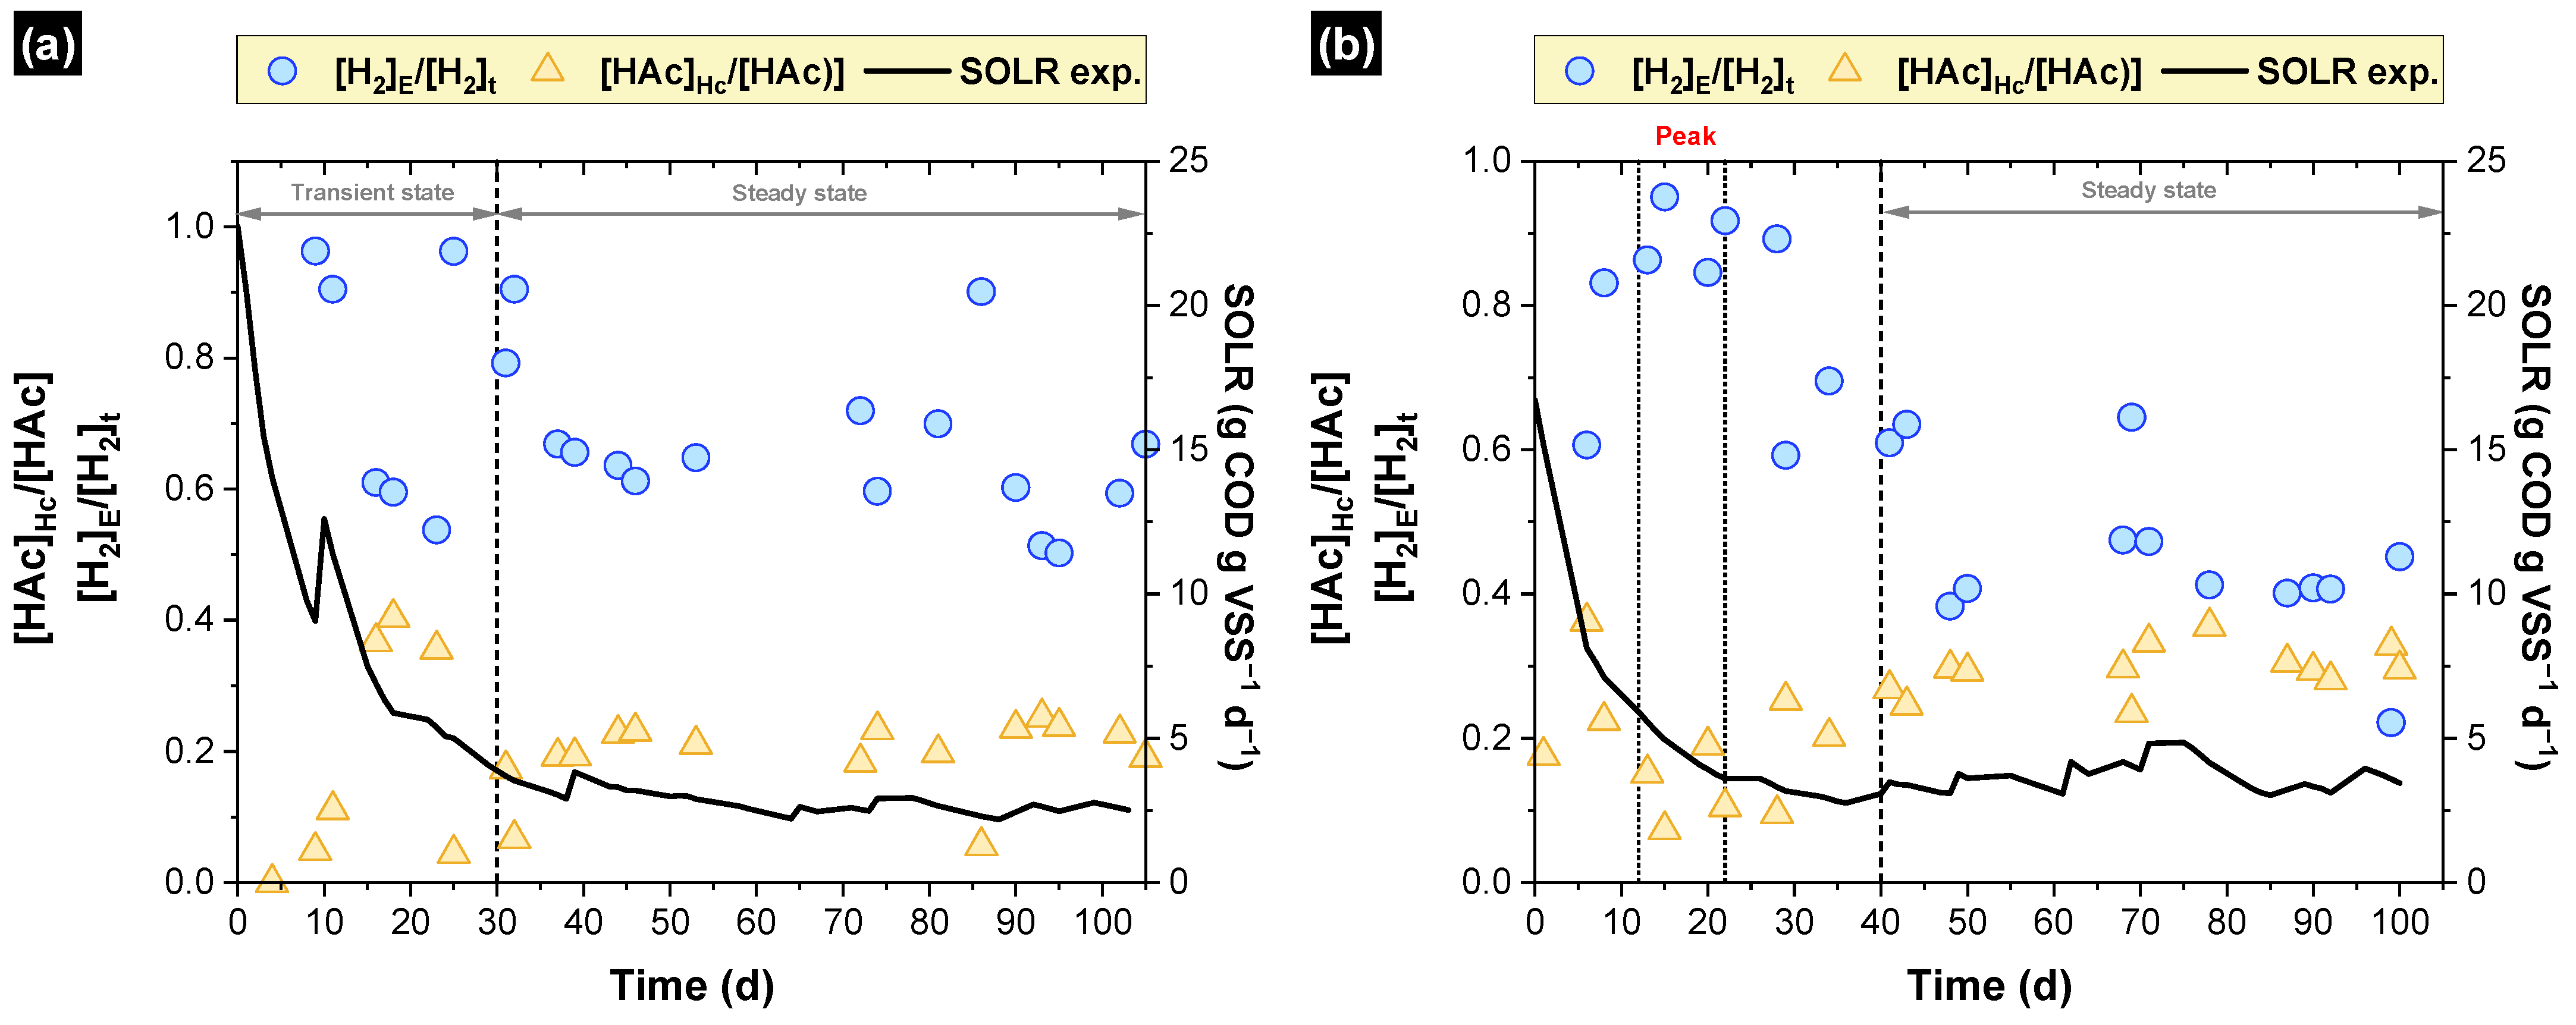
3.4. Hydrogen Consumption

Figure 6 depicts the fraction of homoacetogenesis-derived acetic acid in both reactors. The contribution of homoacetogenesis to acetate production peaked at 37% during the transient state in the packed-bed reactor (Figure 6a), with a subsequent drop, which was consistent with the beginning of the biomass discharges. During the steady-state period, such a fraction was kept at ca. 19 ± 4% (Figure 6a). During the peak of hydrogen production in the structured-bed reactor, the percentage of homoacetogenesis-derived acetic acid was 13 ± 4% (Figure 6b); however, after the peak, this percentage showed a slight but constant increase up to 30%.
Homoacetogenesis has been observed in several types of biohydrogen-producing reactors subjected to different operating parameters and substrates. De Menezes and Silva [14] verified homoacetogenesis between 39% and 50% in expanded granular sludge bed (EGSB) reactors while assessing hydrogen production from sugarcane juice (5, 10, and 15 g COD L−1) under HRT values decreasing from 24 h to 1 h. The authors indicated that there was no relation between the HRT or substrate concentration and the occurrence of homoacetogenesis, which occurred in all operational conditions. Castelló et al. [15] observed that more than 30% of the acetic acid production was derived from the homoacetogenic pathway in a hydrogen-producing continuous stirred tank reactor (CSTR) fed with raw cheese whey. Using specific real-time PCR (fthfs genes/ng DNA or fthfs genes/L) targeting the quantification of homoacetogens, the authors confirmed the presence of the functional gene in the community. Homoacetogenesis was related to the existence of Clostridium ljungdahlii in up-flow anaerobic sludge blanket (UASB) and packed-bed (PBR) reactors under low HRT (<8 h) [42]. A relation between homoacetogenesis and CO2 proportion in the headspace was described by Zheng et al. [43]. Fermentative experiments carried out under CO2 proportions of 0%, 25%, 50%, 75%, and 100% showed that hydrogen consumption by homoacetogens was lower than 50% in CO2 proportions of 25% and 50%. Furthermore, it was observed that for those cases, the propionic acid proportion was higher than in the other CO2 concentrations, from which it was supposed that homoacetogens might have been inhibited by the propionic-producing bacteria. Anyway, the hydrogen consumption was unavoidable.
Previously, Anzola-Rojas and Zaiat [13] verified that the homoacetogenesis percentage was constant (ca. 60%) in down-flow structured-bed reactors using polyethylene, polyurethane foam, and ceramic as support materials for biomass attachment. Such an observation was related to the excess biomass accumulation, which resulted in decreasing SOLR values that triggered shifts in the microbial pathways. In this study, with the intensive biomass discharges, homoacetogenesis was markedly reduced compared with the previous study. However, the adopted strategy was not enough to completely inhibit homoacetogens. These results were compatible with the findings of Montoya-Rosales et al. [40], who suggested that the homoacetogenesis phenomenon coexists in hydrogen-producing mixed cultures. Furthermore, the authors claimed that homoacetogens can persist under different operational conditions even at low relative abundance [21,40].

3.5. Unreleased Hydrogen—Where Is the Hydrogen?

After estimating the theoretical hydrogen H 2 t taking into account the pathways of production and consumption of hydrogen, the relation H 2 E / H 2 t is presented in Figure 6. Noteworthily, during the steady state, the experimental hydrogen corresponded to 67% and 46% of the theoretical hydrogen in packed-bed and structured-bed reactors, respectively. In other words, Ca. 33% and 54% of hydrogen produced did not evolve to the gaseous phase in the packed-bed and structured-bed reactors, respectively. That is, biogas composed of hydrogen and carbon dioxide remained dissolved in the bulk liquid. Thus, because microorganisms can only take up gaseous substrates in their dissolved form [44], the occurrence of dissolved hydrogen could facilitate its consumption [45,46]. Noteworthily, the fraction of hydrogen released was inversely proportional to the homoacetogenic activity. Furthermore, the proportion of hydrogen trapped in the liquid phase during the steady-state period reached 54 ± 9% in the structured-bed reactor, which could have triggered ethanol production and, consequently, the low VHP (Figure 4d). Similarly, Zhang et al. [38] observed that the supersaturation of hydrogen led to low hydrogen yields, poor glucose degradation, and higher molar ratios of ethanol/(acetate + butyrate).
The supersaturation of hydrogen in the liquid phase occurs when the hydrogen production rate is higher than the gas–liquid mass transfer rate [47]. Pauss et al. [48] observed that in an anaerobic process, the H2 concentration in the liquid phase can reach 80-fold the thermodynamic equilibrium. It is noticeable that the proportion of hydrogen released was directly related to the bed arrangement in this study. A mixing regime more vigorous of the packed-bed reactor compared with the structured bed could have enhanced the gas–liquid mass transfer. Palomo-Briones et al. [45] concluded that the conditions of the mass transfer, i.e., measured by determining the volumetric mass transfer coefficient ( K L a ), can control the accumulation of hydrogen, as well the overall performance of the reactors and influence the metabolic pathways and microbial community. The authors confirmed that the increase in the K L a from 1.04 to 4.23 L h−1 improved the butyrate yield from 0.31 to 0.5 mol mol−1 hexose, consequently, the VHP increased from 4.4 to 7.6 L H2 L−1 d−1.

3.6. Future Perspectives

The results presented herein indicated that controlling the amount of biomass retained in fixed-bed reactors is required to achieve continuous hydrogen production levels, regardless of the bed arrangement. However, there were notable differences between the overall performance of the packed-bed and structured-bed systems (Table 3) as a result of different factors, such as the bed porosity and hydrodynamic patterns, as well as the diversity of the microbial communities established in the reactors (although microbial community characterization was not carried out, the different metabolite profiles obtained suggested the favoring of different microbial groups). On the one hand, the packed-bed reactor presented higher biomass retention levels (Section 3.1) and a better mixing regime compared with the structured bed (Section 3.4). However, despite the scheduled bottom biomass discharges, the amount of attached biomass is still excessive to achieve the optimal SOLR in that kind of bed arrangement. On the other hand, the actual structured arrangement of the bed could present a mixing regime ineffective for the liquid–gas mass transfer. Furthermore, a previous study utilizing a structured bed system indicated a non-uniform microbial diversity along the bed, with hydrogen producers prevailing mainly in the feeding compartment [26]. The bottom biomass discharges may have adversely impacted such hydrogen-producing bacteria in this study. Therefore, hydrodynamic assays investigating other types of bed configurations that include variations in the size and shape of the media, and even the media arrangement can be required. Such assays should be directed to optimize both the bed porosity and mixing regime, maintaining a uniform microbial diversity along the bed. These optimized factors could allow biomass control by scheduled discharges with longer time intervals, minimizing any microbial diversity alteration. Other studies can include analysis and better characterization of the solids retained and washed out from the reactor because the SOLR is usually presented in terms of VSS without any differentiation between cells and extracellular polymeric substances.

4. Conclusions

The success in utilizing scheduled bottom biomass discharges as a strategy to continuously control the specific organic loading rate in fixed-bed dark fermentation reactors was demonstrated to be dependent on the bed arrangement. Continuous hydrogen production (2.2 L H2 L−1 d−1 during steady-state operation) was achieved in the packed-bed reactor, most likely because the biomass attached to the bed offset the periodic losses of suspended biomass. Meanwhile, these biomass losses negatively affected the hydrogen production in the structured-bed system (1.0 L H2 L−1 d−1 during steady-state operation) because of the lower biomass retention capacity of the structured bed. The establishment of homoacetogenesis was controlled to a certain extent with this strategy, corresponding to no more than 20–30% of the acetogenic activity under steady-state operation in both reactors. The online control of biomass concentration in fermentative fixed-bed reactors is still a challenge, and further refining the approach is required, such as better characterizing the composition of VSS and carrying out online determinations of VSS concentrations. On the other hand, hydrodynamic assays could be useful for optimizing bed arrangement and mixing regime and, consequently, the biomass distribution.

Author Contributions

Conceptualization, M.d.P.A.-R., L.T.F. and M.Z.; methodology, M.d.P.A.-R. and M.Z.; investigation, M.d.P.A.-R. and L.T.F.; writing—original draft preparation, M.d.P.A.-R.; writing—review and editing, L.T.F. and M.Z.; supervision, M.Z.; funding acquisition, M.Z. All authors have read and agreed to the published version of the manuscript.

Funding

This research was funded by the São Paulo Research Foundation (FAPESP) [grant numbers 2009/15984-0 and 2009/17491-1] and in part by the Coordenação de Aperfeiçoamento de Pessoal de Nível Superior—Brasil (CAPES)—Finance Code 001.

Institutional Review Board Statement

Not applicable.

Informed Consent Statement

Not applicable.

Data Availability Statement

Data are contained within the article.

Conflicts of Interest

The authors declare no conflicts of interest.

References

  1. IPCC. Climate Change 2014 Synthesis Report; IPCC: Geneva, Switzerland, 2014. [Google Scholar]
  2. IRENA. Geopolitics of the Energy Transformation: The Hydrogen Factor; IRENA: Abu Dhabi, United Arab Emirates, 2022; ISBN 9789292603700. [Google Scholar]
  3. Dawood, F.; Anda, M.; Shafiullah, G.M. Hydrogen Production for Energy: An Overview. Int. J. Hydrogen Energy 2020, 45, 3847–3869. [Google Scholar] [CrossRef]
  4. Maggio, G.; Nicita, A.; Squadrito, G. How the Hydrogen Production from RES Could Change Energy and Fuel Markets: A Review of Recent Literature. Int. J. Hydrogen Energy 2019, 44, 11371–11384. [Google Scholar] [CrossRef]
  5. Ajanovic, A.; Sayer, M.; Haas, R. The Economics and the Environmental Benignity of Different Colors of Hydrogen. Int. J. Hydrogen Energy 2022, 47, 24136–24154. [Google Scholar] [CrossRef]
  6. IEA. The Future of Hydrogen; IEA: Paris, France, 2019. [Google Scholar] [CrossRef]
  7. Ntaikou, I.; Antonopoulou, G.; Lyberatos, G. Biohydrogen Production from Biomass and Wastes via Dark Fermentation: A Review. Waste Biomass Valorization 2010, 1, 21–39. [Google Scholar] [CrossRef]
  8. Yang, G.; Wang, J. Various Additives for Improving Dark Fermentative Hydrogen Production: A Review. Renew. Sustain. Energy Rev. 2018, 95, 130–146. [Google Scholar] [CrossRef]
  9. Dahiya, S.; Chatterjee, S.; Sarkar, O.; Mohan, S.V. Renewable Hydrogen Production by Dark-Fermentation: Current Status, Challenges and Perspectives. Bioresour. Technol. 2021, 321, 124354. [Google Scholar] [CrossRef]
  10. Chen, Y.; Yin, Y.; Wang, J. Recent Advance in Inhibition of Dark Fermentative Hydrogen Production. Int. J. Hydrogen Energy 2021, 46, 5053–5073. [Google Scholar] [CrossRef]
  11. Akhlaghi, N.; Najafpour-Darzi, G. A Comprehensive Review on Biological Hydrogen Production. Int. J. Hydrogen Energy 2020, 45, 22492–22512. [Google Scholar] [CrossRef]
  12. Saady, N.M.C. Homoacetogenesis during Hydrogen Production by Mixed Cultures Dark Fermentation: Unresolved Challenge. Int. J. Hydrogen Energy 2013, 38, 13172–13191. [Google Scholar] [CrossRef]
  13. Anzola-Rojas, M.d.P.; Zaiat, M. A Novel Anaerobic Down-Flow Structured-Bed Reactor for Long-Term Stable H2 Energy Production from Wastewater. J. Chem. Technol. Biotechnol. 2016, 91, 1551–1561. [Google Scholar] [CrossRef]
  14. de Menezes, C.A.; Silva, E.L. Hydrogen Production from Sugarcane Juice in Expanded Granular Sludge Bed Reactors under Mesophilic Conditions: The Role of Homoacetogenesis and Lactic Acid Production. Ind. Crops Prod. 2019, 138, 111586. [Google Scholar] [CrossRef]
  15. Castelló, E.; Braga, L.; Fuentes, L.; Etchebehere, C. Possible Causes for the Instability in the H2 Production from Cheese Whey in a CSTR. Int. J. Hydrogen Energy 2018, 43, 2654–2665. [Google Scholar] [CrossRef]
  16. Arooj, M.F.; Han, S.-K.; Kim, S.-H.; Kim, D.-H.; Shin, H.-S. Continuous Biohydrogen Production in a CSTR Using Starch as a Substrate. Int. J. Hydrogen Energy 2008, 33, 3289–3294. [Google Scholar] [CrossRef]
  17. Luo, G.; Karakashev, D.; Xie, L.; Zhou, Q.; Angelidaki, I. Long-Term Effect of Inoculum Pretreatment on Fermentative Hydrogen Production by Repeated Batch Cultivations: Homoacetogenesis and Methanogenesis as Competitors to Hydrogen Production. Biotechnol. Bioeng. 2011, 108, 1816–1827. [Google Scholar] [CrossRef] [PubMed]
  18. Carrillo-Reyes, J.; Celis, L.B.; Alatriste-Mondragón, F.; Razo-Flores, E. Decreasing Methane Production in Hydrogenogenic UASB Reactors Fed with Cheese Whey. Biomass Bioenergy 2014, 63, 101–108. [Google Scholar] [CrossRef]
  19. Carrillo-Reyes, J.; Celis, L.B.; Alatriste-Mondragón, F.; Montoya, L.; Razo-Flores, E. Strategies to Cope with Methanogens in Hydrogen Producing UASB Reactors: Community Dynamics. Int. J. Hydrogen Energy 2014, 39, 11423–11432. [Google Scholar] [CrossRef]
  20. Anzola-Rojas, M.d.P.; Da Fonseca, S.G.; Da Silva, C.C.; De Oliveira, V.M.; Zaiat, M. The Use of the Carbon/Nitrogen Ratio and Specific Organic Loading Rate as Tools for Improving Biohydrogen Production in Fixed-Bed Reactors. Biotechnol. Rep. 2015, 5, 46–54. [Google Scholar] [CrossRef] [PubMed]
  21. Fuentes, L.; Palomo-Briones, R.; de Jesús Montoya-Rosales, J.; Braga, L.; Castelló, E.; Vesga, A.; Tapia-Venegas, E.; Razo-Flores, E.; Ecthebehere, C. Knowing the Enemy: Homoacetogens in Hydrogen Production Reactors. Appl. Microbiol. Biotechnol. 2021, 105, 8989–9002. [Google Scholar] [CrossRef] [PubMed]
  22. Thi Nguyen, M.-L.; Hung, P.-C.; Vo, T.-P.; Lay, C.-H.; Lin, C.-Y. Effect of Food to Microorganisms (F/M) Ratio on Biohythane Production via Single-Stage Dark Fermentation. Int. J. Hydrogen Energy 2021, 46, 11313–11324. [Google Scholar] [CrossRef]
  23. Blanco, V.M.C.; Fuess, L.T.; Zaiat, M. Calcium Dosing for the Simultaneous Control of Biomass Retention and the Enhancement of Fermentative Biohydrogen Production in an Innovative Fixed-Film Bioreactor. Int. J. Hydrogen Energy 2017, 42, 12181–12196. [Google Scholar] [CrossRef]
  24. Gomes, S.D.; Fuess, L.T.; Mañunga, T.; De Lima Gomes, P.C.F.; Zaiat, M. Bacteriocins of Lactic Acid Bacteria as a Hindering Factor for Biohydrogen Production from Cassava Flour Wastewater in a Continuous Multiple Tube Reactor. Int. J. Hydrogen Energy 2016, 41, 8120–8131. [Google Scholar] [CrossRef]
  25. Torres, D.G.B.; dal’ Maso Lucas, S.; Andreani, C.L.; de Carvalho, K.Q.; Coelho, S.R.M.; Gomes, S.D. Hydrogen Production and Performance of Anaerobic Fixed-Bed Reactors Using Three Support Arrangements from Cassava Starch Wastewater. Eng. Agric. 2017, 37, 160–172. [Google Scholar] [CrossRef]
  26. Fuess, L.T.; Fuentes, L.; Bovio-Winkler, P.; Eng, F.; Etchebehere, C.; Zaiat, M.; Oller do Nascimento, C.A. Biohydrogen-Producing from Bottom to Top? Quali-Quantitative Characterization of Thermophilic Fermentative Consortia Reveals Microbial Roles in an Upflow Fixed-Film Reactor. Chem. Eng. J. Adv. 2021, 7, 100125. [Google Scholar] [CrossRef]
  27. Corbari, S.D.M.L.; Andreani, C.L.; Torres, D.G.B.; Eng, F.; Gomes, S.D. Strategies to Improve the Biohydrogen Production from Cassava Wastewater in Fixed-Bed Reactors. Int. J. Hydrogen Energy 2019, 44, 17214–17223. [Google Scholar] [CrossRef]
  28. Fuess, L.T.; Mazine Kiyuna, L.S.; Garcia, M.L.; Zaiat, M. Operational Strategies for Long-Term Biohydrogen Production from Sugarcane Stillage in a Continuous Acidogenic Packed-Bed Reactor. Int. J. Hydrogen Energy 2016, 41, 8132–8145. [Google Scholar] [CrossRef]
  29. Hafez, H.; Nakhla, G.; Naggar, M.H.E.; Elbeshbishy, E.; Baghchehsaraee, B. Effect of Organic Loading on a Novel Hydrogen Bioreactor. Int. J. Hydrogen Energy 2010, 35, 81–92. [Google Scholar] [CrossRef]
  30. Gomes, S.D.; Fuess, L.T.; Penteado, E.D.; Lucas, S.D.M.; Gotardo, J.T.; Zaiat, M. The Application of an Innovative Continuous Multiple Tube Reactor as a Strategy to Control the Specific Organic Loading Rate for Biohydrogen Production by Dark Fermentation. Bioresour. Technol. 2015, 197, 201–207. [Google Scholar] [CrossRef]
  31. Stenerson, K. Analysis of Permanent Gases. Report 2004, 3, 3. [Google Scholar]
  32. Dubois, M.; Gilles, K.A.; Hamilton, J.K.; Rebers, P.A.; Smith, F. Colorimetric Method for Determination. Anal. Chem. 1956, 28, 350–356. [Google Scholar] [CrossRef]
  33. APHA. Standard Methods for the Examination of Water and Wastewater, 23rd ed.; American Public Health Association, American Water Works Association: Washington, DC, USA, 2017; ISBN 9780875532875. [Google Scholar]
  34. Adorno, M.; Hirasawa, J.; Varesche, M. Development and Validation of Two Methods to Quantify Volatile Acids. Am. J. Anal. Chem. 2014, 5, 406–414. [Google Scholar] [CrossRef]
  35. Maintinguer, S.I.; Fernandes, B.S.; Duarte, I.C.S.; Saavedra, N.K.; Adorno, M.A.T.; Varesche, M.B. Fermentative Hydrogen Production by Microbial Consortium. Int. J. Hydrogen Energy 2008, 33, 4309–4317. [Google Scholar] [CrossRef]
  36. Matsumoto, M.; Nishimura, Y. Hydrogen Production by Fermentation Using Acetic Acid and Lactic Acid. J. Biosci. Bioeng. 2007, 103, 236–241. [Google Scholar] [CrossRef] [PubMed]
  37. Dipasquale, L.; d’Ippolito, G.; Fontana, A. Capnophilic Lactic Fermentation and Hydrogen Synthesis by Thermotoga Neapolitana: An Unexpected Deviation from the Dark Fermentation Model. Int. J. Hydrogen Energy 2014, 39, 4857–4862. [Google Scholar] [CrossRef]
  38. Zhang, F.; Zhang, Y.; Chen, M.; Zeng, R.J. Hydrogen Supersaturation in Thermophilic Mixed Culture Fermentation. Int. J. Hydrogen Energy 2012, 37, 17809–17816. [Google Scholar] [CrossRef]
  39. Ferreira, T.B.; Rego, G.C.; Ramos, L.R.; Soares, L.A.; Sakamoto, I.K.; de Oliveira, L.L.; Varesche, M.B.A.; Silva, E.L. Selection of Metabolic Pathways for Continuous Hydrogen Production under Thermophilic and Mesophilic Temperature Conditions in Anaerobic Fluidized Bed Reactors. Int. J. Hydrogen Energy 2018, 43, 18908–18917. [Google Scholar] [CrossRef]
  40. Montoya-Rosales, J.d.J.; Ontiveros-Valencia, A.; Esquivel-Hernández, D.A.; Etchebehere, C.; Celis, L.B.; Razo-Flores, E. Metatranscriptomic Analysis Reveals the Coexpression of Hydrogen-Producing and Homoacetogenesis Genes in Dark Fermentative Reactors Operated at High Substrate Loads. Environ. Sci. Technol. 2023, 57, 11552–11560. [Google Scholar] [CrossRef] [PubMed]
  41. Wang, Y.; Mu, Y.; Yu, H.Q. Comparative Performance of Two Upflow Anaerobic Biohydrogen-Producing Reactors Seeded with Different Sludges. Int. J. Hydrogen Energy 2007, 32, 1086–1094. [Google Scholar] [CrossRef]
  42. Si, B.; Li, J.; Li, B.; Zhu, Z.; Shen, R.; Zhang, Y.; Liu, Z. The Role of Hydraulic Retention Time on Controlling Methanogenesis and Homoacetogenesis in Biohydrogen Production Using Upflow Anaerobic Sludge Blanket (UASB) Reactor and Packed Bed Reactor (PBR). Int. J. Hydrogen Energy 2015, 40, 11414–11421. [Google Scholar] [CrossRef]
  43. Zheng, Y.; Huang, J.; Shen, R.; Zhao, Y.; Lei, C.; Wang, Y. Quantitative Analysis of Hydrogen and Fatty Acid from Homoacetogenesis and Optimization of Glycerol Fermentation Condition. Int. J. Hydrogen Energy 2023, 48, 4182–4192. [Google Scholar] [CrossRef]
  44. Van Hecke, W.; Bockrath, R.; De Wever, H. Effects of Moderately Elevated Pressure on Gas Fermentation Processes. Bioresour. Technol. 2019, 293, 122129. [Google Scholar] [CrossRef]
  45. Palomo-Briones, R.; Celis, L.B.; Méndez-Acosta, H.O.; Bernet, N.; Trably, E.; Razo-Flores, E. Enhancement of Mass Transfer Conditions to Increase the Productivity and Efficiency of Dark Fermentation in Continuous Reactors. Fuel 2019, 254, 115648. [Google Scholar] [CrossRef]
  46. Chang, S.; Li, J.; Liu, F.; Yu, Z. Effect of Different Gas Releasing Methods on Anaerobic Fermentative Hydrogen Production in Batch Cultures. Front. Environ. Sci. Eng. 2012, 6, 901–906. [Google Scholar] [CrossRef]
  47. Bakonyi, P.; Buitrón, G.; Valdez-Vazquez, I.; Nemestóthy, N.; Bélafi-Bakó, K. A Novel Gas Separation Integrated Membrane Bioreactor to Evaluate the Impact of Self-Generated Biogas Recycling on Continuous Hydrogen Fermentation. Appl. Energy 2017, 190, 813–823. [Google Scholar] [CrossRef]
  48. Pauss, A.; Andre, G.; Perrier, M.; Guiot, S.R. Liquid-to-Gas Mass Transfer in Anaerobic Processes: Inevitable Transfer Limitations of Methane and Hydrogen in the Biomethanation Process. Appl. Environ. Microbiol. 1990, 56, 1636–1644. [Google Scholar] [CrossRef] [PubMed]
Figure 1. Anaerobic up-flow fixed-bed reactors (A) cylinder-shaped particles of recycled low-density polyethylene used for bed packing; (B) regular-shaped cylinders of recycled low-density polyethylene used for bed structuring.
Fermentation 10 00213 g001
Figure 2. Simulated and experimental SOLR in the (a) packed-bed and (b) structured-bed reactors.
Fermentation 10 00213 g002
Figure 3. Biomass exiting from reactors: (a,b) VSS concentration of discharges (VSSd) and volume of each discharge (Vd), and (c,d) VSS mass flow w ˙ x .
Fermentation 10 00213 g003
Figure 4. Hydrogen production and sucrose conversion in the packed-bed and structured-bed reactors: (a,d) volumetric hydrogen production (VHP) and specific organic load rate (SOLR), (b,e) hydrogen yield (YH2), and (c,f) sucrose conversion efficiency (SCE).
Fermentation 10 00213 g004
Figure 5. Soluble fermentation products (SFP) detected in the packed-bed and structured-bed reactors during transient and steady-state periods: (a,b) primary SFP and (c,d) secondary SFP.
Fermentation 10 00213 g005
Figure 6. Fraction of acetic acid produced via homoacetogenesis, and fraction of the experimental hydrogen compared with the theoretical production from SFP in the (a) packed-bed reactor and (b) structured-bed reactor.
Fermentation 10 00213 g006
Table 1. Operational features considered for estimating SOLR and scheduling biomass discharges.
Features of ReactorsValueReference
Y x / s for sucrose as substrate 0.06 g VSS g−1 consumed sucrose[13]
Substrate concentration 1.79 g sucrose L−1This work
HRT 2 hThis work
Packed-bed reactor
Useful volume 2.8 LThis work
Flow 1.4 L h−1This work
Substrate conversion (as sucrose concentration) 80%[20]
Biomass washed out in the effluent 70%[20]
Structured-bed reactor
Useful volume 3.6 LThis work
Flow 1.8 L h−1This work
Substrate removal (as sucrose concentration) 70%[13]
Biomass washed out in the effluent 81%[13]
Nomenclature: Y x / s —biomass growth per consumed substrate factor, HRT—hydraulic retention time.
Table 2. Biomass and substrate count at the end of the continuous operation of both reactors for determining the index Y x s and percentages of retained and washed-out biomass.
Biomass/Substrate CountPacked-Bed Reactor%Structured-Bed Reactor%
Retained in the reactor (mg) 67,417 78,507
Attached (mg) 15,5047.110,2073.8
Suspended (mg) 57602.775022.8
Discharged frequently (mg) 46,42921.460,79822.5
Washed out from the reactor (mg) 149,61268.8192,28271.0
Total produced biomass (mg) 217,305-270,789-
Total converted sucrose (mg) 5,000,691-4,505,748-
Index   Y x s (g VSS g−1 sucrose)0.043-0.060-
Table 3. Overall performance of the reactors during steady-state conditions a according to the sucrose conversion.
Parameter Packed-Bed ReactorStructured-Bed Reactor
Peak Steady
Biogas composition
Molar fraction (%)
H262 ± 2 66 ± 165 ± 4
CO238 ± 234 ± 135 ± 4
Volumetric hydrogen production—VHP
(L H2 L−1 d−1)
Min.1.33.00.5
Max.3.23.21.6
Ave.2.2 ± 0.43.1 ± 0.11.0 ± 0.3
St. dev. (%)161.630
Hydrogen yield—HY
(mole H2 mol−1 sucrose)
Min.0.82.00.4
Max.2.42.51.7
Ave.1.6 ± 0.32.3 ± 0.10.9 ± 0.3
St. dev. (%)24530
Sucrose conversion efficiency—SCE
(%)
Min.726243
Max.1007780
Ave.89 ± 668 ± 461 ± 9
St. dev. (%)7515
SOLR
(g sucrose g−1 VSS d−1)
Min.2.23.63.0
Max.3.85.94.9
Ave.2.8 ± 0.34.6 ± 0.83.7 ± 0.4
St. dev. (%)111712
Note: a packed-bed: from day 30 onwards; structured-bed reactor: from day 40 onwards.
Table 4. Comparative data regarding hydrogen production in fixed-bed reactors.
Ref.Fixed-Bed Arrangement/Material (Void Index)SubstrateAssessed ConditionOLR
(g L−1 d−1)
Substrate Conversion (%)YH2
(mol H2 mol−1
Substrate)
VHP
L H2 d−1 L−1
Steady State Not/Yes
(Highlights)
Anzola-Rojas et al. [20]Packed-bed
RLDP (60%)
Synthetic wastewater based on sucroseC/N = 402488.4 ± 5.31.7 *NDNOT
(Continuous decrease in H2 production)
C/N = 9092.7 ± 7.13.1 *ND
C/N = 14088.5 ± 5.13.5 *ND
C/N = 19089.5 ± 9.72.9 *ND
Anzola-Rojas et al. [13]Structured-bed and down-flow
RLPD (85%)
PF (70%)
Ceramic (72%)
Synthetic wastewater based on sucroseRLPD2470 ± 110.4 ± 0.20.5 ± 0.2YES
PF2471 ± 100.5 ± 0.20.6 ± 0.3YES
Ceramic2458 ± 140.1 ± 0.20.2 ± 0.2NOT (H2 production ceased completely after 60 d)
Same as above with eventual biomass dischargesSynthetic wastewater based on sucroseRLPD2464 ± 110.6 ± 0.20.6 ± 0.2YES
PF2466 ± 90.6 ± 0.30.6 ± 0.3YES
Ceramic2448 ± 110.3 ± 0.20.3 ± 0.2YES
Fuess et al. [28] Packed-bed
Small pieces of RLPD (65%)
Sugarcane stillageHigh OLR
Eventual biomass discharges
ph control between 5.1 and 5.2
84.264 ± 101.5 ± 1.10.8 ± 0.6NOT
(H2 production recovered after operational strategies)
Blanco et al. [23]Structured-bed
RLDP (ND)
Synthetic wastewater based on sucroseCOD/Ca =
4423
2454 ± 12 0.3 ± 0.60.6 ± 0.6 NOT
(Continuous decrease in H2 production)
207956 ± 150.6 ± 0.61.2 ± 0.5
135757 ± 161.4 ± 1.21.4 ± 0.6
101261 ± 151.2 ± 1.11.3 ± 0.4
88464 ± 150.2 ± 0.20.8 ± 0.4
63267 ± 130.5 ± 0.41.3 ± 0.6
Torres et al. [25]Structured-bed
RLDP (ND)
Bamboo stems
(ND)
Cassava starch wastewaterRLDP 95 ± 30.20.22NOT
(Continuous decrease in H2 production)
92 ± 100.80.25
Bamboo stems 93 ± 110.150.17
93 ± 60.310.14
Corbari et al. [27]Structured-bed
RLDP
(76%)
Cassava starch wastewaterAnaerobic Sludge 1095 ± 30.2 ± 0.20.2 ± 0.2NOT
(Continuous decrease in H2 production)
2090 ± 90.2 ± 0.20.5 ± 0.4
Natural fermentation2088 ± 120.3 ± 0.40.6 ± 0.5
This workPacked-bed (50%)
Structured-bed (85%)
Synthetic wastewater based on sucroseControlled biomass discharges2489 ± 6
68 ± 4
1.6 ± 0.3
0.9 ± 0.3
2.2 ± 0.4
1.0 ± 0.3
YES
OLR: organic loading rate; * maximum values reported as potential; PF: polyurethane foam; RLDP: recycled low-density polyethylene.
Table 5. Average concentration of the soluble fermentation products (SFP) equivalent in COD (COD eq.) during steady-state operation in the packed-bed and structured-bed reactors and during the peak of hydrogen production in the structured-bed reactor.
SFPSteady StatePeak
Packed-Bed Reactor
(mg COD L−1)
COD Eq. (%) Structured-Bed Reactor
(mg COD L−1)
COD Eq.
(%)
Structured-Bed Reactor
(mg COD L−1)
COD Eq. (%)
Primarily SFP
Acetic acid 455 ± 87 24%289 ± 9216%214 ± 2712%
Butyric acid 212 ± 3212%166 ± 319%293 ± 3216%
Ethanol 344 ± 7618%364 ± 12720%256 ± 5414%
Secondary SFP
Propionic acid 61 ± 153%50 ± 193%18 ± 31%
Caproic acid 24 ± 71%12 ± 31%--
Disclaimer/Publisher’s Note: The statements, opinions and data contained in all publications are solely those of the individual author(s) and contributor(s) and not of MDPI and/or the editor(s). MDPI and/or the editor(s) disclaim responsibility for any injury to people or property resulting from any ideas, methods, instructions or products referred to in the content.

