Article

Investigation of Crypthecodinium cohnii High-Cell-Density Fed-Batch Cultivations

1
Laboratory of Bioprocess Engineering, Latvian State Institute of Wood Chemistry, LV-1006 Riga, Latvia
2
Bioreactors.net AS, LV-1006 Riga, Latvia
3
Institute of Microbiology and Biotechnology, University of Latvia, LV-1004 Riga, Latvia
*
Author to whom correspondence should be addressed.
Fermentation 2024, 10(4), 203; https://doi.org/10.3390/fermentation10040203
Submission received: 29 February 2024 / Revised: 26 March 2024 / Accepted: 7 April 2024 / Published: 10 April 2024
(This article belongs to the Special Issue Fermentation: 10th Anniversary)

Abstract

:
Crypthecodinium cohnii is a marine microalga that can accumulate high amounts of polyunsaturated fatty acids (PUFAs) and thus replace conventional routes of fish oil production. They are associated with the destruction of marine resources and multiple downstream/purification complications. The major drawbacks of using C. cohnii for industrial-scale production are associated with low PUFA productivity. One of the means of increasing the PUFA synthesis rate is to maintain the medium component concentrations at optimal values throughout cultivation, thus increasing PUFA production efficiency, which can result in the successful transfer of the process to pilot and/or industrial scale. The goal of the present research was to develop techniques for increasing the efficiency of PUFA production via C. cohnii cultivation. Multiple experiments were carried out to test and fine-tune the cultivation medium composition and oxygen transfer factors. The biomass yields from individual components, yeast extract, sea salts, and glucose amounted to 5.5, 0.65, and 0.61 g·g−1, respectively. C. cohnii cell susceptibility to mechanical damage was experimentally evaluated. Power inputs of <276.5 W/m3 did not seem to promote cell destruction when Pitched-blade impellers were used. The obtained cultivation conditions were shown to be efficient in terms of increasing the biomass productivity and the omega-3 fatty acid content in C. cohnii. By using the applied methods, the maximal biomass productivity reached 8.0 g·L−1·day−1, while the highest obtained biomass concentration reached 110 g·L−1. A steady increase in the concentration of PUFAs during cultivation was observed from the FTIR data.

1. Introduction

Microalgae are organisms with high lipid production potential as they can accumulate significant amounts of lipids in a way similar to those found in other oil-bearing plants [1]. Compared to terrestrial plants, microalgae have greater potential for DHA production. The average lipid content in microalgae biomass ranges from 20 to 50% by mass; however, under stress conditions, it can reach even higher levels (up to 85%) [2].
Docosahexaenoic acid (DHA) is a polyunsaturated fatty acid (PUFA) belonging to the omega-3 fatty acid (FA) group. In recent years, DHA has attracted much attention due to its broad beneficial effects on human health. As an important component of cellular membranes of human nervous, visual, and reproductive tissues, DHA is considered essential for the neurological development of infants. In addition, DHA plays significant roles in alleviating cardiovascular diseases, hypertension, diabetes, and neuropsychiatric disorders. It acts as an anti-inflammatory agent, a precursor of several metabolites, and a potent lipid mediator, and thus could be used to treat several neurologic disorders such as Alzheimer’s disease. Even though the conversion of alpha-linolenic acid into omega-3 fatty acids occurs in humans, it happens at a very slow rate, thus these FAs must be provided in the diet. The traditional source of DHA is fish oil, as ocean fish can accumulate omega-3 PUFAs by consuming DHA-rich algae as food [3].
The traditional fish oil industries are based on fish stocks such as sardines, salmon, tuna, and herring [4]. Fish of the Salmonidae, Scombridae, and Clupeidae families have been the sole commercial sources of DHA as their oils contain approximately 20–30% DHA. Nevertheless, DHA purification and concentration from fish oil is costly, and the resulting oil quality is strongly dependent on species, location, and other ecological factors. Furthermore, fish-derived DHA is unsuitable for vegetarians and vegans, who avoid including animal-derived products in their diets [5]. Furthermore, fish oil is argued to pose negative effects on infants, as the mixture alongside DHA contains eicosapentaenoic acid (EPA), which is considered to promote neonatal growth retardation [6].
Oils from genetically engineered plant oilseeds such as Brassica juncea, Arabidopsis thaliana, and Camelina sativa can, to some extent, satisfy the global demand for DHA; however, omega-3 PUFA content in vegetable oils is very low and there is no valid method, as of now, to concentrate them for commercial purposes [5]. (Patel et al. 2020).
DHA production from microalgal sources shows benefits over DHA obtained from fish or plant oilseeds since the pure microalgal oil is odorless, non-dependent on fish stocks, does not contain ocean-borne contaminants, displays high quantities of DHA, and is friendly towards most dietary requirements [7].
Additionally, microalgae are rich in proteins, polysaccharides, cytochromes (such as chlorophyll, astaxanthin, and lutein), and other important bioactive substances, which can be widely used in animal feed. Feeding animals with algae biomass significantly improves the saturated fatty acid content of meat, eggs, and milk. In previous studies, it was reported that the addition of 2% microalgae in the diet increased the survival rate and rate of weight gain of chicks by 16.8% and 33.4%, respectively, and the addition of 0.8% and 4.3% microalgae increased the DHA content of each egg by 134 and 220 mg, respectively [8]. Additionally, egg production in hens was improved by 6% by introducing 0.5–7.5% of microalgae in their diets [9]. Cholesterol levels in the hen’s blood and eggs were also reduced [9].
Crypthecodinium cohnii (a relevant member of the marine phytoplankton group) is an obligatory heterotrophic dinoflagellate microalga that can be found in temperate and tropical waters. This microorganism is a unicellular protist and a eukaryote with some retained prokaryotic features. The characteristic feature of C. cohnii is that its motility is provided by flagella; however, when entering the vegetative state, the motile cells shed their flagella, becoming cysts that can produce 2, 4, or 8 daughter cells each. A notable aspect of C. cohnii is that it has the ability to accumulate high amounts of DHA, with insignificant mixtures of other PUFAs [6]. Under certain cultivation conditions, C. cohnii cells accumulate less than 1% of other FAs, which is a clear advantage for DHA purification. Furthermore, the presence of more than 50–60% of fatty acids with 16 and 18 carbon atoms (C16–C18) in C. cohnii’s total fatty acid content makes this microalga a potential source of biodiesel production [7].
The growth of C. cohnii and the rate of DHA production is highly dependent on the composition of the cultivation medium. In the late 1990s and early 2000s, several carbon sources were tested to grow C. cohnii, including glucose, acetic acid, ethanol, and pure glycerol [7]. Previous studies by de Swaaf et al. have shown that the optimal concentration of glucose for stimulating the synthesis of DHA should be in the range of 15–25 g·L−1—at higher concentrations, biomass growth slows down. Lower concentrations of glucose do not greatly affect the rate of biomass growth but reduce the rate of fatty acid production [10]. Other authors report that higher CO2 concentrations can simulate the production of DHA [11]. The concentration of other components, such as nitrogen, phosphorous, silicone, and mineral salts [10,12,13] also seem to affect the course of DHA synthesis. Thus, maintaining the medium component concentrations at optimal values throughout cultivation can increase DHA production efficiency and result in the successful transfer of the process to pilot and/or industrial-scale applications. Maintaining glucose concentrations within a certain range is possible only in cultivations operated in fed-batch or continuous regimes. Considering the above, the development of valid techniques for fed-batch cultivation of C. cohnii, with a special emphasis on DHA synthesis, was the main goal of the present research.
Additionally, assessments of cell susceptibility to mechanical damage were performed from both practical and theoretical standpoints. The maximal specific power input (minimal Kolmogorov’s microscale length) was deduced in order to evaluate the highest obtainable oxygen mass transfer rates during cultivation while avoiding possible C. cohnii cell damage, which can potentially result in decreased DHA production yield. Based on the obtained maximal specific power input values, the appropriate agitation rate range for a particular bioreactor configuration was determined. The generated information can provide significant aid in further DHA production scale-up studies.

2. Materials and Methods

2.1. Inoculum Preparation

Crypthecodinium cohnii CCMP 316 was obtained from the Provasoli-Guillard National Center for Marine Algae and Microbiota (NCMA) (East Boothbay, ME, USA). Inoculum cultures were grown as previously described by Didrihsone et al. [14] in 250 mL bottles with a working volume of 150 mL, a medium containing 5 g glucose L−1 (Sigma-Aldrich Co., Ltd., St. Louis, MO, USA, Prod. # 49159), 2 g yeast extract L−1 (Sigma-Aldrich Co., Ltd., St. Louis, MO, USA, Prod. # 92144), and 25 g sea salts L−1 (Sigma-Aldrich Co., Ltd., St. Louis, MO, USA, Prod. # S9883), with aeration at 30 mL·min−1, rotation speed of 130 rpm (orbital shaker PSU-20i, Biosan, Riga, Latvia) at 25 °C under heterotrophic conditions. Each flask was inoculated with 1 mL of C. cohnii culture (DCW = 5 g L−1).

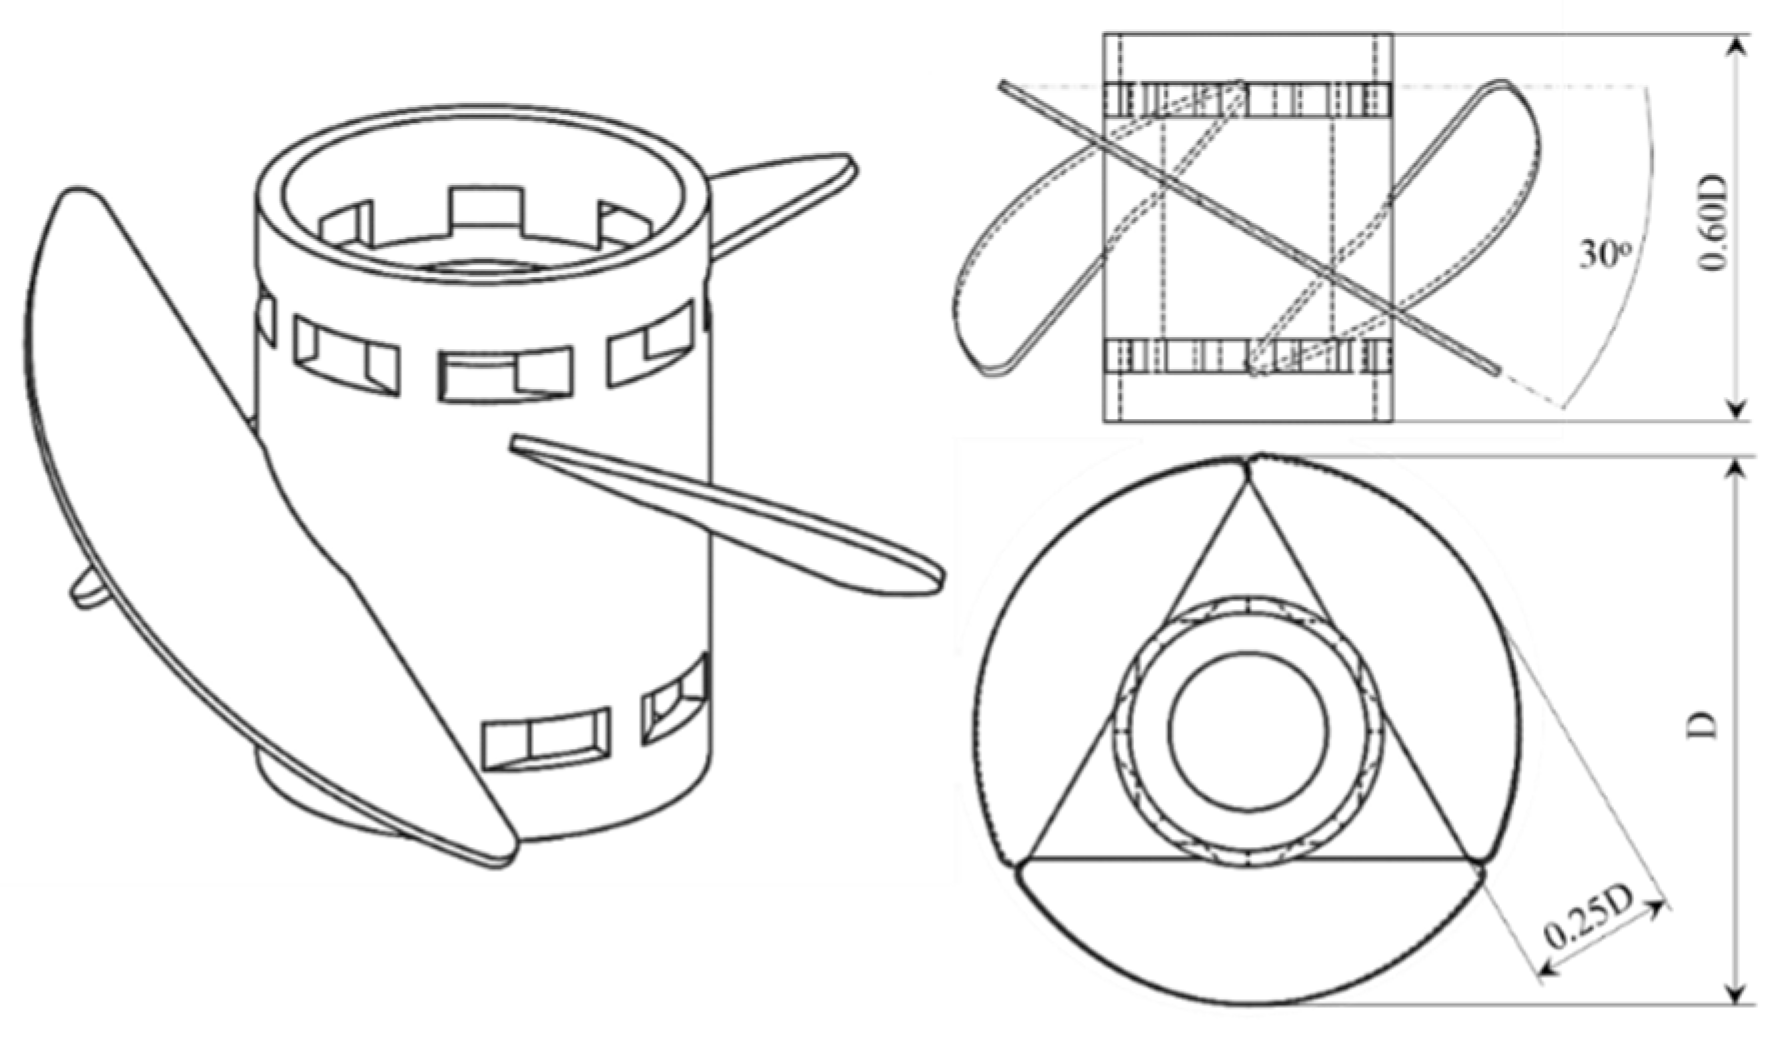
2.2. Bioreactor Cultivations

Laboratory-scale cultivations were performed in a 4.0 L working volume glass bioreactor EDF-5.4_1 (Bioreactors.net AS, Riga, Latvia). The batch medium consisted of 5–15 g glucose L−1, 2 g yeast extract L−1, 25 g sea salts L−1, and antibiotics: 0.05 g ampicillin L−1 and 0.01 g kanamycin sulfate L−1. The fed-batch feeding solution consisted of 200 g glucose L−1, 25 g yeast extract L−1, and 25 g sea salts L−1. During bioreactor cultivations, active control was performed to maintain the temperature at 30 °C, pH at 6.5 ± 0.2, DO at 5 ± 5%-sat. and foam levels. The pH was maintained by automatic dosing of acidic (20% m·m−1 H2SO4) or alkali (10% m·m−1 NaOH) solutions to the cultivation medium via two pre-calibrated peristaltic pumps. The foam level was controlled automatically by adding antifoam A (Sigma) via the pre-calibrated peristaltic pump. The dissolved oxygen (DO) control was performed according to a DO cascade algorithm (primarily increasing the agitation rate from 100 rpm, and secondly by enriching the inlet gas with oxygen). During the cultivation, a constant gas flow rate of 0.3 slpm was maintained. The cultivations were started in the batch mode with an initial volume of 3.6 L after inoculation of 400 mL of inoculum (inoculation biomass concentration DCW = 10 g L−1) and proceeded as fed-batch when the substrate concentration fell to a pre-defined level.
Online measurements of CO2 and O2 concentrations in the off-gas were performed using a BlueInOneFerm gas analyzer (BlueSens gas sensor GmbH, Herten, Germany).
Process data acquisition was performed using SCADA (supervisory control and data acquisition) software (Bioreactors.net AS, Riga, Latvia) linked to a BIO4 bioprocess controller. At-line sample data, e.g., optical density (biomass concentration) and glucose concentration were manually entered into SCADA at pre-defined time points.

2.3. Optical Density, Viable Cell Density, Glucose Concentration, and Conductivity Measurements

An Incyte permittivity probe (Hamilton Bonaduz AG, Bonaduz, Switzerland) was used for online monitoring of viable cell density (VCD) and conductivity of the solution during cultivations. The VCD probe was connected to an Arc View controller 265 (Hamilton Bonaduz AG, Bonaduz, Switzerland) for recording and plotting both conductivity and permittivity measurements. The permittivity measured online was correlated with the viable cell density based on a linear regression. The slope between the permittivity signal and biomass dry cell weight (DCW) was determined as the “cell factor”, which was used to correct the controller. The VCD sensor signal probing time was set to 60 s. Permittivity was measured at 1000 kHz. Prior to introducing the pre-prepared inoculum into the growth medium, the VCD sensor signal was calibrated after 60 min of stabilization.
An ASD19-EB-01 light absorption sensor (Optek-Dahulat Gmbh, Essen, Germany) was used for online turbidity measurements. The measurements were carried out in the 840–910 nm wavelength range, while the optical path length was equal to 10 mm. The sensor signal probing time was set to 60 s.
The glucose concentration was measured enzymatically using an AccuChek ACTIVE blood sugar analyzer (Roche AG, Rotkreuz, Switzerland).

2.4. Mechanical Cell Susceptibility Assessment

The specific power input (and agitation rate) range within which cell membrane disruption cannot occur was determined theoretically. According to previous studies, it is argued that the eddy scale in turbulent flow has to be larger than the cell size (≈30 µm for C. cohnii), in other cases, agitation-induced damage can occur [15]. The above-mentioned turbulence (eddy) scale was calculated using the Kolmogorov microturbulence Equation (1):
L = ( μ 3 · ρ L 3 · ε 1 ) 0.25
where ε—dissipation rate of kinetic energy;
L—turbulence scale, m;
Μ —dynamic viscosity of fluid;
ρL—density of liquid, kg·m3.
The dissipation rate (ε) was calculated using Equation (2), but it should be noted that only the average kinetic energy dissipation rate can be determined using the mentioned equation. In the rotor area, the energy dissipation rate could be higher. For further calculations, it was assumed that no kinetic energy dissipation rate gradients formed within the liquid volume, and it was equal to:
ε = P · ( V L · ρ L ) 1
where VL—volume of liquid, m3;
P—power input during mixing, W.
Based on the Power number equation, the maximal agitation rate, which does not induce mechanical damage to microorganism cells, for a specific mixer rotor geometry was calculated as:
P MAX = P o · ρ L · r 3 · d 5
where P o —Power Number;
PMAX—maximal power, W;
R —agitation rate, rps;
d —diameter of the external rotor, m.
The impeller power number (0.55), which was used for the observed calculation, was estimated using the methods described in previously performed studies [16]. The impeller diameter was equal to 80 mm. The impeller design can be seen in Figure 1.
Additionally, agitation susceptibility tests were conducted in the EDF-5.4_1 laboratory bioreactor. The bioreactor was filled with 3.6 L of cultivation medium and 400 mL of fresh C. cohnii inoculum, reaching a total volume of 4 L. The cultivation medium was mixed at different agitation rates for 20 min. During the tests, the VCD was measured using the Incyte permittivity sensor to register the changes in viable cell numbers.

2.5. Determination of Biomass Dry Cell Weight

The biomass dry cell weight (DCW) in relation to the absorbance at a wavelength of 470 nm was determined gravimetrically as the difference between biomass and supernatant dry mass as described by Dubencovs et al. 2021 [17]. In the present study, the correlation coefficient value was determined as 1.415 g (DCW)·L−1·A.U.−1.

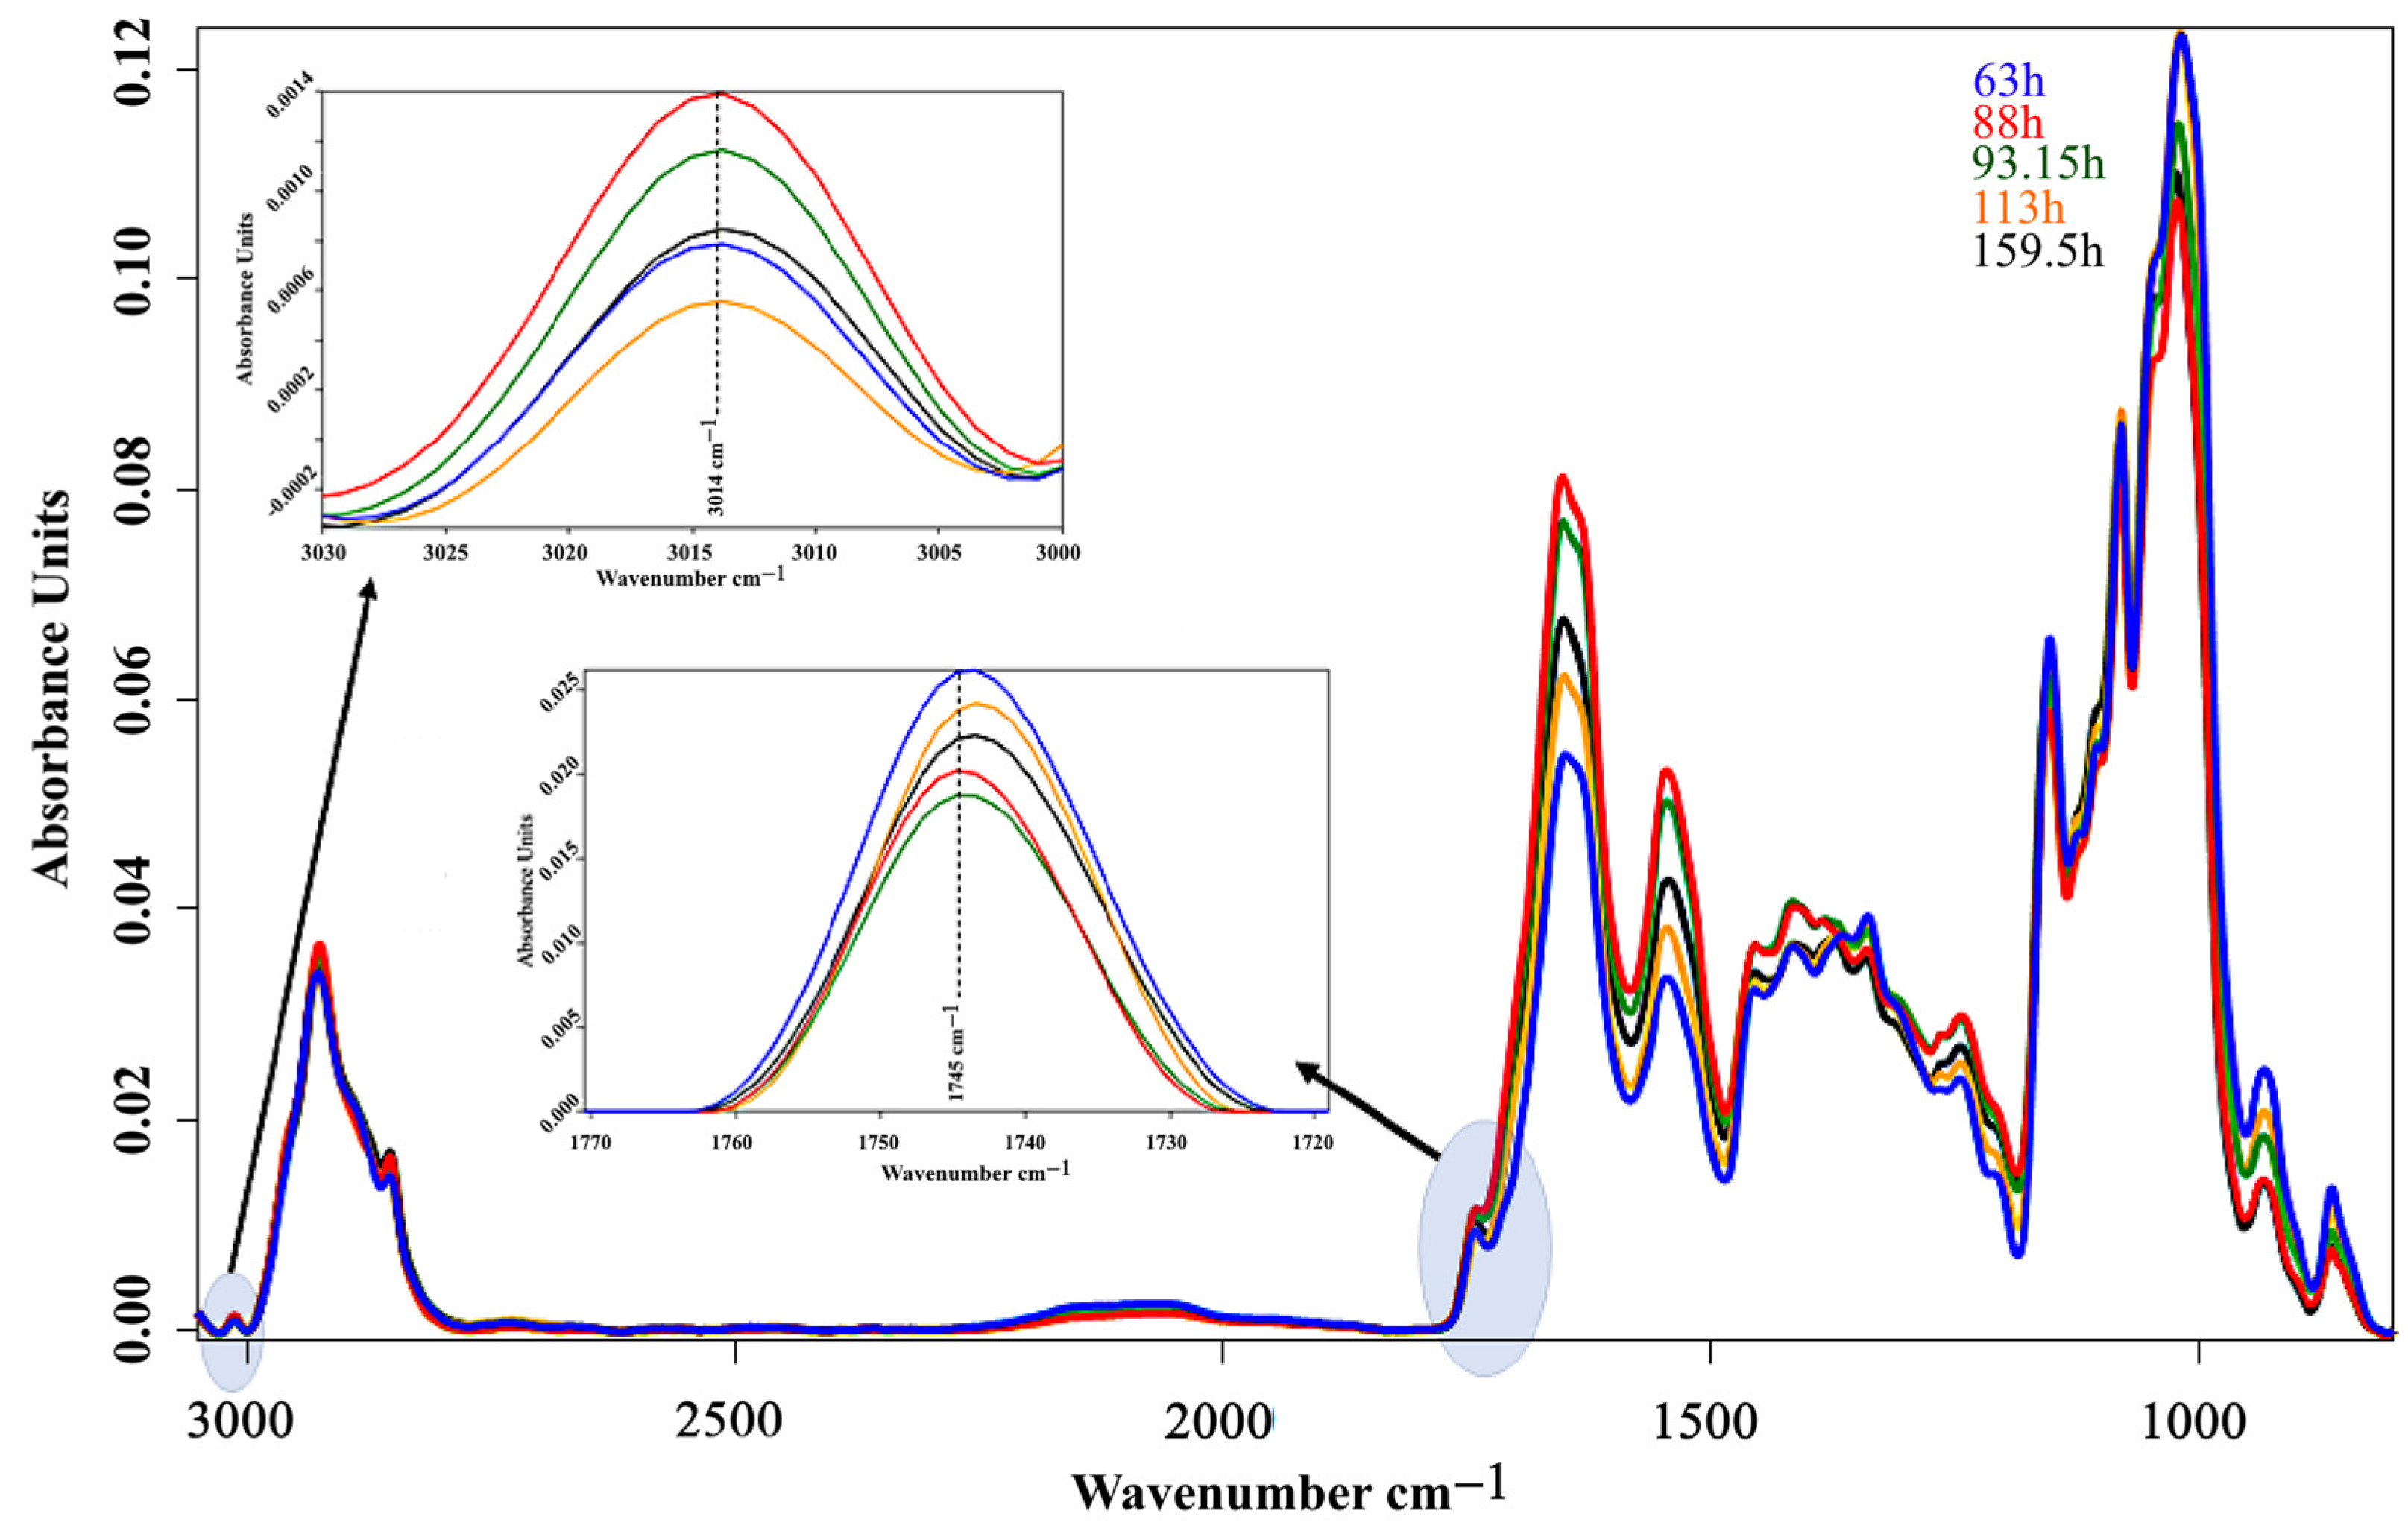
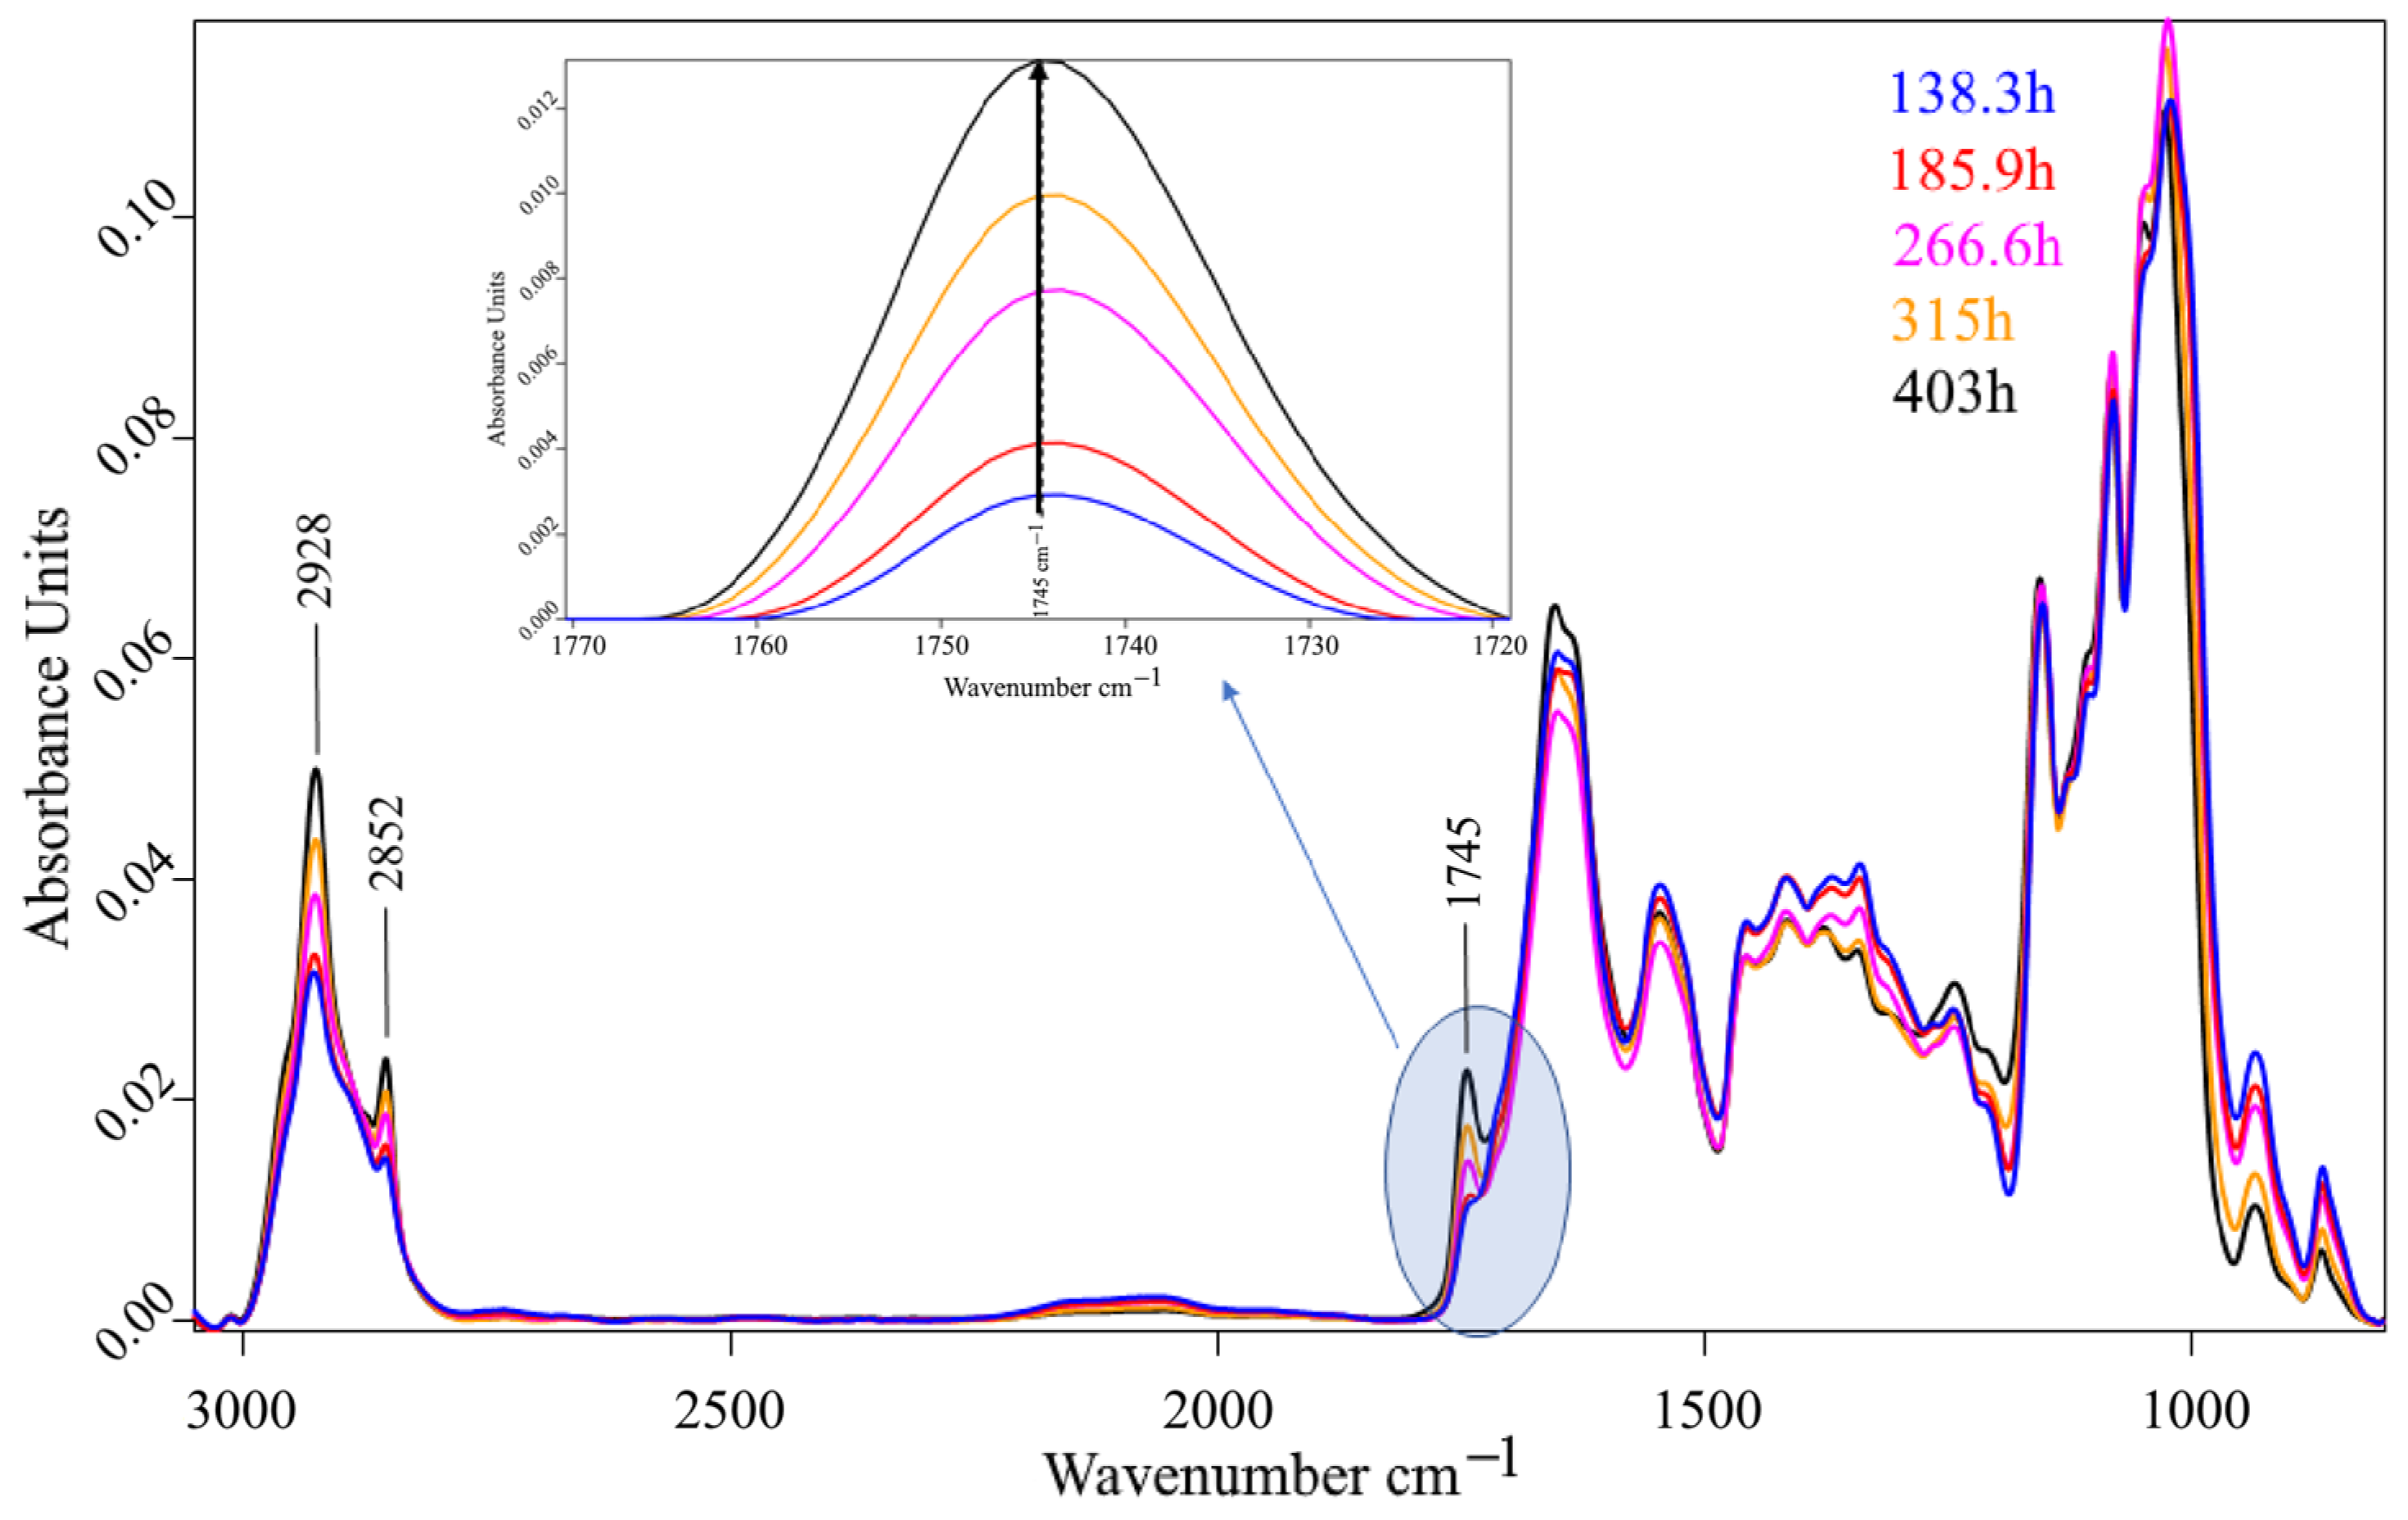
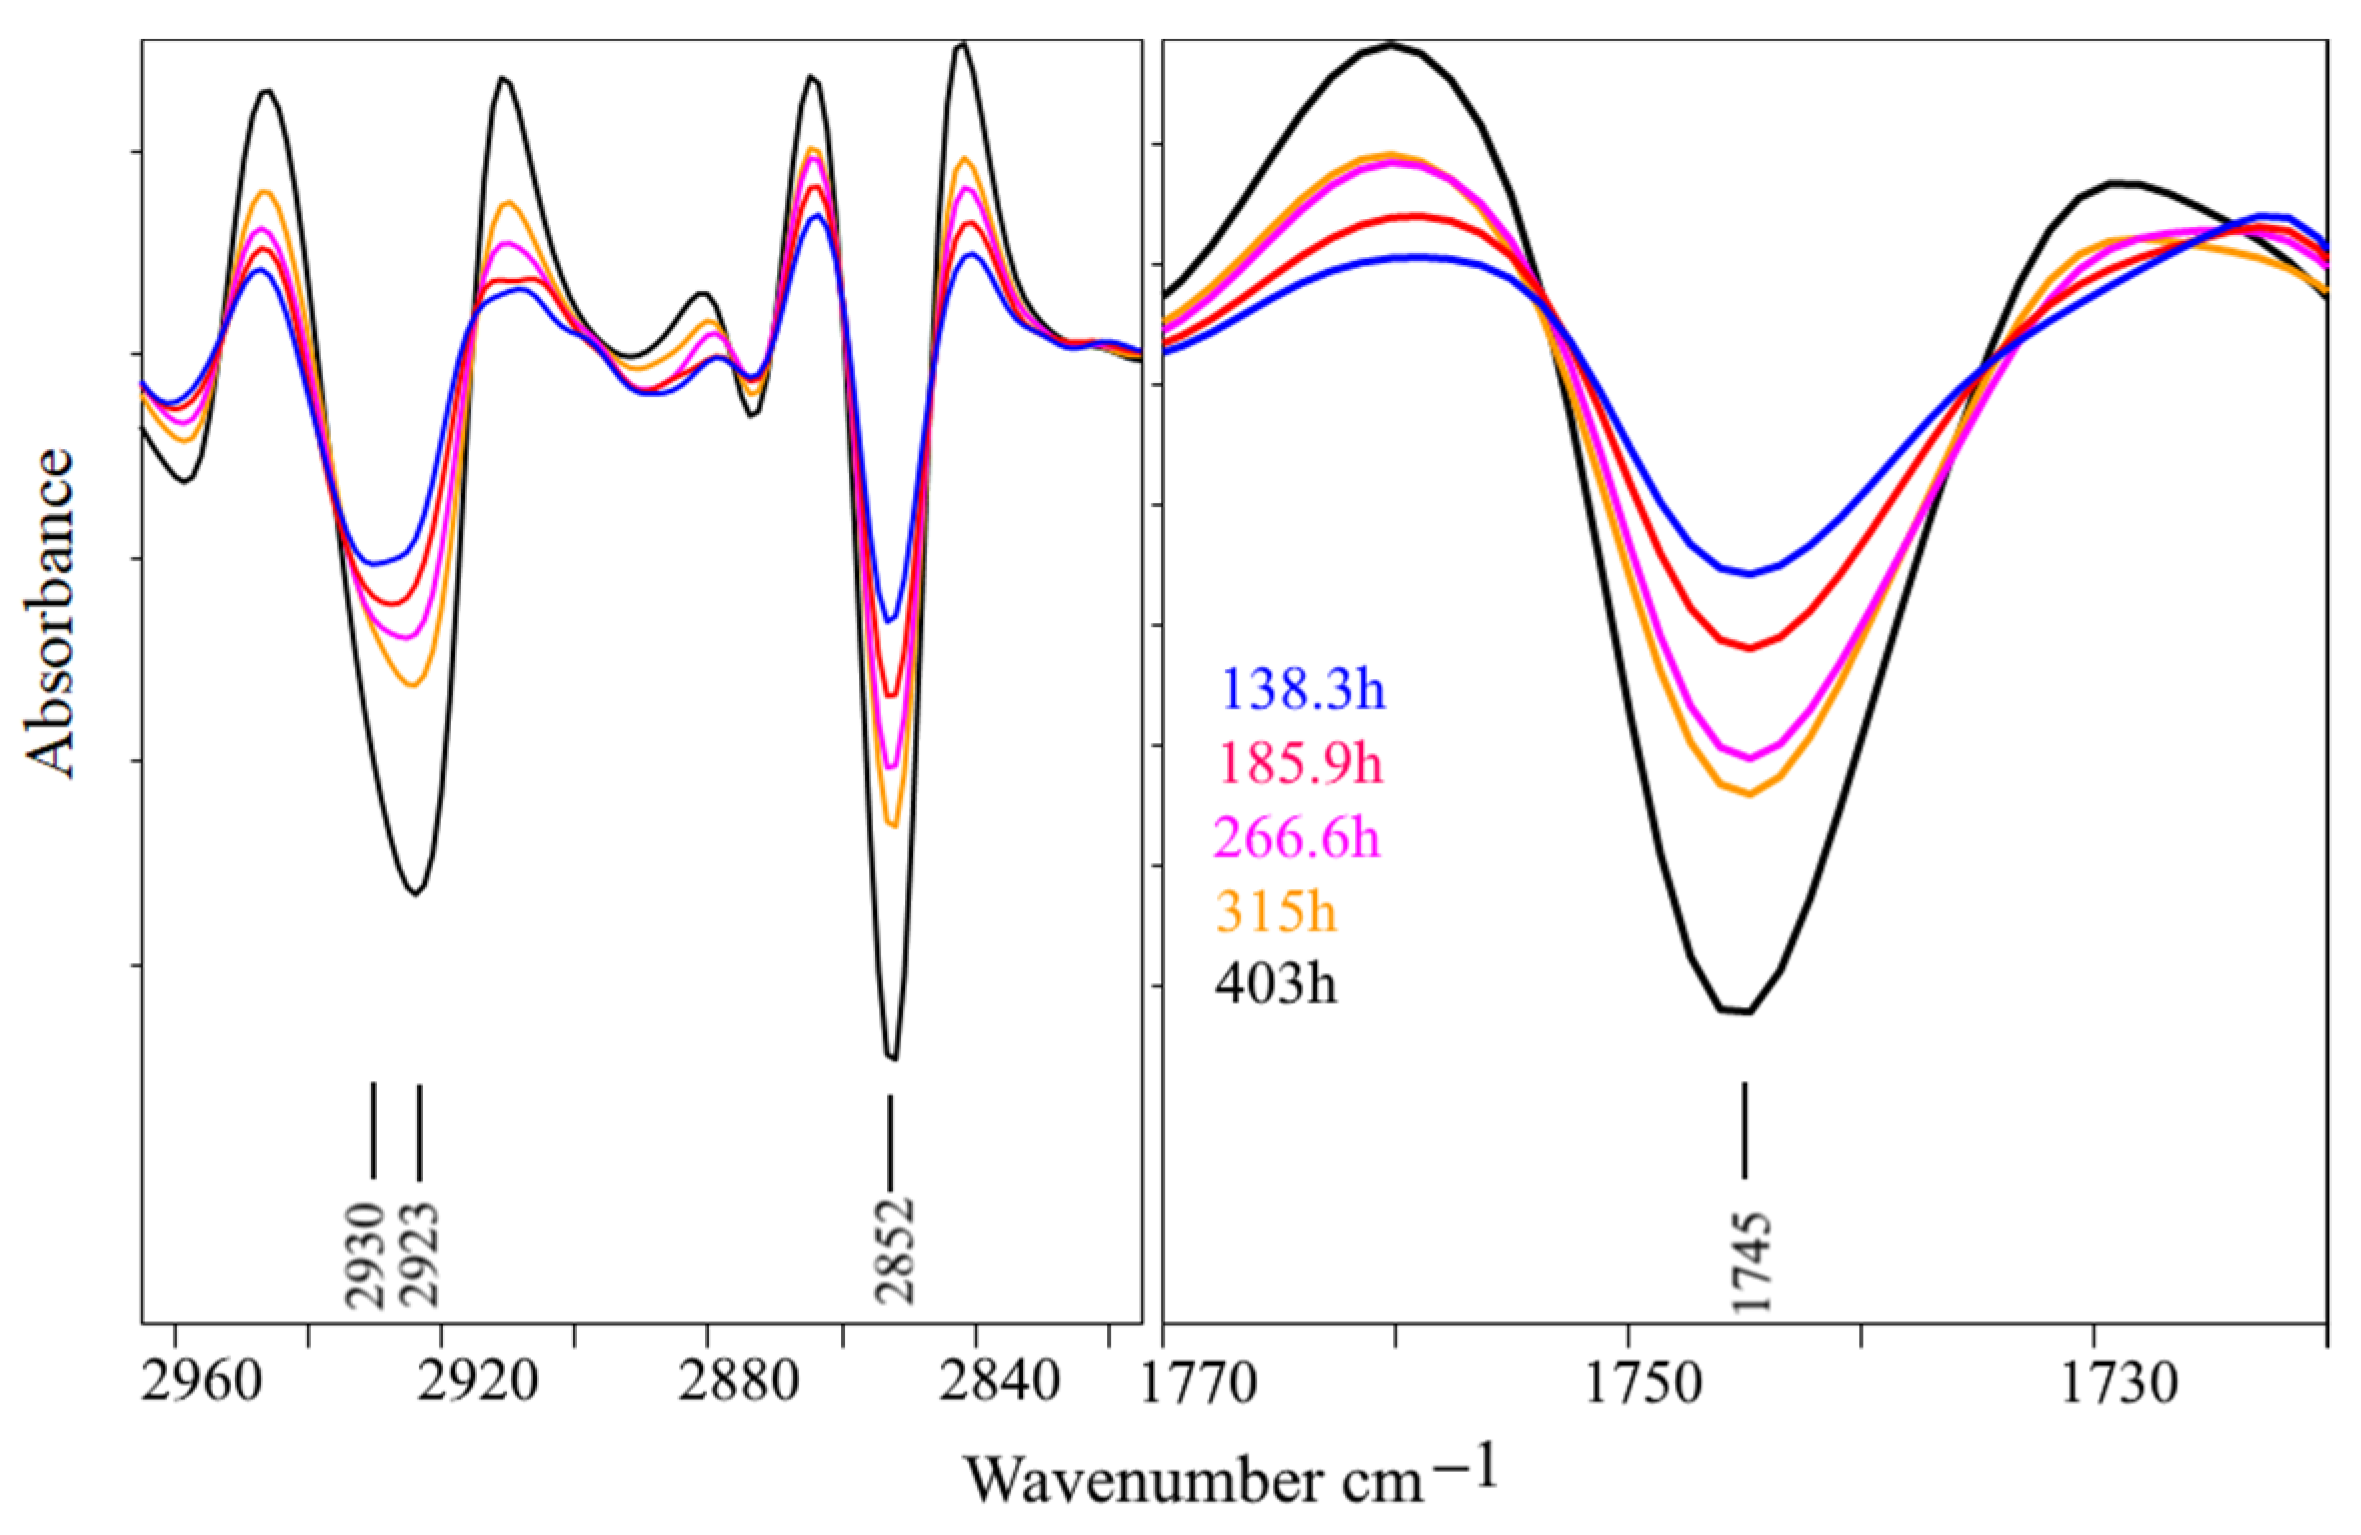
2.6. Fourier Transform Infrared Spectrometry

Fourier transform infrared (FTIR) spectra of the biomass were recorded using the Vertex 70 coupled with the microplate reader HTS-XT (Bruker Optik GmbH, Ettlingen, Germany). Sample aliquots were pipetted on a 384-well microplate, dried, and recorded in the wavenumber range of 4000–600 cm−1 with a spectral resolution of 4 cm−1; 64 scans were co-added. Omega FAs were identified based on absorption bands at ~1743 cm−1 and ~3012 cm−1 [14,18,19]. Only spectra with absorbance within absorption limits between 0.25 and 0.80 (where the concentration of a component is proportional to the intensity of the absorption band) were used for data analysis. The FTIR spectra were vector-normalized and deconvoluted (2nd derivative) for a more precise evaluation of spectral bands and to resolve the overlapping components, if any. The baseline of each spectrum was corrected using the rubber band method. The data were processed using the OPUS 7.5 software (Bruker, Germany).

3. Results and Discussion

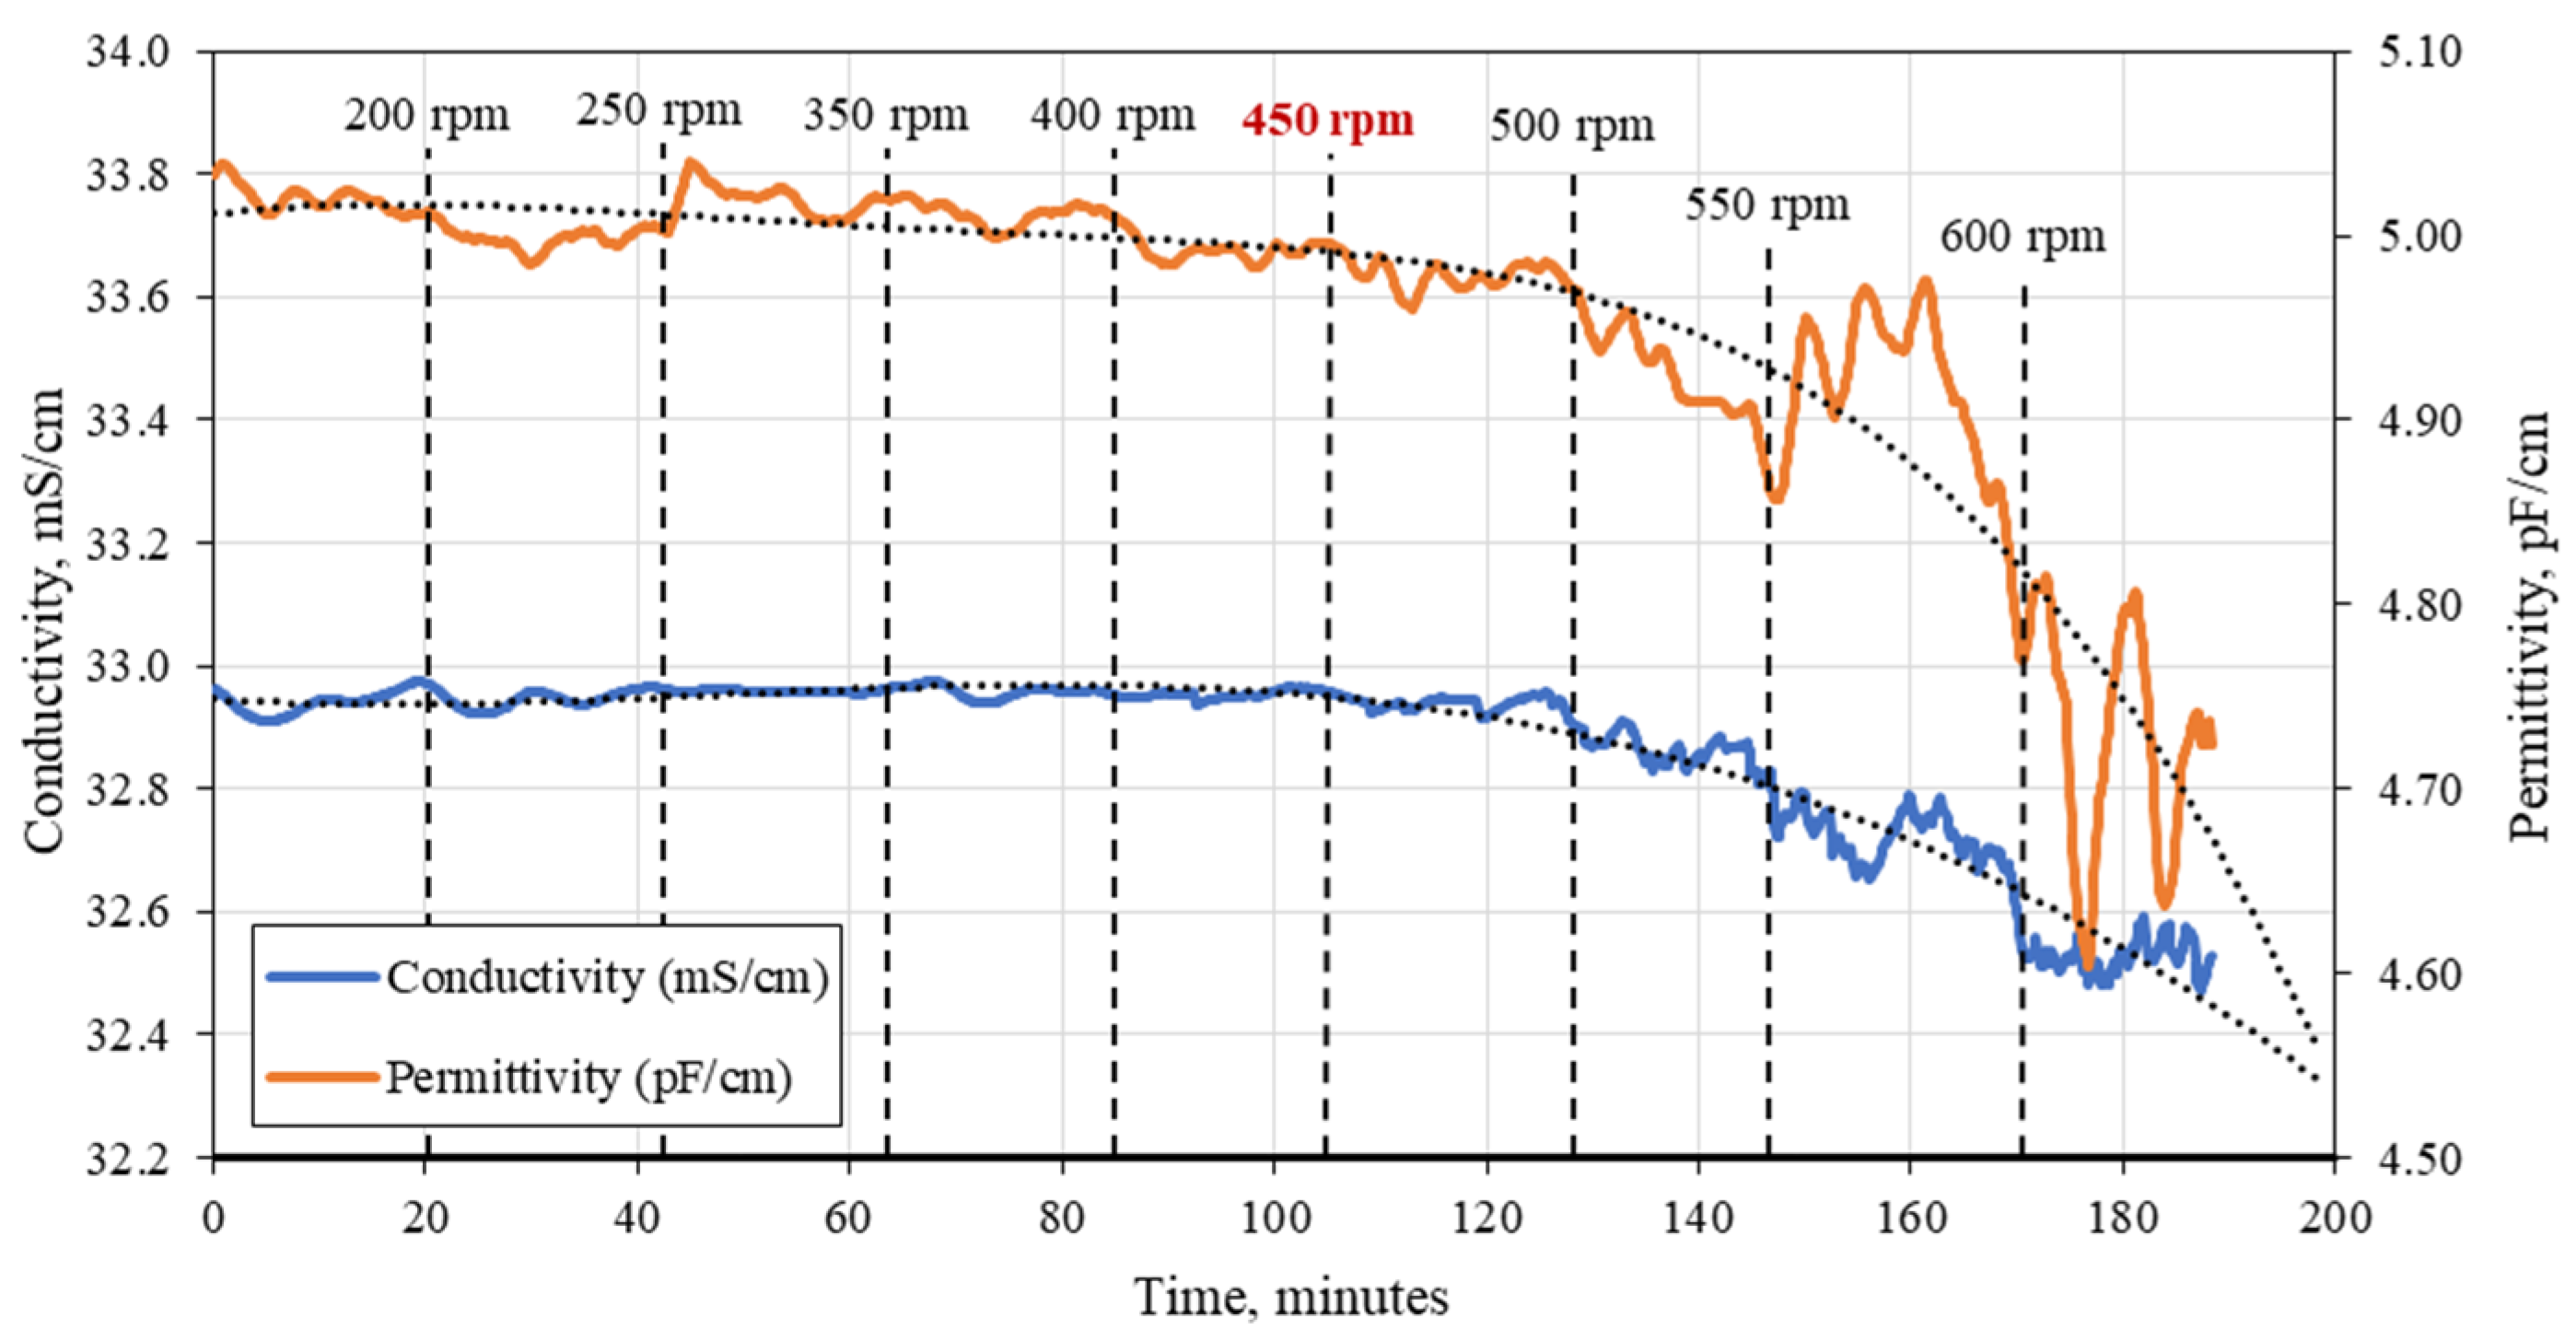
3.1. C. cohnii Susceptibility to Mechanical Damage

Interactions between microorganisms and eddies in turbulent flow can cause mechanical damage to cell membranes. The intensity of the forces involved in these interactions depends on the scale of the eddies and the size of the cells. If the cell size is relatively small compared to the eddy scale (generally assumed to be at least equal to the cell size), the cell is captured in the vortex and mechanical damage to the cell membrane is theoretically impossible. The above-mentioned phenomenon is present due to the fact that the movement of the liquid inside the eddy is laminar. Accordingly, the difference in velocity between the fluid flow and the microorganism is small, except for short periods of acceleration as the cell moves from one vortex to another. Therefore, on average, if the particles are smaller than the vortexes, the effects of vortex–cell interactions are minimal.
Primarily, the maximal possible kinetic energy dissipation rate was calculated using Equation (1):
ε = μ 3 ( L 4 · ρ L 3 ) = 0.00106 3 ( ( 3.0 · 10 5 ) 4 · 1050 3 ) = 1.27   W / kg
Next, the power input, which correlates with the obtained kinetic energy dissipation rate, was determined:
P = ε · V L · ρ L = 1.27 · 0.004 · 1050 = 5.33   W
Then, from the Power number Equation (3), the maximal possible agitation rate (which correlates to the previously calculated power input) was obtained:
n = ( P n · P o · ρ L · d 5 ) 1 3 = ( 5.33 2 · 0.55 · 1000 · 0.08 5 ) 1 3 = 11.21   RPS = 672   rpm
Additionally, the maximal agitation rate (and maximal power input) for C. cohnii was determined experimentally by measuring the changes in viable cell density over time at different agitation rates (see Figure 2).
As can be observed from Figure 2, the maximal agitation rate, which does not lead to pronounced cell destruction, is in the range of 400–450 rpm. The mentioned agitation rate corresponds to roughly 276.5 W/m3 of specific ungassed power input.
The minimal agitation rate at which cell sedimentation is avoided was empirically determined to be equal to 50 rpm.
By comparing the theoretical and experimental maximal agitation rates at 672 rpm and 450 rpm, respectively, it was observed that the calculated value significantly overestimates the maximal value. The latter can be explained by the fact that agitation energy dissipation within the medium is not uniform, e.g., high energy dissipation occurs in the vicinity of the impeller, while near the bioreactor wall, the mentioned value is significantly smaller.
By determining the appropriate agitation rate range within which cell mechanical damage is not induced, we were able to minimize the negative effect of external variables (apart from the cultivation medium composition). Thus, the subsequent fed-batch process optimization procedure was significantly simplified.

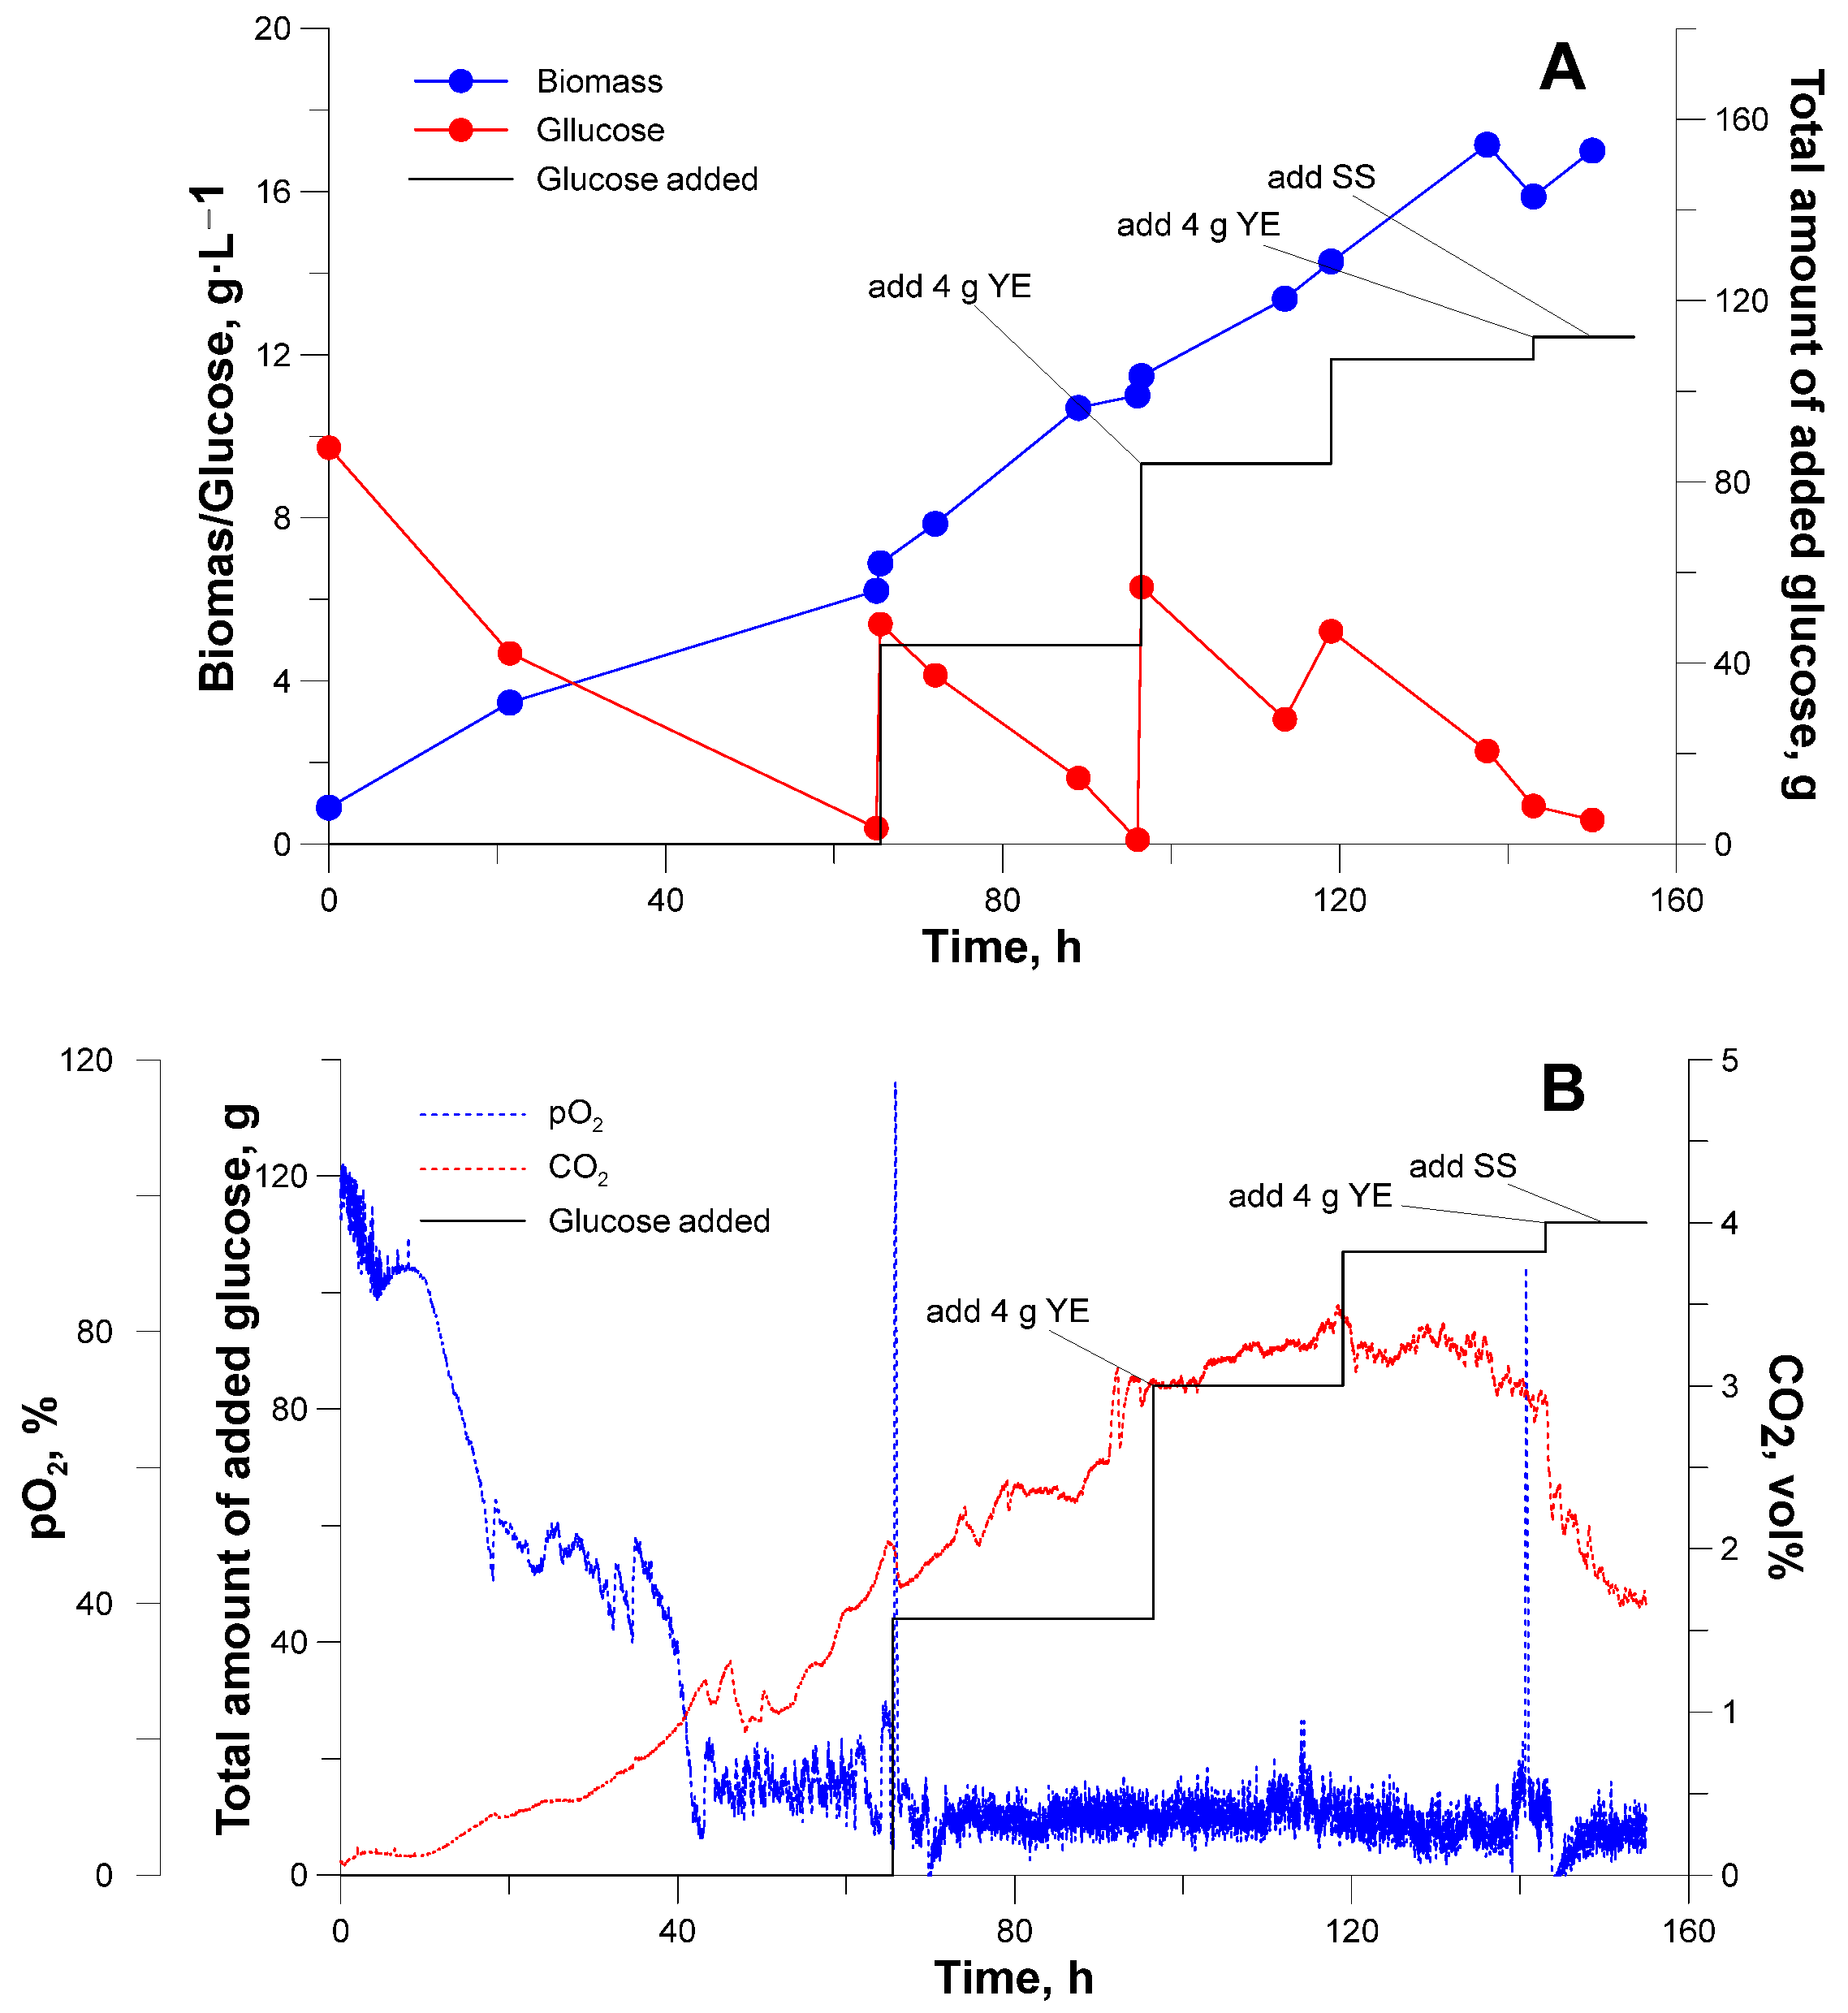
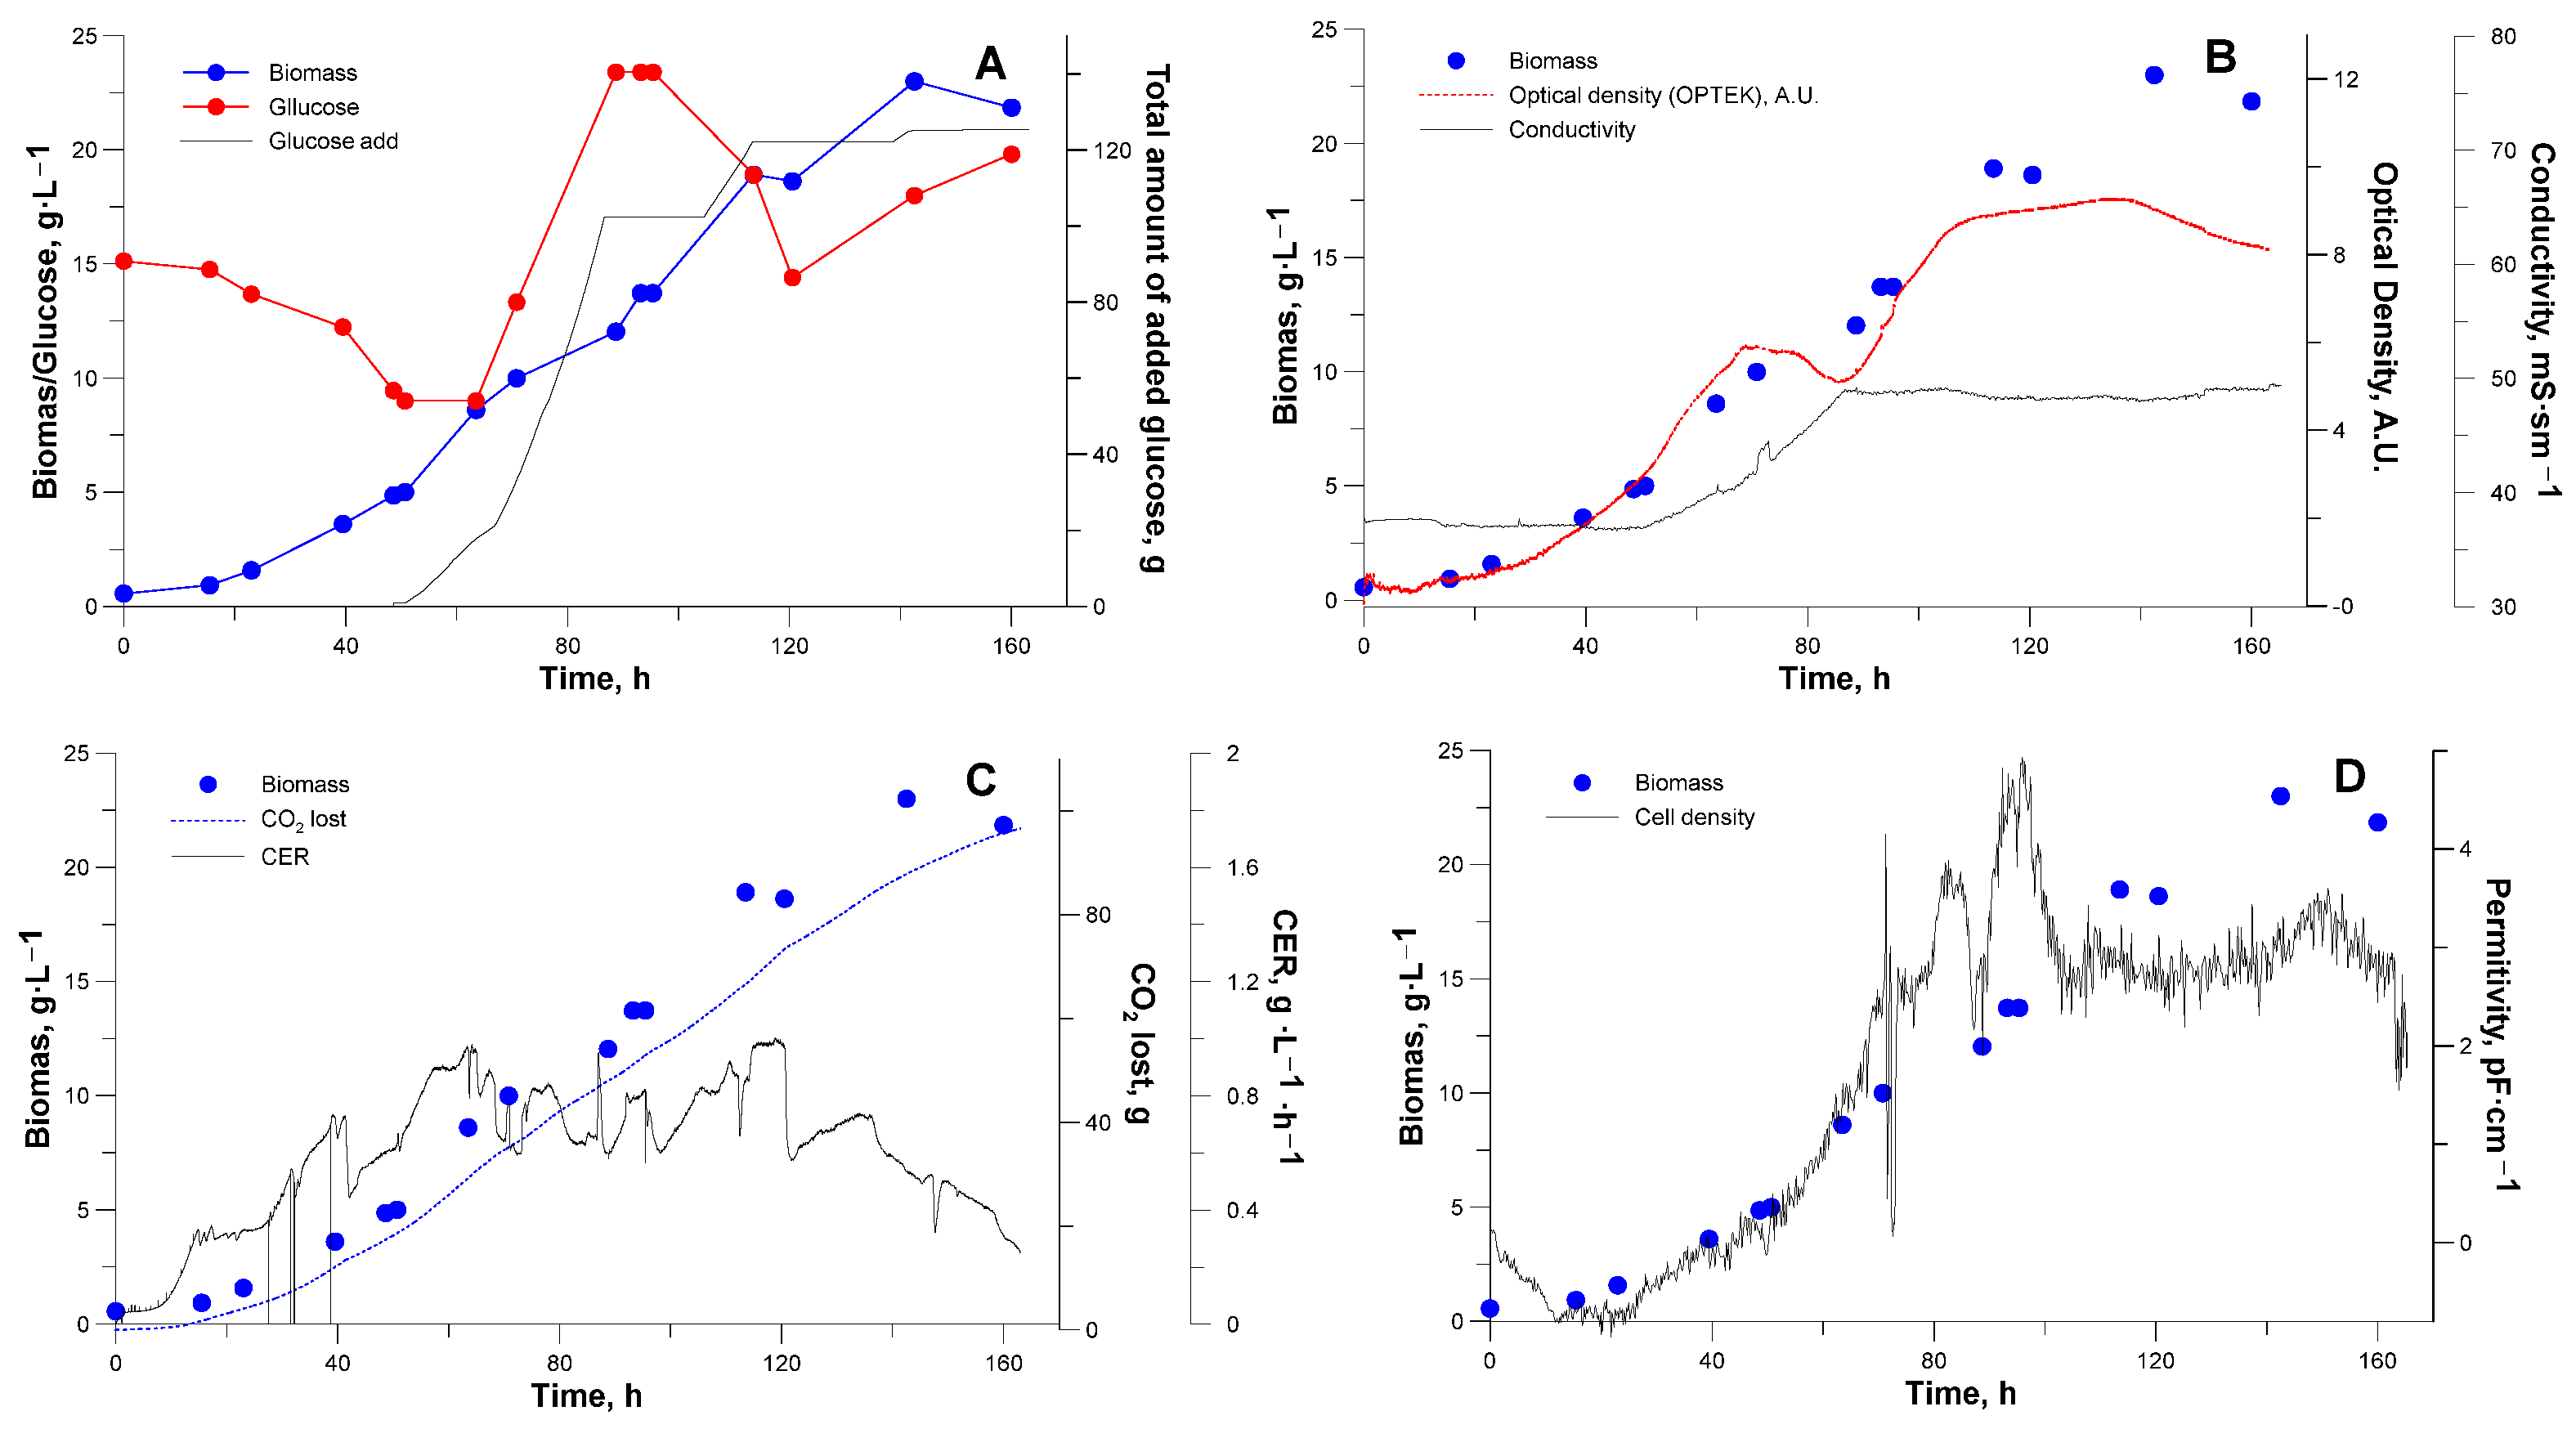
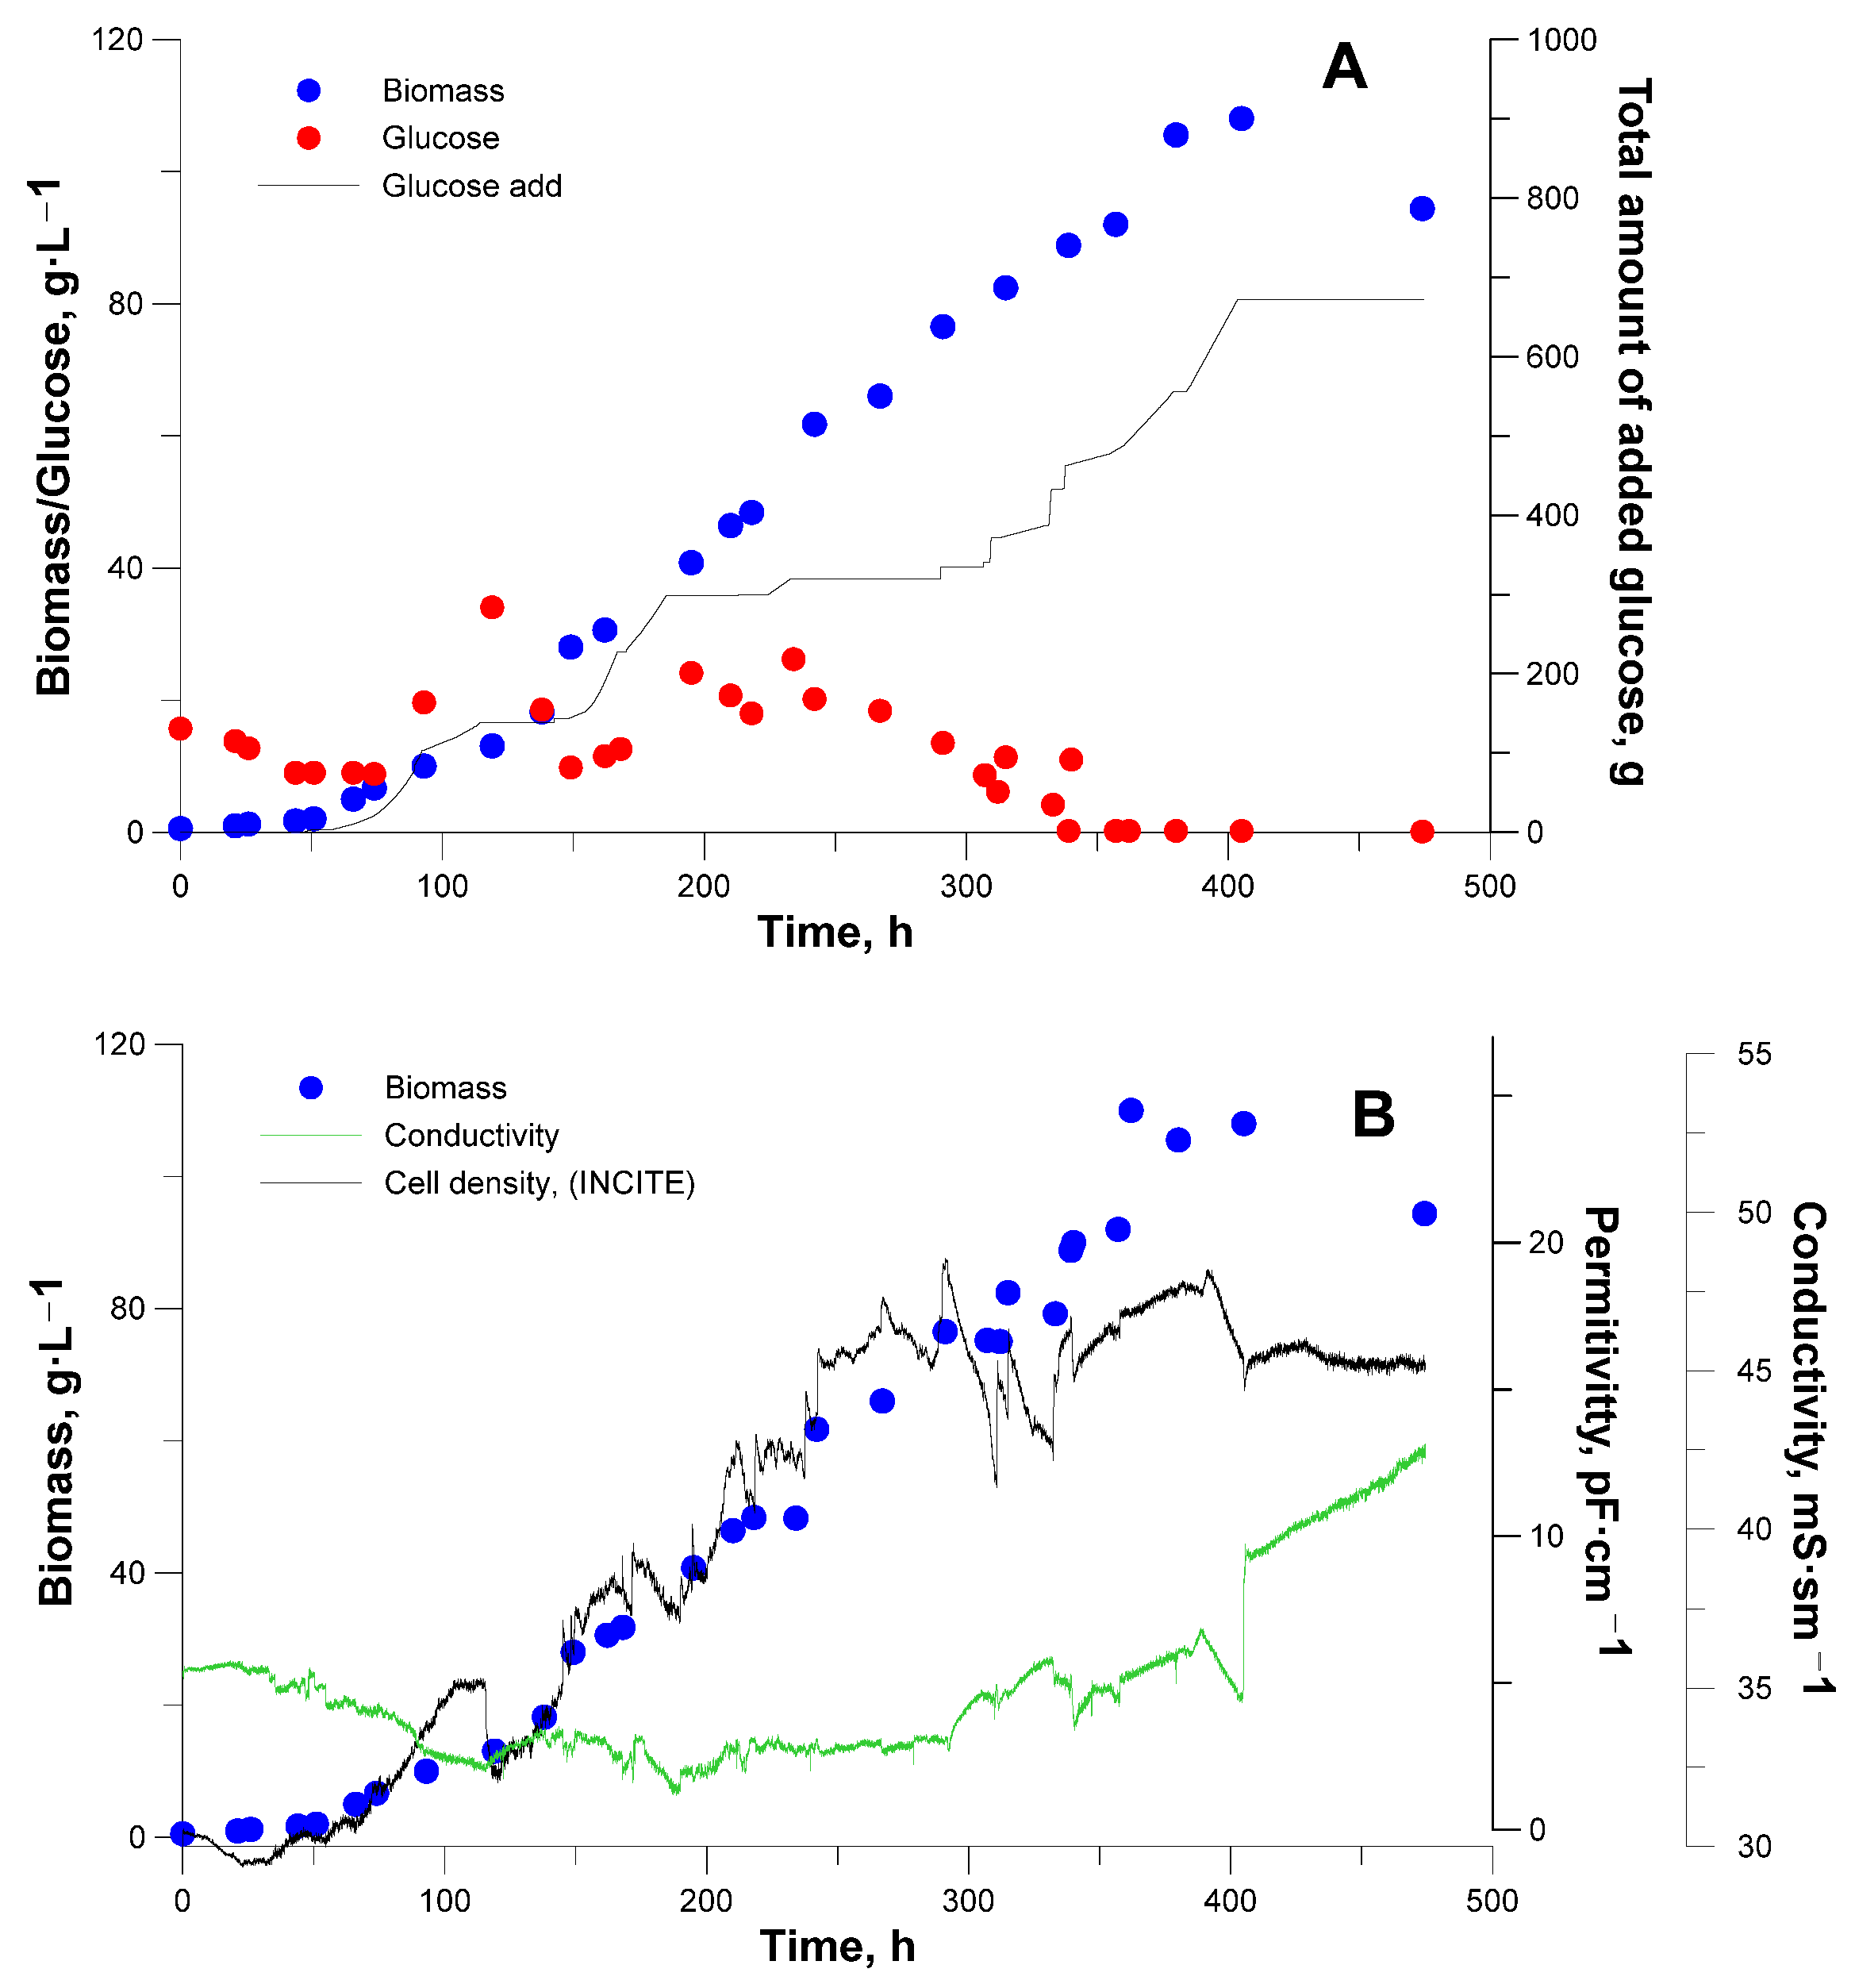
3.2. Bioreactor Cultivation

The composition of the feeding solution supplied during the fed-batch process must be optimized with respect to the concentration of the main components. An excess or shortage of one of the main components can greatly affect the course of the process, for example, reduce the biomass growth rate or stimulate the production of metabolites [20]. Furthermore, ref. [10] showed that excess yeast extract impairs the synthesis of DHA, and excess sea salt inhibits biomass growth. Therefore, the first cultivation experiment was carried out in order to identify the optimal composition of the nutrient medium that would not limit cell growth. In the first experiment, a glucose solution (150 g·L−1) was used for feeding and was pulse-fed into the cultivation medium upon registration of a shortage of substrate in the bioreactor.
The initial concentrations of components in the batch medium were: 10 g glucose L−1, 2 g yeast extract (YE) L−1, and 25 g sea salts (SS) L−1. Substrate feeding was enabled at the 65 h of cultivation, after glucose concentration fell to zero and a decrease in carbon dioxide production and oxygen consumption was registered. About 96 h into the cultivation, the biomass growth rate noticeably decreased (see Figure 3A). This could also be observed as a decrease in CO2 production rate and an increase in DO (see Figure 3B). Another portion of the feeding solution was introduced into the medium, although no reaction was noticed on substrate addition. Only after adding a portion of yeast extract did biomass growth, CO2 production, and oxygen uptake return to their previous levels. This indicates that at the given time, elements of the yeast extract were consumed within the cultivation solution; thus, the yield of biomass from yeast extract amounted to 5.5 g·g−1. The next decrease in biomass growth rate was observed 140 h into the cultivation and took place due to the depletion of sea salt components since the addition of yeast extract did not affect biomass growth. The yields of biomass from sea salts and glucose from the first experiment were estimated to be 0.65 and 0.61 g·g−1, respectively. The average microalgae biomass productivity of the cultivation amounted to 3.6 g·L−1·day−1.
The second experiment was carried out in the fed-batch mode by supplying a solution containing 200 g glucose L−1, 25 g YE L−1, and 100 g SS L−1. The concentration of glucose during the batch phase of the cultivation was initially set to 15 g·L−1, and after reaching 9 g·L−1, the feeding was enabled to keep the glucose concentration in the range of 15–25 g·L−1. The glucose feeding rate was calculated as:
F t = F o · e μ set · t
where Fo is the feeding initial rate l·h−1;
F o = ( μ set Y x / s ) · X o · V o W in
where µset—the set specific biomass growth rate, s−1;
Yx/sbiomass yield from substrate, g·g−1;
Xo—biomass concentration at the beginning of fed-batch, g·L−1;
Vo—volume of medium in the bioreactor at the beginning of fed-batch, L;
Win—substrate concentration in the feeding solution, g·L−1.
The feeding rate was chosen such as to maintain the maximal biomass growth rate identical to that achieved during the batch phase, while the glucose concentration remained at 10 g·L−1. As can be seen from Figure 4A, during the first 24 h, it was possible to maintain the selected growth rate, after which, a sharp decrease in growth rate was observed. This was apparently associated with an increase in salinity. The average biomass productivity between 63 and 110 h of cultivation reached 4.3 g·L−1·day−1, a 20% increase over the previous experiment. Figure 4B,C shows that the growth rate and CO2 release slowed down when the conductivity of the cultivation medium reached 42 mS·cm−1, which corresponds to a sea salt concentration of approximately 30 g·L−1. The increase in salinity induced osmotic stress in C. cohnii, which in turn resulted in changes in cell size. The latter significantly impacted online measurements of optical density—practically no changes in OD values were observed starting from this point. Nevertheless, the permittivity continued to increase. This can be explained by a change in viable cell volume (see Figure 4D). Upon observation, it was confirmed that the cell state changed from motile to cyst. Furthermore, the cyst size was, on average, noticeably larger compared to motile cells. The decrease in growth rate resulted in substrate accumulation in the growth medium, which further aggravated the situation. After assimilation of the accumulated sugar and the decrease in glucose concentration to 15 g·L−1, the biomass growth rate was restored and the cells switched to the motile state; however, the subsequent increase in the glucose concentration to 18 g·L−1 completely inhibited the growth of the culture.
FTIR spectra of C. cohnii (see Figure 5) showed absorption bands of the basic components: carbohydrates at 1080 cm−1, nucleic acids at 1250 cm−1, proteins—Amide I and Amide II (stretching vibrations of C=O bond of amide and bending vibrations of the N–H bond, respectively), lipids/fatty acids—triplet bands in the region of 2800–3000 cm−1 (C–H stretching in CH3 and CH2), and 1745 cm−1 (C=O of esters/ester carbonyl) [21,22,23,24]. Cross-comparison of spectra shows variations in the content and ratio of the main macromolecular components—carbohydrates, proteins, and lipids. The highest protein content was detected in cells grown for 88.0 h and the lowest in the 63.6 h sample. The carbohydrate and protein contents in samples seemed to change randomly but not when grown for longer cultivation times. The intensities of characteristic total lipid/PUFA bands are weak in all samples. Therefore, it can be concluded that under these cultivation conditions, C. cohnii cells do not overproduce lipids when grown for 159.9 h.
Furthermore, it was concluded that the optimal concentration of glucose is in the range of 9–18 g·L−1, while the concentration of sea salt in the cultivation medium should not exceed 30 g·L−1.
Online measurements of biomass concentrations (permittivity and optical density) were shown to be effective during the early stages of the cultivation when the growth conditions were maintained at close to optimal. The readings of the mentioned sensors are strongly affected by the physiological state of the cells, which can be used in practice to perform relevant assessments. The amount of accumulated biomass was efficiently estimated based on the total amount of emitted CO2, which displayed a direct relation to biomass titers throughout the whole cultivation.
In the third experiment, in order to avoid an increase in the salinity of the cultivation medium, the concentration of sea salt in the feeding solution was lowered to 25 g·L−1. The feeding rate was calculated as described in the previous experiments and was corrected when glucose accumulated in the cultivation medium. Figure 6A shows the biomass growth and glucose uptake curves. The average productivity of the process between 150 and 260 h reached 8 g·L−1·day−1, which is an 86% increase with respect to the second experiment. The conductivity of the medium at the beginning of the cultivation gradually decreased, but after 100 h it stabilized at 34 mS·cm−1 and remained constant until 300 h. After 300 h, when the biomass concentration reached 80 g·L−1, the medium conductivity began to increase and reached 45 mS·cm−1, which, similar to the second experiment, decreased the biomass growth rate (see Figure 6B). The change in salinity, in contrast to the second experiment, was not due to the over-addition of feeding since the nutrient solution had the same concentration of sea salt as the batch medium but was a consequence of cell lysis—confirmed by microscopy—which showed cell destruction and a decrease in their mobility. One of the causes of cell lysis could be the mechanical destruction of cells due to an increase in the viscosity of the medium resulting in an increase in shear stress. The second reason for cell lysis could be the low concentration of dissolved oxygen, which was impossible to maintain at a constant rate at higher biomass concentrations and under selected oxygenation parameters (agitation, 270 rpm; airflow, 0.125 vvm; oxygen enrichment, 50%). Increasing the agitation rate to 300 rpm resulted in a decrease in permittivity, which was induced by the mechanical destruction of cells. Such a discrepancy with respect to the theoretically calculated maximum agitation rate is most likely due to the longer exposure time (the susceptibility tests were conducted at exposure times of 20 min) and the higher viscosity of the cultivation medium.
The biomass concentration reached a maximum of 110 g·L−1 at the end of the cultivation, which is one of the highest values ever reported in the literature when cultivating C. cohnii using glucose. Despite the obtained maximal biomass concentration, the optimal value under the given oxygenation condition is 80 g·L−1 when the lowest percentage of lysed cells is observed. After reaching the mentioned concentration, it is preferable to switch cultivation to the continuous regime or to terminate the cultivation altogether.
In the FTIR spectrum of fish oil (EPA-TAGs and DHA-TAGs mix), the sharp band at ~1744 cm−1 assigned to C=O stretches of ester functional groups from lipids and fatty acids or triglycerides [25,26,27] revealed three high absorption bands at 2925, 2854 cm−1, and 1745 cm−1 that were assigned to lipids, fatty acids, or triglycerides and are therefore indicative of total lipids [21,23,24,25,26,27].
FTIR spectra of C. cohnii (see Figure 7) biomass after growth for 136.3, 149.3, 161.9, 185.9, 194.5, 209.5, 234, 242, 266.6, 290.6, 304.5, 315, 339, 362.05, 379, 403, and 474.3 h showed the same absorption band frequencies, pointing to a similar composition; however, higher or lower intensities indicate higher or lower contents, i.e., concentrations.
FTIR spectra showed an increase in 2925 cm−1, 2854 cm−1, and 1745 cm−1 band intensities with growth time. For mutual cross-comparison of bands assigned to lipids, fatty acids, or triglycerides, the spectra were vector-normalized and deconvoluted (2nd derivative). This approach is used for a more precise evaluation of spectral band intensities and resolution of any overlapping components [27]. The 2nd derivative spectra proved that these peaks were simple and separate, and therefore, characteristic of lipids, fatty acids, or triglycerides (see Figure 8). The deconvoluted spectra clearly demonstrate an increase in the total lipid, fatty acid, and triglyceride content in C. cohnii cells.

4. Conclusions

Based on the experiments, which were aimed at evaluating the susceptibility of C. cohnii cells to mechanical damage, the maximal specific power input value at which cell destruction is not induced was found to be 276.5 W/m3. The mentioned value can be used for future scale-up studies.
Multiple batch and fed-batch cultivation experiments were performed using glucose as the main substrate. Individual biomass yields from each cultivation medium component were estimated from the experimental data. The yields from yeast extract, sea salts, and glucose amounted to 5.5, 0.65, and 0.61 g·g−1, respectively. The latter enabled the possibility of fine-tuning both the cultivation medium and feeding solution compositions.
The experimental data enabled the possibility of optimizing the cultivation medium as well as the feeding solution compositions, which in turn resulted in improvements both in terms of biomass productivity (8 g·L−1·day−1) and maximal biomass concentration (110 g·L−1). The presence of unsaturated fatty acids was confirmed by the FTIR data. Furthermore, the data showed a steady increase in PUFA concentrations throughout cultivation.
Additional research should be performed to further improve the overall cultivation efficiency. Aspects such as fine-tuning the cultivation medium composition (using a synthetic mixture of inorganic salts in exchange for sea salts) and automatic transfer of cultivation from the cell growth to the DHA accumulation state can be taken into account in subsequent studies, as both can significantly affect the scale-up potential of such applications.

Author Contributions

Conceptualization, K.D. and A.S. (Arturs Suleiko); methodology, K.D. and A.S. (Arturs Suleiko); formal analysis, K.D., A.S. (Arturs Suleiko) and K.S.; investigation, K.D., E.D., A.S. (Arturs Suleiko), A.S. (Anastasija Suleiko), M.G. and K.S.; resources, J.V.; data curation, K.D., A.S. (Arturs Suleiko) and K.S.; writing—original draft preparation, K.D., E.D., A.S. (Arturs Suleiko) and M.G.; writing—review and editing, K.D., E.D., A.S. (Arturs Suleiko) and M.G.; visualization, K.D., A.S. (Arturs Suleiko) and K.S.; supervision, K.D.; project administration, E.D.; funding acquisition, J.V. All authors have read and agreed to the published version of the manuscript.

Funding

This research was performed with financial support from the European Regional Development Fund project no. 1.1.1.1/18/A/022 “Crypthecodinium cohnii and Zymomonas mobilis syntrophy for production of omega 3 fatty acid from byproducts of biofuel and sugar industry” and Latvian state Institute of Wood Chemistry grant No. 11-24 (By2Surf).

Institutional Review Board Statement

Not applicable.

Informed Consent Statement

Not applicable.

Data Availability Statement

Data are contained within the article.

Conflicts of Interest

Author Konstantins Dubencovs, Arturs Suleiko, and Juris Vanags were employed by Bioreactors.net AS. The remaining authors declare that the research was conducted in the absence of any commercial or financial relationships that could be construed as potential conflicts of interest.

References

  1. Kumsiri, B.; Pekkoh, J.; Pathom-aree, W.; Lumyong, S.; Pumas, C. Synergistic Effect of Co-Culture of Microalga and Actinomycete in Diluted Chicken Manure Digestate for Lipid Production. Algal Res. 2018, 33, 239–247. [Google Scholar] [CrossRef]
  2. Santos-Sánchez, N.F.; Valadez-Blanco, R.; Hernández-Carlos, B.; Torres-Ariño, A.; Guadarrama-Mendoza, P.C.; Salas-Coronado, R. Lipids Rich in ω-3 Polyunsaturated Fatty Acids from Microalgae. Appl. Microbiol. Biotechnol. 2016, 100, 8667–8684. [Google Scholar] [CrossRef]
  3. Cui, J.; Diao, J.; Sun, T.; Shi, M.; Liu, L.; Wang, F.; Chen, L.; Zhang, W. 13C Metabolic Flux Analysis of Enhanced Lipid Accumulation Modulated by Ethanolamine in Crypthecodinium cohnii. Front. Microbiol. 2018, 9, 956. [Google Scholar] [CrossRef]
  4. Kadalag, N.L.; Pawar, P.R.; Prakash, G. Co-Cultivation of Phaeodactylum Tricornutum and Aurantiochytrium Limacinum for Polyunsaturated Omega-3 Fatty Acids Production. Bioresour. Technol. 2022, 346, 126544. [Google Scholar] [CrossRef]
  5. Patel, A.; Liefeldt, S.; Rova, U.; Christakopoulos, P.; Matsakas, L. Co-Production of DHA and Squalene by Thraustochytrid from Forest Biomass. Sci. Rep. 2020, 10, 1992. [Google Scholar] [CrossRef]
  6. Mendes, A.; Reis, A.; Vasconcelos, R.; Guerra, P.; Lopes Da Silva, T. Crypthecodinium cohnii with Emphasis on DHA Production: A Review. J. Appl. Phycol. 2009, 21, 199–214. [Google Scholar] [CrossRef]
  7. Taborda, T.; Moniz, P.; Reis, A.; da Silva, T.L. Evaluating Low-Cost Substrates for Crypthecodinium cohnii Lipids and DHA Production, by Flow Cytometry. J. Appl. Phycol. 2021, 33, 263–274. [Google Scholar] [CrossRef]
  8. Liu, H.; Li, H.; Zhong, Y.; Lu, Q.; Zhang, X.; Wang, Q.; Liu, H.; Diao, Z.; Yao, C. Co-Cultivation of: Rhodotorula glutinis and Chlorella pyrenoidosa to Improve Nutrient Removal and Protein Content by Their Synergistic Relationship. RSC Adv. 2019, 9, 14331–14342. [Google Scholar] [CrossRef]
  9. Kalia, S.; Lei, X.G. Dietary Microalgae on Poultry Meat and Eggs: Explained versus Unexplained Effects. Curr. Opin. Biotechnol. 2022, 75, 102689. [Google Scholar] [CrossRef]
  10. de Swaaf, M.E.; de Rijk, T.C.; Eggink, G.; Sijtsma, L. Optimisation of Docosahexaenoic Acid Production in Batch Cultivations by Crypthecodinium cohnii. Prog. Ind. Microbiol. 1999, 35, 185–192. [Google Scholar] [CrossRef]
  11. Wu, M.; Gao, G.; Jian, Y.; Xu, J. High CO2 Increases Lipid and Polyunsaturated Fatty Acid Productivity of the Marine Diatom Skeletonema costatum in a Two-Stage Model. J. Appl. Phycol. 2022, 34, 43–50. [Google Scholar] [CrossRef]
  12. Jiang, X.; Han, Q.; Gao, X.; Gao, G. Conditions Optimising on the Yield of Biomass, Total Lipid, and Valuable Fatty Acids in Two Strains of Skeletonema menzelii. Food Chem. 2016, 194, 723–732. [Google Scholar] [CrossRef]
  13. Gao, G.; Wu, M.; Fu, Q.; Li, X.; Xu, J. A Two-Stage Model with Nitrogen and Silicon Limitation Enhances Lipid Productivity and Biodiesel Features of the Marine Bloom-Forming Diatom Skeletonema costatum. Bioresour. Technol. 2019, 289, 121717. [Google Scholar] [CrossRef]
  14. Didrihsone, E.; Dubencovs, K.; Grube, M.; Shvirksts, K.; Suleiko, A.; Suleiko, A.; Vanags, J. Crypthecodinium cohnii Growth and Omega Fatty Acid Production in Mediums Supplemented with Extract from Recycled Biomass. Mar. Drugs 2022, 20, 68. [Google Scholar] [CrossRef]
  15. Freiberger, F.; Budde, J.; Ateş, E.A.; Schlüter, M.; Pörtner, R.; Möller, J. New Insights from Locally Resolved Hydrodynamics in Stirred Cell Culture Reactors. Processes 2022, 10, 107. [Google Scholar] [CrossRef]
  16. Suleiko, A.; Vanags, J.; Konuhova, M.; Dubencovs, K.; Grigs, O. The Application of Novel Magnetically Coupled Mixer Drives in Bioreactors of up to 15 m3. Biochem. Eng. J. 2020, 154, 107464. [Google Scholar] [CrossRef]
  17. Dubencovs, K.; Liepins, J.; Suleiko, A.; Suleiko, A.; Vangravs, R.; Kassaliete, J.; Scerbaka, R.; Grigs, O. Optimization of Synthetic Media Composition for Kluyveromyces Marxianus Fed-Batch Cultivation. Fermentation 2021, 7, 62. [Google Scholar] [CrossRef]
  18. Berzins, K.; Muiznieks, R.; Baumanis, M.R.; Strazdina, I.; Shvirksts, K.; Prikule, S.; Galvanauskas, V.; Pleissner, D.; Pentjuss, A.; Grube, M.; et al. Kinetic and Stoichiometric Modeling-Based Analysis of Docosahexaenoic Acid (DHA) Production Potential by C. cohnii from Glycerol, Glucose and Ethanol. Mar. Drugs 2022, 20, 115. [Google Scholar] [CrossRef]
  19. Yoshida, S.; Yoshida, H. Noninvasive Analyses of Polyunsaturated Fatty Acids in Human Oral Mucosa in Vivo by Fourier-Transform Infrared Spectroscopy. Biopolymers 2004, 74, 403–412. [Google Scholar] [CrossRef]
  20. Simopoulos, A.P. The Importance of the Ratio of Omega-6/Omega-3 Essential Fatty Acids. Biomed. Pharmacother. 2002, 56, 365–379. [Google Scholar] [CrossRef]
  21. Killeen, D.P.; Marshall, S.N.; Burgess, E.J.; Gordon, K.C.; Perry, N.B. Raman Spectroscopy of Fish Oil Capsules: Polyunsaturated Fatty Acid Quantitation Plus Detection of Ethyl Esters and Oxidation. J. Agric. Food Chem. 2017, 65, 3551–3558. [Google Scholar] [CrossRef]
  22. Karunathilaka, S.R.; Choi, S.H.; Mossoba, M.M.; Yakes, B.J.; Brückner, L.; Ellsworth, Z.; Srigley, C.T. Rapid Classification and Quantification of Marine Oil Omega-3 Supplements Using ATR-FTIR, FT-NIR and Chemometrics. J. Food Compos. Anal. 2019, 77, 9–19. [Google Scholar] [CrossRef]
  23. Vongsvivut, J.; Heraud, P.; Zhang, W.; Kralovec, J.A.; McNaughton, D.; Barrow, C.J. Quantitative Determination of Fatty Acid Compositions in Micro-Encapsulated Fish-Oil Supplements Using Fourier Transform Infrared (FTIR) Spectroscopy. Food Chem. 2012, 135, 603–609. [Google Scholar] [CrossRef] [PubMed]
  24. Guillén, M.D.; Cabo, N. Characterization of Edible Oils and Lard by Fourier Transform Infrared Spectroscopy. Relationships between Composition and Frequency of Concrete Bands in the Fingerprint Region. JAOCS J. Am. Oil Chem. Soc. 1997, 74, 1281–1286. [Google Scholar] [CrossRef]
  25. Ripoche, A.; Guillard, A.S. Determination of Fatty Acid Composition of Pork Fat by Fourier Transform Infrared Spectroscopy. Meat Sci. 2001, 58, 299–304. [Google Scholar] [CrossRef] [PubMed]
  26. Meng, W.; Jiang, Y.; Rothschild, D.; Lipke, M.; Hall, G.; Wang, L. Modeling the Structure and Infrared Spectra of Omega-3 Fatty Acid Esters. J. Chem. Phys. 2020, 153, 035101. [Google Scholar] [CrossRef]
  27. Susi, H.; Byler, D.M. [13] Resolution-Enhanced Fourier Transform Infrared Spectroscopy of Enzymes. Methods Enzym. 1986, 130, 290–311. [Google Scholar] [CrossRef]
Figure 1. Studied impeller geometry and the respective Power number values.
Fermentation 10 00203 g001
Figure 2. Viable cell density as a function of time during mixing at different agitation rates. Dotted vertical lines, the stirrer speed at the respective time; dotted curve, line of approximation; blue line, conductivity; orange line, permittivity.
Fermentation 10 00203 g002
Figure 3. C. cohnii first bioreactor cultivation. (A) Biomass (DCW) growth (blue line) and glucose uptake (red line) curves and amount of glucose added (black line). (B) Dissolved oxygen concentration (blue line), released CO2 (red line), and added glucose (black line).
Fermentation 10 00203 g003
Figure 4. C. cohnii second bioreactor fed-batch cultivation. (A) Biomass growth (blue line) and glucose uptake (red line) curves and amount of glucose added (black line), (B) Biomass growth (blue dots), cell density (red dot line), and conductivity (black line), (C) Gas analysis data (CER—carbon evolution rate—(black line), CO2 (red dot line), biomass (blue dots)), (D) biomass growth (blue dots) and cell density (permittivity; black line).
Fermentation 10 00203 g004
Figure 5. Vector-normalized FTIR spectra of C. cohnii biomasses after cultivation for 63.5 (blue line), 88 (red line), 93.15 (green line), 113 (yellow line), and 159.5 (black line) hours.
Fermentation 10 00203 g005
Figure 6. C. cohnii third bioreactor fed-batch cultivation. (A) Biomass growth (blue dots), glucose uptake (red dots) curves, and amount of glucose added (black line), (B) biomass growth (blue dots), conductivity (green line), and cell density (permittivity; black line).
Fermentation 10 00203 g006
Figure 7. Vector-normalized FTIR spectra of C. cohnii biomass after cultivation for 138.3 (blue line), 185.9 (red line), 266.6 (pink line), 315 (yellow line), and 403 (black line) hours.
Fermentation 10 00203 g007
Figure 8. Vector-normalized 2nd derivative spectra of C. cohnii biomass at different growth times.
Fermentation 10 00203 g008
Disclaimer/Publisher’s Note: The statements, opinions and data contained in all publications are solely those of the individual author(s) and contributor(s) and not of MDPI and/or the editor(s). MDPI and/or the editor(s) disclaim responsibility for any injury to people or property resulting from any ideas, methods, instructions or products referred to in the content.

