
Effect of Carbon Nanoparticles on the Porous Texture of ι-Carrageenan-Based N-Doped Nanostructured Porous Carbons and Implications for Gas Phase Applications

 , , , and
Abstract
1. Introduction
2. Materials and Methods
2.1. Characterization Methods
2.2. Adsorption with Probe Gases
3. Results and Discussion
3.1. Effect of the CNPs on the Morphology and Chemistry of the Samples
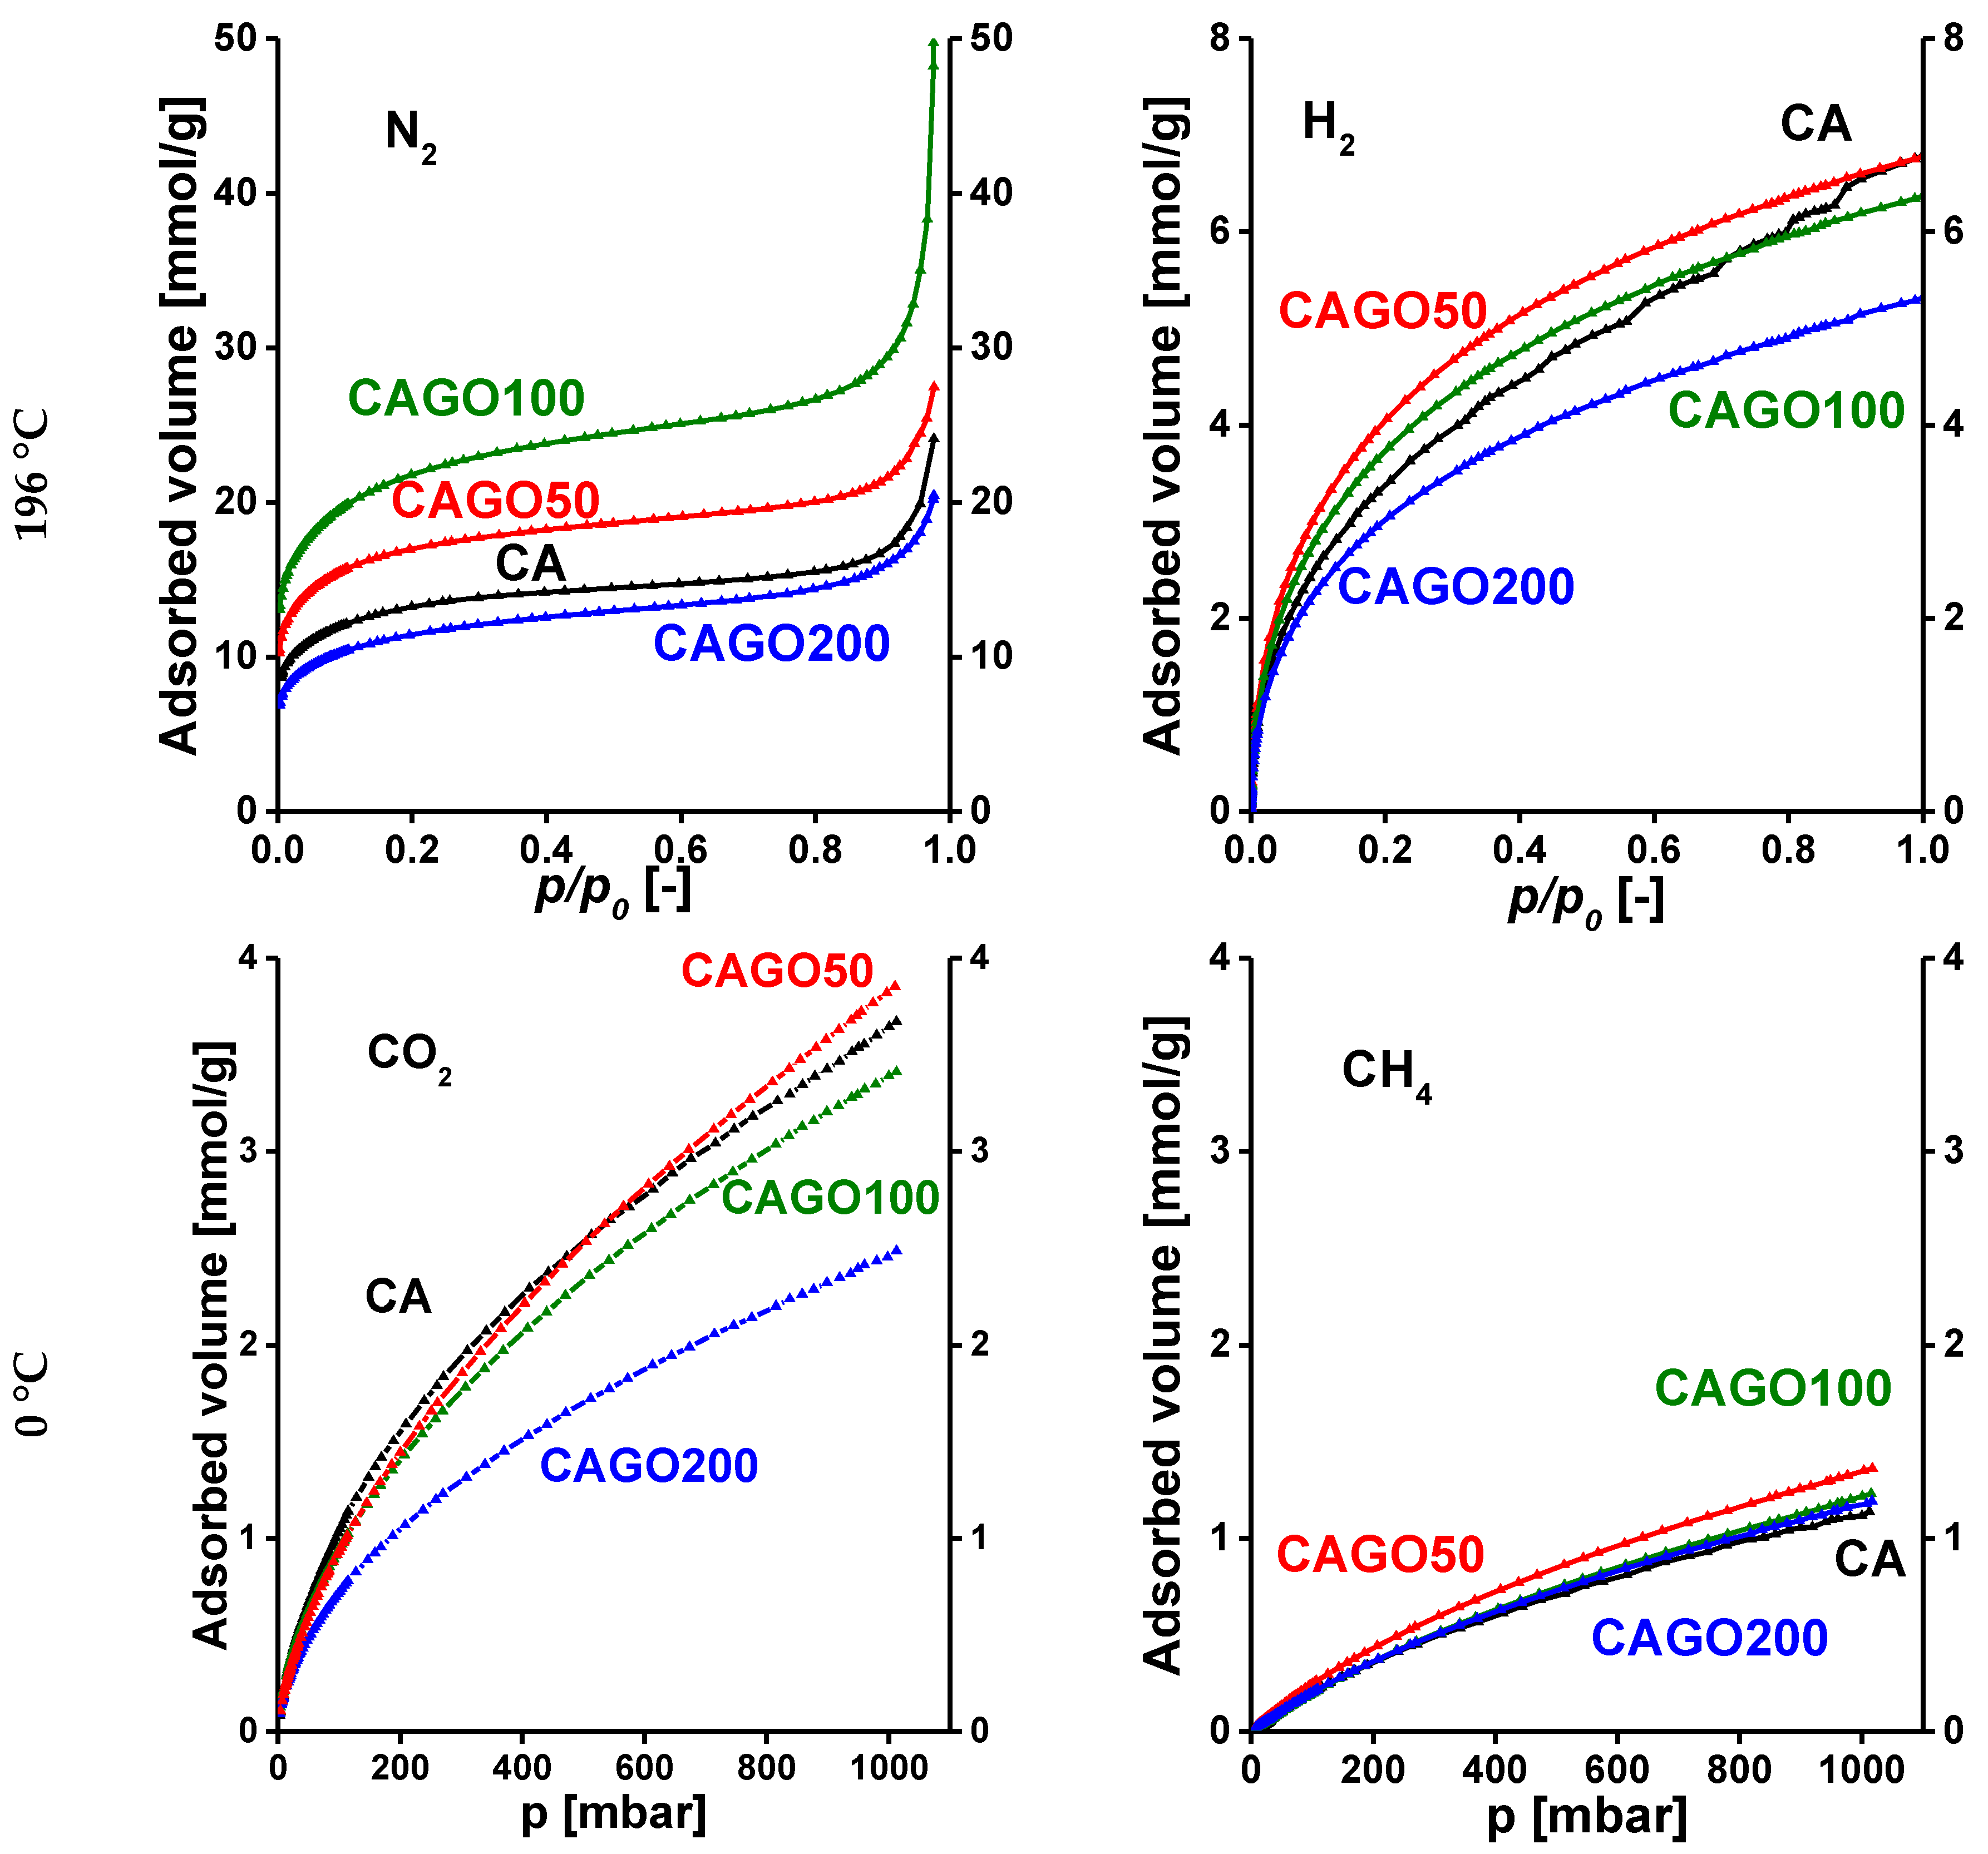
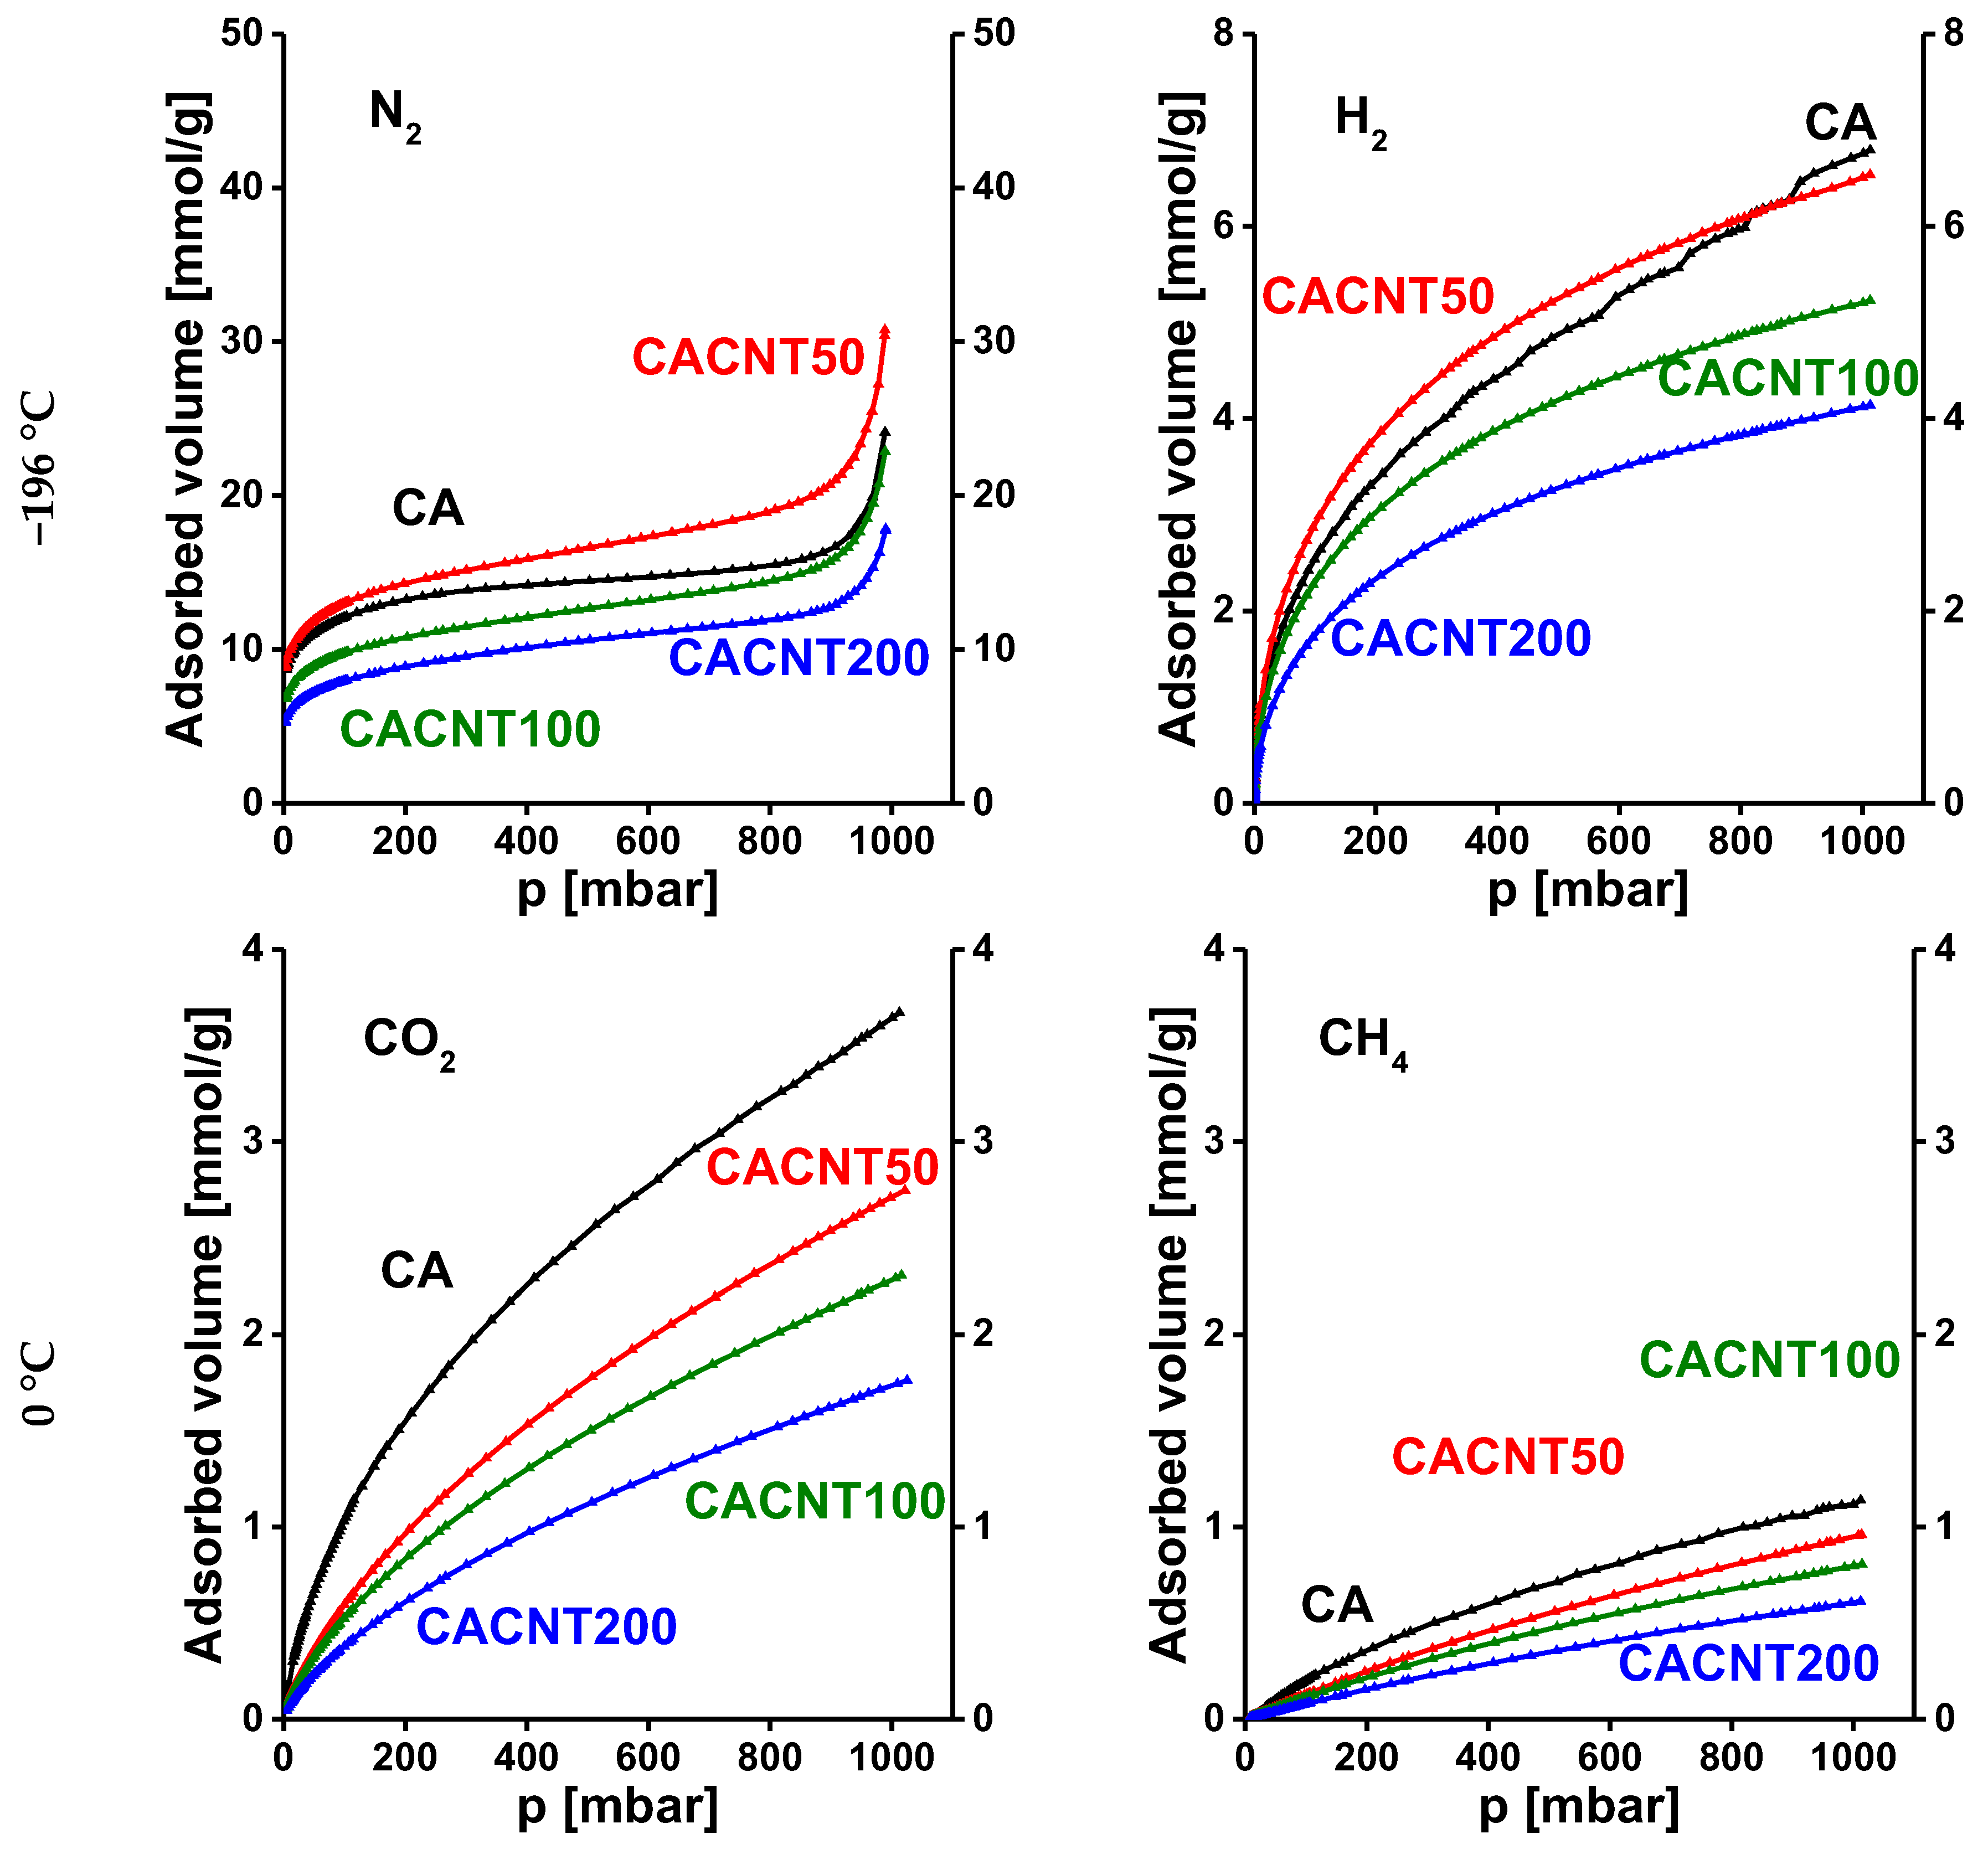
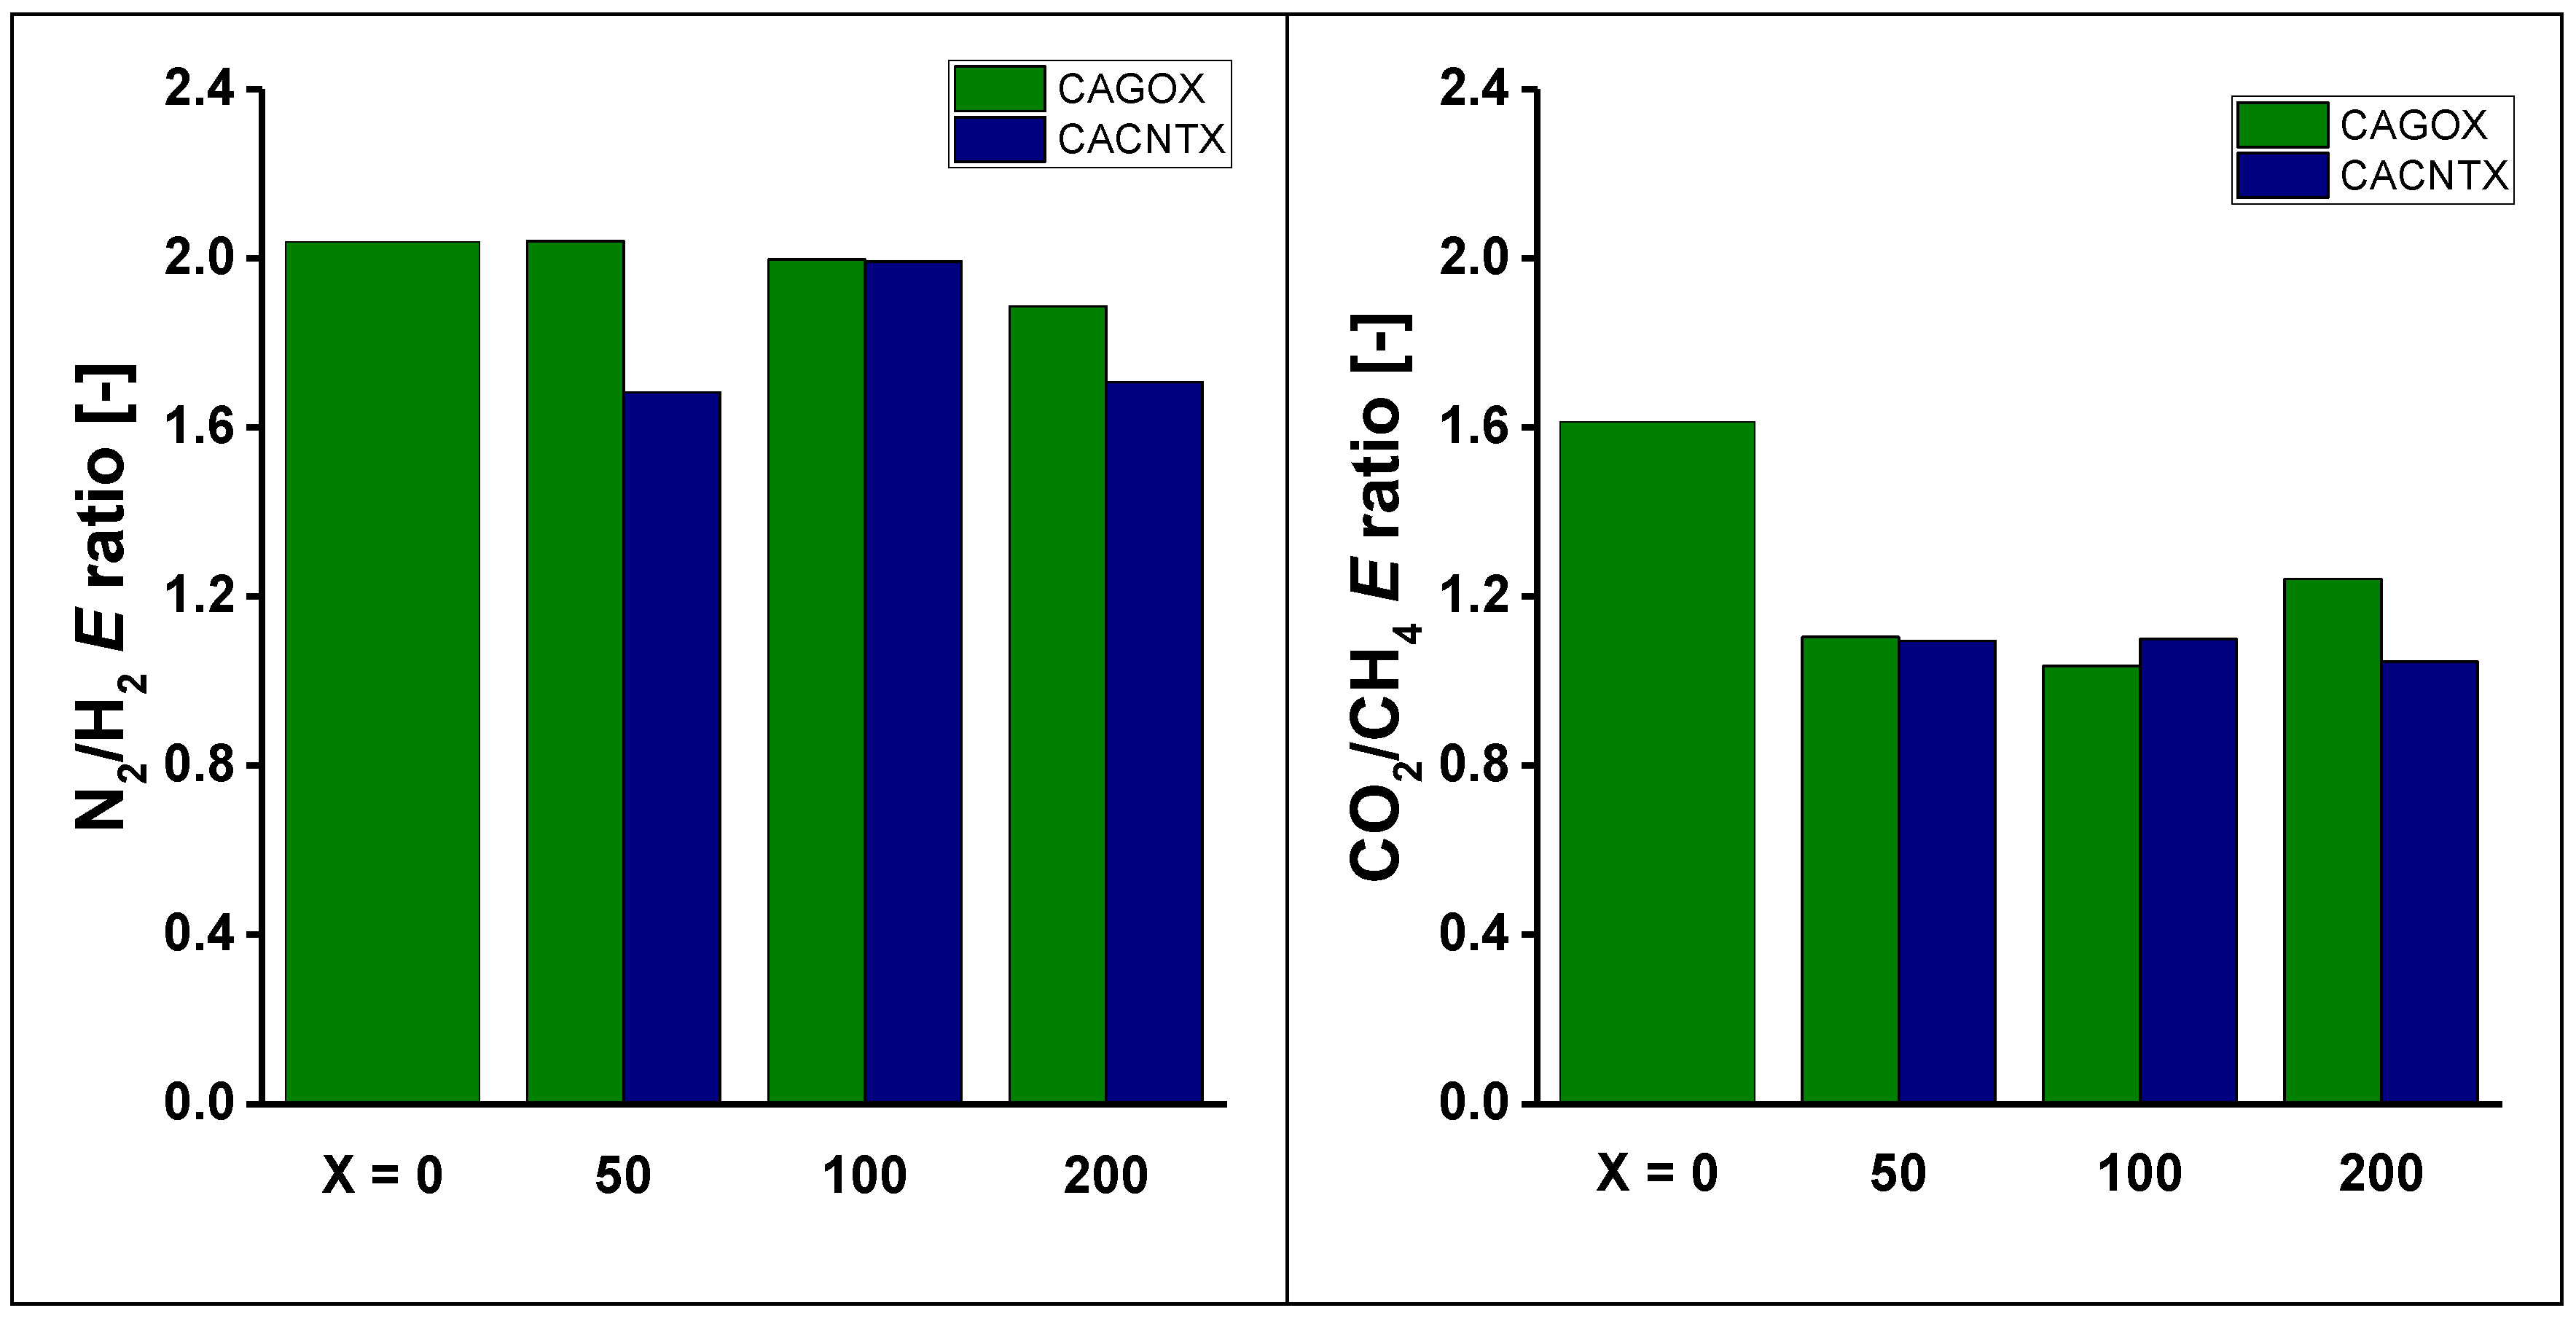
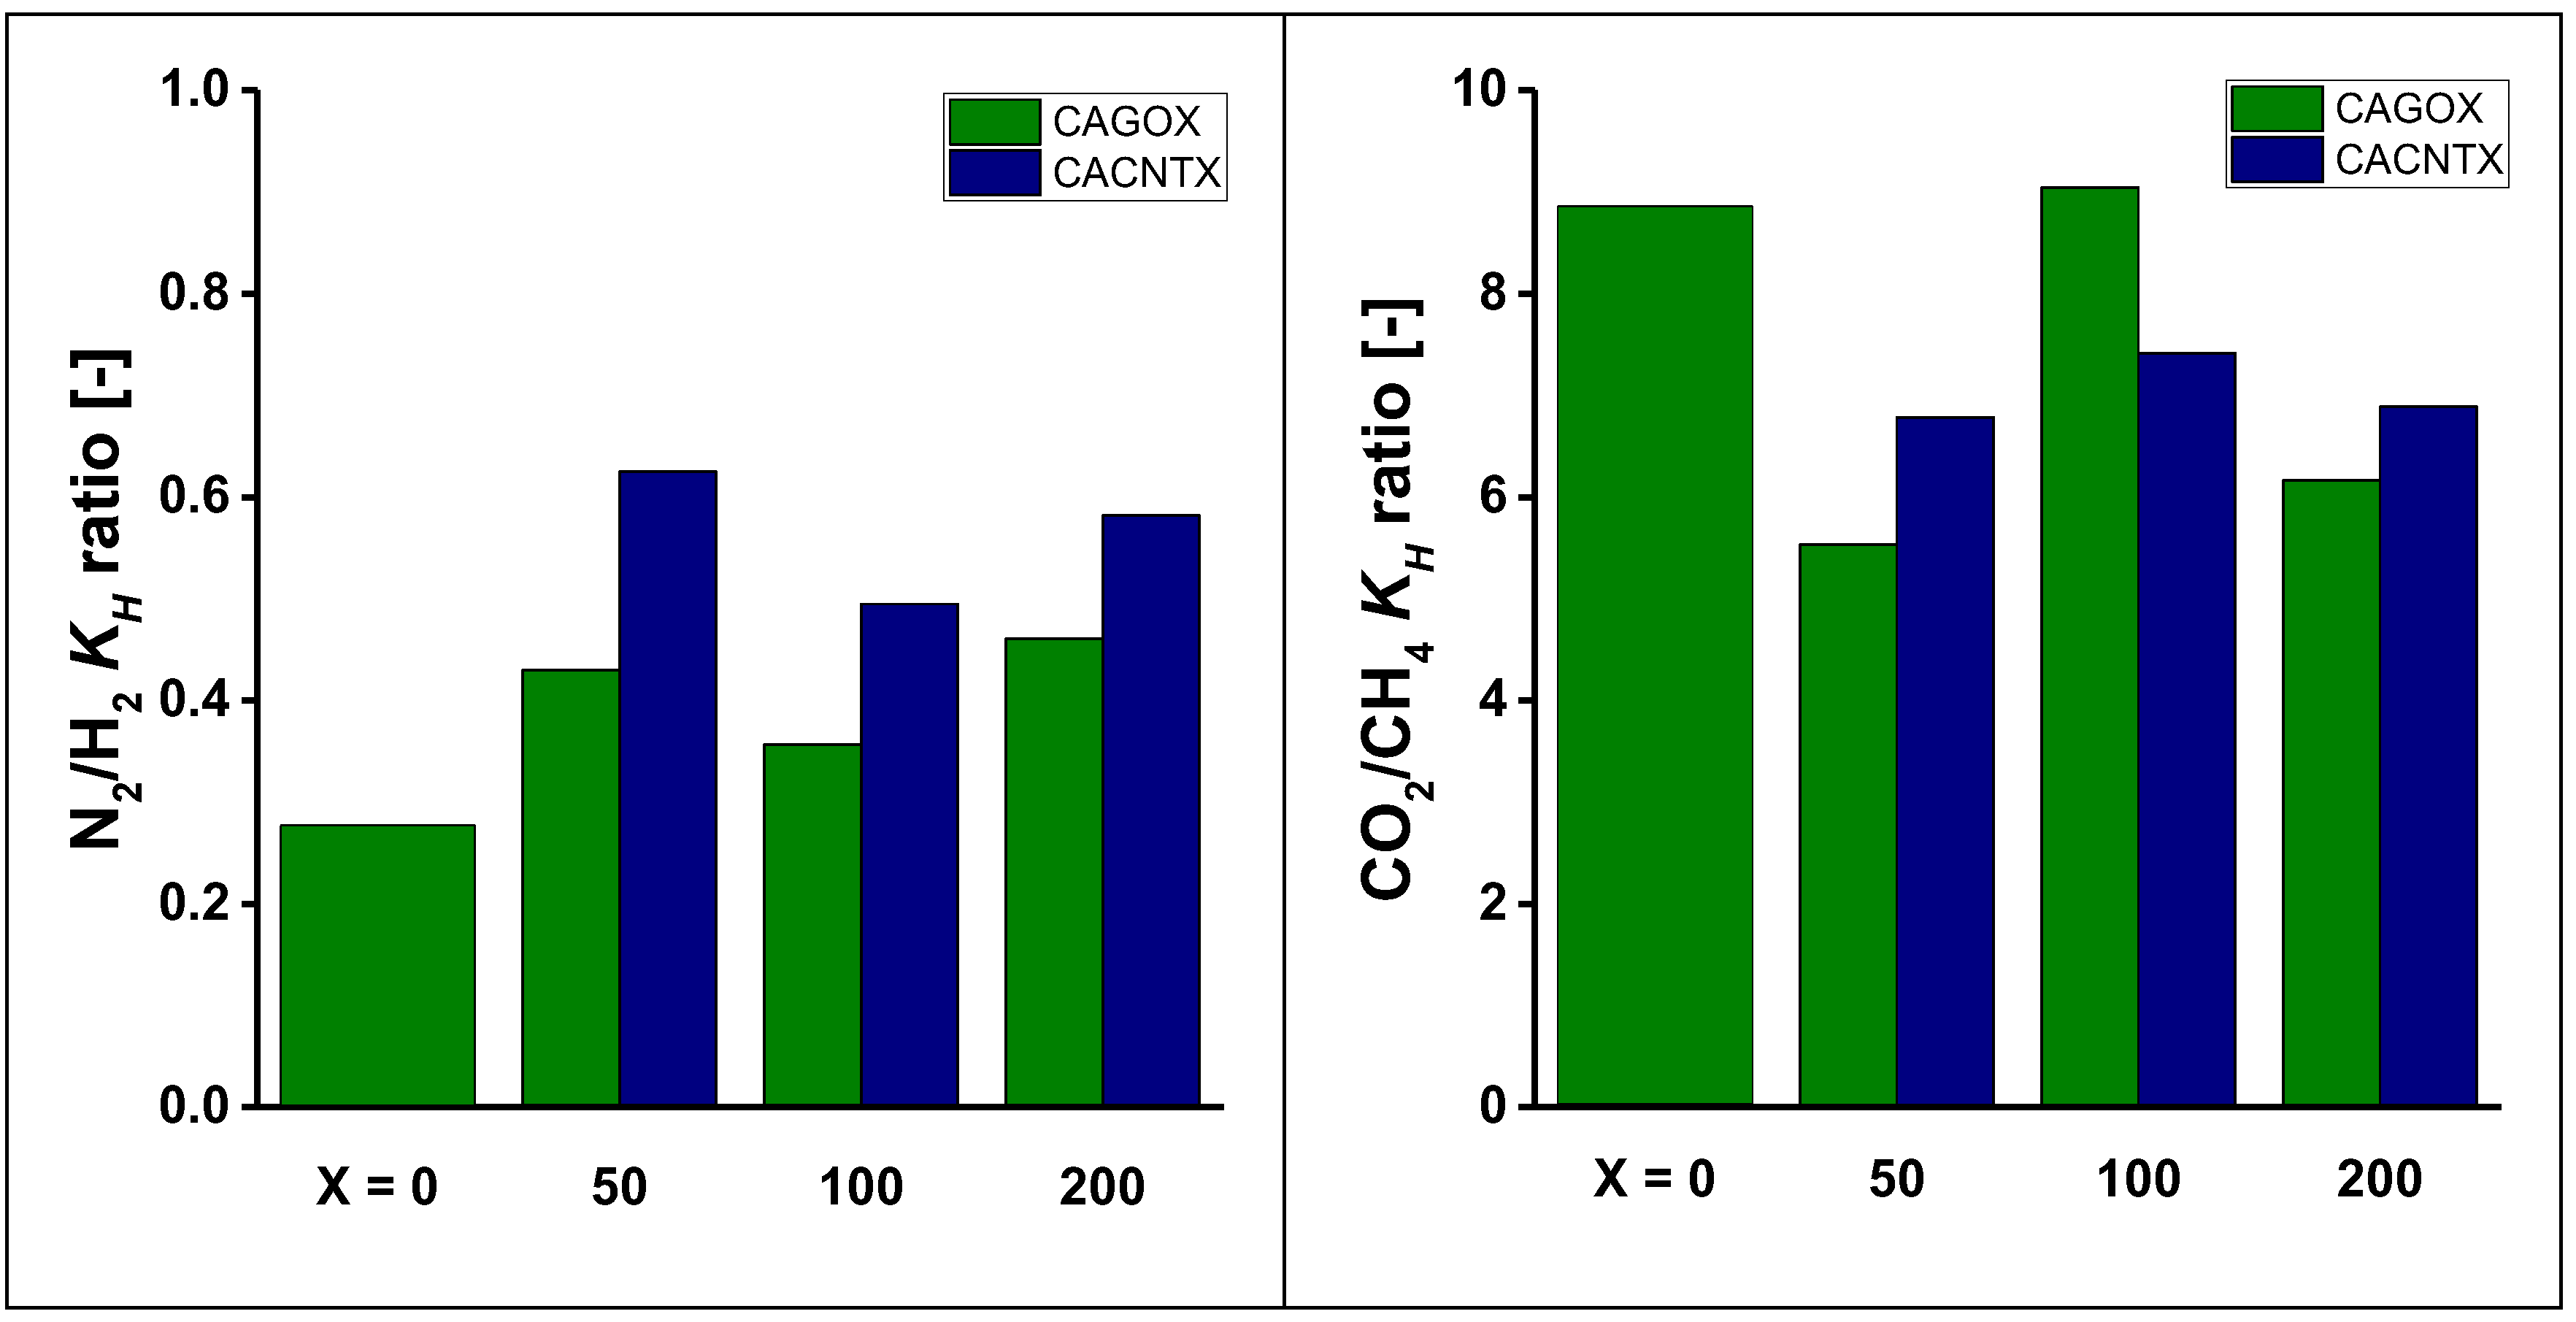
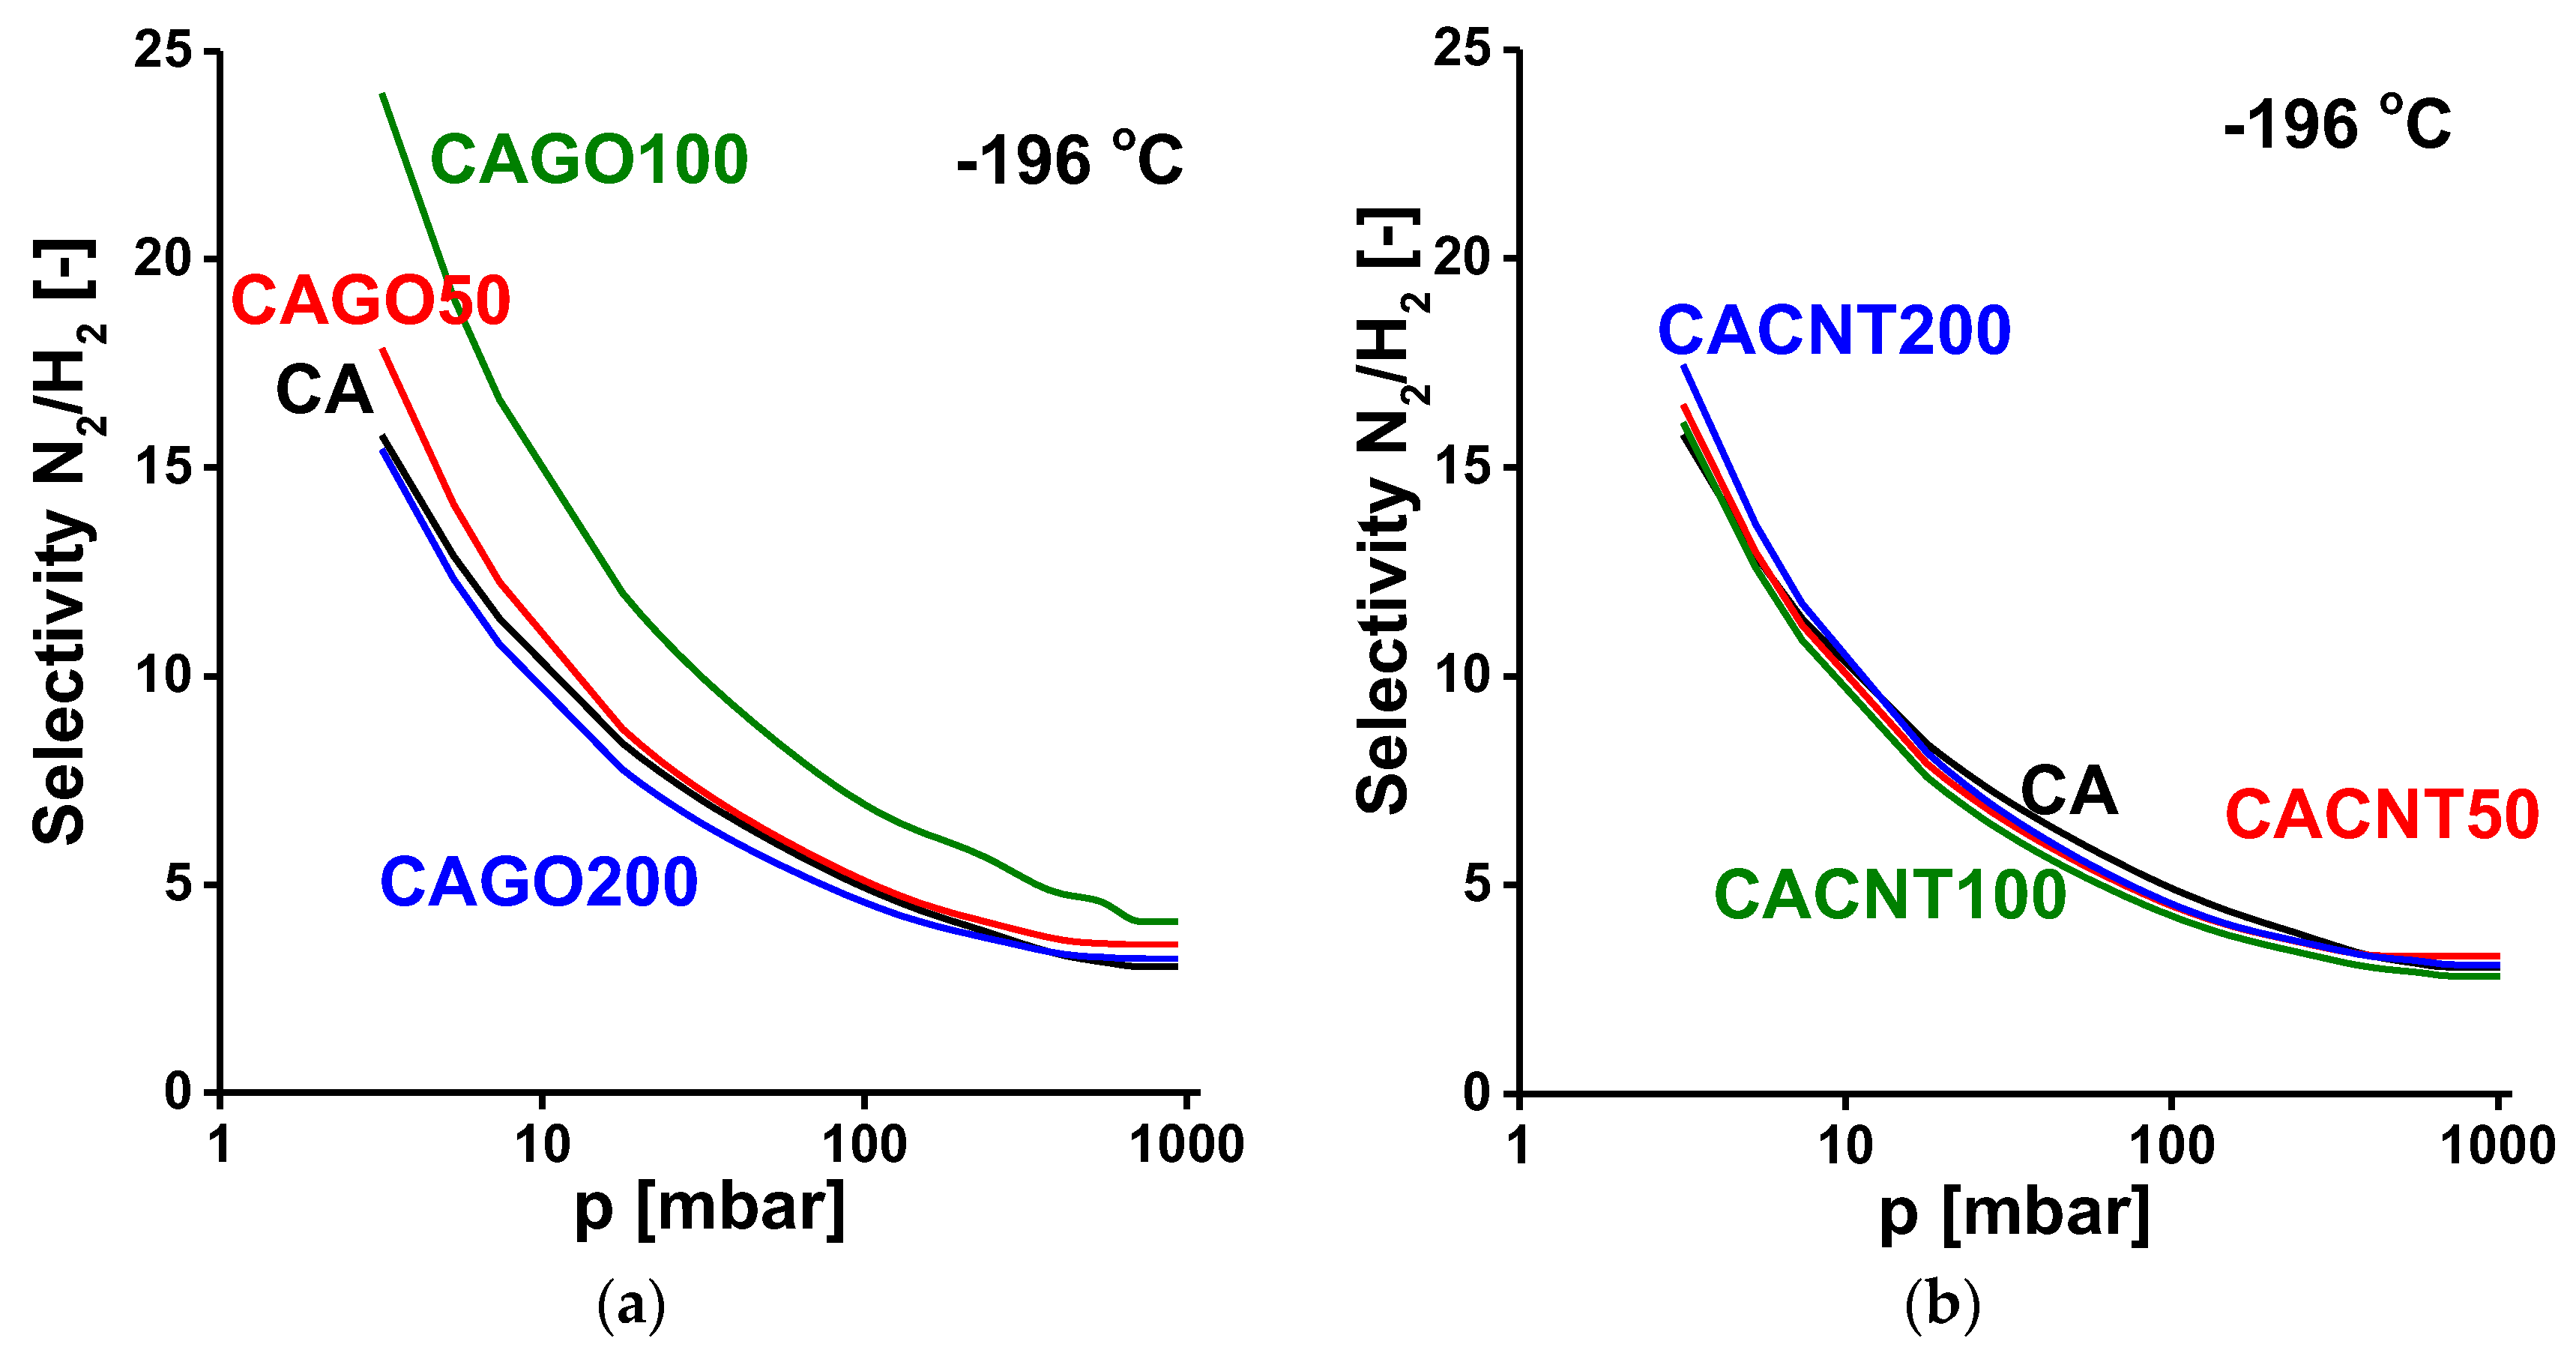
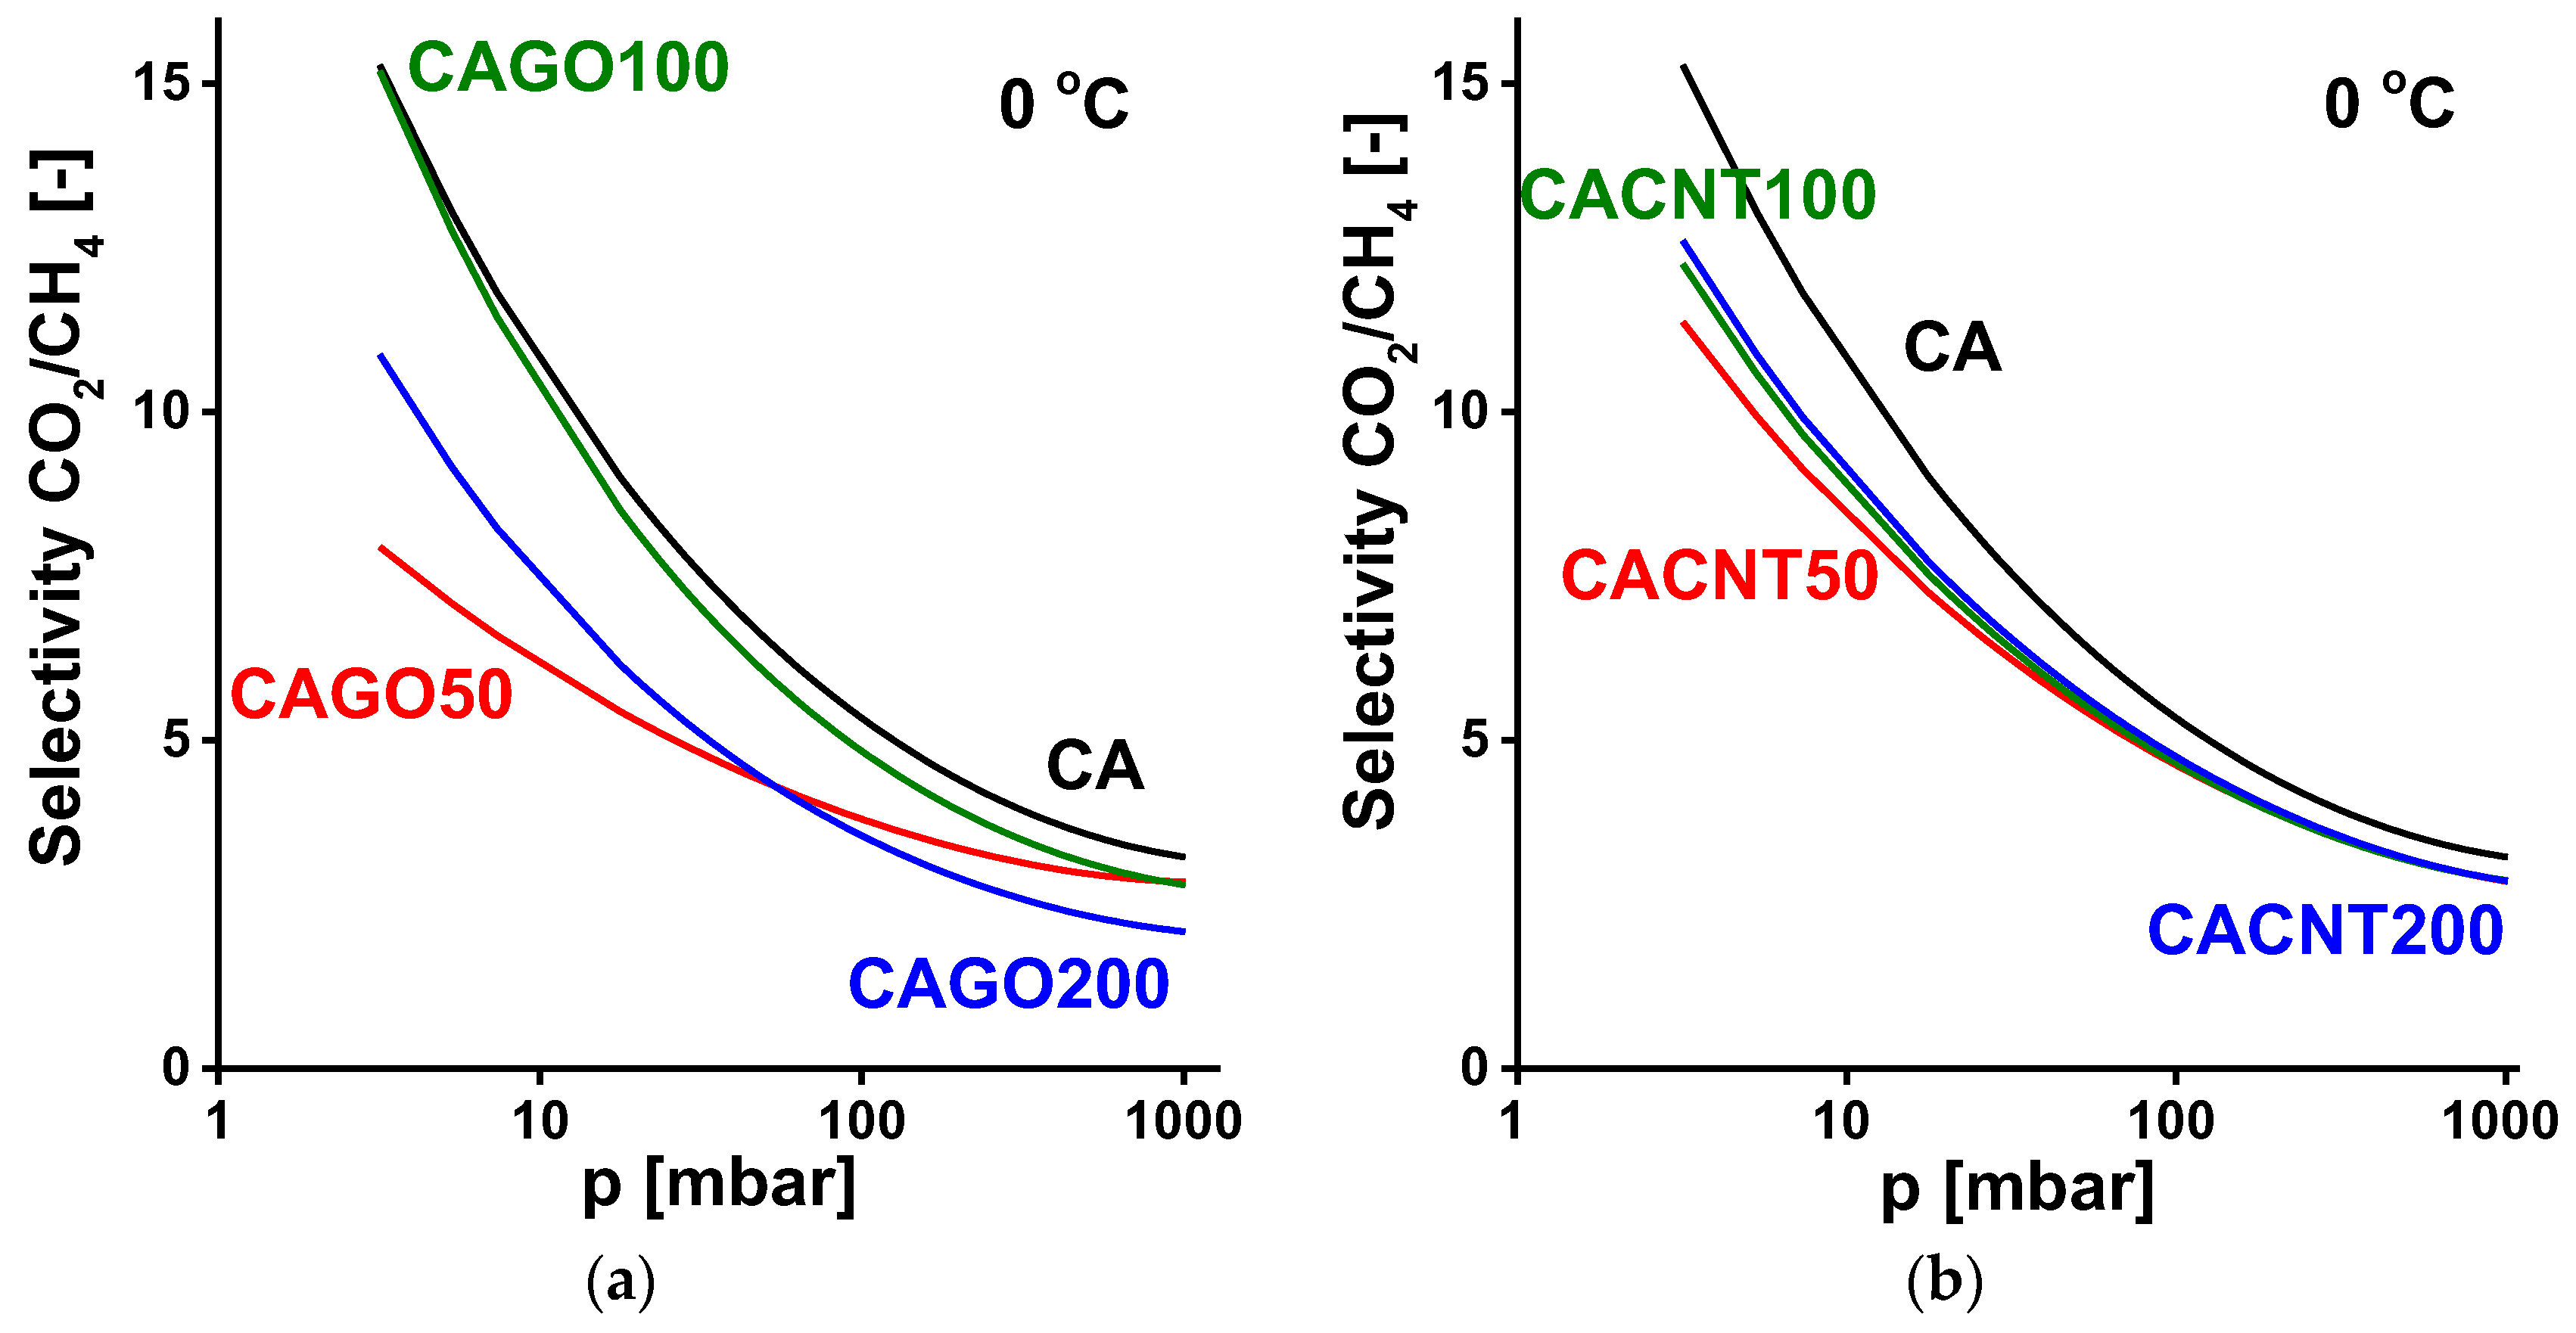
3.2. Gas Storage and Separation Results
4. Conclusions
Author Contributions
Funding
Data Availability Statement
Acknowledgments
Conflicts of Interest
References
- Titirici, M.M.; White, R.J.; Falco, C.; Sevilla, M. Black perspectives for a green future: Hydrothermal carbons for environment protection and energy storage. Energy Environ. Sci. 2012, 5, 6796–6822. [Google Scholar] [CrossRef]
- Karimi, M.; Shirzad, M.; Silva, J.A.C.; Rodrigues, A.E. Biomass/Biochar carbon materials for CO2 capture and sequestration by cyclic adsorption processes: A review and prospects for future directions. J. CO2 Util. 2022, 57, 101890. [Google Scholar] [CrossRef]
- Praveen Kumar, D.; Ramesh, D.; Karuppasamy Vikraman, V.; Subramanian, P. Synthesis of carbon molecular sieves from agricultural residues: Status, challenges and prospects. Environ. Res. 2022, 214, 114022. [Google Scholar] [CrossRef] [PubMed]
- Rehman, A.; Nazir, G.; Rhee, K.Y.; Park, S.J. A rational design of cellulose-based heteroatom-doped porous carbons: Promising contenders for CO2 adsorption and separation. J. Chem. Eng. 2021, 420, 130421. [Google Scholar] [CrossRef]
- Tan, Y.; Wang, X.; Song, S.; Sun, M.; Xue, Y.; Yang, G. Preparation of nitrogen-doped cellulose-based porous carbon and its carbon dioxide adsorption properties. ACS Omega 2021, 6, 24814–24825. [Google Scholar] [CrossRef] [PubMed]
- Onyestyák, G.; László, K.; Rees, L.V.C. Molecular sieve honeycomb for air separation from Picea abies. Helv. Chim. Acta 2004, 87, 1888–1893. [Google Scholar] [CrossRef]
- Alhwaige, A.A.; Agag, T.; Ishida, H.; Qutubuddin, S. Biobased chitosan hybrid aerogels with superior adsorption: Role of graphene oxide in CO2 capture. RSC Adv. 2013, 3, 16011–16044. [Google Scholar] [CrossRef]
- Shi, S.; Ochedi, F.O.; Cui, S.; Liu, Y. Removal of CO2 from flue gas using seaweed porous carbons prepared by urea doping and KOH activation. Energy Fuels 2020, 34, 16411–16422. [Google Scholar] [CrossRef]
- Yang, M.; Ma, C.; Xu, M.; Wang, S.; Xu, L. Recent advances in CO2 adsorption from air: A review. Curr. Pollut. Rep. 2019, 5, 272–293. [Google Scholar] [CrossRef]
- Lee, T.S.; Cho, J.H.; Chi, S.H. Carbon dioxide removal using carbon monolith as electric swing adsorption to improve indoor air quality. Build. Environ. 2015, 92, 209–221. [Google Scholar] [CrossRef]
- Zhang, Z.; Zhou, J.; Xing, W.; Xue, Q.; Tan, Z.; Zhuo, S.; Qiao, S.Z. Critical role of small micropores in high CO2 uptake. Phys. Chem. Chem. Phys. 2013, 15, 2523–2529. [Google Scholar] [CrossRef] [PubMed]
- Villalobos, L.F.; Babu, D.J.; Hsu, K.-J.; Van Goethem, C.; Agrawal, K.V. Gas separation membranes with atom-thick nanopores: The potential of nanoporous single-layer graphene. Acc. Mater. Res. 2022, 3, 1073–1087. [Google Scholar] [CrossRef] [PubMed]
- Zhu, L.; Shen, D.; Luo, K.H. A critical review on VOCs adsorption by different porous materials: Species, mechanisms and modification methods. J. Hazard Mater. 2020, 389, 122102. [Google Scholar] [CrossRef] [PubMed]
- Jia, X.; Xu, S.; Cong, Y. Kinetics of spontaneous liquid-gas imbibition in carbon molecular sieves used for O2/N2 separation. Microporous Mesoporous Mater. 2017, 241, 185–191. [Google Scholar] [CrossRef]
- Mohamed, A.R.; Mohammadi, M.; Darzi, G.N. Preparation of carbon molecular sieve from lignocellulosic biomass: A review. Renew. Sustain. Energy Rev. 2010, 14, 1591–1599. [Google Scholar] [CrossRef]
- Villar-Rodil, S.; Navarrete, R.; Denoyel, R.; Albiniak, A.; Paredes, J.I.; Martínez-Alonso, A.; Tascón, J.M.D. Carbon molecular sieve cloths prepared by chemical vapour deposition of methane for separation of gas mixtures. Microporous Mesoporous Mater. 2005, 77, 109–118. [Google Scholar] [CrossRef]
- Marsh, H. Rodríguez Reinoso: Activated Carbon; Elsevier: Amsterdam, The Netherlands, 2006. [Google Scholar] [CrossRef]
- Muhammad, R.; Nah, Y.-C.; Oh, H. Spider silk-derived nanoporous activated carbon fiber for CO2 capture and CH4 and H2 storage. J. CO2 Util. 2023, 69, 102401. [Google Scholar] [CrossRef]
- Sevilla, M.; Al-Jumialy, A.S.M.; Fuertes, A.B.; Mokaya, R. Optimization of the pore structure of biomass-based carbons in relation to their use for CO2 capture under low- and high-pressure regimes. ACS Appl. Mater. Interfaces 2018, 10, 1623–1633. [Google Scholar] [CrossRef]
- Blankenship, T.S.; Balahmar, N.; Mokaya, R. Oxygen-rich microporous carbons with exceptional hydrogen storage capacity. Nat. Commun. 2017, 8, 1545. [Google Scholar] [CrossRef]
- Park, J.; Attia, N.F.; Jung, M.; Lee, M.; Lee, K.; Chung, J.; Oh, H. Sustainable nanoporous carbon for CO2, CH4, N2, H2 adsorption and CO2/CH4 and CO2/N2 separation. Energy 2018, 158, 9–16. [Google Scholar] [CrossRef]
- Ashourirad, B.; Arab, P.; Verlander, A.; El-Kaderi, H.M. From Azo-linked polymers to microporous heteroatom-doped carbons: Tailored chemical and textural properties for gas separation. ACS Appl. Mater. Interfaces 2016, 8, 8491–8501. [Google Scholar] [CrossRef]
- Wang, X.; Sun, G.; Routh, P.; Kim, D.-H.; Huang, W.; Chen, P. Heteroatom-doped graphene materials: Synthesis, properties and applications. Chem. Soc. Rev. 2014, 43, 7067–7098. [Google Scholar] [CrossRef] [PubMed]
- Sevilla, M.; Falco, C.; Titirici, M.M.; Fuertes, A.B. High-performance CO2 sorbents from algae. RSC Adv. 2012, 2, 12792–12797. [Google Scholar] [CrossRef]
- Liang, J.; Jiao, Y.; Jaroniec, M.; Qiao, S.Z. Sulfur and nitrogen dual-doped mesoporous graphene electrocatalyst for oxygen reduction with synergistically enhanced performance. Angew. Chem. Int. Ed. 2012, 51, 11496–11500. [Google Scholar] [CrossRef]
- Bucior, B.J.; Chen, D.-L.; Liu, J.; Johnson, J.K. Porous carbon nanotube membranes for separation of H2/CH4 and CO2/CH4 mixtures. J. Phys. Chem. C 2012, 116, 25904–25910. [Google Scholar] [CrossRef]
- Li, D.; Jia, Y.; Chang, G.; Chen, J.; Liu, H.; Wang, J.; Hu, Y.; Xia, Y.; Yang, D.; Yao, X. A defect-driven metal-free electrocatalyst for oxygen reduction in acidic electrolyte. Chem 2018, 4, 2345–2356. [Google Scholar] [CrossRef]
- Samaniego Andrade, S.K.; Bakos, I.; Dobos, G.; Farkas, A.; Kiss, G.; Klébert, S.; Madarász, J.; László, K. Biomass related highly porous metal free carbon for gas storage and electrocatalytic applications. Materials 2021, 14, 3488. [Google Scholar] [CrossRef]
- Myers, A.L.; Prausnitz, J.M. Thermodynamics of mixed-gas adsorption. AIChE J. 1965, 11, 121–127. [Google Scholar] [CrossRef]
- Hummers, W.S.; Offeman, R.E. Preparation of graphitic oxide. J. Am. Chem. Soc. 1958, 80, 1339. [Google Scholar] [CrossRef]
- Marcano, D.C.; Kosynkin, D.V.; Berlin, J.M.; Sinitskii, A.; Sun, Z.; Slesarev, A.; Alemany, L.B.; Lu, W.; Tour, J.M. Improved synthesis of graphene oxide. ACS Nano 2010, 4, 4806–4814. [Google Scholar] [CrossRef]
- Tóth, A.; Voitko, K.V.; Bakalinska, O.; Prykhod’ko, G.P.; Bertóti, I.; Gun’ko, V.M.; László, K. Morphology and adsorption properties of chemically modified MWCNT probed by nitrogen, n-propane and water vapor. Carbon 2012, 50, 577–585. [Google Scholar] [CrossRef]
- Brunauer, S.; Emmett, P.H.; Teller, E. Adsorption of gases in multimolecular layers. J. Am. Chem. Soc. 1938, 60, 309–319. [Google Scholar] [CrossRef]
- Dubinin, M.M.; Radushkevich, L.V. The Equation of the characteristic curve of activated charcoal. Dokl. Akad. Nauk. SSSR 1947, 55, 327–329. [Google Scholar]
- Landers, J.; Gor, G.Y.; Neimark, A.V. Density functional theory methods for characterization of porous materials. Colloids Surf. A Physicochem. Eng. 2013, 437, 3–32. [Google Scholar] [CrossRef]
- Bertóti, I.; Mohai, M.; László, K. Surface modification of graphene and graphite by nitrogen plasma: Determination of chemical state alterations and assignments by quantitative X-ray photoelectron spectroscopy. Carbon 2015, 84, 185–196. [Google Scholar] [CrossRef]
- Mohai, M. XPS MultiQuant: Multimodel XPS quantification software. Surf. Interface Anal. 2004, 36, 828–832. [Google Scholar] [CrossRef]
- Evans, S.; Pritchard, R.G.; Thomas, J.M. Relative differential subshell photoionization cross-sections (MgKα) from lithium to uranium. J. Electron. Spectrosc. Relat. Phenom. 1978, 14, 341–358. [Google Scholar] [CrossRef]
- Reilman, R.F.; Msezane, A.; Manson, S.T. Relative intensities in photoelectron spectroscopy of atoms and molecules. J. Electron. Spectrosc. Relat. Phenom. 1976, 8, 389–394. [Google Scholar] [CrossRef]
- Thommes, M.; Kaneko, K.; Neimark, A.V.; Oliver, J.P.; Rodriguez-Reinoso, F.; Rouquerol, J.; Sing, K.S.W. Physisorption of gases, with special reference to the evaluation of surface area and pore size distribution (IUPAC Technical Report). Pure Appl. Chem. 2015, 87, 1051–1069. [Google Scholar] [CrossRef]
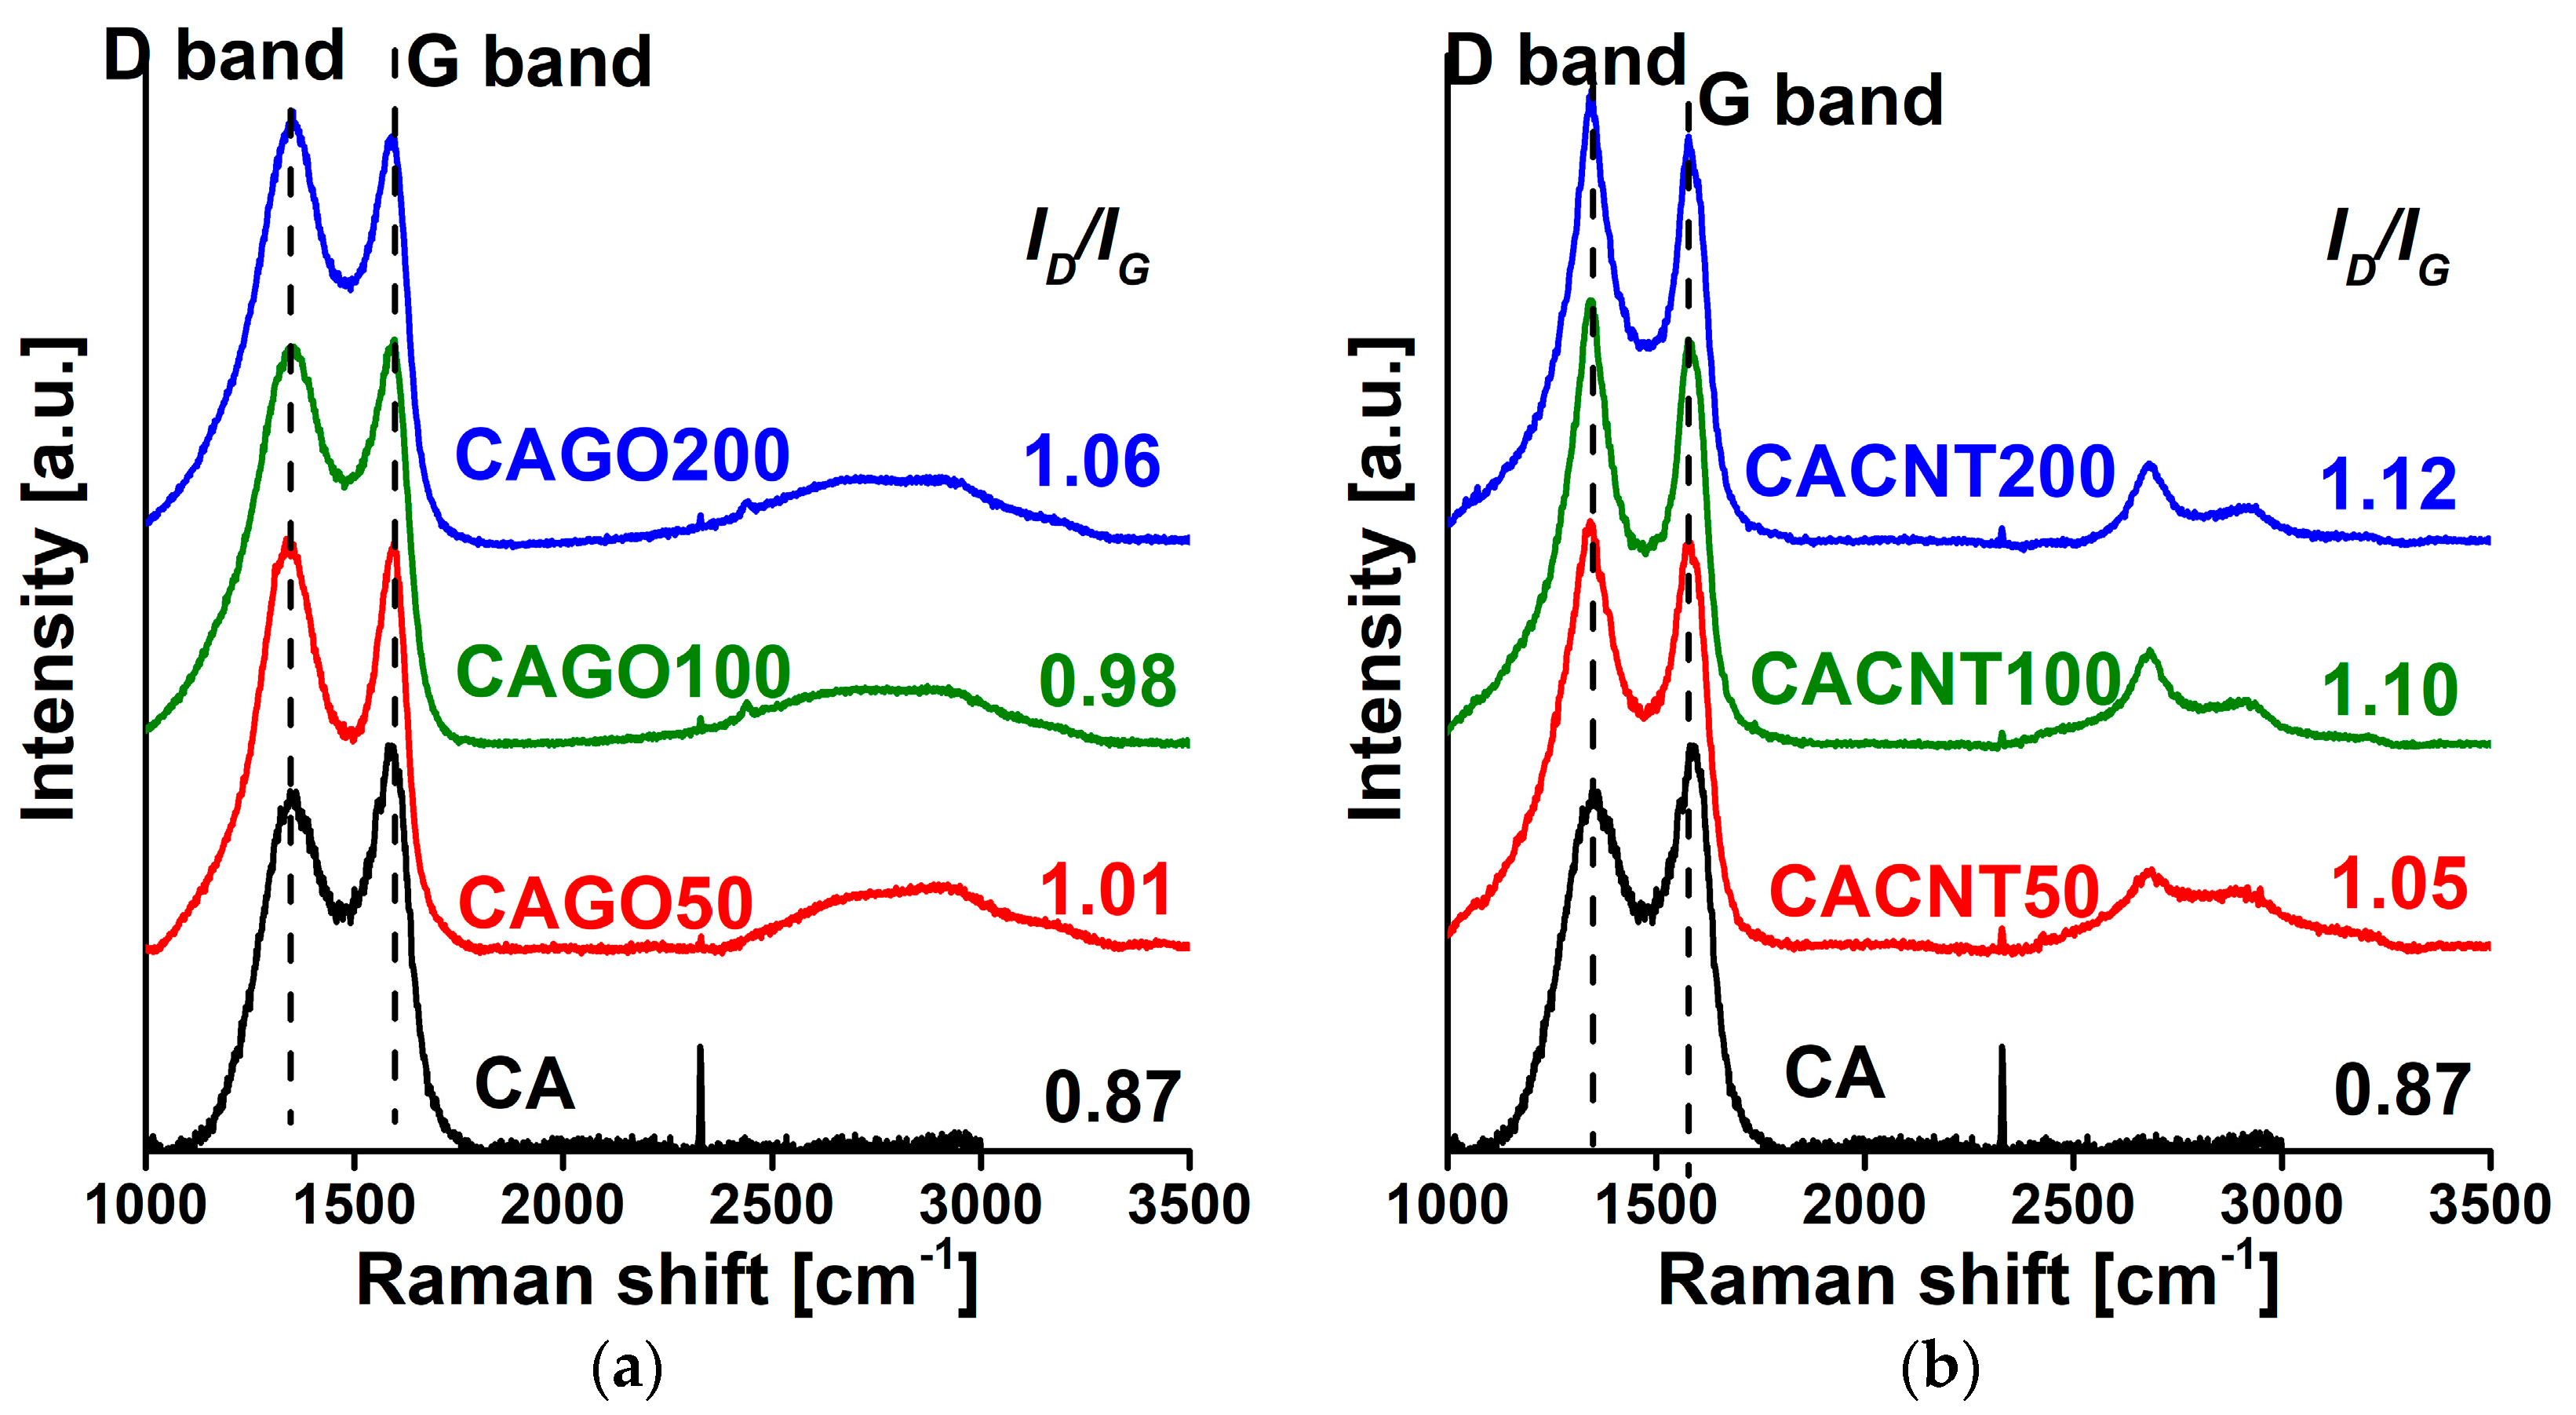
- Wang, Y.; Alsmeyer, D.C.; McCreery, R.L. Raman spectroscopy of carbon materials: Structural basis of observed spectra. Chem. Mater. 1990, 2, 557–563. [Google Scholar] [CrossRef]
- Smith, B.C. Infrared Spectral Interpretation; CRC Press: Boca Raton, FL, USA, 2018. [Google Scholar] [CrossRef]
- Kamran, U.; Park, S.J. Acetic acid-mediated cellulose-based carbons: Influence of activation conditions on textural features and carbon dioxide uptakes. J. Colloid Interface Sci. 2021, 594, 745–758. [Google Scholar] [CrossRef]
- Sips, R. On the structure of a catalyst surface. J. Chem. Phys. 1948, 16, 490–495. [Google Scholar] [CrossRef]
- Sips, R. On the structure of a catalyst surface. II. J. Chem. Phys. 1950, 18, 1024–1026. [Google Scholar] [CrossRef]


| from N2 | from CO2 | ||||||
|---|---|---|---|---|---|---|---|
| Sample | SBET | V0.98 | W0 | Vmeso | Vumicro,DR | Vumicro,DFT | |
| m2/g | cm3/g | cm3/g | % | cm3/g | cm3/g | cm3/g | |
| CA | 1070 | 0.83 | 0.40 | 48 | 0.43 | 0.057 | 0.037 |
| CAGO50 | 1408 | 0.95 | 0.56 | 59 | 0.39 | 0.049 | 0.027 |
| CAGO100 | 1779 | 1.72 | 0.64 | 37 | 1.08 | 0.050 | 0.027 |
| CAGO200 | 933 | 0.71 | 0.34 | 48 | 0.37 | 0.040 | 0.022 |
| CACNT50 | 1169 | 1.07 | 0.43 | 40 | 0.64 | 0.032 | 0.018 |
| CACNT100 | 880 | 0.79 | 0.32 | 41 | 0.47 | 0.028 | 0.016 |
| CACNT200 | 727 | 0.62 | 0.26 | 42 | 0.36 | 0.020 | 0.013 |
| Sample | C | O | N | S | O/C | N/C | S/C | S/N | |
|---|---|---|---|---|---|---|---|---|---|
| CA | 90.6 | 3.3 | 5.1 | 1.0 | 0.036 | 0.056 | 0.011 | 0.104 | 0.196 |
| CAGO50 | 92.0 | 3.1 | 3.7 | 1.3 | 0.034 | 0.039 | 0.014 | 0.087 | 0.361 |
| CAGO100 | 90.7 | 4.1 | 4.1 | 1.2 | 0.045 | 0.045 | 0.013 | 0.104 | 0.293 |
| CAGO200 | 90.4 | 3.7 | 4.4 | 1.4 | 0.041 | 0.049 | 0.015 | 0.105 | 0.318 |
| GO | 67.4 | 32.1 | - | 0.5 | 0.476 | - | 0.007 | 0.484 | - |
| CACNT50 | 91.6 | 4.0 | 3.1 | 1.2 | 0.044 | 0.034 | 0.013 | 0.091 | 0.387 |
| CACNT100 | 91.8 | 3.7 | 3.4 | 1.1 | 0.040 | 0.037 | 0.012 | 0.089 | 0.323 |
| CACNT200 | 92.2 | 4.6 | 1.9 | 1.2 | 0.050 | 0.021 | 0.013 | 0.084 | 0.632 |
| CNT | 94.9 | 5.1 | - | - | 0.054 | - | - | 0.054 | - |
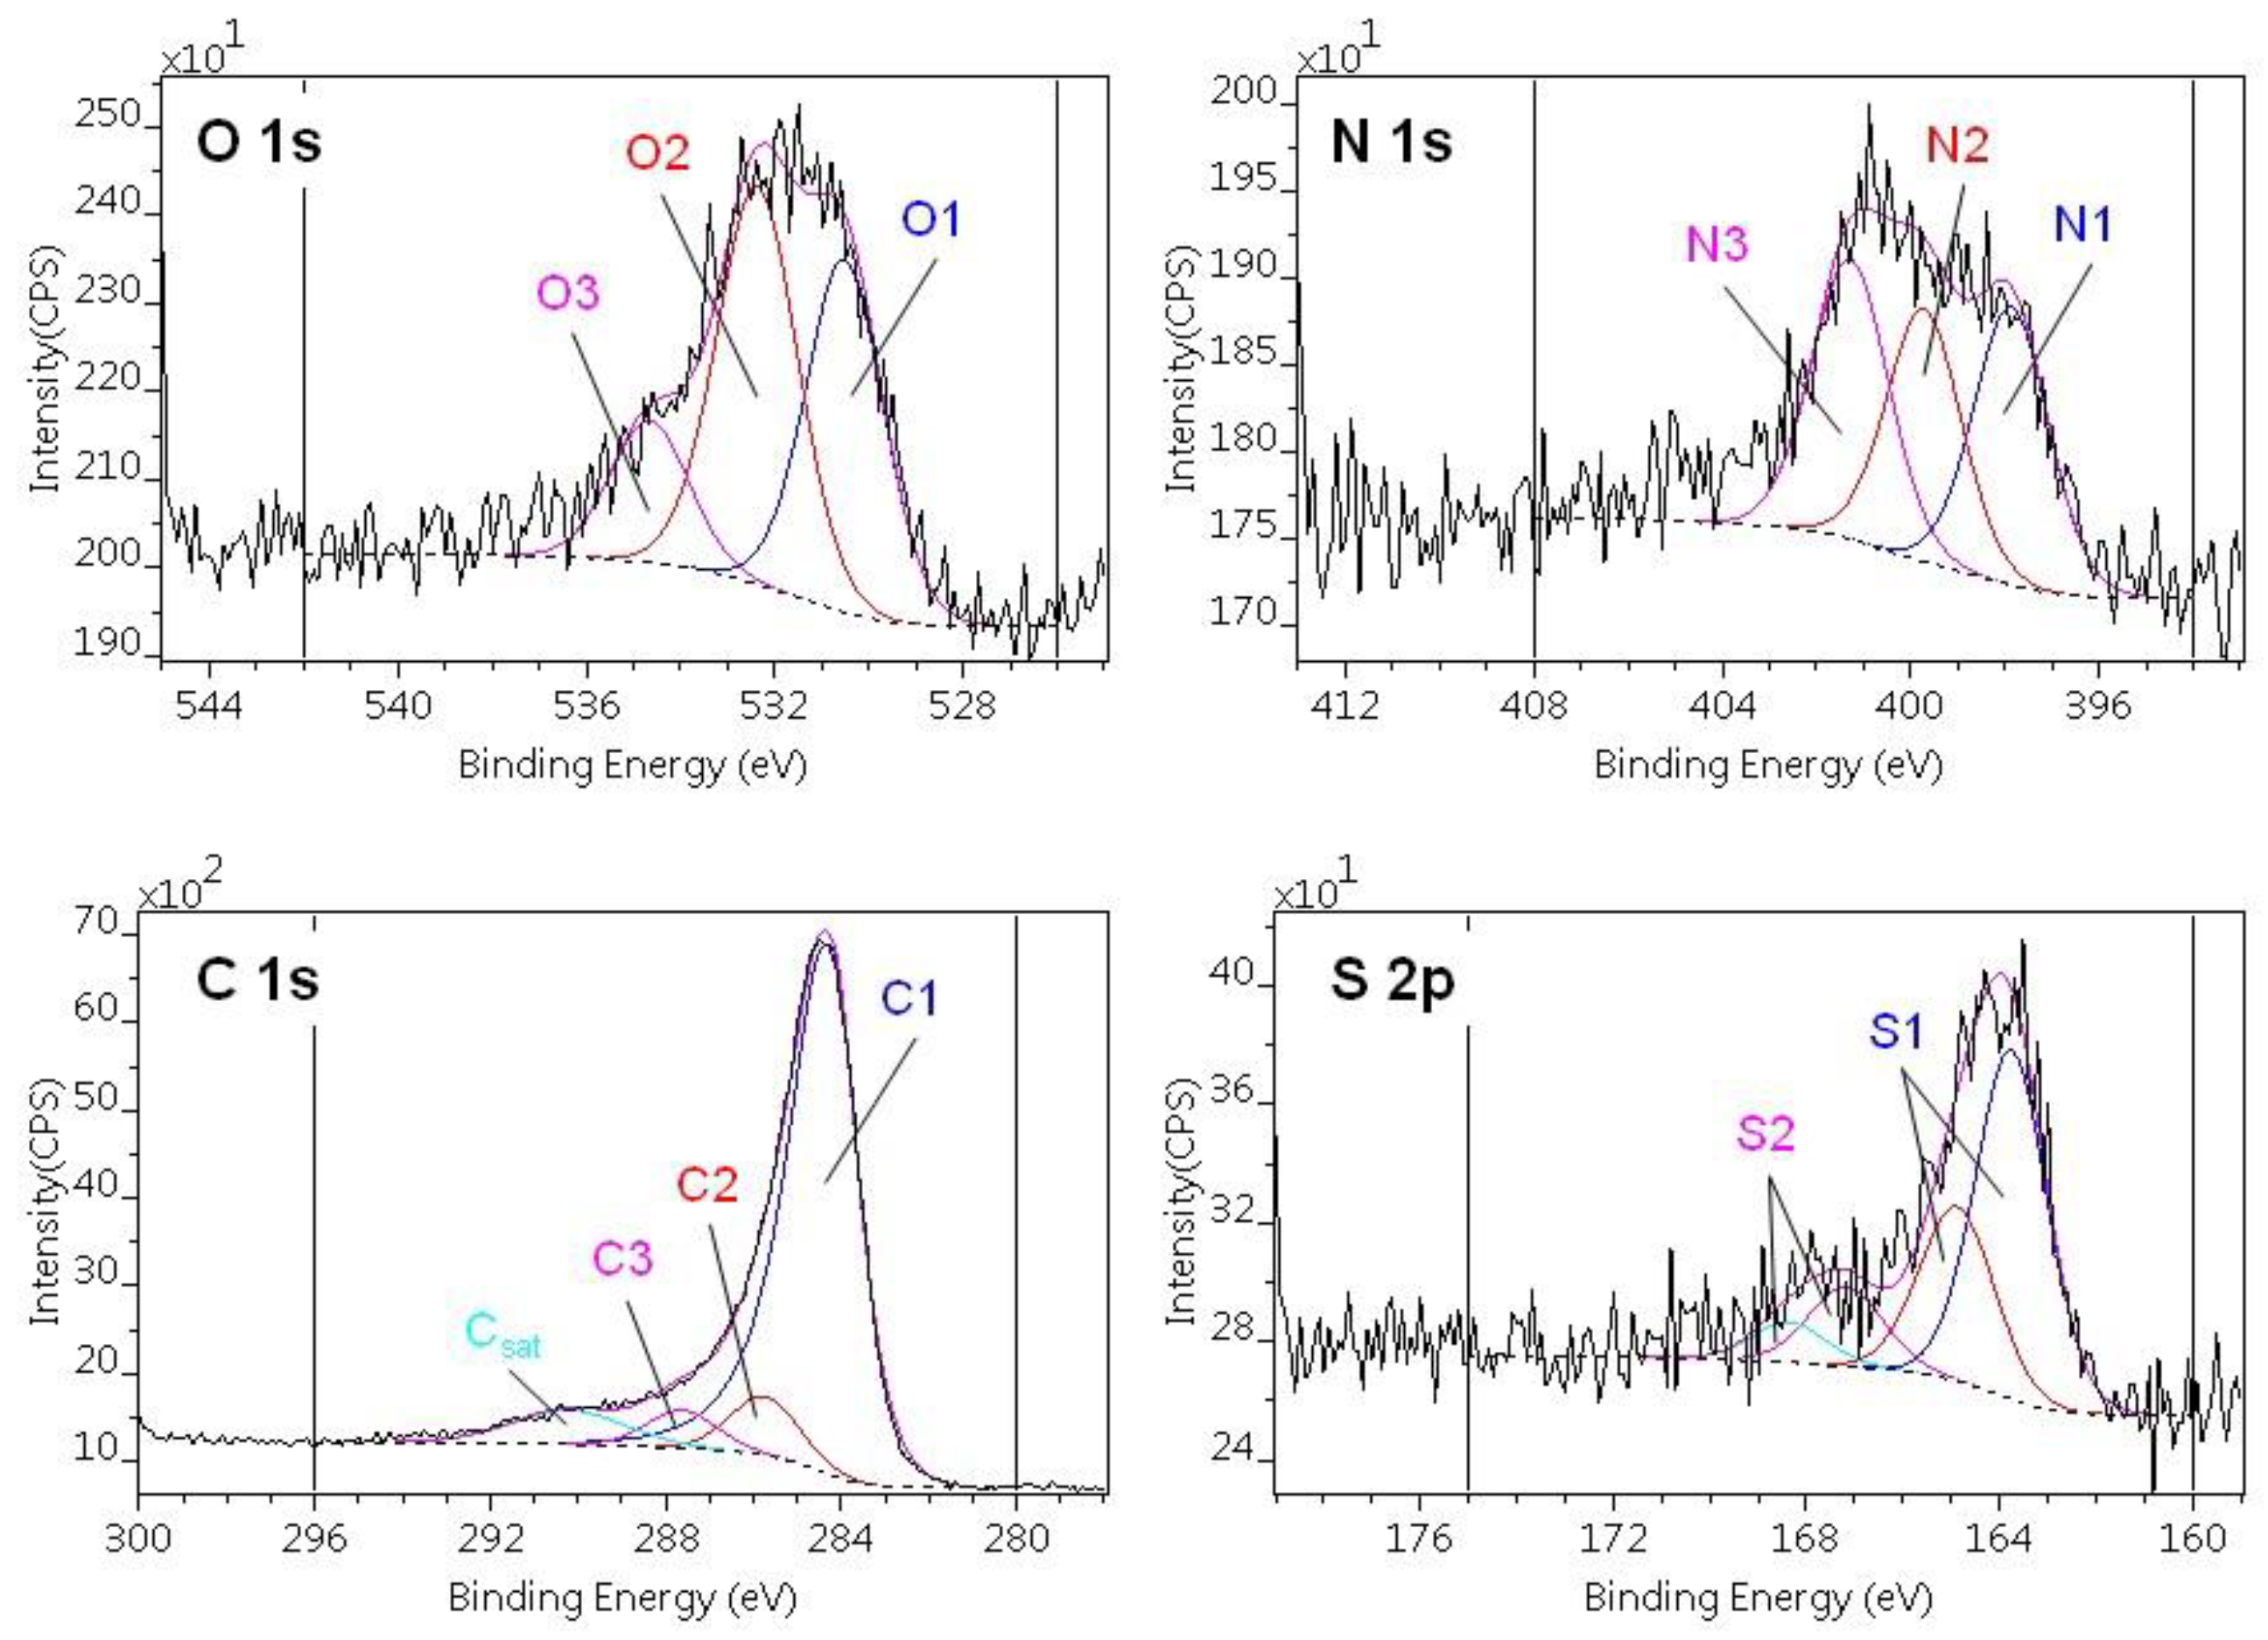
| C1s | O1s | |||||
|---|---|---|---|---|---|---|
| C1 | C2 | C3 | O1 | O2 | O3 | |
| Chemical state | sp2 C=C | C–O C–N C–S | C=O O–C–O N–C–O | S–O | C–O–C C–OH C=O | OC–O–CO (H2O) |
| Binding energy [eV] | 284.3–284.4 | 285.7–285.8 | 287.5–287.9 | 530.2–530.6 | 532.1–532.5 | 533.9–534.3 |
| CA | 74.0 | 10.9 | 5.4 | 1.5 | 1.7 | n.d. |
| CAGO50 | 78.8 | 7.4 | 5.5 | 1.9 | 1.3 | n.d. |
| CAGO100 | 74.7 | 11.0 | 4.8 | 1.8 | 1.7 | 0.7 |
| CAGO200 | 75.9 | 9.4 | 4.8 | 1.8 | 1.6 | 0.5 |
| CACNT50 | 78.6 | 7.8 | 5.1 | 1.6 | 1.9 | 0.7 |
| CACNT100 | 80.5 | 7.4 | 4.5 | 1.3 | 2.0 | 0.7 |
| CACNT200 | 75.7 | 10.8 | 5.5 | 1.7 | 2.3 | 0.9 |
| N1s | S2p | ||||
|---|---|---|---|---|---|
| N1 | N2 | N3 | S1 | S2 | |
| Chemical state | C–N | OO–C–N | C–N+ | C–S | C–SO3 |
| Binding energy [eV] | 397.8–398.0 | 400.4–400.5 | 402.4–402.7 | 164.9–165.0 | 168.3–168.6 |
| CA | 2.3 | 2.3 | 0.8 | 0.9 | 0.2 |
| CAGO50 | 1.6 | 1.7 | 0.6 | 1.2 | n.d. |
| CAGO100 | 1.9 | 1.9 | 0.4 | 1.0 | 0.2 |
| CAGO200 | 2.0 | 2.0 | 0.7 | 1.1 | 0.3 |
| CACNT50 | 1.1 | 1.0 | 1.1 | 1.0 | 0.2 |
| CACNT100 | 0.9 | 0.7 | 0.9 | 1.0 | 0.2 |
| CACNT200 | 0.6 | 0.5 | 0.8 | 0.9 | 0.4 |
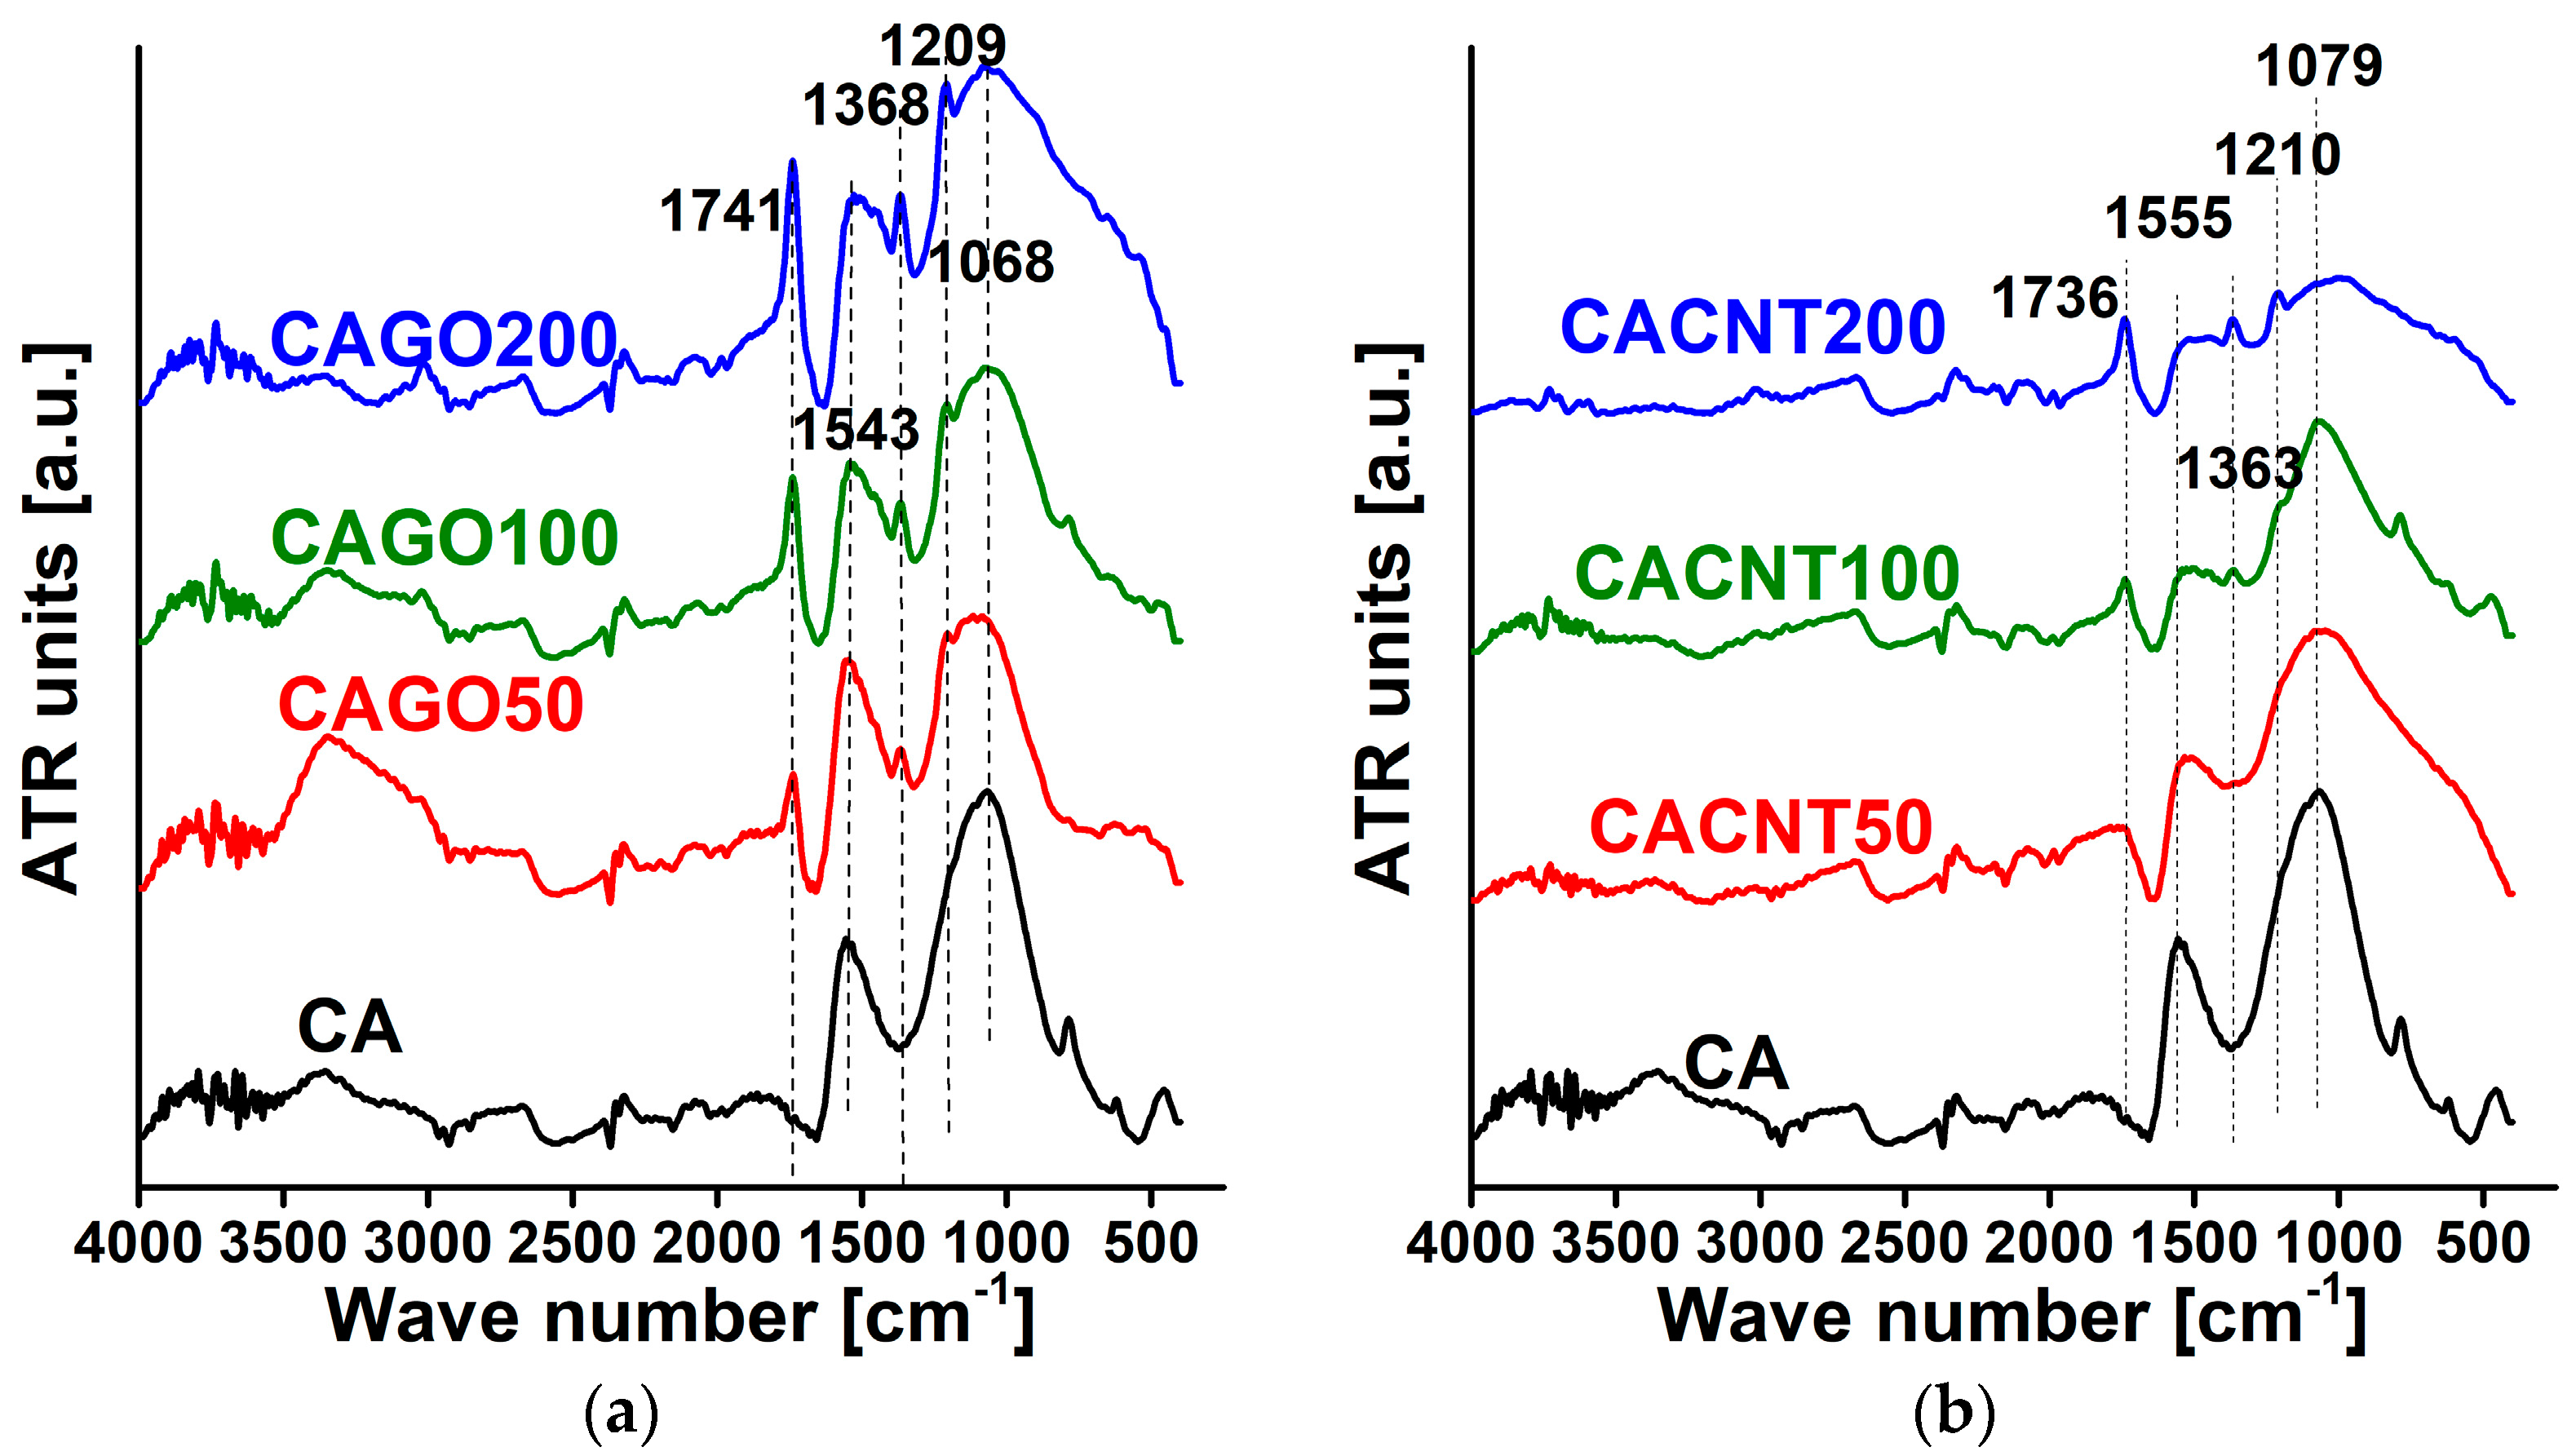
| Wavenumber [cm−1] | Assignation |
|---|---|
| 1750–1705 | aromatic (1730–1705) and aliphatic (1750–1730) C=O stretching |
| 1600–1400 | C=C bond stretching in the aromatic ring |
| 1350 ± 50 | OH in-plane bending of phenol and alcohol groups |
| 1260–1200 | C–O stretching in phenols |
| 1060–1035 | C-O stretching in noncyclic acid anhydrides |
| Sample | C=O/C=C | OH/C=C | C-O(H)/C=C | C-O-C/C=C |
|---|---|---|---|---|
| CA | 0.19 | 0.50 | 1.33 | 1.69 |
| CAGO50 | 0.53 | 0.62 | 1.10 | 1.17 |
| CAGO100 | 0.93 | 0.78 | 1.31 | 1.51 |
| CAGO200 | 1.17 | 1.02 | 1.55 | 1.60 |
| CACNT50 | 0.53 | 0.81 | 1.50 | 1.86 |
| CACNT100 | 0.91 | 1.00 | 1.73 | 2.68 |
| CACNT200 | 1.33 | 1.33 | 1.72 | 1.89 |
| CA | CAGO50 | CAGO100 | CAGO200 | CACNT50 | CACNT100 | CACNT200 | |||
|---|---|---|---|---|---|---|---|---|---|
| −196 °C | N2 | 0.0236 | 0.0254 | 0.0271 | 0.0278 | 0.0297 | 0.0292 | 0.0298 | |
| KH * | 0.151 | 0.284 | 0.338 | 0.156 | 0.213 | 0.152 | 0.140 | ||
| H2 | 0.0978 | 0.106 | 0.108 | 0.0988 | 0.0842 | 0.116 | 0.0870 | ||
| KH | 0.543 | 0.661 | 0.541 | 0.437 | 0.430 | 0.329 | 0.241 | ||
| 0 °C | CO2 | 0.212 | 0.196 | 0.182 | 0.163 | 0.197 | 0.198 | 0.201 | |
| KH | 0.0186 | 0.0166 | 0.0190 | 0.0148 | 0.00950 | 0.00890 | 0.00620 | ||
| CH4 | 0.551 | 0.239 | 0.195 | 0.251 | 0.236 | 0.239 | 0.220 | ||
| KH | 0.00210 | 0.00300 | 0.00210 | 0.00240 | 0.00140 | 0.00120 | 0.000900 |
Disclaimer/Publisher’s Note: The statements, opinions and data contained in all publications are solely those of the individual author(s) and contributor(s) and not of MDPI and/or the editor(s). MDPI and/or the editor(s) disclaim responsibility for any injury to people or property resulting from any ideas, methods, instructions or products referred to in the content. |
© 2023 by the authors. Licensee MDPI, Basel, Switzerland. This article is an open access article distributed under the terms and conditions of the Creative Commons Attribution (CC BY) license (https://creativecommons.org/licenses/by/4.0/).
Share and Cite
Andrade, S.K.S.; Menyhárd, A.; Klébert, S.; Mohai, M.; Nagy, B.; László, K. Effect of Carbon Nanoparticles on the Porous Texture of ι-Carrageenan-Based N-Doped Nanostructured Porous Carbons and Implications for Gas Phase Applications. C 2023, 9, 68. https://doi.org/10.3390/c9030068
Andrade SKS, Menyhárd A, Klébert S, Mohai M, Nagy B, László K. Effect of Carbon Nanoparticles on the Porous Texture of ι-Carrageenan-Based N-Doped Nanostructured Porous Carbons and Implications for Gas Phase Applications. C. 2023; 9(3):68. https://doi.org/10.3390/c9030068
Chicago/Turabian StyleAndrade, Samantha K. Samaniego, Alfréd Menyhárd, Szilvia Klébert, Miklós Mohai, Balázs Nagy, and Krisztina László. 2023. "Effect of Carbon Nanoparticles on the Porous Texture of ι-Carrageenan-Based N-Doped Nanostructured Porous Carbons and Implications for Gas Phase Applications" C 9, no. 3: 68. https://doi.org/10.3390/c9030068
APA StyleAndrade, S. K. S., Menyhárd, A., Klébert, S., Mohai, M., Nagy, B., & László, K. (2023). Effect of Carbon Nanoparticles on the Porous Texture of ι-Carrageenan-Based N-Doped Nanostructured Porous Carbons and Implications for Gas Phase Applications. C, 9(3), 68. https://doi.org/10.3390/c9030068