Article

Assessing the Effect of Intensive Agriculture and Sandy Soil Properties on Groundwater Contamination by Nitrate and Potential Improvement Using Olive Pomace Biomass Slag (OPBS)

1
Laboratory of LAMSE, Faculty of Sciences and Techniques of Tangier, B.P. 416, Tangier 90000, Morocco
2
Research Team: Materials, Environment and Sustainable Development (MEDD), Faculty of Sciences and Techniques of Tangier, B.P. 416, Tangier 90000, Morocco
3
Department of Chemical and Environmental Engineering, University of Seville, Camino de Los Descubrimientos, s/n, 41092 Seville, Spain
*
Author to whom correspondence should be addressed.
Submission received: 25 October 2022 / Revised: 15 December 2022 / Accepted: 20 December 2022 / Published: 22 December 2022
(This article belongs to the Special Issue Biomass—a Renewable Resource for Carbon Materials)

Abstract

:
The relationship between agricultural activities, soil characteristics, and groundwater quality is critical, particularly in rural areas where groundwater directly supplies local people. In this paper, three agricultural sandy soils were sampled and analyzed for physicochemical parameters such as pH, water content, bulk density, electrical conductivity (EC), organic matter (OM), cation exchange capacity (CEC), and soil grain size distribution. Major and trace elements were analyzed by inductively coupled plasma-optical emission spectrometry (ICP/OES) to determine their concentrations in the fine fraction (FF) of the soils. Afterward, the elemental composition of the soils was identified by X-ray powder diffraction (XRD) and quantified by X-ray fluorescence (XRF). The surface soil characteristics were determined by the Brunauer–Emmett–Teller (BET) method, whereas the thermal decomposition of the soils was carried out using thermogravimetric analysis and differential scanning calorimetric (TGA-DSC) measurements. The morphological characteristics were obtained by scanning electron microscopy (SEM). Afterward, column-leaching experiments were conducted to investigate the soil’s retention capacity of nitrate (NO3). Parallelly, a chemical and physical study of olive pomace biomass slag (OPBS) residue was carried out in order to explore its potential use as a soil additive and improver in the R’mel area. The OPBS was characterized by physicochemical analysis, assessed for heavy metals toxicity, and characterized using (XRD, XRF, SEM, and BET) techniques. The results show that the R’mel soils were slightly acidic to alkaline in nature. The soils had a sandy texture with low clay and silt percentage (<5% of the total fraction), low OM content, and weak CEC. The column experiments demonstrated that the R’mel irrigated soils have a higher tendency to release large amounts of nitrate due to their texture and a higher degree of mineralization which allows water to drain quickly. The OPBS chemical characterization indicates a higher alkaline pH (12.1), higher water content (7.18%), and higher unburned carbon portion (19.97%). The trace elements were present in low concentrations in OPBS. Macronutrients in OPBS showed composition rich in Ca, K, and Mg which represent 10.59, 8.24, and 1.56%, respectively. Those nutrients were quite low in soil samples. Both XRD and XRF characterization have shown a quasi-dominance of SiO2 in soil samples revealing that quartz was the main crystalline phase dominating the R’mel soils. Oppositely, OPBS showed a reduced SiO2 percentage of 26,29% while K, Ca, and P were present in significant amounts. These results were confirmed by XRF analysis of OPBS reporting the presence of dolomite (CaMg, (CO3)2), fairchildite (K2Ca (CO3)2), and free lime (CaO). Finally, the comparison between the surface characteristic of OPBS and soils by BET and SEM indicated that OPBS has a higher surface area and pore volume compared to soils. In this context, this study suggests a potential utilization of OPBS in order to (1) increase soil fertility by the input of organic carbon and macronutrients in soil; (2) increase the water-holding capacity of soil; (3) increase soil CEC; (4) stabilize trace elements; (5) enhance the soil adsorption capacity and porosity.

1. Introduction

Soil is one of the most essential elements in life. Its functions are crucial to the ecosystem because it is considered a storehouse of carbon and a food supplier. In addition, healthy soils are a prerequisite for ensuring the ecological ecosystem functions worldwide [1,2]. Moreover, the soil has a primordial role in limiting the intrusion of pollutants in groundwater by acting as a filter [3]. In several irrigated areas, worrying signs of deterioration in water and soil quality have been reported. Agricultural practices directly impact the soil’s physical, chemical, and biological properties [4,5]. The alteration of soil properties has resulted in many environmental problems, such as soil degradation, salinization, waterlogging [6], deforestation and erosion [7], and groundwater contamination. The terms of agriculture conservation must be respected by ensuring the recycling of nutrients, avoiding environmental losses, and reducing the emission of greenhouse gases, whether at the regional or national scale [8]. Nitrogen is an essential macronutrient for healthy plant growth and high-yield production. Nevertheless, the massive use of nitrogenous fertilizers has led to some environmental problems, such as nitrate leaching [9,10]. After N application, crops assimilate their nitrogen needs by absorbing nitrate and ammonium accessible in the soil. The surplus of nitrate exceeds the plants’ demand and soil denitrification capacity [11] and leaches out of the root zone as one of the most common forms of groundwater contamination [12,13]. The leaching of nitrate from the soil is a major problem threatening surface and groundwater quality and therefore human health [14,15]. The nitrate form (NO3) of nitrogen is highly soluble, easily mobile within the soil, and poorly adsorbed by the soil particles. Recent literature shows increasing global concern about the impact of nitrate leaching with regard to the environment, especially in agricultural ecosystems [10]. The nitrate background is determined not to exceed 10 mg/L, and values exceeding this concentration indicate anthropogenic pollution [16]. The factors influencing the leaching of nitrate from the soil are numerous. Still, the most important remains the nature of the soil (the content of clay, silt, and organic matter), the irrigation and precipitation rates, the dose of fertilizers, and the temperature.
The soil texture is the most important determining factor influencing the vertical movement of contaminants through the soil. In coarse-textured sandy soils, the voids between soil particles are large in volume, allowing water to flow quickly through the unsaturated zone and reach groundwater. Huang and Hartemink [17] reported that sandy soils often have high hydraulic conductivity, gas permeability, and specific heat, but low field capacity, permanent wilting point, organic carbon, and cation exchangeable capacity. Therefore, filtration or natural water treatment takes a minimal amount of time. On the contrary, in fine-textured soils such as clays, the movement of water and contaminants through the soil is prolonged, which gives the clay minerals the time to adsorb pollutants and allows bacteria and other microorganisms to degrade contaminants before reaching the groundwater. Furthermore, the groundwater level can vary considerably from season to season, depending mainly on the infiltration rates. Consequently, the percentage of clay could be a deterministic factor affecting groundwater, especially in agricultural areas.
The soil characteristics could be determined using several characterization techniques. Simultaneous use of thermogravimetric analysis (TGA) and differential scanning calorimetry (DSC) in combination or association with XRD and other chemical analyses could be used for the quantitative determination of a particular mineral or the estimation of the total mineralogical composition [18]. Indeed, the knowledge of soil characteristics using different techniques (SEM, XRF, XRD, BET, TGA/DSC) allows the determination of the soil texture and its influence on the mobility, adsorption, and leaching rates of pollutants. The study of soil characteristics in agricultural areas could help decision-makers and scientists in understanding the processes that might reduce groundwater pollution. Parallelly, proposing low-cost solutions for soil remediation and optimization might be beneficial to the environment, especially in sandy soils. Many approaches and strategies are already in place to address soil pollution issues. Soil remediation techniques and their applicability (e.g., in situ or ex situ) differ according to the type of contamination, the method of treatment (physical, chemical, or bioremediation), and the cost-effectiveness of treatment [19]. Nanomaterial is a novel technology that is quickly evolving and expanding its domains of application in all areas of research [20,21]. Yaqoob et al. [22] noted that nanoparticles have become the most appealing and widely employed materials for a wide range of applications including agriculture and wastewater treatment. Nowadays, nanotechnology has the potential to offer solutions for agricultural challenges such as boosting nutrient utilization efficiency, mitigating heavy metal toxicity, and efficiently improving soil fertility [23,24]. Alessandrino et al. [25] investigated the ability of graphene to reduce the concentration of nitrate in sandy soils and concluded that, unlike other soil improvers, graphene can stimulate the denitrification process in soil. The use of biochar in reducing soil contamination has been extensively studied during the last years [26,27,28,29]. Due to their higher cation exchange capacity, complexation, precipitation, physisorption, and electrostatic interaction, alkaline substances such as cement, lime, fly ash, steel slag, and blast furnace slag are excellent stabilizers for soil contaminants [30,31]. Das et al. [32] highlighted the importance of reusing steel slag (steel processing by-products) to increase crop productivity and soil fertility, reduce greenhouse gas emissions, and stabilize heavy metals in contaminated soils. Liyun et al. [33] reported that steel slag is efficient for nitrate removal and might be used to decrease nitrate leaching from the soil. The fast growth of biomass power plants has resulted in massive amounts of ashes and slags [34]. The application of biomass ash and slag to agricultural soils is now largely recognized as the most efficient way for recycling these residues [35].
The groundwater resources in the Loukkos region are well known for their low quality resulting mainly from intensive farming activities. The sandy nature of the soil, the intensive use of fertilizers, and the shallow aquifer make the R’mel groundwater sensitive to physicochemical contamination. This vulnerability becomes more problematic as long as the area provides water intended for human consumption. According to Tanji et al. [36], in the same study area, 25 groundnut farmers used extensively six nitrogenous fertilizers with an average of 350 Kg/ha. Such excessive nitrogenous applications are unacceptable since the majority of these effluents would immediately infiltrate groundwater. Moreover, previous studies have reported the contamination of public drinking wells by higher concentrations of nitrate and pesticide residues in this region [37,38,39]. Contrariwise, no studies aim to explain the influence of soil properties on groundwater contamination by nitrate in this perimeter.
In this study, agricultural sandy soils were analyzed for physicochemical parameters and characterized in order to investigate the influence of soil properties and intensive farming on nitrate leaching and to determine the nitrate-retention capacity in sandy soils through column experiments. In addition, the authors proposed the potential utilization of biomass slag (BS) formed during the combustion of olive pomace as a soil additive and improver. To explore the physical and chemical properties of this residual material, the olive pomace biomass slag (OPBS) was evaluated for physicochemical parameters and heavy metal toxicity and characterized using different techniques (ICP/OES, XRD, XRF, BET, and SEM).

2. Materials and Methods

2.1. Presentation of the Study Area

The Loukkos perimeter is located in the northwest of Morocco between Rabat, the capital, and Tangier. The Loukkos perimeter covers an area of 256,000 Ha, with a large-scale irrigated part of 27,000 Ha. It includes the alluvial plains, located at different altitudes, the plateaus, and the roughly tortuous hills. The study area can be classified as the Mediterranean climate, characterized by a sub-humid and temperate winter and by a hot and dry summer.
The surface water resources of the region are dominated by the Lokkous River, the most important river in the area. The hydrological regime of the Lokkous is pluvial and characterized by a strong inter-annual irregularity. A strong irregularity marks the seasonal distribution of the inputs during January and February. The villages and urban centers Ksar el Kébir and Larache are experiencing rapid growth caused by the success of the development of irrigated areas. This growth has generated an increase in various industries. However, the socio-economic infrastructure is not developing quickly due to inadequate planning and financial and human resources. This lack has generated negative repercussions on the environment of the region. It has led to the spread of unsanitary housing, especially in the surrounding rural areas, which poses health and environmental problems.

2.2. The R’mel Groundwater

The R’mel aquifer, located south of Larache city along the Atlantic coast, constitutes an essential groundwater tank. It varies originally and seasonally from good chemical quality to very poor quality. The R’mel aquifer is shallow in the south, where the level is roughly 5 m below the ground. The water table in the north and the littoral zone varies between 15 and 20 m. It is used to supply drinking, industrial, and irrigation water. The drinking water supply is done by individual, artesian, or surface wells. The R’mel aquifer is experiencing intensive pumping to supply drinking water to the rural inhabitants and for the irrigation of agricultural lands. The R’mel aquifer is mainly fed by precipitation and irrigation water. The phenomenon of the water table upwelling, observed at the level of the R’mel plateau, is mainly due to the over-irrigation and the lack of a suitable drainage system.
In the region of R’mel, the sandy-textured plateaus have an excessively low water-retention capacity and limited fertility. As a result, the R’mel region has become more exposed to pollution by several pollutants deriving from the expansive use of inorganic fertilizers and pesticides. Because of the excessive groundwater pumping, the problem of seawater intrusion is another growing concern in the region. Legislative and regulatory dispositions on soil and their protection within the irrigated areas are few and scattered. A large part of R’mel lands has been developed for crops under rotations and sprinkler irrigation. The aspect of crop rotation in the R’mel region has resulted in maximum use of the soil and water. Hmamou and Bounakaya [40] pointed out that water resources in the R’mel region have become insufficient to meet irrigation and other needs on agricultural land. Added to this is farmers’ lack of understanding regarding the excessive spread of fertilizers and pesticides in the R’mel area.

2.3. Sample Collection and Preparation

Soil samples were collected from the R’mel agricultural area within the Loukkos perimeter located in the northwest of Morocco between the city of Tangier and Rabat. The samples were taken from three agricultural fields cultivated for potatoes and strawberries. The three chosen cities were recently fertilized. The sampling was carried out manually using a shovel at a level between 0 and 30 cm from the surface of the fields. For each of the three sites, a quantity in the order of 5–8 kg was taken. The samples were dried, sieved to 2 mm, and preserved immediately at a temperature below 4 °C in polyethylene plastic bags.

2.4. Soil Sample Analysis

Soil samples were dried at room temperature and then sieved using a vertical sieving machine to separate and sort grain-size fractions. The pH was measured following METHOD 9045D. Loss on ignition (LOI) analysis was used to determine the organic matter content (%OM) of the three soil samples. The colorimetric molybdenum blue method was used to determine the available phosphorus in soil samples as orthophosphate after digestion by HNO3-HCL 1:3 (v/v). The cation exchange capacity (CEC) is related to the soil’s clay and organic matter content. This measurement makes it possible to know the total quantity of exchangeable cations (K+, Ca2+, Mg2+, Na+, H+, etc.) tending to retain the nutrients and phytosanitary products available to plants. The CEC of the soils was determined using the Metson method [41], which is based on the extraction of cations by 1N ammonium acetate at pH 7.0.
Major elements such as Ca, Fe, K, Mg, and Na, and heavy metals such as, Cd, Co, Cr, Cu, Mn, Mo, Ni, Pb, Se, Ti, and Zn were determined in the fine fraction of the soil (<63 µm fraction) using inductively coupled plasma–optical emission spectroscopy (ICP-OES, Agilent 5100, Tokyo, Japan). Analysis was performed after acid digestion (HNO3-HCL 1:3 (v/v)) using a DigiPREP blocks digestion and heating system (SCP Science, Montreal, QC, Canada). The concentrations of heavy metals were expressed on a dry mass basis (mg/kg). Given that the sampled soils were characterized by a coarse texture mainly dominated by sand particles, trace elements and macronutrients were analyzed on the fraction below 63 µm. From another point of view, the objective of analyzing the fine fraction of the soil despite its low percentage is to give an idea about the role of the silty and clayey fraction in the retention of heavy metals in sandy soils.

2.5. Olive Pomace Biomass Slag (OPBS)

During biomass combustion, two types of waste are generated: bottom ash or slag and fly ash. Biomass slag comprises the coarser fraction of ash produced on the grate in the primary combustion chamber. The residual ash forms molten aggregates that are not transported out of the burner grate and/or furnace, thus forming slag [42]. The presence of alkali metals in biomass decreases the melting point of ash, allowing for faster slag formation [43]. The biomass slag is often mixed with mineral impurities contained in biomass fuel, such as sand, stones, and mud, or with bedding material in fluidized bed combustion plants. These impurities can be mineral, especially in fixed-bed combustion plants, and give rise to slag formation (due to a lowering of the melting point) and the presence of sintered ash particles in the bottom ash. In this study, biomass slag residue was sampled from a biomass-fired power plant for the combustion of olive pomace (Figure 1). The raw biomass slag residue was air dried at room temperature, crashed manually, and then sieved at 2 mm mesh size. The pH of the OPBS was measured following the 9045D method using a Thermo Orion pH meter (Waltham, MA USA) equipped with a low-sodium-error electrode. For trace-element determination in the OPBS, the sample was digested by HNO3-HCL 1:3 (v/v) using a DigiPREP blocks digestion and heating system. The leached trace elements were analyzed by direct injection in (ICP/OES). The moisture content or humidity percentage in the OPBS was calculated by measuring the loss in weight after drying the sample at 105 °C for 24 h. The unburned carbon fraction in the collected Biomass Slag was quantified by the loss on ignition (LOI) method.

2.6. Soil and Olive Pomace Biomass Slag (OPBS) Characterization

Various characterization techniques were used in this study in order to compare the physical and chemical properties of soil samples and OPBS. The Brunauer–Emmett–Teller (BET) analysis was used to determine the adsorption characteristics such as N adsorption–desorption curves, specific surface area, and porosity of the soils and (OPBS) under N2 adsorption at 77 K using the Micromeritics Tristar II 3020 Surface Area Analyzer (Micromeritics Instr. Corps., Norcross, GA, USA). Scanning electron microscopy (SEM) was employed to determine the morphology of the soil samples and OPBS using a (SEM, Hitachi, Tokyo, Japan, S-4800). At the same time, an x-ray fluorescence spectrometer (XRF, PANalytical Axios FAST simultaneous WDXRF, Malvern PANalytical Ltd., Almelo, The Netherlands) was used to determine the mineral composition of the fine-soil fraction (<63 µm fraction) and OPBS. The crystalline phases of the soil’s complete fraction and OPBS were determined by X-ray diffraction (XRD) using an X-ray diffractometer PANalytical X’Pert Pro (Malvern PANalytical Ltd., Almelo, The Netherlands). Thermo-gravimetric and differential calorimetric scanning TGA/DCS analysis of the soil’s fine and complete fractions was carried out using an SDT Q600 V20.9 Build 20 (TA Instruments, Newcastle, DE, USA).

2.7. Column Study

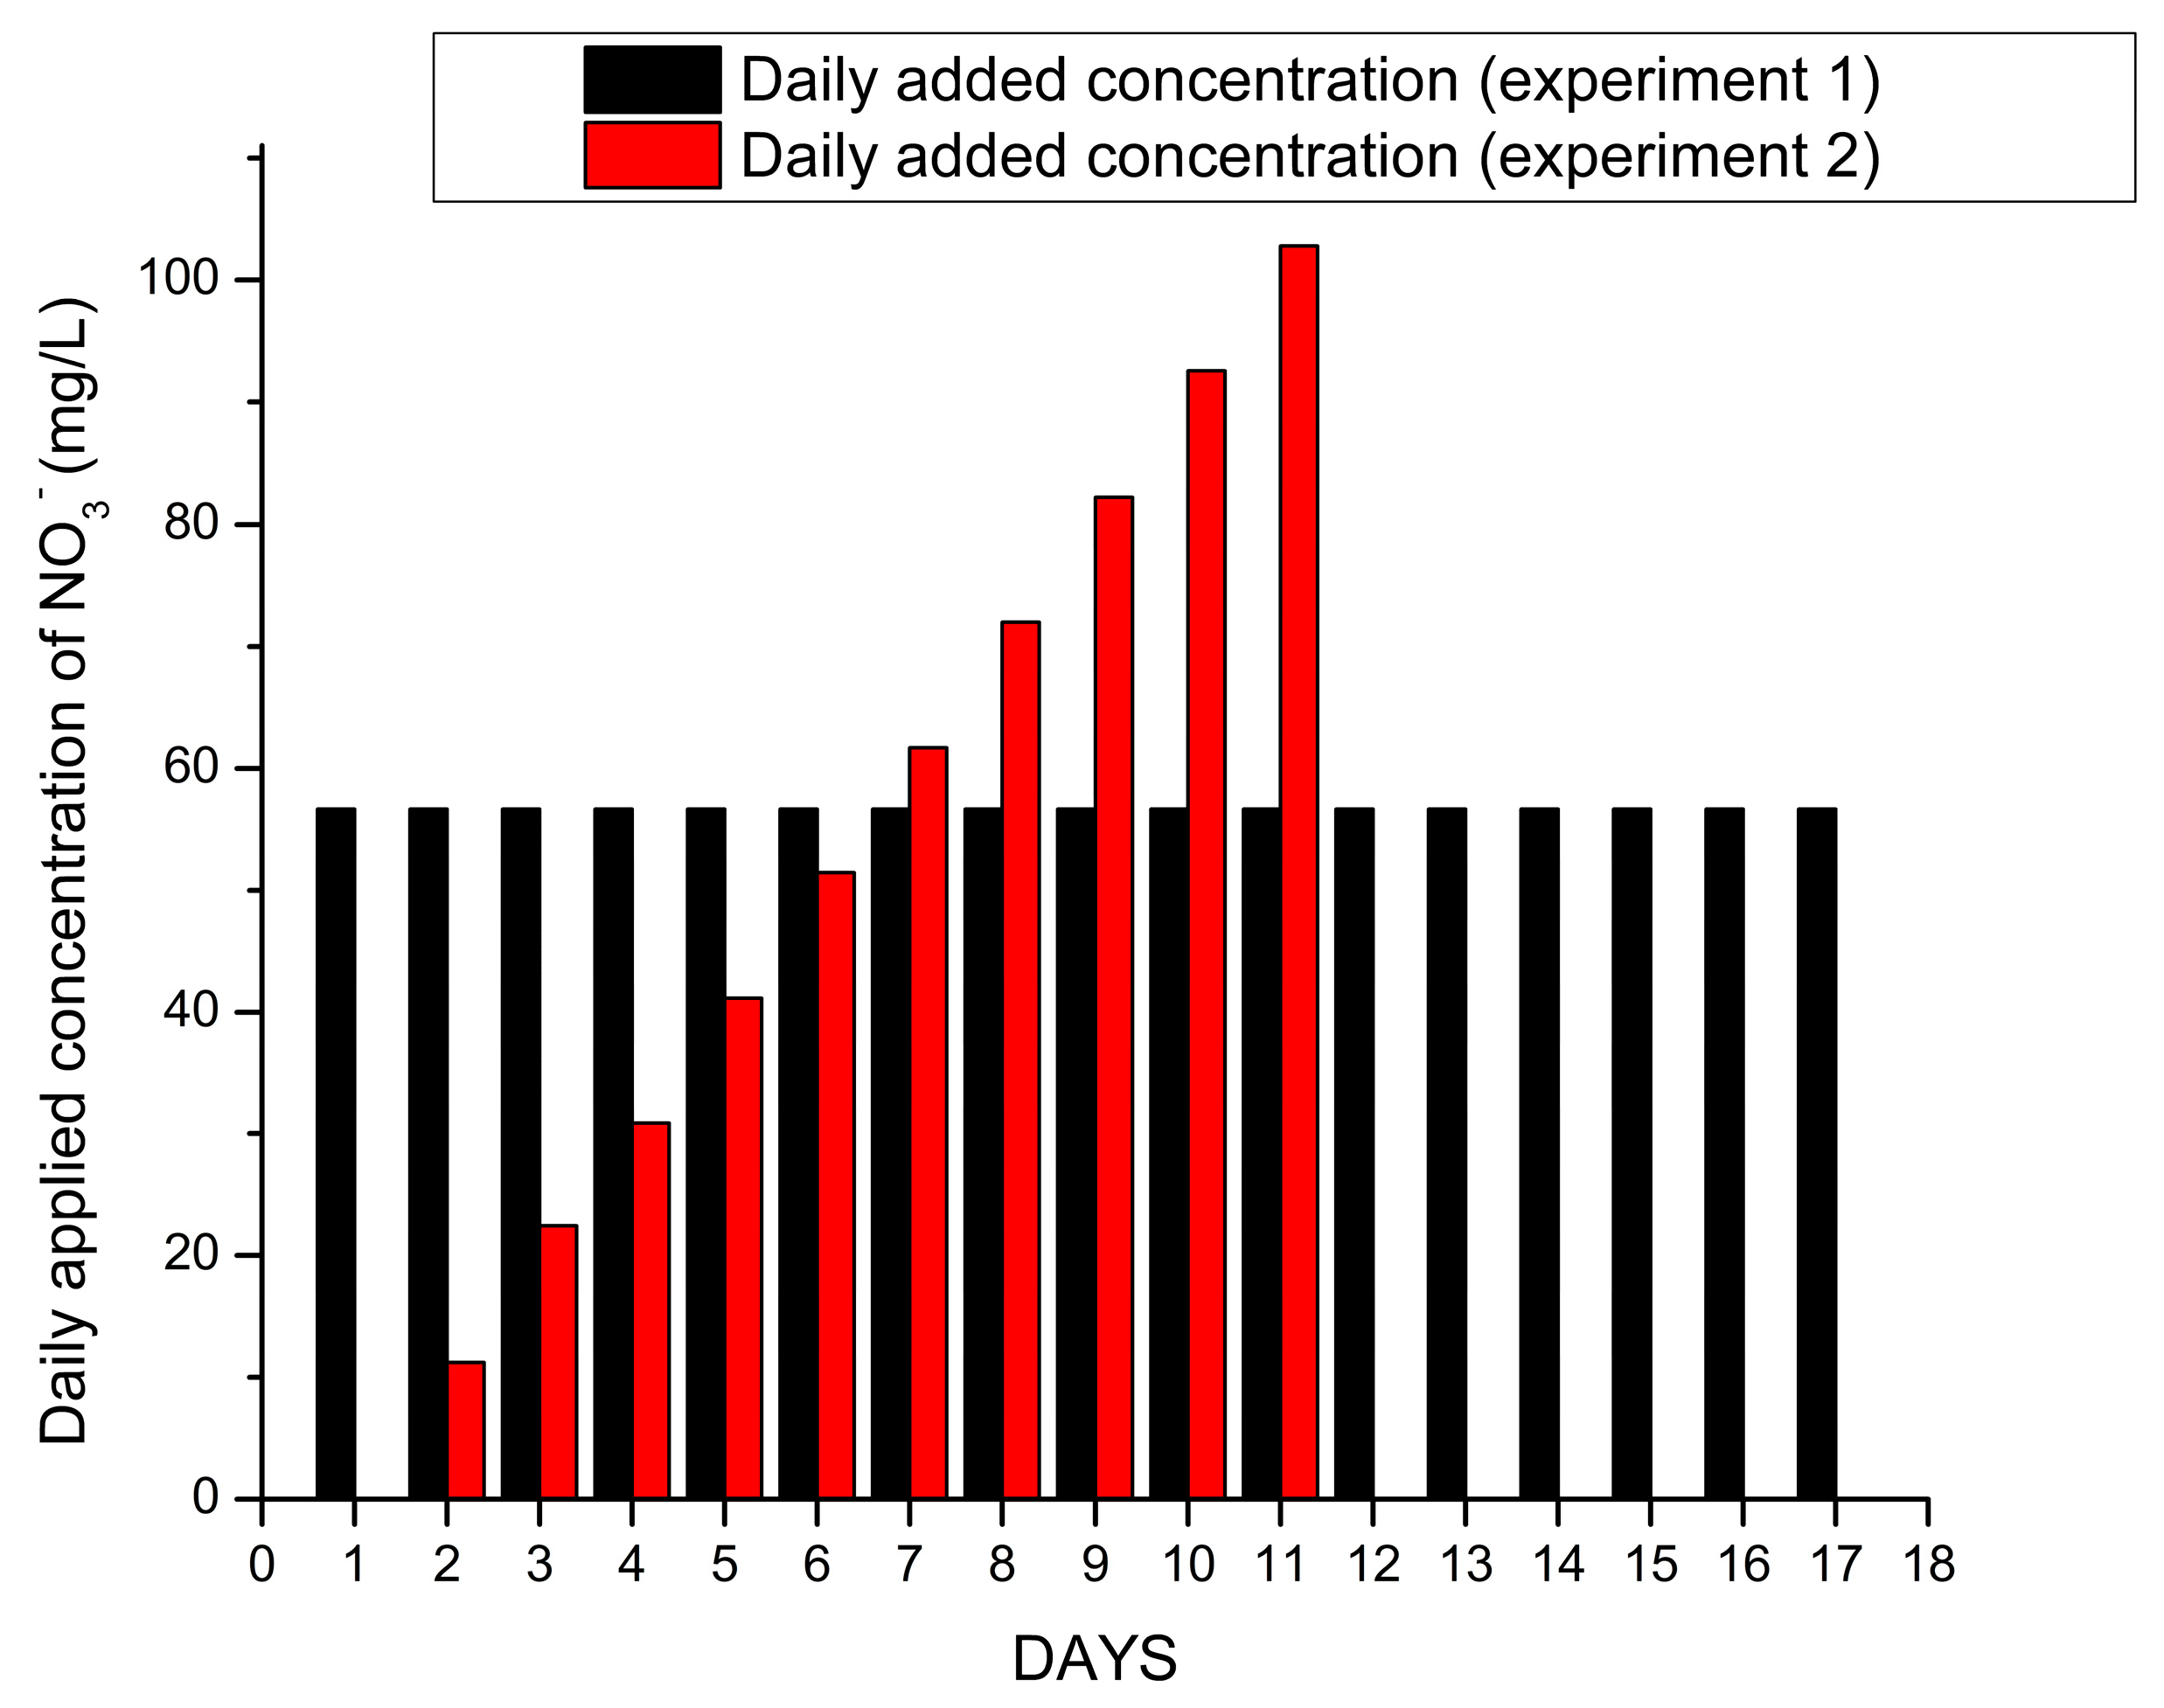
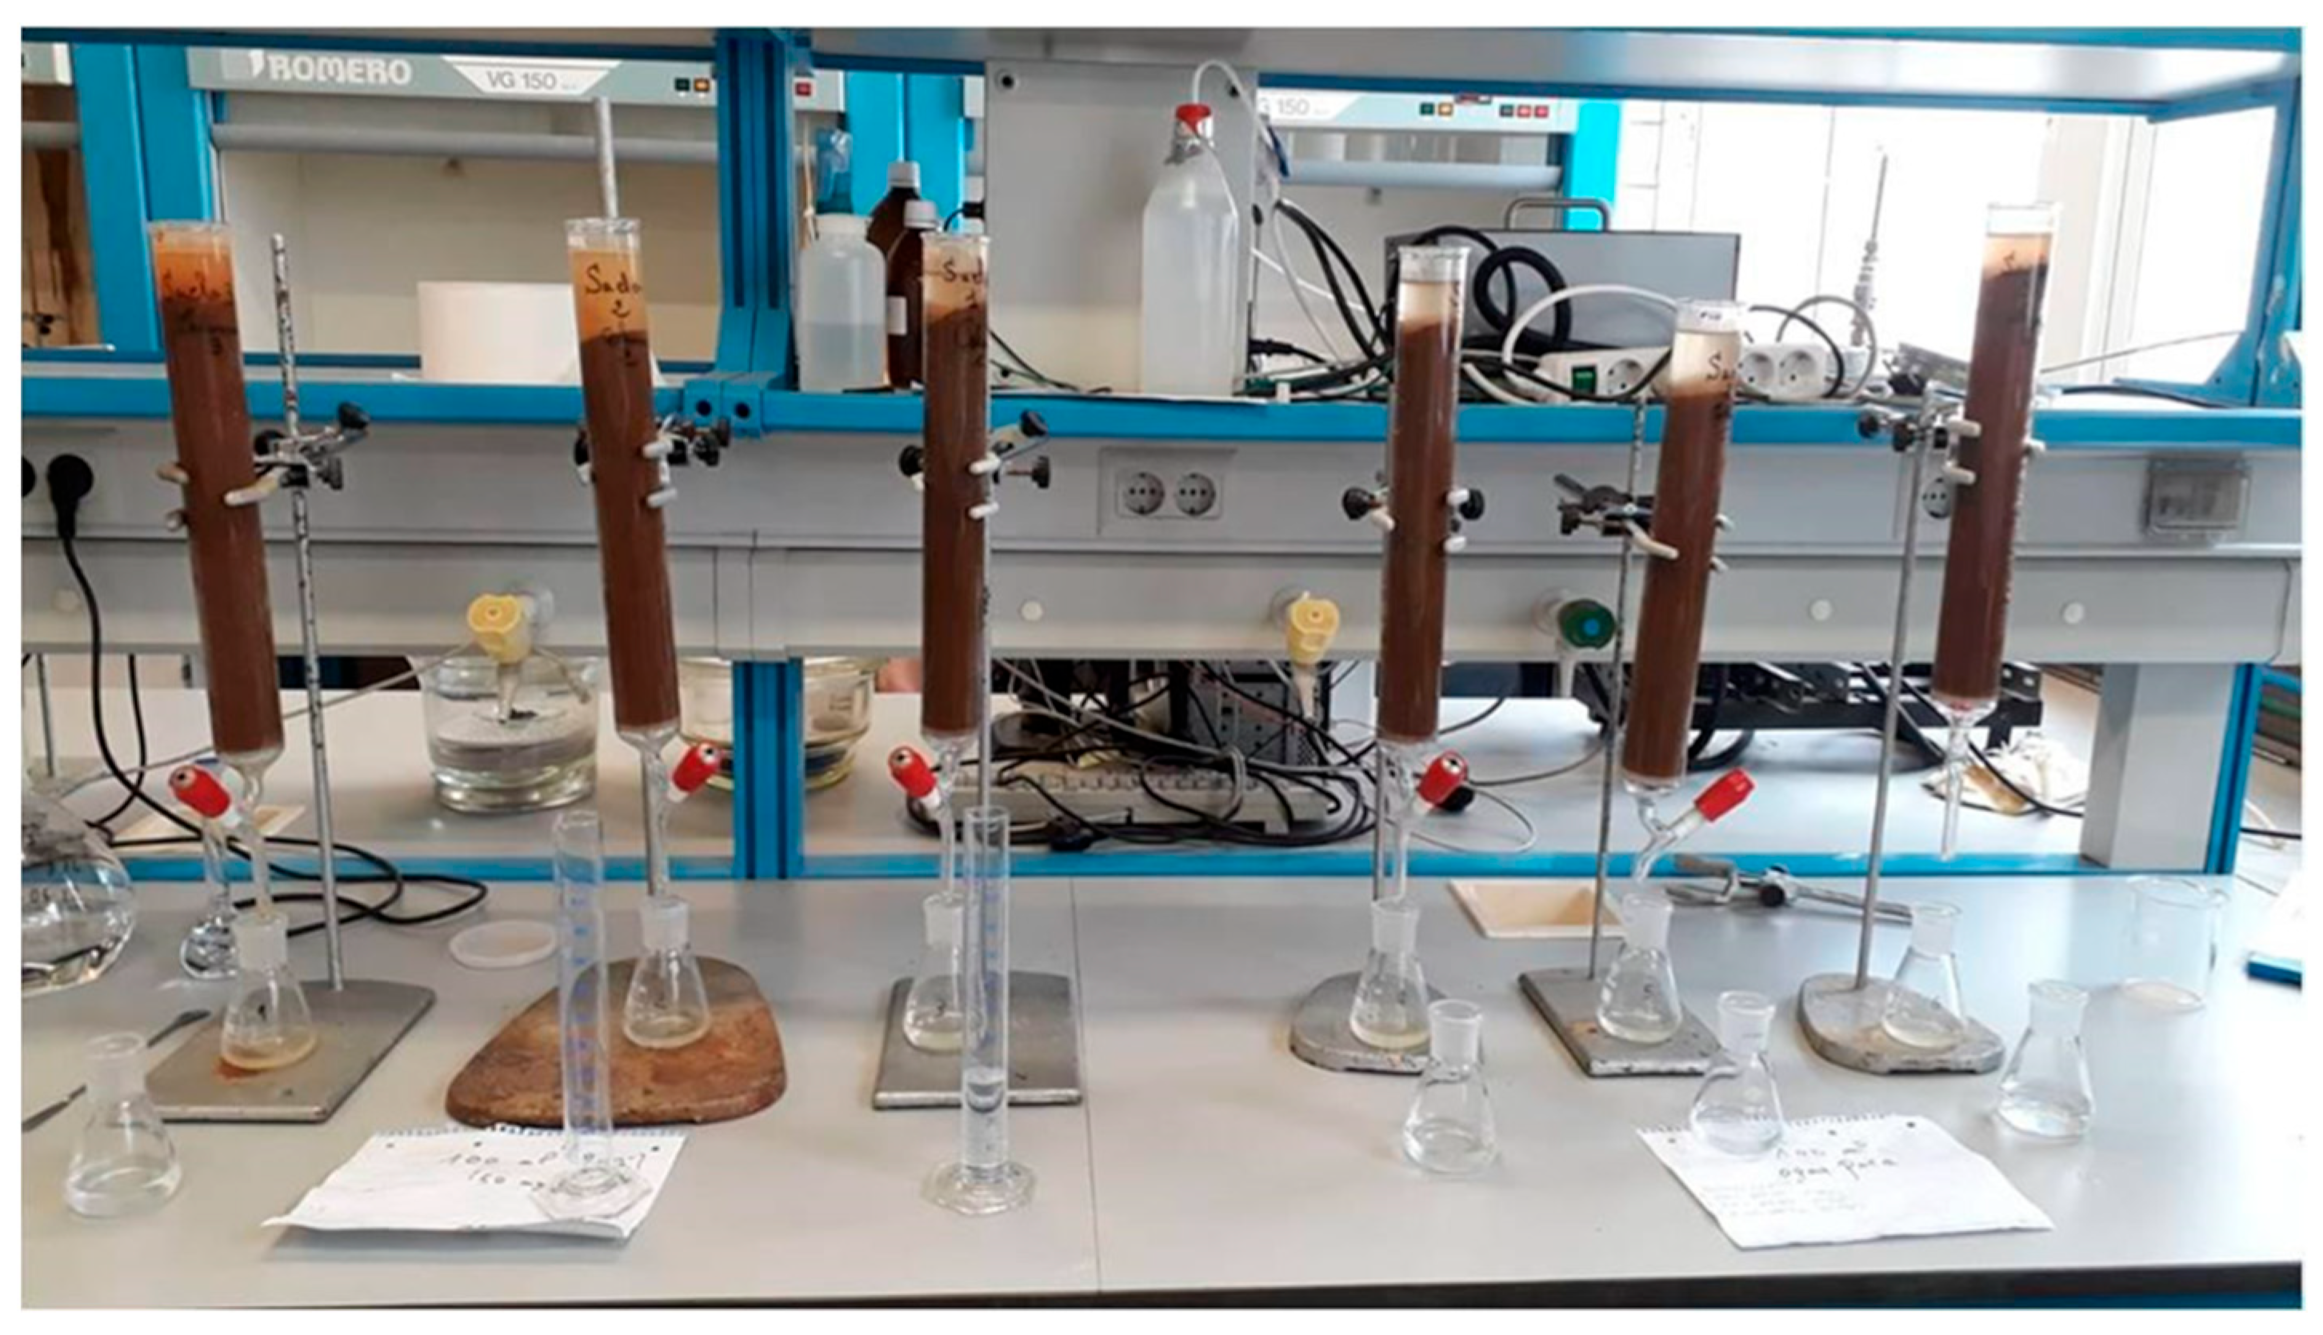
In order to assess the soil retention capacity of NO3 in the R’mel area, a study of nitrate leaching via vertical columns was carried out. A total of six columns were used in this study. The glass columns used for this study had a length of 35 cm and a diameter of 5 cm. The soil profiles were brought to the field conditions by controlling the apparent density of the soil by adding the necessary amounts of water to promote the vertical movement of solute. Generally, sandy soils are characterized by their high permeability allowing the effluent to infiltrate by gravity and do not necessarily need a force to be drained. All the experiments consisted of the addition of 100 mL constant daily volume of N-NO3. In the first experiment, soils 1, 2, and 3 were filled in columns, namely C1, C2, and C3, conditioned with ultrapure water (T0), and an initial concentration of 51.60 mg/L N-NO3 was added on a daily basis for 17 days. In the second experiment, the columns labeled C4, C5, and C6 were filled with soils 1, 2, and 3, respectively. Before initiating the experiment, the three columns were flushed several times with ultrapure water in order to remove the excess nitrogen already contained in the samples. Afterward, the three columns were loaded with an increasing concentration of N-NO3 ranging from 0 to 102.83 mg/L. Figure 2 shows the initially loaded concentrations for experiments 1 and 2. The collected solutions were analyzed every day for TN and expressed as N-NO3. Figure 3 shows the column setup for the nitrate-leaching experiments of the R’mel soils.

2.8. Measurements and Data Analysis

The total nitrogen (TN) measurements were conducted by catalytic combustion at 720 °C using a Shimadzu TOC–VCSH analyzer, according to the manufacturer’s instructions, with a 5.0% coefficient of variation. A total of six columns were prepared, and 82 samples were measured for TN. NH4 and NO2 were considered negligible in this study because of their weak concentrations in the R’mel groundwater [39]. The higher N-NO3 concentrations reported in the study area were mainly due to the shallow depth of the water table and the aerated conditions allowing the continued oxygenation of the soil and groundwater. According to Zarabi and Jalali [44], N-NO3 is the predominant form in N leachate solution due to its high solubility and lower affinity to be adsorbed by soil sites. The following conversion equation was used to express nitrate concentration in the leached solution.
Nitrate NO 3   mg L = 4.4268 ×   Nitrate N   mg L

3. Results

3.1. Soil Physicochemical Characterization

The results of the physicochemical properties of the soil are shown in Table 1. The granulometric classification made it possible to classify the three types of soil according to their particle size into three groups: sand, silt, and clay. The grain-size distribution showed that the soils have a sandy texture (>95% of sand) with low silt and clay content. This granulometric classification highlights the infertility of the R’mel soils, which leads farmers to intensify the use of inorganic fertilizers and manures in order to increase soil fertility. In consequence, the intensive irrigation rates applied to crops and soils have caused the leaching of these amendments towards groundwater due to the soil’s low capacity to adsorb fertilizers.
These results were also confirmed by analyzing the organic matter available in the three soils. Indeed, analyses of the organic matter in the complete fraction, CF, of the soil showed that the R’mel soils were characterized by a low OM content of 2.8, 2.36, and 1.57% for the samples S01, S02, and S03, respectively. On the contrary, the fine fraction, FF, which represents the fraction under 63 μm mainly composed of silt and clay, has a higher OM content. Soil 1 was characterized by the highest OM rate of 9.11%, whereas percentages of 7.5 and 7.65% were measured in S02 and S03, respectively. The pH of the R’mel soils varied between 6.33 and 8.7, with a mean value of 7.55. The soil S02 was alkaline in nature with the highest pH value of 8.75; soil S03 was slightly acidic with a pH value of 6.33, whereas soil S01 had a neutral pH value of 7.57. The measured cation exchange capacity (CEC) showed values of 9.28, 9.11, and 8.18 meq/100 g for the samples S01, S02, and S03 with a mean value of 8.86 meq/100 g of soil. This value confirms the low percentage of soil organic matter and clay in the R’mel soil. The electrical conductivity, EC, of the soil indicated the salinity of the sampled soils and ranged between 0.23 and 0.32 mS/Cm, thus indicating a low EC. Phosphorus in soils is almost entirely in the form of orthophosphate, with total P concentrations typically ranging from 500 to 800 mg/kg dry soil [45]. The presence of orthophosphate in the soil is closely related to organic matter and clay minerals. The analysis of PO3−4 in the soil’s fine fraction showed a concentration ranging from 0.81 to 2.04 g/Kg, which indicates that despite the dominance of sandy texture, the clayey fraction tends to adsorb higher amounts of orthophosphate ions. Nutrient availability in soils is affected by many interconnected variables; examples include parental rock composition, particle size, humus and water content, pH, aeration, temperature, root surface area, and fungal growth [46]. The lack of nutrients in sandy soils is frequently resulting in decreased water-holding capacity, soil pH, cation exchange capacity, and soil organic matter [47]. The concentrations of nutrients in the fine fraction of the R’mel soils were in the following order: Fe > Ca > Mg > K> Mn > Na, with values ranging from 46.19 to 47.41, 5.24 to 13.37, 3.42 to 4.86, 2.05 to 3,48, 1.35 to 1.62, and 0.18 to 0.33 g/Kg, respectively. The lack of OM in the R’mel soils probably influences the plants’ nutrient availability since the dominant texture is coarse. The higher Ca2+ content (13.37 g/kg) recorded in Soil 2 indicates that calcium cation influences the pH of the soil. This relatively higher alkalinity in Soil 2 could be originating from the application of free lime (CaO) to increase soil pH for optimal plant growth in this area known for its low alkalinity. The concentrations of these nutrients in the fine fraction of the R’mel soil indicate that their presence is barely at the level recommended for agricultural soils. Furthermore, this fraction accounts for less than 5% of the total soil fraction, although the remaining fraction is notably coarse particles with low CEC and low water- and organic-matter-holding capacity, and therefore poor in nutrients.
During their assimilation, certain trace elements, such as Cu, Zn, Ni, Fe, Co, Se, and Ba, are essential for the functioning of plants [48]. They intervene in processes such as photosynthesis, biosynthesis of proteins, amino and nucleic acids, and chlorophyll, as well as the production of substances made by plants that make them competitive in their environment [49]. However, soil pollution by heavy metals is one of the world’s major environmental problems [50]. The accumulation of heavy metals in soil could originate from geogenic or/and anthropogenic sources. Several studies have shown that agricultural practices could be a source of heavy metal accumulation in agricultural fields. Several studies [51,52,53] reported that the applications of fertilizers and pesticides were responsible for the accumulation of Cr, Cd, Cu, Zn, Ni, Mn, and Pb in agricultural fields.
Table 1 represents the concentrations of trace elements analyzed in the fine fraction of the R’mel soils. The heavy metals were well absorbed by the FF of the soil, which was evident from the As, Cr, Cu, and Ni contents surpassing the allowable limits set at 20 ppm, 0.8 ppm, 30 ppm, and 35 ppm, respectively. Zn concentrations varied between 114 and 224 mg/kg in the soil samples. Zn is generally present in soils at background concentrations of 10–100 mg Zn kg−1 [54]. Arsenic is a ubiquitous element that can be found in every Earth compartment; arsenic derives naturally from geogenic rocks and/or can originate from anthropogenic activities such as the use of fertilizers and pesticides. R’mel drinking water was already reported as being contaminated by arsenic. This contamination has been attributed to both geogenic and anthropogenic sources [39]. From these results, it is possible to mention the crucial role of the fine fraction (clays and silts) in the retention of pollutants and also to shed light on the impact of low organic matter on the release of pollutants towards groundwater. By comparing the amount of clay in the three samples, it was consistent that Soil 1 had retained a higher concentration of trace elements than Soils 2 and 3; this higher concentration is closely related to the higher amount of OM and clay contained in the soil which is manifested by the relatively higher adsorption capacity of trace elements. Despite this finding, the R’mel soils contain negligible amounts of silt and clay and consist largely of coarse particles, which affects the leaching of trace elements and other agricultural pollutants.

3.2. Column-Leaching Experiments

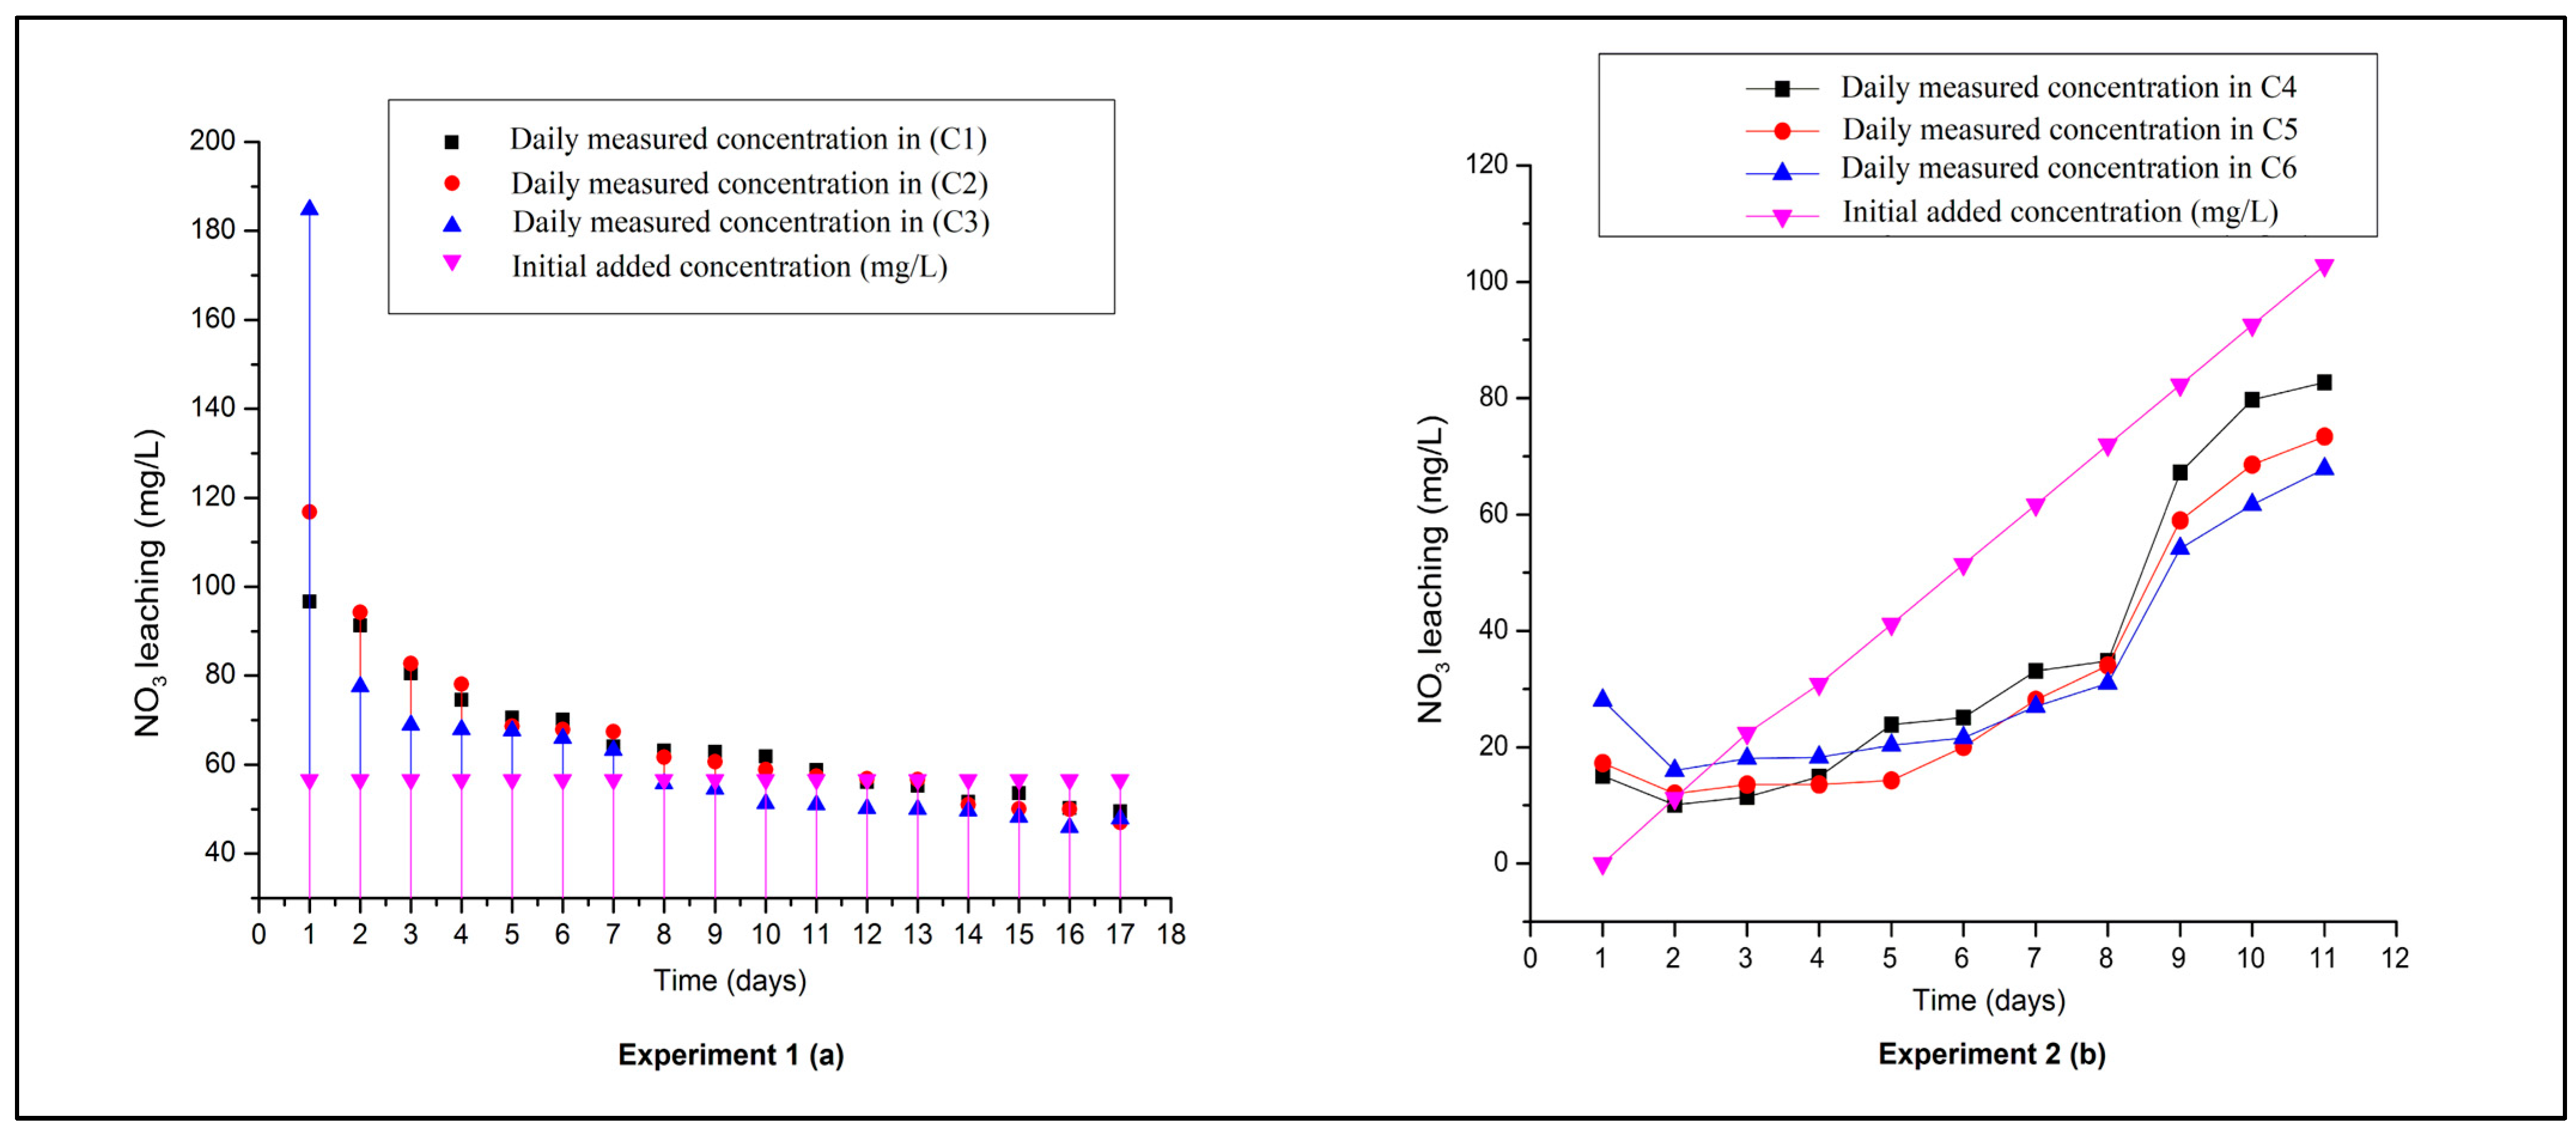
The nitrate-leaching concentrations recorded during experiment 1 are shown in Figure 4a. The first day of leaching was marked by elevated leaching rates of 96.70, 116.82, and 184.82 mg/L for C1, C2, and C3, respectively. The measured concentration indicated that leaching exceeded the initially loaded concentrations and imply that nitrogen was already present in the soil samples from field fertigation activities. It was also evident that Soil 3 had a higher nitrogen content. On the second day, there was an evident decrease in NO3 concentration in C3 (77.52 mg/L), whereas NO3 concentration in C1 and C2 decreased slightly to 91.25 and 94.2 mg/L, respectively. Except for day one, the daily measured NO3 concentration in C3 was lower than in C1 and C2 until day five, when concentrations were comparable at 70.61, 68.66, and 67.55 mg/L in C1, C2, and C3, respectively. The observed leachate concentrations dropped consistently until day eight, indicating that NO3 loading was roughly close to the leachate concentration in Soil 3 (55.73 mg/L). The NO3 leaching in C1 and C2 was close to the initial loaded concentration from D11 of the experiment. Afterward, the NO3 concentrations decreased slightly in the three columns and ranged between 56.08 and 49.47, 56.79 and 46.97, and 50.13 and 47.79 mg/L in C1, C2, and C3, respectively. The results of this experiment show that after fertigation of the raw soils with 51,56 mg/L of NO3, the soils need more time to eliminate the NO3 excess already contained in the soil. The last days of the experiment showed that the loaded concentration of NO3 was moderately equal to the leached concentration. This experiment highlighted that after 17 days from the application of a constant NO3 concentration, the leaching rates do not decrease in the collected leachate. On the contrary, the raw sampled soils contribute, in turn, to the enrichment of NO3 in leachate. Nitrate-permissible level in groundwater was determined to not exceed 50 mg/L. This experiment showed that an excess of fertigation/irrigation rates in the R’mel area could cause the contamination of local groundwater by nitrate.
Experiment 2, illustrated in Figure 4b, shows the effect of increased nitrate doses on leaching rates from the three sandy soils. Nitrate leaching on the first day was higher than the initially applied concentration of 0 mg/L (only water), reaching 15.1, 17.3, and 28.0 mg/L in columns C4, C5, and C6, respectively. These results indicate that although the soil columns were diluted several times with water to remove excess nitrate present in the soil, the three columns still contain nitrate, indicating residual or secondary leaching from soil samples. The following application (day two) shows that the measured NO3- concentration in C4, C5, and C6 decreased while the initially applied NO3 increased from 0 to 11.21 mg/L. After day three, all the measured concentrations in leachates were lower than the initially applied concentration until the end of the experiment. The leaching curve increased slightly from day three to day eight for an increasing loaded concentration ranging from 30.85 to 71.98 mg/L. These results show that the maximum adsorption capacity of the soils was reached between days three and eight. Meanwhile, a rapid increase in NO3 leaching was observed in the three columns on day nine, potentially indicating that the soils started to progressively lose their ability to adsorb nitrate.
In general, the nitrate leaching in columns C4, C5, and C6 seems to increase with respect to the applied doses of nitrate. However, experiment 2 demonstrated that after removing nitrogen excess from the raw soils, it appears that nitrate leaching decreases in the three columns. This indicates that R’mel soils have a low adsorption capacity which is quickly affected by higher nitrogen applications.
By comparing the collected leachate with the measured added concentrations in experiment 2, it is evident that, contrary to experiment 1, the NO3 leaching did not exceed the applied NO3 concentration. This suggests that the elevated applied N fertilizer affects the soil’s adsorption capacity in the R’mel area. In this context, the following sections will be dedicated to discussing the main factors affecting the R’mel soil retention capacity through various physical and chemical characterizations.

3.3. Soil Thermal Characterization

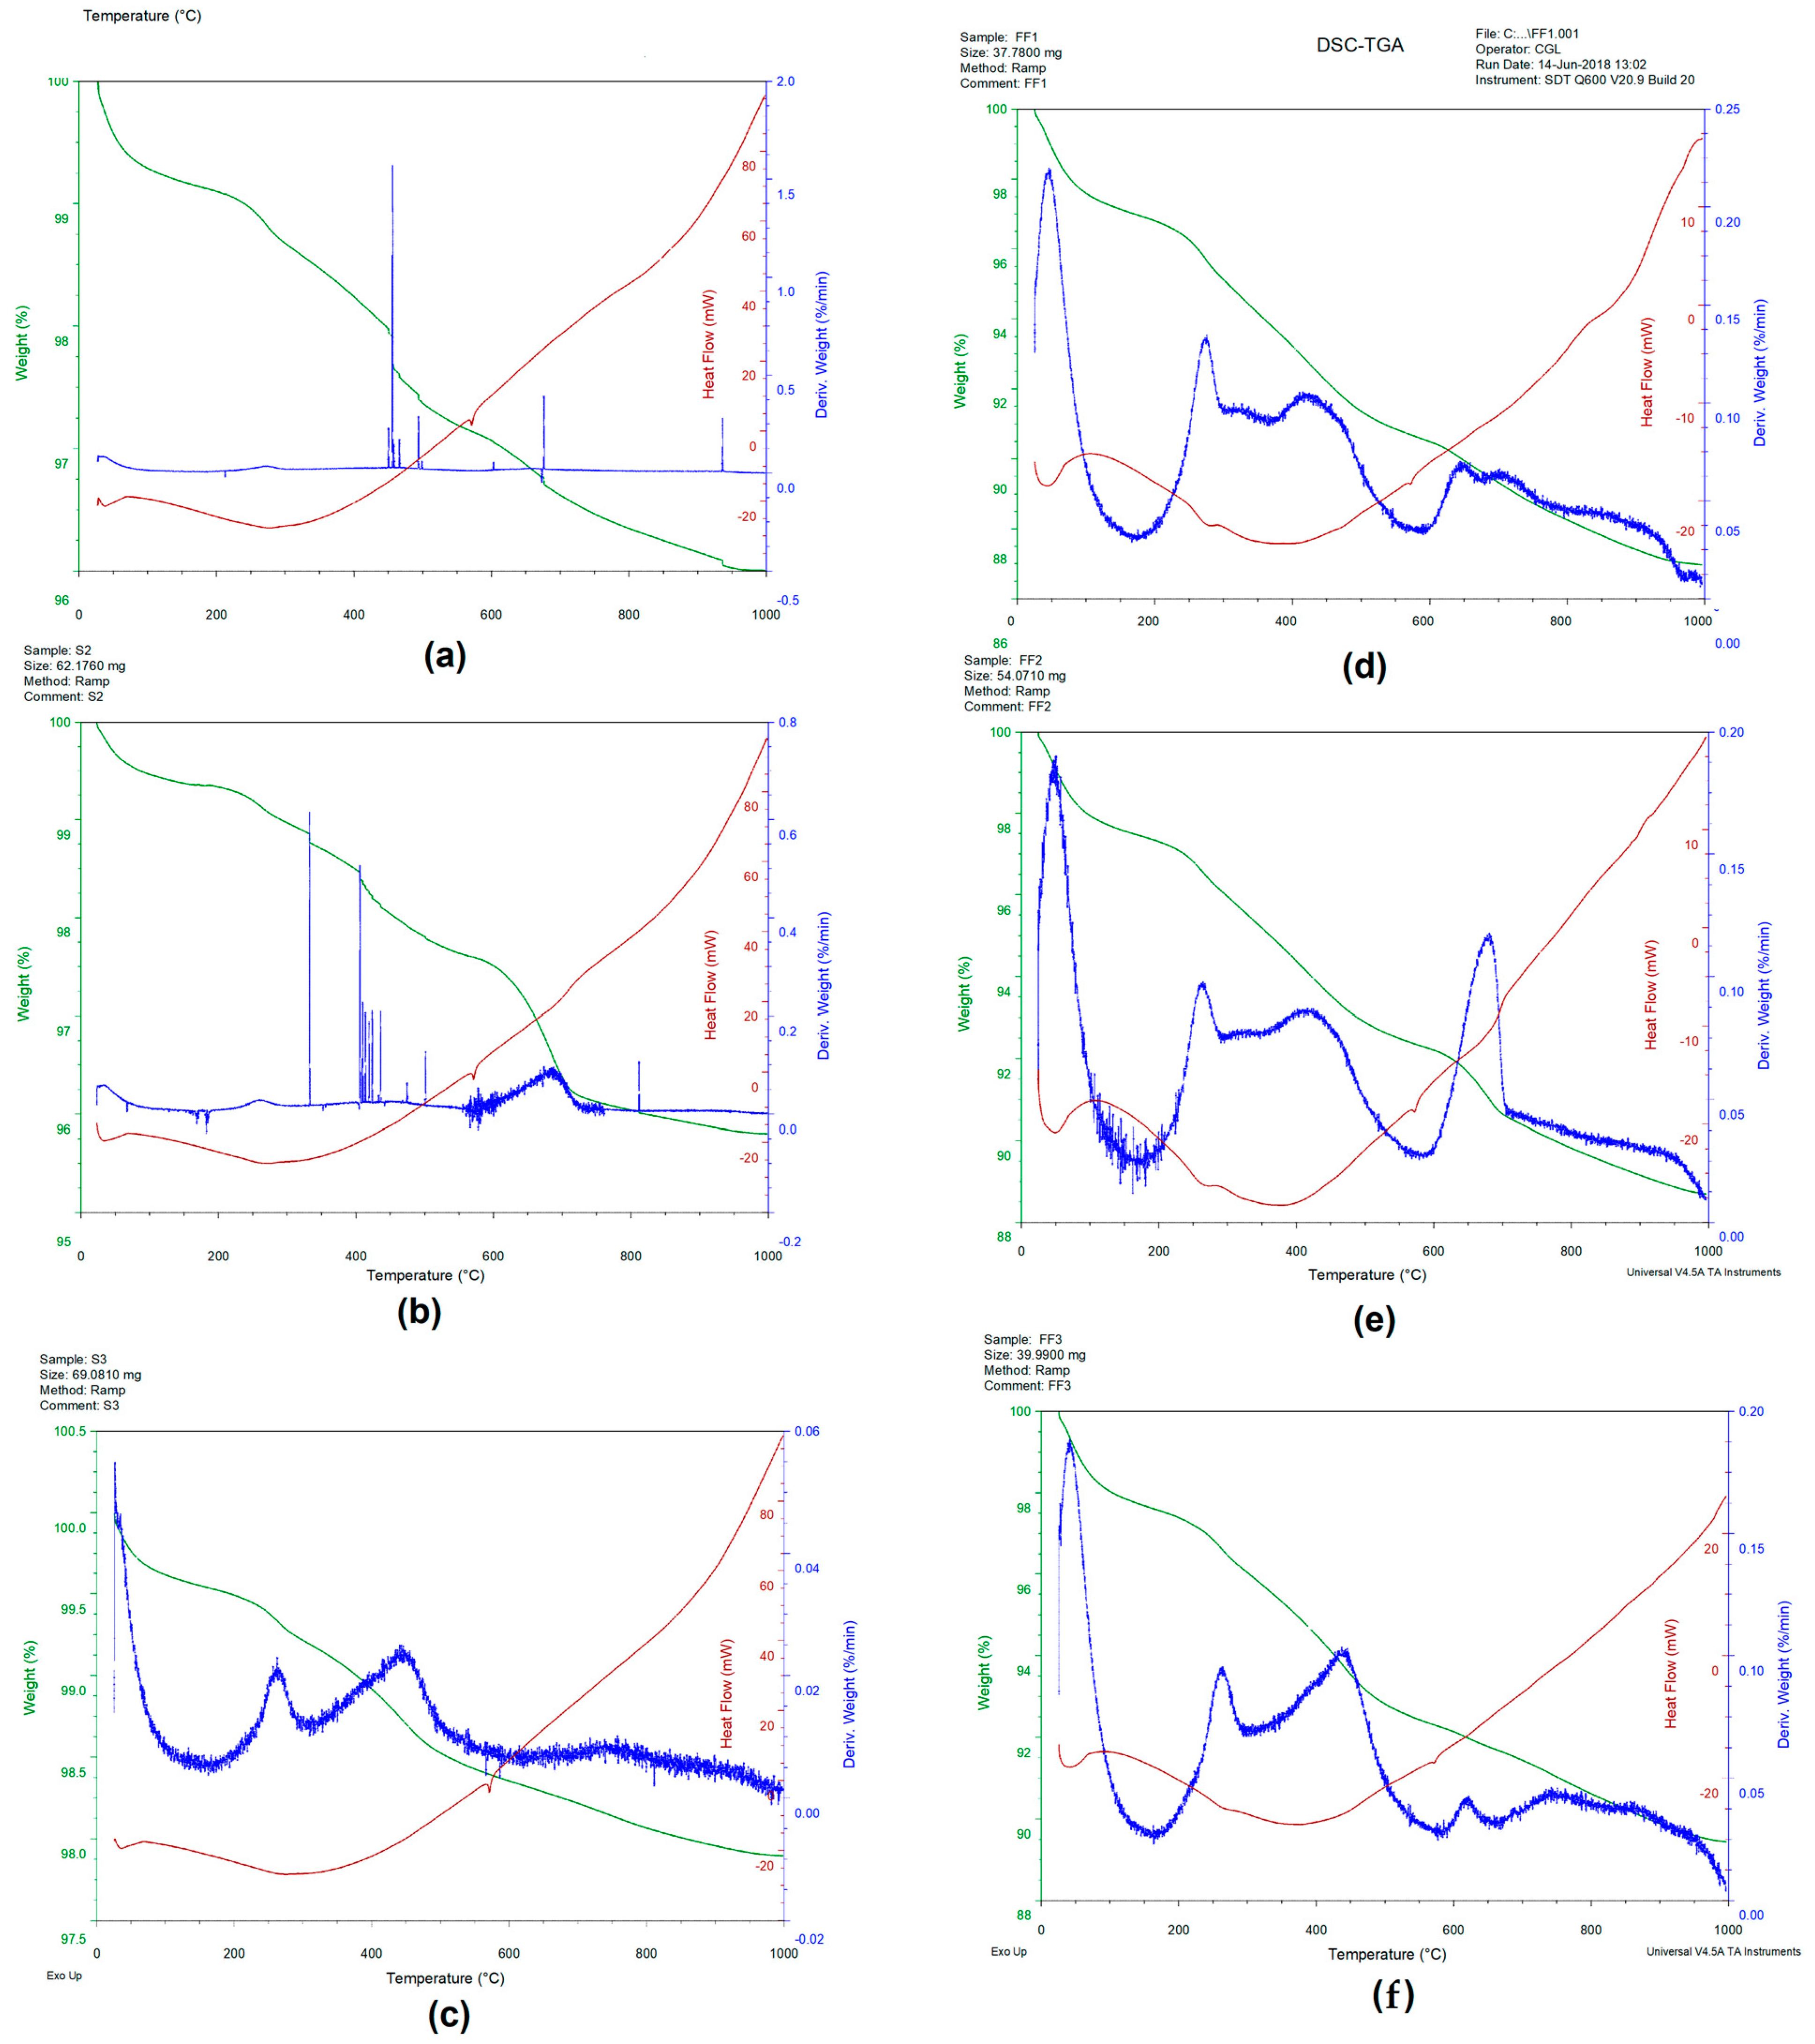
The adoption of a technique such as TGA-DSC could alleviate the problem of soil decomposition and provide an accurate description of soil composition by comparing the different temperature intervals of the soil. The simultaneous (TGA-DSC) measurements for both the fine and complete fractions of the sampled soils are presented in Figure 5. The observed effects of TGA variation include three intervals; the first ranges from 0 to 105 °C and represents the loss of interstitial water from the samples intra-pores, the second interval refers to the pyrolyze/oxidation of OM under a maximum temperature of 550 °C, whereas the third interval represents the decomposition of CaCO3 at a temperature exceeding 550 °C. Soil 2 was characterized by higher derivative peaks (600 °C and 700 °C) in its FF and CF; these results confirm the presence of CaCO3 in this soil. This will be also confirmed by both XRD and XRF results (CaO and CaCO3), in addition to the soil’s higher calcium content and pH. It is noteworthy that the higher mass losses are accompanied by the higher peak of derivative mass loss, thus highlighting the significant changes in weight (inflection points) and demonstrating the areas corresponding to the decomposition of the soil during the heating process. Moreover, the points corresponding to changes in heat flow were highlighted by higher derivative peaks. The TGA/DSC of the soil FF displays a clear peak when compared with the CF. The mass loss of the FF was clearly higher than the CF which is mainly due to higher water content, organic matter, and carbonates in the clayey fraction. This difference between the TGA/DSC curves provided information on the parameters influencing the soil retention capacity, such as the presence of fine particles, water-holding capacity, and porosity.

3.4. Olive Pomace Biomass Slag (OPBS) Analysis

The composition of OPBS was characterized as major (Table 2). The OPBS has a very alkaline pH of 12.1. This higher pH is related to the presence of dissolved metals as basic metal salts, oxides, and carbonates formed during the combustion of biomass. Accordingly, OPBS could be used to increase the pH of acidic soils in the R’mel region. The OPBS represents a moisture content of 7.18% calculated as dry mass. This moisture content was much higher when compared to soil samples which did not exceed 1% of the total mass based on the generated TGA curves. These findings demonstrate that the pore spaces between OPBS particles could hold more interstitial water than the R’mel soils, implying that the application of OPBS to soil may boost soil water-retention capacity. During biomass combustion, the organic carbon present in the slag corresponds to the unburned fraction of the biomass. The OPBS contains 19.97% of total organic carbon (TOC) that has not been burnt. Batra et al. [55] investigated the presence of unburned carbon in bagasse fly ash sampled from bagasse cogeneration power plants in India and found more than 25% of unburned carbon. The same authors reported that unburned carbon resulted in disposal issues, provided challenges when employed in cement formulations, and would thus be better suited for alternative uses. In this context, there is a distinct possibility to apply the OPBS as a carbon-containing amendment to R’mel sandy soils recognized by their lower organic carbon as demonstrated by thermogravimetric analysis. In addition to the high carbon content, the major element compositions of OPBS showed significant amounts of macronutrients which decrease in the sequence of Ca > K > Mg > Fe > Na. The leaching of essential macronutrients is common in coarse-textured soils and reduces nutrient availability to plants. By comparing the macronutrient level in OPBS with soil, it is convincible to exploit the fertilizing capacity of this material to amend R’mel soils. In addition, many farmers in the R’mel region use lime in order to control soil acidity mainly resulting from irrigation and excessive nitrogen use. The cationic exchange capacity (CEC) plays an important role in adsorbing and releasing nutrients needed by plants, as well as assessing the potential harm of certain contaminants. As a result, the R’mel soils have shown quite low CEC. The higher level of macronutrients contained in OPBS such as calcium, potassium, and magnesium could be introduced to increase the soil CEC, and thus macronutrient availability to the plants. OPBS, on the other hand, has the potential to limit the excessive use of N fertilizers by not only giving essential nutrients but also preserving their availability in the soil. Motesharezadeh and collaborators [56] concluded that the use of lime in sandy soils increases the CEC and reduces the leaching of NO3 and K.
The combustion of biomass could result in the accumulation of trace elements in ashes and slag residues. For example, Wang et al. 2014 [57] reported that woody biomass blended in the fuels could generate large amounts of As, Cd, Cu, Cr, Pb, and Zn in fly ash and slag. In this study, OPBS was analyzed to assess trace-element toxicity in order to insure a safe utilization of this residue in soil (Table 3). The heavy metal content in OPBS decreases in the order of Mn > Zn > Cr > Cu > Ni > Co > Mo > As > Pb > Cd. It can be seen that the levels of heavy metals such as, Cd, Co, Pb, and Mo were quite low in the OPBS samples, whereas Cu, Ni, Cr, Mn, and Zn occurred in background levels, and no element present any potential risk of contamination. Moreover, the toxicity of the slags is not intrinsically linked to their trace-element levels, but rather to their leaching. A previous similar study of four biomass slags from a fired power plant showing approximately the same composition of OPBS has demonstrated too low leaching amounts of trace elements [34]. The same authors have concluded that the biomass slags did not represent any risk of contamination related to their utilization. In another study, the fertilizer value of fly ash derived from burning bark and wood chip was investigated by Numesniemi et al. [58], and the findings revealed that the levels of hazardous elements (As, Cd, Cr, Cu, Hg, Pb, Ni, and Zn) were low. In addition, the comparison between the level of trace elements in the clayey fraction of the soil and OPBS revealed that the fine fraction contained higher trace elements than the OPBS; these results indicate that the use of OPBS will not affect the levels of trace elements in the soil. From another point of view, the OPBS, which has a similar composition to fly ashes, could represent a great solution for the immobilization of heavy metals in the soil. Indeed, several studies reported the efficiency of fly-ash addition to soil on trace-element immobilization [57,58,59,60,61,62,63,64,65].

3.5. X-ray Fluorescence Analysis

The major oxides present in the soil’s FF, CF, and OPBS are presented in Table 4. The percentage of oxides decreased in the sequence of SiO2 > Al2O 3 > Fe2O3 > CaO > MgO > K2O > TiO2 > Na2O > P2O5 > SO3 in the three analyzed soils for both the fine fraction (FF) and the complete fraction (CF) of the soils. The results showed that the samples were predominately silicate soils rich in iron and aluminum. According to Chong et al. [66], the high content of exchangeable Al and Fe ions is mainly due to the high temperatures and heavy rains resulting in low soil pH, low nutrient availability, and low organic matter content. A significant difference in SiO2 percentage was noted between the FF and CF, confirming quartz particles’ predominance in the R’mel soils. In contrast, the SiO2 percentage has decreased while other oxides have increased parallelly in the soil clayey fraction. The mineral matrix present in the soil ranges between 83.3% and 89.62% for the FF, whereas it ranges from 89.04 to 92.13% for the CF, indicating the higher rate of soil cultivation in the R’mel area. Considering the heterogeneity of the situation in soils, normally the denser and more friable/loose mineral fraction (less oxide/silica content) is found in the FF of the soil representing higher OM, CEC, and specific surface area (SSA). On the contrary, the less friable (or gangue) material is typically composed of oxides, often the majority being silica. In addition, the higher percentage of mineral matrix signifies a more dominant effect of hydrogen bonding on the adhesion of inorganic oxide particles. The size distribution and mineralogy of the clayey and silty fractions associated with sand grains are also responsible for variations in the physical properties of tropical sandy soils [67]. The XRF analysis of OPBS reveals a distinct composition dominated mainly by SiO2, CaO, and K2O accounting for more than 66% of the total OPBS. Oxides such as CaO, K2O, MgO, P2O5, and SO3 were present at negligible amounts in both soil fractions. In contrast, these oxides were found in high concentrations in the OPBS. Consequently, the OPBS can provide essential nutrients needed by crops when amended with OPBS. In addition, the higher alkali oxides represent a great advantage due to the liming characteristics of this material.

3.6. XRD Analysis

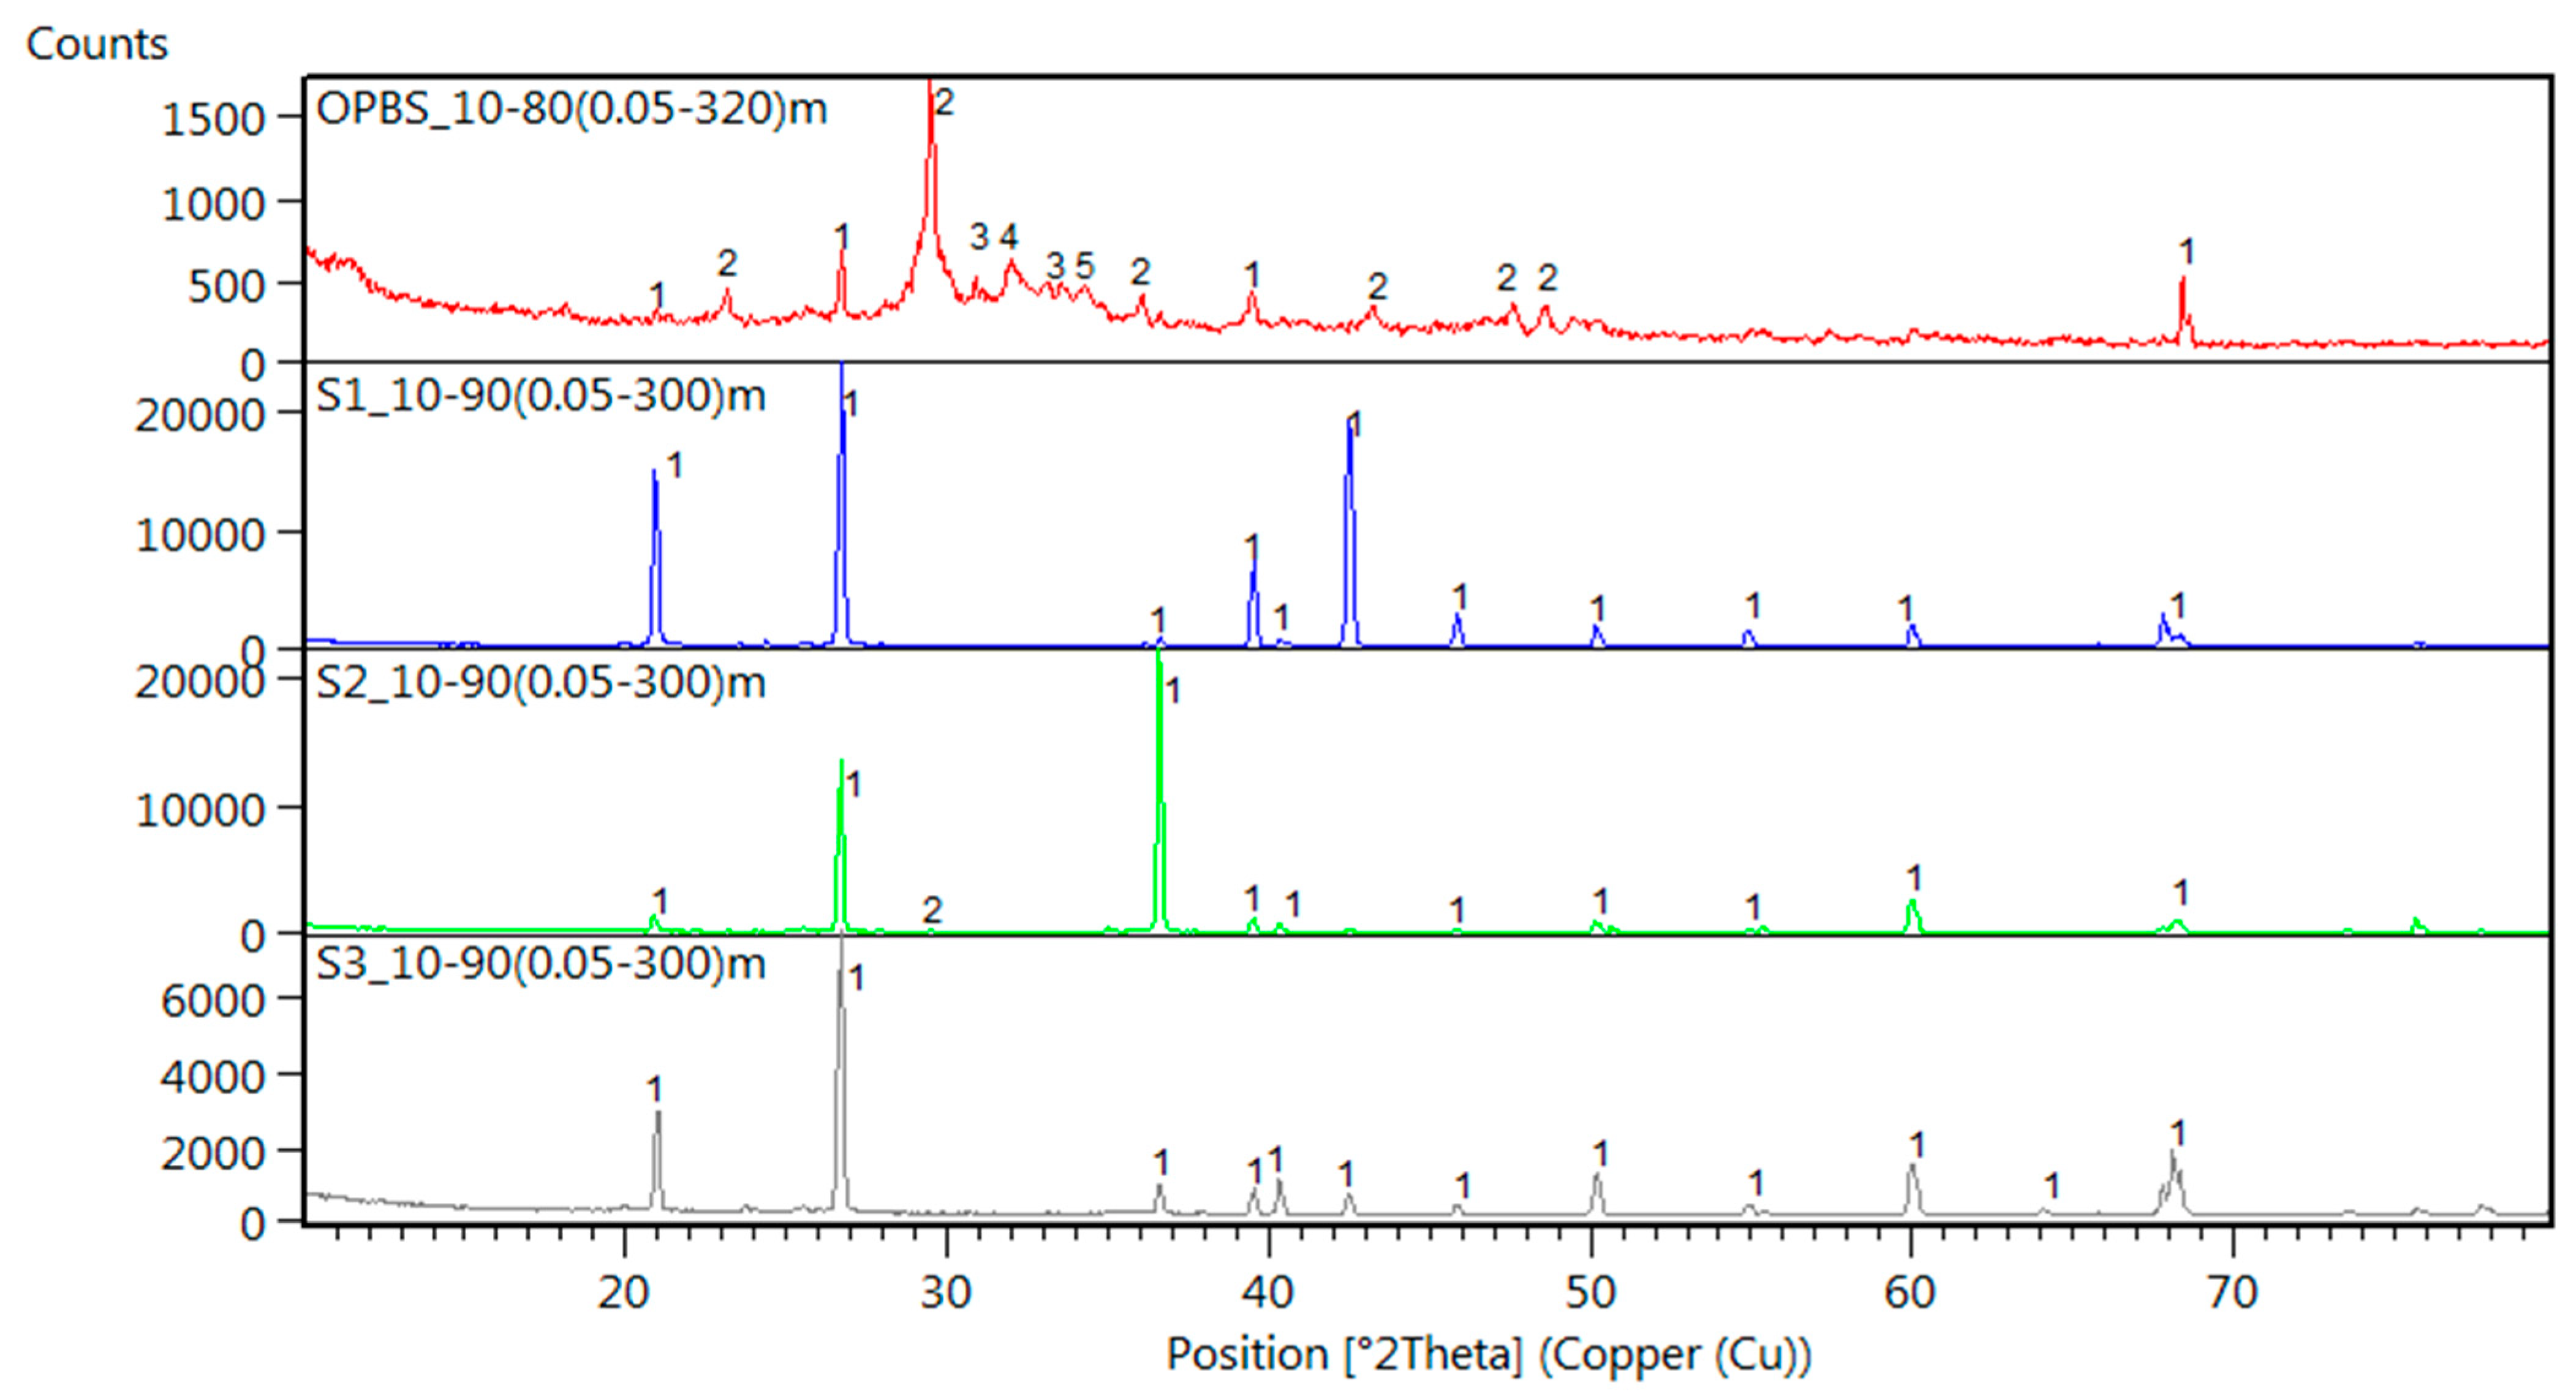
The use of X-ray diffraction is a necessary tool for determining the different crystalline phases contained in a soil sample. Figure 6 displays the XRD pattern of the three soils (S1, S2, and S3) and Olive Pomace Biomass Slag (OPBS) samples. The soils were dominated by silicon oxide (SiO2), with no other crystalline phase detected. Except for Soil 02, which displayed a minor peak of CaCO3 as validated by TGA curves and XRF, which had a high proportion of CaO oxide (2,56%) when compared to Soils 1 and 3. The strongest quartz peaks were found between 20.71° and 26.45° for both the soil and the OPBS samples. XRD analysis of OPBS, on the other hand, revealed that the most prevalent crystalline phase was calcite (CaCO3) and quartz (SiO2), along with other minerals such as dolomite (CaMg, (CO3)2), fairchildite (K2Ca (CO3)2), and free lime (CaO). The results of XRD confirm that higher percentages of SiO2, CaO, and K2O detected by XRF analysis were the main elemental composition of the crystalline phases of OPBS. In sandy soils, significant weathering occurs at depth resulting in mineralogy where quartz is the dominant mineral in the sand and silt fraction and forms a considerable proportion of the clay fraction. It is noted that despite the prevalence of silica in the soil samples, other minerals were also detected by XRF in FF at a considerable percentage, e.g., Al2O and Fe2O3; however, the XRD patterns revealed only the quartz (SiO2) which is mainly due to the absence of clayey minerals such montmorillonite, bentonite, kaolinite, etc. [67]. As a result, the application of OPBS as a soil additive might influence the weathering of Si. Matichenkov et al. [68] reported that soil properties such as P, Al, heavy-metal behavior, and adsorption capacity are governed by soil silicon compounds.

3.7. BET Characterization of the Soil Samples and Biomass Slag

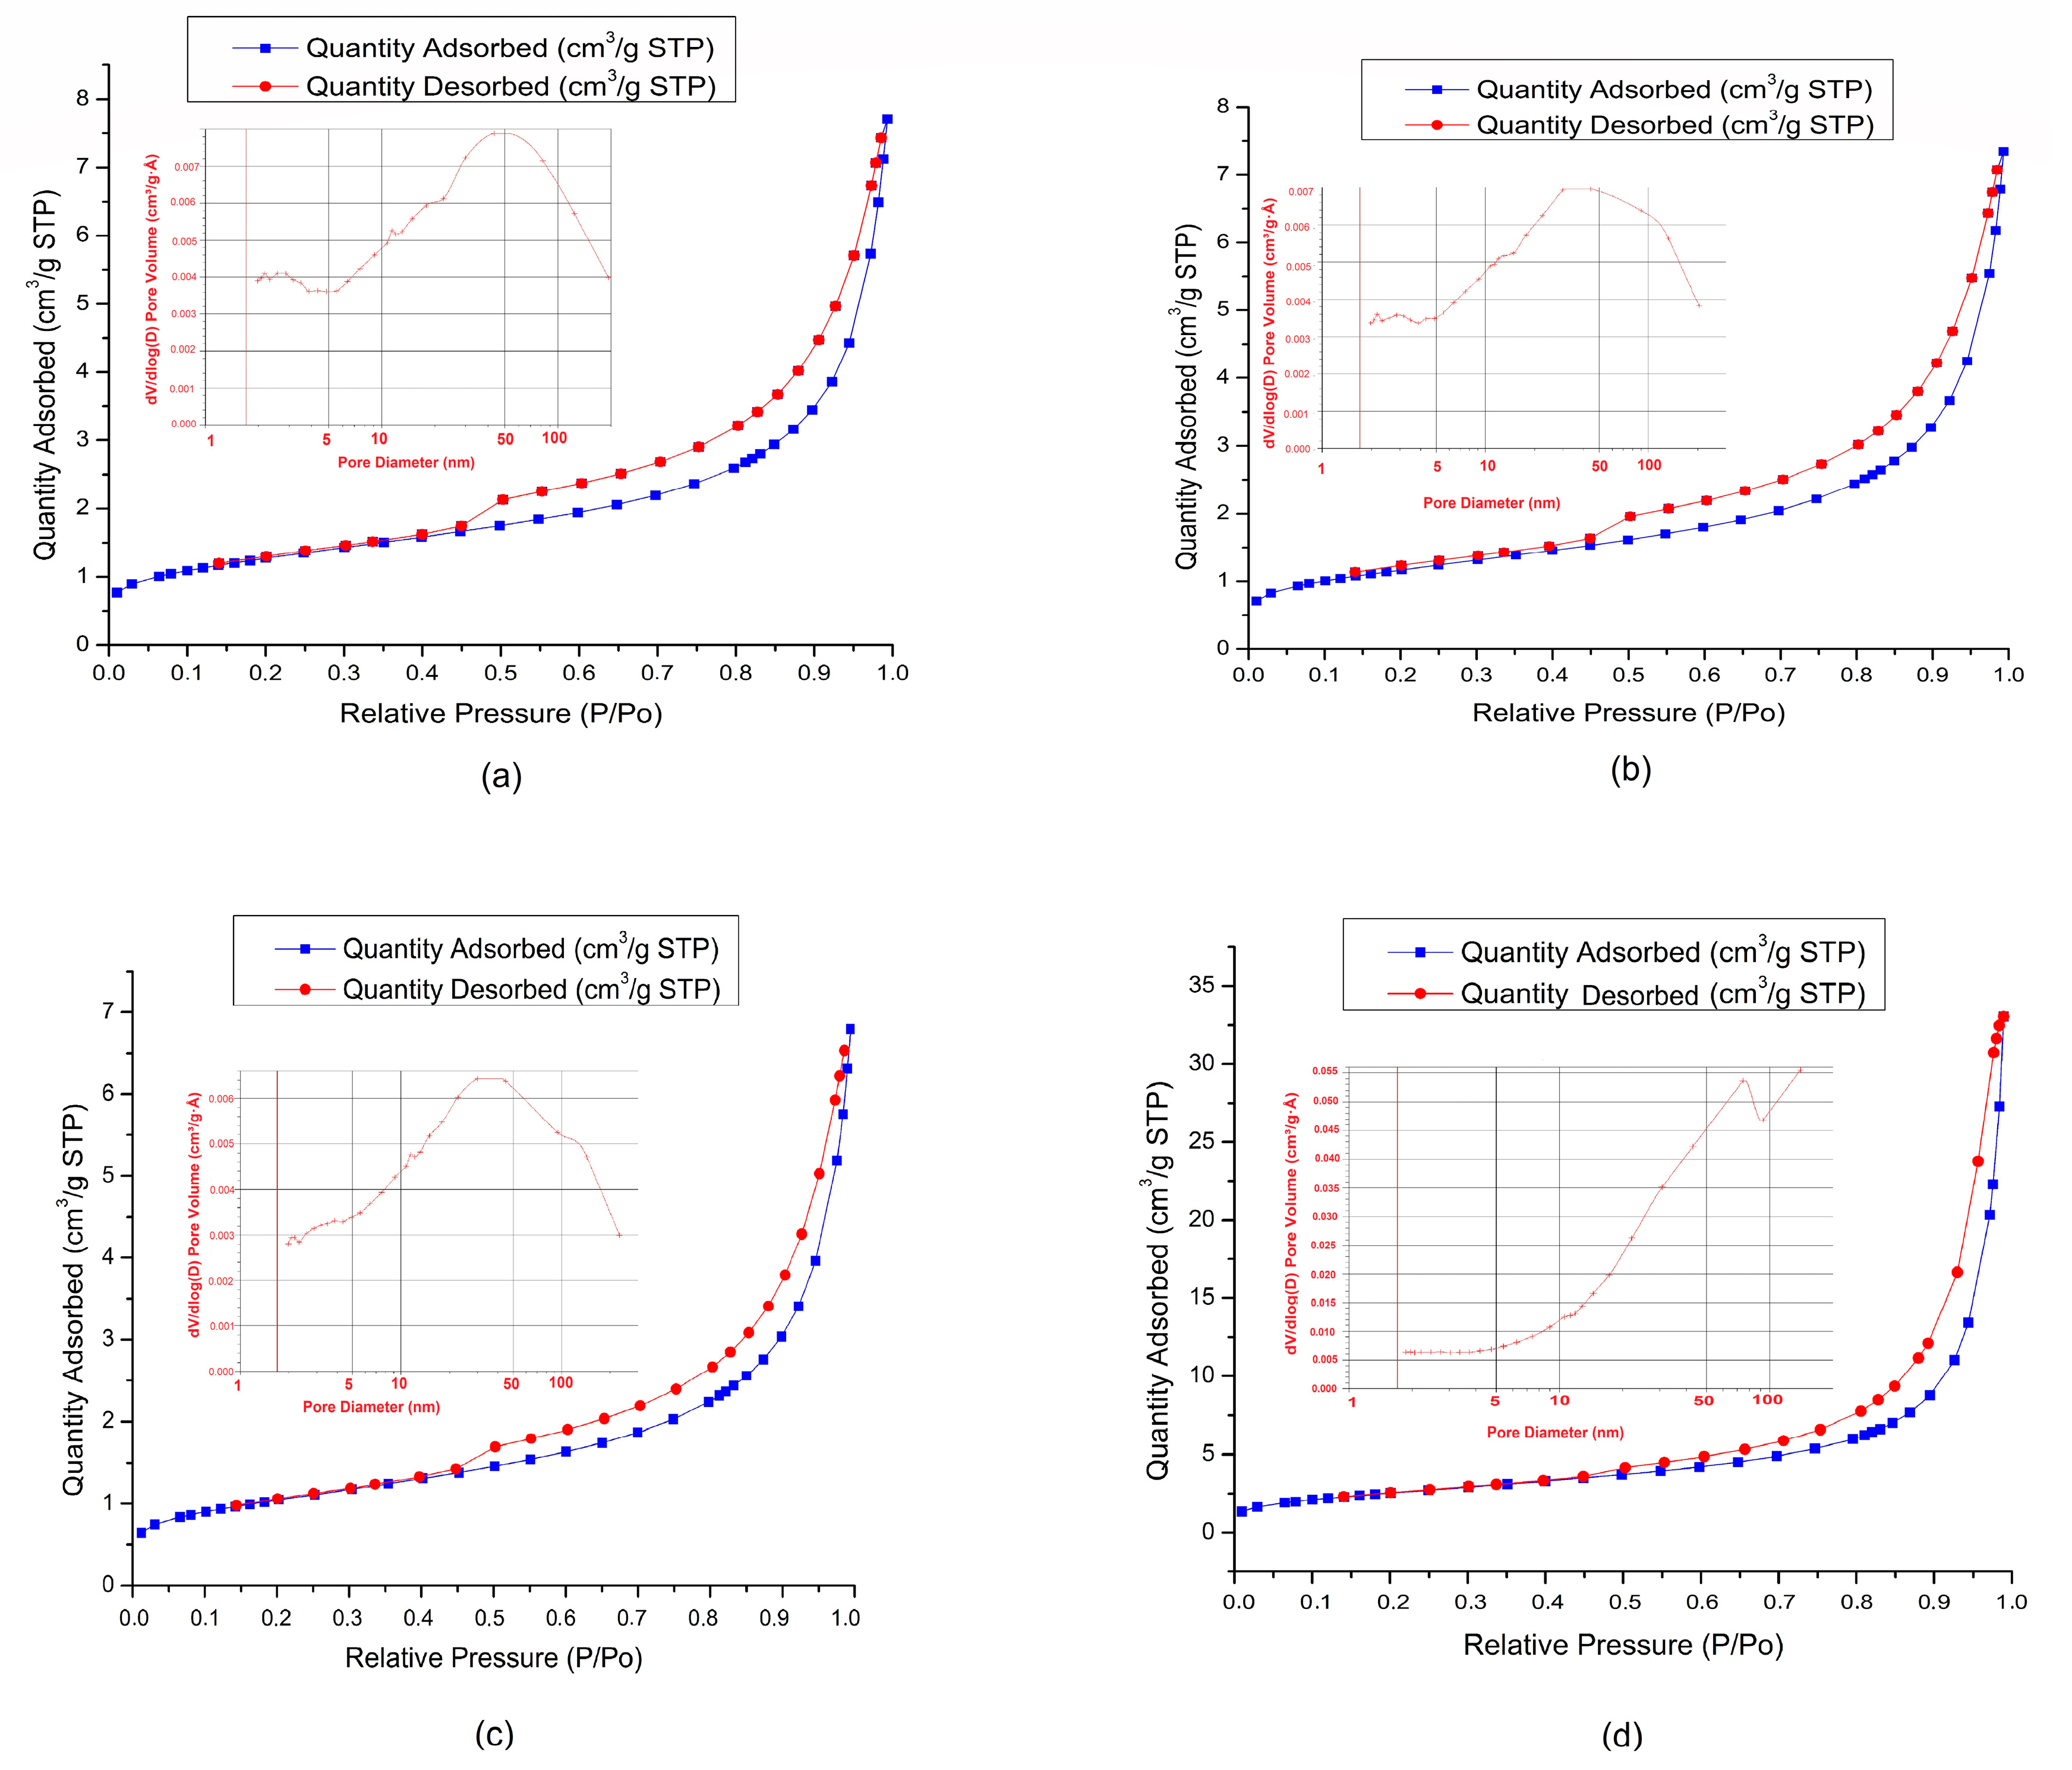
In order to investigate the surface characteristics of soil and OPBS, the BET surface area measurements were performed to provide information such as adsorption isotherms, specific surface area, pore volumes, and pore diameter. The collected gas adsorption/desorption isotherms of the samples are shown in Figure 7. The shape of isotherms corresponds to type IV which represents a mesoporous surface in which capillary condensation occurs. A hysteresis is generally observed between the adsorption and desorption curves. According to the gas adsorption isotherms, the OPBS has an adsorption volume of 33.05 (cm3/g STP) at the relative pressure (P/P0 = 0.99), whereas soil samples have maximum adsorption capacities of 7.70, 7.34, and 6.80 (cm3/g STP) for S1, S2, and S3, respectively. This result demonstrates the high adsorption capacity of OPBS when compared with soil samples. The specific surface area represents the total area divided by the mass unit (g) and refers to the gas adsorption rate into the available pores in low-temperature conditions. The average pore diameter shows that OPBS has a higher pore diameter of 20.73 (nm) compared to soil samples. It is common for particles with smaller pores to have a higher specific surface area, but the surface area of a given particle is also determined by the number of pores in that particle, i.e., its porosity. Consequently, a particle can have very small pores, but only in a limited number, resulting in a small specific surface area as demonstrated for Soils 1, 2, and 3 (Table 5). All the samples were dominated by mesopores as shown in the pore diameter distribution (Figure 7). However, the OPBS adsorption in the function of pore volume was greater than in soil samples indicating the higher number and volume of mesopores in OPBS compared to soil samples.

3.8. SEM Characterization

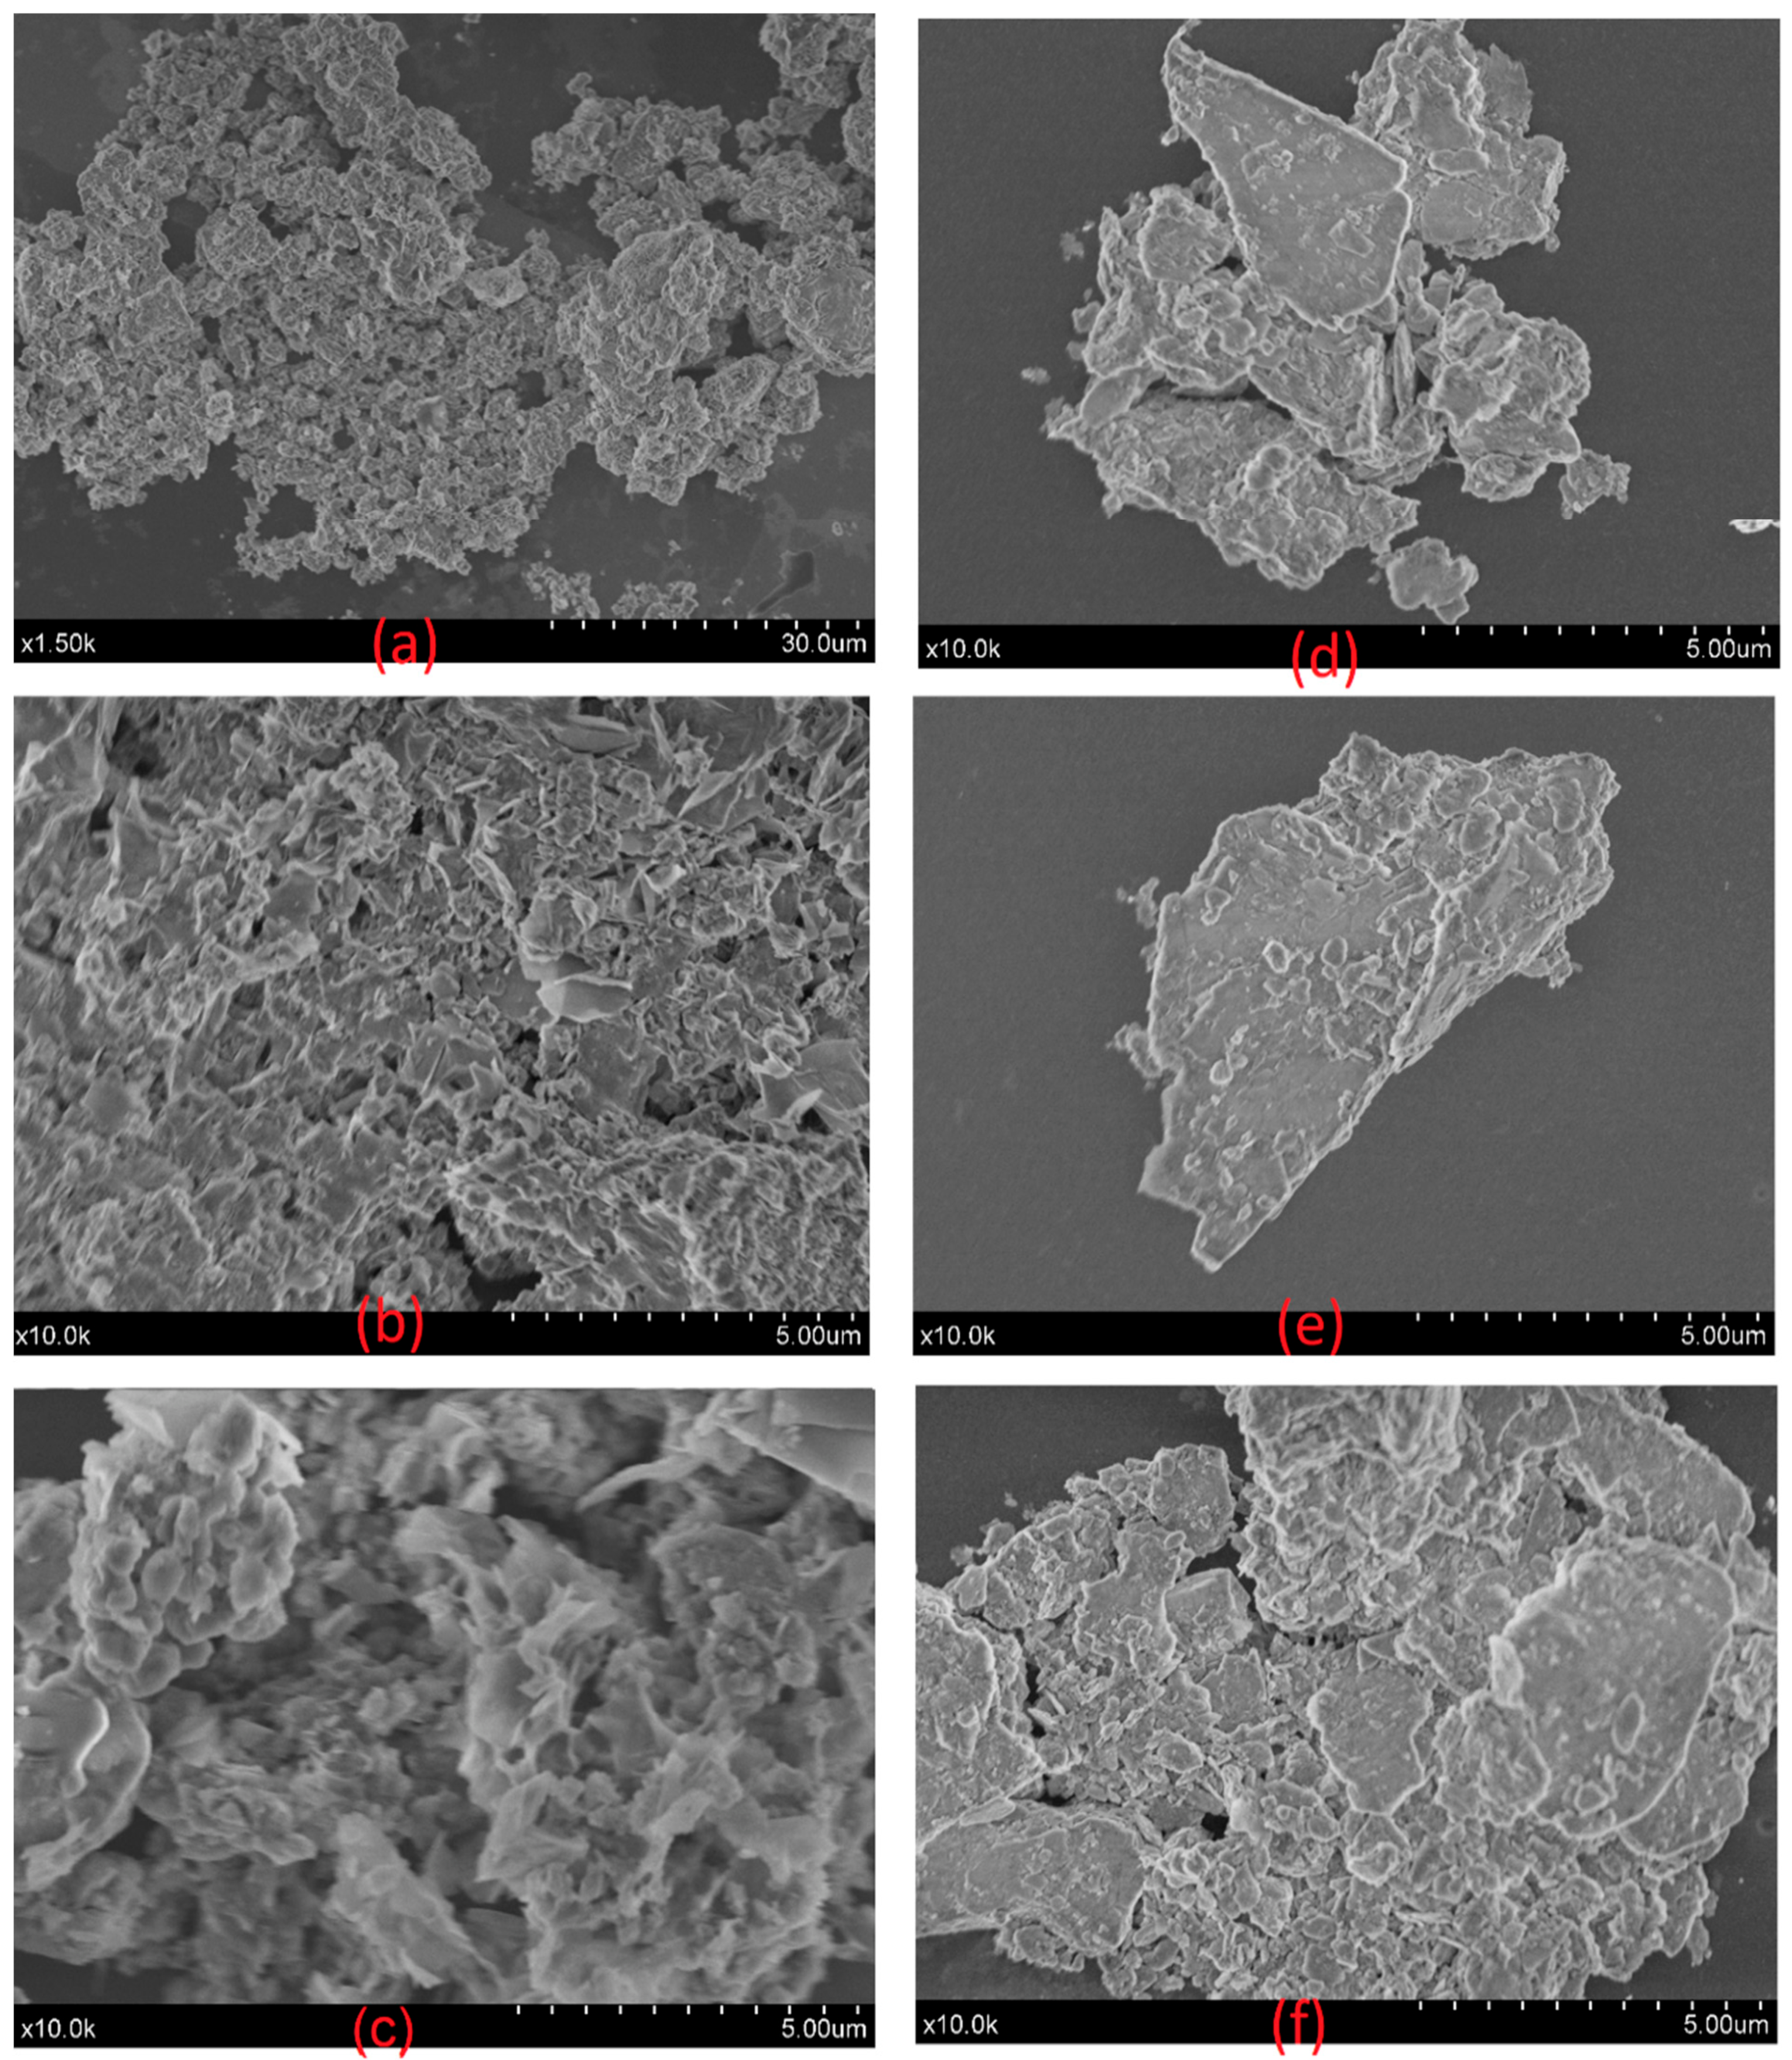
In order to explore the surface characteristics (texture, pore, and pore size) of soils and OPBS, SEM analyses are presented in Figure 8. Micrographs (d, e, and f) indicate that the soil samples had approximately the same size with a prismatic shape. The micrograph scale indicates that soil particles were large in diameter and display low porosity surfaces (micrographs d and e). Indeed, the absence of laminated and porous structures indicates the presence of clayey minerals and confirms the dominance of quartz in the soil samples. However, tiny layers have covered the quartz mineral in minor portions in some spots with a relatively low surface porosity (micrograph f). Unlike soil samples, the OPBS SEM observations demonstrate a larger porous area (micrographs a and b). In addition, the OPBS surface was characterized by a hollow surface with different pore size distributions (micrograph c). The SEM micrograph confirmed that the R’mel agricultural soils had principally a macrostructure composed mostly of larger SiO2 particles, as well as a reduced pore volume (macropores). In contrast, SEM analysis revealed the abundance of pore distribution on the OPBS surface. Finally, the OPBS morphological characteristics could be useful to fill the voids between soil particles and thereby increase the surface area and water-retention capacity of soil. Moreover, the available mesopore sites on the OPBS surface could interact with the soil–water solution and adsorb different pollutants.

4. Conclusions and Perspectives

The properties of three agricultural soils and olive pomace biomass slag (OPBS) were examined in this study to explore the possible use of OPBS as a soil additive and improver. The important findings are summarized in the following points:
(1)
The R’mel soils were coarser in texture, with low clay, silt, and OM, low CEC, limited adsorption sites, and poor nutrient availability. In contrast, the clayey fraction (FF) exhibited significant water content, OM, CaCO3, and heavy-metal adsorption capacity despite its low percentage in the soil (<5%).
(2)
The column experiments demonstrated that the R’mel soils had a low water- and NO3 retention capacity. Higher leaching rates in percolates were measured, even above the loaded quantities in experiment 1.
(3)
The examination of OPBS showed that this residue is non-toxic, has a significant amount of essential plant nutrients such as potassium and calcium, has a moderately porous internal structure, includes organic carbon, and has a high water-retention capacity.
(4)
The spreading of OPBS in R’mel soils might be supported by its higher agronomic value as a source of fertilizing elements necessary for plants (Ca, P, K, and C). OPBS can also have a direct/indirect effect on soil properties by improving the physical and chemical characteristics such as water-holding capacity, CEC, and adsorption capacity, and could contribute to the immobilization of trace elements in the soils.
Monitoring the soil and water quality in the R’mel area is currently not subject to any regulatory control. Moreover, very little data exists on the quality of groundwater and soil. The nature of the soil and the extent of the water table at a shallow depth make these waters sensitive to pollution by the surrounding agricultural activities. Therefore, it is certain that if nothing changes in the current behavior of farmers in the short term, the R’mel zone will be exposed to significant serious effects. This study intended to explain the main factors affecting groundwater quality in this area as well as propose a low-cost solution allowing the remediation and optimization of soil quality.

Author Contributions

Conceptualization, O.S. and F.E.M.; methodology, O.S.; software, O.S.; validation, O.S., F.E.M. and M.S.; formal analysis, J.B.; investigation, O.S.; resources, F.E.M., E.O. and J.M.; writing—original draft preparation, O.S. and F.E.M.; writing—review and editing, E.O., A.O., J.M. and F.E.M.; visualization, J.B.; supervision, M.S. and A.O.; project administration, M.S. and J.B.; All authors have read and agreed to the published version of the manuscript.

Funding

This research received no external funding.

Institutional Review Board Statement

Not applicable.

Informed Consent Statement

Not applicable.

Data Availability Statement

Not applicable.

Acknowledgments

The authors are thankful to Shimadzu and Merck Life Science Corporations for their continuous support.

Conflicts of Interest

The authors declare no conflict of interest.

References

  1. Neina, D. The Role of Soil PH in Plant Nutrition and Soil Remediation. Appl. Environ. Soil Sci. 2019, 2019, 5794869. [Google Scholar] [CrossRef] [Green Version]
  2. Jones, A. Soil Atlas of Africa; Publications Office of the European Union: Luxembourg, 2013. [Google Scholar]
  3. Keesstra, S.D.; Geissen, V.; Mosse, K.; Piiranen, S.; Scudiero, E.; Leistra, M.; van Schaik, L. Soil as a Filter for Groundwater Quality. Curr. Opin. Environ. Sustain. 2012, 4, 507–516. [Google Scholar] [CrossRef]
  4. Panagos, P.; Borrelli, P.; Poesen, J.; Ballabio, C.; Lugato, E.; Meusburger, K.; Montanarella, L.; Alewell, C. The New Assessment of Soil Loss by Water Erosion in Europe. Environ. Sci. Policy 2015, 54, 438–447. [Google Scholar] [CrossRef]
  5. Abd-Elmabod, S.K.; Bakr, N.; Muñoz-Rojas, M.; Pereira, P.; Zhang, Z.; Cerdà, A.; Jordán, A.; Mansour, H.; De la Rosa, D.; Jones, L. Assessment of Soil Suitability for Improvement of Soil Factors and Agricultural Management. Sustainability 2019, 11, 1588. [Google Scholar] [CrossRef] [Green Version]
  6. Amer, R. Spatial Relationship between Irrigation Water Salinity, Waterlogging, and Cropland Degradation in the Arid and Semi-Arid Environments. Remote Sens. 2021, 13, 1047. [Google Scholar] [CrossRef]
  7. Bhattacharyya, R.; Ghosh, B.N.; Mishra, P.K.; Mandal, B.; Rao, C.S.; Sarkar, D.; Das, K.; Anil, K.S.; Lalitha, M.; Hati, K.M. Soil Degradation in India: Challenges and Potential Solutions. Sustainability 2015, 7, 3528–3570. [Google Scholar] [CrossRef] [Green Version]
  8. Taghizadeh-Toosi, A.; Hansen, E.M.; Olesen, J.E.; Baral, K.R.; Petersen, S.O. Interactive Effects of Straw Management, Tillage, and a Cover Crop on Nitrous Oxide Emissions and Nitrate Leaching from a Sandy Loam Soil. Sci. Total Environ. 2022, 828, 154316. [Google Scholar] [CrossRef]
  9. Cui, X.; Wang, J.; Wang, J.; Li, Y.; Lou, Y.; Zhuge, Y.; Dong, Y. Soil Available Nitrogen and Yield Effect under Different Combinations of Urease/Nitrate Inhibitor in Wheat/Maize Rotation System. Agronomy 2022, 12, 1888. [Google Scholar] [CrossRef]
  10. Padilla, F.M.; Gallardo, M.; Manzano-Agugliaro, F. Global Trends in Nitrate Leaching Research in the 1960–2017 Period. Sci. Total Environ. 2018, 643, 400–413. [Google Scholar] [CrossRef]
  11. Lu, B.; Liu, X.; Dong, P.; Tick, G.R.; Zheng, C.; Zhang, Y.; Mahmood-UI-Hassan, M.; Bai, H.; Lamy, E. Quantifying Fate and Transport of Nitrate in Saturated Soil Systems Using Fractional Derivative Model. Appl. Math. Model. 2020, 81, 279–295. [Google Scholar] [CrossRef]
  12. Craswell, E. Fertilizers and Nitrate Pollution of Surface and Ground Water: An Increasingly Pervasive Global Problem. SN Appl. Sci. 2021, 3, 518. [Google Scholar]
  13. Stanley, J.; Reading, L. Nitrate Dynamics in Groundwater under Sugarcane in a Wet-Tropics Catchment. Heliyon 2020, 6, e05507. [Google Scholar] [CrossRef] [PubMed]
  14. Luo, X.; Kou, C.; Wang, Q. Optimal Fertilizer Application Reduced Nitrogen Leaching and Maintained High Yield in Wheat-Maize Cropping System in North China. Plants 2022, 11, 1963. [Google Scholar] [CrossRef]
  15. Ingraham, P.A.; Salas, W.A. Assessing Nitrous Oxide and Nitrate Leaching Mitigation Potential in US Corn Crop Systems Using the DNDC Model. Agric. Syst. 2019, 175, 79–87. [Google Scholar] [CrossRef]
  16. Wongsanit, J.; Teartisup, P.; Kerdsueb, P.; Tharnpoophasiam, P.; Worakhunpiset, S. Contamination of Nitrate in Groundwater and Its Potential Human Health: A Case Study of Lower Mae Klong River Basin, Thailand. Environ. Sci. Pollut. Res. 2015, 22, 11504–11512. [Google Scholar] [CrossRef]
  17. Huang, J.; Hartemink, A.E. Soil and Environmental Issues in Sandy Soils. Earth-Sci. Rev. 2020, 208, 103295. [Google Scholar] [CrossRef]
  18. Karathanasis, A.D.; Harris, W.G. Quantitative Thermal Analysis of Soil Materials. In Quantitative Methods in Soil Mineralogy; Soil Science Society of America: Madison, WI, USA, 1994; pp. 360–411. [Google Scholar]
  19. Li, C.; Zhou, K.; Qin, W.; Tian, C.; Qi, M.; Yan, X.; Han, W. A Review on Heavy Metals Contamination in Soil: Effects, Sources, and Remediation Techniques. Soil Sediment Contam. Int. J. 2019, 28, 380–394. [Google Scholar] [CrossRef]
  20. Bilecenoglu, M.; Kaya, M.; Eryigit, A. New Data on the Occurrence of Two Alien Fishes, Pisodonophis Semicinctus and Pomadasys Stridens, from the Eastern Mediterranean Sea. Mediterr. Mar. Sci. 2009, 10, 151. [Google Scholar] [CrossRef] [Green Version]
  21. Bakshi, M.; Abhilash, P.C. Nanotechnology for Soil Remediation: Revitalizing the Tarnished Resource. In Nano-Materials as Photocatalysts for Degradation of Environmental Pollutants; Elsevier: Amsterdam, The Netherlands, 2020; pp. 345–370. [Google Scholar]
  22. Yaqoob, A.A.; Parveen, T.; Umar, K.; Mohamad Ibrahim, M.N. Role of Nanomaterials in the Treatment of Wastewater: A Review. Water 2020, 12, 495. [Google Scholar] [CrossRef] [Green Version]
  23. Sarkar, A.; Sengupta, S.; Sen, S. Nanoparticles for Soil Remediation. In Nanoscience and Biotechnology for Environmental Applications; Springer: Berlin/Heidelberg, Germany, 2019; pp. 249–262. [Google Scholar]
  24. Prasad, R.; Bhattacharyya, A.; Nguyen, Q.D. Nanotechnology in Sustainable Agriculture: Recent Developments, Challenges, and Perspectives. Front. Microbiol. 2017, 8, 1014. [Google Scholar] [CrossRef] [Green Version]
  25. Alessandrino, L.; Colombani, N.; Aschonitis, V.G.; Mastrocicco, M. Nitrate and Dissolved Organic Carbon Release in Sandy Soils at Different Liquid/Solid Ratios Amended with Graphene and Classical Soil Improvers. Appl. Sci. 2022, 12, 6220. [Google Scholar] [CrossRef]
  26. Cheng, S.; Chen, T.; Xu, W.; Huang, J.; Jiang, S.; Yan, B. Application Research of Biochar for the Remediation of Soil Heavy Metals Contamination: A Review. Molecules 2020, 25, 3167. [Google Scholar] [CrossRef] [PubMed]
  27. Yang, X.; Zhang, S.; Ju, M.; Liu, L. Preparation and Modification of Biochar Materials and Their Application in Soil Remediation. Appl. Sci. 2019, 9, 1365. [Google Scholar] [CrossRef] [Green Version]
  28. Islam, T.; Li, Y.; Cheng, H. Biochars and Engineered Biochars for Water and Soil Remediation: A Review. Sustainability 2021, 13, 9932. [Google Scholar] [CrossRef]
  29. Liang, M.; Lu, L.; He, H.; Li, J.; Zhu, Z.; Zhu, Y. Applications of Biochar and Modified Biochar in Heavy Metal Contaminated Soil: A Descriptive Review. Sustainability 2021, 13, 14041. [Google Scholar] [CrossRef]
  30. Song, P.; Xu, D.; Yue, J.; Ma, Y.; Dong, S.; Feng, J. Recent Advances in Soil Remediation Technology for Heavy Metal Contaminated Sites: A Critical Review. Sci. Total Environ. 2022, 838, 156417. [Google Scholar] [CrossRef]
  31. Xu, D.-M.; Fu, R.-B.; Wang, J.-X.; Shi, Y.-X.; Guo, X.-P. Chemical Stabilization Remediation for Heavy Metals in Contaminated Soils on the Latest Decade: Available Stabilizing Materials and Associated Evaluation Methods-A Critical Review. J. Clean. Prod. 2021, 321, 128730. [Google Scholar] [CrossRef]
  32. Das, S.; Kim, G.W.; Hwang, H.Y.; Verma, P.P.; Kim, P.J. Cropping with Slag to Address Soil, Environment, and Food Security. Front. Microbiol. 2019, 10, 1320. [Google Scholar] [CrossRef]
  33. Liyun, Y.; Ping, X.; Maomao, Y.; Hao, B. The Characteristics of Steel Slag and the Effect of Its Application as a Soil Additive on the Removal of Nitrate from Aqueous Solution. Environ. Sci. Pollut. Res. 2017, 24, 4882–4893. [Google Scholar] [CrossRef] [Green Version]
  34. Wang, X.; Zhu, Y.; Hu, Z.; Zhang, L.; Yang, S.; Ruan, R.; Bai, S.; Tan, H. Characteristics of Ash and Slag from Four Biomass-Fired Power Plants: Ash/Slag Ratio, Unburned Carbon, Leaching of Major and Trace Elements. Energy Convers. Manag. 2020, 214, 112897. [Google Scholar] [CrossRef]
  35. Tosti, L.; van Zomeren, A.; Pels, J.R.; Dijkstra, J.J.; Comans, R.N.J. Assessment of Biomass Ash Applications in Soil and Cement Mortars. Chemosphere 2019, 223, 425–437. [Google Scholar] [CrossRef] [PubMed]
  36. Tanji, A.; Benicha, M.; Mrabet, R. Techniques de Production de l’arachide, Résultats d’enquêtes Au Loukkos. Bull. Transf. Technol. Agric. 2011. [Google Scholar] [CrossRef]
  37. Mourabit, F.; Ouassini, A.; Azmani, A.; Mueller, R. Nitrate Occurrence in the Groundwater of the Loukkos Perimeter. J. Environ. Monit. 2002, 4, 127–130. [Google Scholar] [CrossRef] [PubMed]
  38. El Bakouri, H.; Ouassini, A.; Morillo, J.; Usero, J. Pesticides in Ground Water beneath Loukkos Perimeter, Northwest Morocco. J. Hydrol. 2008, 348, 270–278. [Google Scholar] [CrossRef]
  39. Sarti, O.; Otal, E.; Morillo, J.; Ouassini, A. Integrated Assessment of Groundwater Quality beneath the Rural Area of R’mel, Northwest of Morocco. Groundw. Sustain. Dev. 2021, 14, 100620. [Google Scholar] [CrossRef]
  40. Hmamou, M.; Bounakaya, B. The role of artificial impoundments in improving agricultural production in the semi-arid regions of northern morocco. Geogr. Environ. Sustain. 2020, 13, 32–42. [Google Scholar] [CrossRef]
  41. Metson, A.J. Methods of Chemical Analysis for Soil Survey Samples; New Zealand Department of Scientific and Industrial Research: Wellington, New Zealand, 1961. [Google Scholar]
  42. Alam, M.T.; Dai, B.; Wu, X.; Hoadley, A.; Zhang, L. A Critical Review of Ash Slagging Mechanisms and Viscosity Measurement for Low-Rank Coal and Bio-Slags. Front. Energy 2021, 15, 46–67. [Google Scholar] [CrossRef]
  43. Wang, S.; Jiang, X.M.; Han, X.X.; Wang, H. Fusion Characteristic Study on Seaweed Biomass Ash. Energy Fuels 2008, 22, 2229–2235. [Google Scholar] [CrossRef]
  44. Zarabi, M.; Jalali, M. Leaching of Nitrogen and Base Cations from Calcareous Soil Amended with Organic Residues. Environ. Technol. 2012, 33, 1577–1588. [Google Scholar] [CrossRef]
  45. Mengel, K.; Kirkby, E.A.; Kosegarten, H.; Appel, T. Phosphorus. In Principles of Plant Nutrition; Springer: Dordrecht, The Netherlands, 2001; pp. 453–479. [Google Scholar]
  46. Jackson, R.S. 5—Site Selection and Climate. In Wine Science, 4th ed.; Jackson, R.S., Ed.; Food Science and Technology; Academic Press: San Diego, CA, USA, 2014; pp. 307–346. ISBN 978-0-12-381468-5. [Google Scholar]
  47. Fujii, K.; Hayakawa, C.; Panitkasate, T.; Maskhao, I.; Funakawa, S.; Kosaki, T.; Nawata, E. Acidification and Buffering Mechanisms of Tropical Sandy Soil in Northeast Thailand. Soil Tillage Res. 2017, 165, 80–87. [Google Scholar] [CrossRef]
  48. Yan, A.; Wang, Y.; Tan, S.N.; Mohd Yusof, M.L.; Ghosh, S.; Chen, Z. Phytoremediation: A Promising Approach for Revegetation of Heavy Metal-Polluted Land. Front. Plant Sci. 2020, 11, 359. [Google Scholar] [CrossRef] [PubMed]
  49. Remon, E. Tolérance et Accumulation Des Métaux Lourds Par La Végétation Spontanée Des Friches Métallurgiques: Vers de Nouvelles Méthodes de Bio-Dépollution. Ph.D. Thesis, Université Jean Monnet, Saint-Étienne, France, 2006. [Google Scholar]
  50. Stefanowicz, A.M.; Kapusta, P.; Zubek, S.; Stanek, M.; Woch, M.W. Soil Organic Matter Prevails over Heavy Metal Pollution and Vegetation as a Factor Shaping Soil Microbial Communities at Historical Zn–Pb Mining Sites. Chemosphere 2020, 240, 124922. [Google Scholar] [CrossRef] [PubMed]
  51. Atafar, Z.; Mesdaghinia, A.; Nouri, J.; Homaee, M.; Yunesian, M.; Ahmadimoghaddam, M.; Mahvi, A.H. Effect of Fertilizer Application on Soil Heavy Metal Concentration. Environ. Monit. Assess. 2010, 160, 83–89. [Google Scholar] [CrossRef] [PubMed]
  52. Kelepertzis, E. Accumulation of Heavy Metals in Agricultural Soils of Mediterranean: Insights from Argolida Basin, Peloponnese, Greece. Geoderma 2014, 221–222, 82–90. [Google Scholar] [CrossRef]
  53. Sun, C.; Liu, J.; Wang, Y.; Sun, L.; Yu, H. Multivariate and Geostatistical Analyses of the Spatial Distribution and Sources of Heavy Metals in Agricultural Soil in Dehui, Northeast China. Chemosphere 2013, 92, 517–523. [Google Scholar] [CrossRef]
  54. Mertens, J.; Smolders, E. Zinc. In Heavy Metals in Soils: Trace Metals and Metalloids in Soils and Their Bioavailability, 3rd ed.; Alloway, B.J., Ed.; Springer: Berlin, Germanry, 2013; pp. 465–493. [Google Scholar]
  55. Batra, V.S.; Urbonaite, S.; Svensson, G. Characterization of Unburned Carbon in Bagasse Fly Ash. Fuel 2008, 87, 2972–2976. [Google Scholar] [CrossRef]
  56. Motesharezadeh, B.; Bell, R.W.; Ma, Q. Lime Application Reduces Potassium and Nitrate Leaching on Sandy Soils (Die Kalkanwendung Reduziert Das Auswaschen von Kalium Und Nitrat Auf Sandigen Böden). J. Kult. 2021, 73, 83–93. [Google Scholar]
  57. Wang, L.; Skjevrak, G.; Hustad, J.E.; Skreiberg, Ø. Investigation of Biomass Ash Sintering Characteristics and the Effect of Additives. Energy Fuels 2014, 28, 208–218. [Google Scholar] [CrossRef]
  58. Nurmesniemi, H.; Mäkelä, M.; Pöykiö, R.; Manskinen, K.; Dahl, O. Comparison of the Forest Fertilizer Properties of Ash Fractions from Two Power Plants of Pulp and Paper Mills Incinerating Biomass-Based Fuels. Fuel Process. Technol. 2012, 104, 1–6. [Google Scholar] [CrossRef]
  59. Mandal, J.K.; Mukherjee, S.; Saha, N.; Halder, N.; Biswas, T.; Chakraborty, S.; Hassan, S.; Hassan, M.M.; Abo-Shosha, A.A.; Hossain, A. Assessing the Capability of Chemical Ameliorants to Reduce the Bioavailability of Heavy Metals in Bulk Fly Ash Contaminated Soil. Molecules 2021, 26, 7019. [Google Scholar] [CrossRef]
  60. Querol, X.; Alastuey, A.; Moreno, N.; Alvarez-Ayuso, E.; García-Sánchez, A.; Cama, J.; Ayora, C.; Simón, M. Immobilization of Heavy Metals in Polluted Soils by the Addition of Zeolitic Material Synthesized from Coal Fly Ash. Chemosphere 2006, 62, 171–180. [Google Scholar] [CrossRef] [PubMed]
  61. Dermatas, D.; Meng, X. Utilization of Fly Ash for Stabilization/Solidification of Heavy Metal Contaminated Soils. Eng. Geol. 2003, 70, 377–394. [Google Scholar] [CrossRef]
  62. Ciccu, R.; Ghiani, M.; Peretti, R.; Serci, A.; Zucca, A. Heavy Metal Immobilization Using Fly Ash in Soils Contaminated by Mine Activity. In Proceedings of the 2001 International Ash Utilization Symposium, Lexington, KY, USA, 22–24 October 2001. [Google Scholar]
  63. Hu, X.; Huang, X.; Zhao, H.; Liu, F.; Wang, L.; Zhao, X.; Gao, P.; Li, X.; Ji, P. Possibility of Using Modified Fly Ash and Organic Fertilizers for Remediation of Heavy-Metal-Contaminated Soils. J. Clean. Prod. 2021, 284, 124713. [Google Scholar] [CrossRef]
  64. Ciccu, R.; Ghiani, M.; Serci, A.; Fadda, S.; Peretti, R.; Zucca, A. Heavy Metal Immobilization in the Mining-Contaminated Soils Using Various Industrial Wastes. Miner. Eng. 2003, 16, 187–192. [Google Scholar] [CrossRef]
  65. Ou, Y.; Ma, S.; Zhou, X.; Wang, X.; Shi, J.; Zhang, Y. The Effect of a Fly Ash-Based Soil Conditioner on Corn and Wheat Yield and Risk Analysis of Heavy Metal Contamination. Sustainability 2020, 12, 7281. [Google Scholar] [CrossRef]
  66. Chong, I.Q.; Azman, E.A.; Ng, J.F.; Ismail, R.; Awang, A.; Hasbullah, N.A.; Murdad, R.; Ahmed, O.H.; Musah, A.A.; Alam, M.A. Improving Selected Chemical Properties of a Paddy Soil in Sabah Amended with Calcium Silicate: A Laboratory Incubation Study. Sustainability 2022, 14, 13214. [Google Scholar] [CrossRef]
  67. Bruand, A.; Hartmann, C.; Lesturgez, G. Physical Properties of Tropical Sandy Soils: A Large Range of Behaviours. In Management of Tropical Sandy Soils for Sustainable Agriculture; A Holistic Approach for Sustainable Development of Problem Soils in the Tropics; FAO: Rome, Italy, 2005. [Google Scholar]
  68. Matichenkov, V.V.; Bocharnikova, E.A.; Calvert, D.V.; Snyder, G.H. Comparison Study of Soil Silicon Status in Sandy Soils of South Florida. In Proceedings of the Fifty-Ninth Annual Meeting of the Soil and Crop Science Society of Florida, Sarasota, FL, USA, 22–24 September 1999; Volume 59, pp. 132–137. [Google Scholar]
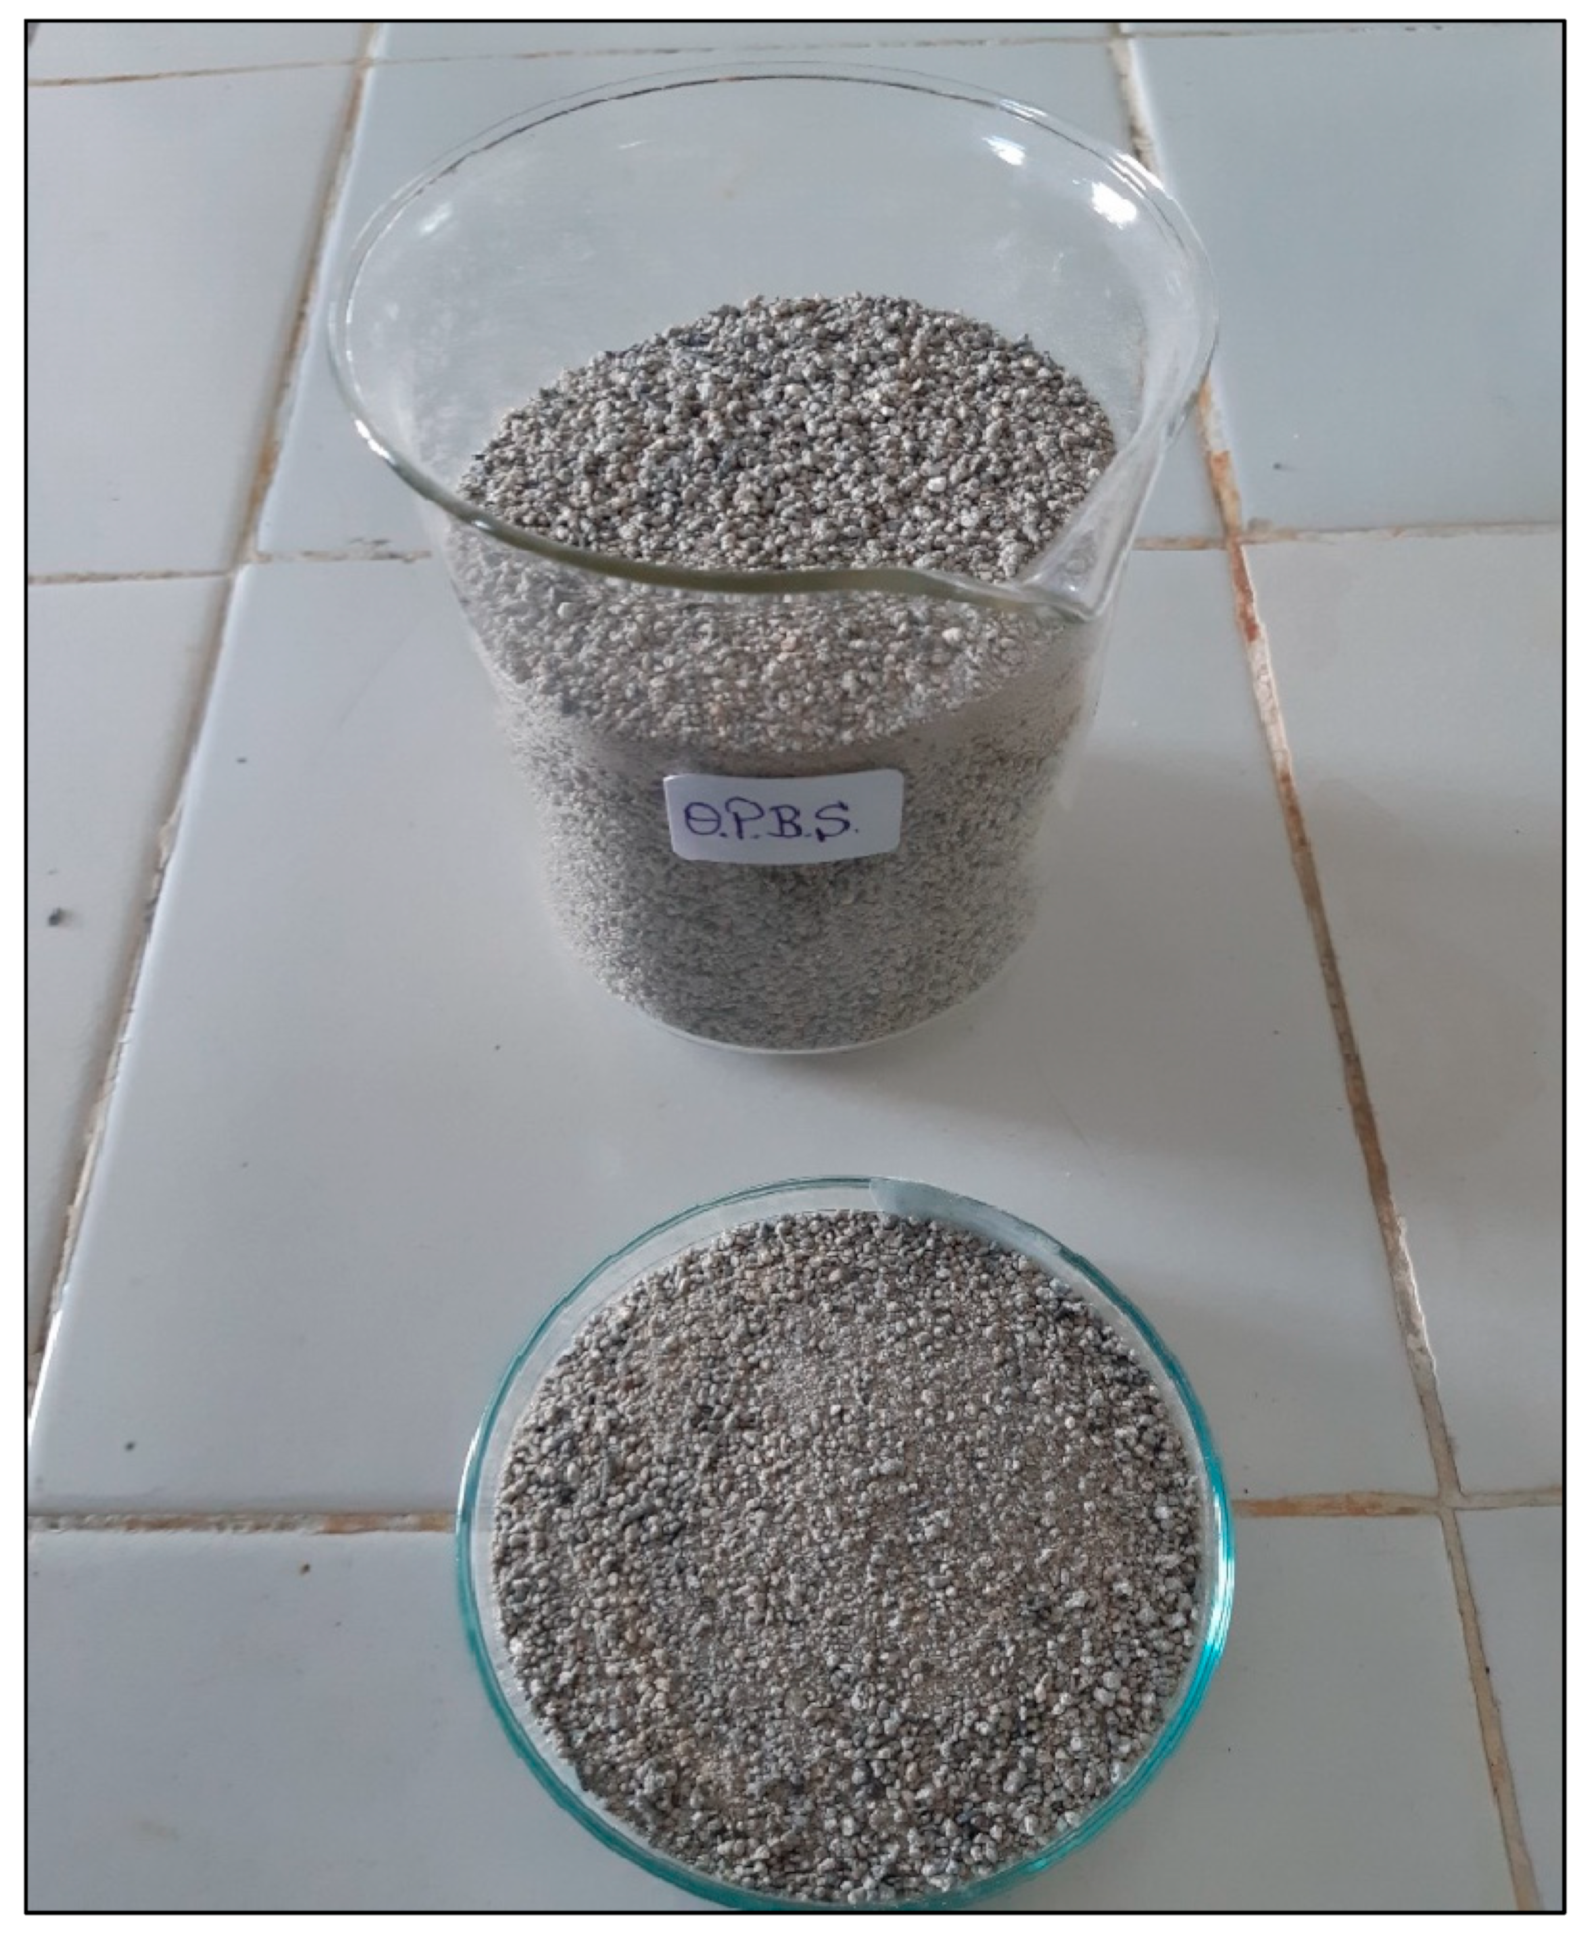
Figure 1. Slag residue from olive pomace combustion (OPBS).
Carbon 09 00001 g001
Figure 2. Daily applied concentration of nitrate during experiment 1 (C1, C2, and C3) and experiment 2 (C4, C5, and C6).
Carbon 09 00001 g002
Figure 3. Column setup for the nitrate-leaching experiments of the R’mel soils.
Carbon 09 00001 g003
Figure 4. NO3 leaching from experiment 1 (a) and experiment 2 (b).
Carbon 09 00001 g004
Figure 5. Thermal decomposition profiles of the R’mel soils: (ac) represent the TGA/DSC curves for the complete fraction of Soils 1, 2, and 3, respectively. Images (df) represent the TGA/DSC curves for the fine fraction (<63 µm) of Soils 1, 2, and 3 respectively.
Carbon 09 00001 g005
Figure 6. XRD analysis of the three soils, S1, S2, and S3, and OPBS: 1 = (SiO2), 2 = (CaCO3), 3 = (CaMg, (CO3)2) 4 = (K2Ca (CO3)2), 5 = (CaO).
Carbon 09 00001 g006
Figure 7. N2 adsorption–desorption isotherms and pore size distribution diagrams of (a) Soil 1, (b) Soil 2, (c) Soil 3, and (d) OPBS.
Carbon 09 00001 g007
Figure 8. SEM micrographs (different magnifications) of OPBS (ac) and soils (df).
Carbon 09 00001 g008
Table 1. Physicochemical analysis of soil samples.
ParameterS01S02S03Mean
pH7.278.756.337.55
EC (mS/Cm)0.260.230.320.27
OM % CF2.812.361.572.25
OM % FF9.117.57.658.09
CEC (meq/100 g)9.289.118.188.86
Bulk density1.281.341.321.31
Sand %95.8495.8795.4295.71
Silt %1.182.472.331.99
Clay %2.982.361.662.33
PO34− (g·Kg−1) *1.262.040.811.37
Ca (g·Kg−1) *7.513.375.248.7
Fe (g·Kg−1) *43.7647.4146.1945.79
K (g·Kg−1) *3.483.1582.052.9
Mg (g·Kg−1) *4.584.863.424.29
Mn (g·Kg−1) *1.621.351.531.5
Na (g·Kg−1) *0.330.270.180.26
As (mg·Kg−1) *62.353.35857.9
Cd (mg·Kg−1) *6.82.641.483.6
Co (mg·Kg−1) *22.120.332.625
Cr (mg·Kg−1) *123.5125.489.6112.8
Cu (mg·Kg−1) *108.138.917.154.7
Mo (mg·Kg−1) *2.840.820.971.5
Ni (mg·Kg−1) *52.436.648.645.9
Pb (mg·Kg−1) *37.323.127.629.4
Zn (mg·Kg−1) *224.7162.14114.25167
* analyzed in the fine fraction (FF) of soil.
Table 2. pH, moisture content, unburned carbon, and major elements in OPBS.
ParameterpHMoisture %Unburned Carbon %Ca %Fe %K%Mg%Na%
OPBS12.17.1819.9710.590.958.241.560.15
Table 3. Trace element composition in OPBS.
Trace Element in (mg. Kg−1)AsCdCoCrCuMnMoNiPbZn
OPBS2.120.252.4948.4348.30396.331.7242.641.9347.34
Table 4. Chemical composition of the three soil samples and Olive Pomace Biomass Slag (OPBS).
SampleSiO2Al2O3Fe2O3MnOMgOCaONa2OK2OTiO2P2O5SO3%Mineral Fraction
F.F 155.1710.869.90.31.571.730.781.420.750.610.2183.3
C.F 171.437.195.940.160.551.030.760.940.550.340.1589.04
F.F 258.7911.099.760.231.592.560.761.380.710.530.1787.57
C.F 272.457.455.000.160.531.210.721.110.450.380.1489.6
F.F 360.6412.5110.740.31.31.010.511.30.810.370.1389.62
C.F 375.707.235.520.190.420.540.631.010.480.320.0992.13
OPBS26.293.261.070.053.5222.380.5617.630.122.751.4179.04
(Note: F.F = Fine-soil fraction (<63 µm); C.F = complete-soil fraction; OPBS = Olive Pomace Biomass Slag).
Table 5. BET specific surface area (SSA) and pore volumes of soil samples.
SampleS1S2S3Biomass Slag
BET surface area (m2/g)4.564.183.749.37
Langmuir surface area (m2/g)6.305.795.2013.20
Total pore volume (cm3/g)0.0088680.0085740.0080340.031480
Pore diameter (nm)11.986912.359212.588120.73
Disclaimer/Publisher’s Note: The statements, opinions and data contained in all publications are solely those of the individual author(s) and contributor(s) and not of MDPI and/or the editor(s). MDPI and/or the editor(s) disclaim responsibility for any injury to people or property resulting from any ideas, methods, instructions or products referred to in the content.