Article

Enhanced Breaking of Lignin and Mesopore Formation in Zinc Chloride Assisted Hydrothermal Carbonization of Waste Biomasses

Institute of Chemistry, Carl von Ossietzky University Oldenburg, Carl-von-Ossietzky-Str. 9-11, 26129 Oldenburg, Germany
*
Author to whom correspondence should be addressed.
Submission received: 30 September 2021 / Revised: 4 November 2021 / Accepted: 6 November 2021 / Published: 11 November 2021

Abstract

:
Hydrochars from hydrothermal carbonization of different biowaste materials (dried dandelion, sawdust, coconut shell powder) formed in the presence of aqueous salt solutions were compared to those obtained by the common method in pure water. Hydrochars with increased carbon contents, pore volume and surface areas were specifically obtained from coconut shell powder in the presence of zinc chloride. Compositional and structural changes within the hydrochar products caused by the process conditions and/or the additive were characterized by solid state 13C NMR spectroscopy, proving that cellulose and, in particular, lignin units in the biomass are more easily attacked in the presence of the salt. Under saline conditions, a distinct particle break-up led to the creation of mesoporosity, as observable from hysteresis loops in nitrogen adsorption isotherms, which were indicative of the presence of pores with diameters of about 3 to 10 nm. The obtained hydrochars were still rich in functional groups which, together with the mesoporosity, indicates the compounds have a high potential for pollutant removal. This was documented by adsorption capacities for the methylene blue and methyl orange dyes, which exceeded the values obtained for other hydrochar-based adsorbers. A subsequent physical activation of the mesoporous hydrochars in steam at different temperatures and times resulted in a further drastic increase in the surface areas, of up to about 750 m2/g; however, this increase is mainly due to micropore formation coupled with a loss of surface functionality. Consequently, the adsorption capacity for the quite large dyes does not provide any further benefit, but the uptake of smaller gas molecules is favored.

Graphical Abstract

1. Introduction

Hydrothermal carbonization (HTC) provides a green and sustainable process, allowing the production of a variety of carbonaceous materials starting from cheap natural precursors, such as plant biomass, manure or digestates, under comparatively mild hydrothermal conditions [1]. In recent years, comparable processes such as the conversion of various biomasses by means of vapothermal carbonization (VTC), which uses a water–vapor phase instead of a liquid phase, or wet torrefaction, have also gained in importance. The latter process is particularly applicable because smaller amounts of highly contaminated process water are produced than in HTC [2,3,4]. Further processes to convert biomasses to biooils or high-energy density fuels are torrefaction and valorization [5,6].
The obtained hydrochars from HTC have received increasing interest in various relevant fields of the chemical industry, such as for catalysis, water purification, energy storage and CO2 sequestration [7,8]. However, due to their low degree of porosity and small internal surface areas of less than 10 m2/g [9], the hydrochars mainly serve as precursors instead of competitive substitutes to the energy expensive activated carbons received by pyrolysis at high temperatures [10,11,12,13]. In principle, chars obtained from HTC exhibit great potential as substrates for the synthesis of highly porous carbon materials due to their preferable characteristics, such as their oxygenated functional groups which can catalyze subsequent activation reactions [14]. The creation of carbons with high surface porosity by HTC was achieved from pure glucose in the presence of salt/water mixtures. The hydrophilic ions of the commonly available salts are supposed to alter the partial pressure of the water being in contact with the carbon phase [15]. With a eutectic mixture of lithium chloride and zinc chloride in the presence of water, a high surface area for carbons from glucose was obtained (673 m2/g). However, due to their extreme structural complexity and diversity, natural raw lignocellulosic biomasses have not received much attention as substrates for HTC conversion to porous hydrochars. One of the available studies shows a slight increase in surface area to 69.45 m2/g if the hydrothermal carbonization of corncob was carried out under saline conditions [16]. In general, real biomass hydrochars have much smaller specific surface areas than chars obtained from pyrolysis [4,17,18]. A subsequent activation can act as a further carbonization step increasing the aromatic content, the porosity and the stability of the hydrochars [13]. Steam is used in physical activation tests [19,20,21]; for chemical activation KOH, NaOH or H3PO4 are used. For example, KOH acts as a catalyst and oxidizing agent, and the occurring reactions can be understood as in situ alkali-catalyzed gasification; specific surface areas up to 2.000 m2/g were obtained, which can mainly be attributed to the formation of small micropores with diameters less than 2 nm [22,23,24].
The main goal of our research, however, was to study the impact of the presence of ZnCl2 salt on the formation of mesoporous hydrochars with pores having a size of about 3–10 nm resulting directly from the HTC of complex biomass substrates. For this, three easily available biowaste products were chosen, i.e., dried dandelion, sawdust and coconut shell powder. Elemental composition, morphology, functionality and surface areas of the obtained hydrochars were studied by scanning electron microscopy (SEM), infrared spectroscopy (FTIR), and nitrogen sorption, respectively. Dye adsorption studies on selected hydrochars were carried out to demonstrate the advantages of their porosity and surface functionality for a later application as an adsorbent in pollutant removal. It was shown before that hydrochars can have comparable adsorption capacities as oil-based activated carbons, indicating a potential application of low-cost chars obtained by HTC of waste biomasses. Alatalo et al. described the use of hydrochars from fructose conversion by HTC in the presence of a hypersaline salt mixture (LiCl/ZnCl2) and found fast adsorption controlled by intraparticle diffusion [25]. By simple washing with ethanol, the dye could be desorbed, and the char could be recycled for further dye removal loops.
In a subsequent process we further treated the hydrochars by means of a physical activation with steam at different activation temperatures to elucidate the potential and drawbacks of this treatment.

2. Experimental

The HTC was performed at relatively mild conditions, i.e., 180–220 °C for reaction times of 4–20 h, either in water (further called “normal HTC”) or in a salt–water mixture containing zinc chloride (further called “salt HTC”). After the HTC, the obtained hydrochars were collected by vacuum filtration, washed with water to remove the residual salt, dried at 105 °C overnight, ground and size-selected with a sieve having a mesh size of 0.63 mm.

2.1. Materials

Coconut shell powder (Cn) was kindly provided by Mahlwerk Neubauer-Friedrich Geffers GmbH as Coconut 0.2–0.4 and was used as received. Dried dandelion (Dd) was obtained from the online shop “kaninchenladen.de” and shredded in a Kenwood CH580 chopper. Sawdust (Sd) was picked up from the mechanical workshop section of the Carl von Ossietzky University Oldenburg, Germany; it represents a random mixture of wood being processed in the workshop at that time and was used as received. Lithium chloride (p.a.) was obtained from VWR and zinc chloride (≥98%) was acquired from Sigma Aldrich. The dyes were received from AplliChem (methylene blue) and Alfa Aesar (methyl orange). All chemicals were used without further purification.

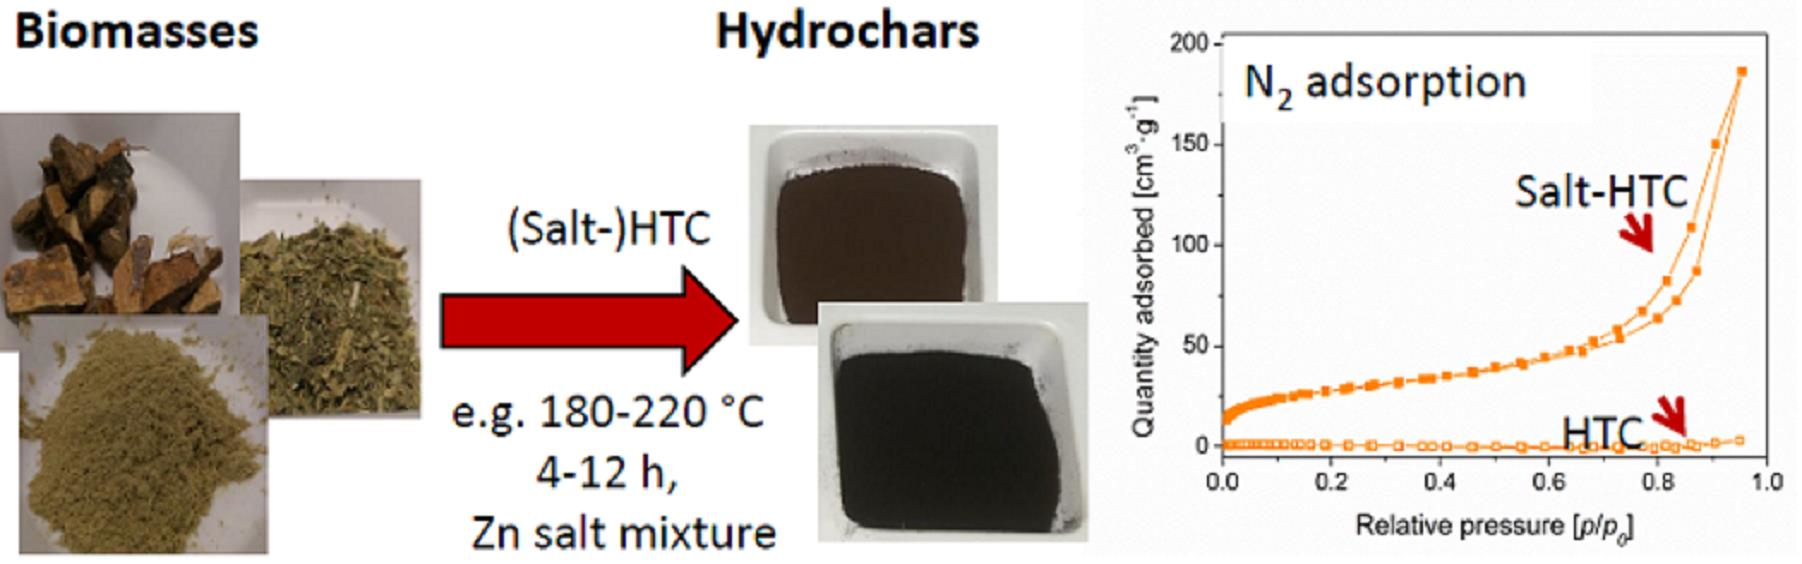
2.2. Hydrothermal Carbonization

The biomass substrates (9 g) were mixed either with 180 mL of pure water (Cn-HTC) or with 22.5 g freshly ground ZnCl2 salt (Cn-HTC Zn) dissolved in the same volume of water. Each mixture was filled into a 200 mL PTFE inlet and placed into a stainless-steel autoclave, which was put in an oven at 180 °C for 12 h. For some HTC experiments the temperature and time were varied (200 or 220 °C and 4–20 h, respectively). After cooling to room temperature, the solid product was ground by hand in a porcelain mortar and stirred in 1 L of water overnight. Afterwards, the samples were collected by vacuum filtration, Soxhlet extracted with water and ethanol to remove any residual salts, and dried at 105 °C overnight. The obtained hydrochars were ground once more and passed through a sieve with a mesh size of 0.63 mm. Thus, all agglomerates were crushed to particles smaller than 0.63 mm.

2.3. Steam Activation

All the steam activated chars were previously processed by HTC. For the steam activation, 2–3 g of each hydrochar obtained by HTC was loaded into a ceramic crucible and placed into a glass inlet of a tube furnace and heated. Upon reaching the desired temperature, the steam originating from a simple heating of water in a connected 500 mL Erlenmeyer flask was allowed to flow through the glass inlet for 1 h. For the coconut substrate, two modifications of the activation were conducted: Activation at (a) 500 °C at different times of steam flow (t = 10, 30, 60 min, e.g., Cn-Act10min) or (b) for 60 min at different temperatures (T = 200, 350, 500, 650 °C, e.g., Cn-Act200C). After cooling, the thus-activated hydrochars were analyzed without further treatment except if otherwise noted under the specific characterization techniques.

2.4. Characterization Techniques

A EuroEA Elemental Analyser (HEKAtech GmbH) was used to determine the carbon, hydrogen and nitrogen contents of the hydrochars. Inorganic elemental concentrations were measured after incinerating 0.2 g of each sample in a muffle furnace at 550 °C for 7 h. Fourier transform infrared (FTIR) spectroscopy was conducted using a Bruker Tensor FTIR spectrometer in the range from 500 to 4000 cm−1. Scanning electron microscopy (SEM) was used to determine the surface morphology of the samples with a Hitachi S3200N microscope being equipped with an INCA X-act silicon drift detector from Oxford Instruments for EDX measurements. Nitrogen sorption measurements were accomplished with N2 at 77 K on a Micromeritics TRISTAR II or a Micromeritics ASAP 2020. Prior to the measurements, the samples were degassed under vacuum first at 80 °C for 1 h and subsequently at 150 °C overnight. The specific surface areas were calculated according to the Brunauer–Emmett–Teller (BET) formalism using adsorption data in the relative pressure range p/p0 < 0.3 in further agreement with criteria proposed by Rouquerol et al. [26].
For the solid-state NMR measurements in this work, a Bruker Avance III HD spectrometer connected to a Ascend™ 500 cryomagnet (11.75 T) was used for the characterization of different hydrochars. The corresponding Larmor frequencies were 500.45 and 125.84 MHz for 1H and 13C, respectively. The rotating frequency used was 15 kHz; a standard 4.0 mm CP/MAS probe head (Bruker WVT-type) was employed. One-dimensional spectra were recorded with the hahnecho pulse sequence and with cross polarization technique (CP pulse sequence) to enhance 13C spectra. Therefore, the relaxation times of the protons were determined by classical saturation recovery experiments. Pulse lengths were 3.13 and 4.20 μs at power levels of 107.05 and 94.37 W for 1H and 13C, respectively. Si(SiMe3)4 served as primary reference to determine the chemical shifts. The controlled temperature of the bearing gas (300.0 K) and a calibration curve of the reference material led to an estimated sample temperature of 338 ± 2 K. Up to 12,000 scans were accumulated using relaxation delays of 3 to 8 s, resulting in acquisition times between 2.5 h and 1 day for each spectrum. Peaks and peak areas were assigned by comparing constituents found in biomass building blocks (cellulose and lignin) with those found in the structurally complex biomass. In addition, they were compared to data from the literature [27,28,29].

2.5. Dye Adsorption Studies

The adsorption experiments with methylene blue (MB) and methyl orange (MO) were performed with selected hydrochars using a modified procedure based on a publication by Islam et al. [30]. For this, 40 mL of methylene blue or methyl orange solution (initial concentration of 100 mg/L) were added to a small amount (50 mg) of char in a 50 mL plastic tube. The mixture was shaken at 250 rpm for different time periods (up to 30 h) at room temperature with a Dual-Action Shaker KL 2 (Edmund Buehler GmbH). After the desired time, the residual concentration in the solution was analyzed using a Varian Cary 4000 spectrophotometer at 664 nm after filtering the adsorbent with syringe filters (0.2 µm, Sarstedt GmbH) to make it carbon-free and diluting it with water by a factor of 20. The amount of dye removed from the solution is reported as qt in mg/g; it was calculated according to Equation (1):
q t = ( C 0 C t ) V m
where C0 and Ct are the initial dye concentration and the concentration after the desired time in mg/L, respectively, V is the volume of used dye solution (L), and m is the weight of the adsorbent (g). To reduce the error of the adsorption data, each sample was tested three times, and the average is reported. If the adsorption time was chosen long enough to reach the equilibrium state, Ct changes to Ce and the corresponding adsorption capacity is given as qe.

3. Results and Discussion

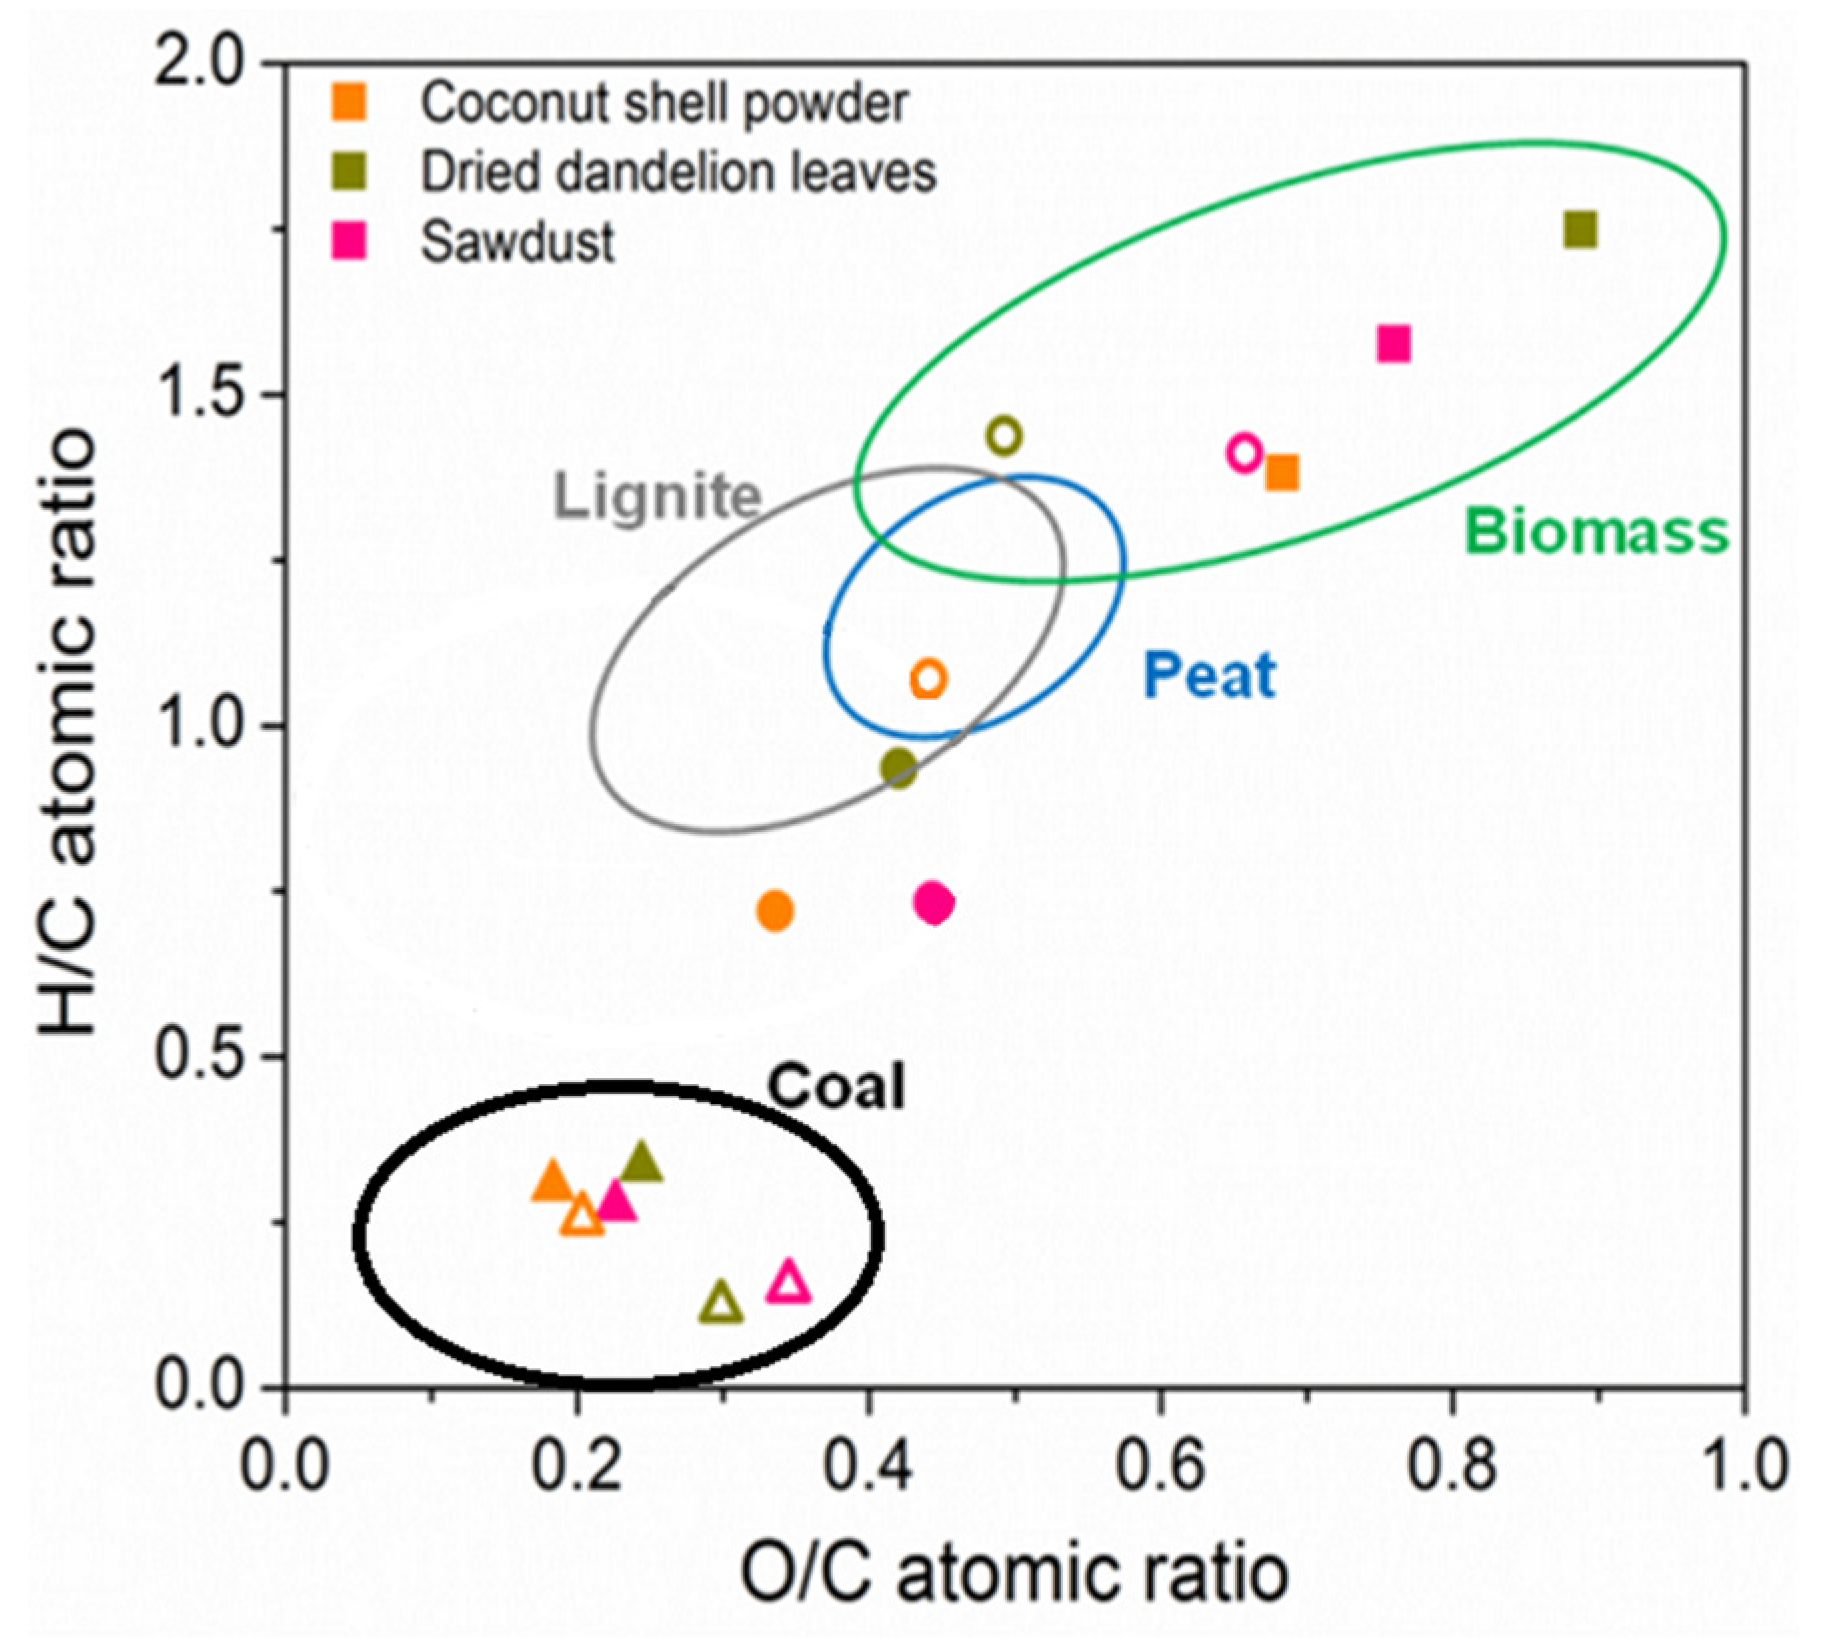
3.1. Elemental Composition of the Hydrochars

Comparison of the carbon content as obtained by the elemental analysis of the raw materials and hydrochars (Table 1) shows that the HTC process leads to an increase in the carbon content by 4 to 11 wt.%, depending on the raw material used. From these, sawdust shows the lowest gain, indicating greater stability as the increase is normally due to cleavage and cracking of weak oxygen and hydrogen bonds in O and H-containing compounds which are preferentially lost due to their higher solubility [31]. If the salt mixture was present, the carbon content increased more, i.e., by 13 to 18 wt.% with respect to the original biomass, reaching 66 wt.% for Cn-HTC Zn.
By steam activation of the HTC hydrochars at 500 °C, the carbon content increased further up to 73 and 77 wt.% for chars from sawdust and coconut shells, respectively. In the case of the dried dandelion, the carbon content changed only slightly, i.e., by 0.1 to 2 wt.%. Coupled with a low yield, this indicates a high loss of carbon into the water or steam phase. Examples in Figure 1 for the hydrochars from coconut shells show the increase in the carbon content is, for all samples, visually supported by a change in color. As expected, the color of the hydrochars from normal HTC is dark brown, indicating that the typical peat- or lignite-like material is formed. The hydrochar obtained in the presence of the ZnCl2, however, is much darker, nearly black, indicating the formation of a char which is mineral coal-like, with a much higher degree of polymerization and aromatic structures [15,31].
For coconut-based hydrochars, the variation in temperature has a more significant influence on the carbon content than the studied times, because only a small increase from 74–76 wt.% after 10 min, to around 77 wt.% after treatment for 60 min, takes place. With increasing temperature during steam activation, the carbon content gradually increases from 59 wt.% at 200 °C to 87 wt.% at 650 °C for HTC coal formed from coconut without salt. The contents of hydrogen and nitrogen were indirectly related to the process para-meters for all feedstocks, indicating mostly a loss in hydrogen from the dehydration reactions taking place in the hydrothermal carbonization.
The loss of hydrogen and oxygen in the different biomasses, i.e., coconut shell powder, dried dandelion leaves and sawdust, due to carbonization and steam activation is shown in a typical van Krevelen diagram in Figure 2. The van Krevelen diagram clearly shows that by HTC in the presence of salt, lower O/C and especially H/C, are obtained than by HTC with water. After steam activation, the obtained levels are closer to each other and the compositions are comparable to that of anthracite; that is, the black coal has the highest degree of condensation and lowest number of functional groups.
In the hydrochars received from dried dandelion leaves, the carbon content is limited to a level of around 50%; nevertheless, the H/C and O/C ratios are low, confirming that the ash content is high in hydrochars obtained from this substrate (up to 28 wt.%), due to the high amount already present in the raw material (10.6 wt.%). The ash contents of the sawdust and coconut samples are small, and the highest amounts (≤3 wt.%) of inorganic compounds remained after activation. Higher contents were observed if the salt mixture was used in the preceding HTC reactions, indicating that some remaining built-in ZnCl2 was not washed out completely.
It is apparent from the yields that the sawdust showed the highest stability under HTC conditions, and also possessed the smallest amount of easily soluble compounds lost by leaching. Instead of complete destruction, the original carbon network seems to be preserved in wide parts and pores are created only in the regions with more soluble material. The stable network is very likely rich in lignin. Thus, the presence of a more stable morphology is a good prerequisite for the introduction of porosity into these structures. The hydrochars from dried dandelion could only be obtained with yields of 30 and 43%, underlining the low stability and high inorganic content of this substrate.

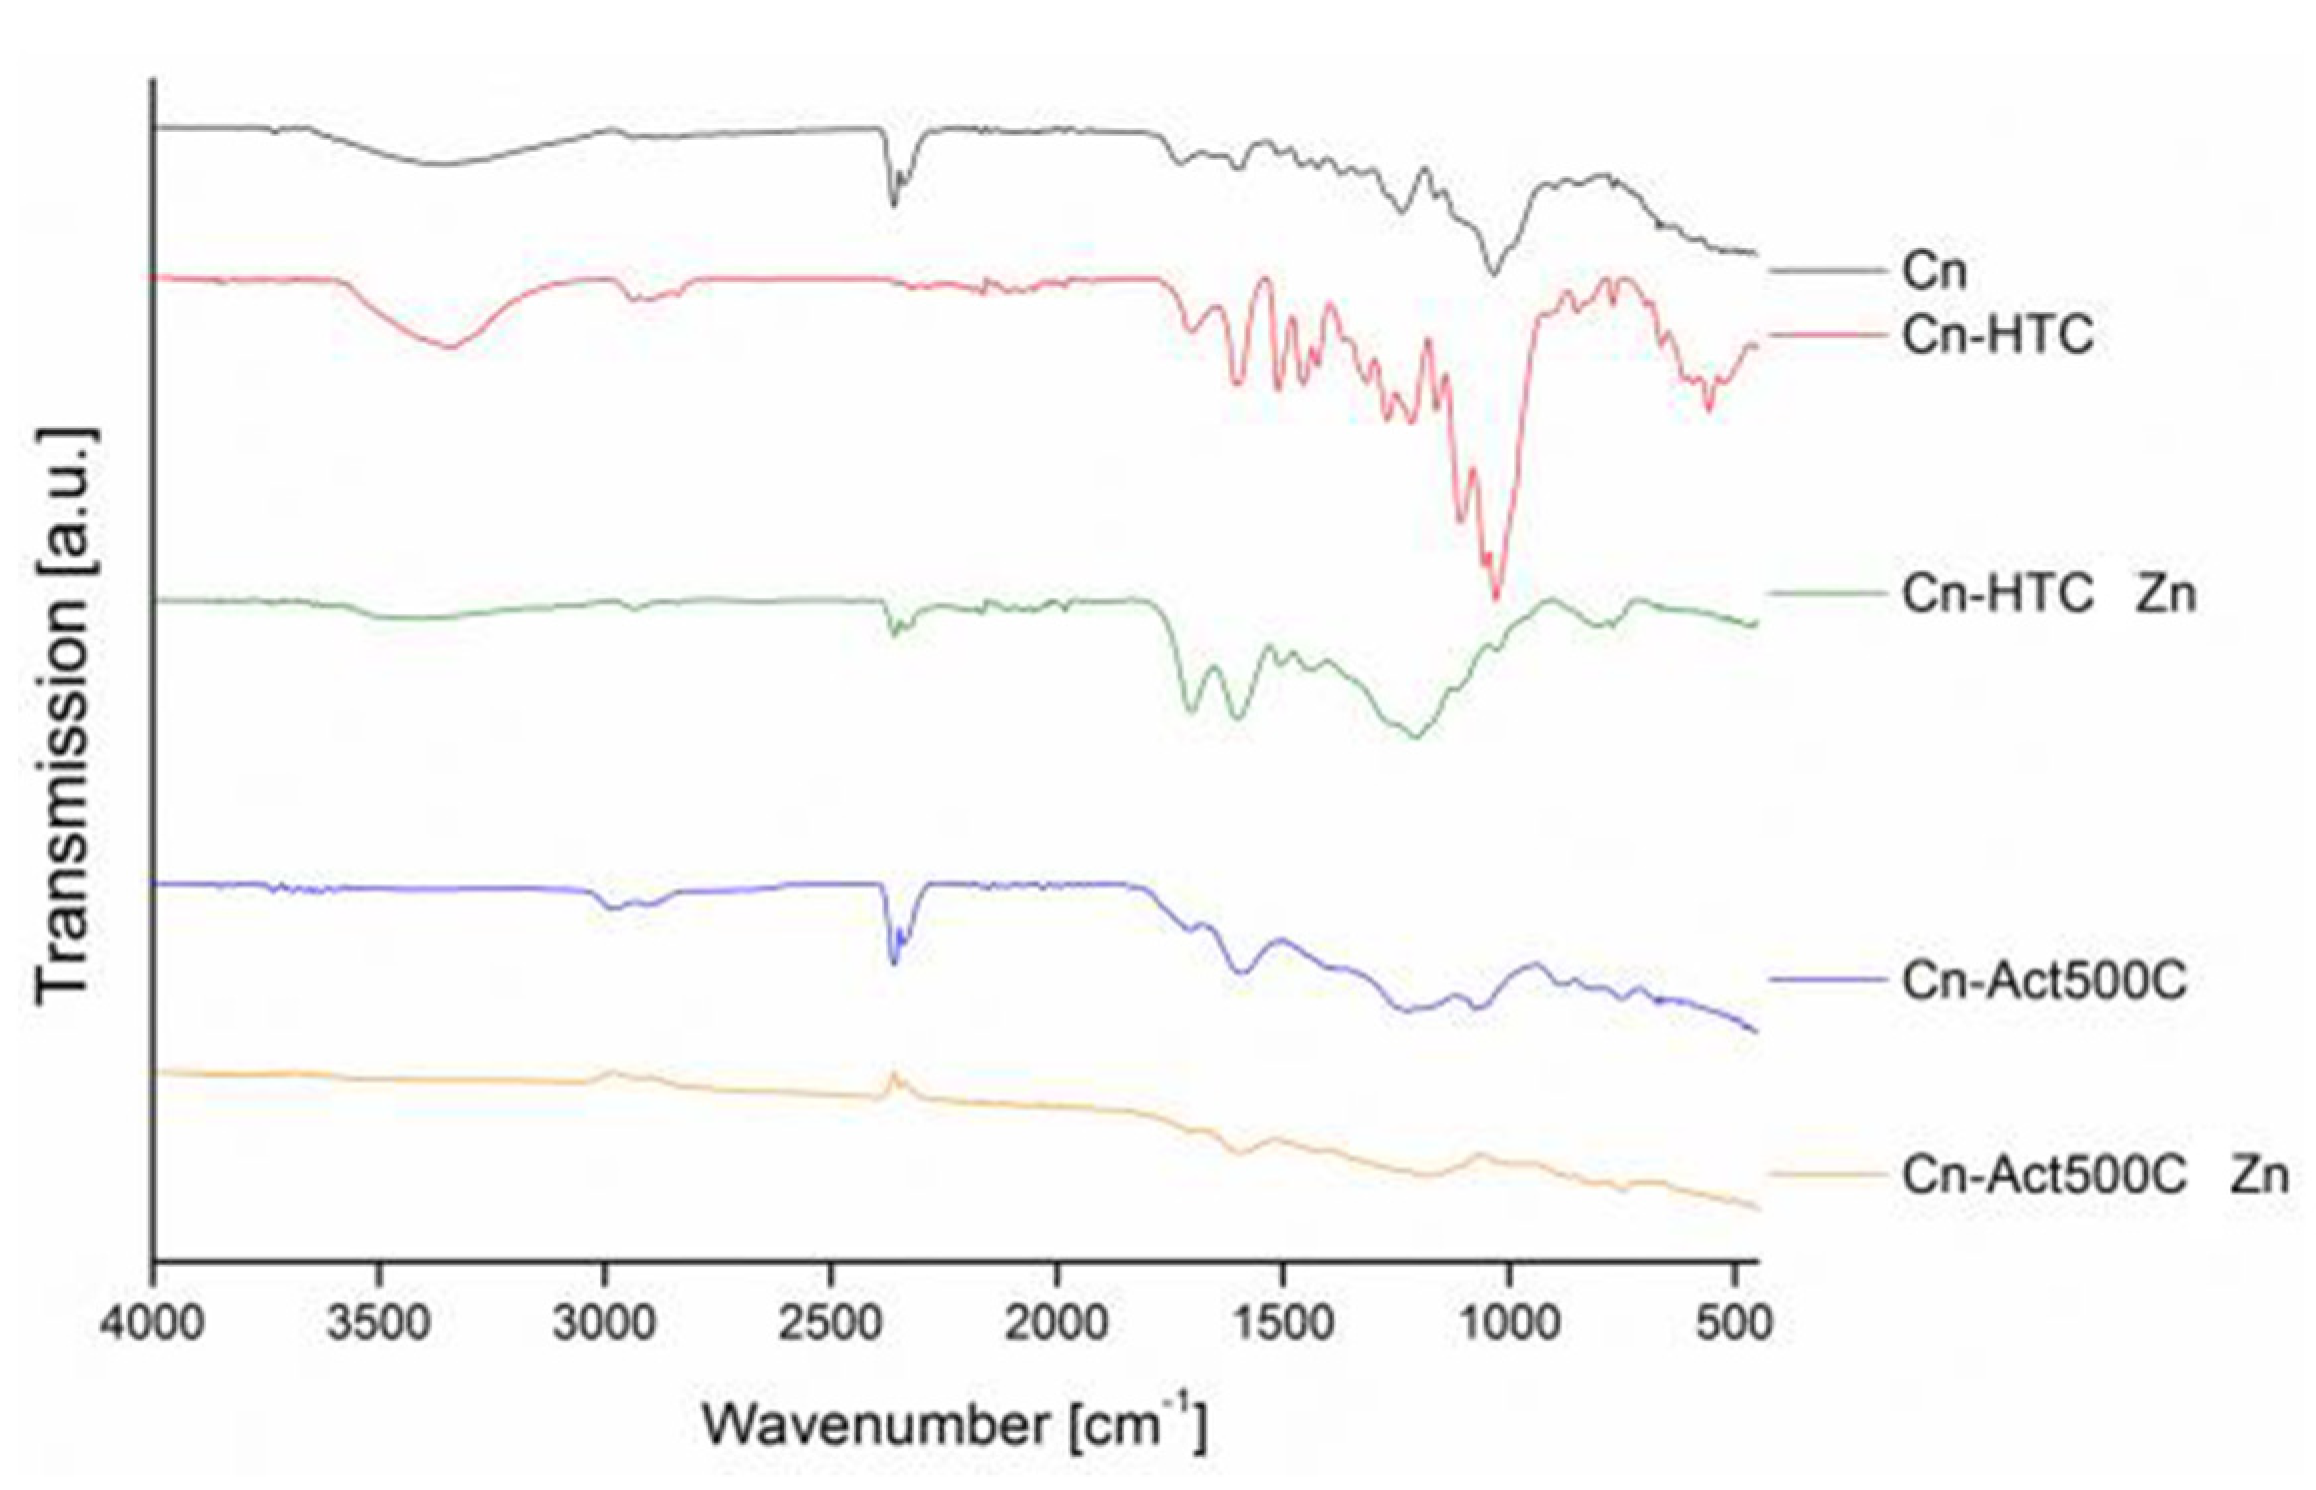
3.2. Surface Composition of the Compounds

FTIR spectra of the coconut shell powder, the related hydrochars from HTC with water or with salt, and the activated chars are shown in Figure 3. The samples from coconut shell powder were chosen as representative examples because all three tested biomasses and obtained hydrochars showed similar trends regarding their surface functionality. Signals of several functional groups in the coconut precursor, namely, hydroxyl groups (3500–3000 cm−1), alkyl groups (3000–2800 cm−1), ether groups (1300–1000 cm−1), C-H groups in aldehydes (2900–2700 cm−1), carbonyl groups in aldehydes and ketones (1850–1650 cm−1) and carboxylic acid groups (1820–1750 cm−1), in addition to aromatic C=C stretching (~1600 cm−1) vibrations (for a more detailed description of IR bands see, e.g., [28,35]) become sharper after hydrothermal carbonization in pure water (Cn-HTC), indicating a relatively increasing amount of these groups in the samples. However, in the presence of an aqueous salt mixture (Cn-HTC Zn), an opposite trend is observed with declined corresponding peaks, which are specifically seen by the flattening of the hydroxyl and ether bands at around 3300 and 1300 to 1000 cm−1, respectively. This sample features only two prominent bands at 1700 and 1600 cm−1, and a wider band at 1200 cm−1 becoming sharper in the course of the process, suggesting the presence of groups with mainly carbonyl and aromatic functionality. From Figure 2 it is also obvious that a thermal treatment with steam after HTC is accompanied with a significant loss of surface functionality, which is again stronger for the hydrochars obtained under saline conditions (Cn-Act500C Zn). This loss can be reduced by using lower activation temperatures; there is a linear correlation to the band flattening and finally complete disappearance with increasing temperatures. Many bands are still prominent after activation at 200 °C but, at 650 °C, with the exception of the double peak at around 2400 cm−1 corresponding to gaseous CO2, no peak remains. The time of steam activation has only a limited influence on the functional groups.

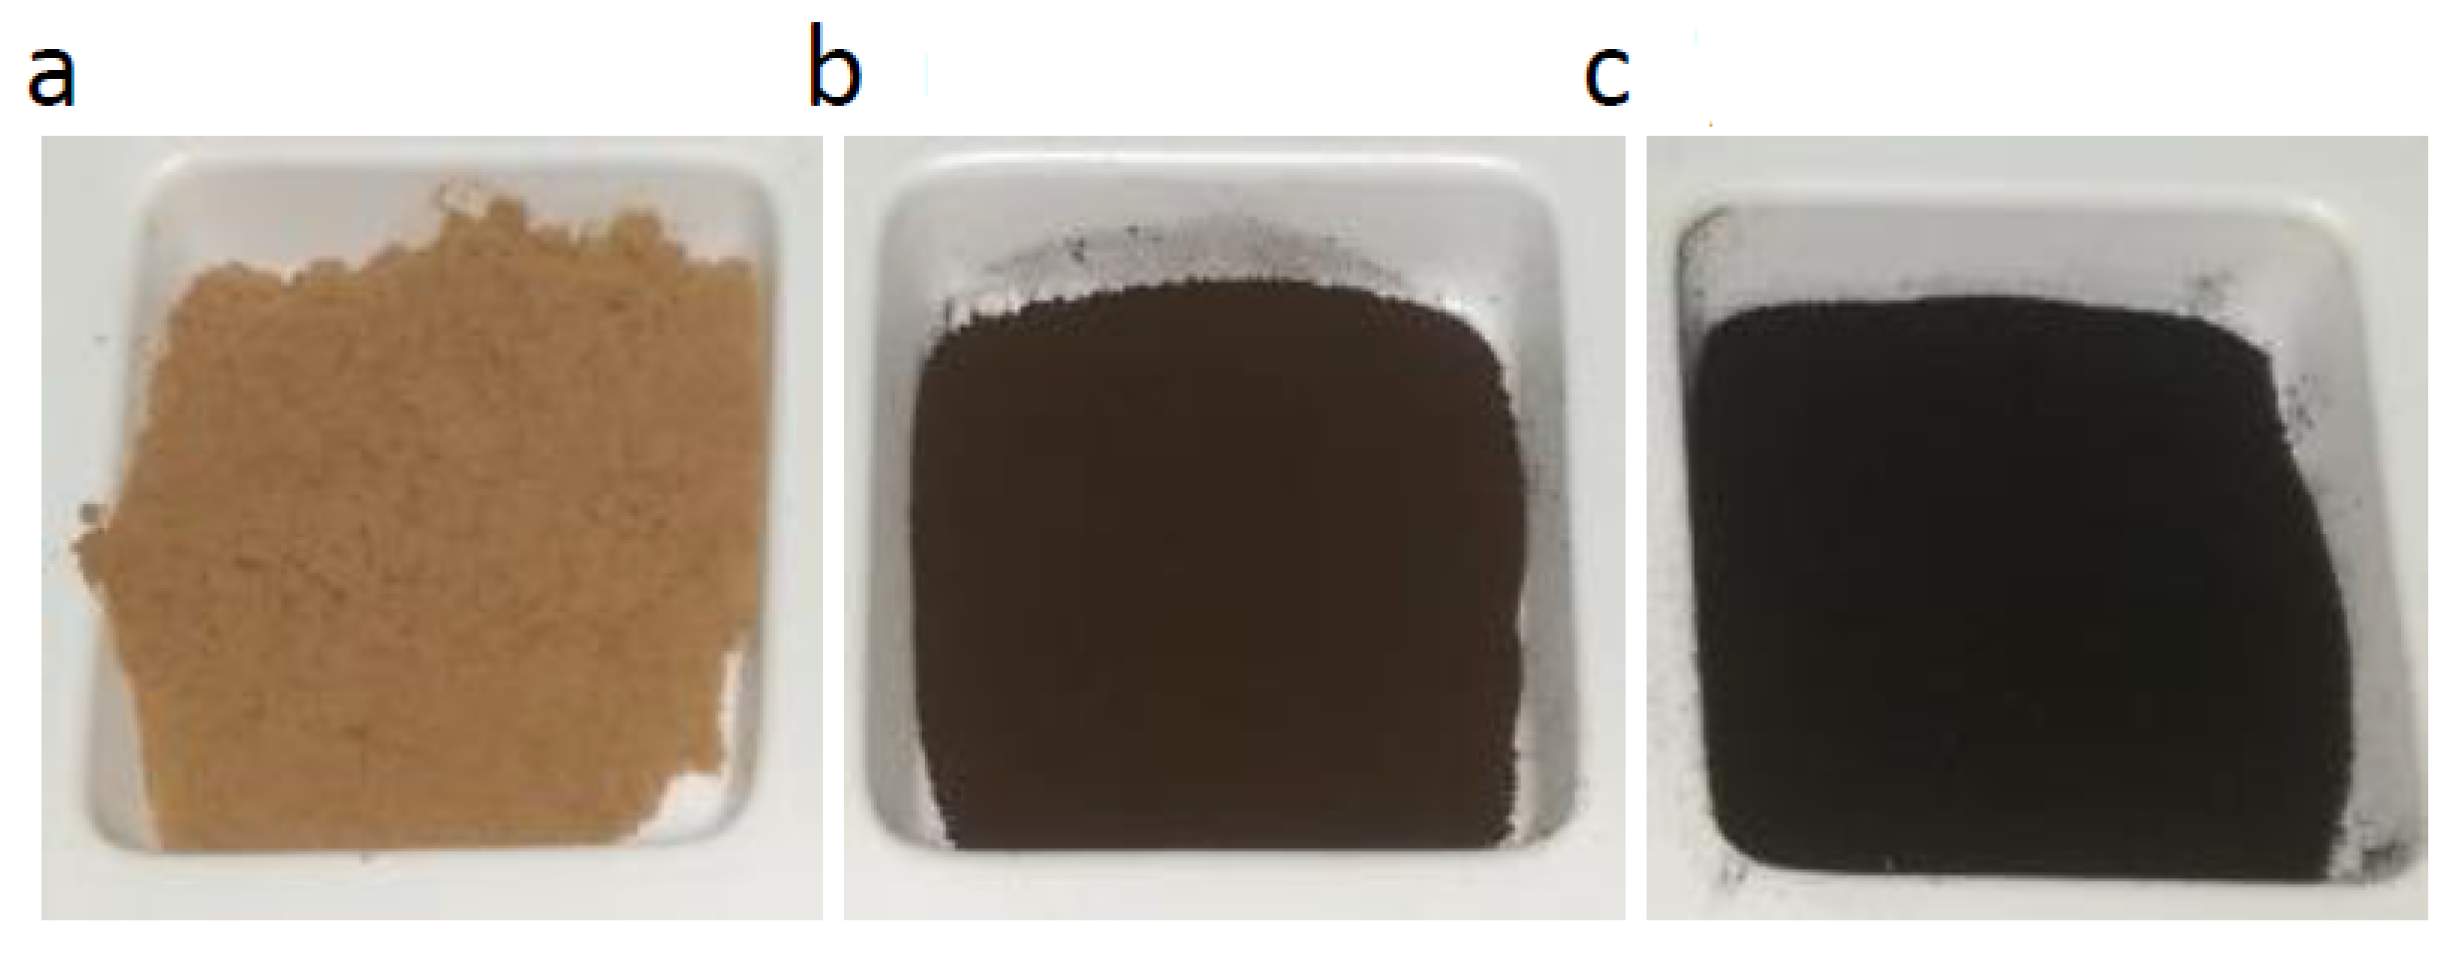
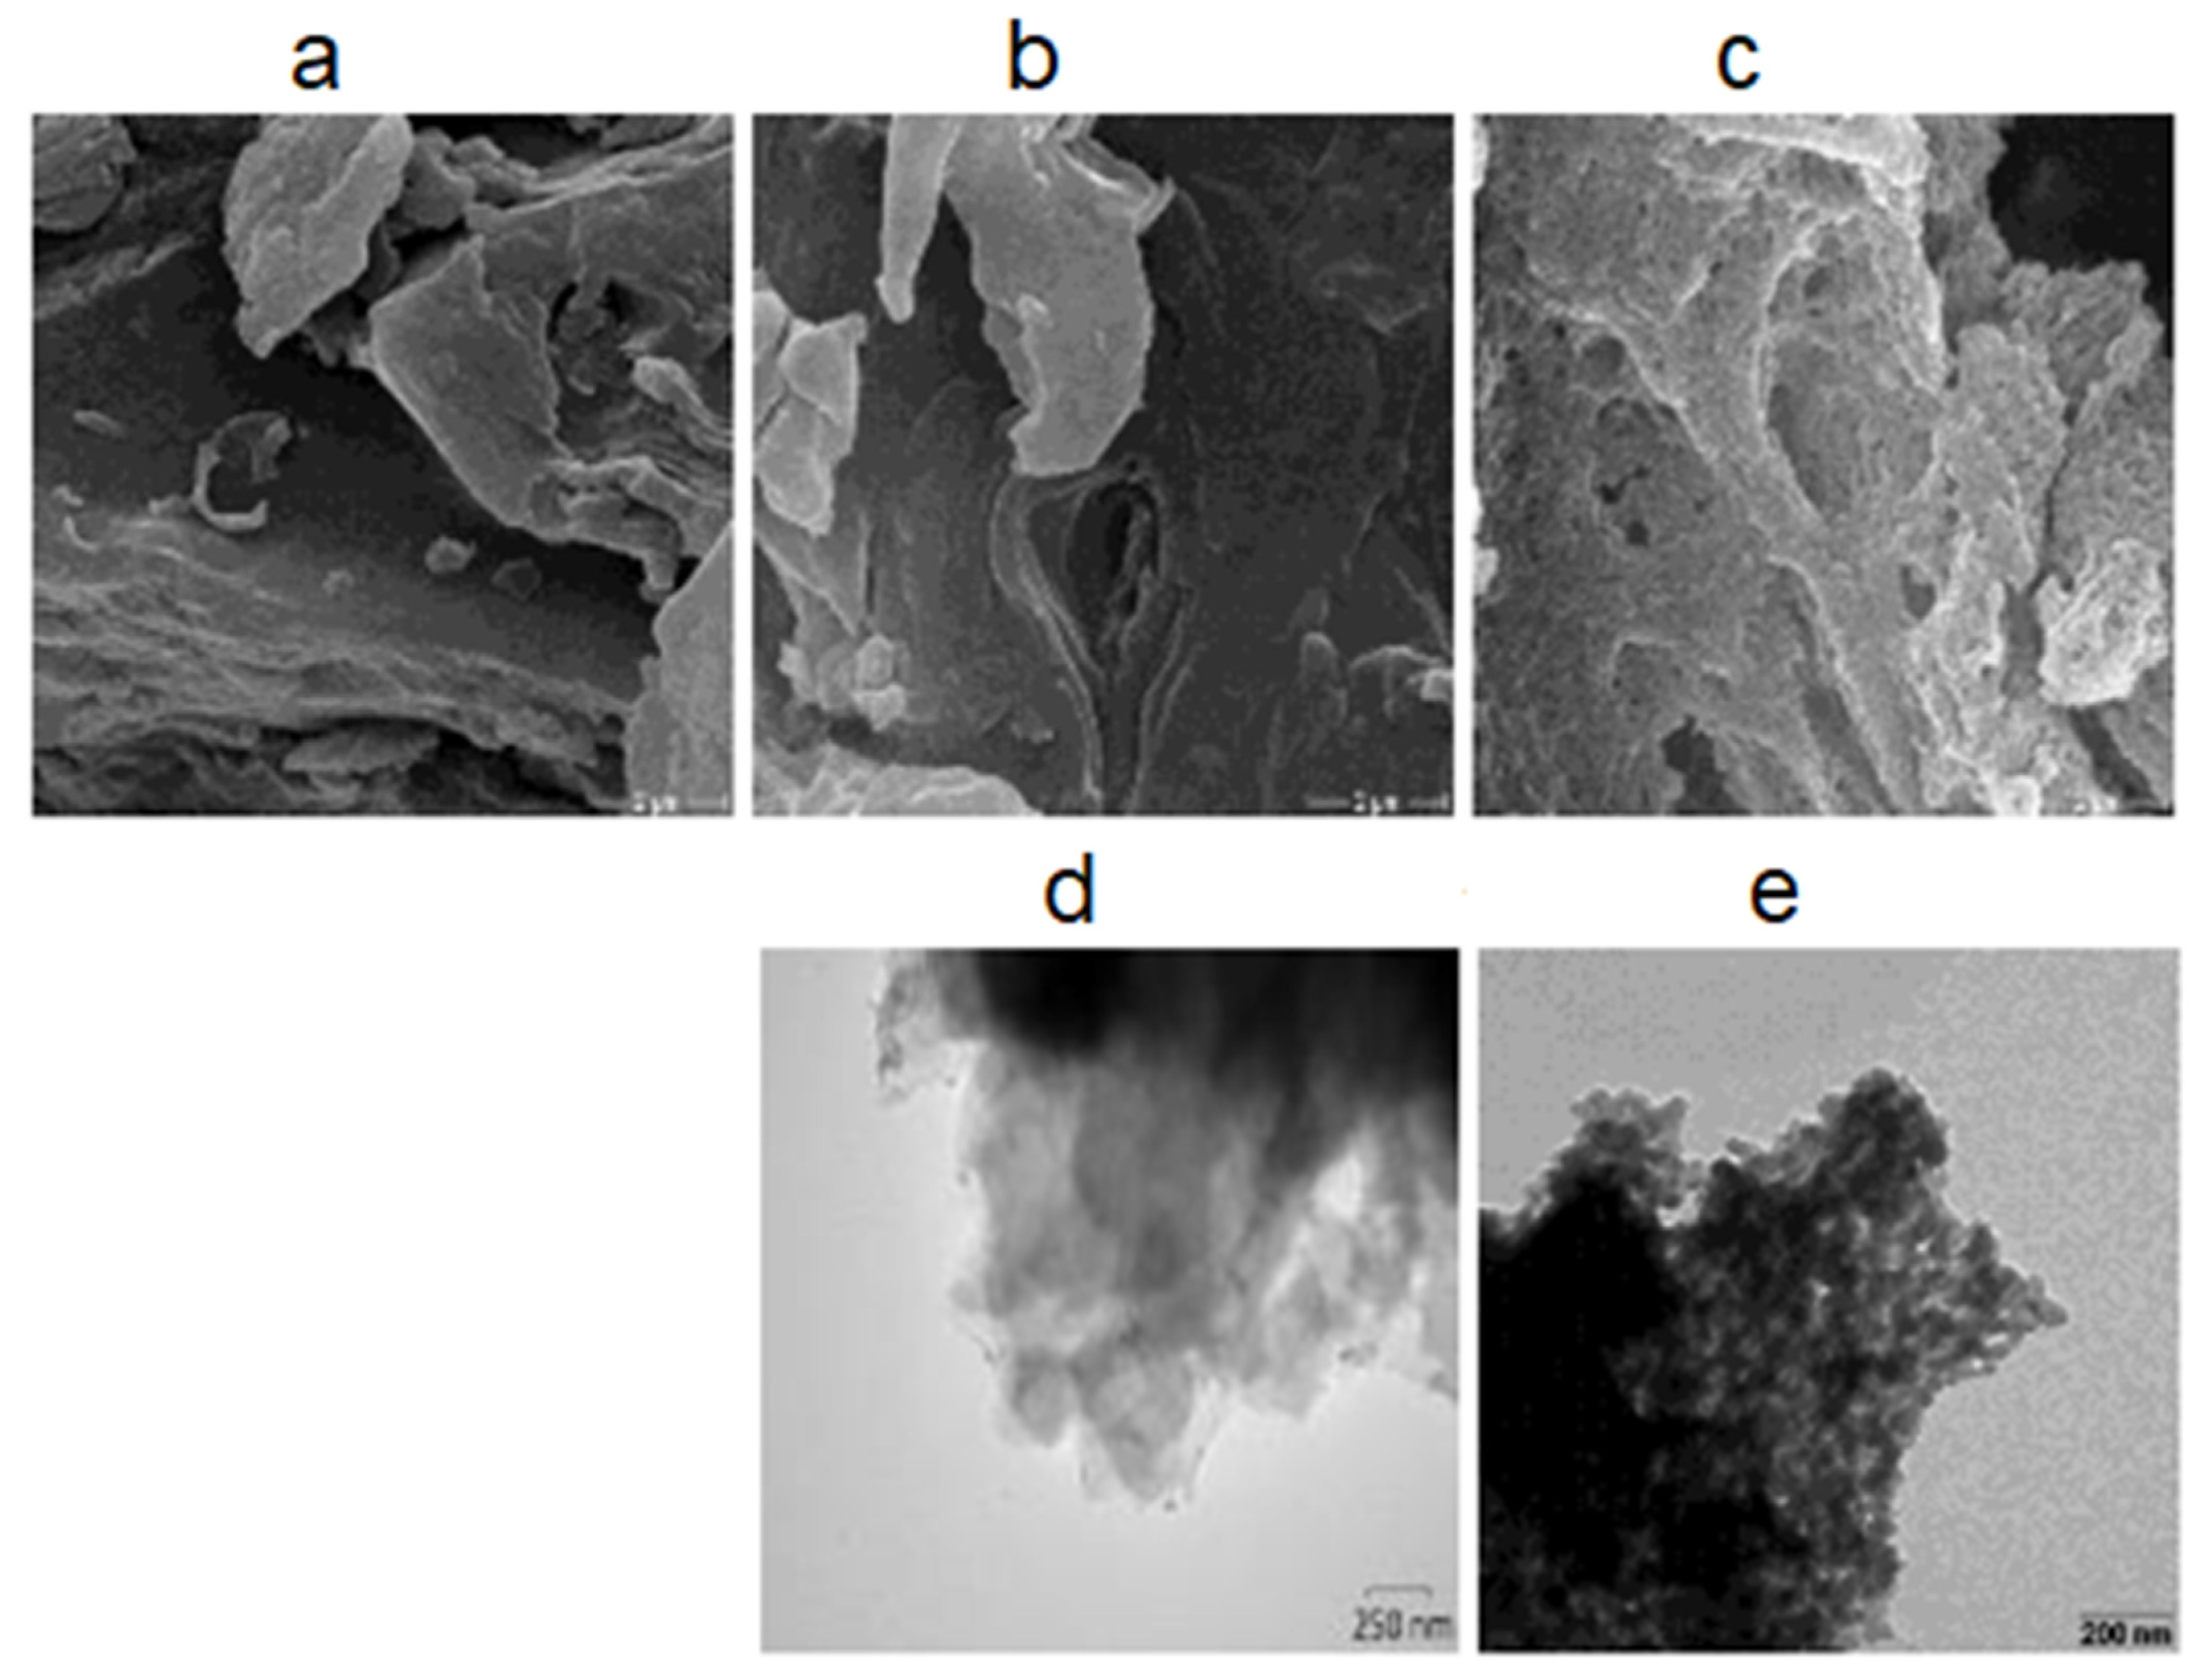
3.3. Morphology of the Hydrochars
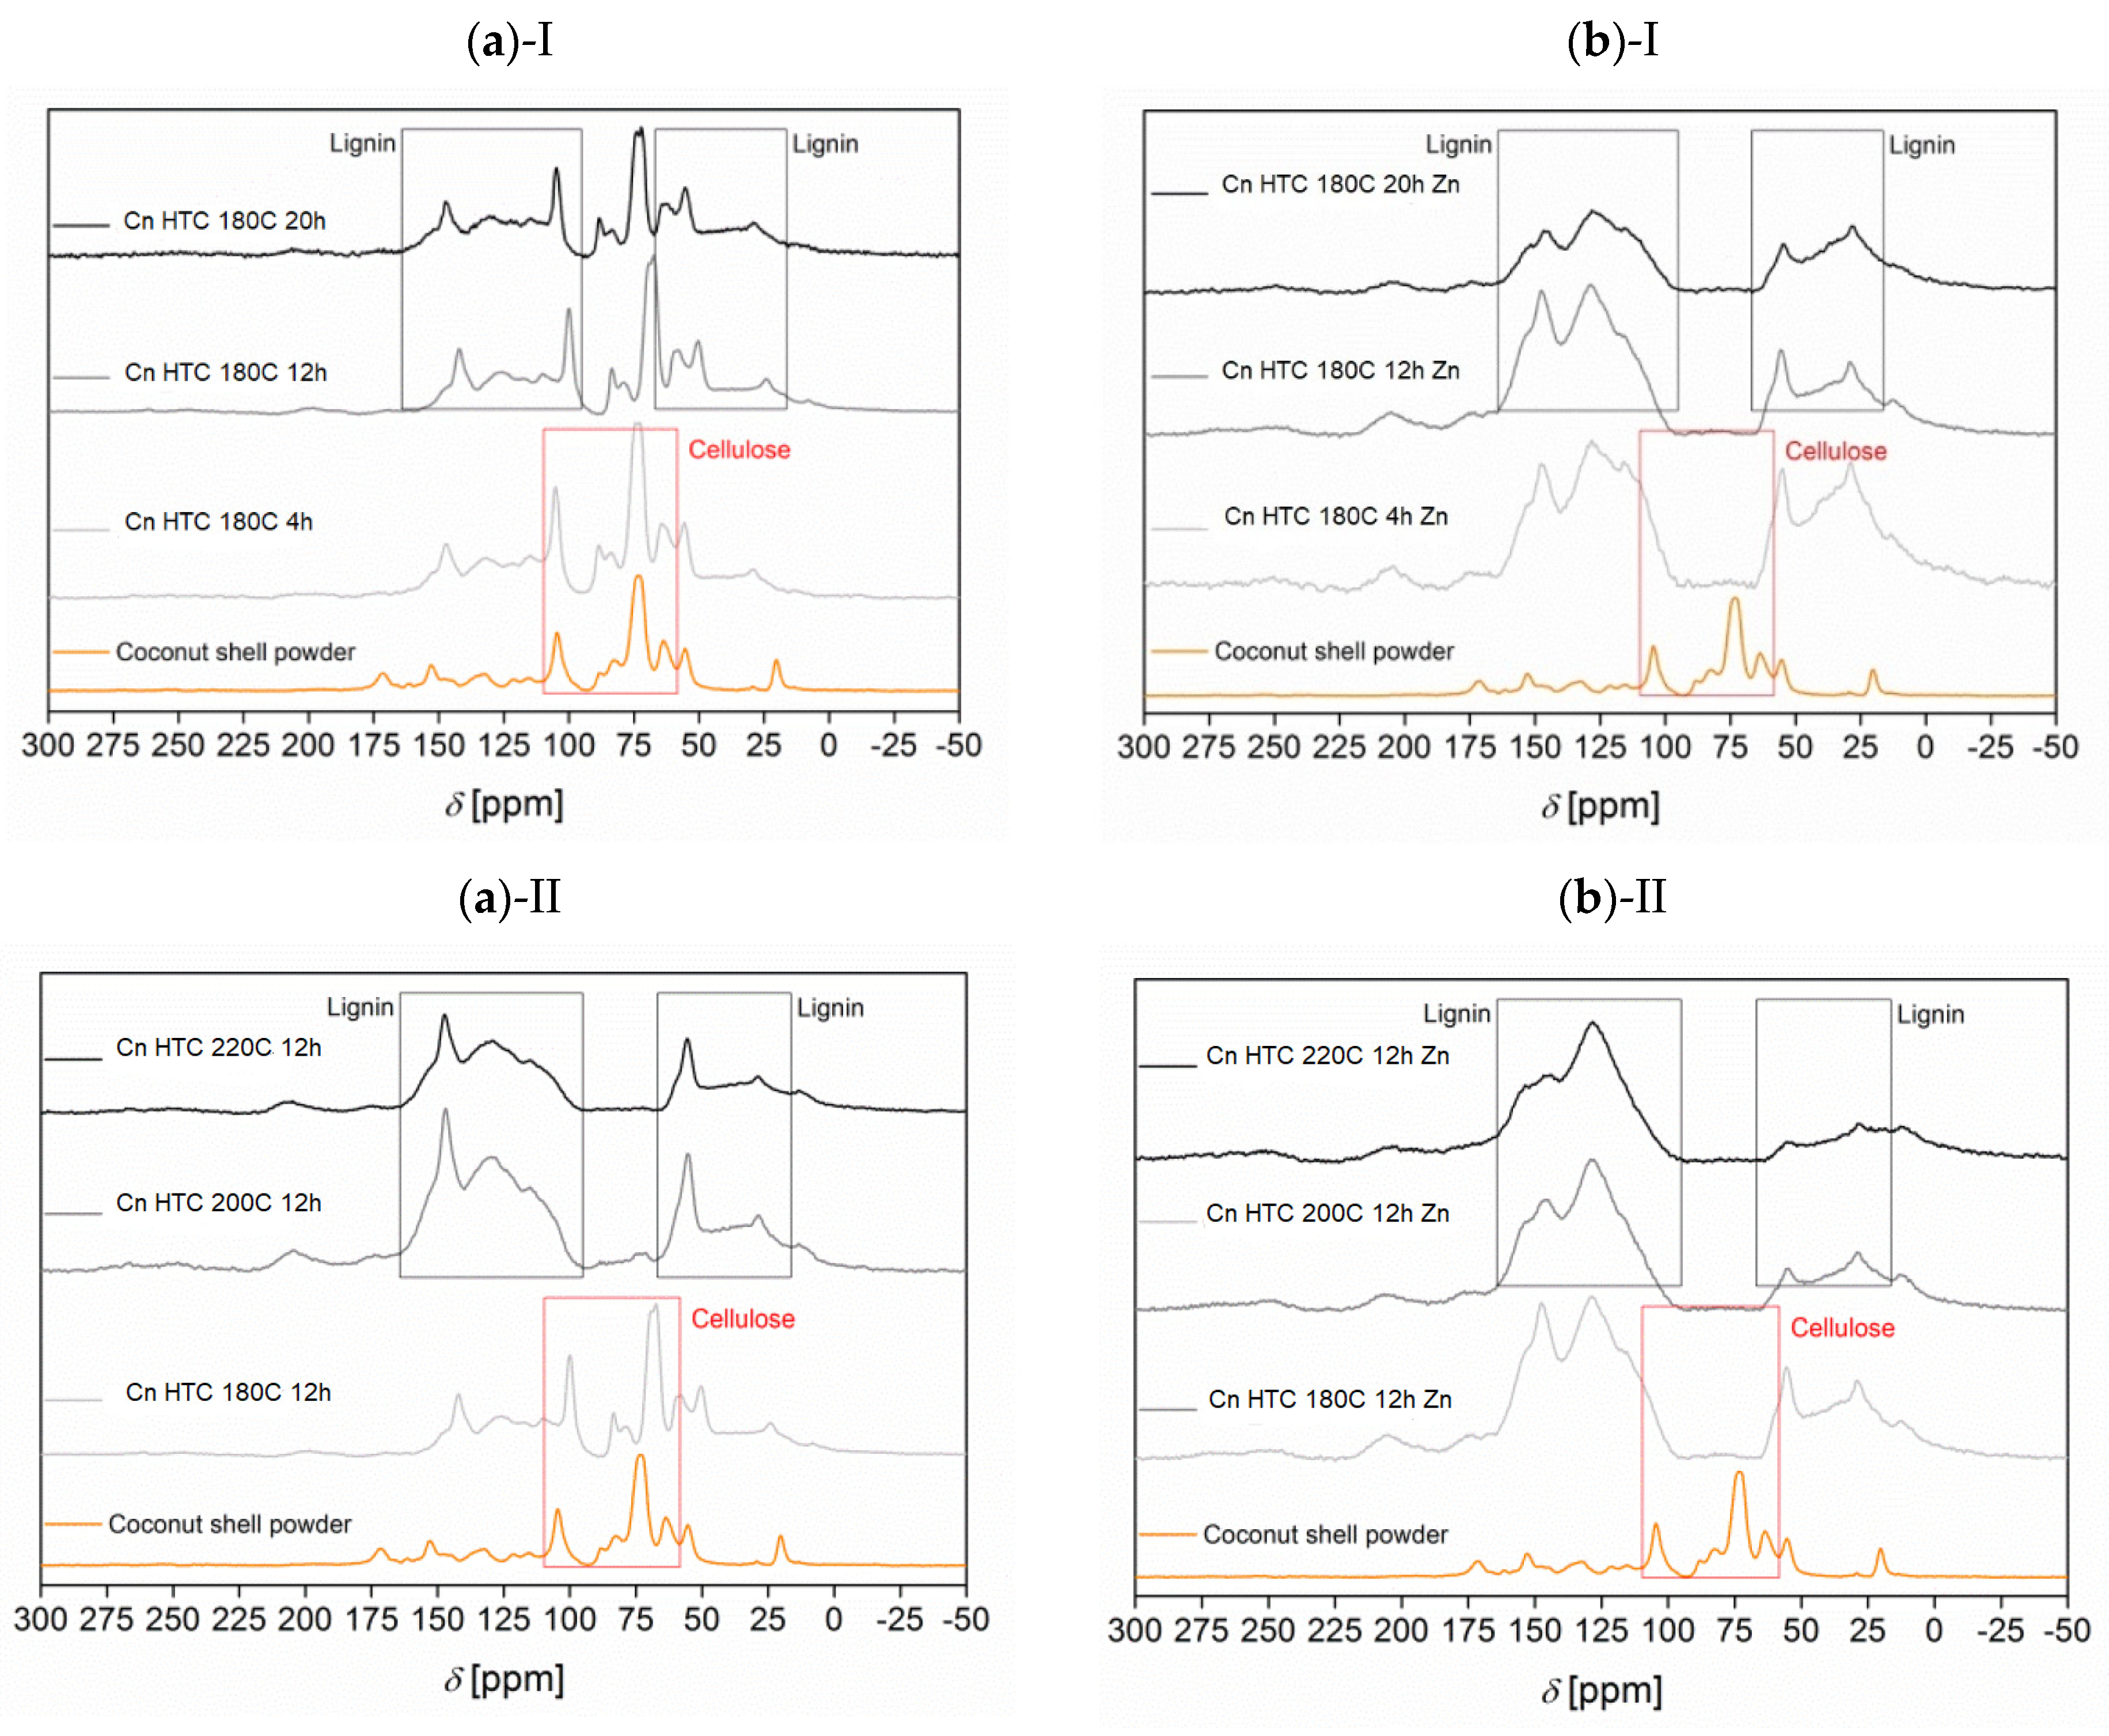
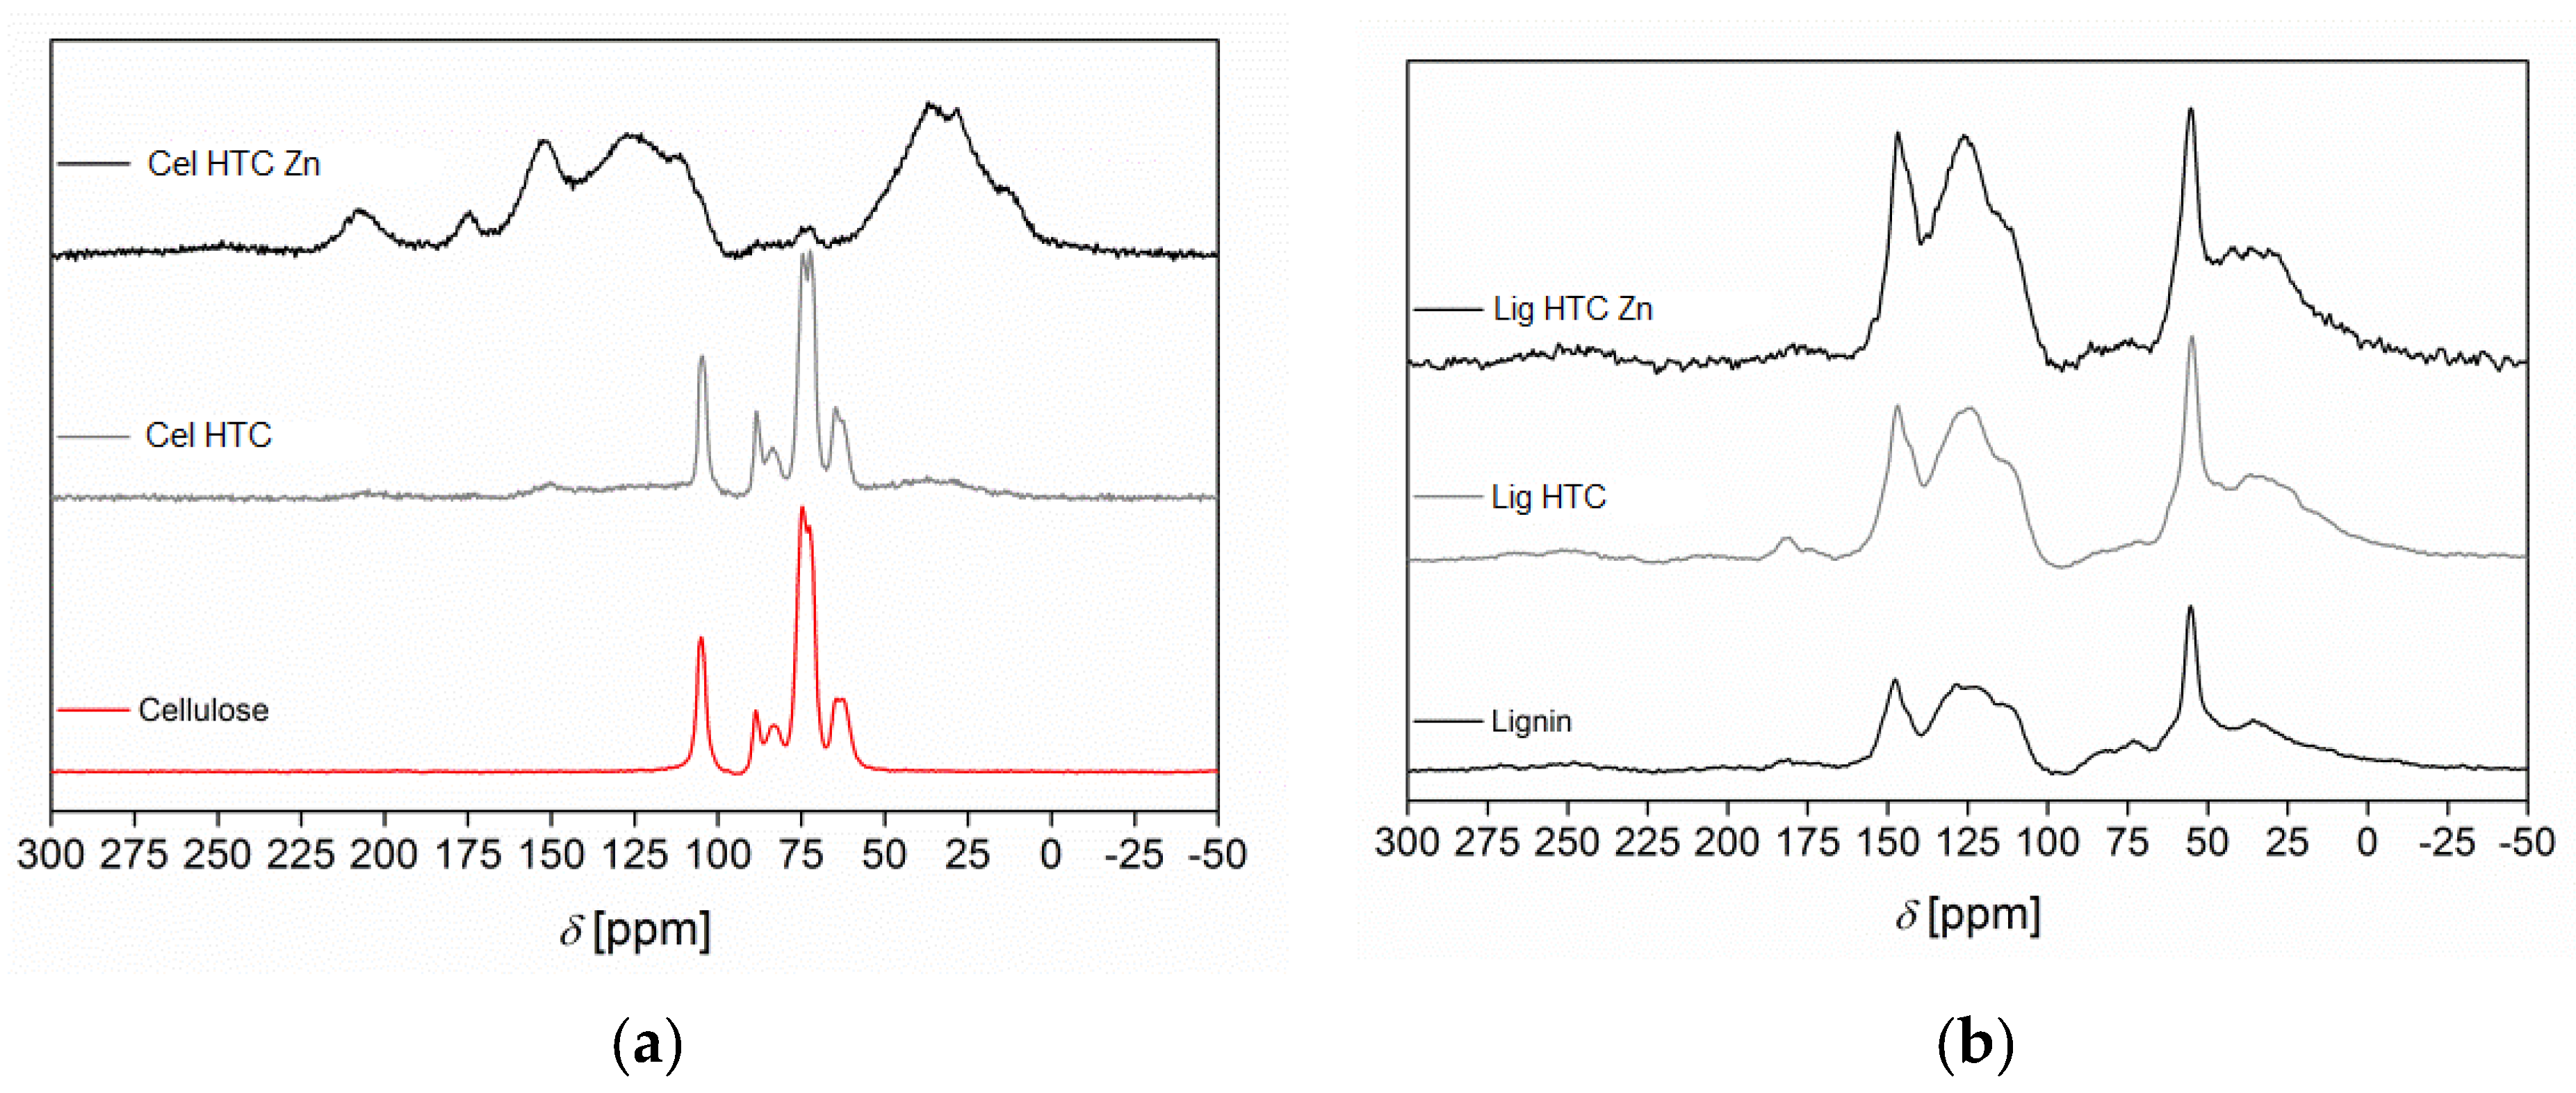
The SEM images (Figure 4a,b) reveal that the normal hydrochar morphology resembles the one seen for the substrate, i.e., heterogeneous structures with layers of rather smooth surfaces. The salt hydrochar, in contrast, shows a much rougher surface; the previously smooth surface is spotted with many holes in the still-maintained macroscopic structures of the biomass, indicating the creation of meso- and macroporosity in these materials (Figure 4c). This observation is confirmed by TEM images (Figure 4d,e), in which the hydrochar from normal HTC shows a vague structure with no identifiable primary building units. The hydrochars from salt HTC, however, are revealed to be built of small primary particles in the size range of 20–50 nm.
From our study it is obvious that all resulting hydrochars consist of very heterogeneous, irregular-shaped particles of different sizes together with larger, stacked structures. Smaller particles presumably originate from the breaking of the large frameworks, which represent the highest content in the initial coconut shell powder.
By HTC in aqueous salt mixture, the number of smaller fractions increases. Smaller particles are observable around and on top of macroscopic structures. This supports the idea that the present salt mixture either catalyzes dehydration reactions [36,37] or increases the solubility of parts of the biomass, i.e., the cellulose and hemicellulose [38]. This results in a partial breaking of the framework and the formation of smaller carbonized structures. However, it is also obvious from both images that the samples still possess large structures resulting from components of the original biomass resistant to hydrothermal treatment such as cellulose and lignin [27].
After additional steam activation, the derived chars show a further increase in particle break-up. Moreover, with a progressing degree of carbonization, the roughness of the particle surfaces also increases. This shows that the steam breaks-up larger structures by oxidizing the different carbon compounds, while creating roughness and porosity on the surface and inside the particles.
Small traces of salt left after washing, as implied by the higher ash content in the salt-HTC samples (Table 1), may contribute with catalytic effects in the activation [16,39]. Energy-dispersive X-ray spectroscopy (EDX) indicates some remains of Cl and Zn2+ in traces of 0.32 and 0.34 wt.%, respectively.
Even after salt HTC and treatment with steam at high temperatures, parts of the natural macrostructure stay intact. Nevertheless, liquefaction and extraction of organic materials such as hemicellulose and non-structured amorphous cellulose leading to mass losses >50 wt.% [30] result in structural changes at the nanometer scale [13].

3.4. Mechanistics

The results indicate that, under the hydrothermal conditions of normal HTC (the autogenous pressure obtained is about 15 bar), the substrate is not significantly attacked at a temperature of 180 °C and stays mostly intact. In the salt HTC, the zinc chloride-enriched steam attacks the surface of the biomass significantly more strongly than the pure water steam, creating surface roughness and forming holes by degradation of the biomass compounds. However, it is worth mentioning that, because the main macrostructure stayed intact, parts of the framework seem to be resistant to the hydrothermal treatment at the chosen, rather soft HTC conditions, even in the presence of the salt.
Biomass is mainly built by different ratios of the three components cellulose, hemicellulose and lignin, which all exhibit different stabilities upon hydrothermal carbonization. Lignin is usually claimed to be resistant to the HTC reactions up to 300 °C [40,41]. Thus, it is possible that the preserved macrostructures consist mostly of the lignin fraction of the biomass, and the holes and roughness were created by hydration, dissolution, decarboxylation and other reactions of the cellulose and/or hemicellulose, leading to a high extent of soluble compounds dissolved in the liquid HTC water phase. The remaining fragments, which are not soluble in water, may form some spherical-shaped carbon particles to minimize the contact area with their surroundings, which can settle on the char resulting from the skeleton frame of the original biomass, and thus create additional roughness [27].
More detailed information about the composition and structure changes from coconut biomass to hydrochars can be derived from 13C solid state CP/MAS NMR spectroscopy data. Figure 5 shows the spectra for different hydrochars obtained from coconut shell powder. As expected, signals of cellulose and lignin are found in the spectra of the hydrochars, as shown by use of the pure cellulose and pure lignin as reference materials (Figure 6). The corresponding signals are highlighted by colored boxes (orange: cellulose; grey: lignin) in Figure 5. Typical chemical shifts for cellulose are found between 55 and 105 ppm (Figure 5, orange box and Figure 6); the signals are mainly from aliphatic carbons linked to alcohol groups; the peak signature corresponds well to the literature data [42]. In contrast, for cellulose treated by normal HTC at 180 °C, almost no change in the 13C NMR spectrum is observable; nearly all original peaks of the cellulose are completely vanished after salt HTC, and the emerging new peaks indicate the formation of polymerization products (Figure 6 left). The NMR signature obtained for lignin shows two prominent peaks at 55 and 146 ppm, which can be attributed to lignin methoxy groups and aromatic carbons to which they are bound, respectively, and two broad peak regions between 0 and 90 ppm, and 100 and 140 ppm, typical for (Kraft) lignin (Figure 6 right). A complete assignment of these broad peaks is complicated; among others, methoxy groups, sp2 hybridized and aromatic carbons contribute to them [43]. The NMR signature of these lignin related parts does not change significantly, even after normal HTC at 220 °C or salt HTC at 180 °C (Figure 5).
These NMR results confirm the discussion regarding the morphologies seen in the SEM and TEM images (Figure 4). In the hydrochars obtained from coconut, the cellulose related peaks obviously survive if normal HTC is undertaken at 180 °C, even if the reaction time is extended to 20 h (Figure 5a(I)). The relative increase in the signals related to lignin indicates that parts of the cellulose are disrupted and dissolved to the liquid phase, but a temperature of 180 °C is not sufficient to completely carbonize cellulose by HTC with water.
If the temperature is increased to 200 or 220 °C, the cellulose peaks disappear due to complete dissolution of the cellulose (Figure 5a(II)). The small cellulose signal left in the spectrum of the sample treated at 200 °C is completely gone at 220 °C and the lignin related peaks, which are small in the original shell powder, become more prominent. The broad signal from around 0 to 60 ppm results mostly from aliphatic carbons. The wide distribution indicates the presence of a variety of different CHx sites. Weak peaks at 28 and 37 ppm, in addition to a shoulder at 13 ppm, can be attributed to quite rigid CH2, more mobile CH2 and mobile CH3 groups, respectively. A large number of signals now become visible in the aromatic (100–160 ppm) region, attributable to C=C-C (112 ppm), sp2 hybridized carbons (126 ppm) and O-C=C (152 ppm), respectively, and even some carbonyl groups (174 and 208 ppm) are recognizable. These results hint that the structure of the hydrochar from salt HTC is mainly formed by carbon structures originating from the lignin parts of the biomass. The lignin parts form the macrostructure of the biomass as seen in the SEM and TEM images (Figure 4), whereas the holes and roughness are created by breaking of the cellulose particles. With increasing temperature, small changes in the lignin signals can also be seen. The two signals at around 55 and 147 ppm decrease in intensity. Moreover, the small signals at 114 and 129 ppm in the aromatic carbon region and signals at 12 and 29 ppm in the aliphatic region become smaller. This shows that lignin is attacked if normal HTC is performed at temperatures of about 220 °C or higher.
By using the salt–water mixture, disruption of the cellulose is achieved already after 4 h at 180 °C (Figure 5b(I)). The ZnCl2 enables reactions at 180 °C that are only possible at temperatures of at least 200 °C in the normal HTC reaction. Thus, the 13C-NMR signatures of Cn 200C 12 h and Cn 220C 12 h (Figure 5a(II)) are quite similar to those of Cn 180C 12 h Zn (Figure 5b(II)). It seems that the zinc chloride acts as a kind of catalyst for hydrolysis, dehydration and decarboxylation [44]. For HTC experiments at 180 °C in the presence of strong mineral acids (i.e., H2SO4), a complete hydrolysis of the cellulose to glucose is reported [28]. However, an increased surface area in the hydrochars is not described in that study.
With longer reaction times in salt HTC at 180 °C, the lignin-related 13C-NMR signals change, and also indicate a starting conversion of the lignin (Figure 5b(I)). These changes are even more pronounced if the temperature is increased to 220 °C (Figure 5b(II)). Thus, the signal at around 128 ppm becomes more dominant. Because this signal represents sp2 hybridized carbon in aromatic compounds, it indicates a high degree of polymerization and, thus, an advanced state of char formation.
This demonstrates that the lignin structures, which are always discussed as a problem compound in the biomass conversion due to their resistance in the fermentation-based biogas production, and in the normal HTC process and even in low-temperature pyrolysis [45], can in fact be easily destroyed by the addition of the zinc chloride to the HTC mixture. Therefore, the salt not only catalyzes the degradation of cellulose but also opens routes for reactions with the lignin compounds in the biomass. This additional attack of lignin is also the reason for the higher pore volumes and surface areas in all the salt-HTC treated hydrochars because the destruction of lignin polymer structures creates additional porosity.

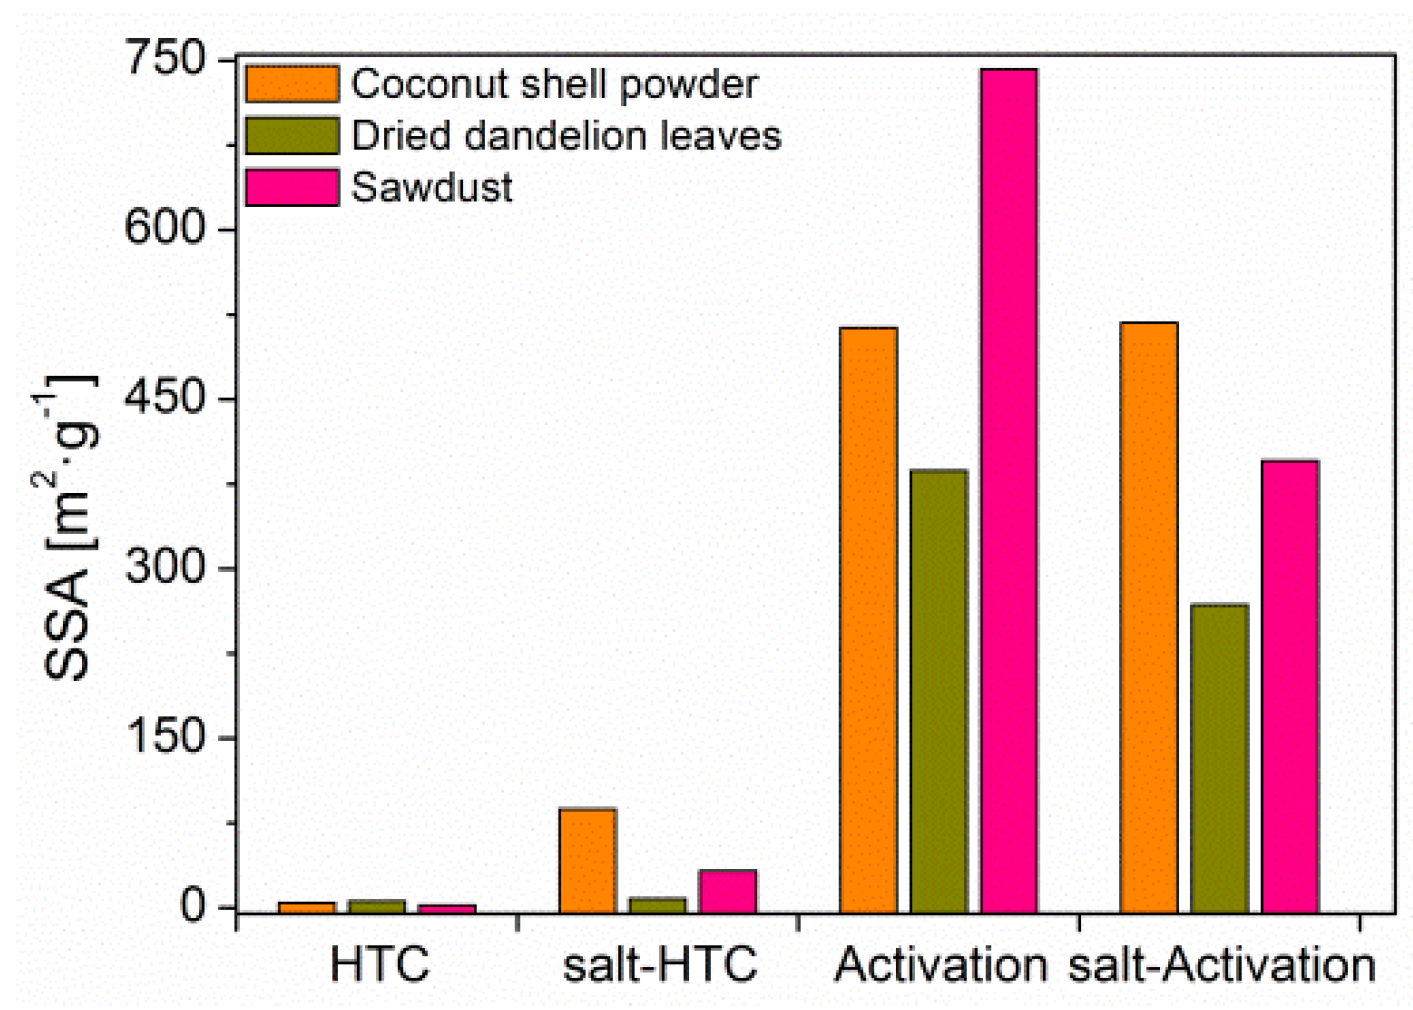
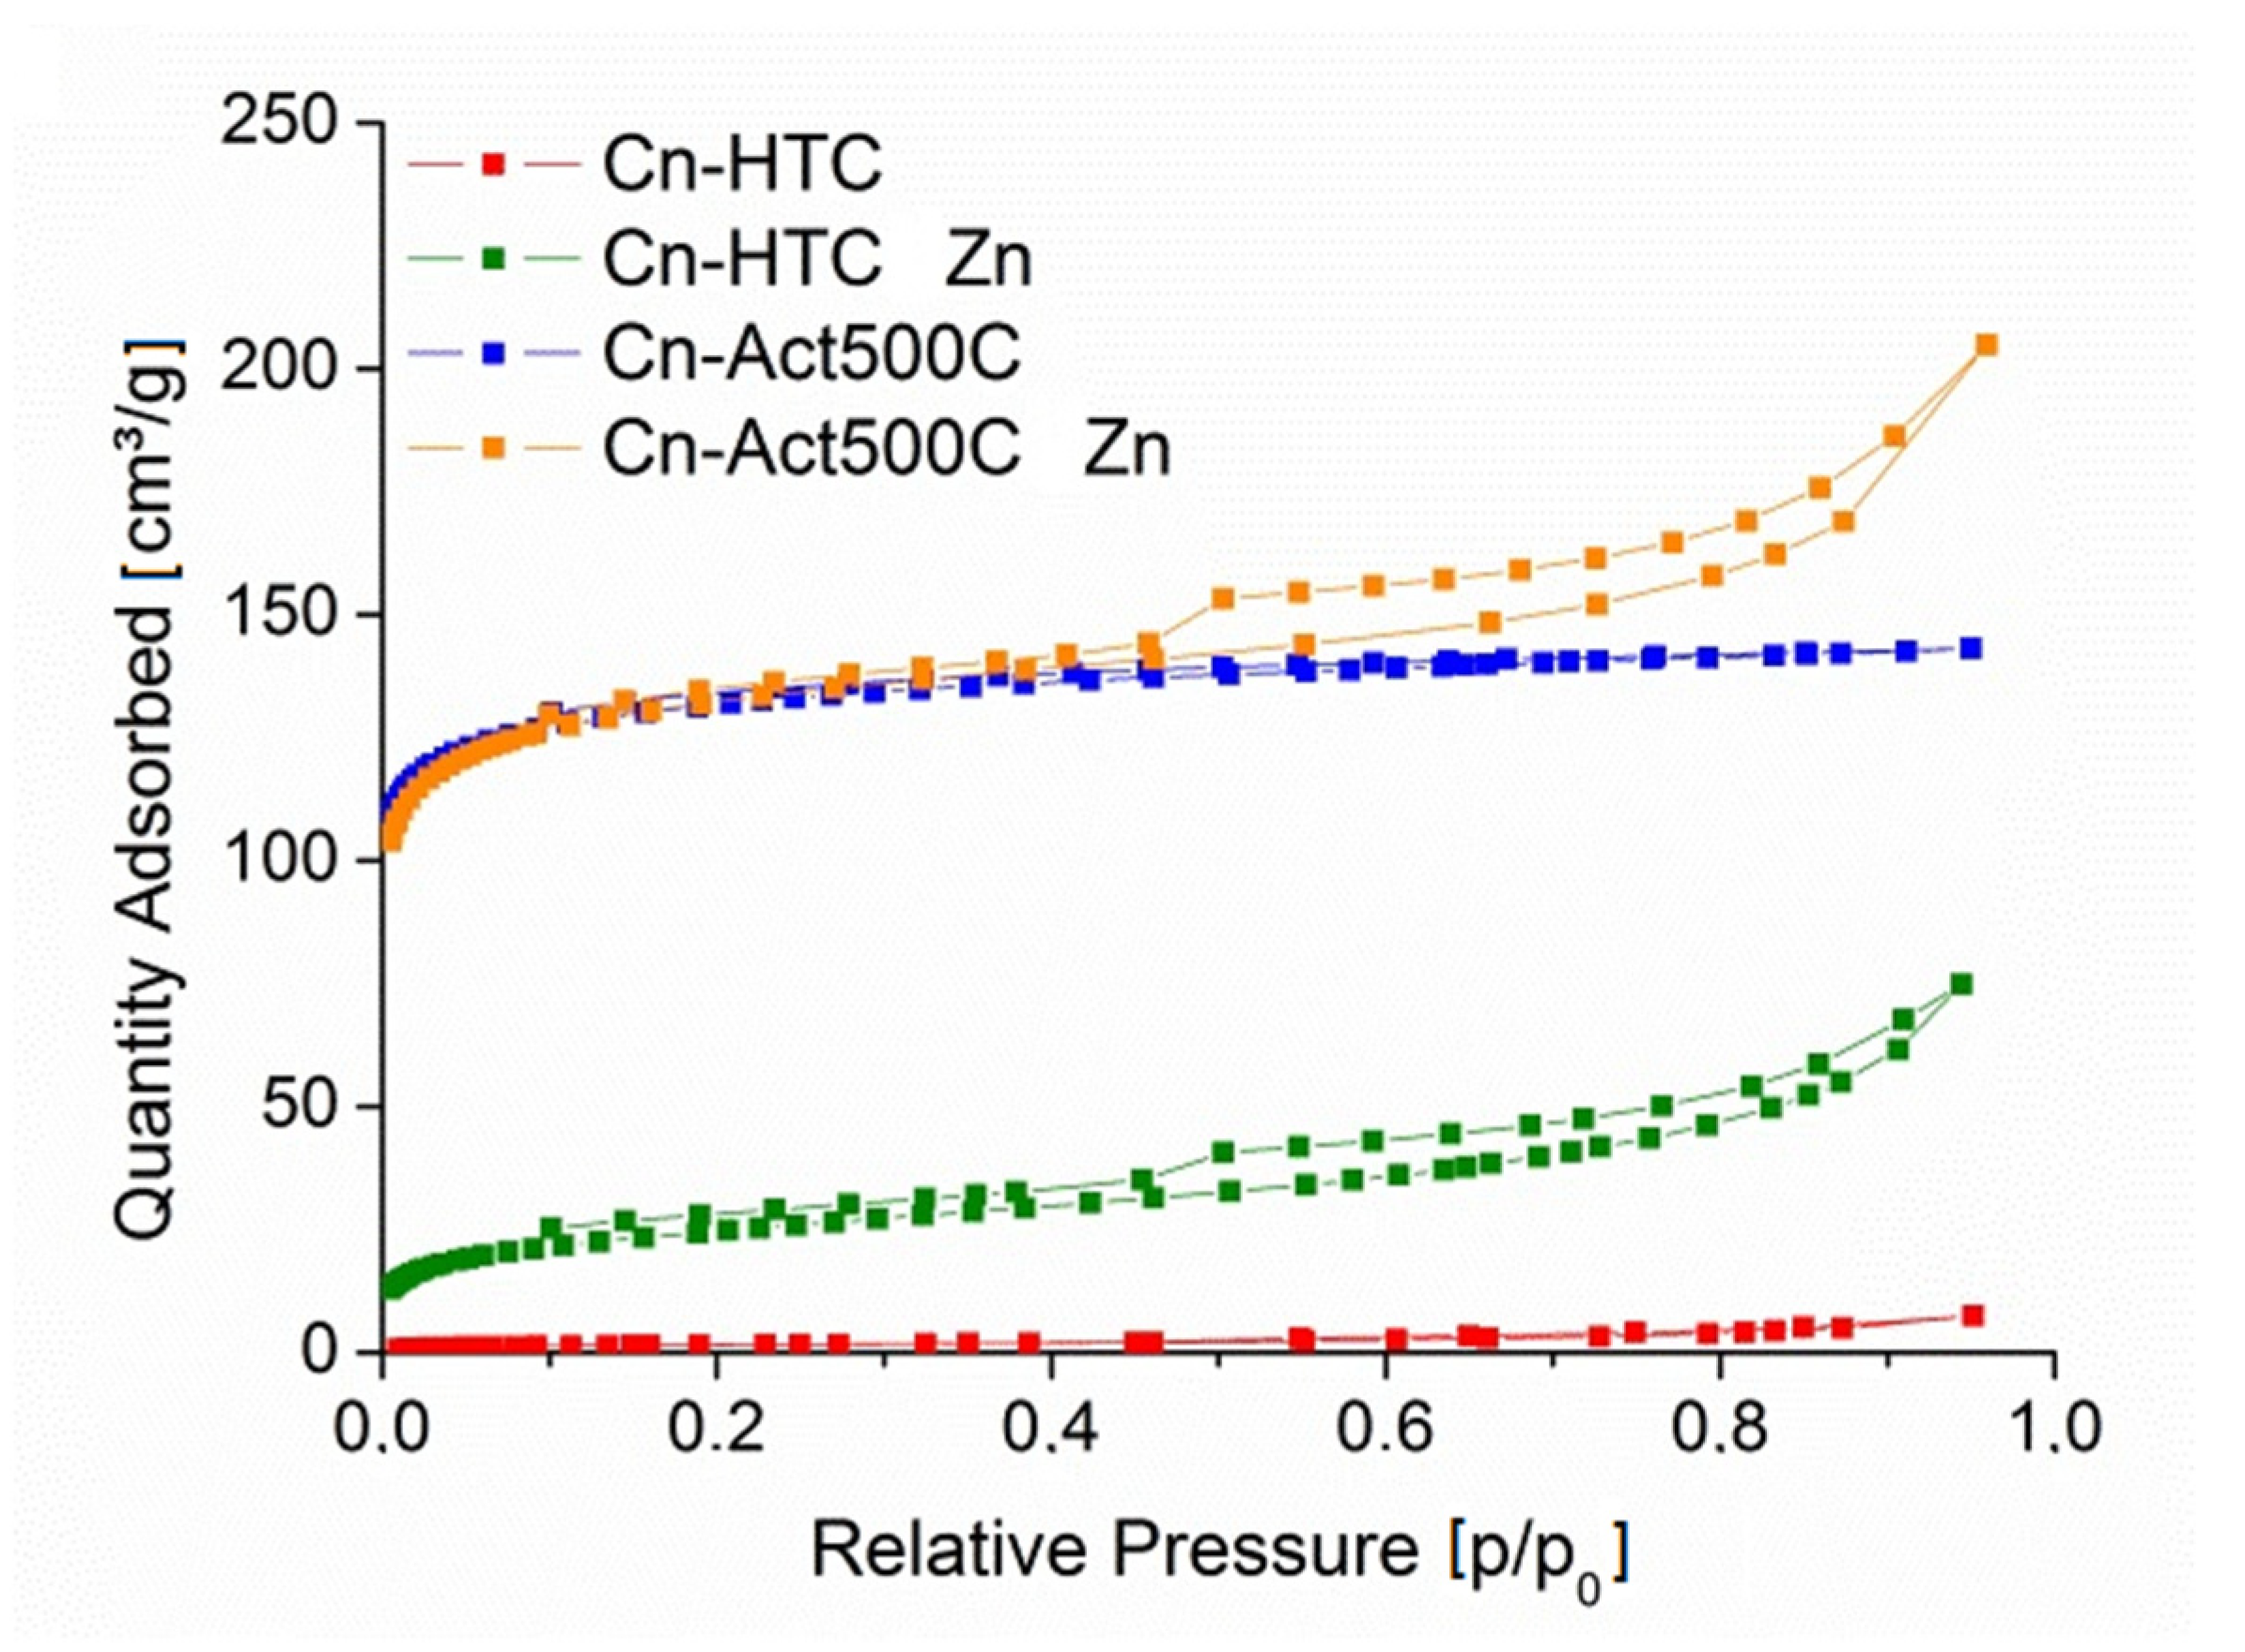
3.5. Surface Area and Adsorption Studies

The surface areas as measured with N2 for the different HTC-derived hydrochars, and the related steam-activated secondary products, are shown in Figure 7. The surface areas of hydrochars obtained by salt HTC are slightly increased compared to those after normal HTC, presumably due to the catalytic effects of the remaining ZnCl2, which catalyzes stripping reactions of hydrogen and oxygen [16,27].
Additional steam activation increases the specific surface area of all hydrochars by a considerable factor. All activated samples showed an increased uptake of nitrogen in the pressure region p/p0 < 0.1 with a type I(b) isotherm, indicating the high measured areas were due to the presence of micropores and possibly narrow mesopores (<~2.5 nm) [38]. The highest BET surface area, of well above 740 m2⋅g−1, was obtained by activating the hydrochar from sawdust for 1 h at 500 °C with steam. During steam activation, a sufficiently high temperature (T ≥ 500 °C) is required to increase the surface area; up to 350 °C, only SSAs of about 200 m2⋅g−1 were observed. Interestingly, after steam activation, the chars from dried dandelion and sawdust exhibited higher surface areas if no salt was previously present in the HTC process, and was most distinct in the latter. The presence of more large structures in these samples presumably increases the chance to develop inner porosity. The high ash contents in the chars from dried dandelion, in general, lower the obtainable surface areas.
Figure 8 showcases typical nitrogen sorption isotherms for hydrochars received from HTC with water or the salt/water mixture along with those of their steam-activated follow-up products for the example of coconut shell biomass. The figure clearly shows the very flat isotherm leading to low SSA (<10 m2∙g−1) after normal HTC samples with water. Using the aqueous salt mixture in HTC, an increase in surface area by a factor of 16 is obtained. This increase could be derived from the breaking of large structures, as visible by SEM measurements. In the isotherms, a formation of some microporosity is indicated by the slightly sharper increase in the low relative pressure range < 0.04 p/p0 (Figure 8 green). Most significant, however, is the formation of mesopores, ranging from 3 to about 10 nm in size, indicated by the small hysteresis loop in the isotherm. The type H3 hysteresis loop also points to the additional existence of macropores which are not completely filled with the N2 condensate [46].
Steam activating increases in the surface area to about 500 m2/g, mainly due to introduction of microporosity as evident from the typical type I shape of theN2 isotherms in the low relative pressure range [36]. Micropore formation may occur by oxidation of surface carbon compounds caused by a rapid desorption of the formed CO2. It is known that, for example, in some MOF materials, an increase in micropore and mesopore sizes is possible with compressed CO2 [47]. The well-defined plateau visible for Cn-Act500 points to a microporous material with a relatively small external surface, whereas Cn-Act500 Zn shows a further increase at high relative pressure, also indicating the presence of an extended mesoporosity [37]. In the literature, a comparable but less pronounced gas uptake at high relative pressures is described as an indication of small interstitial voids between small particles [15].

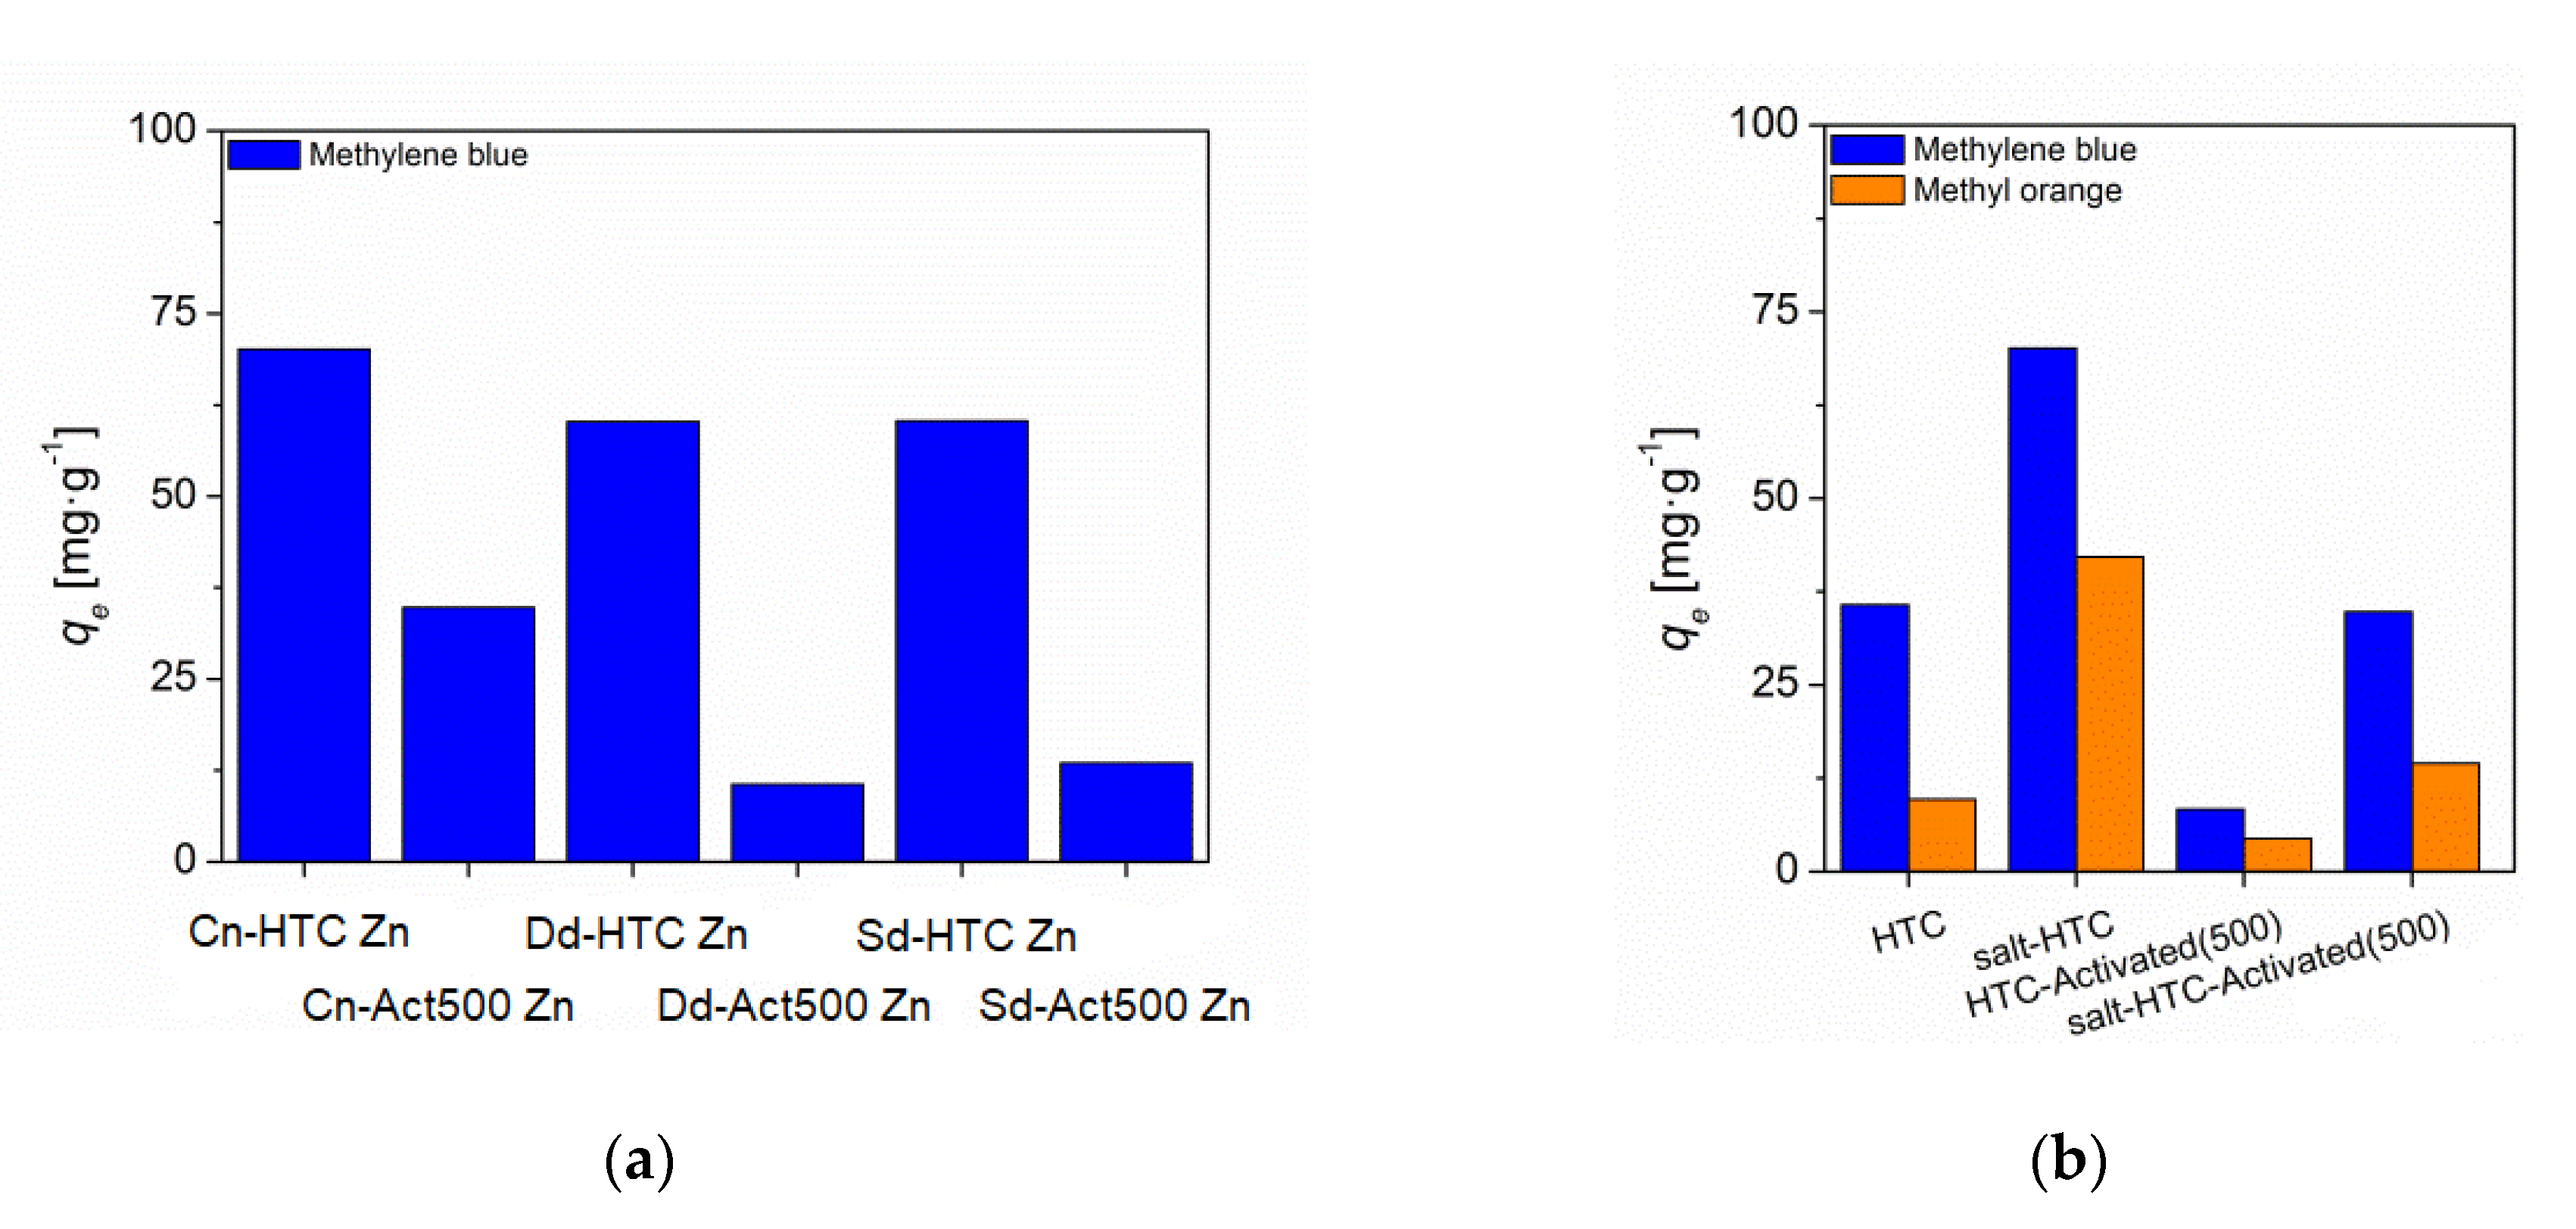
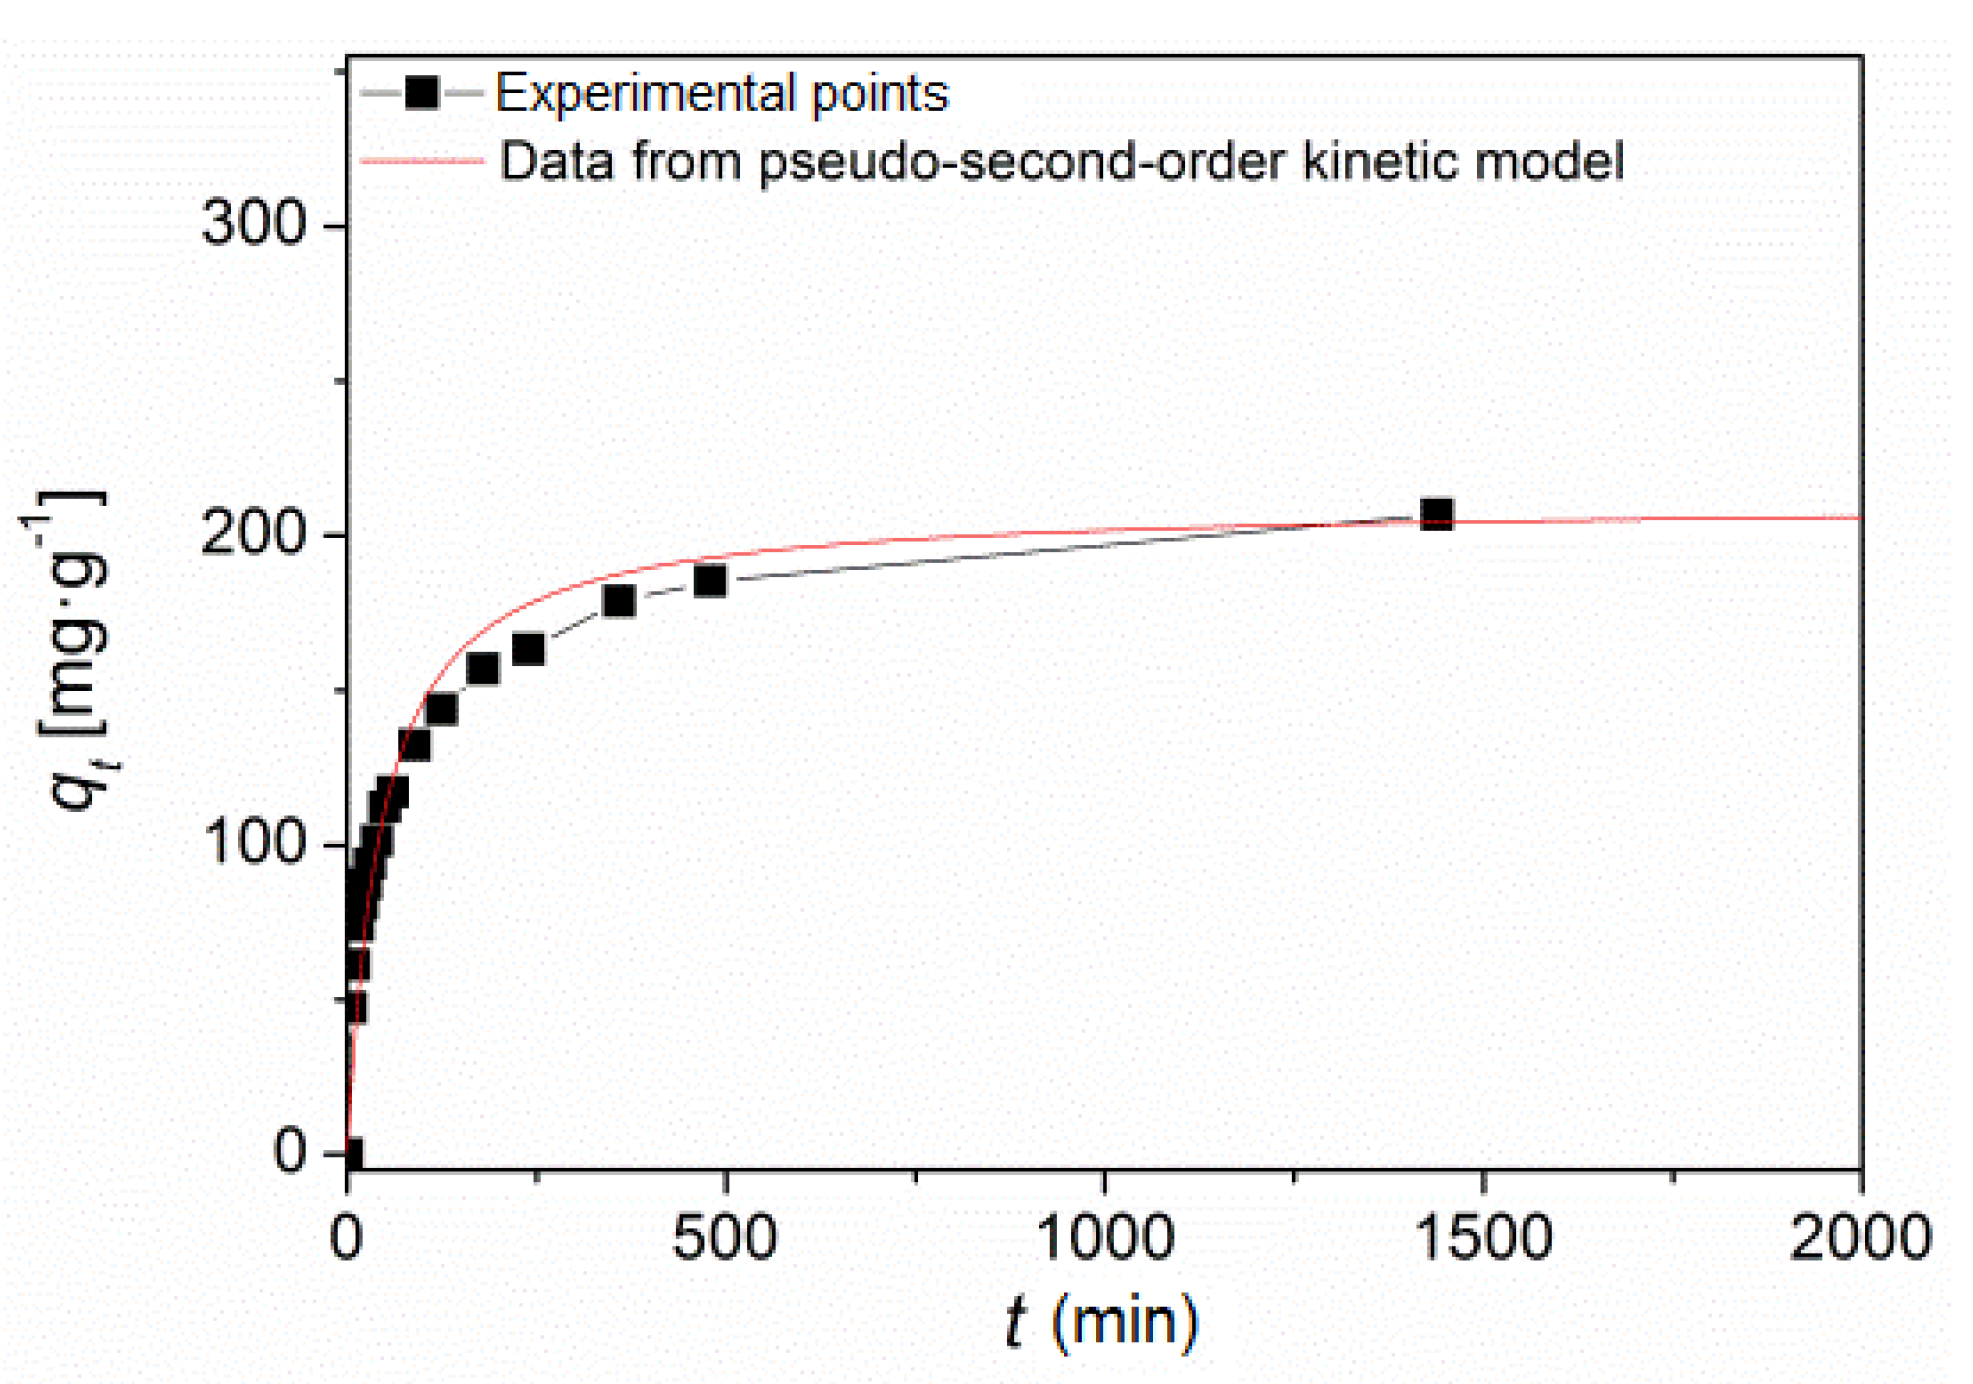
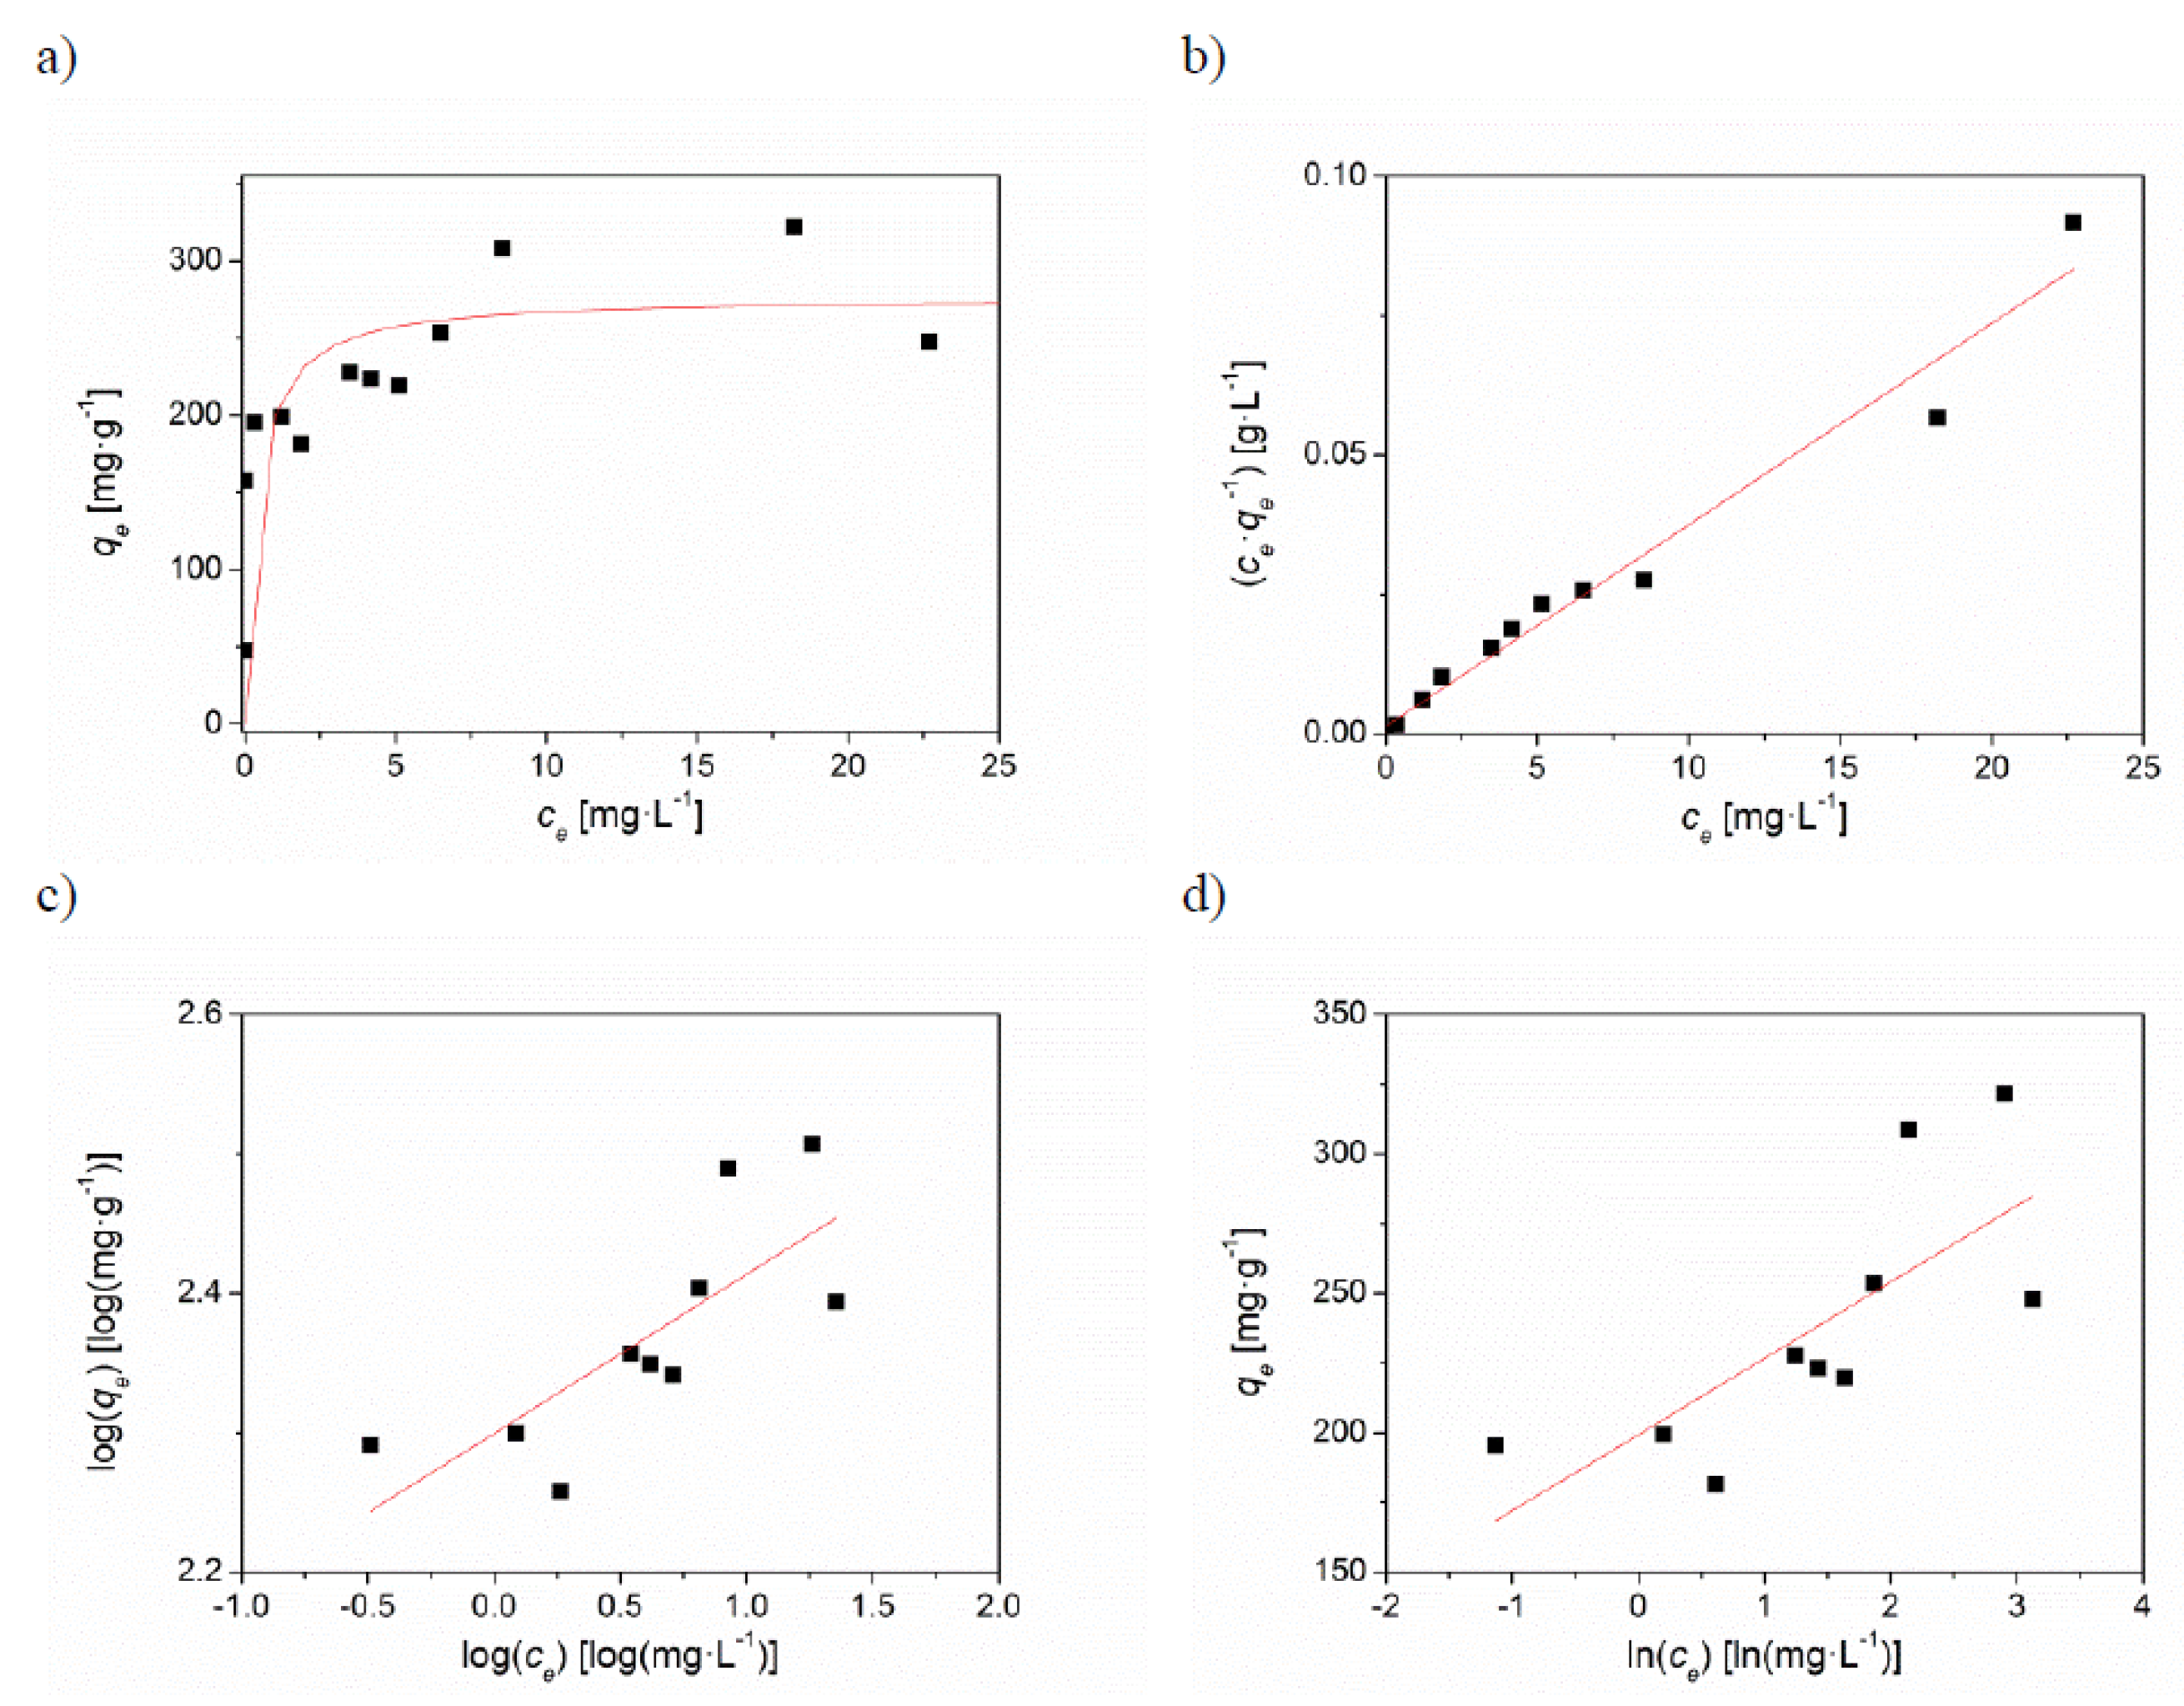
3.6. Adsorption Studies with the Dyes Methylene Blue and Methyl Orange

Figure 9a shows the capacities qe of the salt-HTC hydrochars (12 h, 180 °C) and their steam-activated (1 h, 500 °C) chars obtained from the three different substrates (coconut shell powder, dried dandelion leaves and sawdust) in the adsorption of the dye methylene blue. Surprisingly, the HTC hydrochars were able to remove more dye from the solution than their steam-activated follow-up products. The adsorption capacities for the salt-HTC hydrochars range between 60 and 70 mg∙g−1 but after steam activation the capacity drops to about 35 mg∙g−1 for the coconut shell powder-derived char and below 15 mg∙g−1 for the other two substrates.
It was supposed that the higher surface areas of the activated hydrochars (up to 740 m2/g from gas-phase N2 adsorption) would offer more adsorption sites, leading to higher dye sorption. However, the formed micropores (Figure 8) are too small for dye uptake and, moreover, the observed loss of surface functionality (Figure 3) lowers the necessary interaction strength. Although having different surface areas (8.92 m2/g (Dd-HTC Zn) and 32.60 m2/g (Sd-HTC Zn)) their values for qe MB were almost identical (~60 mg∙g−1). This supports the idea of higher importance of the surface roughness, functionality and available pore sizes of about 3 to 10 nm over the BET surface area, which is dominated by about 1 nm wide pores, for the dye adsorption.
This confirms literature data on the adsorption kinetics of methylene blue or malachite green onto tailored activated carbons from rice husk [48,49]. Although the full decolorization of a MB solution required more than 25 h when using microporous samples with surface areas of more than 2000 m2/g, less than 10 min was needed with carbon materials that exhibit lower BET surface areas (600 m2/g) but possess an increased amount of mesopores.
The dye adsorption on the carbons obtained from coconut shell powder (Figure 9b) shows the same trend; in line with the increase in the mesoporosity of the hydrochars obtained with the aqueous salt mixtures in the HTC reaction, the amount of dye removed from solution doubles compared to that with hydrochars from HTC with pure water. After the steam activation created micropores, the adsorption capacity decreased strongly for all samples, and mostly for the chars obtained without salt possessing or mesopores. An increase in the steam temperature during activation from 500 to 650 °C even increased the negative effect; the qe of the salt-HTC hydrochars decreased further from about 35 mg∙g−1 to about 26 mg∙g−1, because a portion of the mesopores collapsed to micropores. However, even after activation, the dye adsorption is much higher on salt-HTC hydrochars than on those from the normal HTC process, due to the presence of mesopores which survive the steam activation (Figure 8).
The same trend holds if MO was used instead of MB, whereas the amount of dye removed from solution was always lower for MO than MB due to an inhibited surface coverage and pore accessibility for the larger MO, which has an average molecular size of 26.14 Å, compared to MB with 16.34 Å [50,51]. The necessity of mesopores is even more pronounced for the larger dye, as can be seen by the larger ratio in the qe values of hydrochars from salt HTC and HTC (Figure 9b).
For both dyes, MB and MO, maximum adsorption was found for the salt HTC-obtained hydrochar Cn-HTC Zn, of 70.13 and 42.15 mg∙g−1, respectively, demonstrating the high potential for pollutant removal of hydrochars obtained in the salt-assisted HTC process due to a good compromise between some mesoporosity (Figure 8) and some surviving functional groups at the inner surface (Figure 3).
If the temperature of the salt HTC is increased from 180 to 220 °C and the reaction time is prolonged from 12 to 20 h, for coconut shell-based hydrochars the BET surface areas increase from 88 m2/g to about 200 m2/g. This increase is mainly related to an increased mesopore volume. With such hydrochars an MB adsorption capacity qe of 207 mg∙g−1 was obtained (Figure 10).
This adsorption capacity exceeds those reported by Saetea and Tippayawong, who determined for the removal of MB with steam-activated hydrochars from sewage sludge an adsorption capacity of around 160 mg∙g−1 [52]. In their study a much higher steam temperature of 900 °C was applied. Other reported adsorption capacities for MB with HTC salt-obtained hydrochars from pure fructose [25] and corncob [53] are with qe values of 83 and 99, respectively, in the same range of our 180 °C salt-HTC treated chars. All three studies do not report on the adsorption of MO. For MO, Martin-Jimeno et al. reported a qe of 29 for hydrochar from pure glucose, which was HTC treated in the presence of graphene oxide [54]. Although HTC was performed under different conditions with the more sophisticated and expensive additive graphene oxide, the qe value is in the same range as for our 180 °C salt-HTC treatment (Figure 9b).
The adsorption of MB onto activated carbons is considered to take place via different mechanisms, such as electrostatic interactions (I), hydrogen bonding formation (II), electron donor-acceptor (III) and π-π dispersion interaction (IV). In general, interaction IV might be the most important, because the basal plane of an activated carbon is constituted mainly of graphene layers with fewer functional groups present for the other mechanisms to take place [55].
However, an FTIR study after adsorption of the cationic dye methylene green showed that -OH and -C=O groups present on the hydrochar surface interact much more strongly than the aromatic C=C bonds [56]. By increasing the surface functionality via oxy-genation, the dye adsorption can be enhanced significantly. Moreover, metal cations, e.g., Cu2+, are better adsorbed on hydrochars compared to pyrolytic chars obtained at high temperatures of 700 °C or above, even if the pore system of the hydrochars is less well developed [11]. The reason is again the presence of more oxygen-containing groups on the surface. These results are in good agreement with the fact that after the salt-HTC treatment, the highest MB adsorption is obtained, because in these samples oxygen-containing groups are still present on the inner surface of the hydrochars (Figure 3), which are lost after treatment with steam.
Regarding the adsorption kinetics of MB, it can be seen in Figure 10 that most of the dye was removed within the first minutes. After just 5 min, with qt = 47 mg∙g−1, around one-quarter of the final equilibrium capacity (qe = 207 mg∙g−1) was achieved. After 30 min, nearly 50% of the capacity was reached (qt = 94 mg∙g−1) and after 8 h a value of 185 mg∙g−1 was close to the final equilibrium capacity. When comparing pseudo-first-order, pseudo-second-order and Elovich kinetic models to fit the data, the pseudo-second-order model suits best, with a correlation coefficient R2 = 0.9979. Therefore, the rate of adsorption probably depends less on the concentration of the adsorbate in the aqueous dye solution and more on the availability of the adsorption sites, as described by the pseudo-second-order model [57].
Additionally, the initial concentration can be an important driving force for the mass transfer from the solution to the solid. Therefore, the dependency of the initial dye concentration on the adsorption capacity was tested. The initial concentration c0 ranged from 1 to 25 mg∙L−1 where, with increasing c0, the adsorption capacity qe increased from 48 to 200–350 mg∙g−1 (Figure 11a). Although there is a strong spread of data points due to the low weights and high dilutions of the different compounds, a quick saturation trend is visible. The obtained data points were fitted using three different isotherm models: Langmuir, Freundlich and Temkin. The obtained isotherms data are shown in Figure 11b–d. Table 2 summarizes the isotherm parameters determined from the slopes and intercepts of the linear fitting. The data was best fitted to the Langmuir isotherm model, with a correlation coefficient of 0.9682. The other two models showed a very poor representation of the data, with values for R2 of around 0.5 (Freundlich: R2 = 0.5436; Temkin R2 = 0.5031). The good fit to the Langmuir isotherm indicates rather homogenous adsorption places on which the methylene blue will be adsorbed in a monolayer. It is highly probable that these adsorption places are the oxygen atoms of the functional groups still found in the non-activated samples by FTIR (Figure 3, sample Cn-HTC Zn) [57].
The maximum monolayer adsorption capacity of the methylene blue (qm) found from the Langmuir isotherm was determined to be about 277 mg∙g−1, significantly exceeding the above-mentioned values of different hydrochars [25,52,54].

4. Conclusions

It was shown that the approach of using aqueous salt mixtures as a reaction medium for the hydrothermal carbonization of complex biomass substrates results in altered particle size, surface morphology and functionality, in addition to an ultimately higher surface area of the obtained hydrochars when compared to those received from a normal HTC process with water only.
In addition to further improving the typical increase in carbon content in HTC, an enhancement of the otherwise low surface areas of the carbons (<10 m2/g) was observed for two of the three substrate tests (sawdust and coconut shell powder), of up to 88 m2/g at 180 °C carbonization temperature, and even 200 m2/g at 220 °C. These results were due to a breaking of larger char structures in the presence of the salts as a result of the degradation and dissolution of cellulose, hemicellulose and even parts of the lignin. This leads to a formation of mesopores and small amounts of micropores, as shown by SEM and N2 sorption. Moreover, a shift of surface functionality to more carbonyl and aromatic functionality took place as seen by FTIR measurements. Only dried dandelion was identified as an inappropriate substrate for HTC processes due to its high ash content and low reaction yields.
We demonstrated that it is possible to alter the carbon content, surface morphology and surface area of hydrochars by use of zinc chloride in the HTC process as an easily removable and recyclable additive. It was proven that the salt could be re-used in at least three HTC runs without significant loss of surface area of the obtained hydrochars [58].
The ZnCl2 helps to break cellulose and lignin structures in the biomass at significantly lower, and thus more energy-efficient, temperatures. This could be concluded from the analysis of the biomass substrate and the obtained hydrochars by solid state 13C NMR spectroscopy. In particular, the cracking of the usually HTC-resistant lignin structures indicates significant novel potential in the hydrothermal carbonization of lignocellulosic biomass materials.
Additional steam activation can significantly increase the surface areas of all hydrochars, by up to a value of about 740 m2∙g−1 for chars from sawdust. The duration of activation plays a minor role compared to the temperature and the presence of large biomass structures, which provide an extensive introduction to microporosity. The accompanied loss of surface functionality, however, is a drawback. Nonetheless, the formation of hydrochars under saline conditions is advantageous, as they show increased surface roughness and increased mesoporosity with preserved functionality, rendering them an interesting choice for pollutant removal, as shown by the results from the dye adsorption experiments. The dye adsorption takes place via external and intraparticle diffusion, and strongly depends on the presence of suitable oxygen-containing adsorption sites, as seen from the pseudo-second-order kinetics. This confirms the expectation that chemisorption processes are more important than pure physisorption.

Author Contributions

Conceptualization, H.M. and M.W.; Methodology, H.M., P.B. and M.W.; Investigation, H.M.; Resources, M.W.; Data Curation, H.M. and P.B.; Writing—Original Draft Preparation, H.M.; Writing—Review and Editing, M.W.; Visualization, H.M. and P.B.; Supervision, M.W.; Project Administration, H.M. and M.W.; Funding Acquisition, M.W. All authors have read and agreed to the published version of the manuscript.

Funding

We gratefully acknowledge financial support for our Bruker Avance III HD 500 MHz NMR spectrometer by the State of Lower Saxony (Germany) and the German Science Foundation (DFG) under contract INST 184/154-1.

Institutional Review Board Statement

Not applicable.

Informed Consent Statement

Not applicable.

Data Availability Statement

The data presented in this study are available on request from the corresponding author.

Conflicts of Interest

The authors declare no conflict of interest. The funders had no role in the design of the study; in the collection, analyses, or interpretation of data; in the writing of the manuscript, or in the decision to publish the results.

References

  1. Sharma, H.B.; Sarmah, A.K.; Dubey, B. Hydrothermal carbonization of renewable waste biomass for solid biofuel production: A discussion on process mechanism, the influence of process parameters, environmental performance and fuel properties of hydrochar. Renew. Sustain. Energy Rev. 2020, 123, 109761. [Google Scholar] [CrossRef]
  2. Funke, A.; Reebs, F.; Kruse, A. Experimental comparison of hydrothermal and vapothermal carbonization. Fuel Process. Technol. 2013, 115, 261–269. [Google Scholar] [CrossRef]
  3. Kambo, H.S.; Dutta, A. Comparative evaluation of torrefaction and hydrothermal carbonization of lignocellulosic biomass for the production of solid biofuel. Energy Convers. Manag. 2015, 105, 746–755. [Google Scholar] [CrossRef]
  4. Yeoh, K.H.; Shafie, S.A.; Al-Attab, K.A.; Zainal, Z.A. Upgrading agricultural wastes using three different carbonization methods: Thermal, hydrothermal and vapothermal. Bioresour. Technol. 2018, 265, 365–371. [Google Scholar] [CrossRef]
  5. Dai, L.; Wang, Y.; Liu, Y.; Ruan, R.; He, C.; Yu, Z.; Jiang, L.; Zeng, Z.; Tian, X. Integrated process of lignocellulosic biomass torrefaction and pyrolysis for upgrading bio-oil production: A state-of-the-art review. Renew. Sustain. Energy Rev. 2019, 107, 20–36. [Google Scholar] [CrossRef]
  6. Sudarsanam, P.; Zhong, R.; Van den Bosch, S.; Coman, S.M.; Parvulescu, V.I.; Sels, B.F. Functionalised heterogeneous catalysts for sustainable biomass valorization. Chem. Soc. Rev. 2018, 47, 8349–8402. [Google Scholar] [CrossRef] [PubMed] [Green Version]
  7. Titirici, M.M.; Antonietti, M. Chemistry and materials options of sustainable carbon materials made by hydrothermal carbonization. Chem. Soc. Rev. 2010, 39, 103–116. [Google Scholar] [CrossRef]
  8. Schonvogel, D.; Nowotny, M.; Woriescheck, T.; Multhaupt, H.; Wagner, P.; Dyck, A.; Agert, C.; Wark, M. Hydrothermal Carbonization-Derived Carbon from Waste Biomass as Renewable Pt Support for Fuel Cell Applications: Role of Carbon Activation. Energy Technol. 2019, 7, 1900344. [Google Scholar] [CrossRef] [Green Version]
  9. Magdziarz, A.; Mlonka-Medrala, A.; Sieradzka, M.; Aragon-Briceno, C.; Pozarlik, A.; Bramer, E.A.; Brem, G.; Niedzwiecki, L.; Pawlak-Kruczek, H. Multiphase analysis of hydrochars obtained by anaerobic digestion of municipal solid waste organic fraction. Renew. Energy 2021, 175, 108–118. [Google Scholar] [CrossRef]
  10. Budai, A.; Wang, L.; Gronli, M.; Strand, L.T.; Antal, M.J., Jr.; Abiven, S.; Dieguez-Alonso, A.; Anca-Couce, A.; Rasse, D.P. Surface Properties and Chemical Composition of Corncob and Miscanthus Biochars: Effects of Production Temperature and Method. J. Agric. Food Chem. 2014, 62, 3791–3799. [Google Scholar] [CrossRef]
  11. Liu, Z.; Zhang, F.S.; Wu, J. Characterization and application of chars produced from pinewood pyrolysis and hydrothermal treatment. Fuel 2010, 89, 510–514. [Google Scholar] [CrossRef]
  12. Sevilla, M.; Fuertes, A.B. Chemical and structural properties of carbonaceous products obtained by hydrothermal carbonization of saccharides. Chem. Eur. J. 2009, 15, 4195–4203. [Google Scholar] [CrossRef] [PubMed]
  13. Titirici, M.M.; Thomas, A.; Yu, S.H.; Mueller, J.O.; Antonietti, M. A direct synthesis of mesoporous carbons with bicontinuous pore morphology from crude plant material by hydrothermal carbonization. Chem. Mater. 2007, 19, 4205–4212. [Google Scholar] [CrossRef]
  14. Jain, A.; Balasubramanian, R.; Srinivasan, M.P. Hydrothermal conversion of biomass waste to activated carbon with high porosity: A review. Chem. Eng. J. 2016, 283, 789–805. [Google Scholar] [CrossRef]
  15. Fechler, N.; Wohlgemuth, S.; Phillip, J.; Antonietti, M. Salt and sugar: Direct synthesis of high surface area carbon materials at low temperatures via hydrothermal carbonization of glucose under hypersaline conditions. J. Mater. Chem. A 2013, 1, 9418–9421. [Google Scholar] [CrossRef] [Green Version]
  16. Ma, Z.; Zhang, H.; Yang, Z.; Zhang, Y.; Yu, B.; Liu, Z. Highly mesoporous carbons derived from biomass feedstocks templated with eutectic salt ZnCl2/KCl. J. Mater. Chem. A 2014, 2, 19324–19329. [Google Scholar] [CrossRef]
  17. Liu, T.; Liu, Z.; Zheng, Q.; Lang, Q.; Xia, Y.; Peng, N.; Gai, C. Effect of hydrothermal carbonization on migration and environmental risk of heavy metals in sewage sludge during pyrolysis. Bioresour. Technol. 2018, 247, 282–290. [Google Scholar] [CrossRef]
  18. Tekin, K.; Karagöz, S.; Bektaş, S. A review of hydrothermal biomass processing. Renew. Sustain. Energy Rev. 2014, 40, 673–687. [Google Scholar] [CrossRef]
  19. Han, M.; Jiang, K.; Jiao, P.; Ji, Y.; Zhou, J.; Zhuang, W.; Chen, Y.; Liu, D.; Zhu, C.; Chen, X.; et al. Bio-butanol sorption performance on novel porous-carbon adsorbents from corncob prepared via hydrothermal carbonization and post-pyrolysis method. Sci. Rep. 2017, 7, 11753. [Google Scholar] [CrossRef] [Green Version]
  20. Lua, A.C.; Guo, J. Activated carbon prepared from oil palm stone by one-step CO2 activation for gaseous pollutant removal. Carbon 2000, 38, 1089–1097. [Google Scholar] [CrossRef]
  21. Papurello, D.; Santarelli, M.; Fiorilli, S. Physical Activation of Waste-Derived Materials for Biogas Cleaning. Energies 2018, 11, 2338. [Google Scholar] [CrossRef] [Green Version]
  22. Lee, Y.-W.; Kim, H.-J.; Park, J.-W.; Choi, B.-U.; Choi, D.-K.; Park, J.-W. Adsorption and reaction behavior for the simultaneous adsorption of NO-NO2 and SO2 on activated carbon impregnated with KOH. Carbon 2003, 41, 1881–1888. [Google Scholar] [CrossRef]
  23. Li, G.; Gao, X.; Wang, K.; Cheng, Z. Porous carbon nanospheres with high EDLC capacitance. Diam. Relat. Mater. 2018, 88, 12–17. [Google Scholar] [CrossRef]
  24. Lillo-Ródenas, M.A.; Juan-Juan, J.; Cazorla-Amorós, D.; Linares-Solano, A. About reactions occurring during chemical activation with hydroxides. Carbon 2004, 42, 1371–1375. [Google Scholar] [CrossRef]
  25. Alatalo, S.M.; Makila, E.; Repo, E.; Heinonen, M.; Salonen, J.; Kukk, E.; Sillanpaa, M.; Titirici, M.M. Meso-and microporous soft templated hydrothermal carbons for dye removal from water. Green Chem. 2016, 18, 1137–1146. [Google Scholar] [CrossRef] [Green Version]
  26. Rouquerol, F.; Rouquerol, J.; Sing, K.S.W.; Llewellyn, P.; Maurin, G. Adsorption by Powders and Porous Solids, 2nd ed.; Elsevier: Amsterdam, The Netherlands, 2014. [Google Scholar]
  27. Falco, C.; Baccile, N.; Titirici, M.M. Morphological and structural differences between glucose, cellulose and lignocellulosic biomass derived hydrothermal carbons. Green Chem. 2011, 13, 3273–3281. [Google Scholar] [CrossRef] [Green Version]
  28. Baccile, N.; Weber, J.; Falco, C.; Titirici, M.M. Sustainable Carbon Materials from Hydrothermal Processes; Titirici, M.M., Ed.; John Wiley & Sons, Ltd.: Hoboken, NJ, USA, 2013; Chapter 6; pp. 151–211. [Google Scholar]
  29. Baccile, N.; Laurent, G.; Babonneau, F.; Fayon, F.; Titirici, M.M.; Antonietti, M. Structural Characterization of Hydrothermal Carbon Spheres by Advanced Solid-State MAS C-13 NMR Investigations. J. Phys. Chem. C 2009, 113, 9644–9654. [Google Scholar] [CrossRef] [Green Version]
  30. Islam, M.A.; Benhouria, A.; Asif, M.; Hameed, B.H. Methylene blue adsorption on factory-rejected tea activated carbon prepared by conjunction of hydrothermal carbonization and sodium hydroxide activation processes. J. Taiwan Inst. Chem. Eng. 2015, 52, 57–64. [Google Scholar] [CrossRef]
  31. Fang, J.; Gao, B.; Chen, J.; Zimmerman, A.R. Hydrochars derived from plant biomass under various conditions: Characterization and potential applications and impacts. Chem. Eng. J. 2015, 267, 253–259. [Google Scholar] [CrossRef]
  32. Reza, M.T.; Wirth, B.; Luder, U.; Werner, M. Behavior of selected hydrolyzed and dehydrated products during hydrothermal carbonization of biomass. Bioresour. Technol. 2014, 169, 352–361. [Google Scholar] [CrossRef]
  33. Mumme, J.; Eckervogt, L.; Pielert, J.; Diakite, M.; Rupp, F.; Kern, J. Hydrothermal carbonization of anaerobically digested maize silage. Bioresour. Technol. 2011, 102, 9255–9260. [Google Scholar] [CrossRef]
  34. Licursi, D.; Antonetti, C.; Bernardini, J.; Cinelli, P.; Coltelli, M.B.; Lazzeri, A.; Martinelli, M.; Galletti, A.M.R. Characterization of the Arundo Donax L. solid residue from hydrothermal conversion: Comparison with technical lignins and application perspectives. Ind. Crops Prod. 2015, 76, 1008–1024. [Google Scholar] [CrossRef]
  35. Zeeh, B. Spektroskopische Methoden in der Organischen Chemie, 7th ed.; Hesse, M., Meier, H., Zeeh, B., Eds.; Georg Thieme Publisher: Stuttgart, Germany, 2005; Chapter 2; pp. 33–73. [Google Scholar]
  36. Ahmadpour, A.; Do, D.D. The preparation of activated carbon from macadamia nutshell by chemical activation. Carbon 1997, 35, 1723–1732. [Google Scholar] [CrossRef]
  37. Cesano, F.; Rahman, M.M.; Bertarione, S.; Vitillo, J.G.; Scarano, D.; Zecchina, A. Preparation and adsorption properties of activated porous carbons obtained using volatile zinc templating phases. Carbon 2012, 50, 2045–2060. [Google Scholar] [CrossRef]
  38. Fischer, S. Unconventional dissolution and derivatization of cellulose. Lenzing. Ber. 2004, 83, 71–78. [Google Scholar]
  39. Hu, Z.; Srinivasan, M.P.; Ni, Y. Novel activation process for preparing highly microporous and mesoporous activated carbons. Carbon 2001, 39, 877–886. [Google Scholar] [CrossRef]
  40. Dinjus, E.; Kruse, A.; Troger, N. Hydrothermal Carbonization-1. Influence of Lignin in Lignocelluloses. Chem. Eng. Technol. 2011, 34, 2037–2043. [Google Scholar] [CrossRef]
  41. Liu, Z.G.; Quek, A.; Hoekman, S.K.; Balasubramanian, R. Production of solid biochar fuel from waste biomass by hydrothermal carbonization. Fuel 2013, 103, 943–949. [Google Scholar] [CrossRef]
  42. Zhou, L.; Yang, X.; Xu, J.; Shi, M.; Wang, F.; Chen, C.; Xu, J. Depolymerization of cellulose to glucose by oxidation-hydrolysis. Green Chem. 2015, 17, 1519–1524. [Google Scholar] [CrossRef]
  43. Wysokowski, M.; Klapiszewski, L.; Moszyński, D.; Bartczak, P.; Szatkowski, T.; Majchrzak, I.; Siwińska-Stefańska, K.; Bazhenov, V.V.; Jesionowski, T. Modification of Chitin with Kraft Lignin and Development of New Biosorbents for Removal of Cadmium(II) and Nickel(II) Ions. Mar. Drugs 2014, 12, 2245–2268. [Google Scholar] [CrossRef] [Green Version]
  44. Roehrdanz, M.; Rebling, T.; Ohlert, J.; Jasper, J.; Greve, T.; Buchwald, R.; von Frieling, P.; Wark, M. Hydrothermal carbonization of biomass from landscape management—Influence of process parameters on soil properties of hydrochars. J. Environ. Managem. 2016, 173, 72–78. [Google Scholar] [CrossRef] [PubMed]
  45. Yang, H.P.; Yan, R.; Chen, H.P.; Zheng, C.G.; Lee, D.H.; Liang, D.T. In-depth investigation of biomass pyrolysis based on three major components: Hemicellulose, cellulose and lignin. Energy Fuels 2006, 20, 388–393. [Google Scholar] [CrossRef]
  46. Thommes, M.; Kaneko, K.; Neimark, A.V.; Olivier, J.P.; Rodriguez-Reinoso, F.; Rouquerol, J.; Sing, K.S.W. Physisorption of gases, with special reference to the evaluation of surface area and pore size distribution (IUPAC Technical Report). Pure Appl. Chem. 2015, 87, 1051–1069. [Google Scholar] [CrossRef] [Green Version]
  47. Wang, C.; Liu, X.; Li, W.; Huang, X.; Luan, S.; Huo, X.; Zhang, M.; Wang, Q. CO2 mediated fabrication of hierarchically porous metal-organic frameworks. Microporous Mesoporous Mater 2019, 277, 154–162. [Google Scholar] [CrossRef]
  48. Juarez-Galan, J.M.; Silvestre-Albero, A.; Silvestre-Albero, J.; Rodriguez-Reinoso, F. Synthesis of activated carbon with highly developed “mesoporosity”. Microporous Mesoporous Mater. 2009, 117, 519–521. [Google Scholar] [CrossRef]
  49. Guo, Y.P.; Yang, S.F.; Fu, W.Y.; Qi, J.R.; Li, R.Z.; Wang, Z.C.; Xu, H.D. Adsorption of malachite green on micro- and mesoporous rice husk-based active carbon. Dyes Pigment. 2003, 56, 219–229. [Google Scholar] [CrossRef]
  50. Danish, M.; Hashim, R.; Mohamad Ibrahim, M.N.; Sulaiman, O. Characterization of physically activated acacia mangium wood-based carbon for the removal of methyl orange dye. BioResources 2013, 8, 4323–4339. [Google Scholar] [CrossRef] [Green Version]
  51. Zhao, X.; Bu, X.; Wu, T.; Zheng, S.T.; Wang, L.; Feng, P. Selective anion exchange with nanogated isoreticular positive metal-organic frameworks. Nat. Commun. 2013, 4, 2344–2353. [Google Scholar] [CrossRef]
  52. Saetea, P.; Tippayawong, N. Characterization of Adsorbent from Hydrothermally Carbonized and Steam Activated Sewage Sludge. In Proceedings of the World Congress on Engineering, London, UK, 3–5 July 2013; Volume III. [Google Scholar]
  53. Mok, W.S.L.; Antal, M.J.; Szabo, P.; Varhegyi, G.; Zelei, B. Formation of charcoal from biomass in a sealed reactor. Ind. Eng. Chem. Res. 1992, 31, 1162–1166. [Google Scholar] [CrossRef]
  54. Martin-Jimeno, F.J.; Suarez-Garcia, F.; Paredes, J.I.; Martinez-Alonso, A.; Tascon, J.M.D. Activated carbon xerogels with a cellular morphology derived from hydrothermally carbonized glucose-graphene oxide hybrids and their performance towards CO2 and dye adsorption. Carbon 2015, 81, 137–147. [Google Scholar] [CrossRef]
  55. Vargas, A.M.M.; Cazetta, A.L.; Kunita, M.H.; Silva, T.L.; Almeida, V.C. Adsorption of methylene blue on activated carbon produced from flamboyant pods (Delonix regia): Study of adsorption isotherms and kinetic models. Chem. Eng. J. 2011, 168, 722–730. [Google Scholar] [CrossRef]
  56. Tran, H.N.; You, S.J.; Chao, H.P. Insight into adsorption mechanism of cationic dye onto agricultural residues-derived hydrochars: Negligible role of pi-pi interaction. Korean J. Chem. Eng. 2017, 34, 1708–1720. [Google Scholar] [CrossRef]
  57. Ma, Y.H.; Wang, Q.H.; Wang, X.N.; Sun, X.H.; Wang, X.Q. A comprehensive study on activated carbon prepared from spent shiitake substrate via pyrolysis with ZnCl2. J. Porous Mater. 2015, 22, 157–169. [Google Scholar] [CrossRef]
  58. Multhaupt, H. Potential of Hydrochars Obtained by Hydrothermal Carbonization under Saline Conditions. Ph.D. Thesis, Carl von Ossietzky University of Oldenburg, Oldenburg, Germany, 2018. [Google Scholar]
Figure 1. Digital photos of the original coconut shell powder (a) and hydrochars obtained by the normal (b) or the salt-HTC route (c).
Carbon 07 00077 g001
Figure 2. Van Krevelen diagram documenting the loss of oxygen and hydrogen from the biomasses (squares) during HTC with water (open circles) or HTC with salts (full circles) and subsequent steam activation (triangles). The representative areas for biomass, peat, lignite and black coal (anthracite) are collected from literature [32,33,34].
Carbon 07 00077 g002
Figure 3. FTIR spectra of coconut shell powder and hydrochars obtained by HTC and subsequent steam activation.
Carbon 07 00077 g003
Figure 4. Scanning electron micrographs (SEM, upper line) and transmission electron micrographs (TEM, lower line) of the original coconut shell powder (a) and hydrochars obtained by the normal (b,d) or the salt-HTC route (c,e).
Carbon 07 00077 g004
Figure 5. 13C NMR spectra of hydrochars obtained from coconut shells by normal HTC (a) or salt HTC (b) obtained at different times (I) or temperatures (II).
Carbon 07 00077 g005
Figure 6. 13C NMR spectra of cellulose (a) and lignin (b) obtained by normal HTC or salt HTC at 180 °C and 12 h reaction time.
Carbon 07 00077 g006
Figure 7. Specific surface areas (SSA) of hydrochars from different biomasses after normal HTC, salt HTC (both at 180 °C for 12 h) and subsequent steam activation for 1 h at 500 °C.
Carbon 07 00077 g007
Figure 8. Nitrogen sorption isotherms of coconut shell-based hydrochars from normal HTC (Cn-HTC, red), salt HTC (Cn-HTC Zn, green) both at 180 °C for 12 h, and the follow-up products after steam activation at 500 °C for 1 h (Cn-Act500C, blue and Cn-Act500C Zn, orange).
Carbon 07 00077 g008
Figure 9. (a) Adsorption capacity at equilibrium (qe) of dyes onto different hydrochars (HTC at 180 °C for 12 h) and chars resulting from subsequent steam activation. (b) Hydrochars from coconut shell powder obtained under different treatments are compared.
Carbon 07 00077 g009
Figure 10. Pseudo-first-order kinetic plot resulting from the effect of contact time on the adsorption of MB onto a coconut shell based hydrochar from salt-HTC at 220 °C.
Carbon 07 00077 g010
Figure 11. Equilibrium study on the adsorption of MB onto a hydrochar (a) and the resulting Langmuir equilibrium isotherm (b), Freundlich isotherm (c), and Temkin isotherm (d).
Carbon 07 00077 g011
Table 1. Elemental compositions of the raw materials, their hydrochars and activated carbons produced from dried dandelion (Dd), sawdust (Sd) and coconut shell powder (Cn). For all masses, errors up to 0.5 wt.% must be expected.
SubstrateSampleC [wt.%]N [wt.%]O [wt.%]H [wt.%]Ash [wt.%]
DandelionDd (raw material)37.52.1644.35.510.76
Dd-HTC49.72.332.76.09.3
Dd-HTC Zn52.01.429.14.113.6
Dd-Act500C49.81.919.80.528.0
Dd-Act500C Zn53.61.617.41.525.9
SawdustSd (raw material)46.30.646.96.10.0
Sd-HTC50.00.443.85.90.0
Sd-HTC Zn60.30.435.63.70.0
Sd-Act500C66.11.830.40.90.9
Sd-Act500C Zn73.00.622.01.72.8
CoconutCn (raw material)49.10.144.76.20.4
Cn-HTC59.50.135.05.40.1
Cn-HTC Zn66.20.129.64.00.1
Cn-Act650C86.90.211.81.20.00
Cn-Act650C Zn82.90.112.81.13.1
Cn-Act500C77.20.220.91.70.0
Cn-Act500C Zn77.00.118.82.02.2
Cn-Act350C69.20.327.43.10.0
Cn-Act350C Zn69.20.126.13.01.7
Cn-Act200C59.30.235.35.20.0
Cn-Act200C Zn65.10.831.13.20.5
Cn-Act30min76.80.221.41.60.0
Cn-Act30min Zn75.30.020.81.91.9
Cn-Act10min74.40.323.12.30.0
Cn-Act10min Zn75.90.119.82.22.1
Table 2. Parameters of the different isotherm models for the adsorption of MB onto a hydrochar.
ModelParameterValue
Langmuirqm [mg∙g−1]277.01
KL [L∙mg−1]2.6159
R20.9682
FreundlichKF [(mg∙g−1) (L∙mg−1)1/n]199.29
1/n0.1140
R20.5436
TemkinAT [L∙g−1]1455.59
B90.5810
R20.5031
Publisher’s Note: MDPI stays neutral with regard to jurisdictional claims in published maps and institutional affiliations.

