
Biomass-Derived Carbons as Versatile Materials for Energy-Related Applications: Capacitive Properties vs. Oxygen Reduction Reaction Catalysis

 , ,
, ,  , , and
Abstract
:1. Introduction
2. Materials and Methods
2.1. Preparation of the ACFs
2.2. Materials Characterization
2.3. Electrode Preparation for Electrochemical Measurements
2.4. Electrochemical Measurements
3. Results
3.1. Physical and Chemical Properties of the Prepared CFs
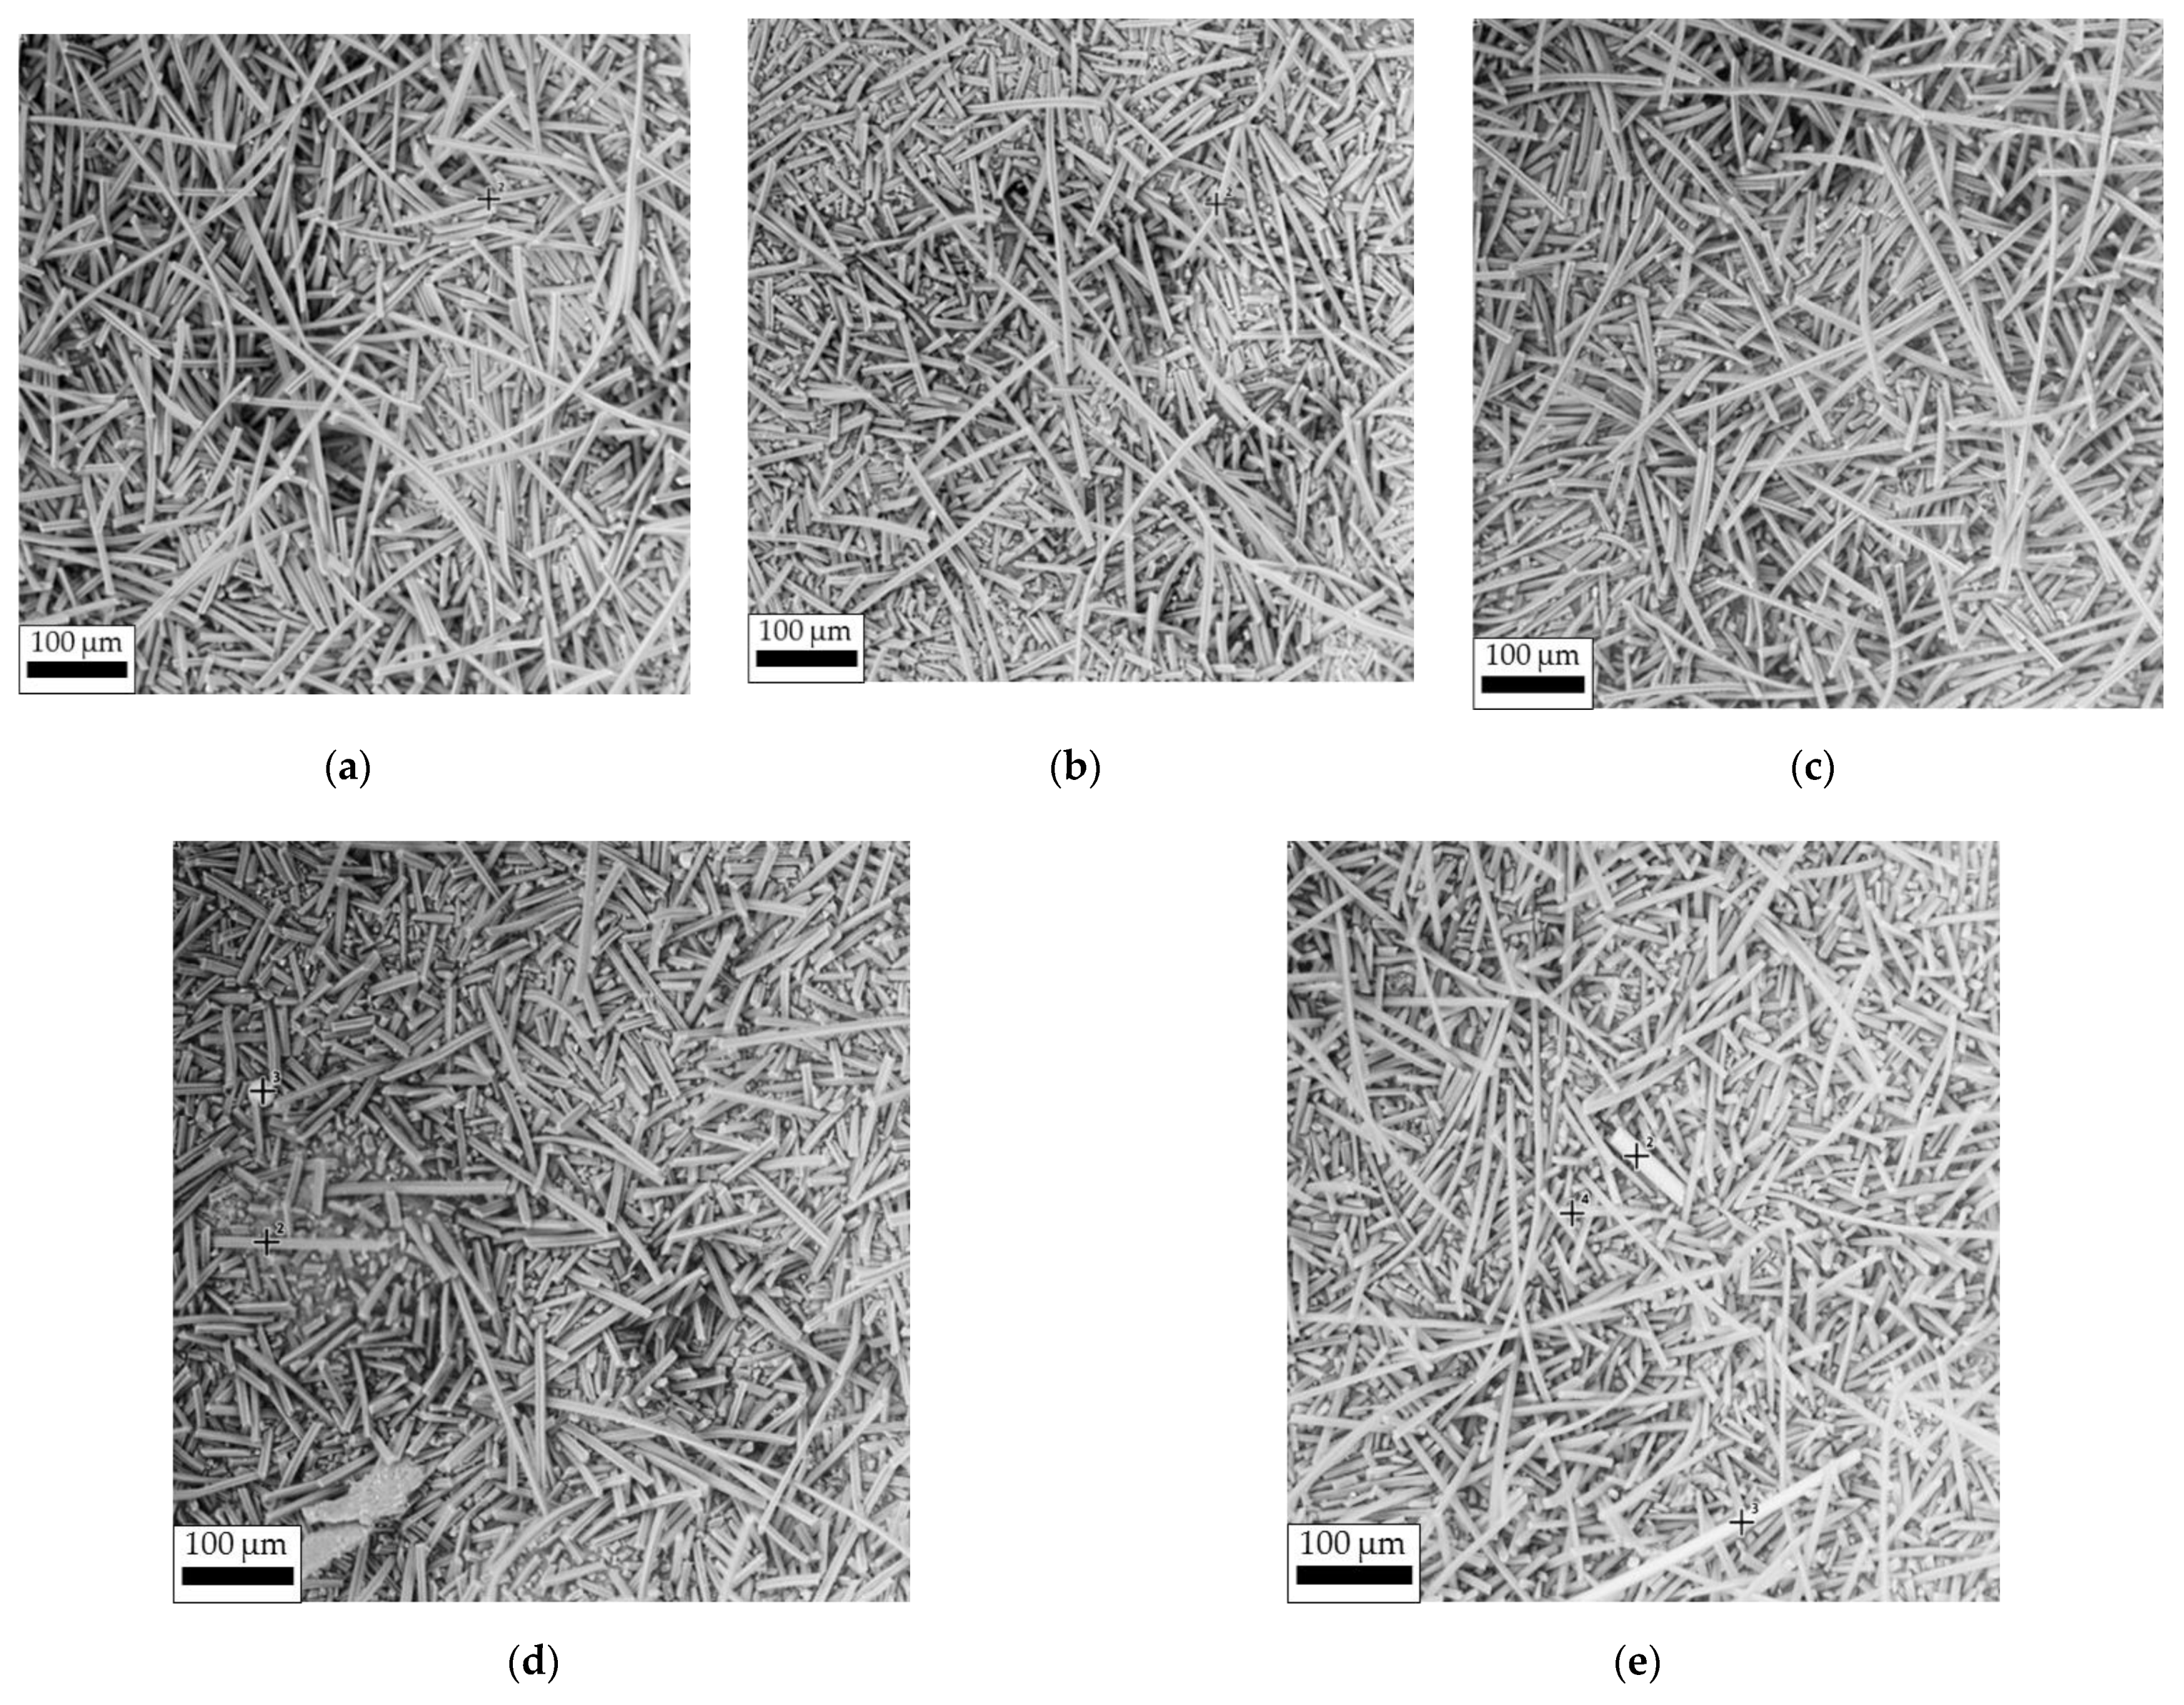
3.1.1. Morphology
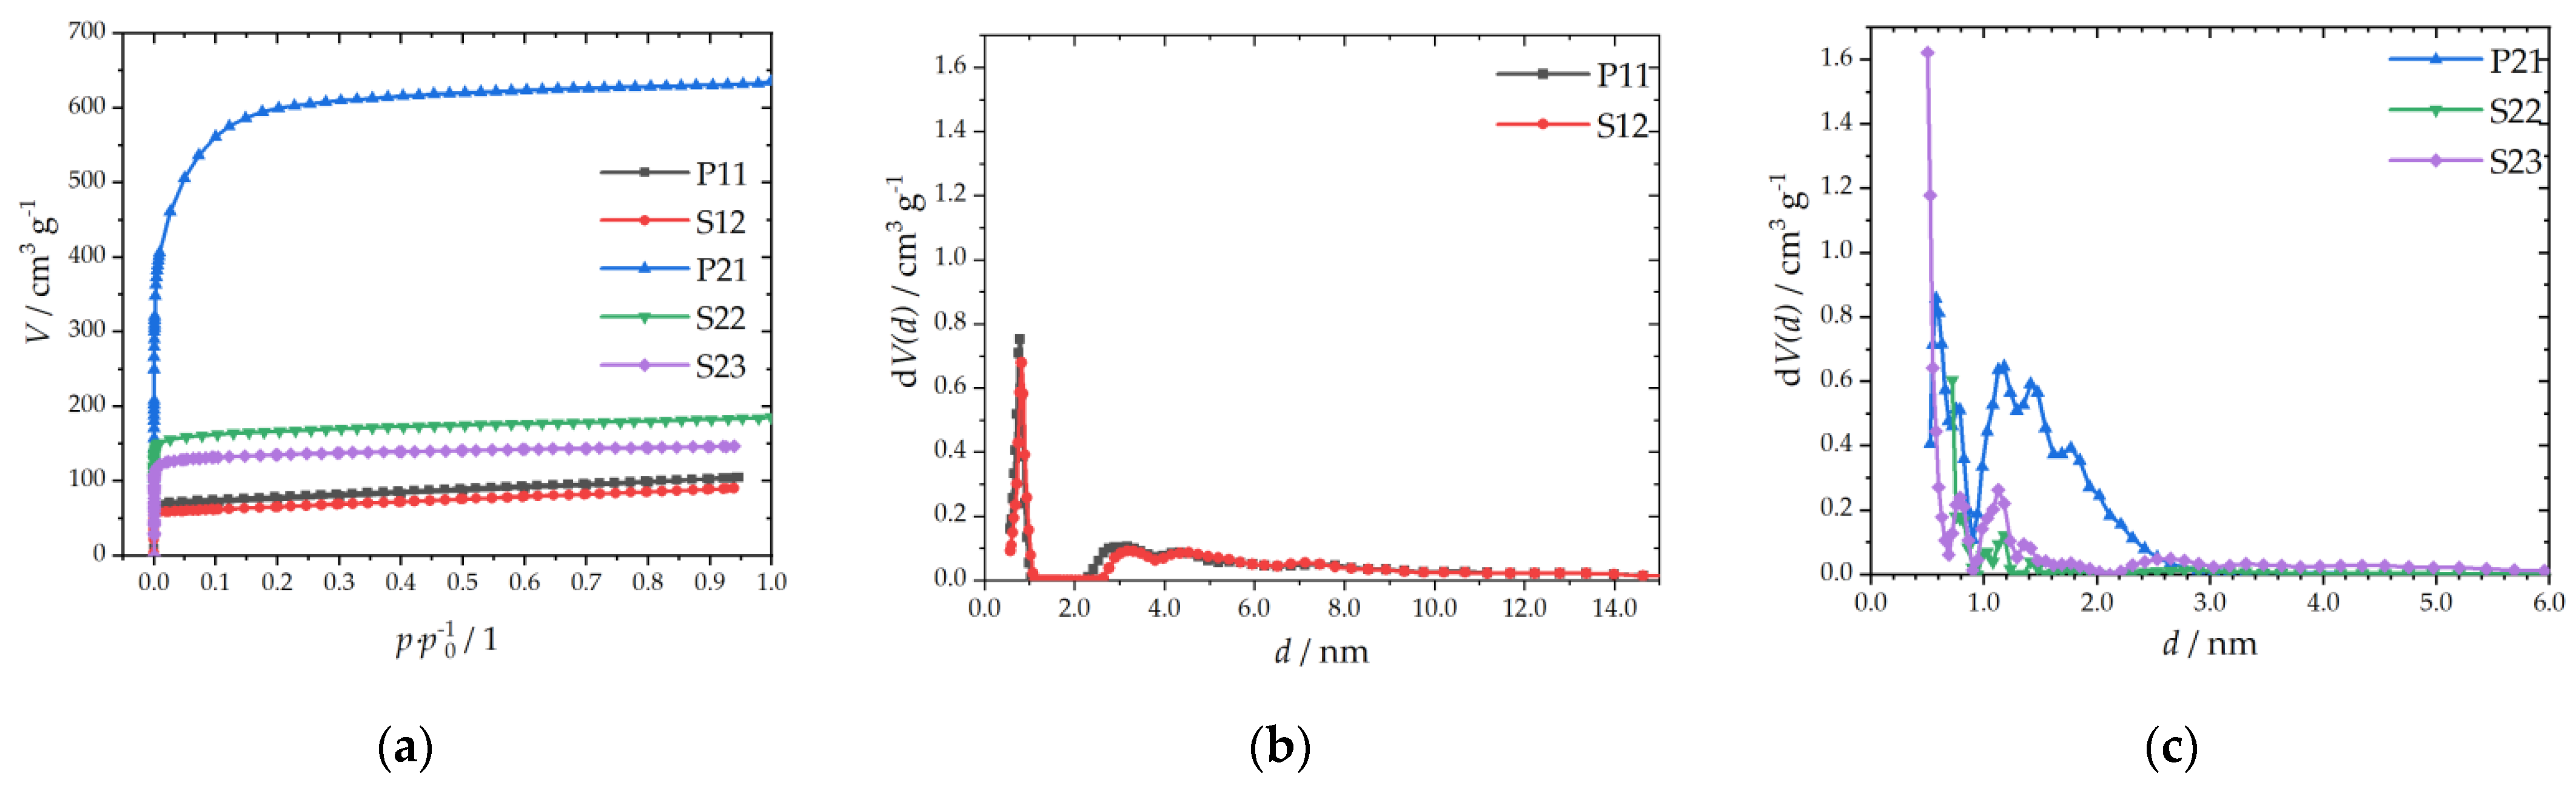
3.1.2. Textural Properties
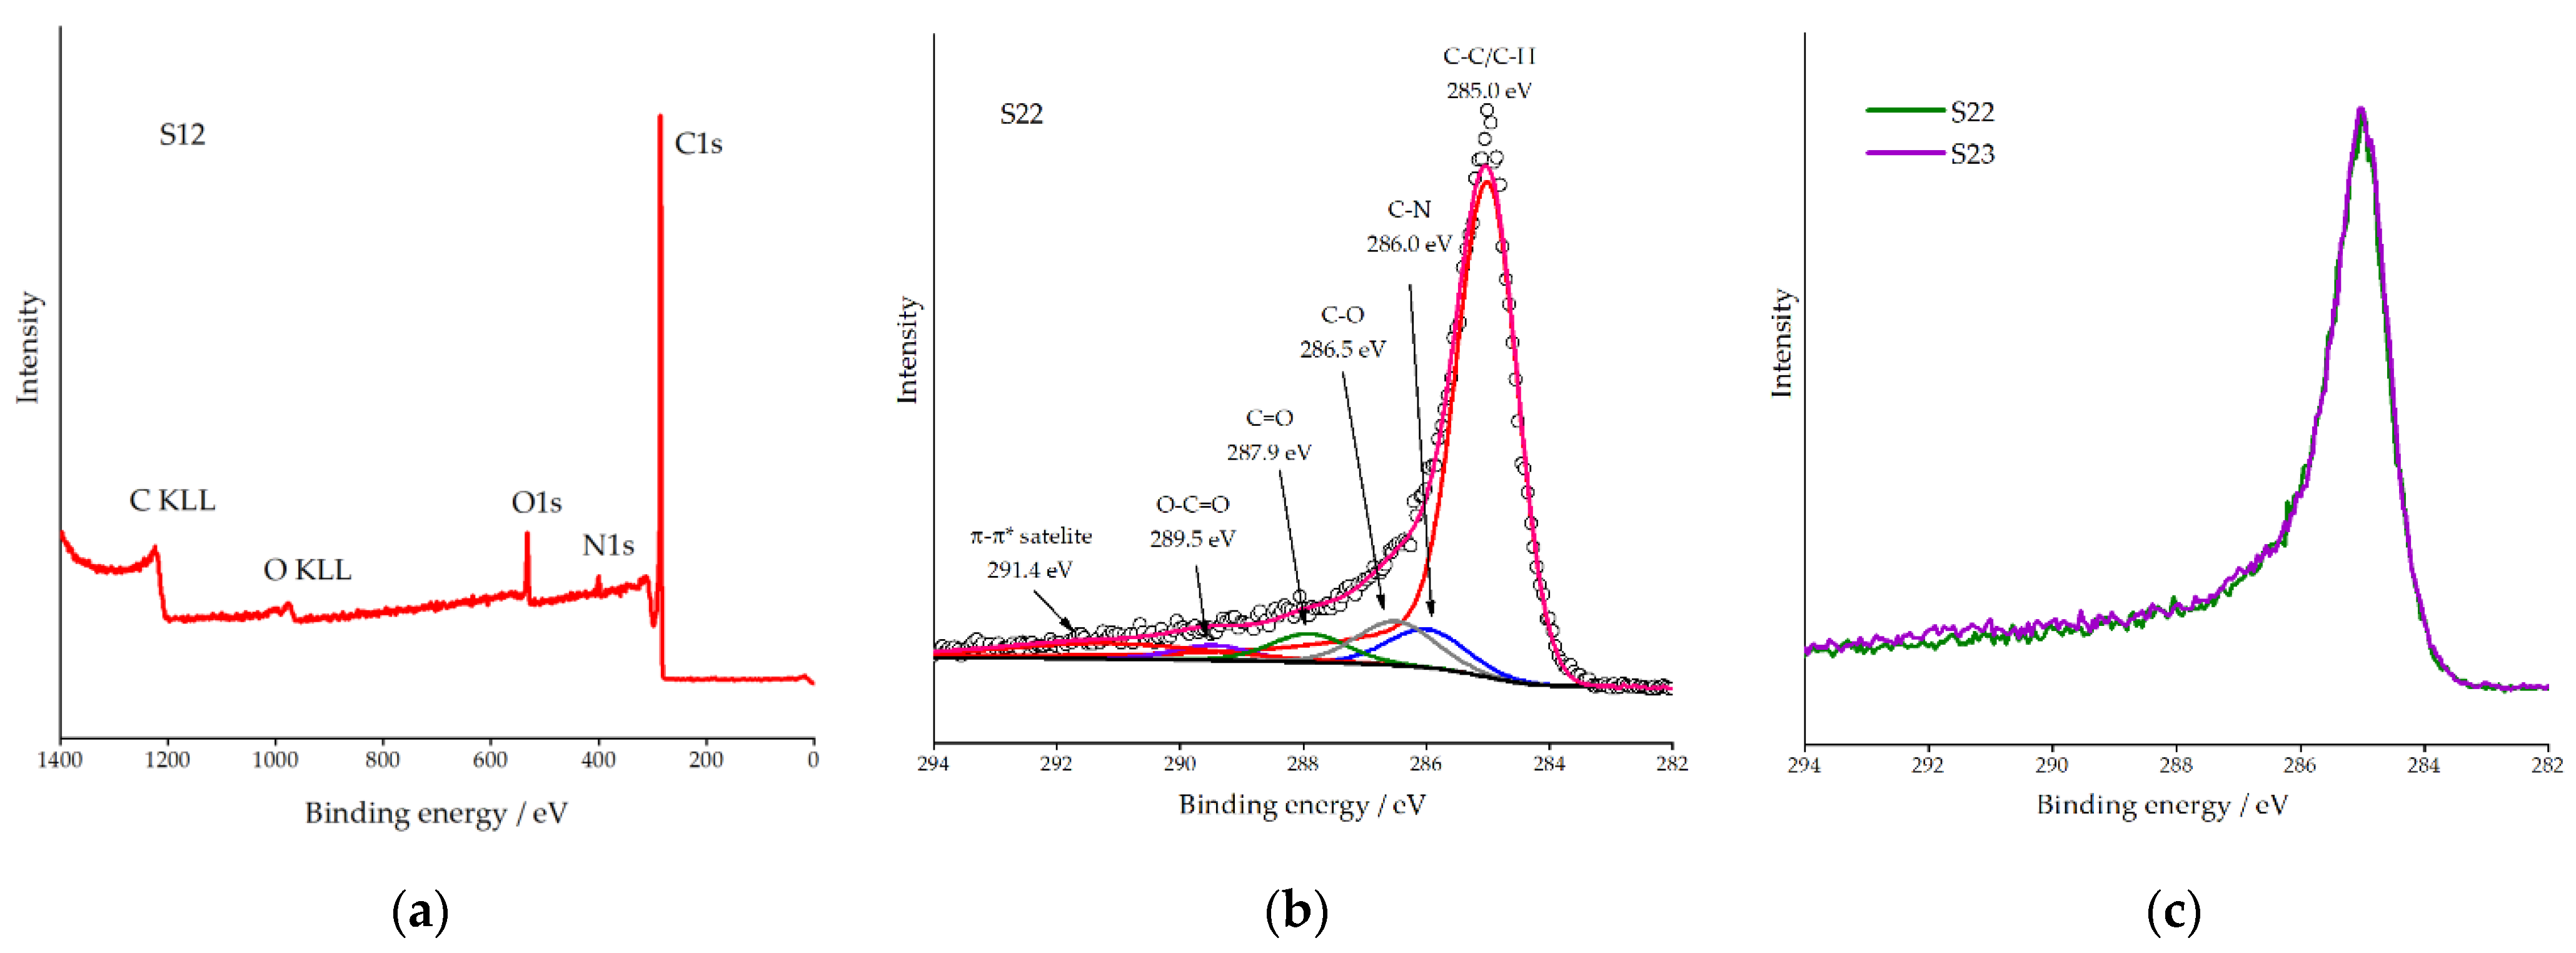
3.1.3. XPS Analysis
3.1.4. Electrical Resistivity
3.2. Electrochemical Measurements
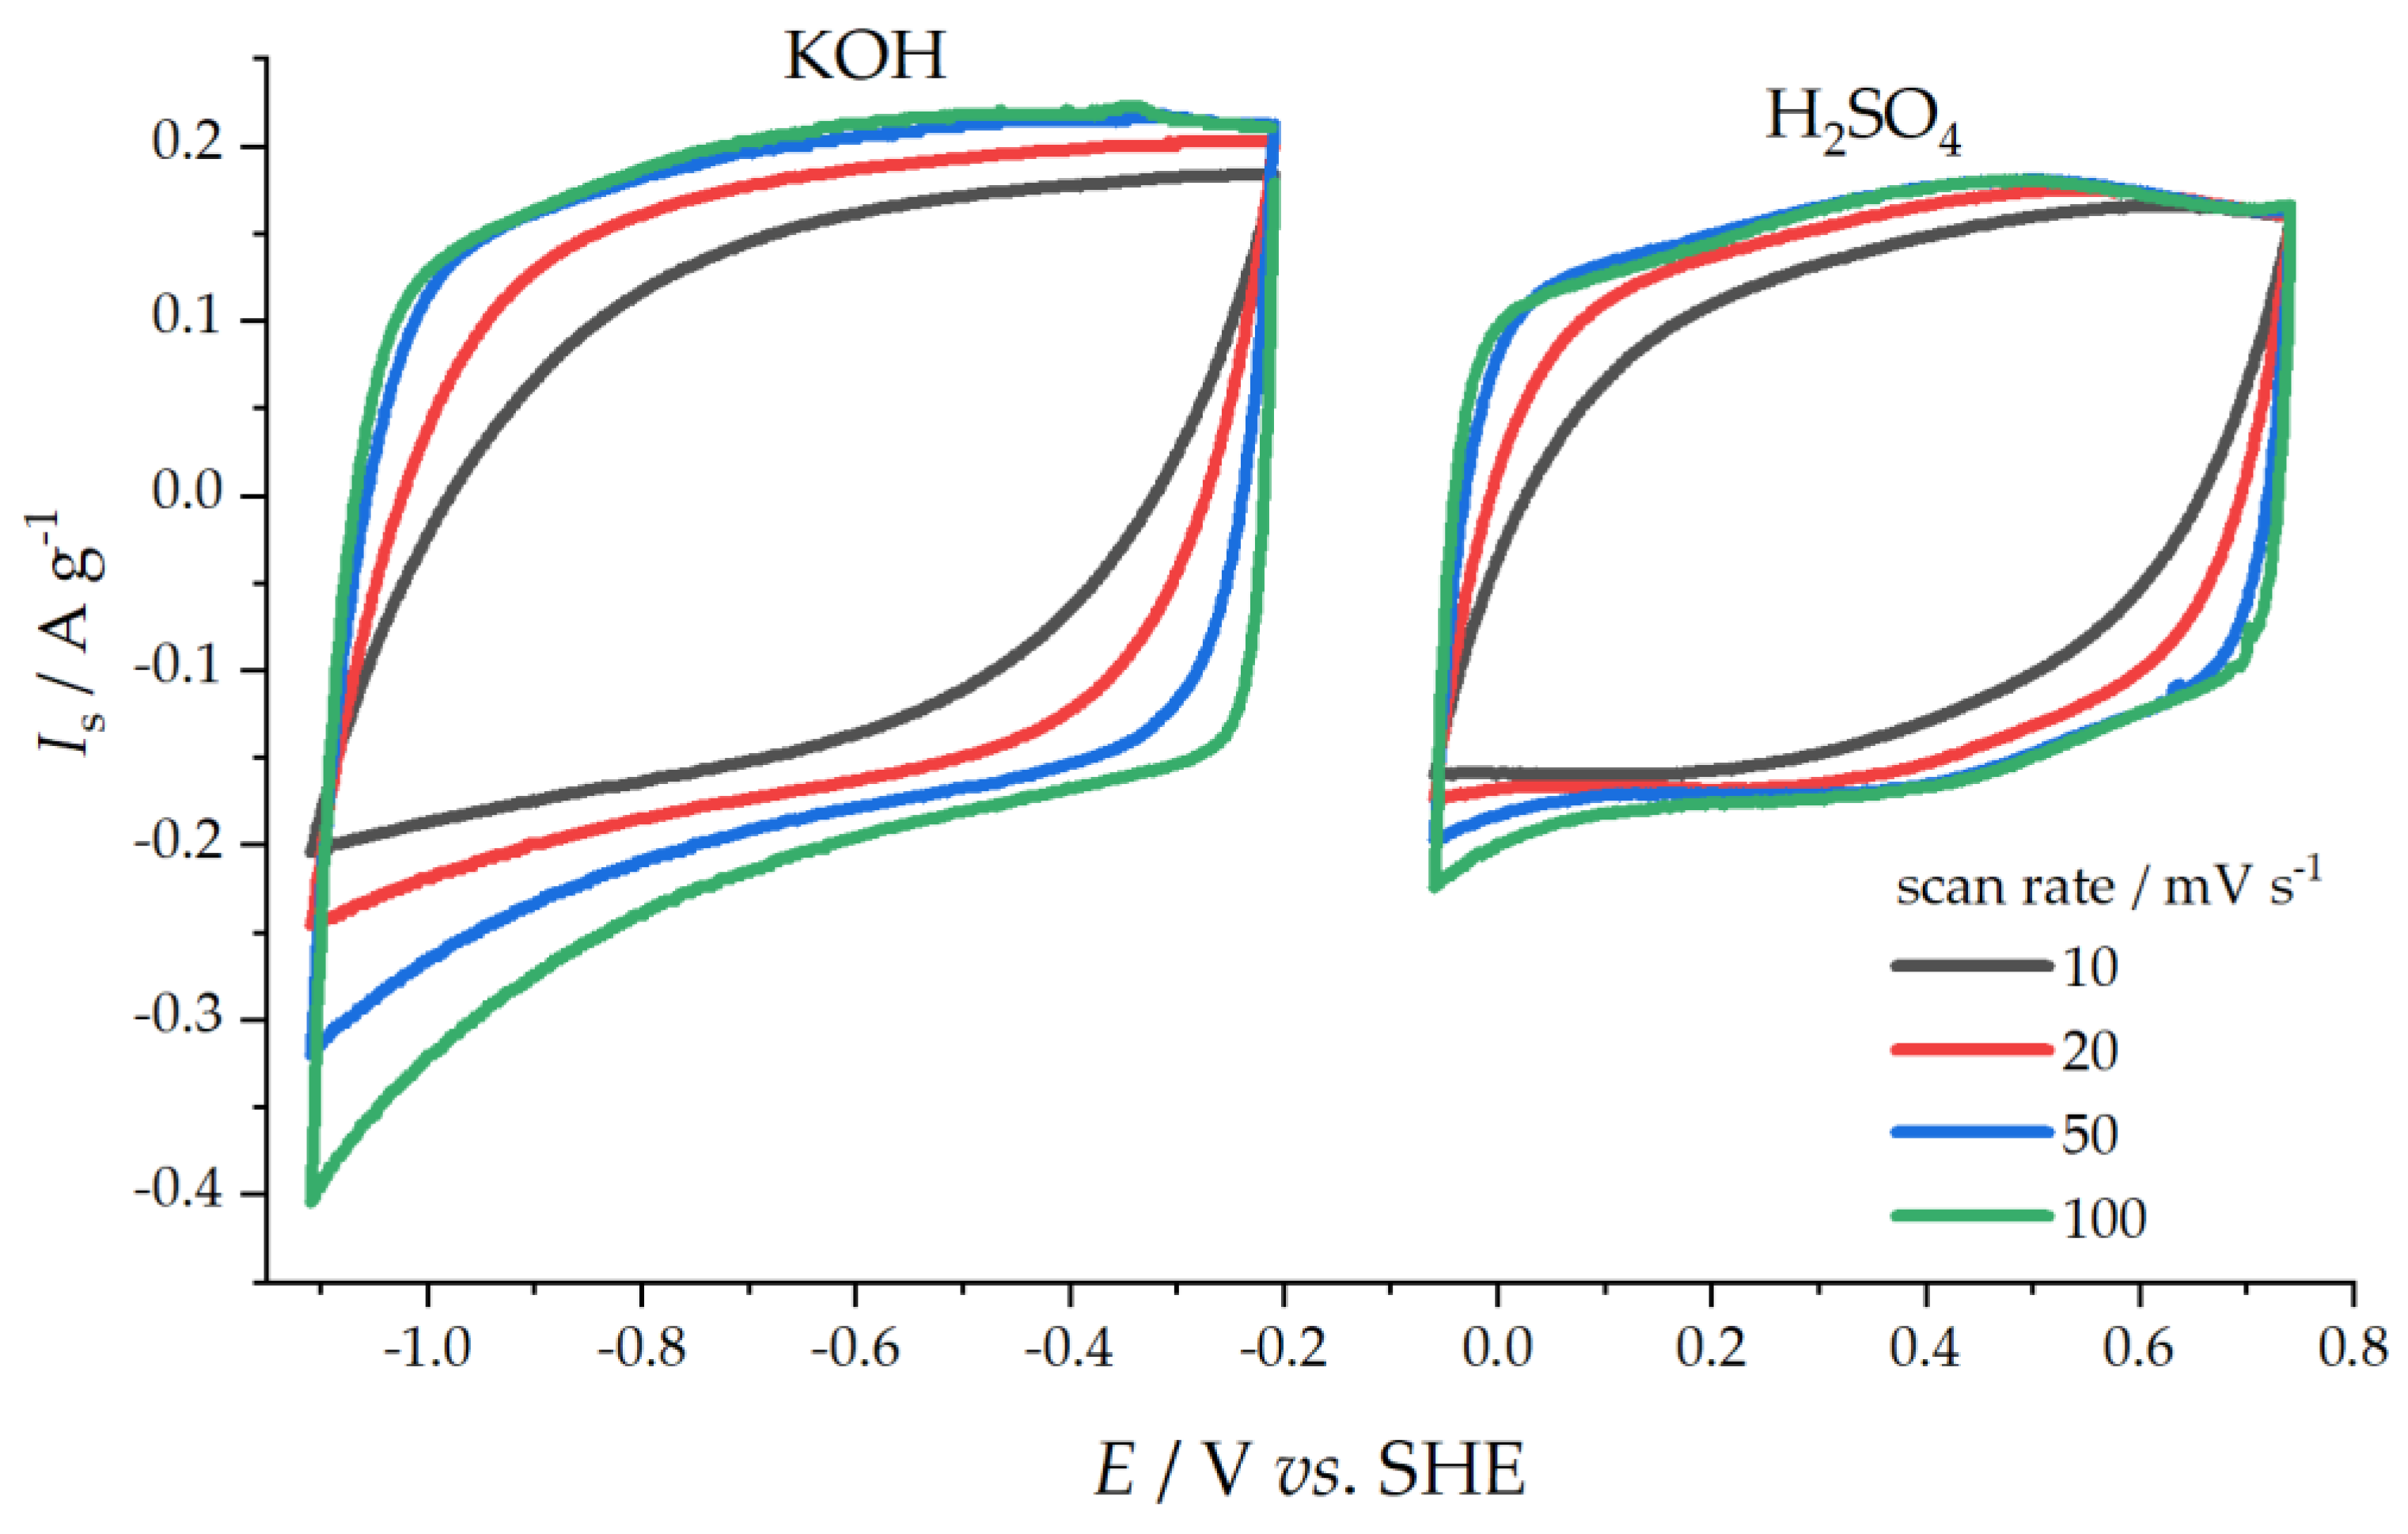
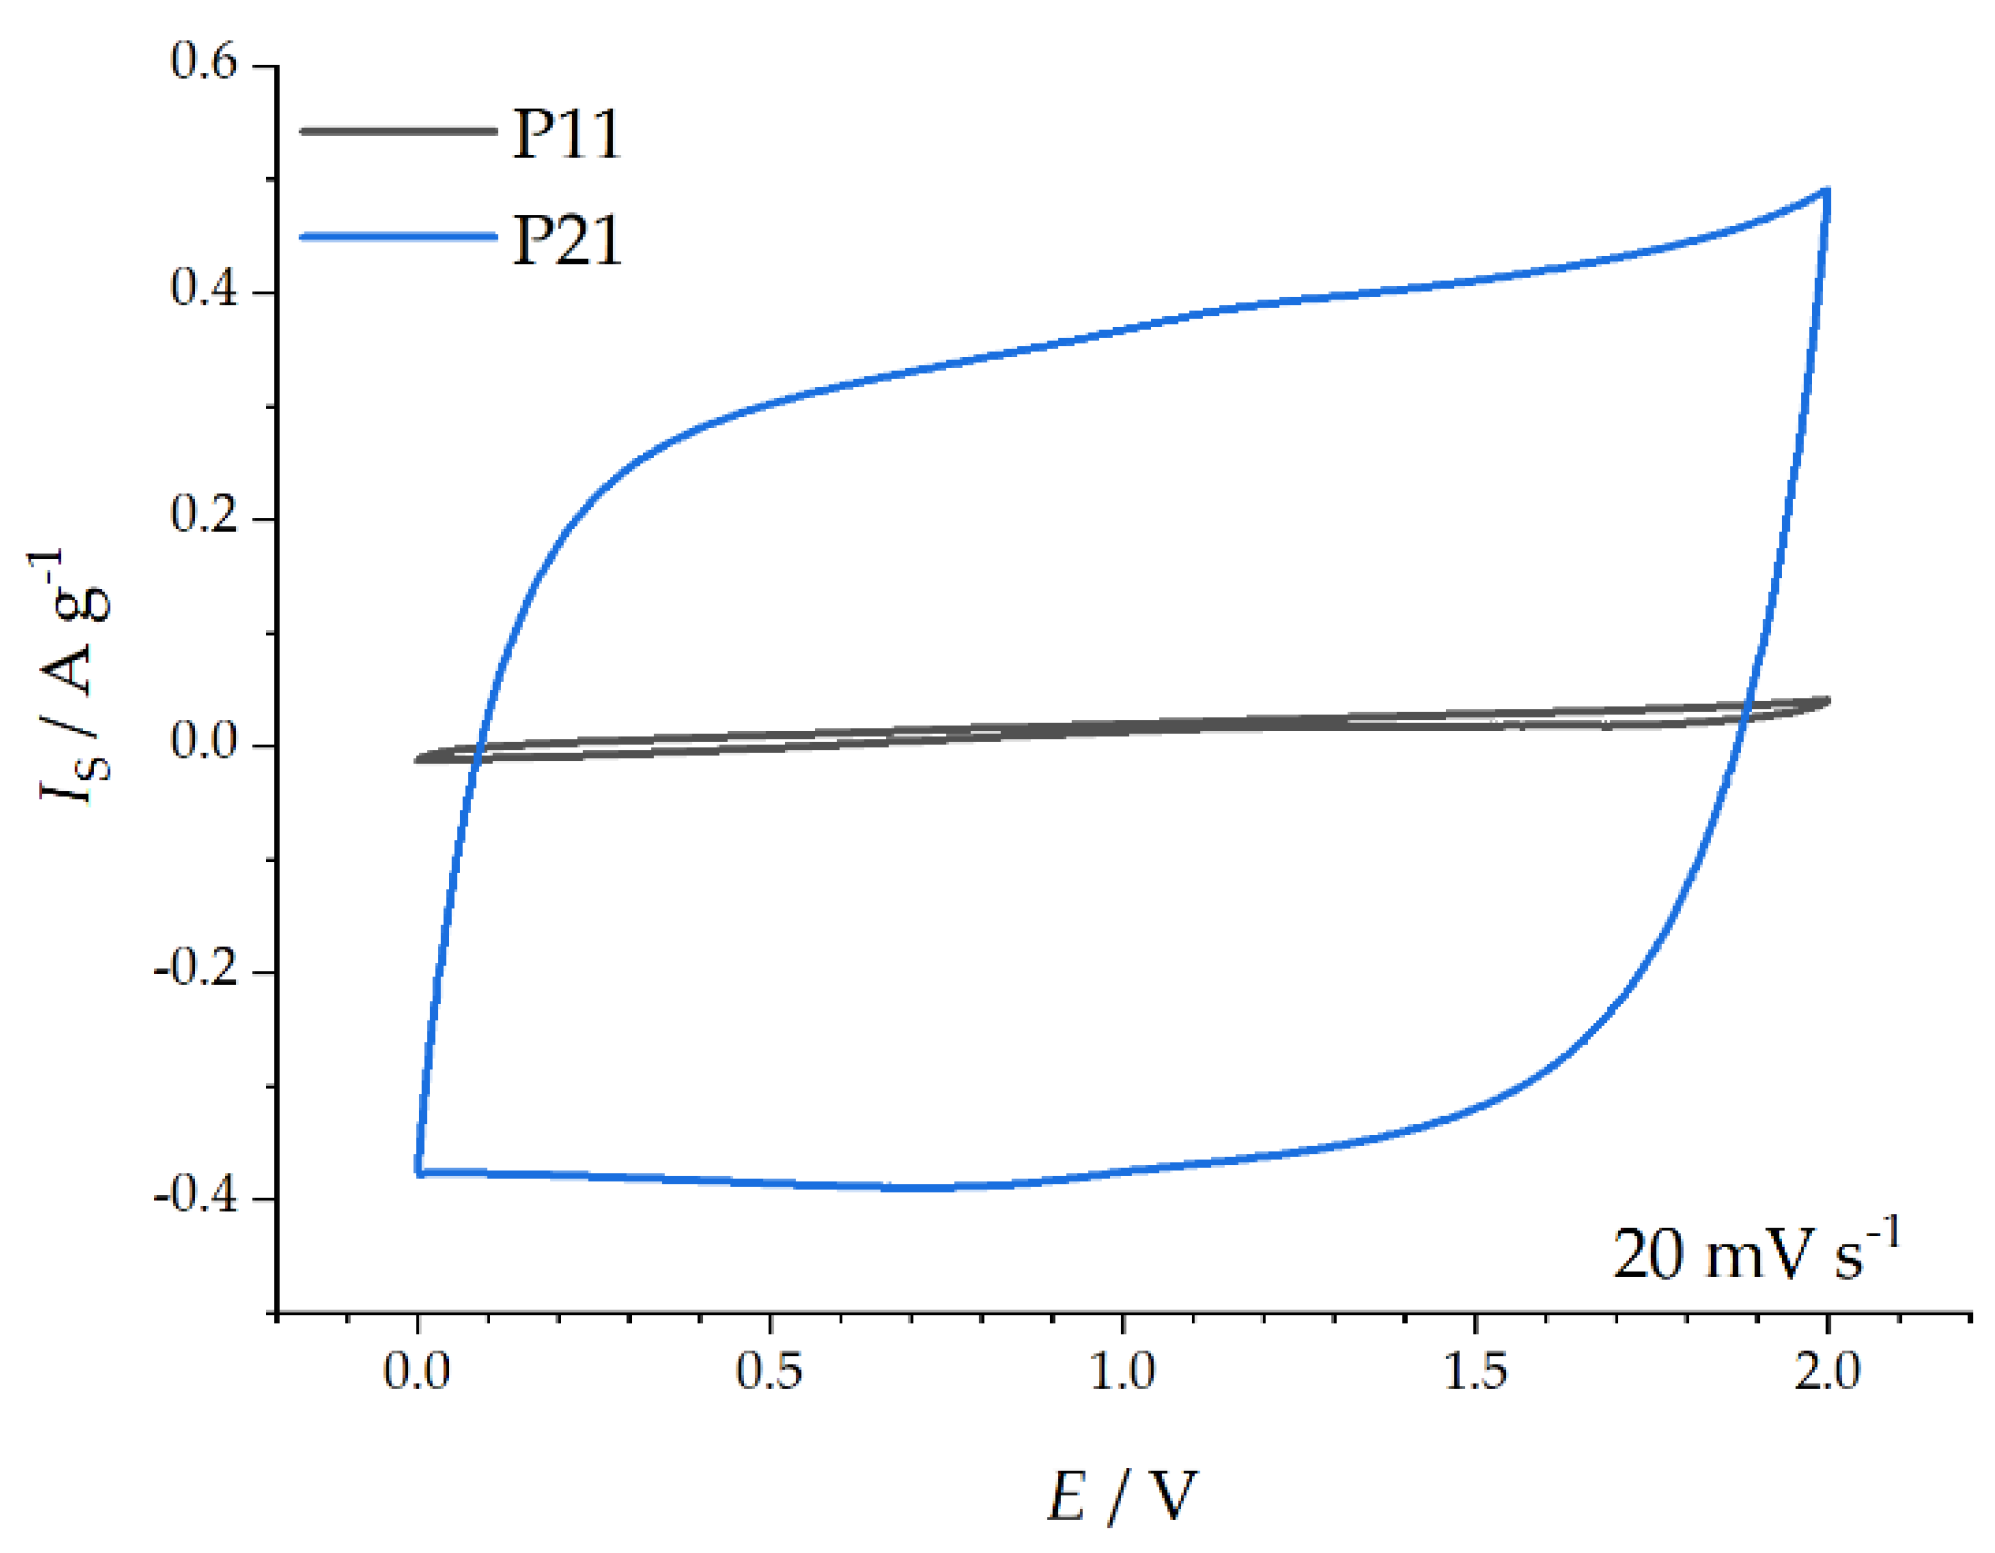
Capacitive Properties
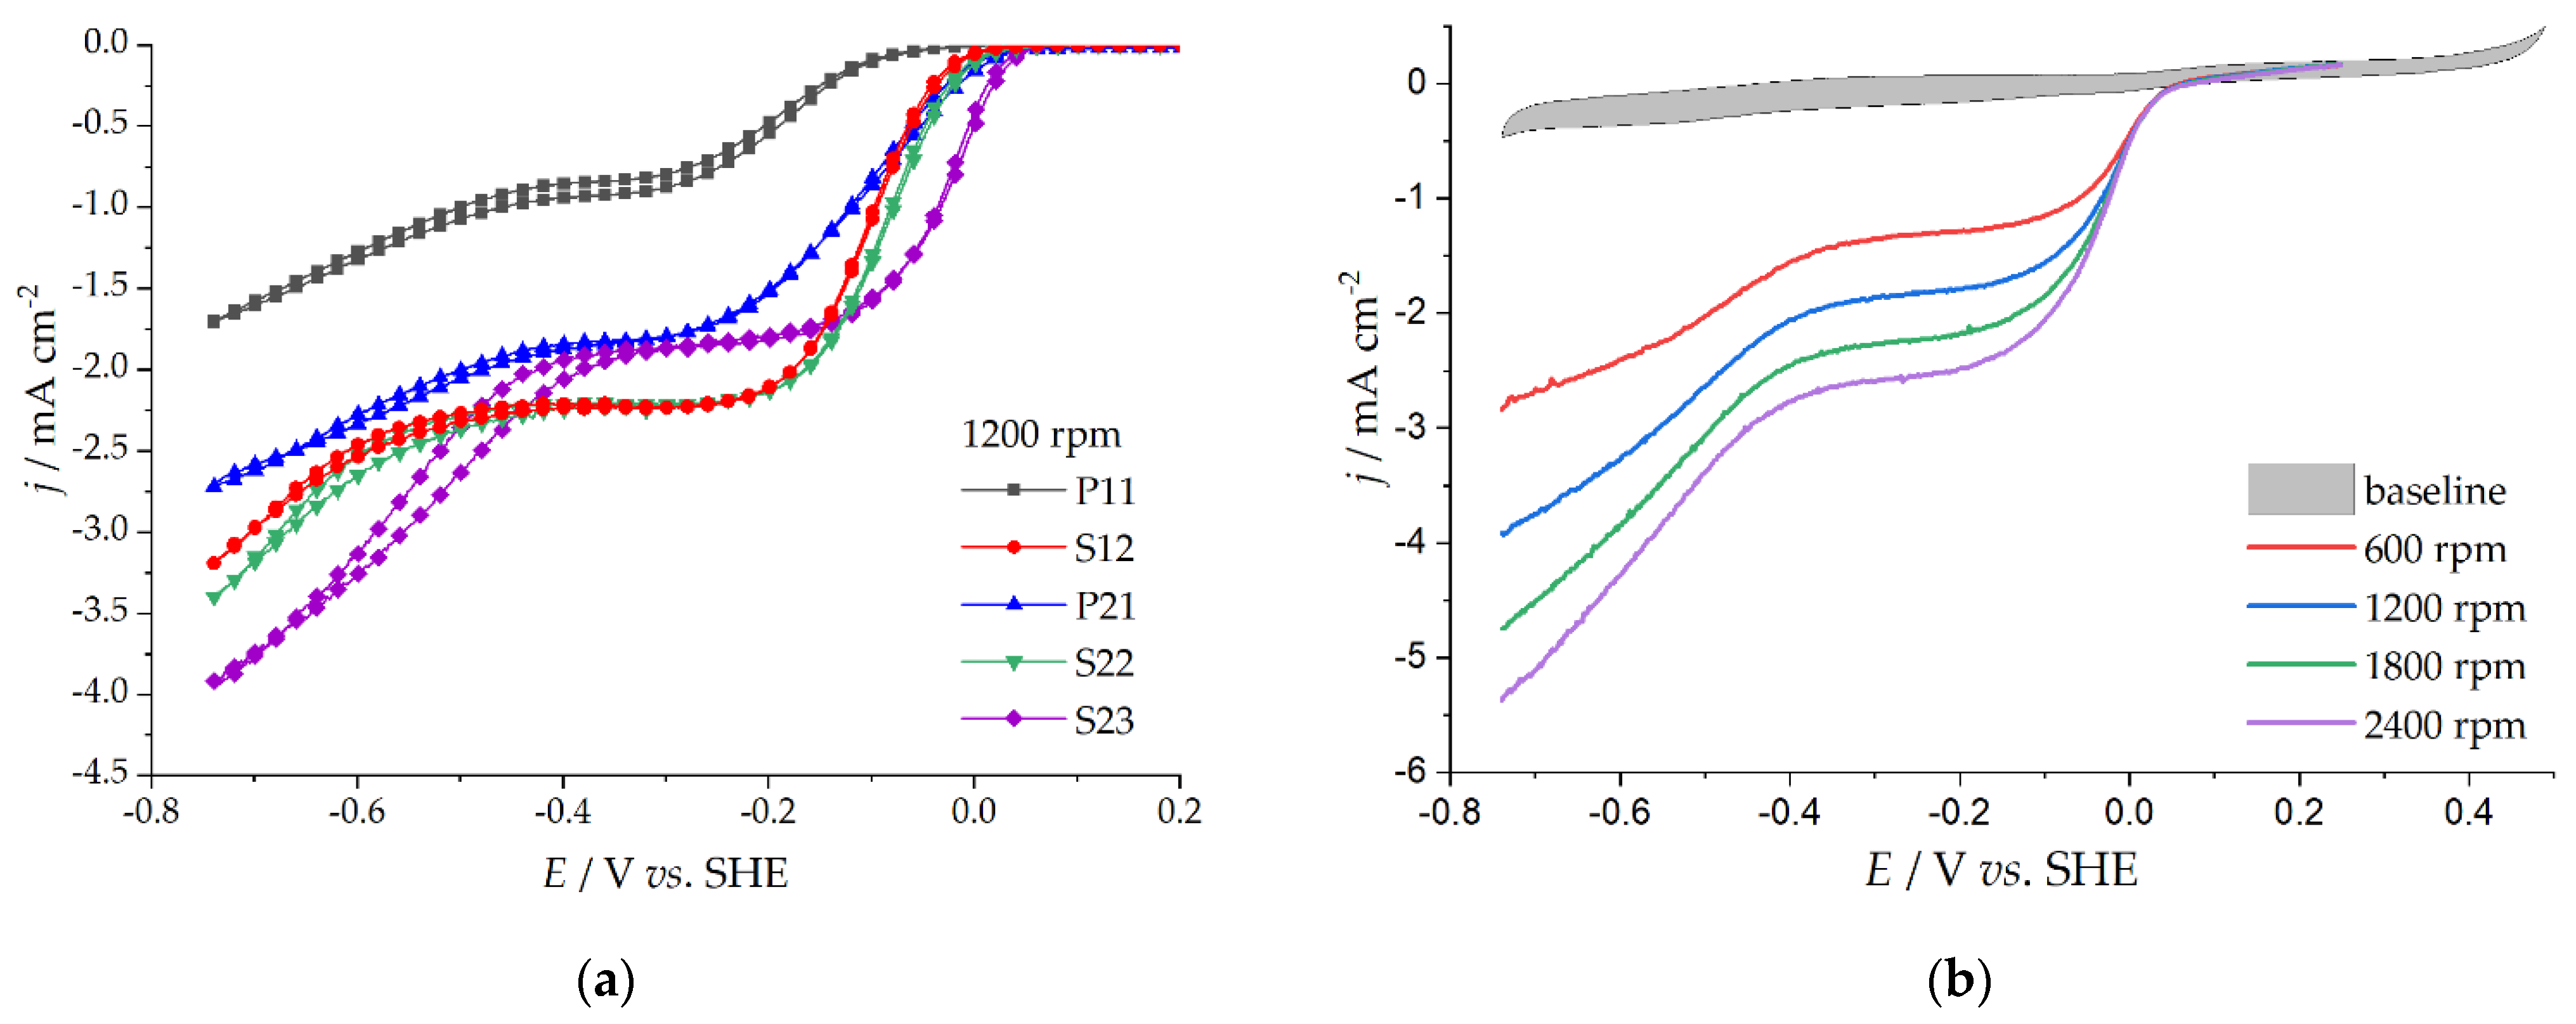
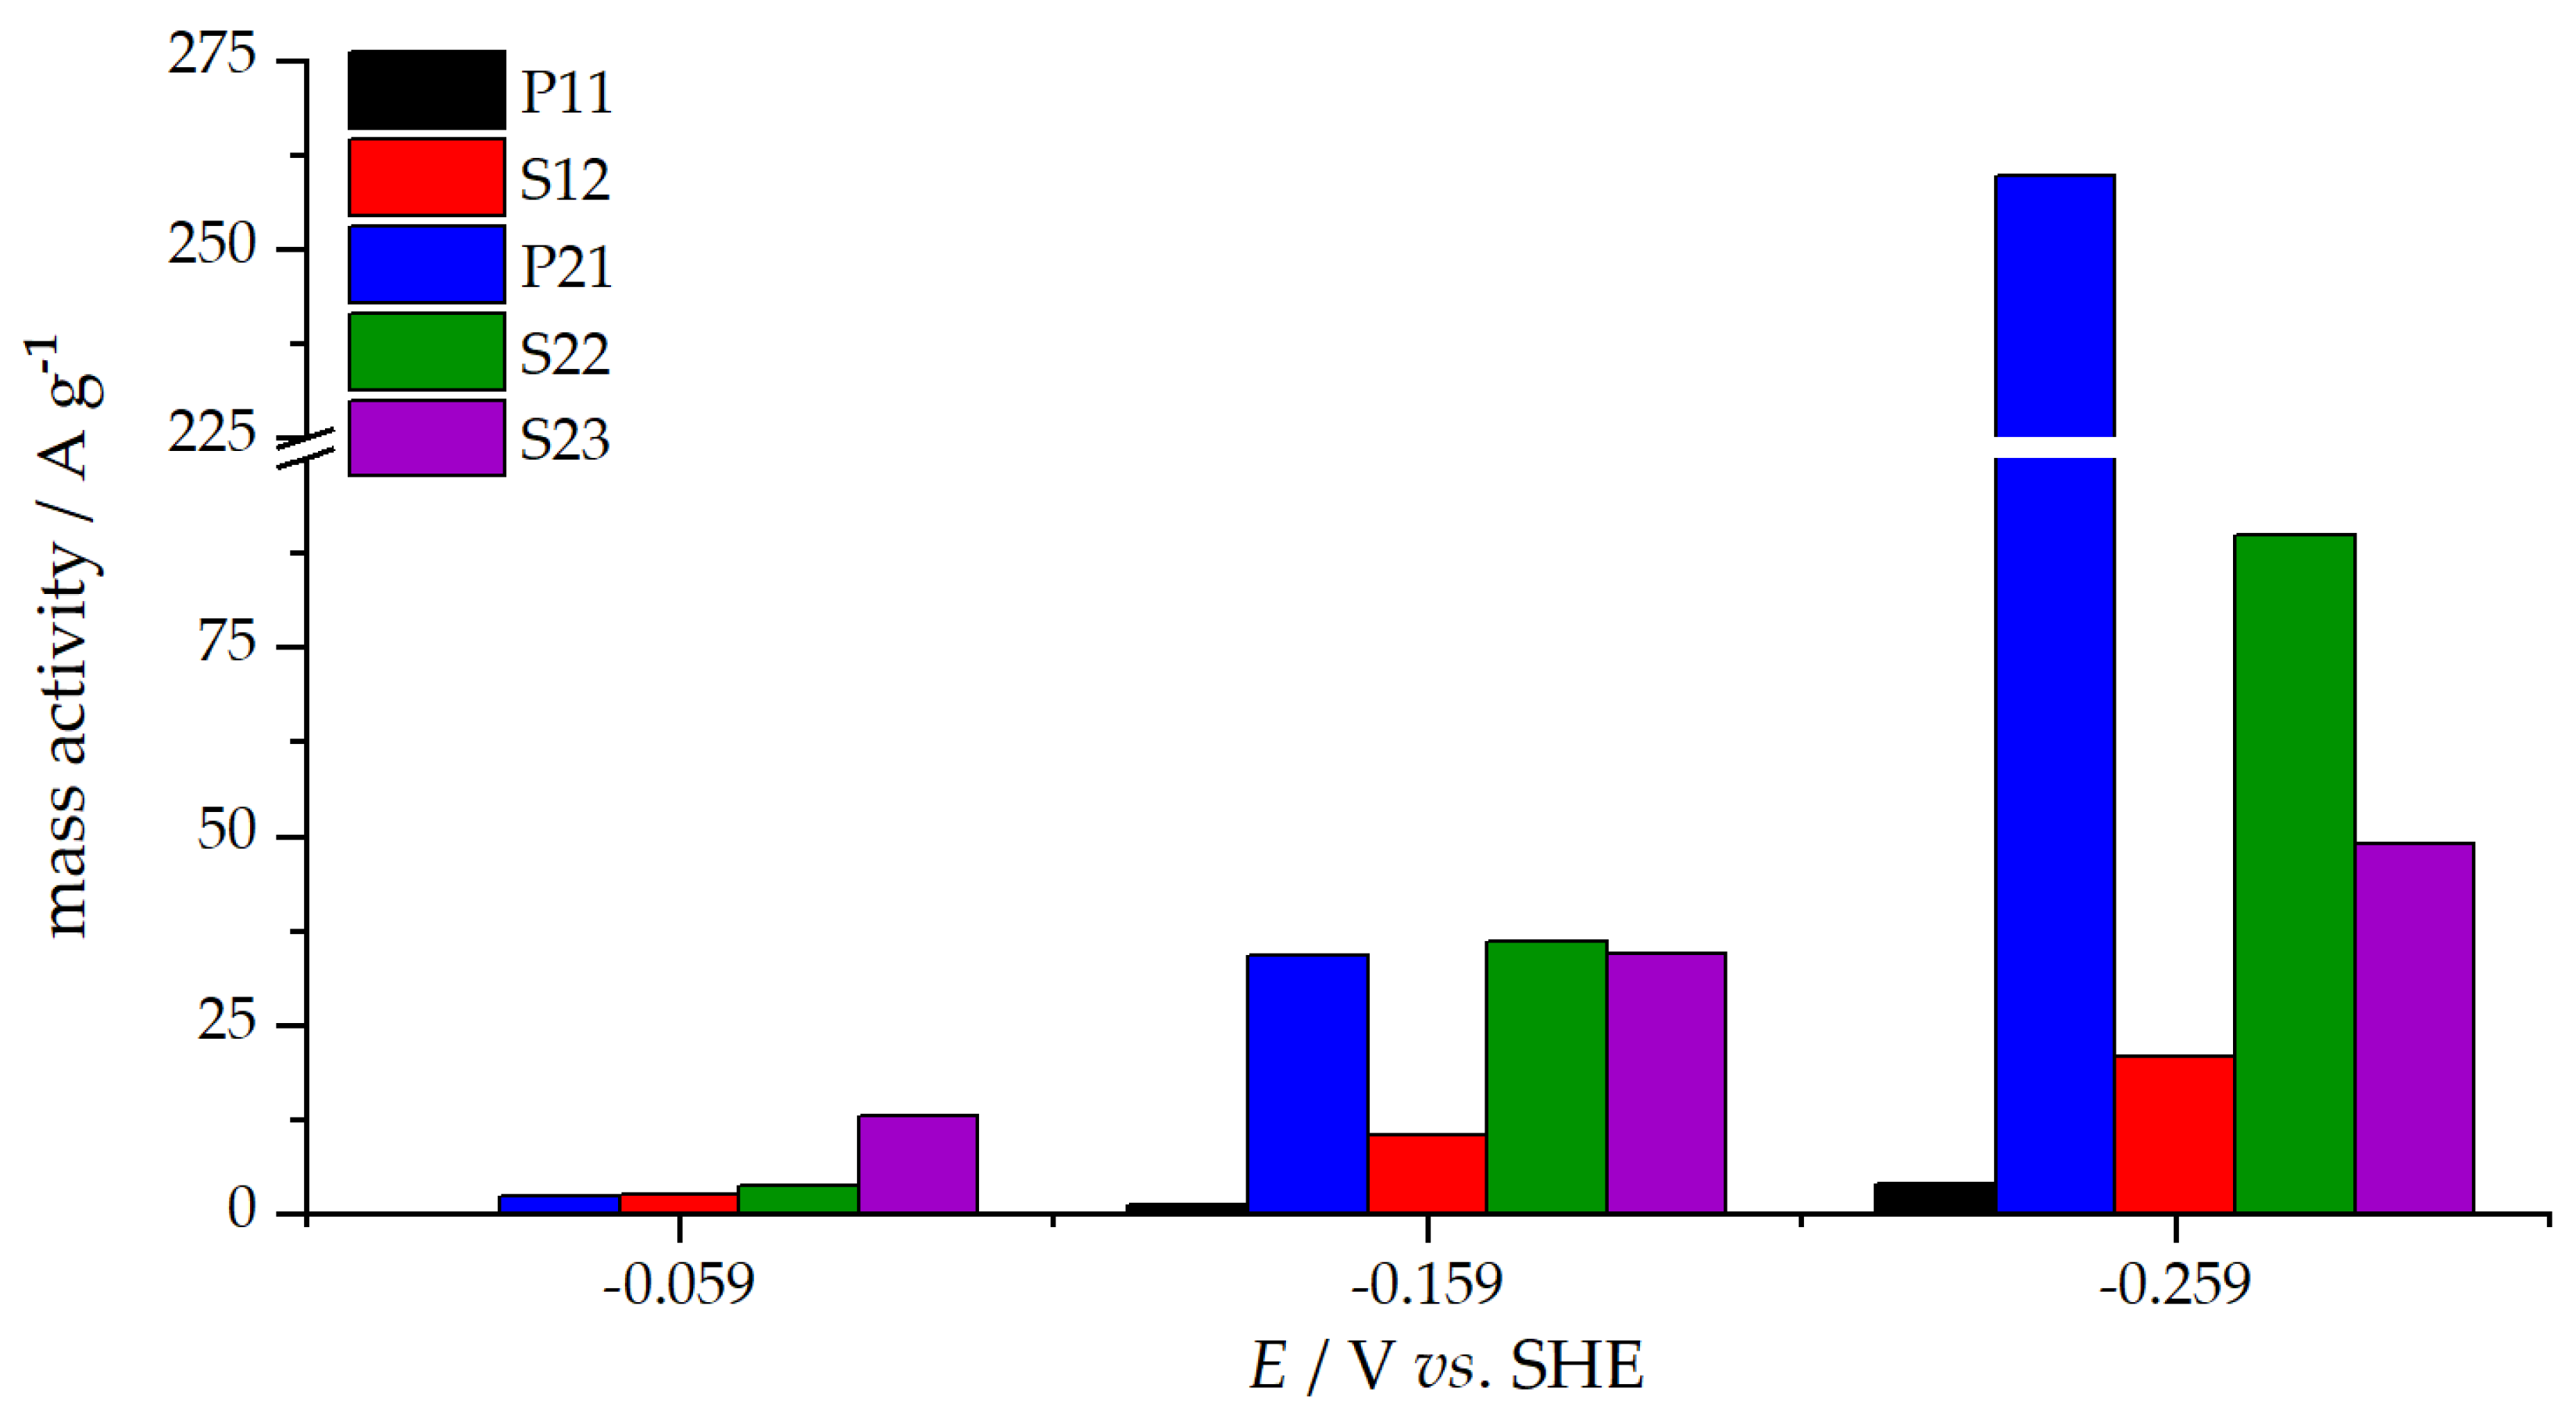
3.3. Oxygen Reduction Reaction Catalysis
4. Discussion
5. Conclusions
Author Contributions
Funding
Institutional Review Board Statement
Data Availability Statement
Conflicts of Interest
References
- Winter, M.; Brodd, R.J. What Are Batteries, Fuel Cells, and Supercapacitors? Chem. Rev. 2004, 104, 4245–4270. [Google Scholar] [CrossRef] [Green Version]
- Bruno, M.M.; Viva, F.A. Direct Alcohol Fuel Cells: Materials, Performance, Durability and Applications; Springer: Dordrecht, The Netherlands, 2014; ISBN 978-94-007-7708-8. [Google Scholar]
- Gaddam, R.R.; Kumar, N.A.; Narayan, R.; Raju, K.V.S.N.; Zhao, X.S. Nanomaterials Synthesis: Design, Fabrication and Applications; Elsevier: Amsterdam, The Netherlands, 2019; ISBN 9780128157510. [Google Scholar]
- He, Y.; Chen, W.; Gao, C.; Zhou, J.Y.; Li, X.; Xie, E. An overview of carbon materials for flexible electrochemical capacitors. Nanoscale 2013, 5, 8799–8820. [Google Scholar] [CrossRef]
- Ćirić-Marjanović, G.; Pasti, I.; Mentus, S. One-dimensional nitrogen-containing carbon nanostructures. Prog. Mater. Sci. 2015, 69, 61–182. [Google Scholar] [CrossRef]
- Kou, L.; Liu, Y.; Zhang, C.; Shao, L.; Tian, Z.; Deng, Z.; Gao, C. A Mini Review on Nanocarbon-Based 1D Macroscopic Fibers: Assembly Strategies and Mechanical Properties. Nano Micro Lett. 2017, 9, 51. [Google Scholar] [CrossRef] [Green Version]
- Dang, Z.-M.; Zheng, M.-S.; Zha, J.-W. 1D/2D Carbon Nanomaterial-Polymer Dielectric Composites with High Permittivity for Power Energy Storage Applications. Small 2016, 12, 1688–1701. [Google Scholar] [CrossRef]
- Pang, J.; Bachmatiuk, A.; Ibrahim, I.; Fu, L.; Placha, D.; Martynková, G.S.; Trzebicka, B.; Gemming, T.; Eckert, J.; Rümmeli, M.H. CVD growth of 1D and 2D sp2 carbon nanomaterials. J. Mater. Sci. 2016, 51, 640–667. [Google Scholar] [CrossRef]
- Fechler, N.; Antonietti, M. Domino games: Controlling structure and patterns of carbon nanomaterials in 2D & 3D. Nano Today 2015, 10, 593–614. [Google Scholar] [CrossRef]
- Ni, J.; Li, Y. Carbon Nanomaterials in Different Dimensions for Electrochemical Energy Storage. Adv. Energy Mater. 2016, 6, 1600278. [Google Scholar] [CrossRef]
- Paul, R.; Du, F.; Dai, L.; Ding, Y.; Wang, Z.L.; Wei, F.; Roy, A. 3D Heteroatom-Doped Carbon Nanomaterials as Multifunctional Metal-Free Catalysts for Integrated Energy Devices. Adv. Mater. 2019, 31, e1805598. [Google Scholar] [CrossRef]
- Ao, W.; Fu, J.; Mao, X.; Kang, Q.; Ran, C.; Liu, Y.; Zhang, H.; Gao, Z.; Li, J.; Liu, G.; et al. Microwave assisted preparation of activated carbon from biomass: A review. Renew. Sustain. Energy Rev. 2018, 92, 958–979. [Google Scholar] [CrossRef]
- Danish, M.; Ahmad, T. A review on utilization of wood biomass as a sustainable precursor for activated carbon production and application. Renew. Sustain. Energy Rev. 2018, 87, 1–21. [Google Scholar] [CrossRef]
- Rafatullah, M.; Ahmad, T.; Ghazali, A.; Sulaiman, O.; Danish, M.; Hashim, R. Oil Palm Biomass as a Precursor of Activated Carbons: A Review. Crit. Rev. Environ. Sci. Technol. 2013, 43, 1117–1161. [Google Scholar] [CrossRef]
- Breitenbach, S.; Lumetzberger, A.; Hobisch, M.A.; Unterweger, C.; Spirk, S.; Stifter, D.; Fürst, C.; Hassel, A.W. Supercapacitor Electrodes from Viscose-Based Activated Carbon Fibers: Significant Yield and Performance Improvement Using Diammonium Hydrogen Phosphate as Impregnating Agent. C 2020, 6, 17. [Google Scholar] [CrossRef] [Green Version]
- Dumanli, A.G.; Windle, A.H. Carbon fibres from cellulosic precursors: A review. J. Mater. Sci. 2012, 47, 4236–4250. [Google Scholar] [CrossRef]
- Zeng, F.; Pan, D.; Pan, N. Choosing the Impregnants by Thermogravimetric Analysis for Preparing Rayon-Based Carbon Fibers. J. Inorg. Organomet. Polym. Mater. 2005, 15, 261–267. [Google Scholar] [CrossRef]
- Li, Y.; Zhang, X.; Yang, R.; Li, G.; Hu, C. The role of H3PO4in the preparation of activated carbon from NaOH-treated rice husk residue. RSC Adv. 2015, 5, 32626–32636. [Google Scholar] [CrossRef]
- Lee, J.-S.; Briggs, M.E.; Hu, C.-C.; Cooper, A.I. Controlling electric double-layer capacitance and pseudocapacitance in heteroatom-doped carbons derived from hypercrosslinked microporous polymers. Nano Energy 2018, 46, 277–289. [Google Scholar] [CrossRef]
- Béguin, F.; Frackowiak, E. Supercapacitors: Materials, Systems, and Applications; Wiley: Weinheim, DE, Germany, 2013. [Google Scholar]
- Luo, X.; Chen, S.; Hu, T.; Chen, Y.; Li, F. Renewable biomass-derived carbons for electrochemical capacitor applications. SusMat 2021, 1, 211–240. [Google Scholar] [CrossRef]
- Guo, D.; Shibuya, R.; Akiba, C.; Saji, S.; Kondo, T.; Nakamura, J. Active sites of nitrogen-doped carbon materials for oxygen reduction reaction clarified using model catalysts. Science 2016, 351, 361–365. [Google Scholar] [CrossRef]
- Pašti, I.A.; Ležaić, A.J.; Gavrilov, N.; Ćirić-Marjanović, G.; Mentus, S.V. Nanocarbons derived from polymers for electrochemical energy conversion and storage—A review. Synth. Met. 2018, 246, 267–281. [Google Scholar] [CrossRef]
- Muñoz, E.; Dalton, A.; Collins, S.; Kozlov, M.; Razal, J.; Coleman, J.; Kim, B.; Ebron, V.; Selvidge, M.; Ferraris, J.; et al. Multifunctional Carbon Nanotube Composite Fibers. Adv. Eng. Mater. 2004, 6, 801–804. [Google Scholar] [CrossRef]
- Wang, Y.; Wei, H.; Lu, Y.; Wei, S.; Wujcik, E.K.; Guo, Z. Multifunctional Carbon Nanostructures for Advanced Energy Storage Applications. Nanomaterials 2015, 5, 755–777. [Google Scholar] [CrossRef]
- Deng, J.; Li, M.; Wang, Y. Biomass-derived carbon: Synthesis and applications in energy storage and conversion. Green Chem. 2016, 18, 4824–4854. [Google Scholar] [CrossRef]
- Taylor, W.H. Formol titration: An evaluation of its various modifications. Analyst 1957, 82, 488–498. [Google Scholar] [CrossRef]
- Scofield, J. Hartree-Slater subshell photoionization cross-sections at 1254 and 1487 eV. J. Electron. Spectrosc. Relat. Phenom. 1976, 8, 129–137. [Google Scholar] [CrossRef]
- Chen, J.G.; Jones, C.W.; Linic, S.; Stamenkovic, V.R. Best Practices in Pursuit of Topics in Heterogeneous Electrocatalysis. ACS Catal. 2017, 7, 6392–6393. [Google Scholar] [CrossRef] [Green Version]
- Levich, V.G. Physicochemical Hydrodynamics; Prentice-Hall: Englewood Cliffs, NJ, USA, 1962. [Google Scholar]
- Koutetskii, Y.; Levich, V.G. The use of a rotating disc electrode for studying kinetic and catalytic processes in electrochemistry. Dokl. Akad. Nauk. SSSR 1957, 117, 441–444. [Google Scholar]
- Sing, K.S.W.; Everett, D.H.; Haul, R.A.W.; Moscou, L.; Pierotti, R.A.; Rouqérol, J.; Siemieniewska, T. Reporting Physisorption Data for Gas/solid Systems with Special Reference to the Determination of Surface area and Porosity. Pure Appl. Chem. 1985, 57, 603–619. [Google Scholar] [CrossRef]
- Hinterreiter, A.; Duchoslav, J.; Kehrer, M.; Truglas, T.; Lumetzberger, A.; Unterweger, C.; Fürst, C.; Stifter, D. Determination of the surface chemistry of ozone-treated carbon fibers by highly consistent evaluation of X-ray photoelectron spectra. Carbon 2019, 146, 97–105. [Google Scholar] [CrossRef]
- Shao, Y.; Zhang, S.; Engelhard, M.; Li, G.; Shao, G.; Wang, Y.; Liu, J.; Aksay, I.A.; Lin, Y. Nitrogen-doped graphene and its electrochemical applications. J. Mater. Chem. 2010, 20, 7491–7496. [Google Scholar] [CrossRef]
- Dobrota, A.; Pašti, I.A.; Mentus, S.V.; Skorodumova, N.V. A DFT study of the interplay between dopants and oxygen functional groups over the graphene basal plane—Implications in energy-related applications. Phys. Chem. Chem. Phys. 2017, 19, 8530–8540. [Google Scholar] [CrossRef] [PubMed]
- Augustyn, V.; Simon, P.; Dunn, B. Pseudocapacitive oxide materials for high-rate electrochemical energy storage. Energy Environ. Sci. 2014, 7, 1597–1614. [Google Scholar] [CrossRef] [Green Version]
- Simon, P.; Gogotsi, Y. Materials for electrochemical capacitors. Nat. Mater. 2008, 7, 845–854. [Google Scholar] [CrossRef] [Green Version]
- Yassine, M.; Fabris, D. Performance of Commercially Available Supercapacitors. Energies 2017, 10, 1340. [Google Scholar] [CrossRef] [Green Version]
- Ma, R.; Lin, G.; Zhou, Y.; Liu, Q.; Zhang, T.; Shan, G.; Yang, M.; Wang, J. A review of oxygen reduction mechanisms for metal-free carbon-based electrocatalysts. Npj Comput. Mater. 2019, 5, 5. [Google Scholar] [CrossRef] [Green Version]
- Pei, Z.; Li, H.; Huang, Y.; Xue, Q.; Zhu, M.; Wang, Z.; Zhi, C. Texturing in situ: N,S-enriched hierarchically porous carbon as a highly active reversible oxygen electrocatalyst. Energy Environ. Sci. 2017, 10, 742–749. [Google Scholar] [CrossRef]
- Vujkovic, M.; Gavrilov, N.; Pasti, I.; Krstic, J.; Travas-Sejdic, J.; Ćirić-Marjanović, G.; Mentus, S. Superior capacitive and electrocatalytic properties of carbonized nanostructured polyaniline upon a low-temperature hydrothermal treatment. Carbon 2013, 64, 472–486. [Google Scholar] [CrossRef]
- Anantharaj, S.; Pitchaimuthu, S.; Noda, S. A review on recent developments in electrochemical hydrogen peroxide synthesis with a critical assessment of perspectives and strategies. Adv. Colloid Interface Sci. 2021, 287, 102331. [Google Scholar] [CrossRef]


| Sample | Impregnation Agent | Loading | Tcarb/°C | νcarb/°C min−1 | Tact/°C | tact/min | QCO2/dm3 h−1 |
|---|---|---|---|---|---|---|---|
| P11 | 4% DAHP | 0.61% P | 850 | 10.0 | - | - | - |
| S12 | 12% AS | 2.33% S | 850 | 10.0 | - | - | - |
| P21 | 4% DAHP | 0.61% P | 850 | 10.0 | 850 | 150 | 22.5 |
| S22 | 12% AS | 2.33% S | 850 | 10.0 | 850 | 150 | 22.5 |
| S23 | 12% AS | 2.33% S | 850 | 10.0 | 850 | 300 | 22.5 |
| Sample | SBET a/m2 g−1 | Vtotal b/cm3 g−1 | Dp c/nm |
|---|---|---|---|
| P11 | 292 | 0.15 | 0.79 |
| S12 | 252 | 0.13 | 0.82 |
| P21 | 2245 | 0.88 | 1.41 |
| S22 | 667 | 0.26 | 0.75 |
| S23 | 535 | 0.22 | 0.50 |
| Sample | Elemental Concentration/at. % Survey (Total)/HR | |||||||||||
|---|---|---|---|---|---|---|---|---|---|---|---|---|
| C | O | N | P | F | Na | |||||||
| C-C C-H | C-N | C-O | C=O | O-C=O | O-C O-P | O=C O=P | NC2 | NC3 | ||||
| P11 | 86.6 | 9.8 | - | 1.9 | 0.8 | 0.9 | ||||||
| 77.1 | - | 6.1 | 1.9 | 1.5 | 5.2 | 4.6 | - | - | ||||
| S12 | 91.1 | 5.8 | 3.1 | - | - | - | ||||||
| 74.4 | 7.4 | 5.3 | 1.9 | 2.1 | 3.0 | 2.8 | 1.3 | 1.8 | ||||
| P21 | 88.9 | 8.6 | 1.5 | 1.0 | - | - | ||||||
| 73.3 | 3.3 | 6.9 | 3.4 | 2.0 | 5.3 | 3.3 | 0.6 | 0.9 | ||||
| S22 | 87.5 | 9 | 3.5 | - | - | - | ||||||
| 68.0 | 6.0 | 6.8 | 4.4 | 2.3 | 5.2 | 3.8 | 1.3 | 2.2 | ||||
| S23 | 88.3 | 7.6 | 3.2 | - | 0.9 | - | ||||||
| 67.2 | 7.5 | 6.3 | 4.5 | 2.8 | 4.6 | 3.0 | 1.5 | 1.7 | ||||
| Sample | ρ/Ω cm |
|---|---|
| P21 | 3.1 |
| S22 | 59.9 |
| S23 | 84.0 |
| Scan Rate/mV s−1 | KOH Solution | H2SO4 Solution | ||||||||
|---|---|---|---|---|---|---|---|---|---|---|
| S12 | S22 | S23 | P11 | P21 | S12 | S22 | S23 | P11 | P21 | |
| 10 | 73 | 84 | 102 | 56 | 205 | 14 | 50 | 72 | 5.7 | 155 |
| 20 | 36 | 67 | 100 | 51 | 187 | 7.6 | 42 | 78 | 4.2 | 152 |
| 50 | 16 | 52 | 95 | 45 | 161 | 3.6 | 34 | 83 | 3.0 | 140 |
| 100 | 10 | 41 | 80 | 36 | 133 | 2.3 | 27 | 73 | 2.1 | 122 |
| 200 | 6.9 | 32 | 72 | 25 | 100 | 1.6 | 22 | 68 | 1.5 | 97 |
| Sample | C/F g−1 |
|---|---|
| P11 | 1.9 |
| S12 | 1.1 |
| P21 | 127 |
| S22 | 2.1 |
| S23 | 2.9 |
| Sample | KOH Solution | H2SO4 Solution |
|---|---|---|
| P11 | 99 ± 3 | 47.5 ± 5.7 |
| S12 | 52 ± 12 | 30 ± 10 |
| P21 | 58.3 ± 6.8 | 65.6 ± 8.3 |
| S22 | 17.8 ± 4.8 | 42.2 ± 3.2 |
| S23 | 51.9 ± 8.6 | 76.8 ± 3.0 |
| S21 | S22 | S23 | P11 | P21 | ||
|---|---|---|---|---|---|---|
| Eonset/V | −0.25 | −0.23 | −0.20 | −0.30 | −0.21 | |
| E / V vs. SHE | ||||||
| n per O2 molecule | −0.059 | 2.1 | 2.3 | 1.8 | - | - |
| −0.159 | 2.2 | 2.1 | 1.8 | - | 1.9 | |
| −0.259 | 2.3 | 2.0 | 1.8 | 2.2 | 1.9 | |
| −0.359 | 2.6 | 2.1 | 2.1 | 2.2 | 1.9 | |
| −0.459 | 2.7 | 2.2 | 2.8 | 2.2 | 2.0 | |
| −0.559 | 2.1 | 2.5 | 3.0 | 2.0 | 2.2 | |
| jk/ mA cm−2 | −0.059 | 0.64 | 0.93 | 3.22 | 0.03 | 0.62 |
| −0.159 | 2.59 | 9.05 | 8.62 | 0.28 | 8.57 | |
| −0.259 | 5.23 | 22.5 | 12.3 | 1.02 | 64.9 |
Publisher’s Note: MDPI stays neutral with regard to jurisdictional claims in published maps and institutional affiliations. |
© 2021 by the authors. Licensee MDPI, Basel, Switzerland. This article is an open access article distributed under the terms and conditions of the Creative Commons Attribution (CC BY) license (https://creativecommons.org/licenses/by/4.0/).
Share and Cite
Breitenbach, S.; Gavrilov, N.; Pašti, I.; Unterweger, C.; Duchoslav, J.; Stifter, D.; Hassel, A.W.; Fürst, C. Biomass-Derived Carbons as Versatile Materials for Energy-Related Applications: Capacitive Properties vs. Oxygen Reduction Reaction Catalysis. C 2021, 7, 55. https://doi.org/10.3390/c7030055
Breitenbach S, Gavrilov N, Pašti I, Unterweger C, Duchoslav J, Stifter D, Hassel AW, Fürst C. Biomass-Derived Carbons as Versatile Materials for Energy-Related Applications: Capacitive Properties vs. Oxygen Reduction Reaction Catalysis. C. 2021; 7(3):55. https://doi.org/10.3390/c7030055
Chicago/Turabian StyleBreitenbach, Stefan, Nemanja Gavrilov, Igor Pašti, Christoph Unterweger, Jiri Duchoslav, David Stifter, Achim Walter Hassel, and Christian Fürst. 2021. "Biomass-Derived Carbons as Versatile Materials for Energy-Related Applications: Capacitive Properties vs. Oxygen Reduction Reaction Catalysis" C 7, no. 3: 55. https://doi.org/10.3390/c7030055
APA StyleBreitenbach, S., Gavrilov, N., Pašti, I., Unterweger, C., Duchoslav, J., Stifter, D., Hassel, A. W., & Fürst, C. (2021). Biomass-Derived Carbons as Versatile Materials for Energy-Related Applications: Capacitive Properties vs. Oxygen Reduction Reaction Catalysis. C, 7(3), 55. https://doi.org/10.3390/c7030055