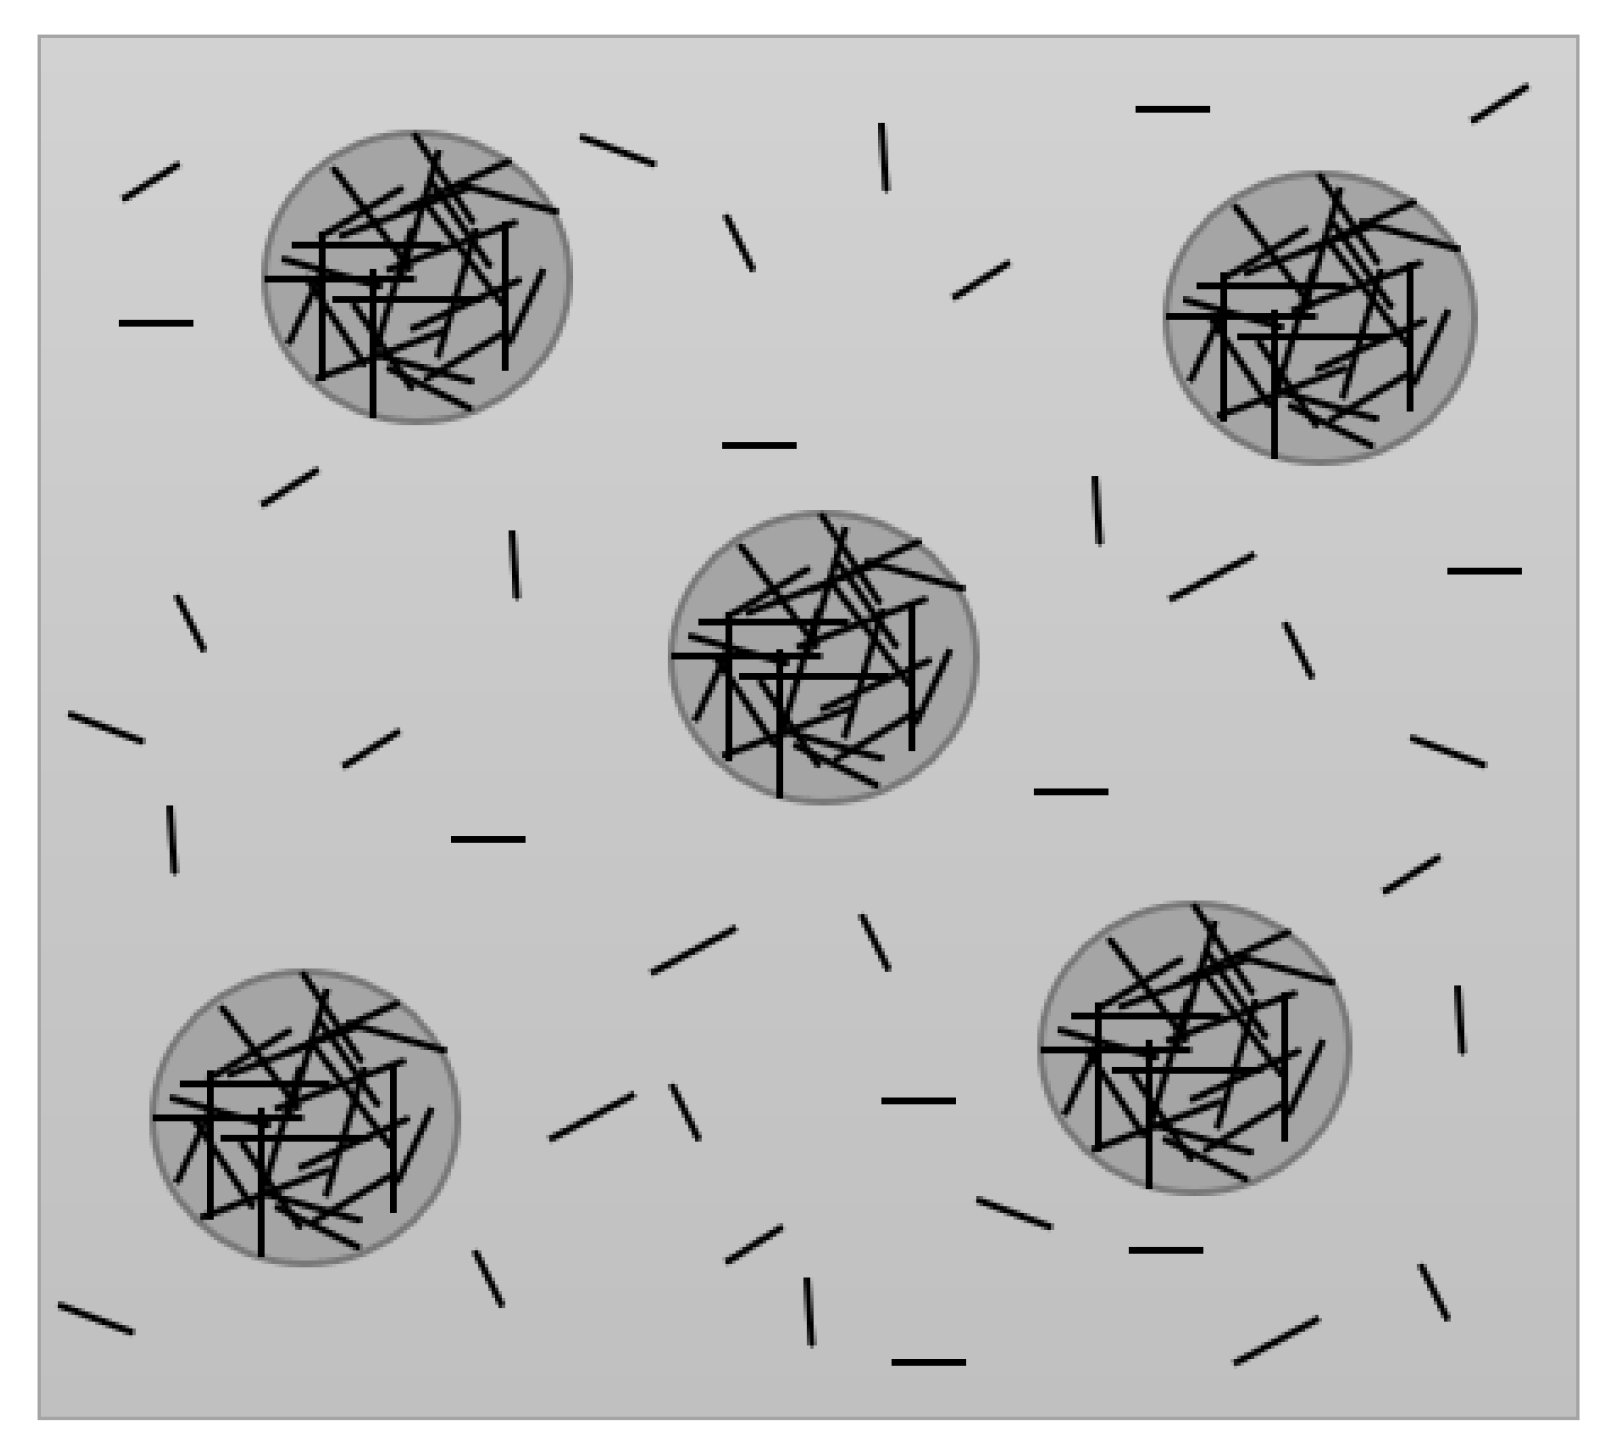
Figure 1.
Eshelby inclusion model of randomly oriented carbon nanotubes.
Figure 1.
Eshelby inclusion model of randomly oriented carbon nanotubes.
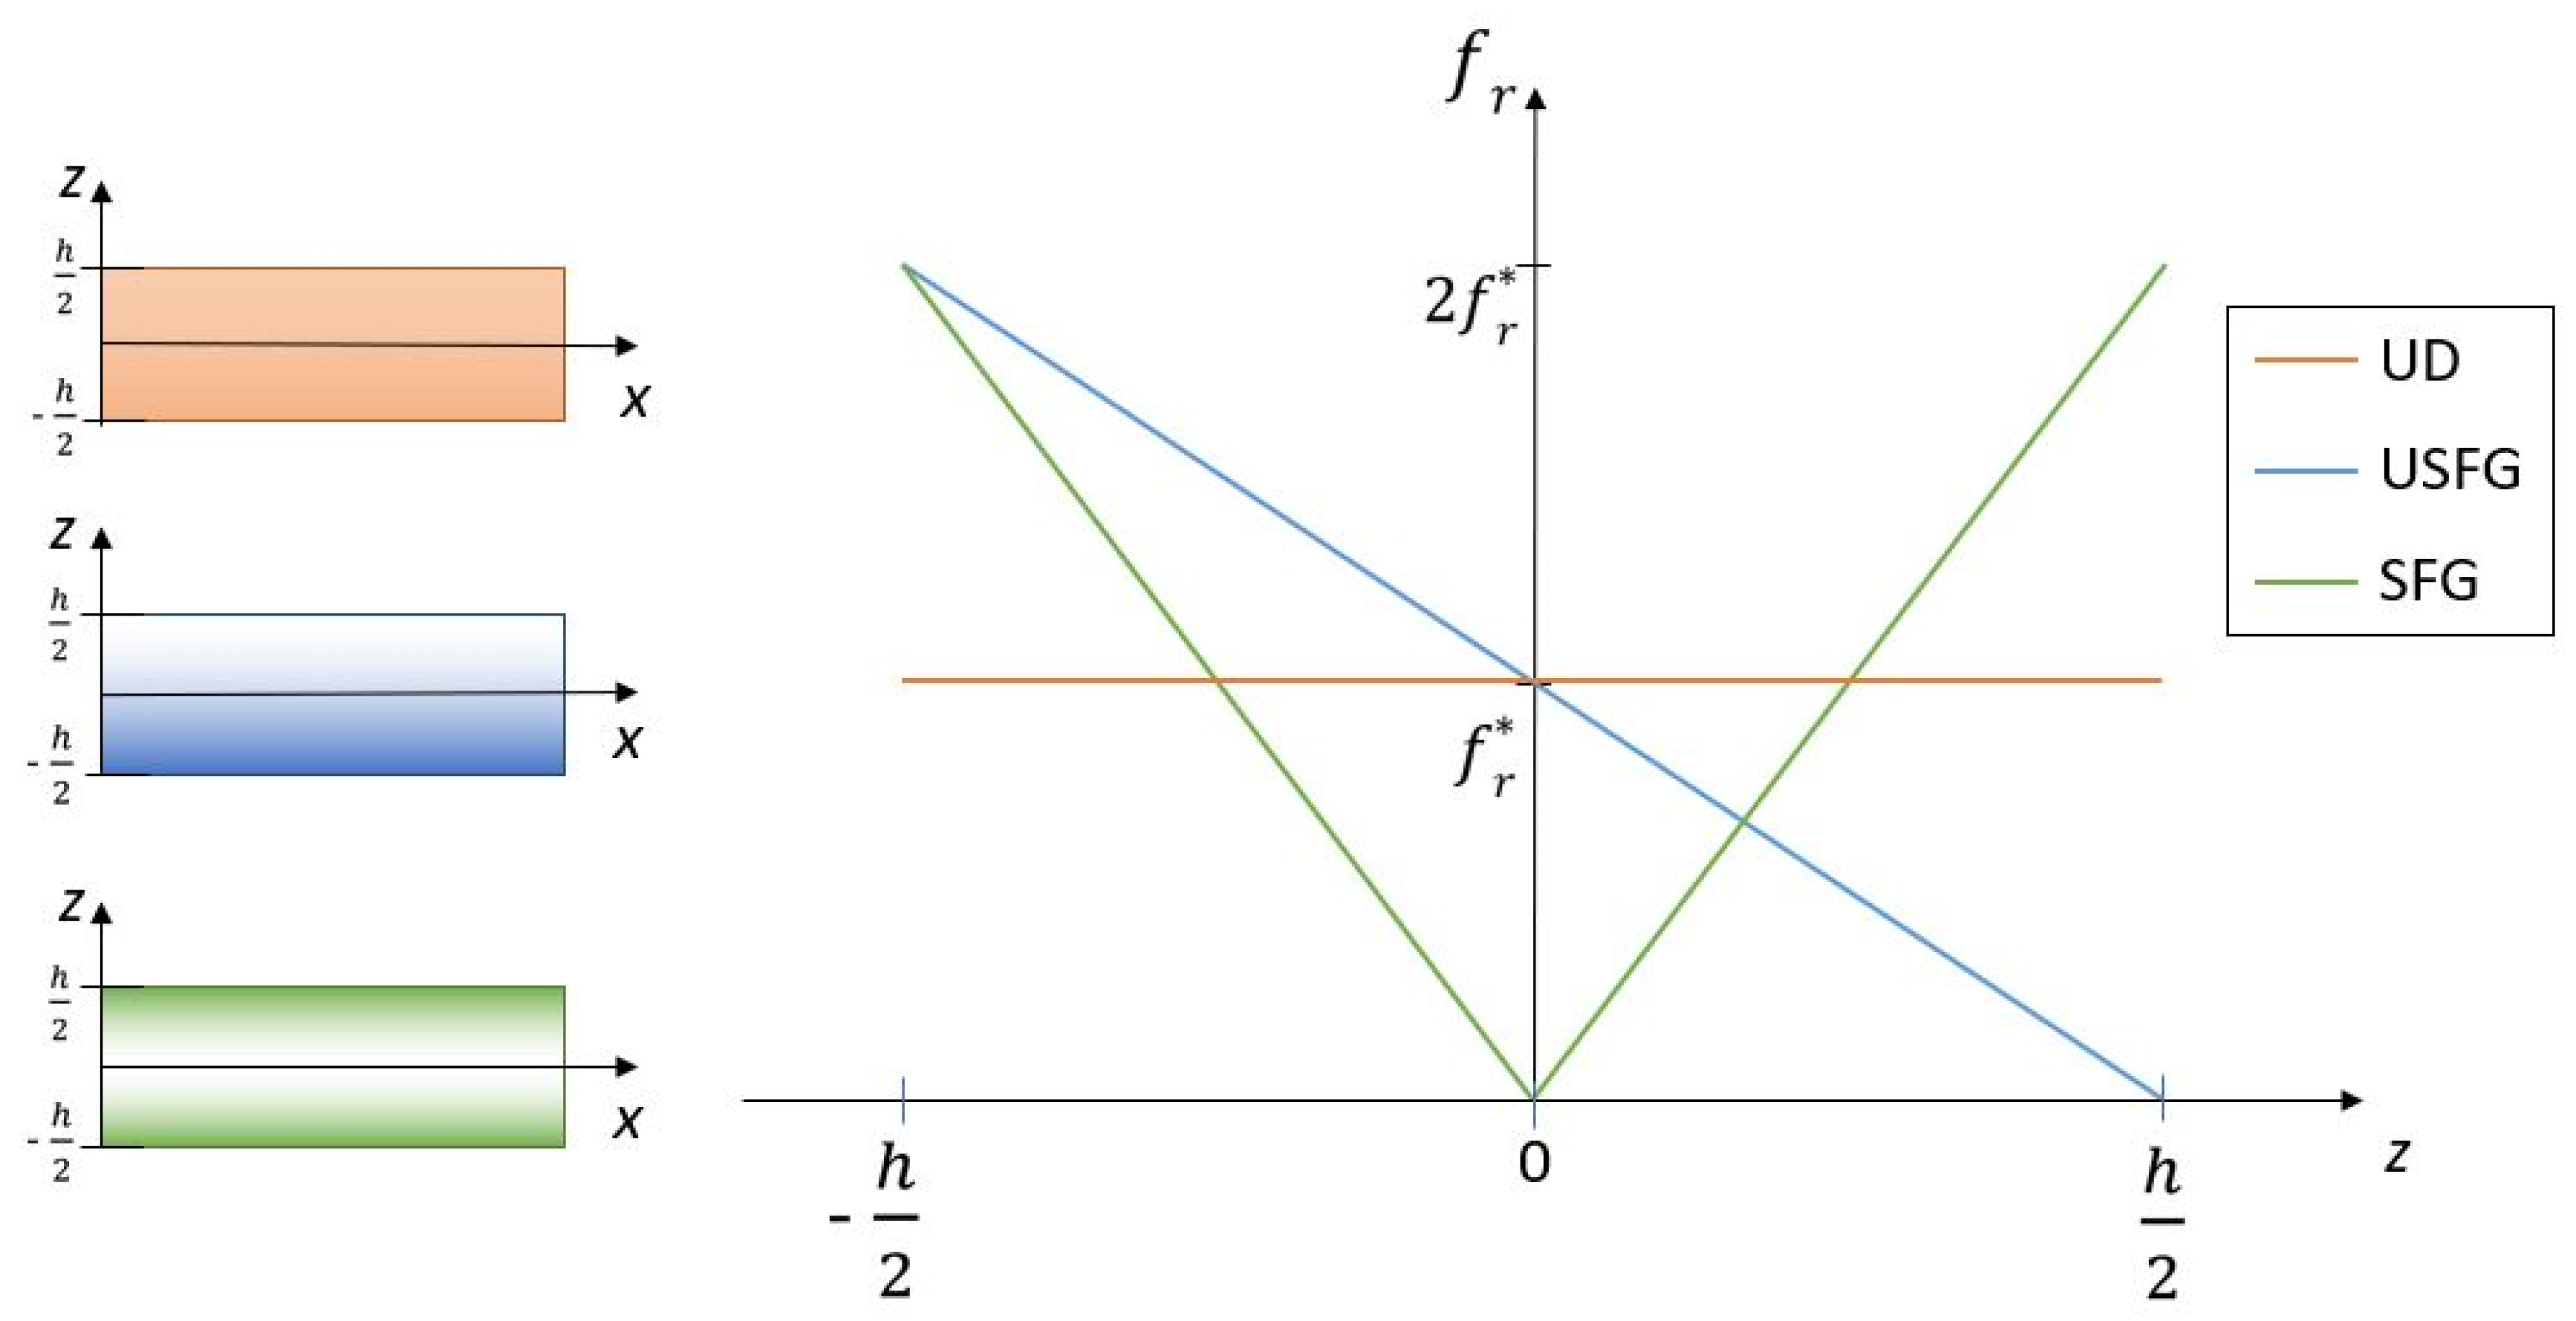
Figure 2.
CNTs volume fractions distributions illustration.
Figure 2.
CNTs volume fractions distributions illustration.
Figure 3.
Representation of the quadrilateral plate.
Figure 3.
Representation of the quadrilateral plate.
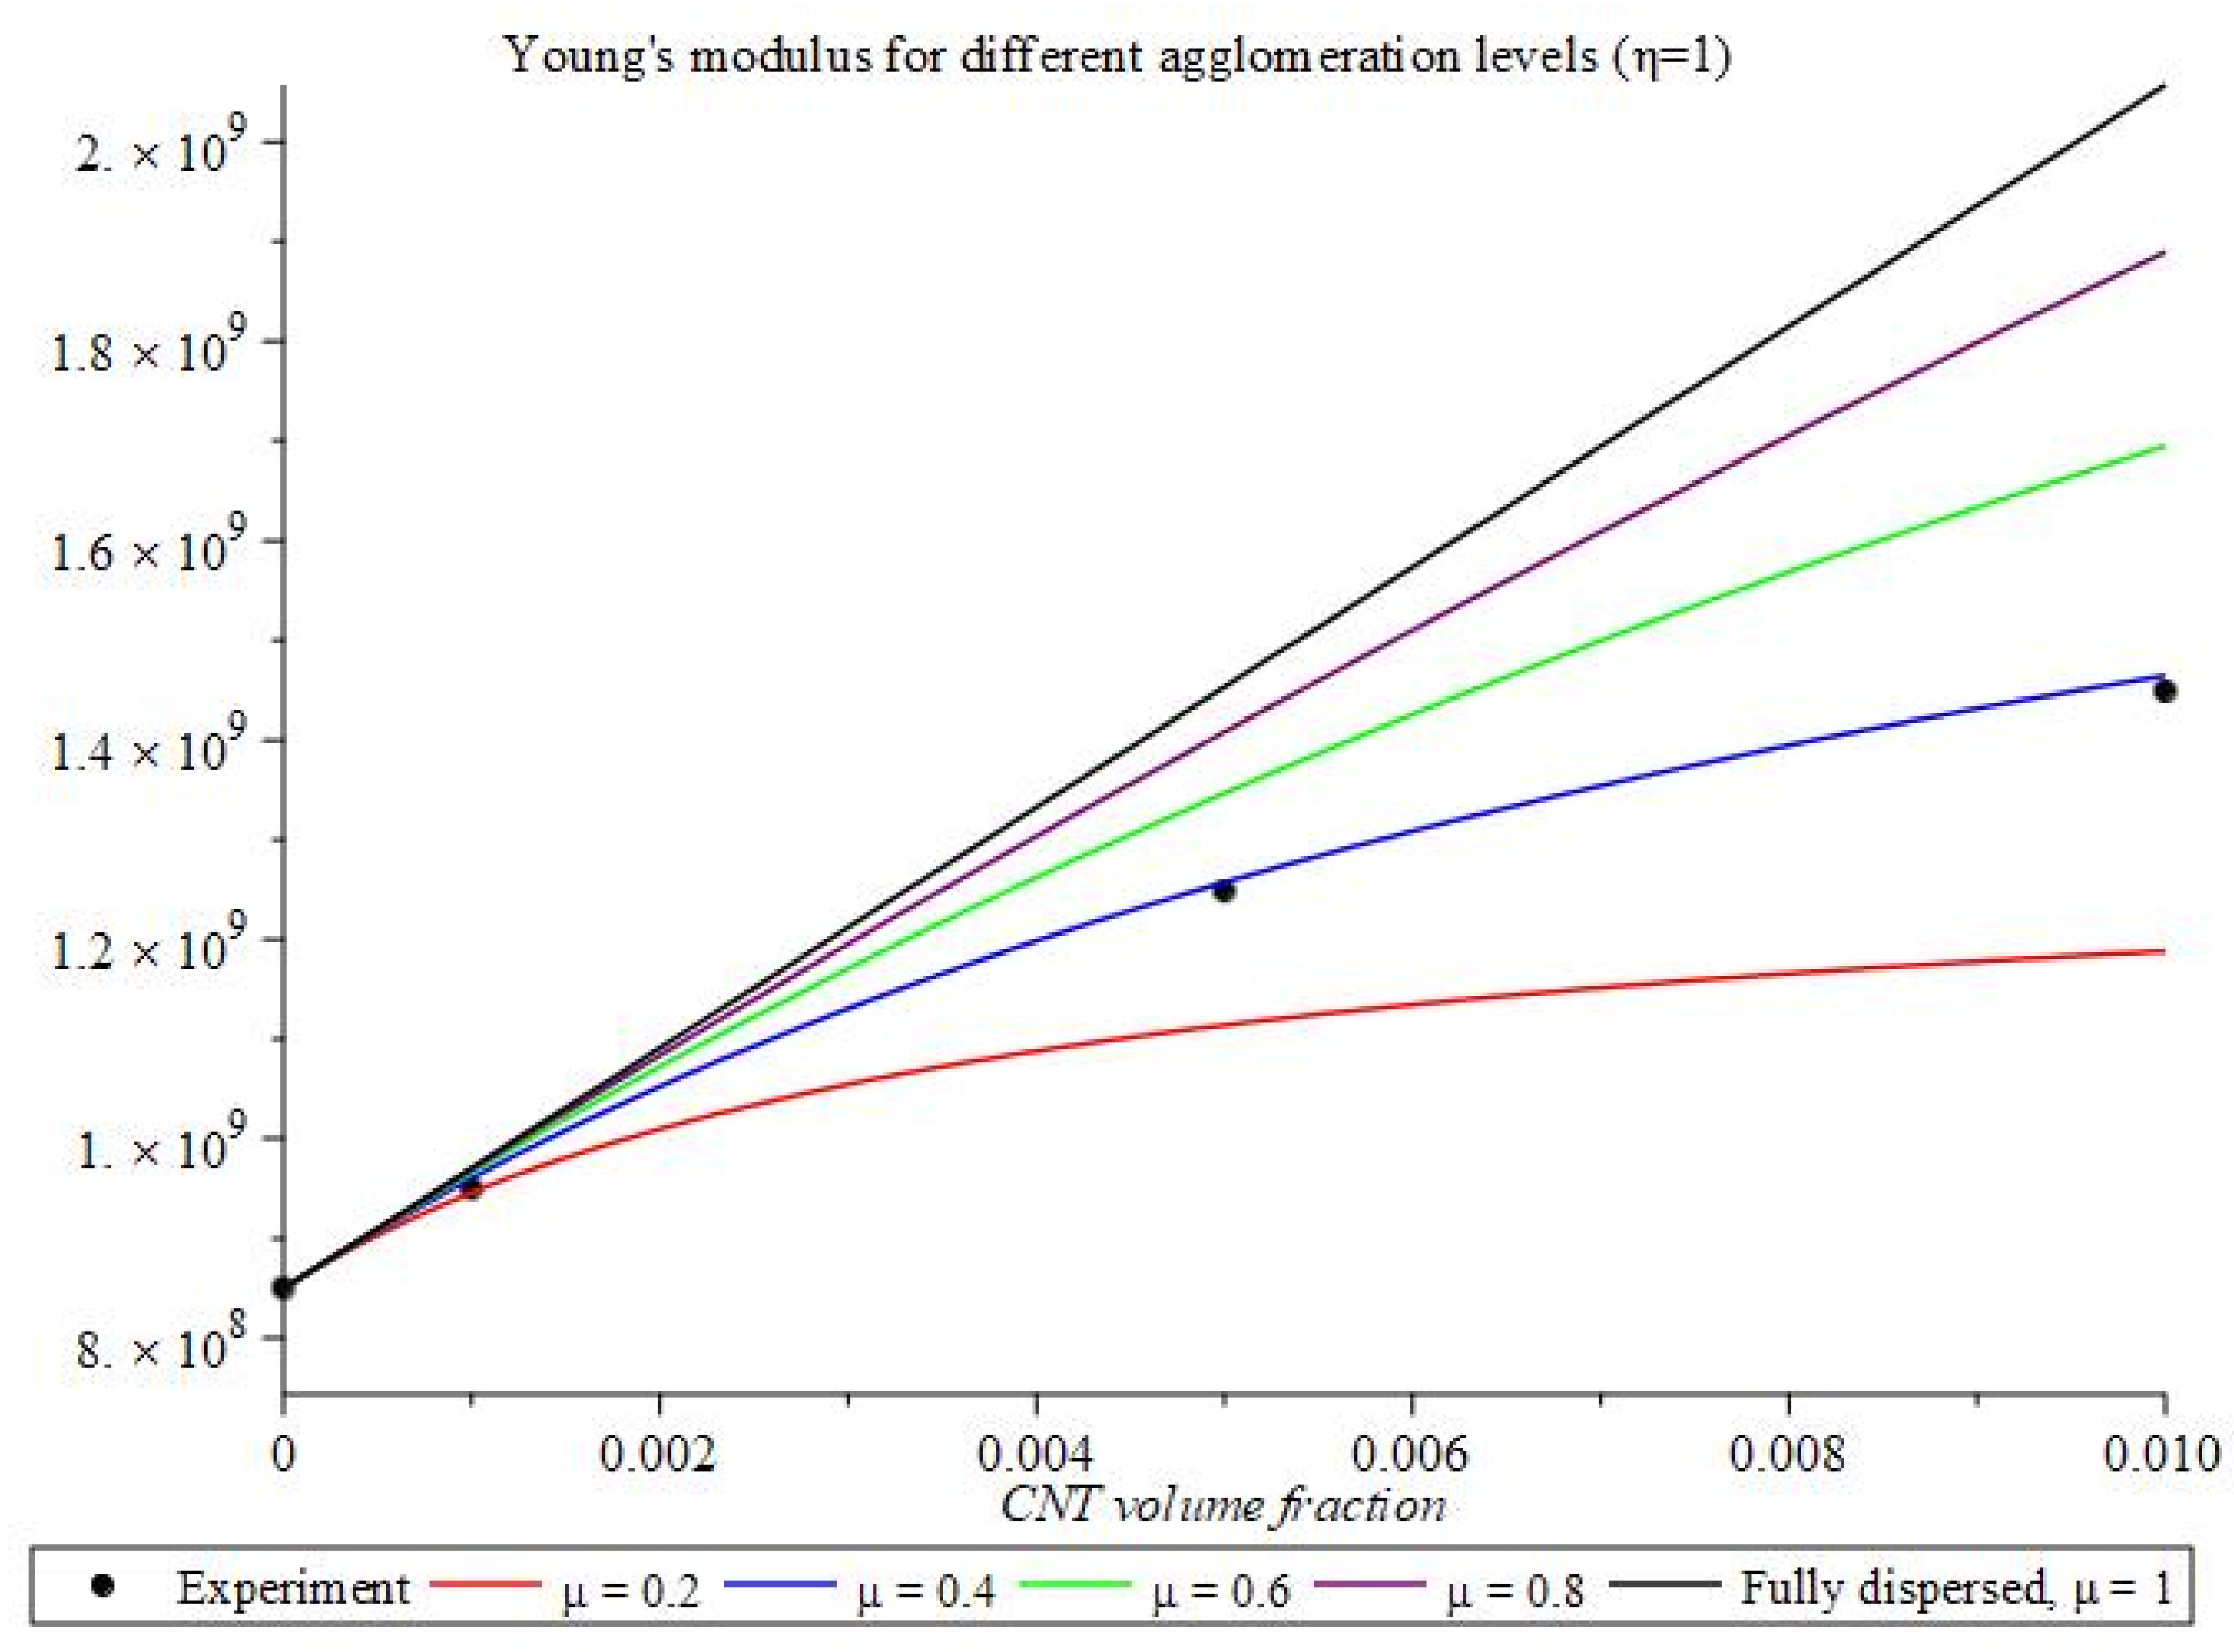
Figure 4.
Young′s modulus for different levels of agglomeration and CNT volume fraction.
Figure 4.
Young′s modulus for different levels of agglomeration and CNT volume fraction.
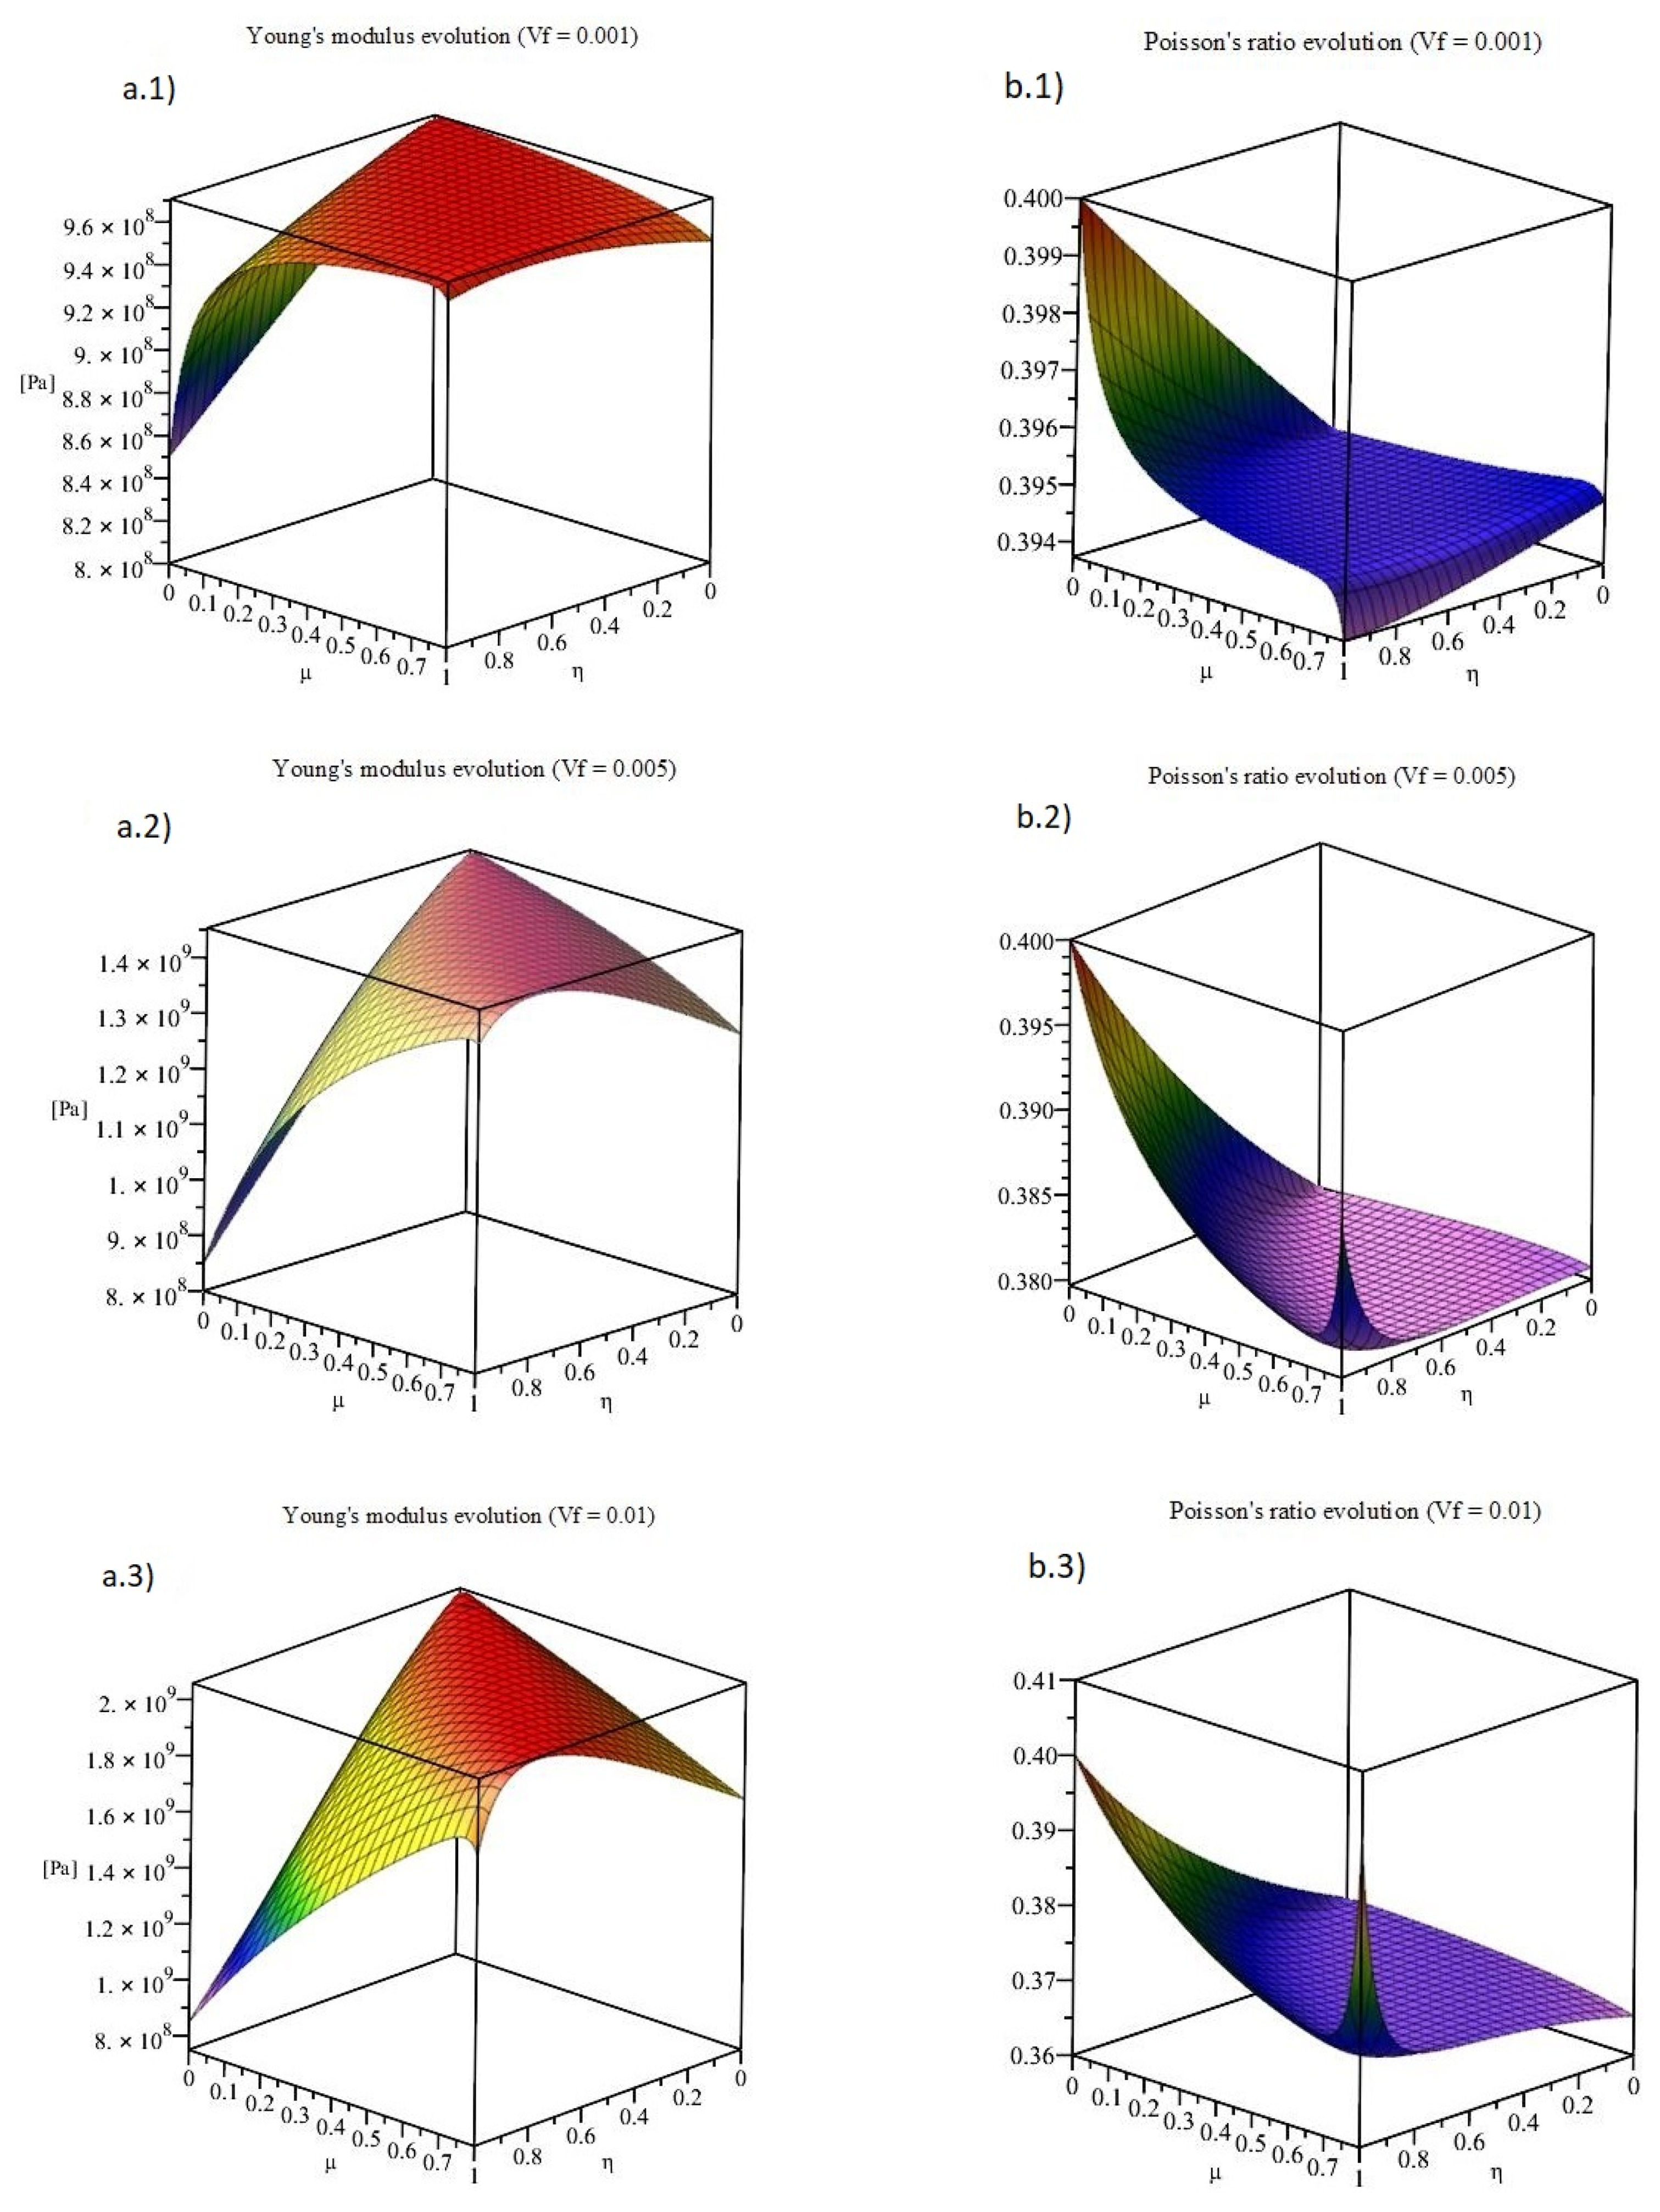
Figure 5.
Mechanical properties evolution for partially agglomerated states. (a.1) Young’s modulus for Vf = 0.001, (b.1) Poisson’s ratio for Vf = 0.001, (a.2) Young’s modulus for Vf = 0.005, (b.2) Poisson’s ratio for Vf = 0.005, (a.3) Young’s modulus for Vf = 0.01, (b.3) Poisson’s ratio for Vf = 0.01.
Figure 6.
Beam schematic representation.
Figure 6.
Beam schematic representation.
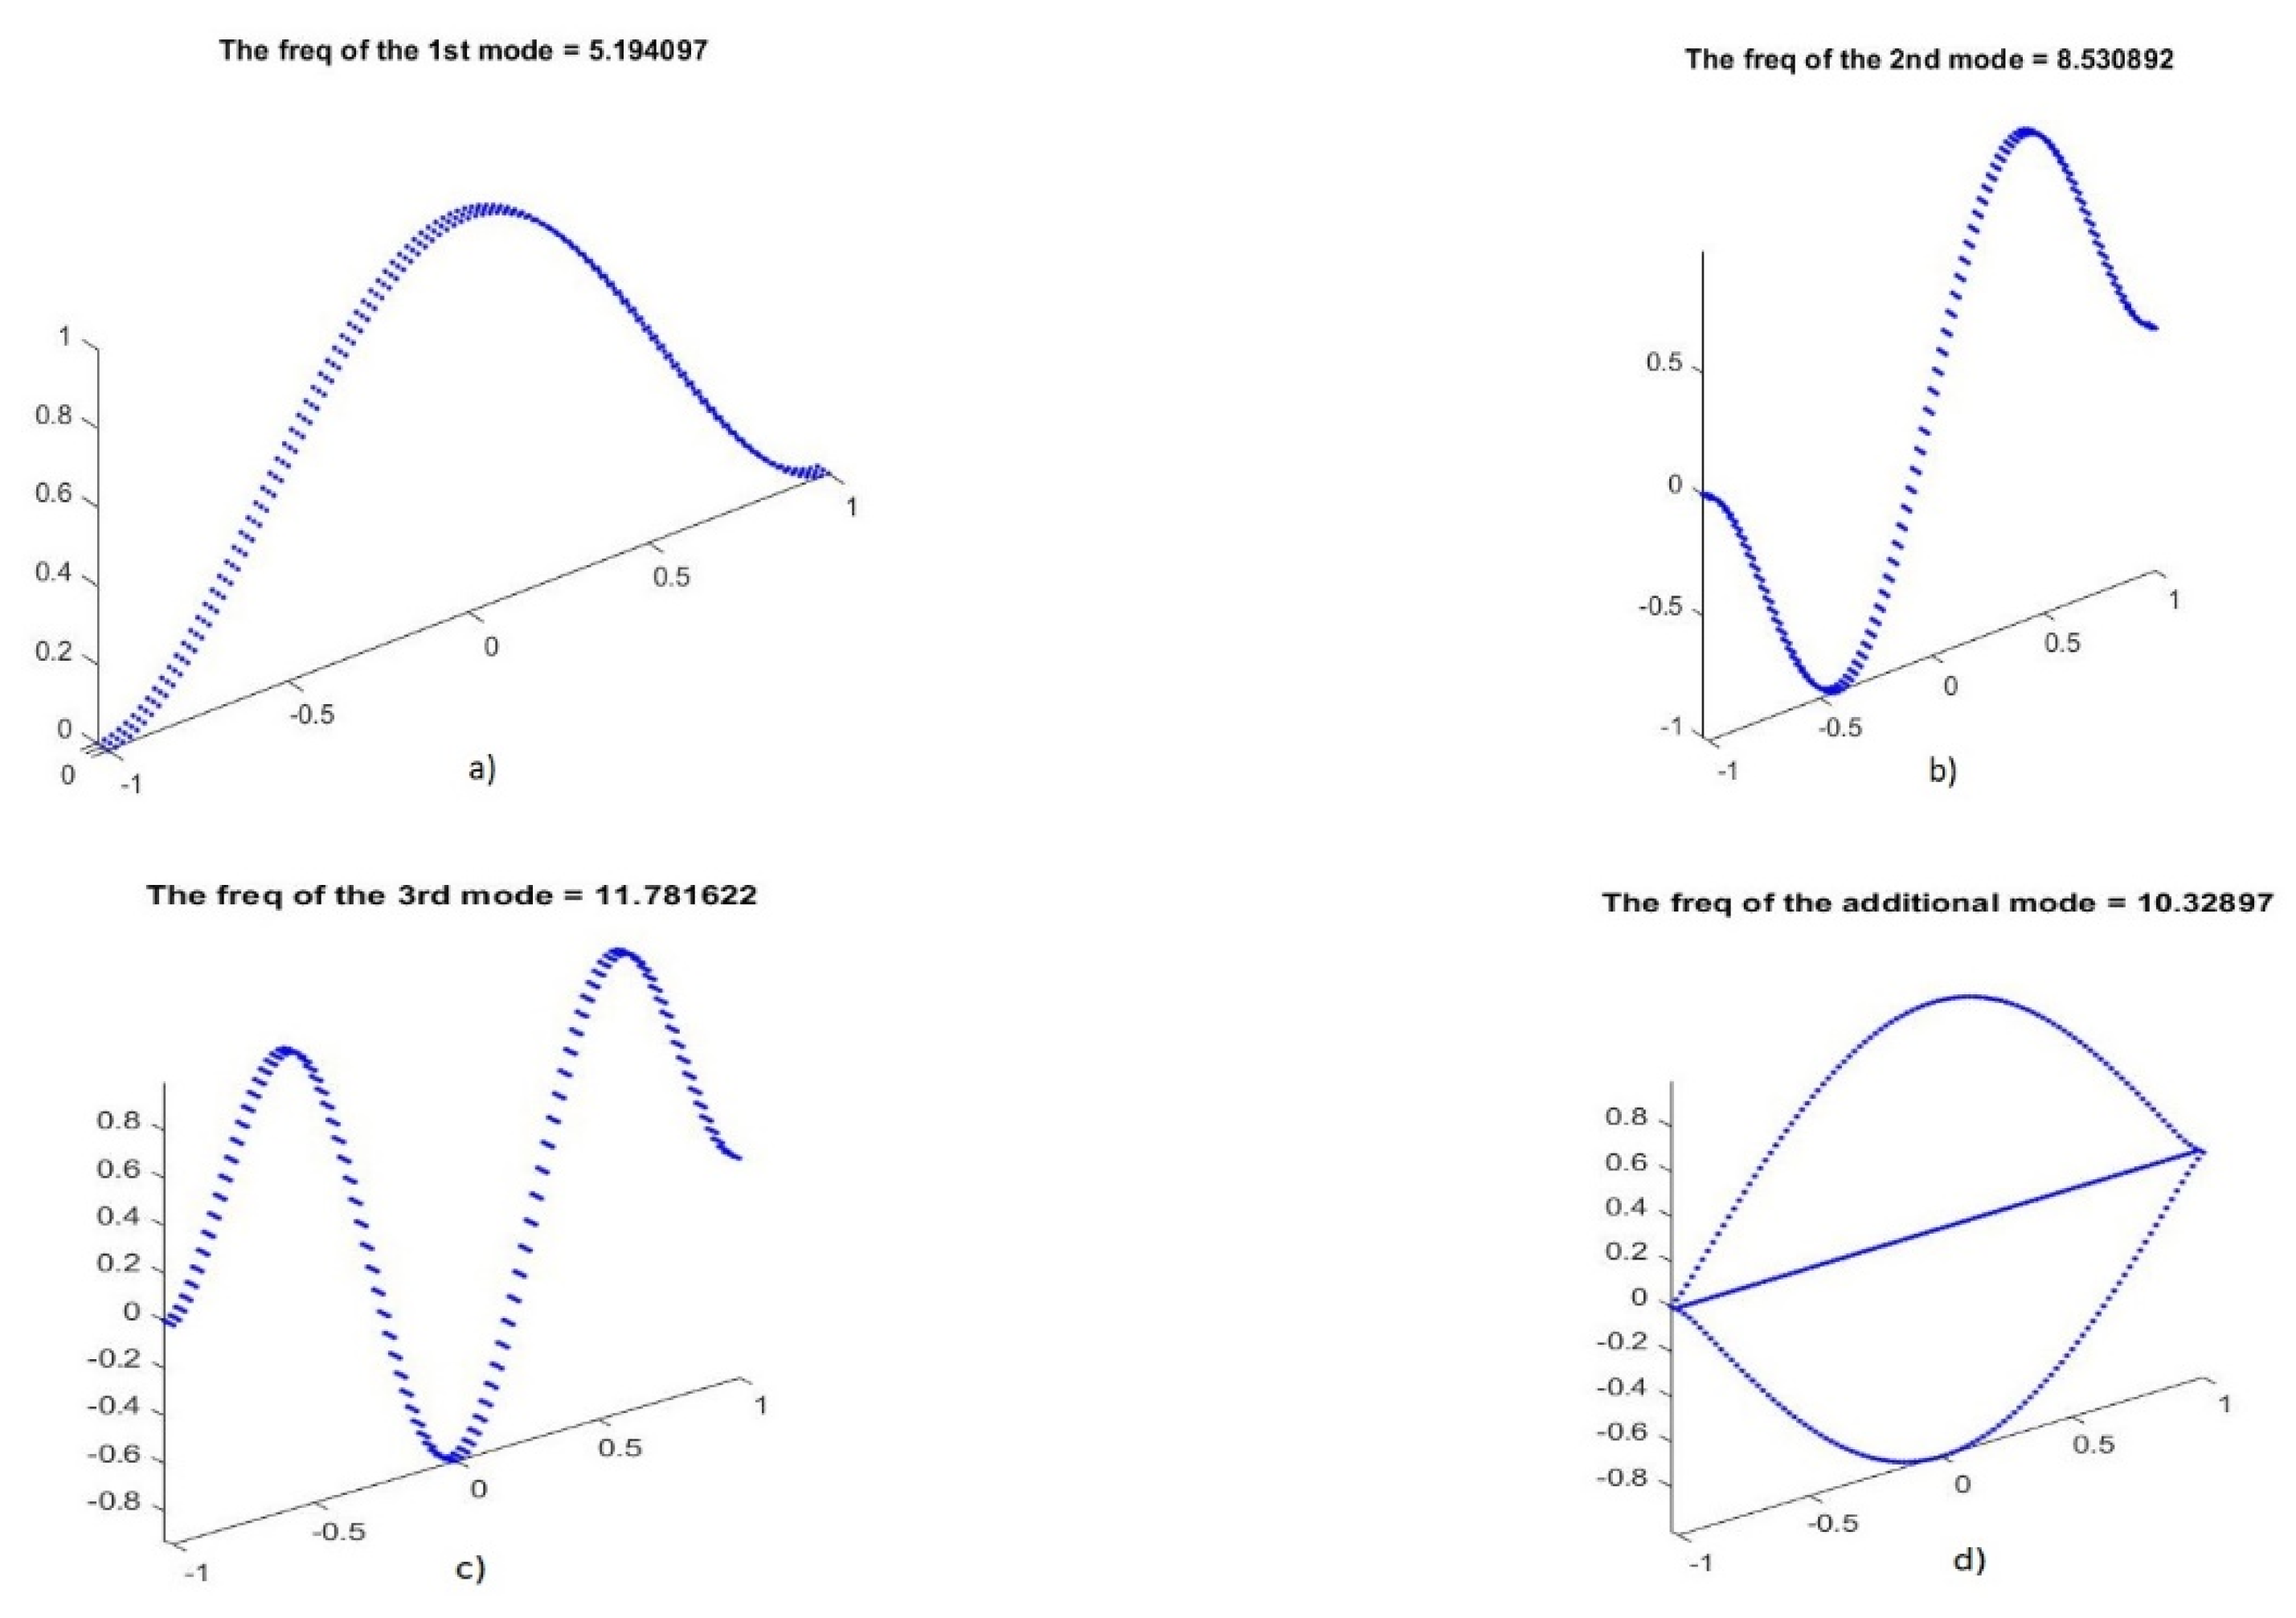
Figure 7.
Vibrational modes of the beam: (a) 1st mode, (b) 2nd mode, (c) 3rd mode, (d) an additional mode related to the plate natural modes between the 2nd and the 3rd modes.
Figure 7.
Vibrational modes of the beam: (a) 1st mode, (b) 2nd mode, (c) 3rd mode, (d) an additional mode related to the plate natural modes between the 2nd and the 3rd modes.
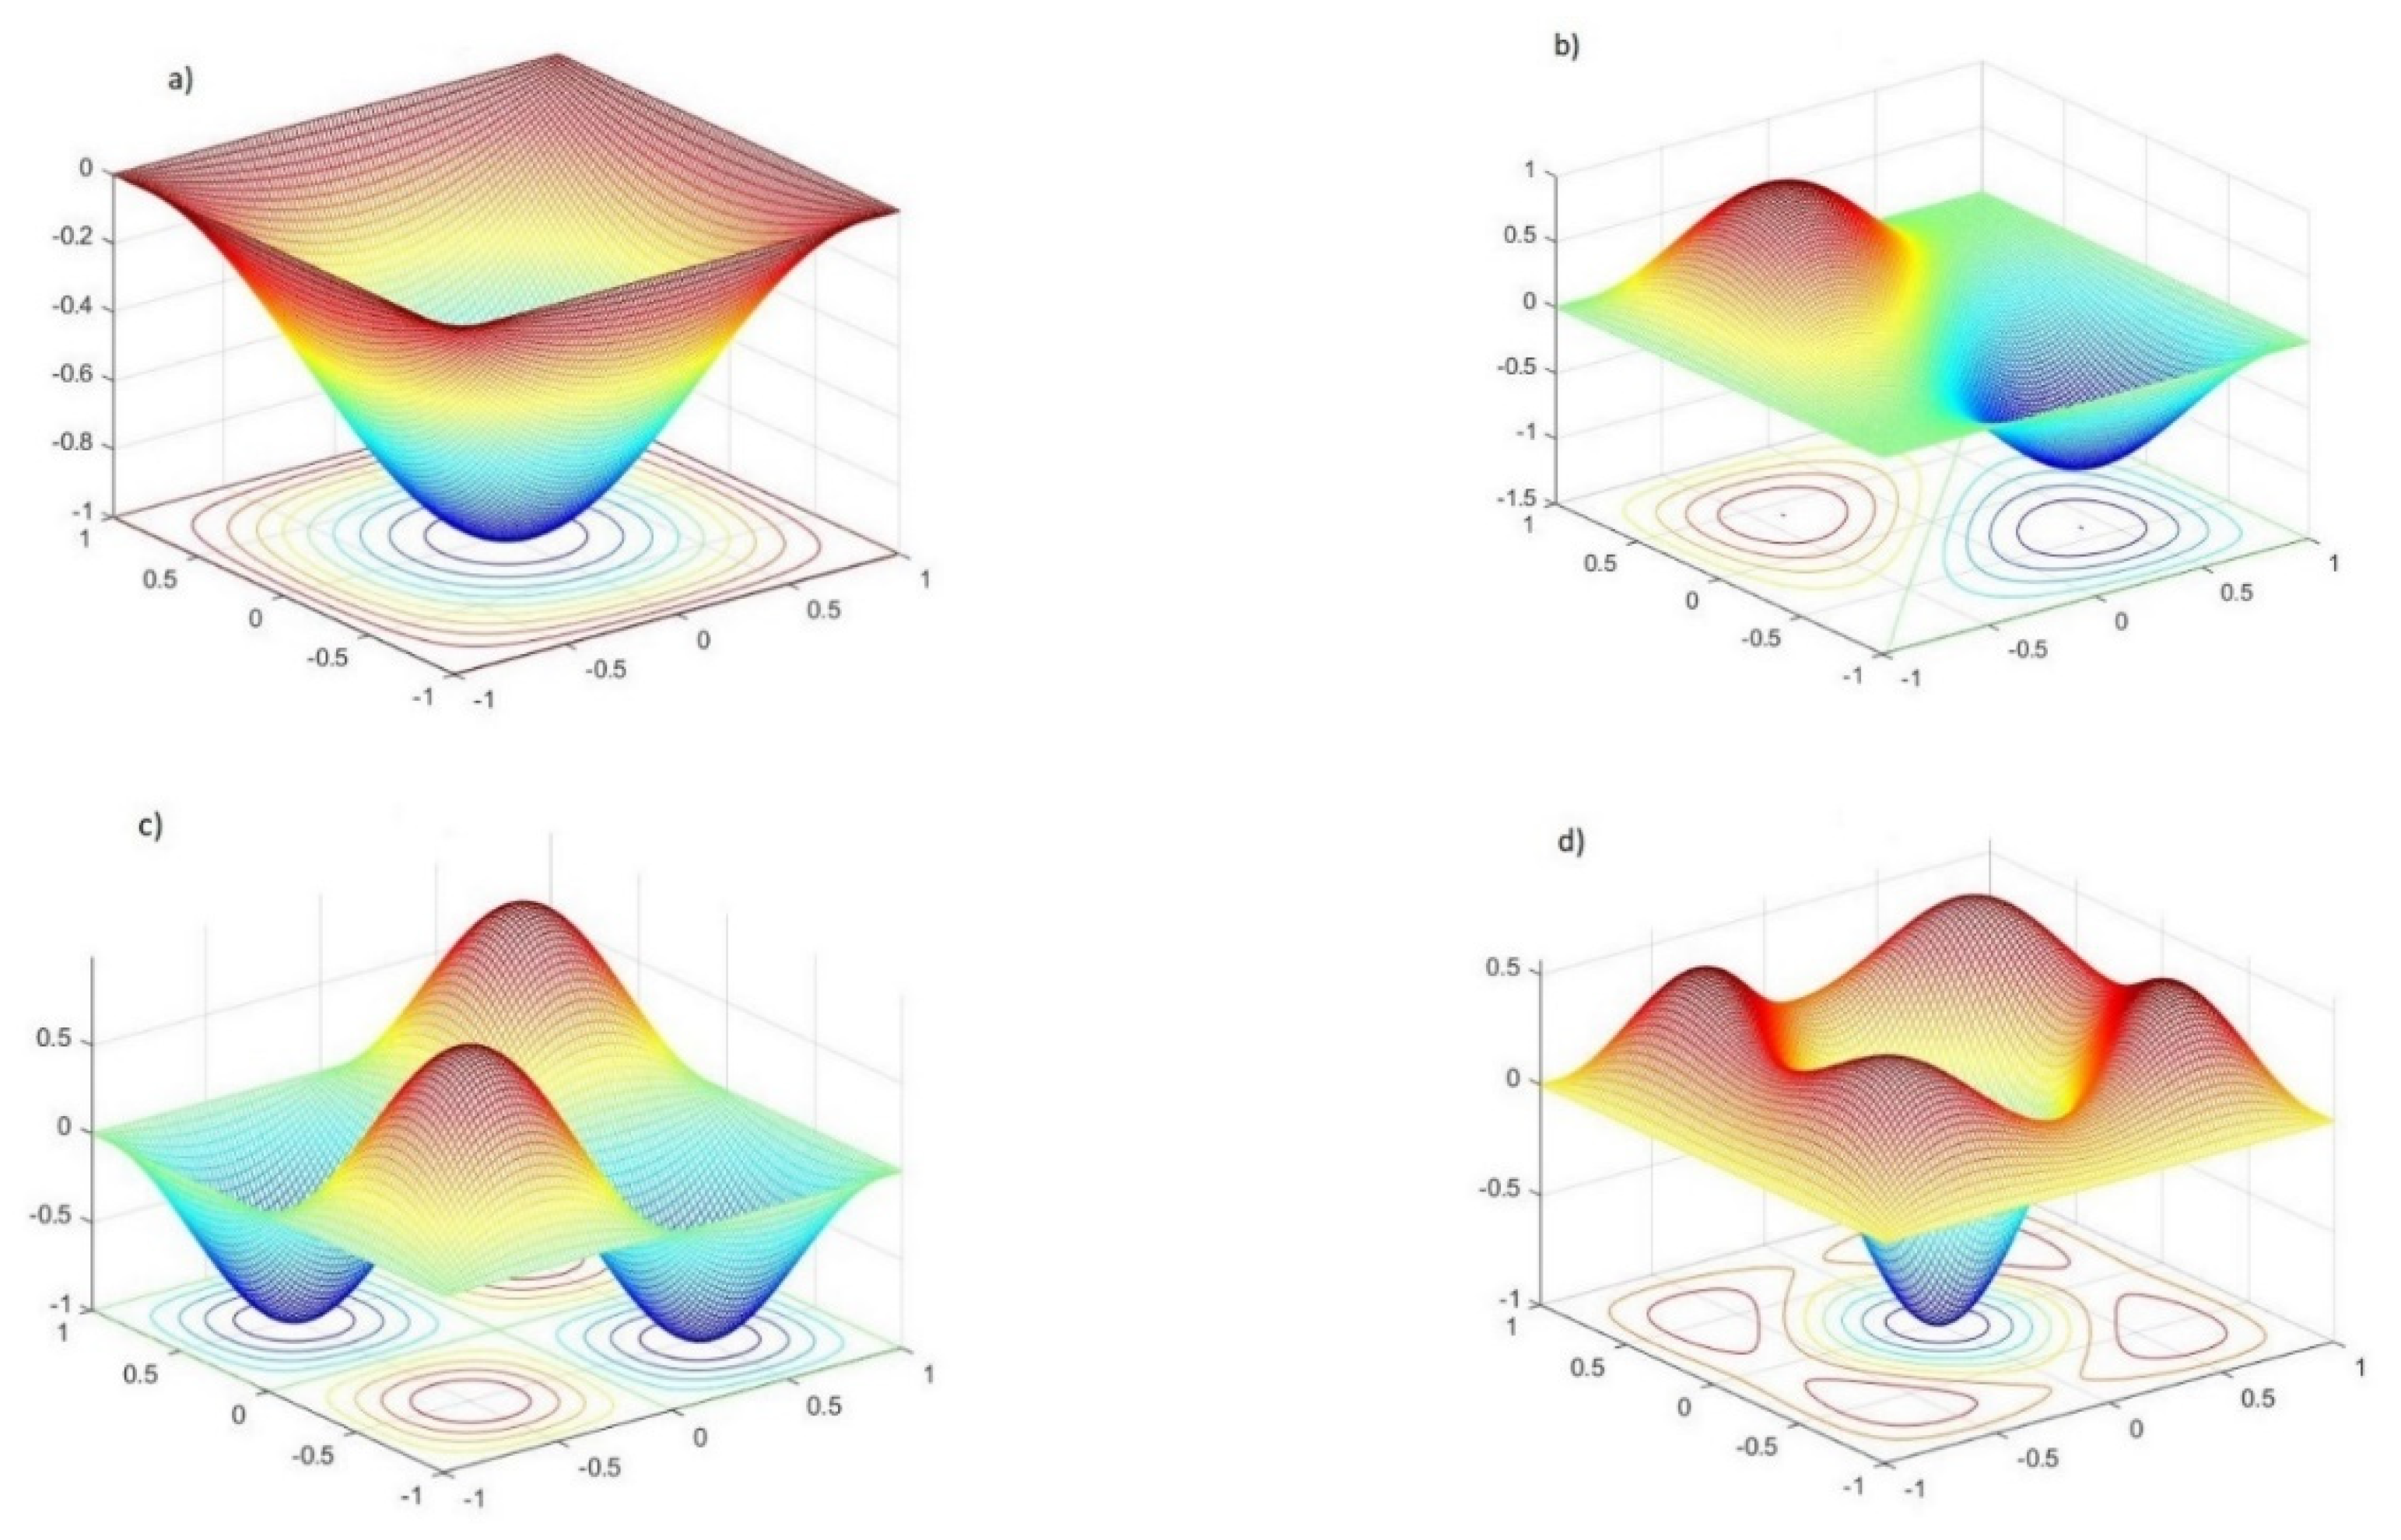
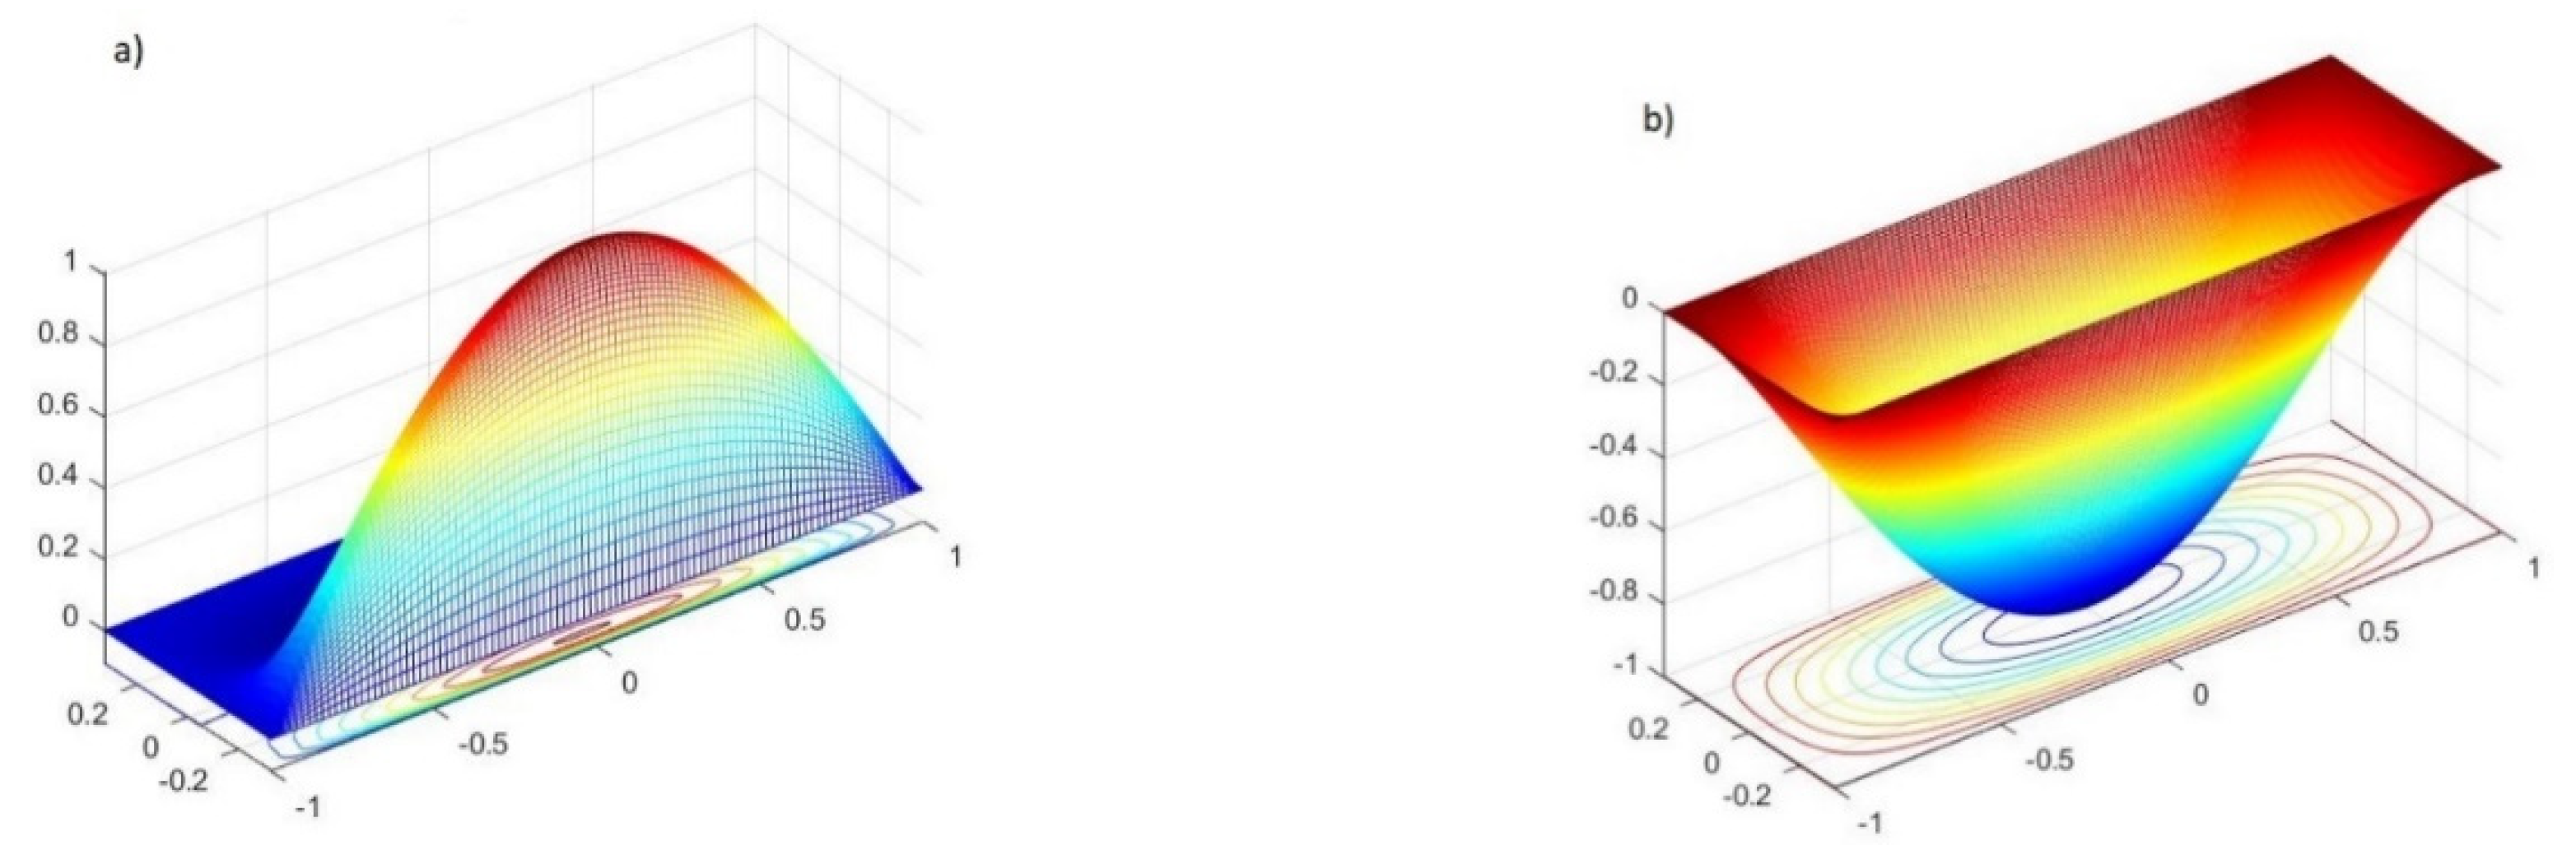
Figure 8.
Vibrational modes for UD distribution without the agglomeration effect: (a) 1st mode, (b) 2nd mode, (c) 4th mode, (d) 5th mode.
Figure 8.
Vibrational modes for UD distribution without the agglomeration effect: (a) 1st mode, (b) 2nd mode, (c) 4th mode, (d) 5th mode.
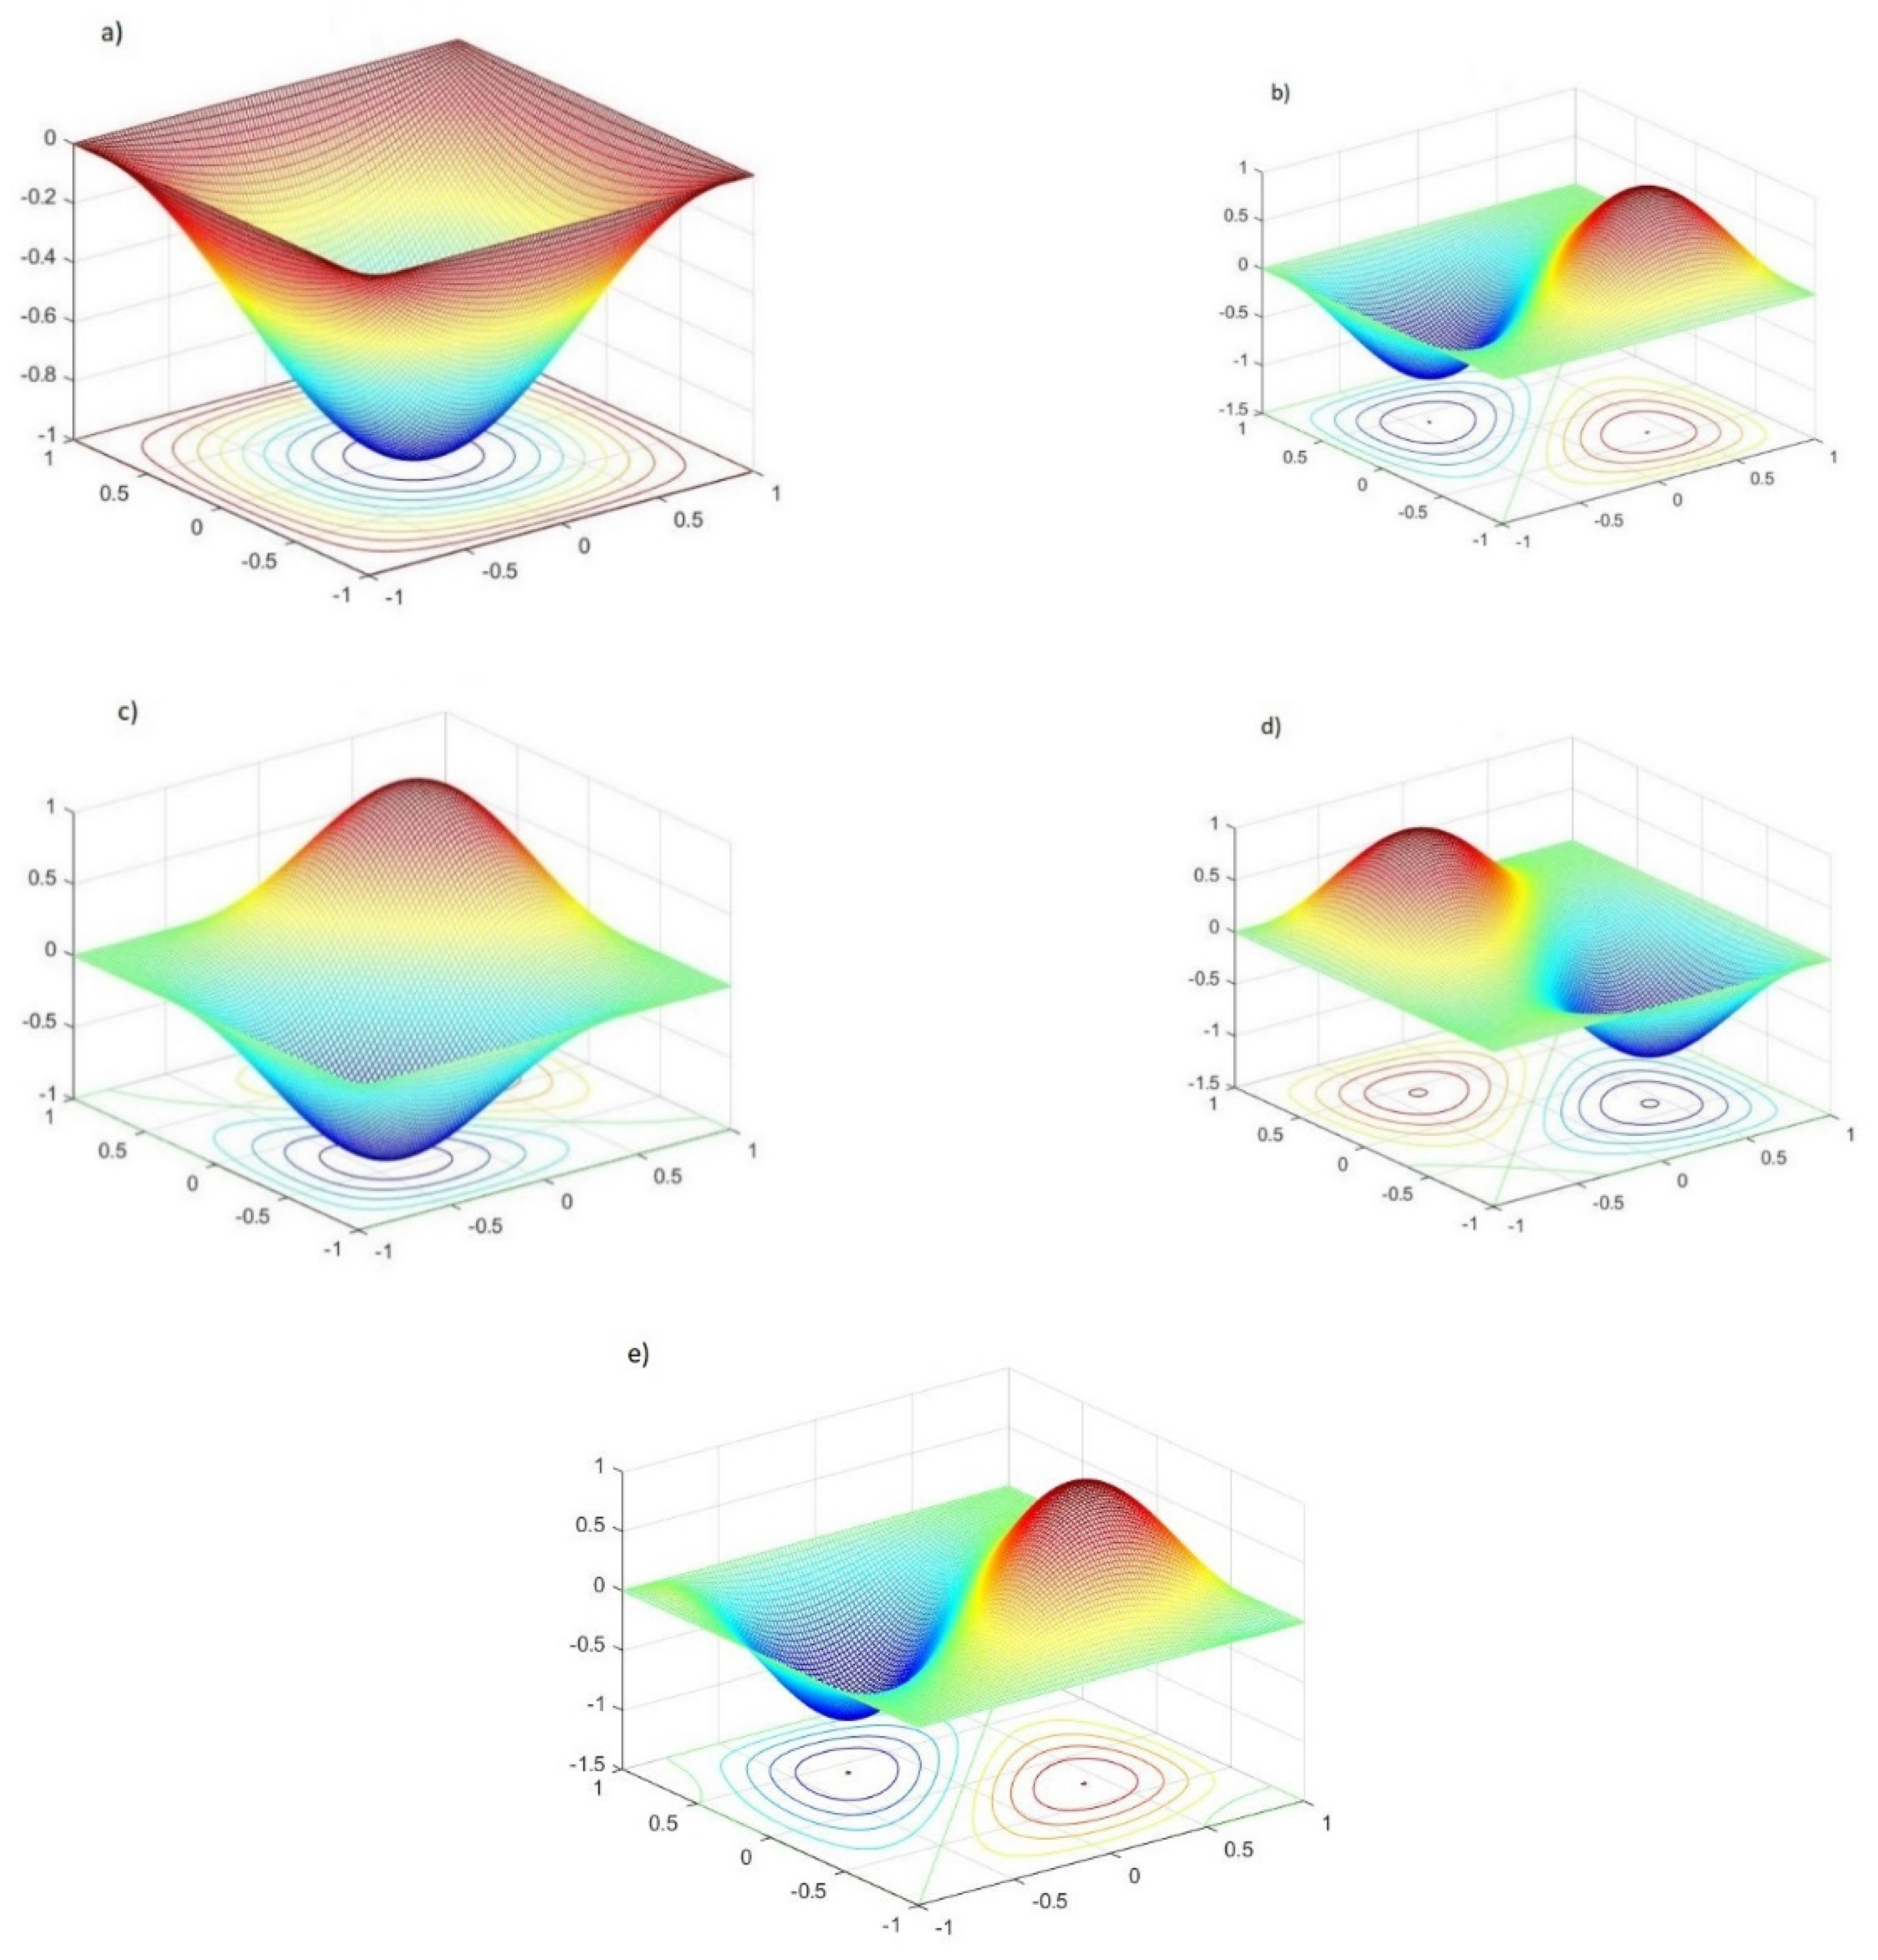
Figure 9.
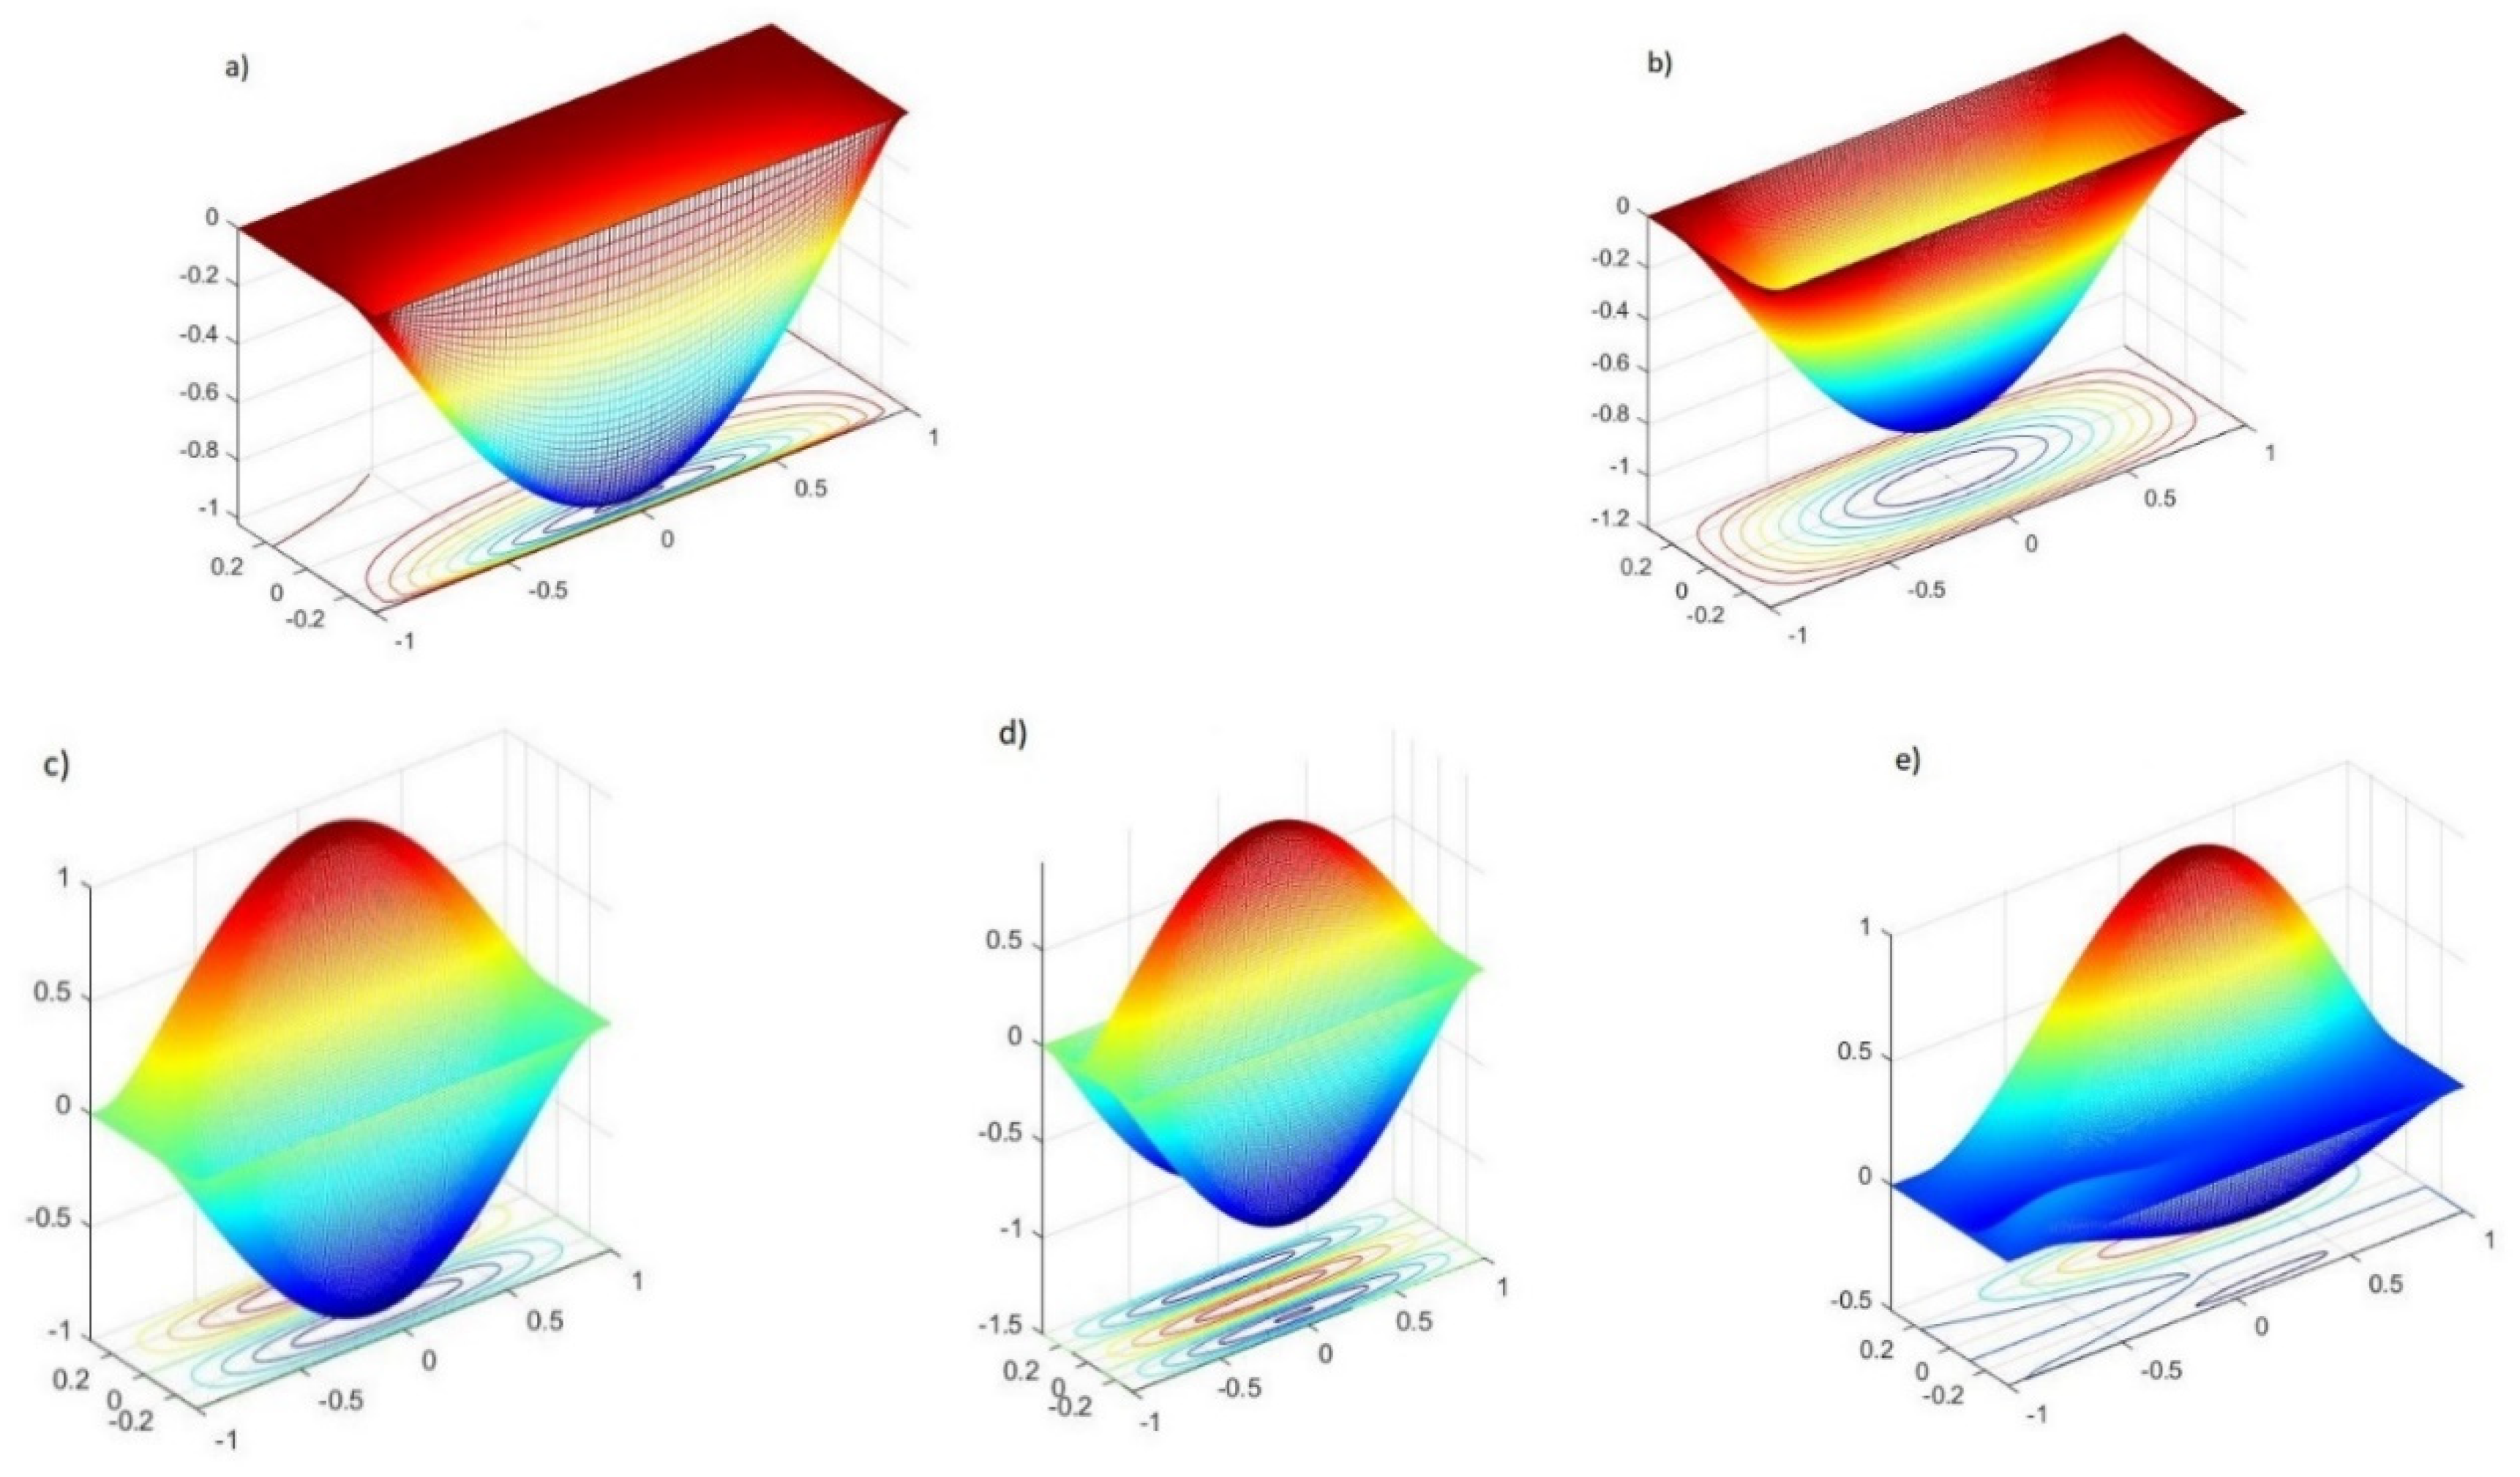
Vibrational modes for USFG distribution without the agglomeration effect: (a) 1st mode, (b) 2nd mode, (c) 3rd mode, (d) 4th mode, (e) 5th mode.
Figure 9.
Vibrational modes for USFG distribution without the agglomeration effect: (a) 1st mode, (b) 2nd mode, (c) 3rd mode, (d) 4th mode, (e) 5th mode.
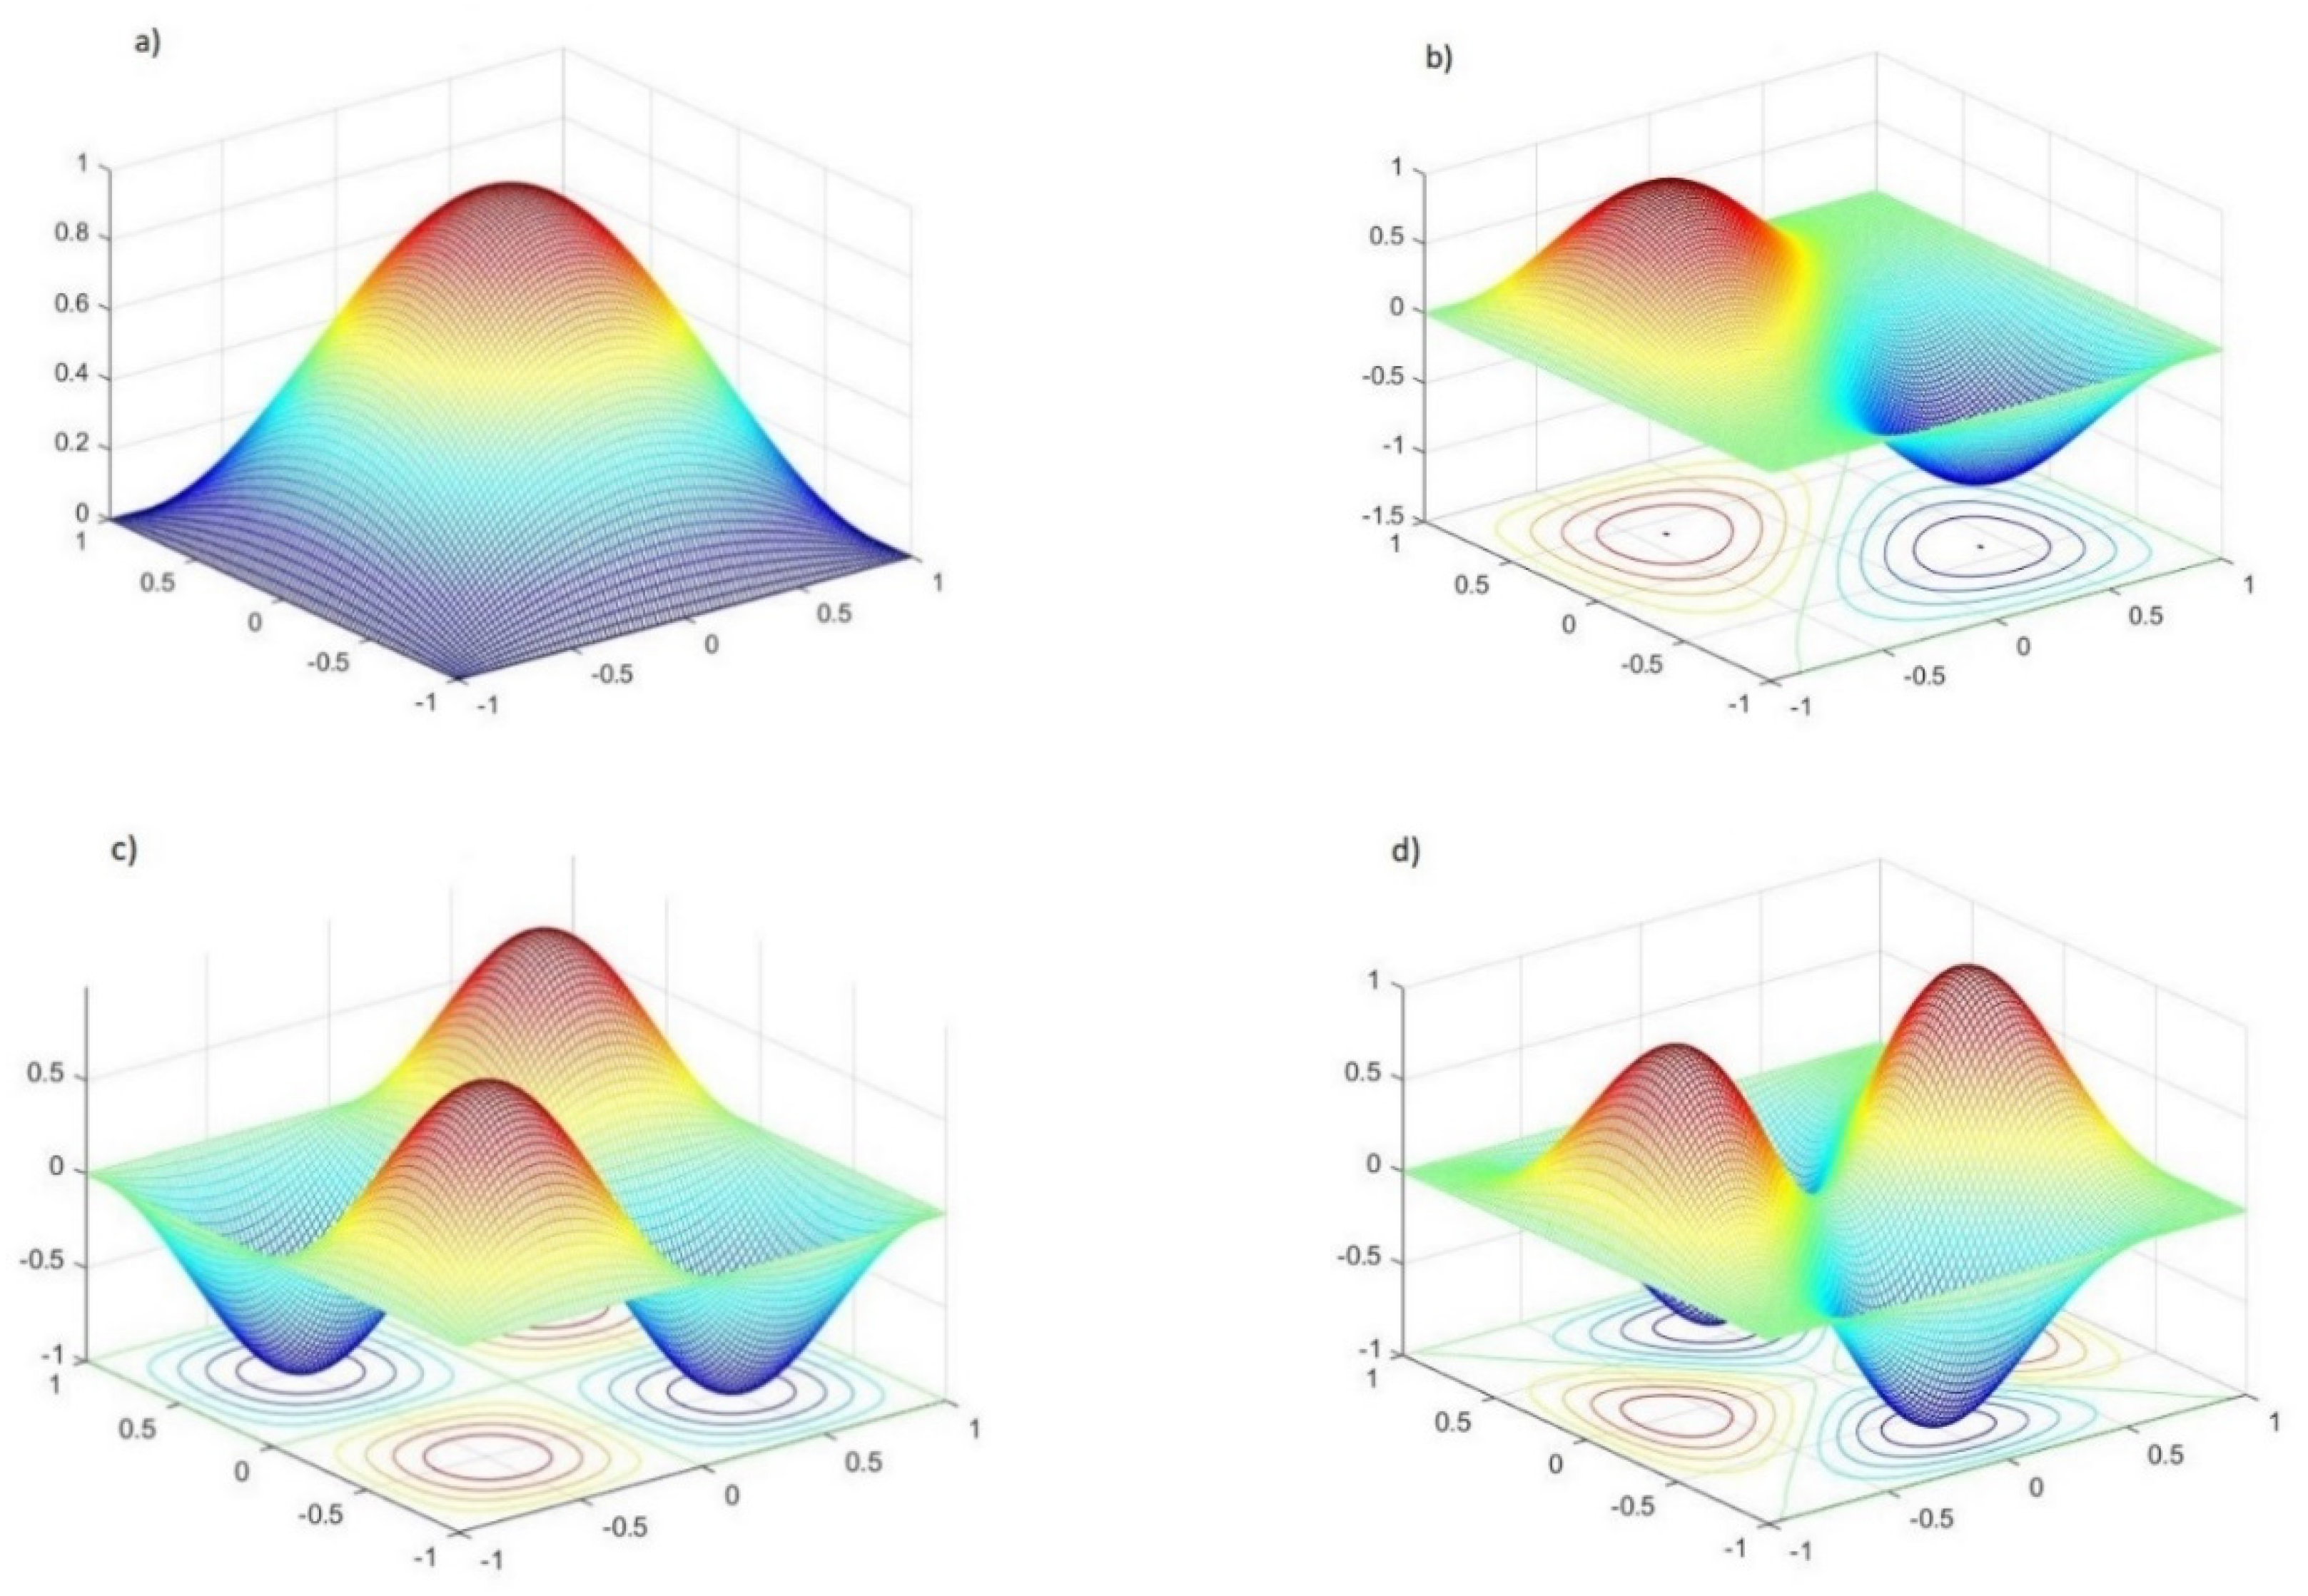
Figure 10.
Vibrational modes for SFG distribution without the agglomeration effect: (a) 1st mode, (b) 2nd mode, (c) 4th mode, (d) 5th mode.
Figure 10.
Vibrational modes for SFG distribution without the agglomeration effect: (a) 1st mode, (b) 2nd mode, (c) 4th mode, (d) 5th mode.
Figure 11.
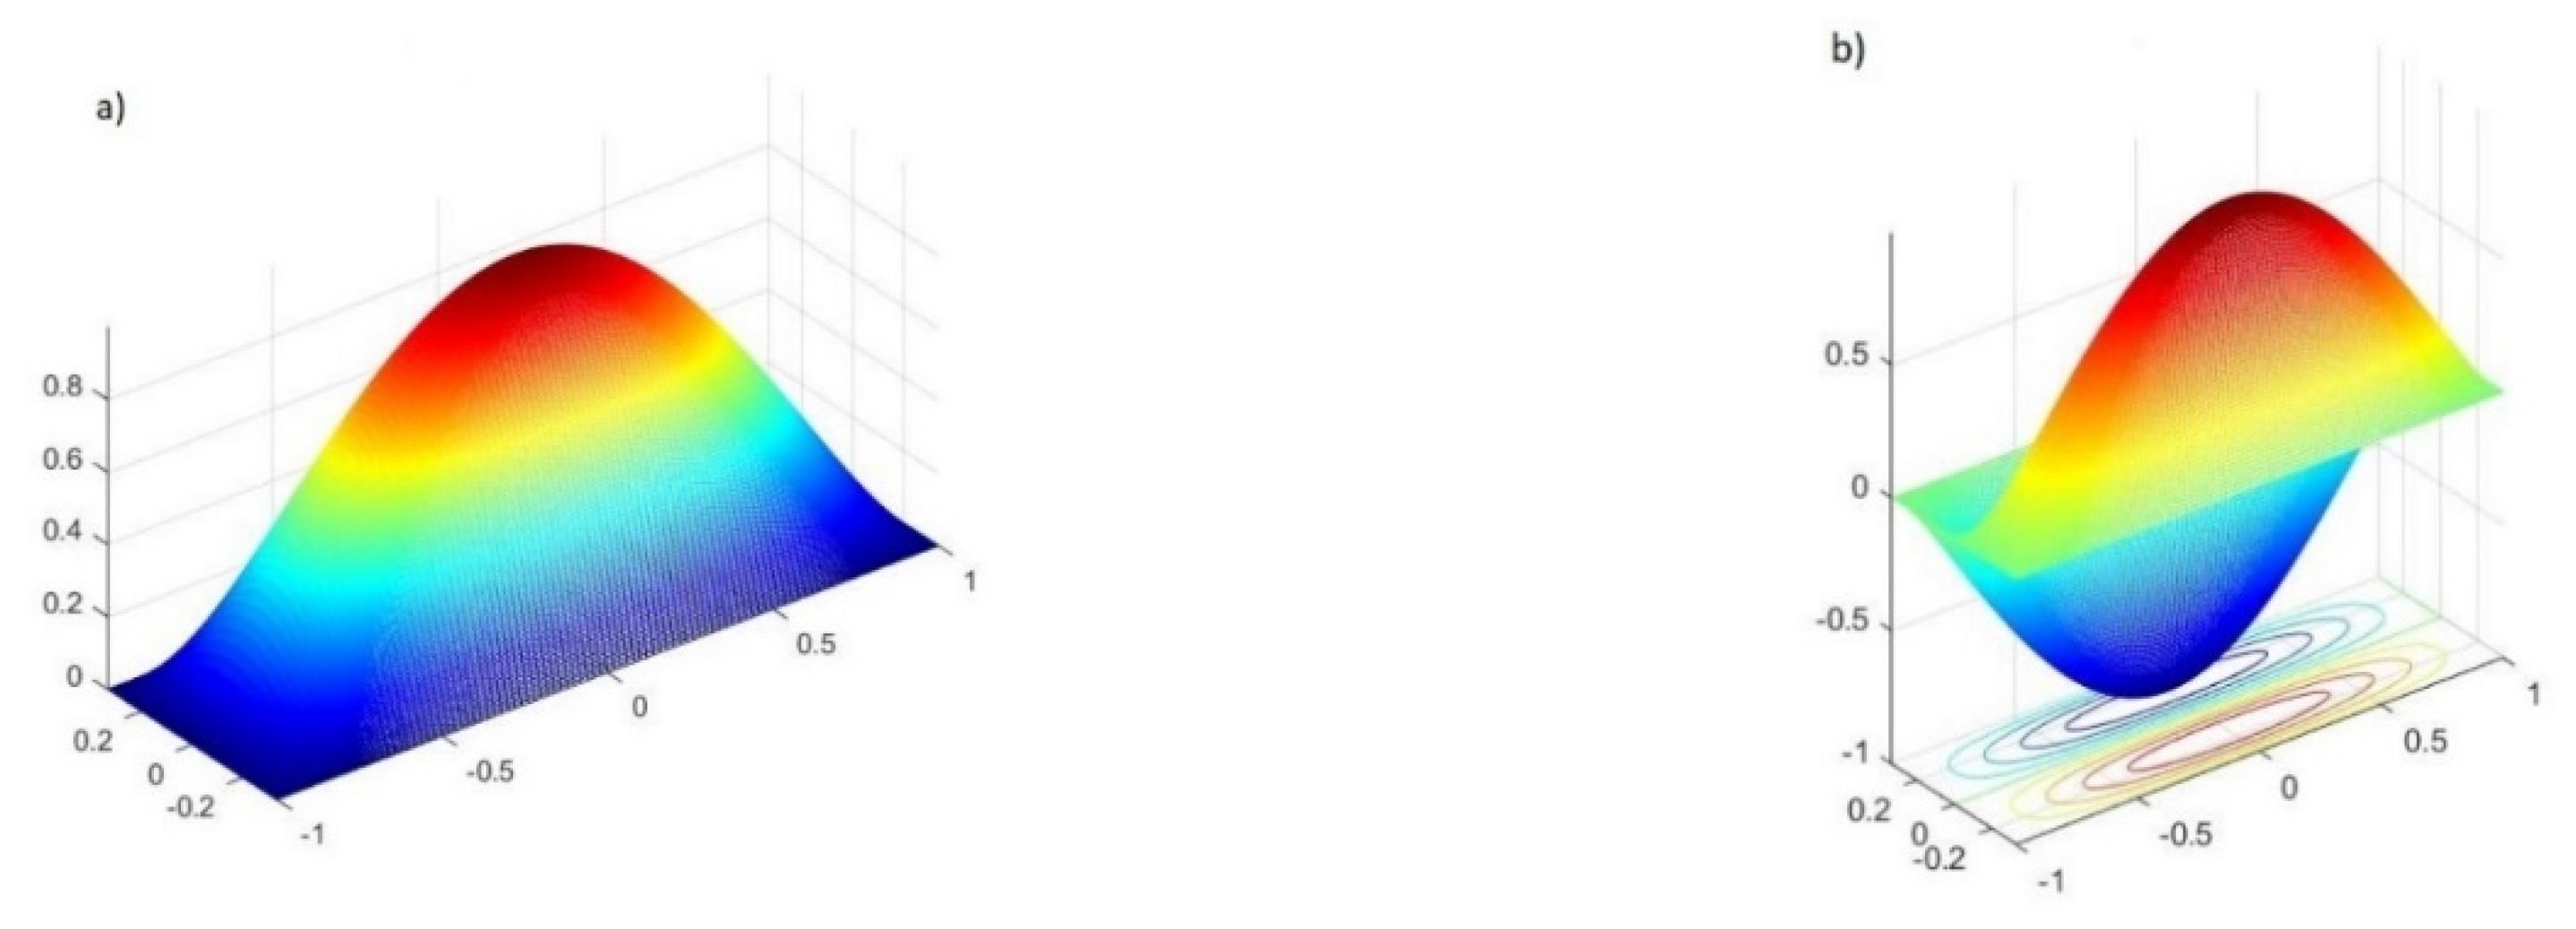
Vibrational modes for the SFG distribution with η = 1 and μ = 0.25: (a) 1st mode, (b) 2nd mode, (c) 4th mode, (d) 5th mode.
Figure 11.
Vibrational modes for the SFG distribution with η = 1 and μ = 0.25: (a) 1st mode, (b) 2nd mode, (c) 4th mode, (d) 5th mode.
Figure 12.
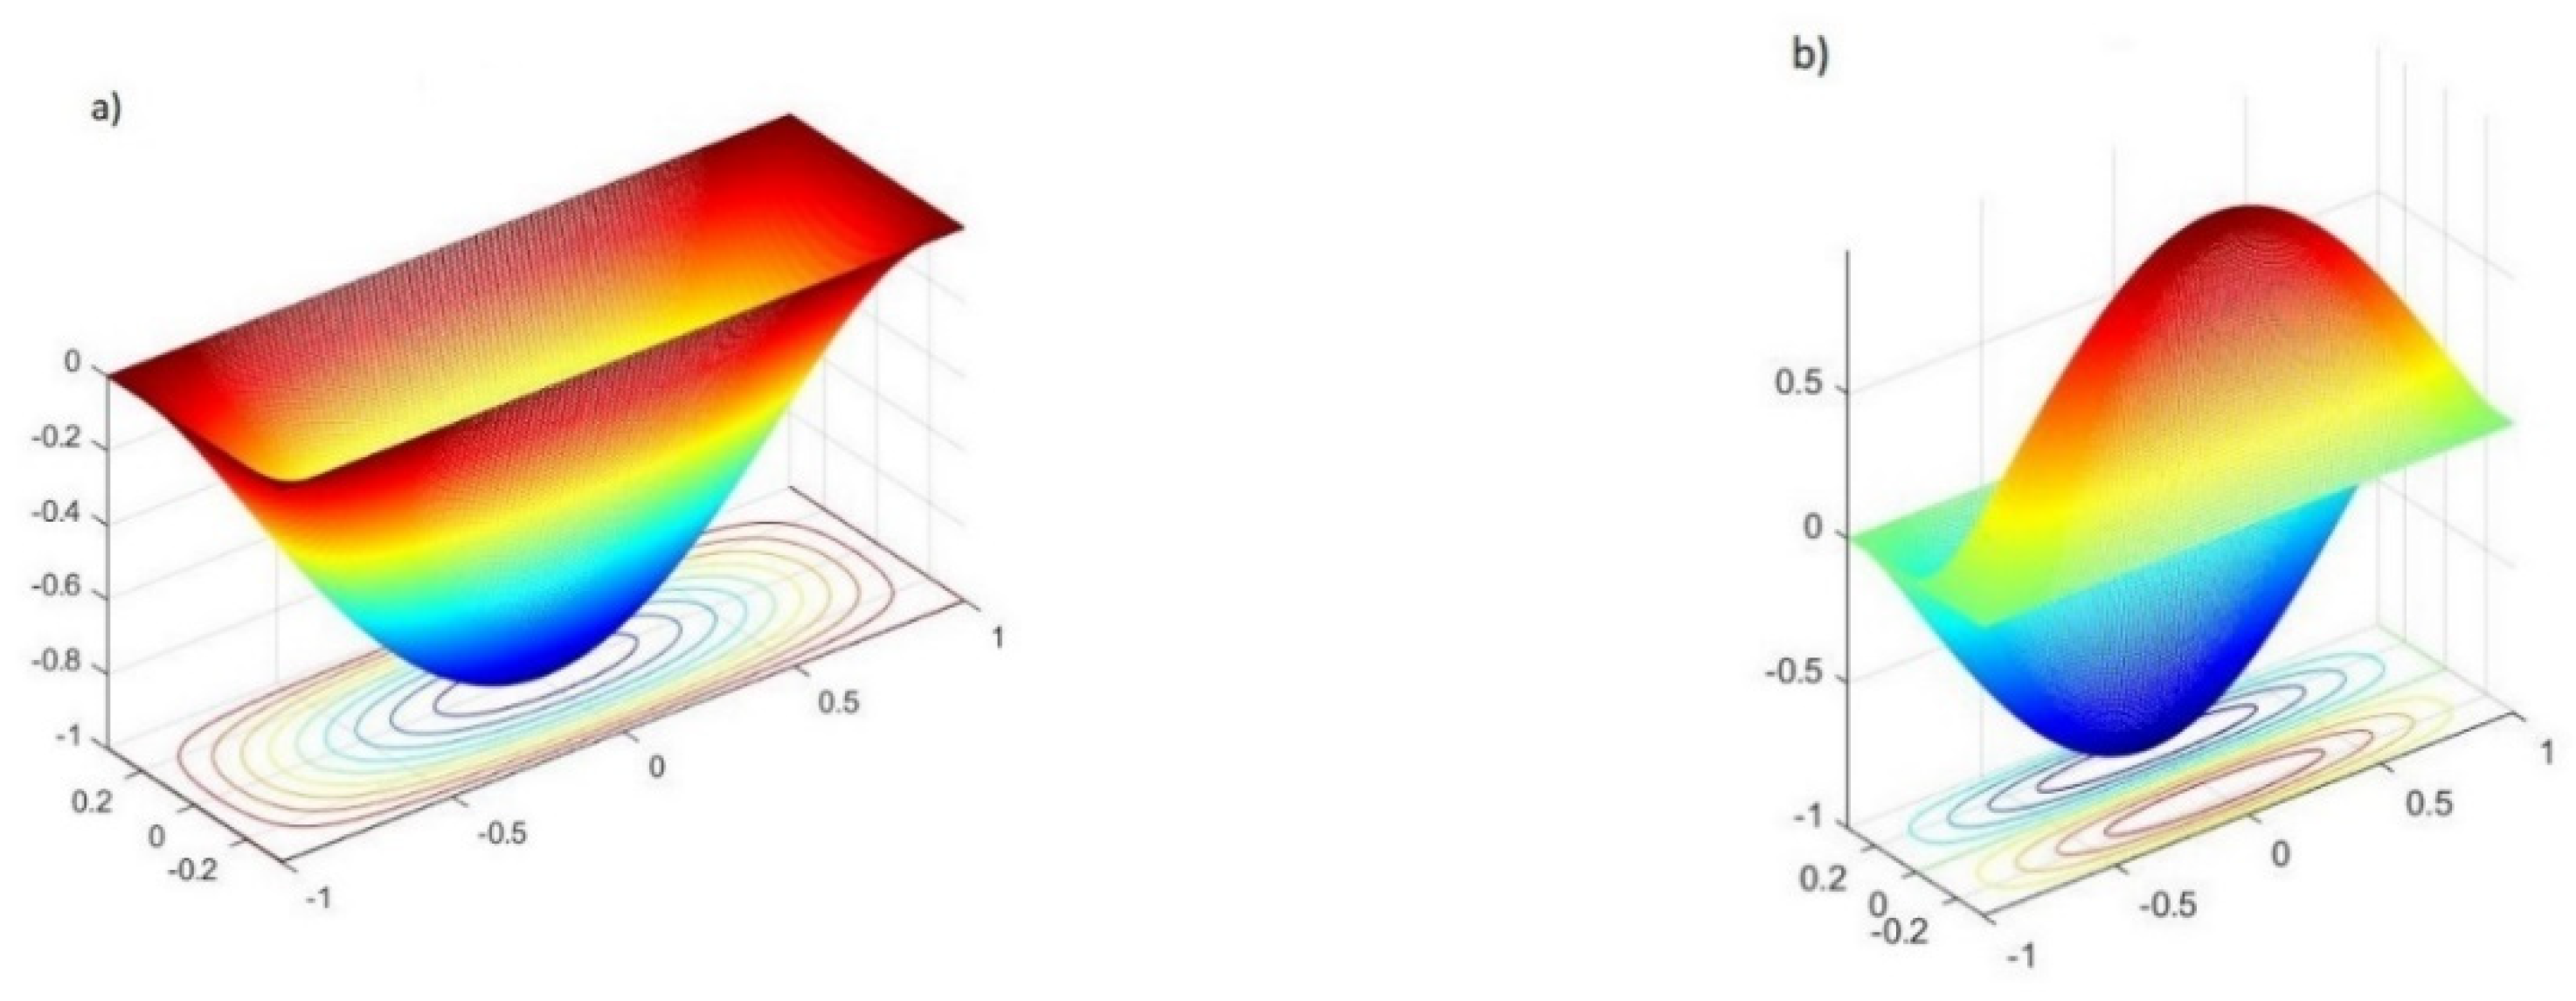
Vibrational modes for the SFG distribution with η = 1 and μ = 0.75: (a) 1st mode, (b) 2nd mode, (c) 4th mode, (d) 5th mode.
Figure 12.
Vibrational modes for the SFG distribution with η = 1 and μ = 0.75: (a) 1st mode, (b) 2nd mode, (c) 4th mode, (d) 5th mode.
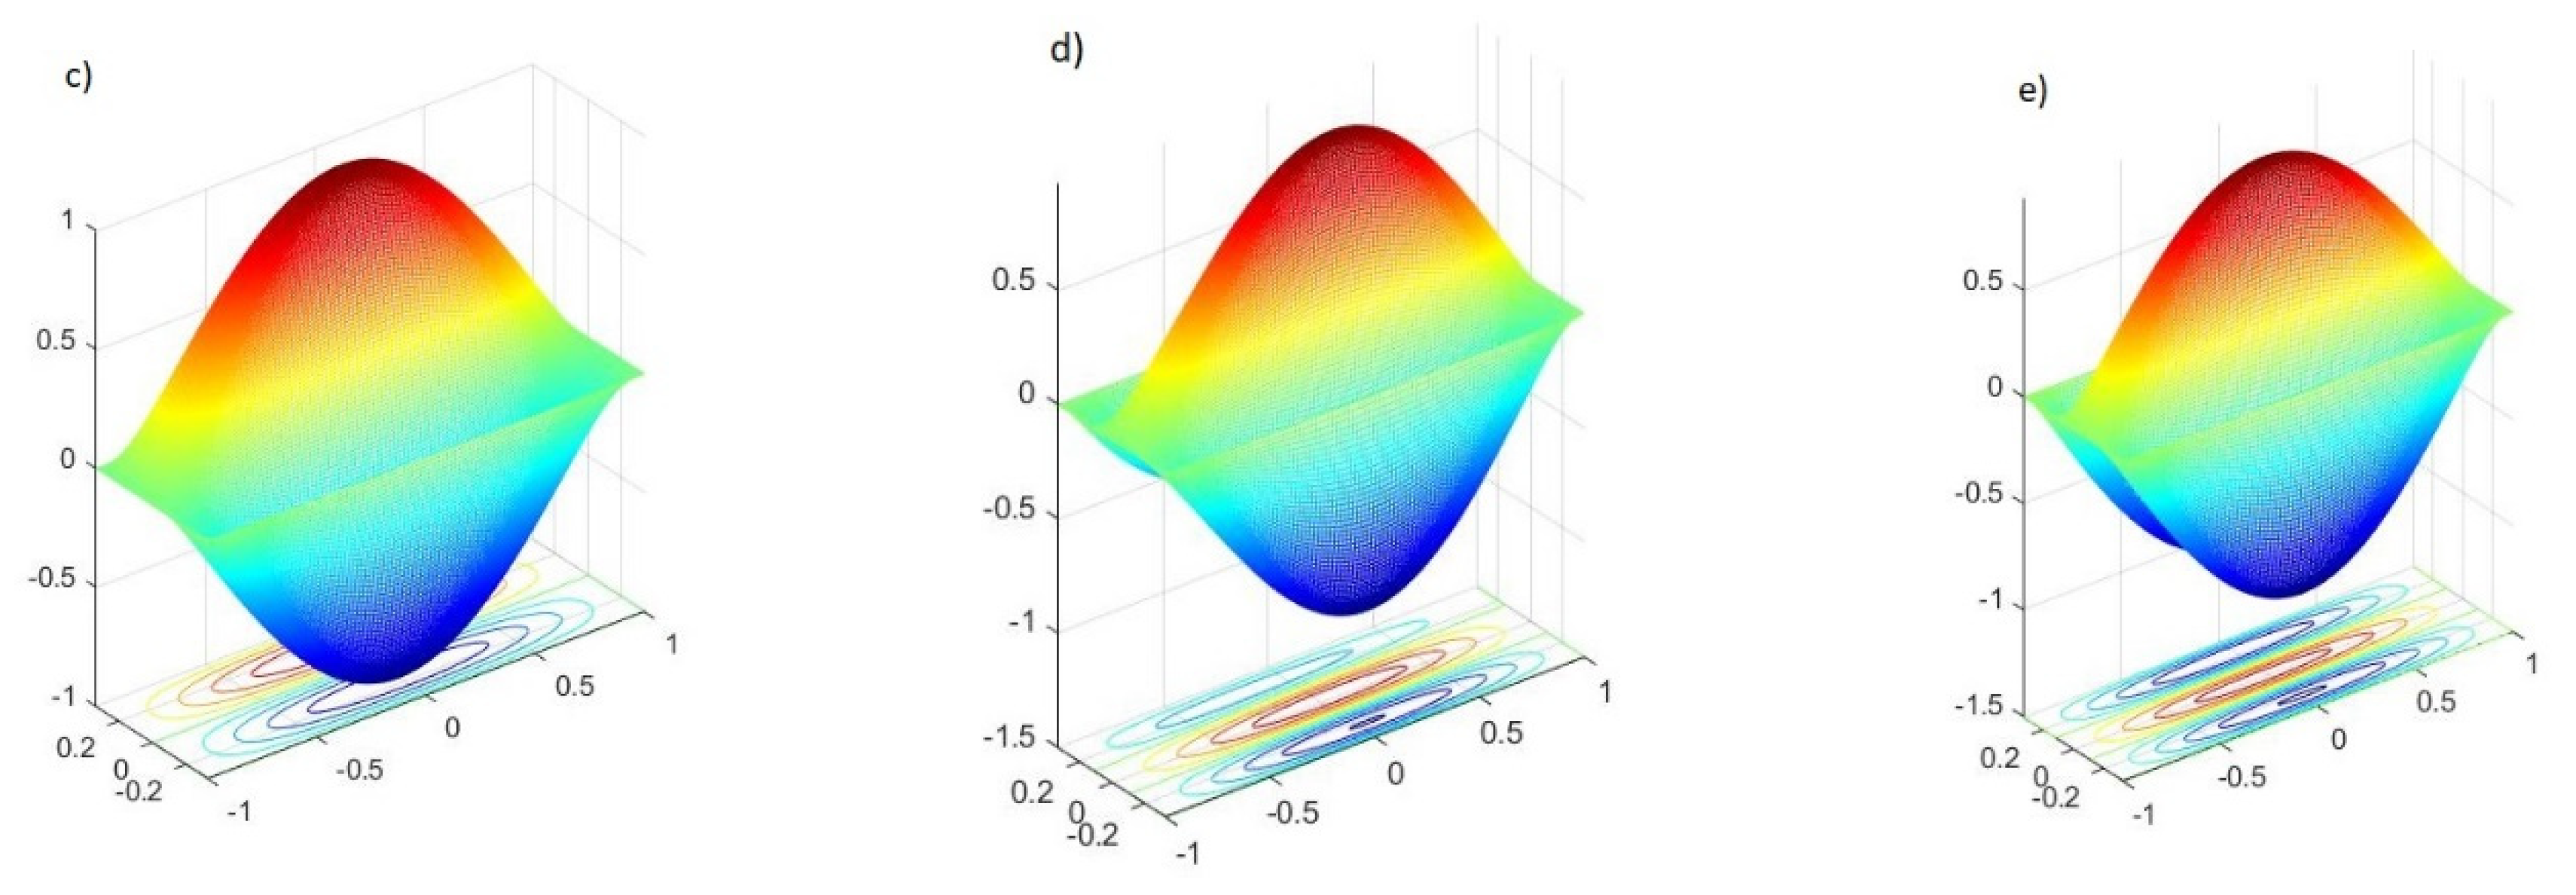
Figure 13.
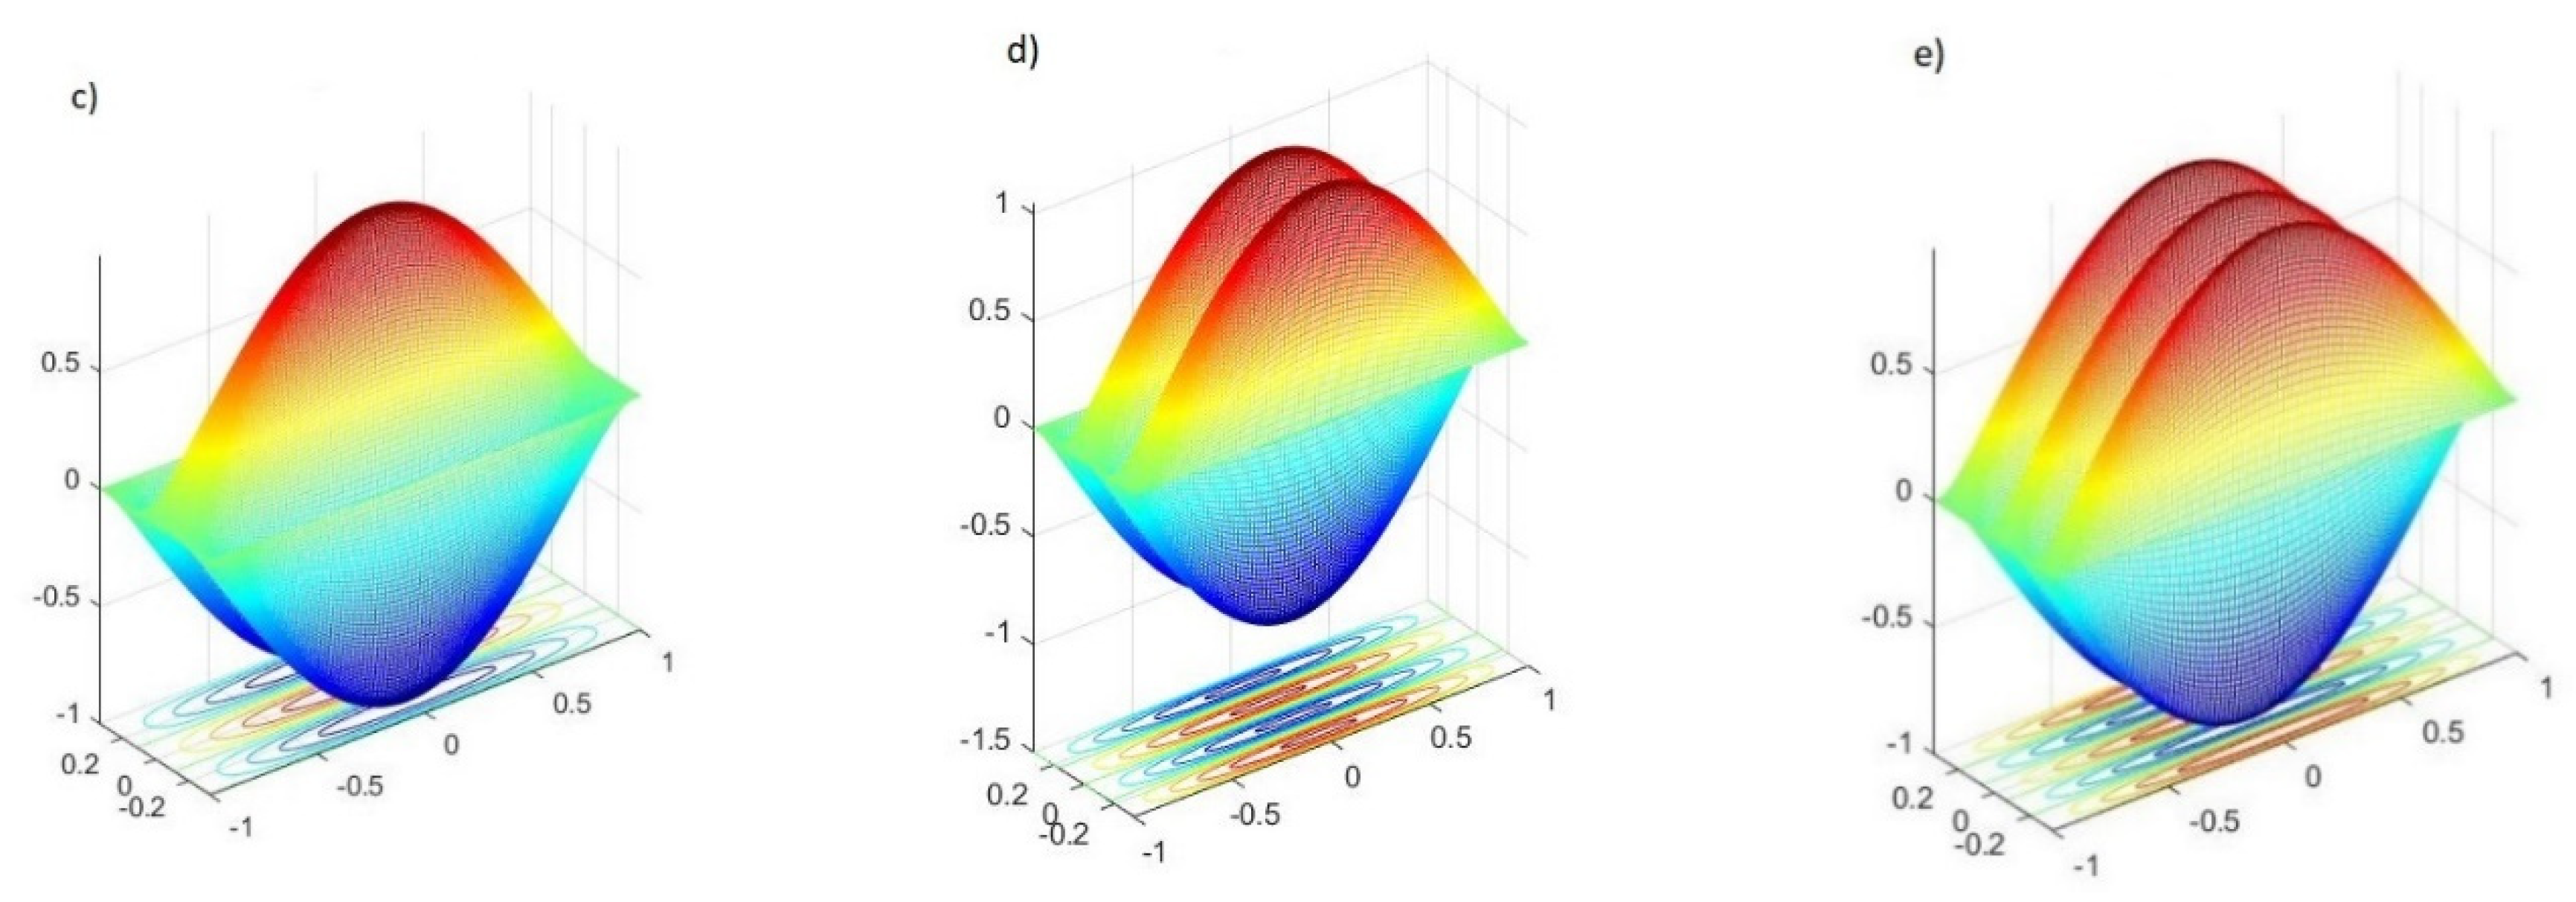
Vibrational modes for the UD distribution without the agglomeration effect: (a) 1st mode, (b) 2nd mode, (c) 3rd mode, (d) 4th mode, (e) 5th mode.
Figure 13.
Vibrational modes for the UD distribution without the agglomeration effect: (a) 1st mode, (b) 2nd mode, (c) 3rd mode, (d) 4th mode, (e) 5th mode.
Figure 14.
Vibrational modes for the USFG distribution without the agglomeration effect: (a) 1st mode, (b) 2nd mode, (c) 3rd mode, (d) 4th mode, (e) 5th mode.
Figure 14.
Vibrational modes for the USFG distribution without the agglomeration effect: (a) 1st mode, (b) 2nd mode, (c) 3rd mode, (d) 4th mode, (e) 5th mode.
Figure 15.
Vibrational modes for the SFG distribution without the agglomeration effect: (a) 1st mode, (b) 2nd mode, (c) 3rd mode, (d) 4th mode, (e) 5th mode.
Figure 15.
Vibrational modes for the SFG distribution without the agglomeration effect: (a) 1st mode, (b) 2nd mode, (c) 3rd mode, (d) 4th mode, (e) 5th mode.
Figure 16.
Vibrational modes for the USFG distribution with η = 1 and μ = 0.25: (a) 1st mode, (b) 2nd mode, (c) 3rd mode, (d) 4th mode, (e) 5th mode.
Figure 16.
Vibrational modes for the USFG distribution with η = 1 and μ = 0.25: (a) 1st mode, (b) 2nd mode, (c) 3rd mode, (d) 4th mode, (e) 5th mode.
Figure 17.
Vibrational modes for the USFG distribution with η = 1 and μ = 0.5: (a) 1st mode, (b) 2nd mode, (c) 3rd mode, (d) 4th mode, (e) 5th mode.
Figure 17.
Vibrational modes for the USFG distribution with η = 1 and μ = 0.5: (a) 1st mode, (b) 2nd mode, (c) 3rd mode, (d) 4th mode, (e) 5th mode.
Table 1.
Properties of the equivalent fibre for SWCNT (10,10) [
10].
Table 1.
Properties of the equivalent fibre for SWCNT (10,10) [
10].
| Equivalent Fibre |
|---|
| Longitudinal elastic modulus (GPa) | 649.12 |
| Transverse elastic modulus (GPa) | 11.27 |
| Transverse shear modulus (GPa) | 5.13 |
| Poisson′s ratio | 0.284 |
| Density (kg/m3) | 1400 |
Table 2.
Hill’s moduli of the SWCNT [
28].
Table 2.
Hill’s moduli of the SWCNT [
28].
| Hill’s Elastic Moduli (GPa) |
|---|
| 271 |
| 88 |
| 17 |
| 1089 |
| 442 |
| Density (kg/m3) | 1400 |
Table 3.
Convergence study for the first natural frequency of a square plate.
Table 3.
Convergence study for the first natural frequency of a square plate.
| Mesh | a/h = 10 | a/h = 100 |
|---|
| Q4 (DOF) | Q9 (DOF) | Analytic Solution | Q4 (DOF) | Q9 (DOF) | Analytic Solution |
|---|
| 5 × 5 | - | 0.9305 (605) | 0.9300 | - | 0.0963 (605) | 0.0963 |
| 10 × 10 | 0.9399 (605) | 0.9303 (2205) | 0.0973 (605) | 0.0963 (2205) |
| 15 × 15 | 0.9346 (1280) | 0.9303 (4805) | 0.0968 (1280) | 0.0963 (4805) |
| 20 × 20 | 0.9327 (2205) | - | 0.0965 (2205) | - |
| 25 × 25 | 0.9318 (3380) | - | 0.0965 (3380) | - |
Table 4.
Convergence analysis using the bi-linear element Q4 and the bi-quadratic element Q9.
Table 4.
Convergence analysis using the bi-linear element Q4 and the bi-quadratic element Q9.
| | Number of Elements | |
|---|
| λ | 15 | 25 | 50 (dev) | 75 | 100 (dev) | Timoshenko beam [5] |
| Q4 |
| 1 | 5.24450 | 5.21481 | 5.20024 (1.994) | 5.19698 | 5.19571 (1.905) | 5.098585 |
| 2 | 8.71002 | 8.59864 | 8.54931 (7.757) | 8.53935 | 8.53566 (7.585) | 7.93386 |
| 3 | 12.21564 | 11.93952 | 11.82283 (13.41) | 11.80034 | 11.79223 (13.11) | 10.42527 |
| Total DOF | 160 | 260 | 510 | 760 | 1010 | |
| λ | Q9 | |
| 1 | 5.19881 | 5.19589 | 5.19410 (1.873) | 5.19371 | 5.19358 (1.863) | 5.098585 |
| 2 | 8.53882 | 8.53377 | 8.53089 (7.525) | 8.53028 | 8.53008 (7.515) | 7.93386 |
| 3 | 11.79418 | 11.78565 | 11.78162 (13.01) | 11.78080 | 11.78055 (13.00) | 10.42527 |
| Total DOF | 465 | 765 | 1515 | 2265 | 3015 | |
Table 5.
Natural frequencies in order of the material distribution and boundary conditions.
Table 5.
Natural frequencies in order of the material distribution and boundary conditions.
| λ | B. C. | Euler-Bernoulli Beam Element [5] | Timoshenko Beam Element [5] |
|---|
| UD | USFG | SFG | UD | USFG | SFG |
|---|
| 1 | C-C | 5.4647 | 5.3708 | 5.7495 | 5.098585 | 5.031699 | 5.294657 |
| 2 | 9.0571 | 8.9005 | 9.5291 | 7.93386 | 7.85222 | 8.167861 |
| 3 | 12.6469 | 12.4262 | 13.3056 | 10.42527 | 10.3392 | 10.66974 |
| 1 | H-H | 3.63 | 3.6182 | 3.8192 | 3.574603 | 3.563695 | 3.748668 |
| 2 | 7.2489 | 7.1216 | 7.6266 | 6.854168 | 6.757675 | 7.133685 |
| 3 | 10.8457 | 10.6722 | 11.4107 | 9.71082 | 9.610907 | 10.02423 |
| 1 | C-F | 2.1672 | 2.13 | 2.2802 | 2.151246 | 2.115347 | 2.259759 |
| 2 | 5.4175 | 5.324 | 5.6998 | 5.167211 | 5.09299 | 5.385917 |
| 3 | 9.0443 | 8.887 | 9.5155 | 8.194459 | 8.096988 | 8.475179 |
| 1 | C-H | 4.5367 | 4.4696 | 4.7731 | 4.356794 | 4.302608 | 4.546786 |
| 2 | 8.1535 | 8.0173 | 8.5784 | 7.426815 | 7.341066 | 7.685675 |
| 3 | 11.7464 | 11.5427 | 12.3583 | 10.08701 | 9.991091 | 10.3645 |
Table 6.
Natural frequencies in order of the material distribution and boundary conditions. Present model with Q9 element.
Table 6.
Natural frequencies in order of the material distribution and boundary conditions. Present model with Q9 element.
| λ | B. C. | Present Model [FSDT] |
|---|
| UD (dev) | USFG (dev) | SFG (dev) |
|---|
| 1 | C-C | 5.19410 (1.873) | 5.23446 (4.030) | 5.41031 (2.184) |
| 2 | 8.53089 (7.525) | 8.59440 (9.452) | 8.87200 (8.621) |
| 3 | 11.78162 (13.01) | 11.86476 (14.75) | 12.23028 (14.63) |
| 1 | H-H | 3.46974 (2.934) | 3.52617 (1.053) | 3.61832 (3.477) |
| 2 | 6.89656 (0.618) | 6.95265 (2.885) | 7.18576 (0.730) |
| 3 | 10.24292 (5.479) | 10.33215 (7.504) | 10.65856 (6.328) |
| 1 | C-F | 2.07402 (3.590) | 2.09119 (1.142) | 2.16316 (4.275) |
| 2 | 5.16153 (0.110) | 5.20323 (2.165) | 5.37898 (0.129) |
| 3 | 8.55821 (4.439) | 8.62481 (6.519) | 8.90793 (5.106) |
| 1 | C-H | 4.32579 (0.712) | 4.36675 (1.491) | 4.50872 (0.837) |
| 2 | 7.72167 (3.970) | 7.78485 (6.045) | 8.03845 (4.590) |
| 3 | 11.02165 (9.266) | 11.10498 (11.15) | 11.45557 (10.53) |
Table 7.
First five natural frequencies for the FG-CNTRC square plate with different distributions without the agglomeration effect.
Table 7.
First five natural frequencies for the FG-CNTRC square plate with different distributions without the agglomeration effect.
| λ | UD | USFG | SFG |
|---|
| Q4 | Q9 | Q4 | Q9 | Q4 | Q9 |
|---|
| 1 | 11.1259 | 11.0975 | 10.2156 | 10.1876 | 13.0043 | 12.9717 |
| 2 | 26.6616 | 26.4300 | 24.0251 | 23.8584 | 30.7728 | 30.5147 |
| 3 | 26.6616 | 26.4300 | 24.3895 | 24.1794 | 30.7728 | 30.5147 |
| 4 | 40.8513 | 40.5000 | 26.0625 | 26.0013 | 46.6761 | 46.2997 |
| 5 | 50.3098 | 49.3144 | 29.7480 | 29.7034 | 57.1369 | 56.0610 |
Table 8.
First five natural frequencies for the UD distribution for three different states of complete agglomeration.
Table 8.
First five natural frequencies for the UD distribution for three different states of complete agglomeration.
| λ | η = 1 μ = 0.25 | η = 1 μ = 0.5 | η = 1 μ = 0.75 |
|---|
| 1 | 7.2119 | 9.8010 | 8.5212 |
| 2 | 17.1866 | 23.3547 | 20.3099 |
| 3 | 17.1866 | 23.3547 | 20.3099 |
| 4 | 26.3491 | 35.8032 | 31.1414 |
| 5 | 32.0929 | 43.6063 | 37.9327 |
Table 9.
First five natural frequencies for the USFG distribution for three different states of complete agglomeration.
Table 9.
First five natural frequencies for the USFG distribution for three different states of complete agglomeration.
| λ | η = 1 μ = 0.25 | η = 1 μ = 0.5 | η = 1 μ = 0.75 |
|---|
| 1 | 6.9518 | 7.9533 | 8.9882 |
| 2 | 16.5096 | 18.8644 | 21.2173 |
| 3 | 16.5822 | 18.9727 | 21.4074 |
| 4 | 16.7036 | 19.5689 | 22.5596 |
| 5 | 19.0766 | 22.3055 | 25.7035 |
Table 10.
First five natural frequencies for the SFG distribution for three different states of complete agglomeration.
Table 10.
First five natural frequencies for the SFG distribution for three different states of complete agglomeration.
| λ | η = 1 μ = 0.25 | η = 1 μ = 0.5 | η = 1 μ = 0.75 |
|---|
| 1 | 7.2801 | 10.6382 | 8.8357 |
| 2 | 17.3136 | 25.1455 | 20.9576 |
| 3 | 17.3136 | 25.1455 | 20.9576 |
| 4 | 26.4997 | 38.2979 | 32.0087 |
| 5 | 32.2457 | 46.4714 | 38.9016 |
Table 11.
First five natural frequencies for the UD distribution for two different states of partial agglomeration.
Table 11.
First five natural frequencies for the UD distribution for two different states of partial agglomeration.
| λ | η = 0.25 μ = 0.5 | η = 0.75 μ = 0.5 |
|---|
| 1 | 10.7993 | 10.6423 |
| 2 | 25.7258 | 25.3509 |
| 3 | 25.7258 | 25.3509 |
| 4 | 39.4283 | 38.8528 |
| 5 | 48.0147 | 47.3131 |
Table 12.
First five natural frequencies for the USFG distribution for two different states of partial agglomeration.
Table 12.
First five natural frequencies for the USFG distribution for two different states of partial agglomeration.
| λ | η = 0.25 μ = 0.5 | η = 0.75 μ = 0.5 |
|---|
| 1 | 9.9679 | 9.8321 |
| 2 | 23.3603 | 23.0535 |
| 3 | 23.6652 | 23.3503 |
| 4 | 25.3939 | 24.9567 |
| 5 | 28.9605 | 28.4688 |
Table 13.
First five natural frequencies for the SFG distribution for two different states of partial agglomeration.
Table 13.
First five natural frequencies for the SFG distribution for two different states of partial agglomeration.
| λ | η = 0.25 μ = 0.5 | η = 0.75 μ = 0.5 |
|---|
| 1 | 12.5694 | 12.2965 |
| 2 | 29.5889 | 28.9567 |
| 3 | 29.5889 | 28.9567 |
| 4 | 44.9194 | 43.9722 |
| 5 | 54.4064 | 53.2675 |
Table 14.
First five natural frequencies for the FG-CNTRC rectangular plate with different distributions without the agglomeration effect.
Table 14.
First five natural frequencies for the FG-CNTRC rectangular plate with different distributions without the agglomeration effect.
| λ | UD | USFG | SFG |
|---|
| 1 | 49.3032 | 29.4880 | 56.0488 |
| 2 | 61.7868 | 45.0712 | 69.7297 |
| 3 | 81.0005 | 56.8115 | 90.5044 |
| 4 | 105.2993 | 74.2900 | 116.3783 |
| 5 | 133.2387 | 76.6857 | 145.6953 |
Table 15.
First five natural frequencies for the UD distribution for three different states of complete agglomeration.
Table 15.
First five natural frequencies for the UD distribution for three different states of complete agglomeration.
| λ | η = 1 μ = 0.25 | η = 1 μ = 0.5 | η = 1 μ = 0.75 |
|---|
| 1 | 32.0856 | 37.9241 | 43.5964 |
| 2 | 40.2250 | 47.5490 | 54.6530 |
| 3 | 52.7614 | 62.3764 | 71.6812 |
| 4 | 68.6291 | 81.1477 | 93.2317 |
| 5 | 86.8894 | 102.7540 | 118.0290 |
Table 16.
First five natural frequencies for the USFG distribution for three different states of complete agglomeration.
Table 16.
First five natural frequencies for the USFG distribution for three different states of complete agglomeration.
| λ | η = 1 μ = 0.25 | η = 1 μ = 0.5 | η = 1 μ = 0.75 |
|---|
| 1 | 19.0417 | 22.2483 | 25.5956 |
| 2 | 31.0008 | 35.5023 | 40.0258 |
| 3 | 38.8980 | 44.6043 | 50.3604 |
| 4 | 49.8835 | 58.2905 | 65.8665 |
| 5 | 50.4338 | 58.3212 | 66.9380 |
Table 17.
First five natural frequencies for the SFG distribution for three different states of complete agglomeration.
Table 17.
First five natural frequencies for the SFG distribution for three different states of complete agglomeration.
| λ | η = 1 μ = 0.25 | η = 1 μ = 0.5 | η = 1 μ = 0.75 |
|---|
| 1 | 32.2384 | 38.8929 | 46.4611 |
| 2 | 40.3660 | 48.6204 | 57.9616 |
| 3 | 52.8553 | 63.5232 | 75.5133 |
| 4 | 68.6205 | 82.2699 | 97.4962 |
| 5 | 86.7151 | 103.7140 | 122.5369 |
Table 18.
First five natural frequencies for the UD distribution for two different states of partial agglomeration.
Table 18.
First five natural frequencies for the UD distribution for two different states of partial agglomeration.
| λ | η = 0.25 μ = 0.5 | η = 0.75 μ = 0.5 |
|---|
| 1 | 48.0037 | 47.3023 |
| 2 | 60.1669 | 59.2865 |
| 3 | 78.8925 | 77.7359 |
| 4 | 102.5815 | 101.0744 |
| 5 | 129.8282 | 127.9167 |
Table 19.
First five natural frequencies for the USFG distribution for two different states of partial agglomeration.
Table 19.
First five natural frequencies for the USFG distribution for two different states of partial agglomeration.
| λ | η = 0.25 μ = 0.5 | η = 0.75 μ = 0.5 |
|---|
| 1 | 28.7626 | 28.2805 |
| 2 | 44.1295 | 43.5517 |
| 3 | 55.6138 | 54.8666 |
| 4 | 72.7059 | 71.7045 |
| 5 | 74.9295 | 73.6747 |
Table 20.
First five natural frequencies for the SFG distribution for two different states of partial agglomeration.
Table 20.
First five natural frequencies for the SFG distribution for two different states of partial agglomeration.
| λ | η = 0.25 μ = 0.5 | η = 0.75 μ = 0.5 |
|---|
| 1 | 54.3945 | 53.2559 |
| 2 | 67.6982 | 66.2947 |
| 3 | 87.9146 | 86.1159 |
| 4 | 113.1130 | 110.8318 |
| 5 | 141.6856 | 138.8681 |
Table 21.
Summary of the agglomeration effect in the natural modes′ shapes of the quadrilateral plates.
Table 21.
Summary of the agglomeration effect in the natural modes′ shapes of the quadrilateral plates.
| Square Plate |
| CNTs′ distribution | η = 1 | μ = 0.5 |
| μ = 0.25 | μ = 0.5 | μ = 0.75 | η = 0.25 | η = 0.75 |
| UD | - | - | - | - | - |
| USFG | - | - | - | - | - |
| SFG | 5th | 5th | 5th | - | - |
| Rectangular Plate |
| CNTs′ distribution | η = 1 | μ = 0.5 |
| μ = 0.25 | μ = 0.5 | μ = 0.75 | η = 0.25 | η = 0.75 |
| UD | - | - | - | - | - |
| USFG | 4th, 5th | 5th | - | - | - |
| SFG | - | - | - | - | - |
