Article

Electrostatic Adsorption of Platinum onto Carbon Nanotubes and Nanofibers for Nanoparticle Synthesis

by
Ritubarna Banerjee
,
Jose L. Contreras-Mora
,
Susan K. McQuiston
,
Brandon Bolton
,
Bahareh Alsadat Tavakoli Mehrabadi
and
John R. Regalbuto
*
Department of Chemical Engineering, University of South Carolina, Columbia, SC 29208, USA
*
Author to whom correspondence should be addressed.
Submission received: 1 December 2017 / Revised: 24 January 2018 / Accepted: 27 January 2018 / Published: 11 February 2018
(This article belongs to the Special Issue Smart Carbon Materials in Catalysis)

Abstract

:
Strong Electrostatic Adsorption (SEA) has been demonstrated as a simple, scientific method to prepare well dispersed Pt nanoparticles over typical forms of carbon: activated, black, and graphitic carbons. Many varieties of specialty carbons have been invented in the last few decades including multi-walled nanotubes, nanofibers, graphene nanoplatelets, etc. In this work, we explore whether SEA can be applied to these specialty carbons for the synthesis of Pt nanoparticles. Over a number of oxidized and unoxidized multiwalled nanotubes and nanofibers, the point of zero charge (PZC) was measured and the uptake of anionic Pt complexes (Pt hexachloride, [PtCl6]2−, and cationic Pt complexes (platinum tetraammine, [Pt(NH3)4]2+) as functions of final pH were surveyed. Pt nanoparticles on the various supports were synthesized at the optimal pH and were characterized by x-ray diffraction (XRD) and scanning transmission electron microscopy (STEM). The specialty carbons displayed volcano-shaped uptake curves typical of electrostatic adsorption for both Pt anions at low pH and Pt cations at high pH. However, the regimes of uptake often did not correspond to the measured PZC, probably due to surface impurities from the carbon manufacturing process. This renders the measured PZC of these specialty carbons unreliable for predicting anion and cation uptake. On the other hand, the anion and cation uptake curves provide an “effective” PZC and do indicate the optimal pH for the synthesis of ultrasmall nanoparticle synthesis. High resolution STEM imaging also showed that with SEA it is possible to disperse nanoparticles on the surface as well as the inner walls of the specialty carbons.

Graphical Abstract

1. Introduction

Carbon materials in the form of nanofibers and nanotubes have great potential as catalyst supports owing to their high specific surface area, mechanical strength, and flexibility [1,2,3] and have been increasingly used as such [4]. A survey of Pt nanoparticle synthesis on these newer forms of carbon over the last three years turns up the two dozen papers listed in Table 1. The most common method of preparation involves reductive deposition of soluble Pt precursors using ethylene glycol or sodium borohydride as the reducing agent [5,6,7,8,9,10,11,12,13,14,15,16]. These methods generally produce particles around 3–5 nm in diameter. Colloidal syntheses involving polyol stabilizing agents, with subsequent removal of the ligands and reduction of the metal, are able to synthesize somewhat smaller Pt nanoparticles (1.7–4 nm) [17,18,19,20]. A host of other methods including as simple as incipient wetness and as complicated as radio frequency magnetron sputtering, have also yielded nanoparticles in the range of 2–5 nm [21,22,23,24,25,26,27], with the smallest stemming from electrodeposition (1.5 nm) [26], and atomic layer deposition (2 nm) [22].
With the exception of incipient wetness [23] (which yields 4.9 nm particles) these methods are somewhat complex and involve an abundance of chemical ingredients. A potentially simpler method yielding even smaller nanoparticles is Strong Electrostatic Adsorption (SEA), in which metal precursors are strongly adsorbed over support surfaces by controlling the pH of the impregnation solution and exploiting the chemistry of the nascent surface hydroxyl groups [28,29,30]. Via SEA, average nanoparticle size is normally between 1 and 2 nm. Systematic studies of electrostatic adsorption have been made of more common carbons: amorphous activated carbon and carbon black [29,31], graphitic carbon [29] as well as amorphous carbon xerogels [30]. These materials have been demonstrated to adsorb anionic Pt chloride complexes such as Pt (IV) hexachloride (PHC), [PtCl6]2−, and cationic complexes such as Pt (II) tetraammine (PTA), [(NH3)4Pt]2+, predominantly via electrostatic adsorption, with commensurate small nanoparticle size.
In this paper, a systematic study of SEA is made over “uncommon” or “specialty” carbons: multiwalled nanotubes and nanofibers. An early indication from the literature demonstrates that electrostatic adsorption can be successfully used to synthesize palladium nanoparticles around 1 nm on carbon nanotubes [32]. In that work, all the nanotubes were oxidized in nitric acid or mixtures of nitric acid and sulfuric acid to introduce varying degrees of oxygen functionalities and make the surfaces more hydrophilic, and Pd was adsorbed as cationic tetraammine complexes.
According to our prior studies of SEA with carbon, surface oxidation is not needed for the adsorption of anions (and is in fact deleterious to it [29]) as pi bonds in aromatic rings can be protonated, while surface oxidation, which imparts acid surface groups and renders deprotonation and negative charge at high solution pH) is needed for the uptake of cations [29,30,31]. With a variety of specialty carbons, comprised of multi-walled carbon nanotubes and nanofibers with varying surface functional groups and orientation of graphene sheets, we demonstrate that SEA can indeed be extended for anionic and cationic metal precursor adsorption over carbons of all types. A caveat with specialty carbons, however, is that many contain surface impurities which render the measured point of zero charge (PZC) meaningless; effective PZCs must be surmised from metal anion and cation uptake and cannot be measured directly from pH shifts.

2. Results and Discussion

The types and pretreatments of the specialty carbons used in this study are listed in Table 2. One multi-walled carbon nanotube (MWCNT), obtained from Sigma-Aldrich (St. Louis, MO, USA), had an as-received surface area of 301 m2/g and a PZC of 5.4. After oxidation in concentrated nitric acid, the surface area remained essentially constant and the PZC dropped to 2.7. These two samples are referred to as MWCNT I and MWCNT I Oxd. A second set of MWCNTs were purchased from Nanostructured and Amorphous Materials, Inc. (Los Alamos, NW, USA). The first had a PZC of 9.3 and surface area of 302 m2/g (MWCNT II), the second was a version oxidized mildly with a PZC of 5.9 and surface area 558 m2/g (MWCNT II OH, to connote the manufacturer’s attempt to add only hydroxyl groups to the surface), while the third was more rigorously oxidized (and thus connoted with carboxylic acid groups as MWCNT II COOH) which had surface area of 416 m2/g and a PZC of 3.1 A final sample was a herring-bone hollow nanofibers (HB nanofibers) which had surface area of 54 m2/g and a PZC of 5.4.
X-ray photoelectron spectroscopy (XPS) analysis of these samples is given in Figure 1; in the survey scans of Figure 1a, the only spectrum which contains more than carbon and oxygen is that for the MWCNT II sample. This sample is known to contain significant amounts of metal catalyst impurity (up to 13,000 ppm from the manufacturer’s literature); this is seen in the small peaks near 780 eV which correspond to Co 2p electrons. The two oxidation treatments used by the manufacturer appear to remove the metal (Figure 1a, upper two spectra). The O 1s peaks for these samples are shown in Figure 1b. The sample containing the least amount of oxygen is MWCNT I, and the increase in the oxygen signal associated with acidic groups upon oxidation is evident. Curiously, though, the PZC of the unoxidized, as received MWCNT I sample is 5.4, much lower than the PZC of pure, unoxidized carbon, which is about 9 [29,30,31]. Low levels of anionic impurities have been shown to dramatically decrease PZC values [31]; it would appear to be the case here that some impurity from the nanotube manufacturing process, below the limit of XPS detection, is affecting the PZC. The HB nanofibers appear to possess acidic oxygen groups straight from the manufacturer, as evidenced by an acidic oxygen XPS signature (third spectrum from the bottom) as well as a low measured PZC (5.4). The oxygen signature of the unoxidized MWCNT II sample is significantly different from the others, being skewed to lower binding energy; this is likely from the oxide of the impurity cobalt (cobalt oxide). The PZC of supported cobalt oxide is around 9 and is consistent with the measured PZC of the sample. The other two MWCNT II samples, MWCNT II OH, and MWCNT II COOH, show moderate and higher degrees of the acidic oxygen as the PZC drops to 5.9 and 3.1 with no impurity Co seen by XPS.

2.1. Pt Precursor Adsorption

The electrostatic adsorption behavior of these carbon materials can be compared with that of “typical” carbons [29,30,31]. In those materials, it was the PZC of the material and not the type of carbon—activated, graphitic, or black which determined uptake behavior. High PZC carbons did not adsorb cations at high pH, as they have no surface functional groups capable of deprotonating and becoming negatively charged [29,33]. The lower the PZC, corresponding to increasing density of surface acid groups which can be deprotonated at high pH, the more cationic Pt precursors were adsorbed. On the other hand, anionic complexes can adsorb over unoxidized carbon surfaces at low pH by virtue of protonated pi bonds [29], and as this pristine surface is successively oxidized, less anions adsorb but more cations adsorb [29,33,34,35].
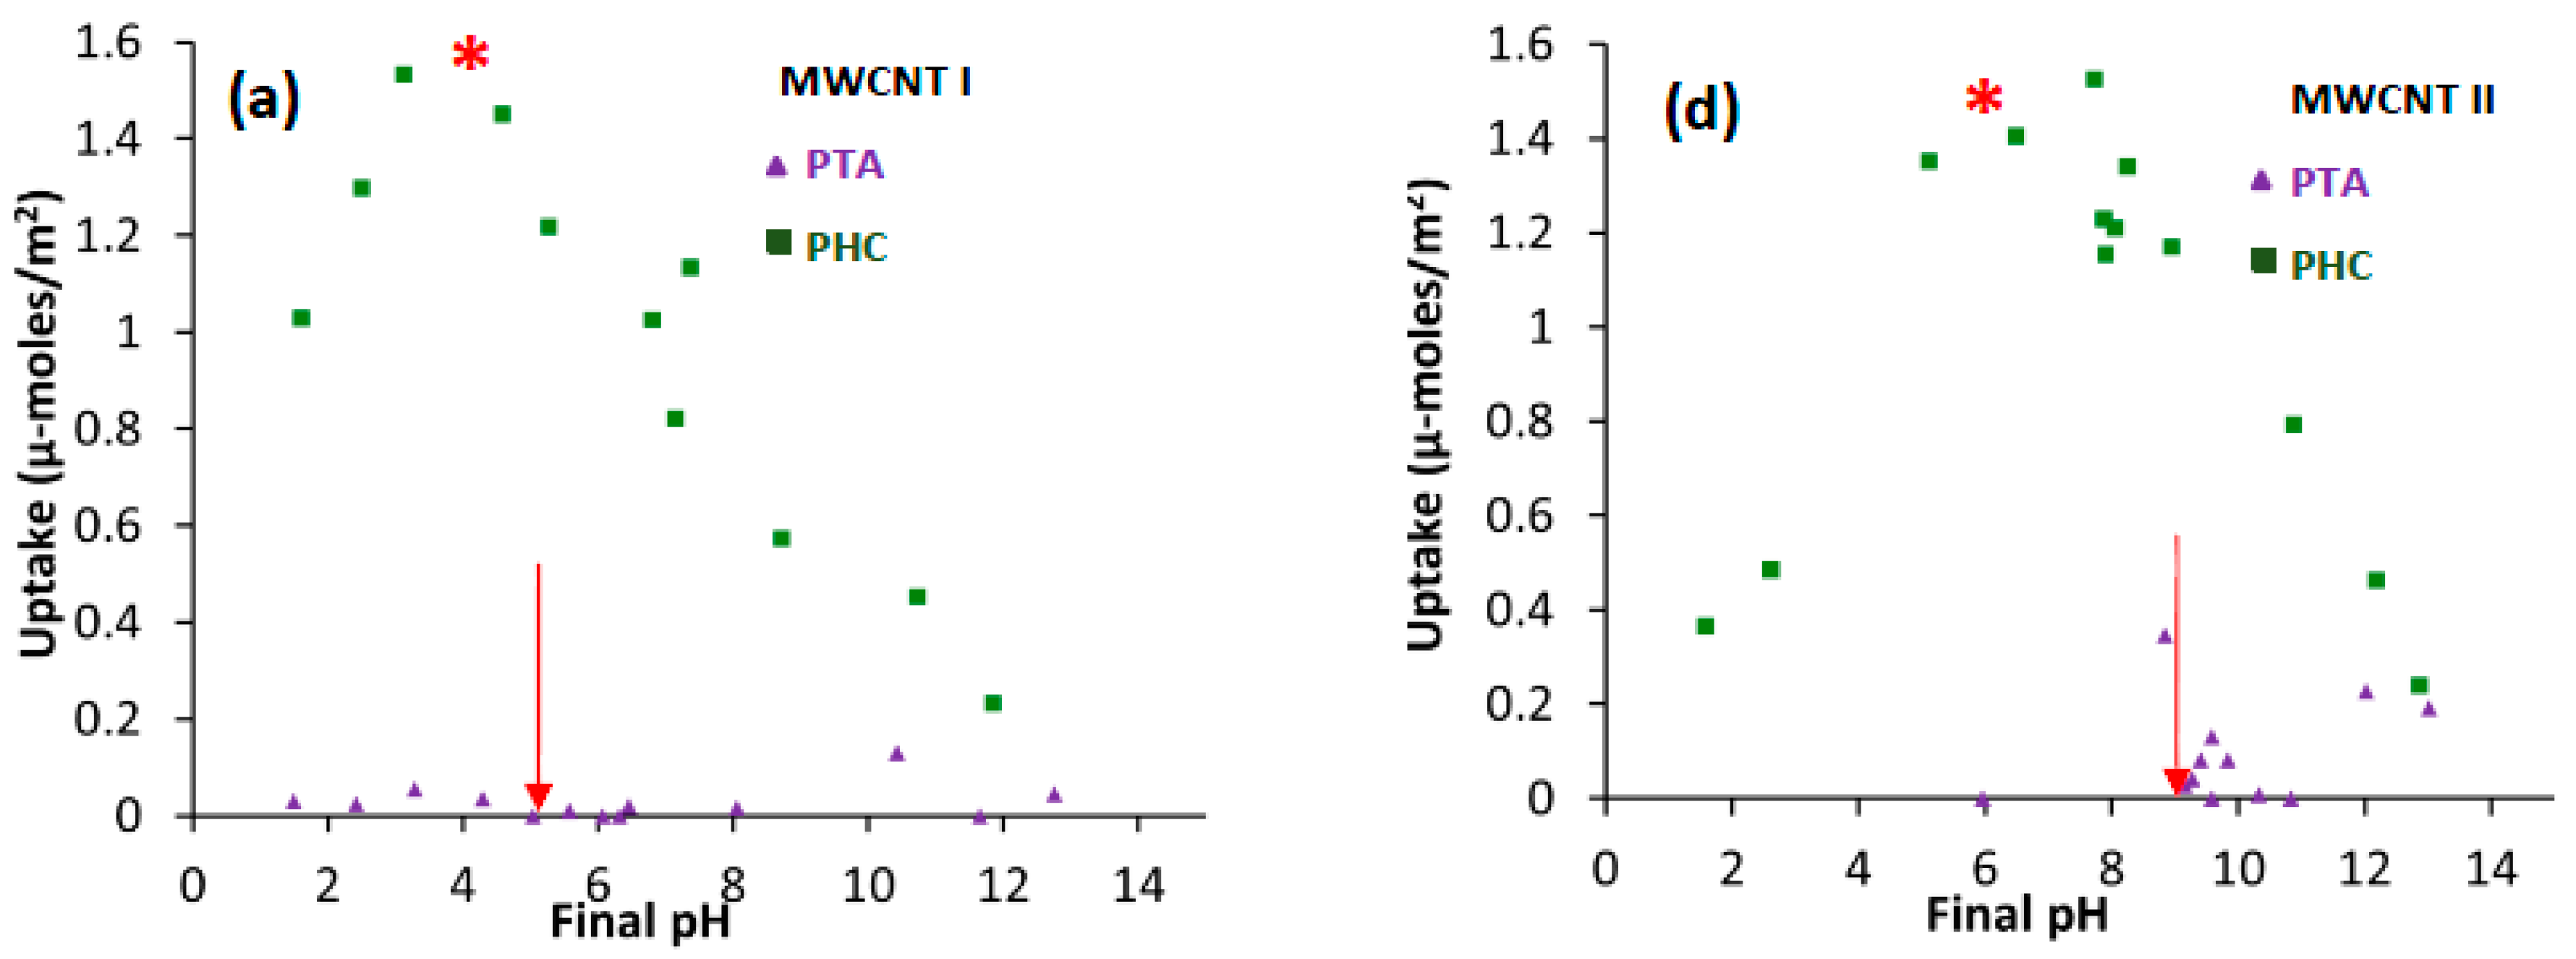
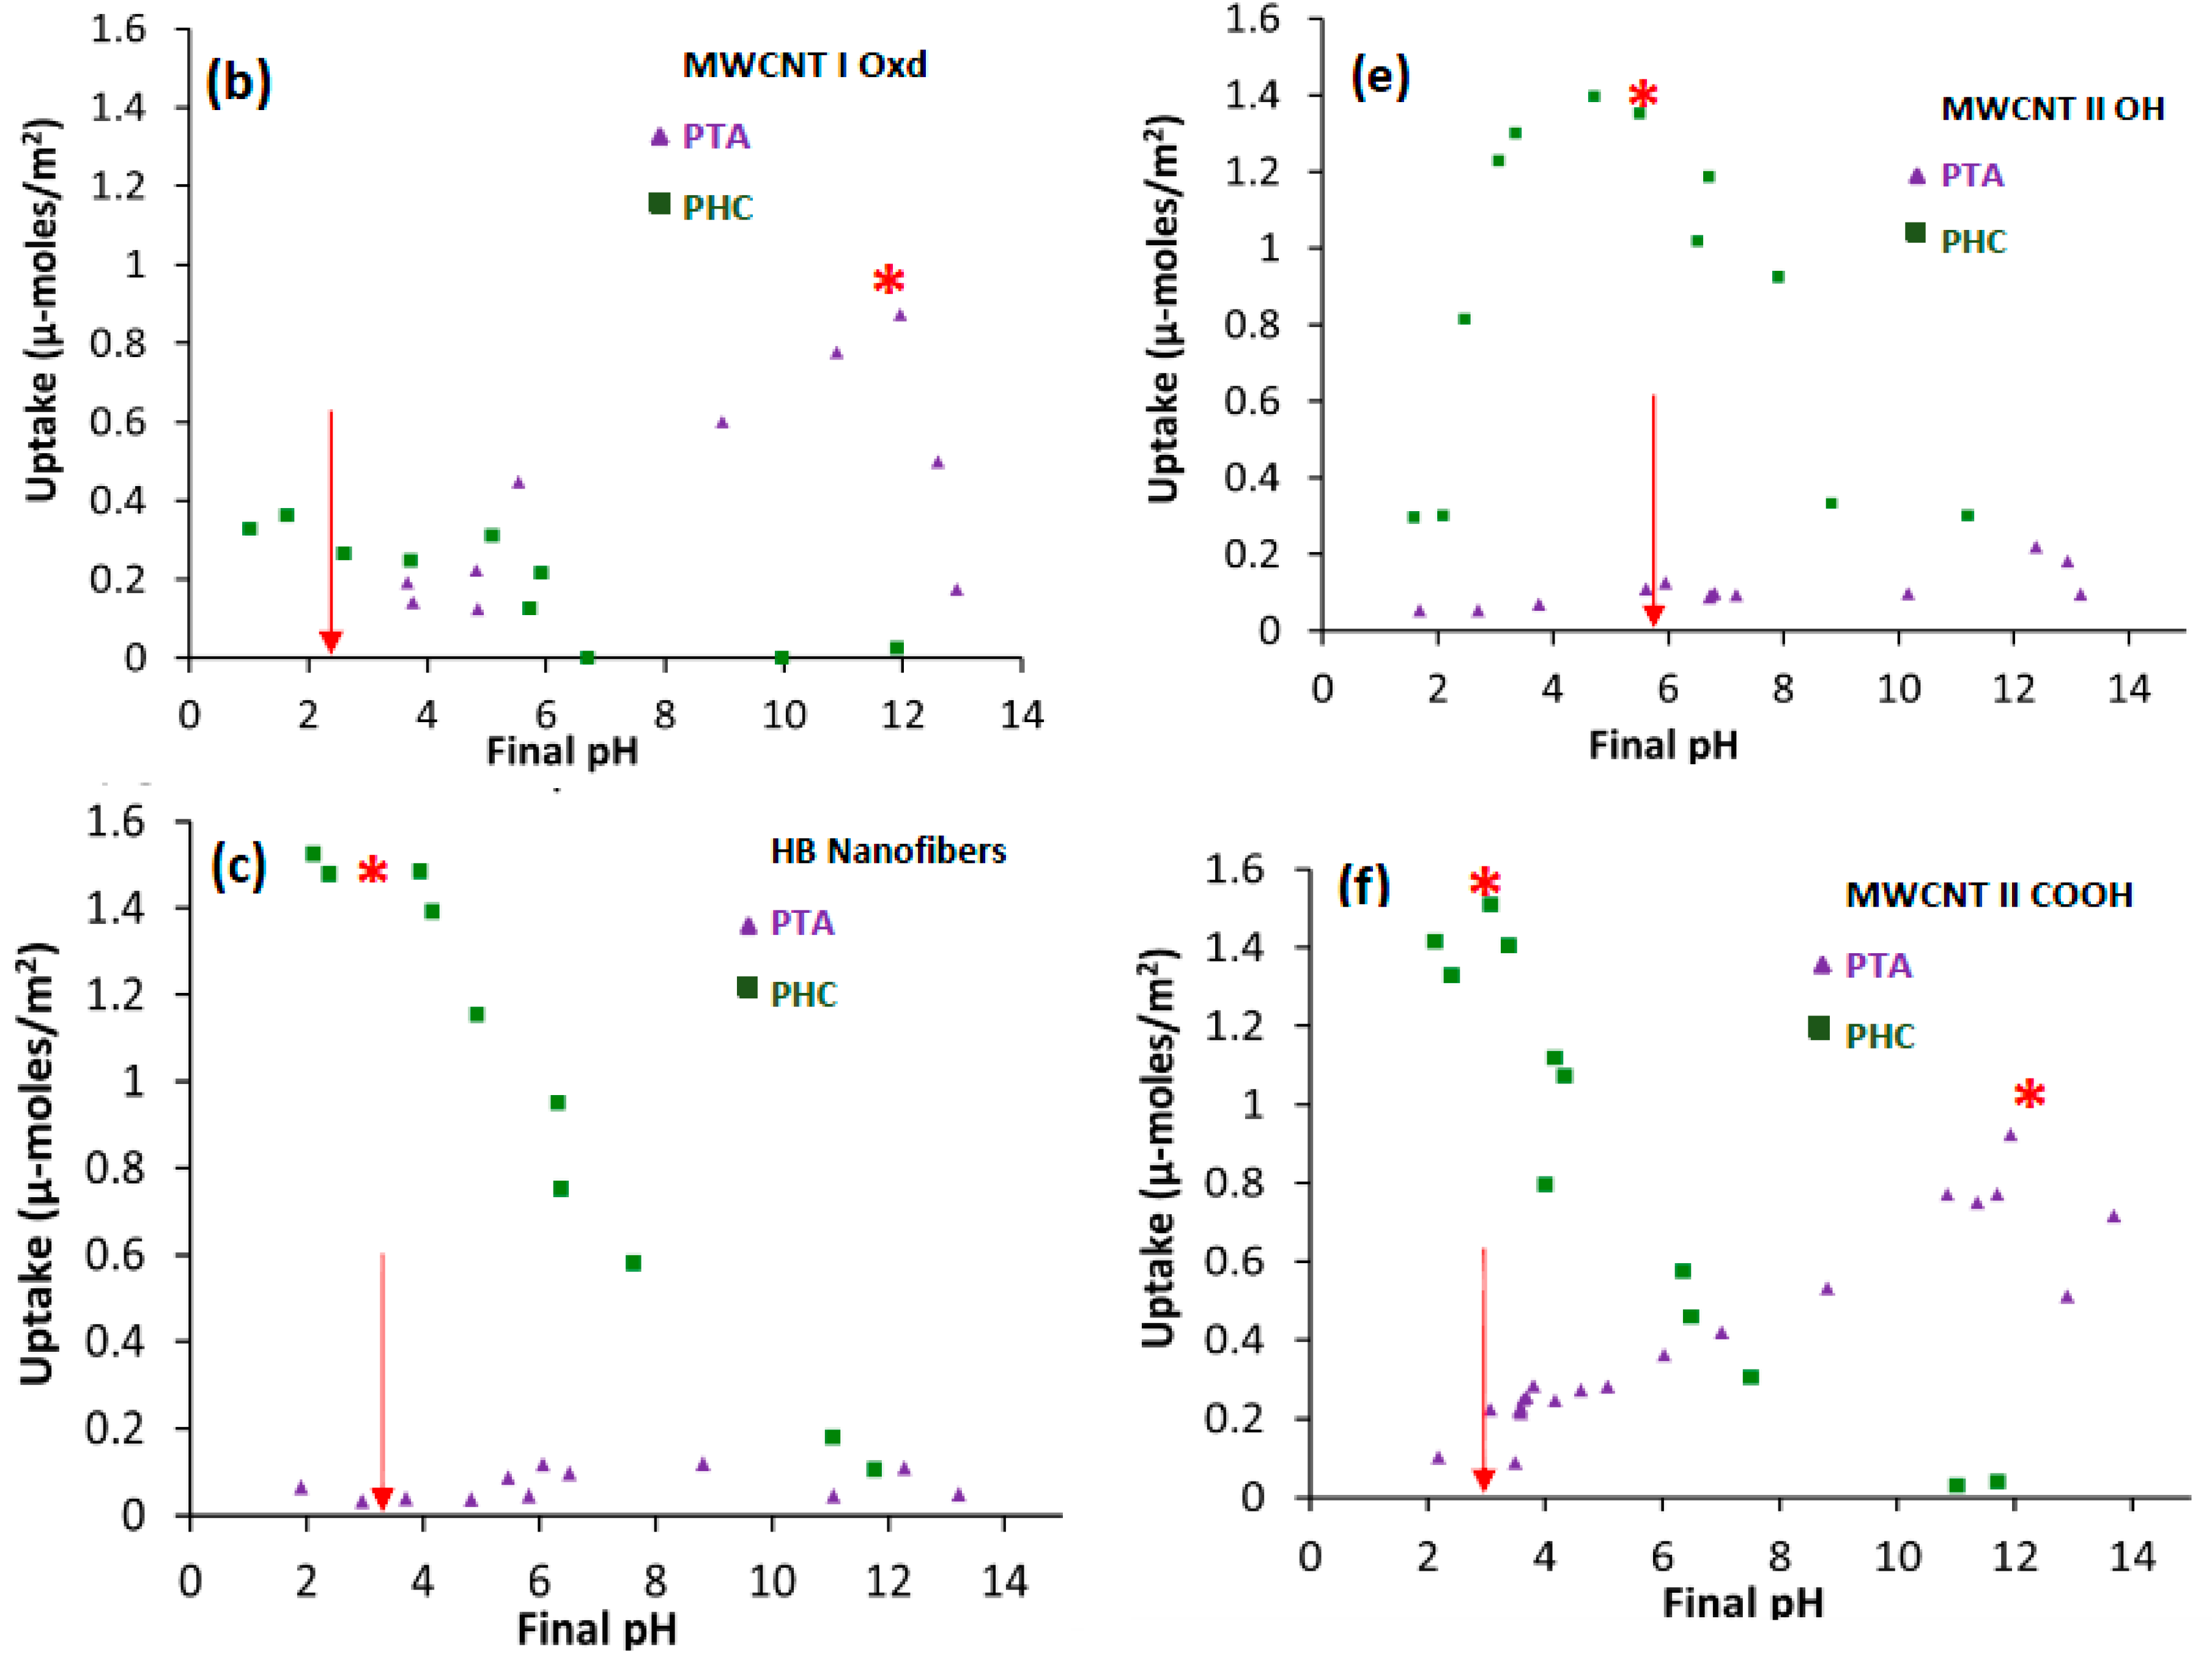
Figure 2 presents surveys of uptake versus pH over all the specialty carbon supports for anionic Pt hexammine, [PtCl6]2−, and cationic Pt tetraammine [(NH3)4Pt]2+ complexes. The MWCNT I material in Figure 2a adsorbs anionic Pt over a wide pH range and does not significantly adsorb cationic Pt. It behaves as a high PZC carbon, despite its measured PZC of 5.4 (arrow in Figure 2a). As mentioned above, this sample contains no surface oxygen and it is likely that the low PZC of the sample results from an anionic surface impurity from the manufacturing process. (While ionic surface impurities such as Cl and Na+ do affect the PZC, they do not affect the uptake [31]). The oxidized MWCNT I Oxd sample, with a PZC of 2.7, does behave as a low PZC carbon (Figure 2b), with high cation and low anion uptake. The maximum surface densities of about 1.6 μmol/m2 for the anions and 0.9 μmol/m2 for the cations, are as expected and correspond to a close packed layer of complexes retaining one and two hydration sheaths respectively [29,34,35].
The three MWCNT II materials are shown on the right hand side of the figure (Figure 2d–f). The unoxidized sample (MWCNT II, Figure 2d) contains the large amount of cobalt oxide impurity, the second sample is mildly oxidized (II-OH, Figure 2e), and the third is harshly oxidized (II-COOH, Figure 2f). The latter two contain no observable cobalt impurity. The harshly oxidized, low PZC (3.1) carbon in Figure 2f behaves largely as expected, with the ability to adsorb high amounts of Pt tetraammine cations, though the capacity to adsorb Pt hexachloride anions is lessened only slightly. The mildly oxidized sample in Figure 2e behaves almost as if it were not oxidized, with little ability to adsorb cations and full capacity to adsorb anions. The behavior of this sample and the HB nanofibers (Figure 2c), both of which feature intermediate degrees of surface oxidation as seen from the XPS data in Figure 1b, suggests that a critical density of surface oxygen groups may be necessary to adsorb cationic complexes. Below this limit, the oxygen groups would be insufficiently dense to effect a strong surface charge. Finally, the MWCNT II sample (Figure 2d) with the impurity exhibits high levels of uptake of anions in the central pH range. This can be attributed to a non-electrostatic mechanism associated with the cobalt oxide impurity.
In sum, the samples for which the measured PZC values accurately indicate the adsorption behavior are the two harshly oxidized samples, the MXCNT I Oxd (Figure 2b) and the MWCNT II COOH (Figure 2f). The unoxidized MWCNT I, HB nanofiber, and MWCNT II OH samples have an effective PZC of about 9 and can adsorb only anions. The untreated MWCNT II sample has impurities which induce anionic Pt deposition in the mid pH range.
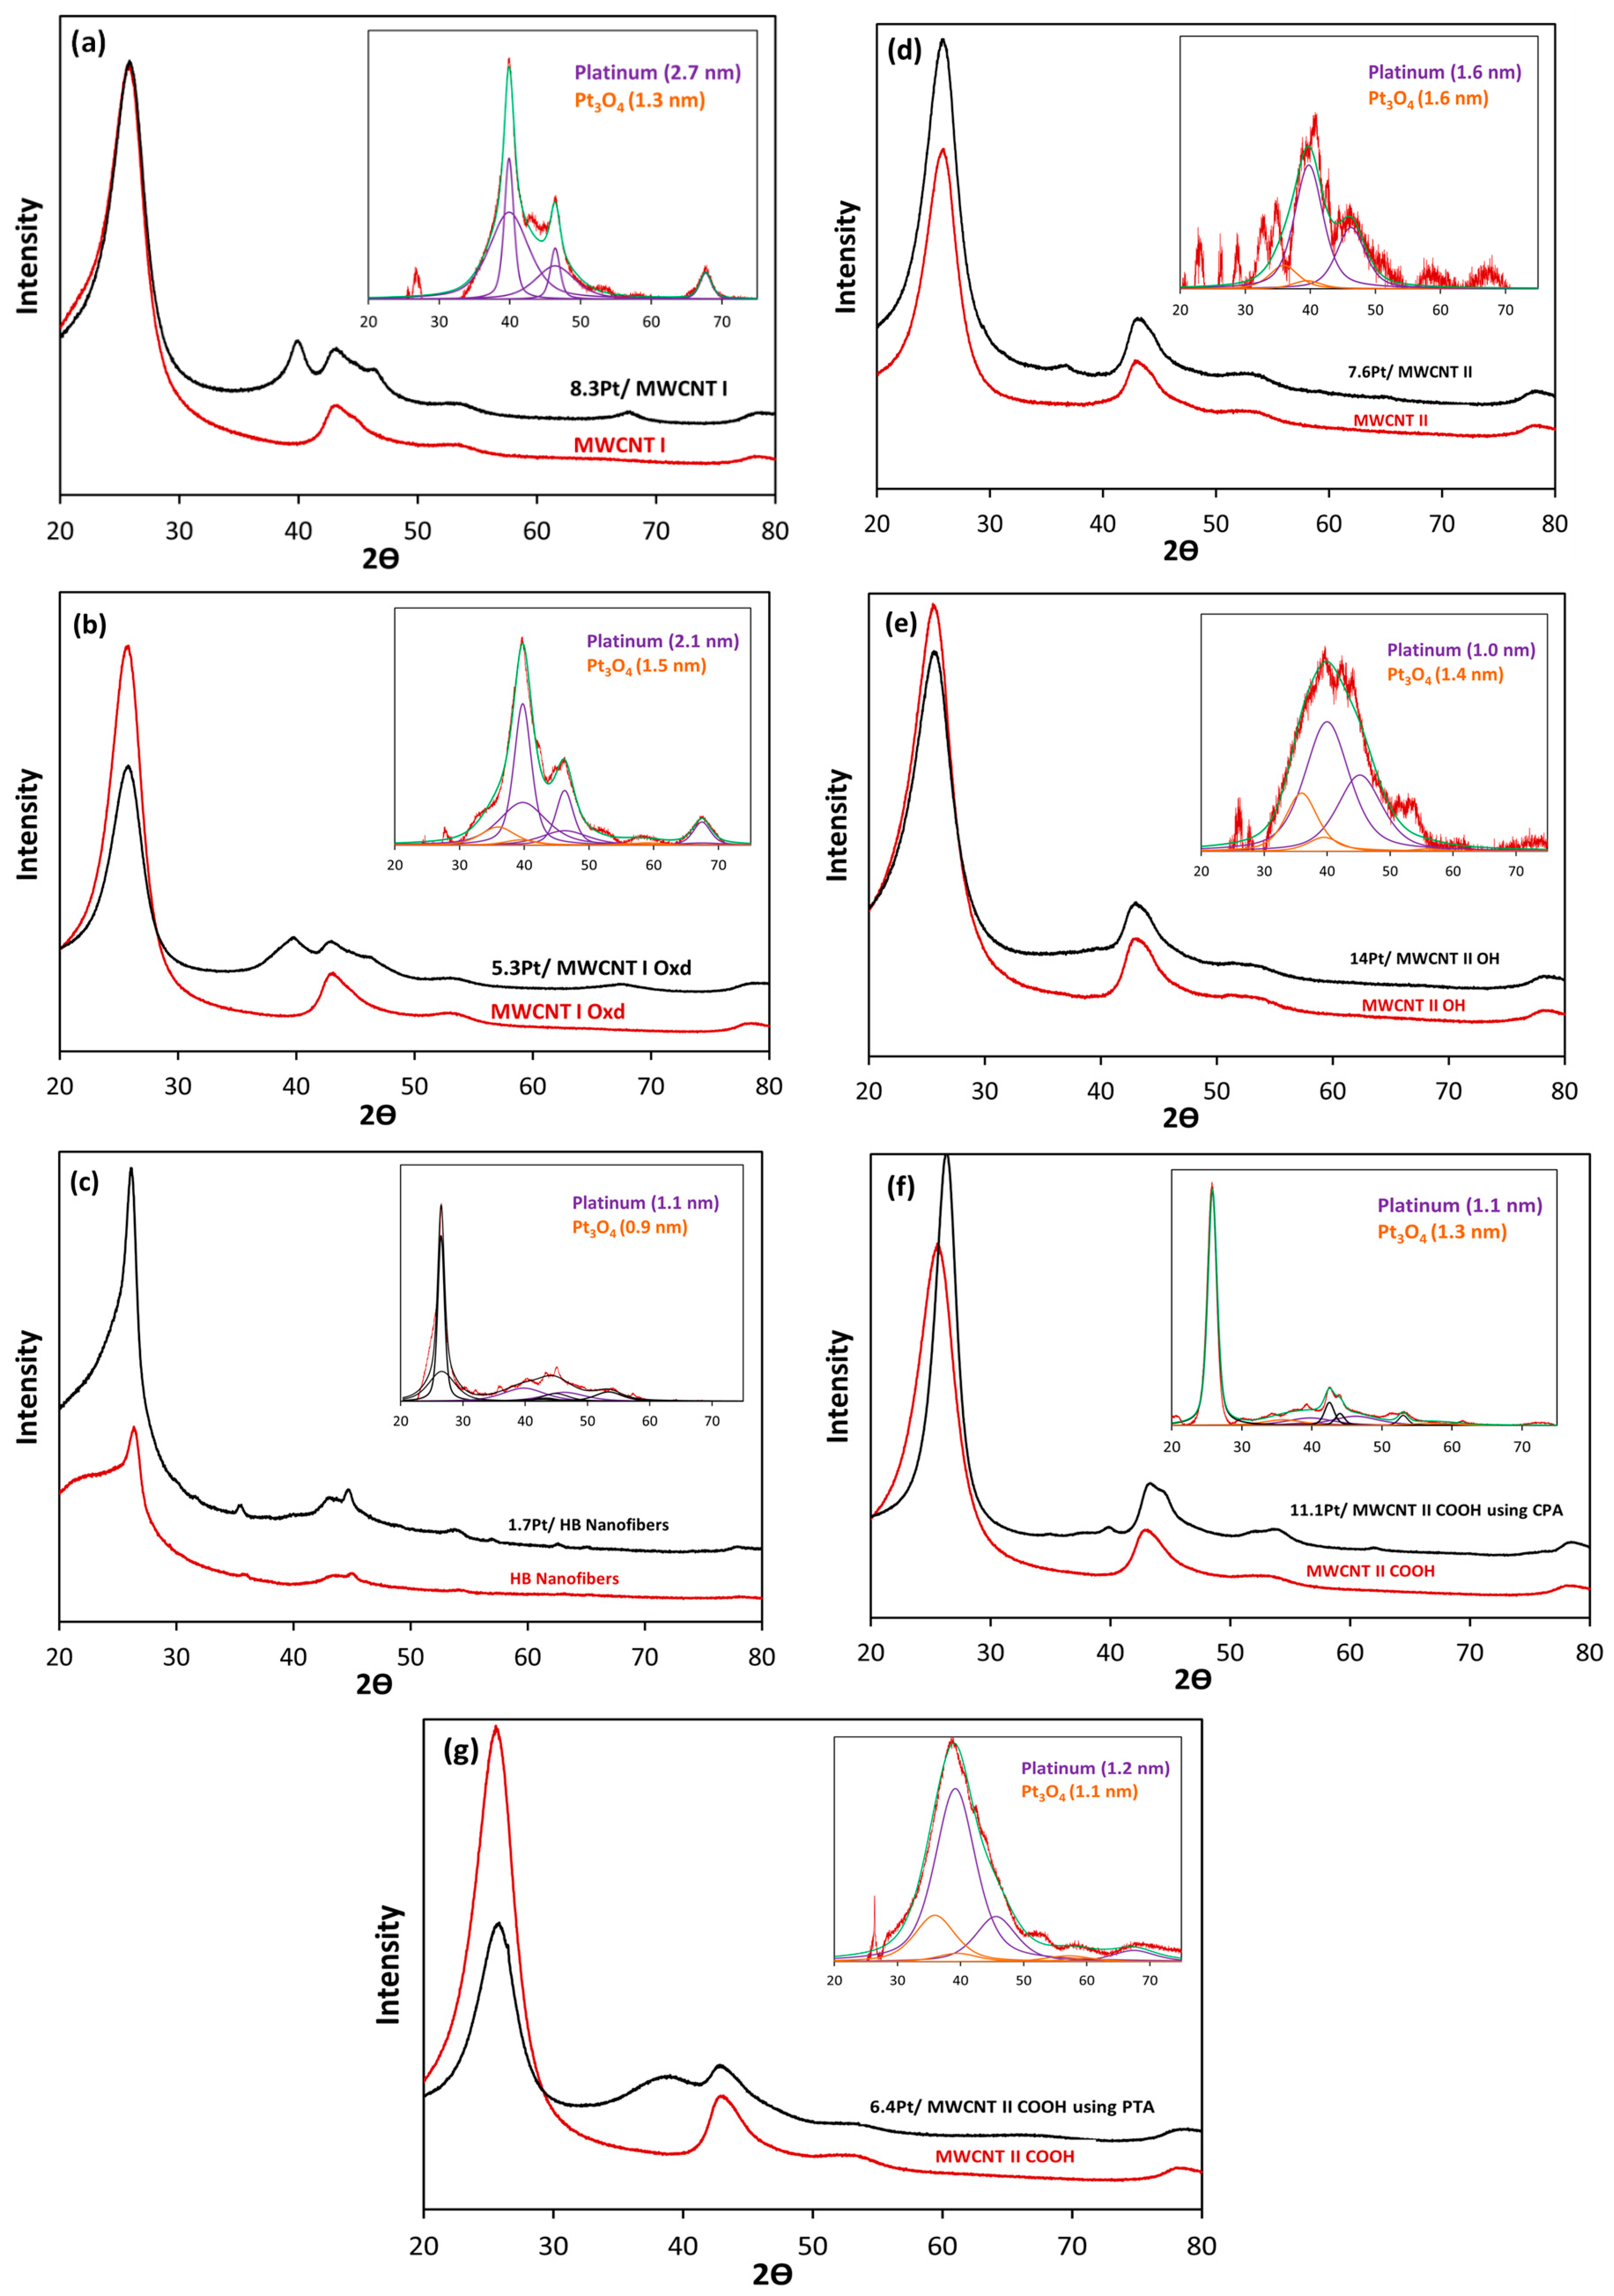
The powder XRD analysis in Figure 3 utilizes procedures recently developed for an instrument with a high sensitivity detector which allows detection of metal particles smaller than 1 nm [36] and has enabled the observation of the ambient oxidation of the ultra-small Pt nanoparticles [37]. Accordingly, the metal free carbon supports are subtracted from the patterns of the metal-containing samples and the differences are fit with a combination of Pt3O4 oxide and fcc Pt metal peaks. The patterns in Figure 3 are arranged in the same order as the uptake surveys in Figure 2; the MWCNT I, MXCNT I Oxd, and HB nanofibers are on the left in Figure 3a–c, and the MWCNT II samples are on the right (Figure 3d–g). The latter two samples (Figure 3f,g) are derived from PHC and PTA adsorbed over the same MWCNT II COOH sample, as indicated with the two asterisks in Figure 2f.
The changing intensity of the graphite peaks in the samples, particularly the highest intensity peak at 26.3° (graphitic carbon 26.3°, 42.6°, 44.8° and 54.2°, from PDF Card No: 00-001-0640) was particularly problematic; in fact it appears that the graphite peak grew for two of the samples, the HB nanofibers (Figure 3c) and the -derived MWCNT II COOH sample (Figure 3f). In the former pattern the graphite peak could best be fit with a bimodal size distribution. Platinum is readily apparent by broad peaks at 40° 2θ in the patterns of Figure 3a,b,g. The first two of these, 8.3% Pt/MWCNT I and 5.3% Pt/MWCNT I Oxd, have the largest particle size and are comprised of minor amounts of Pt oxide in addition to fcc Pt. The Pt phase in the other patterns is less directly discernable but can be seen in the rise in the background of the metal-containing samples relative to the support (Figure 3c–f). The background subtraction and deconvolution of these patterns reveals the smallest particles with in general, higher amounts of Pt3O4. An exception is the HB nanofiber sample, over which no Pt oxide is observed; the facetted inner and outer surfaces of the herring bone structure appear to stabilize the Pt not only at small size [38,39] but also against oxidation. The sizes of the Pt and Pt oxide phases from the XRD analysis are summarized in Table 2.
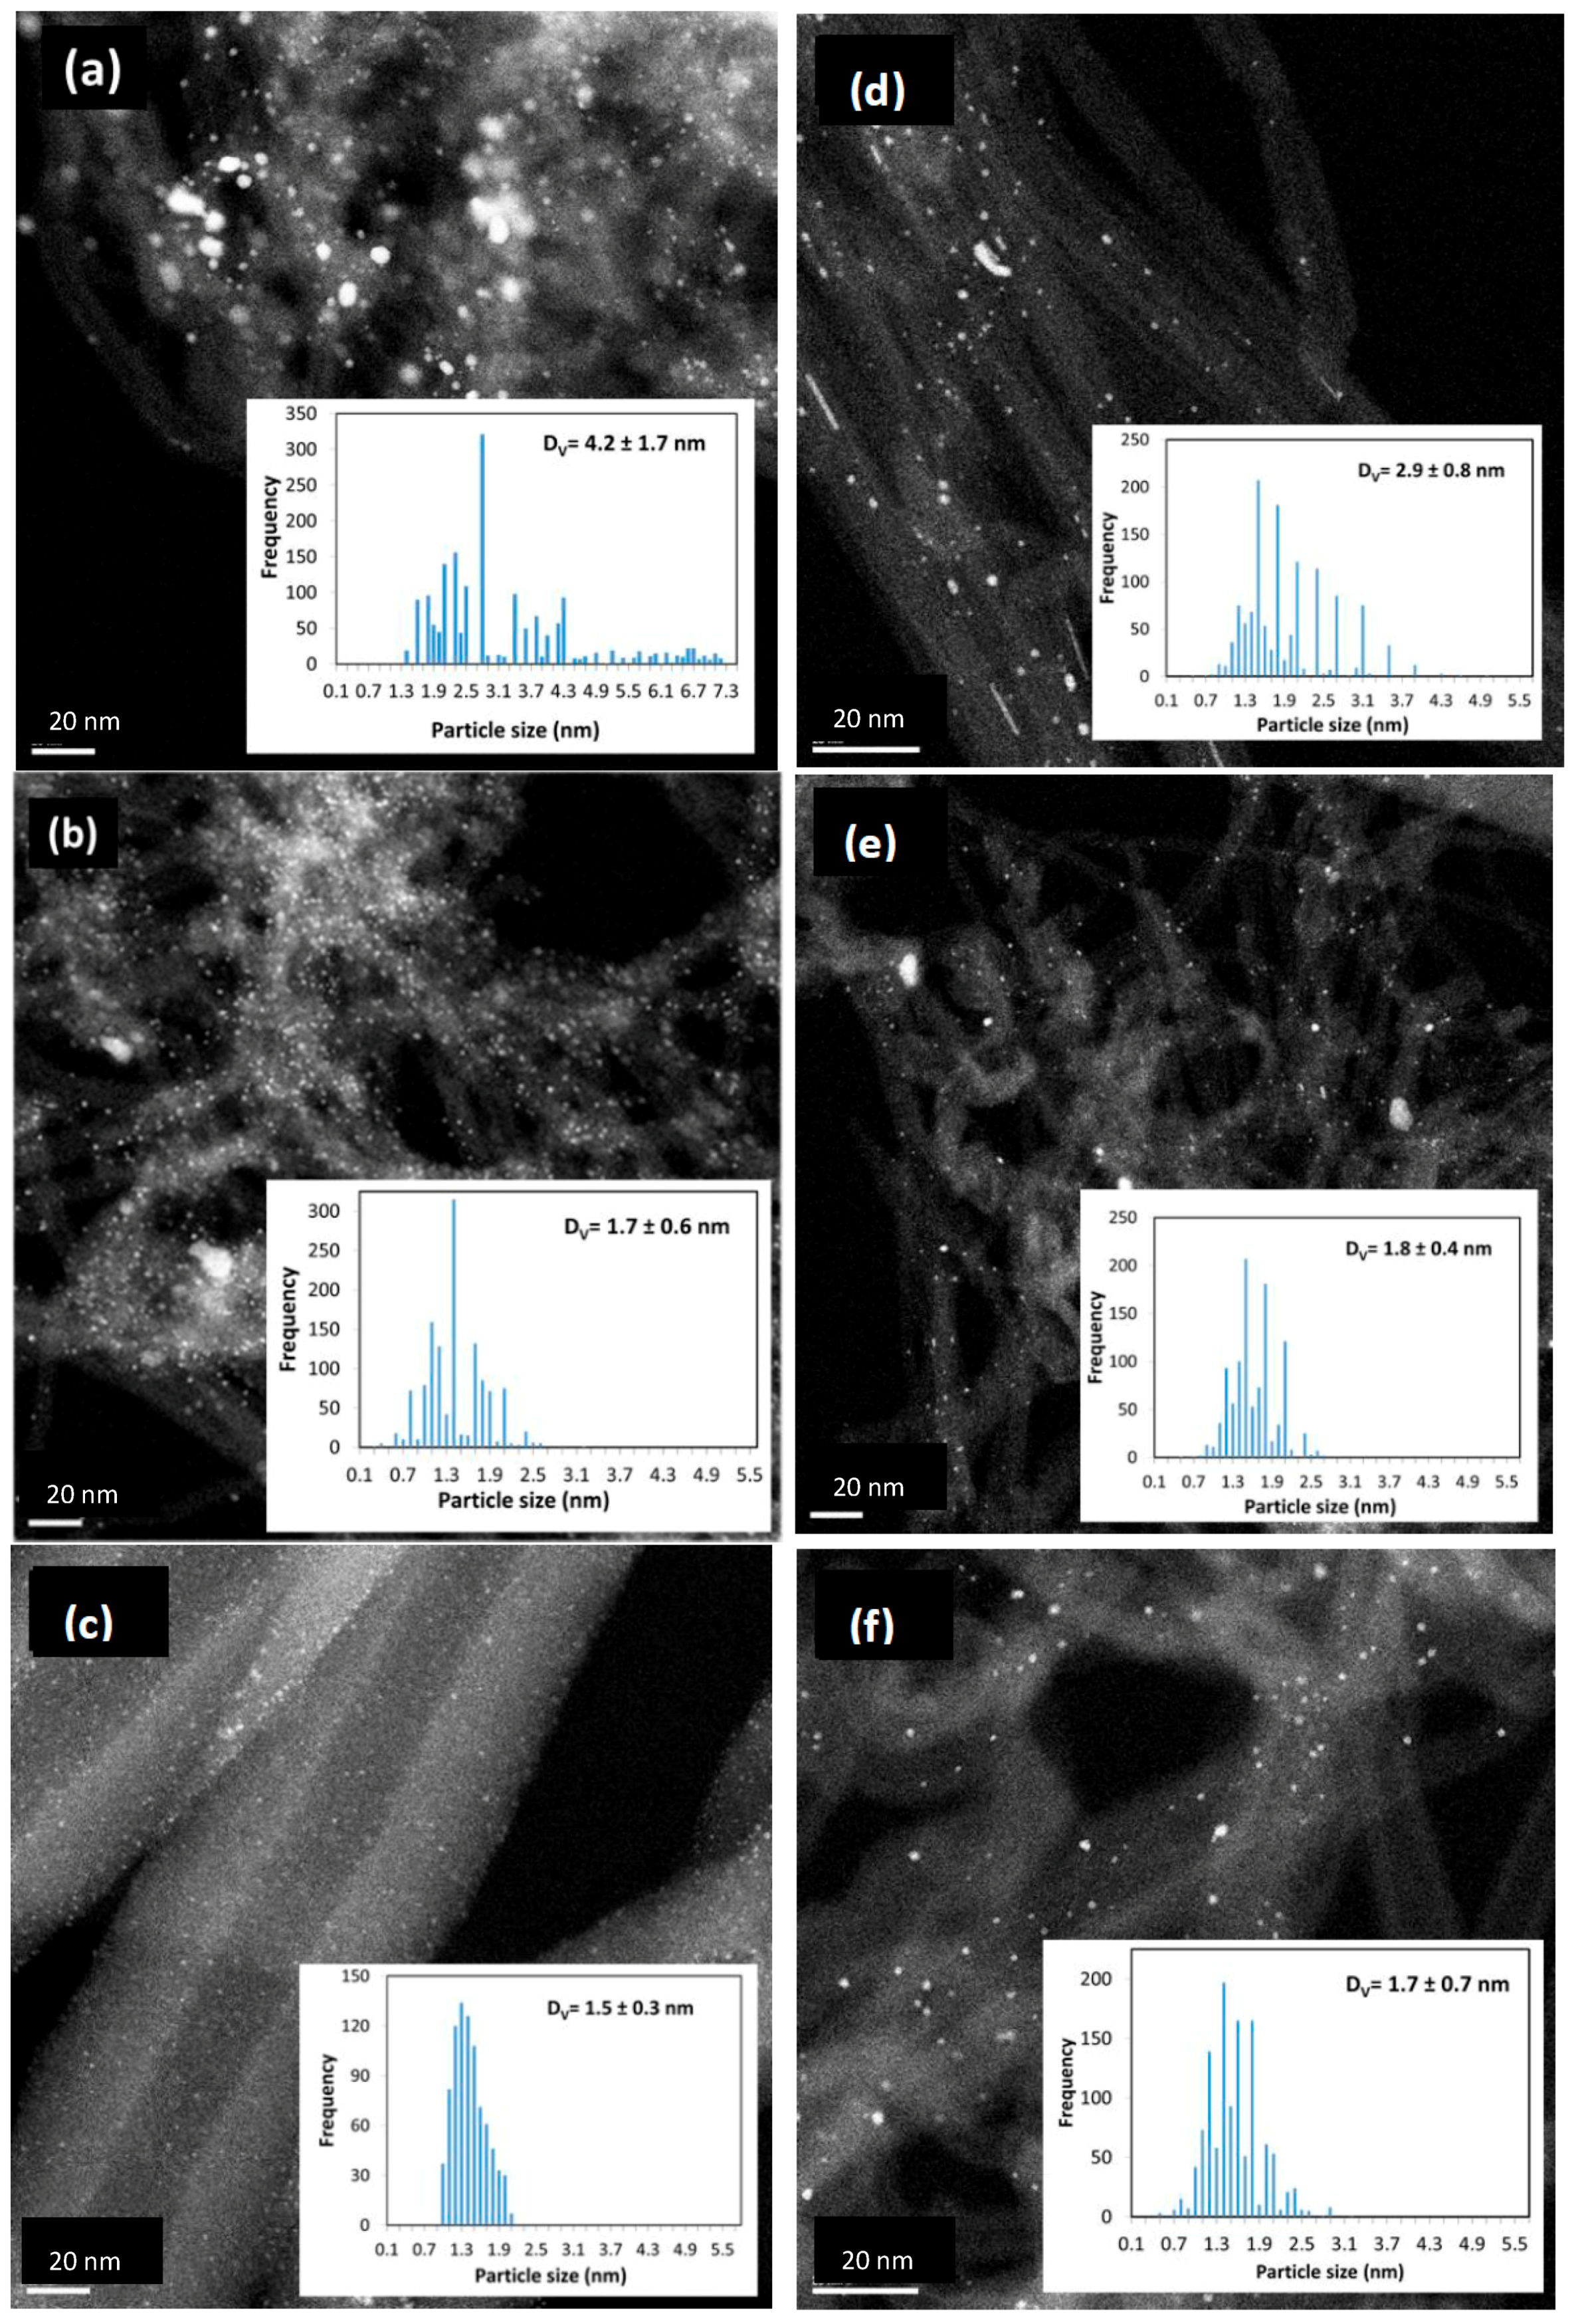
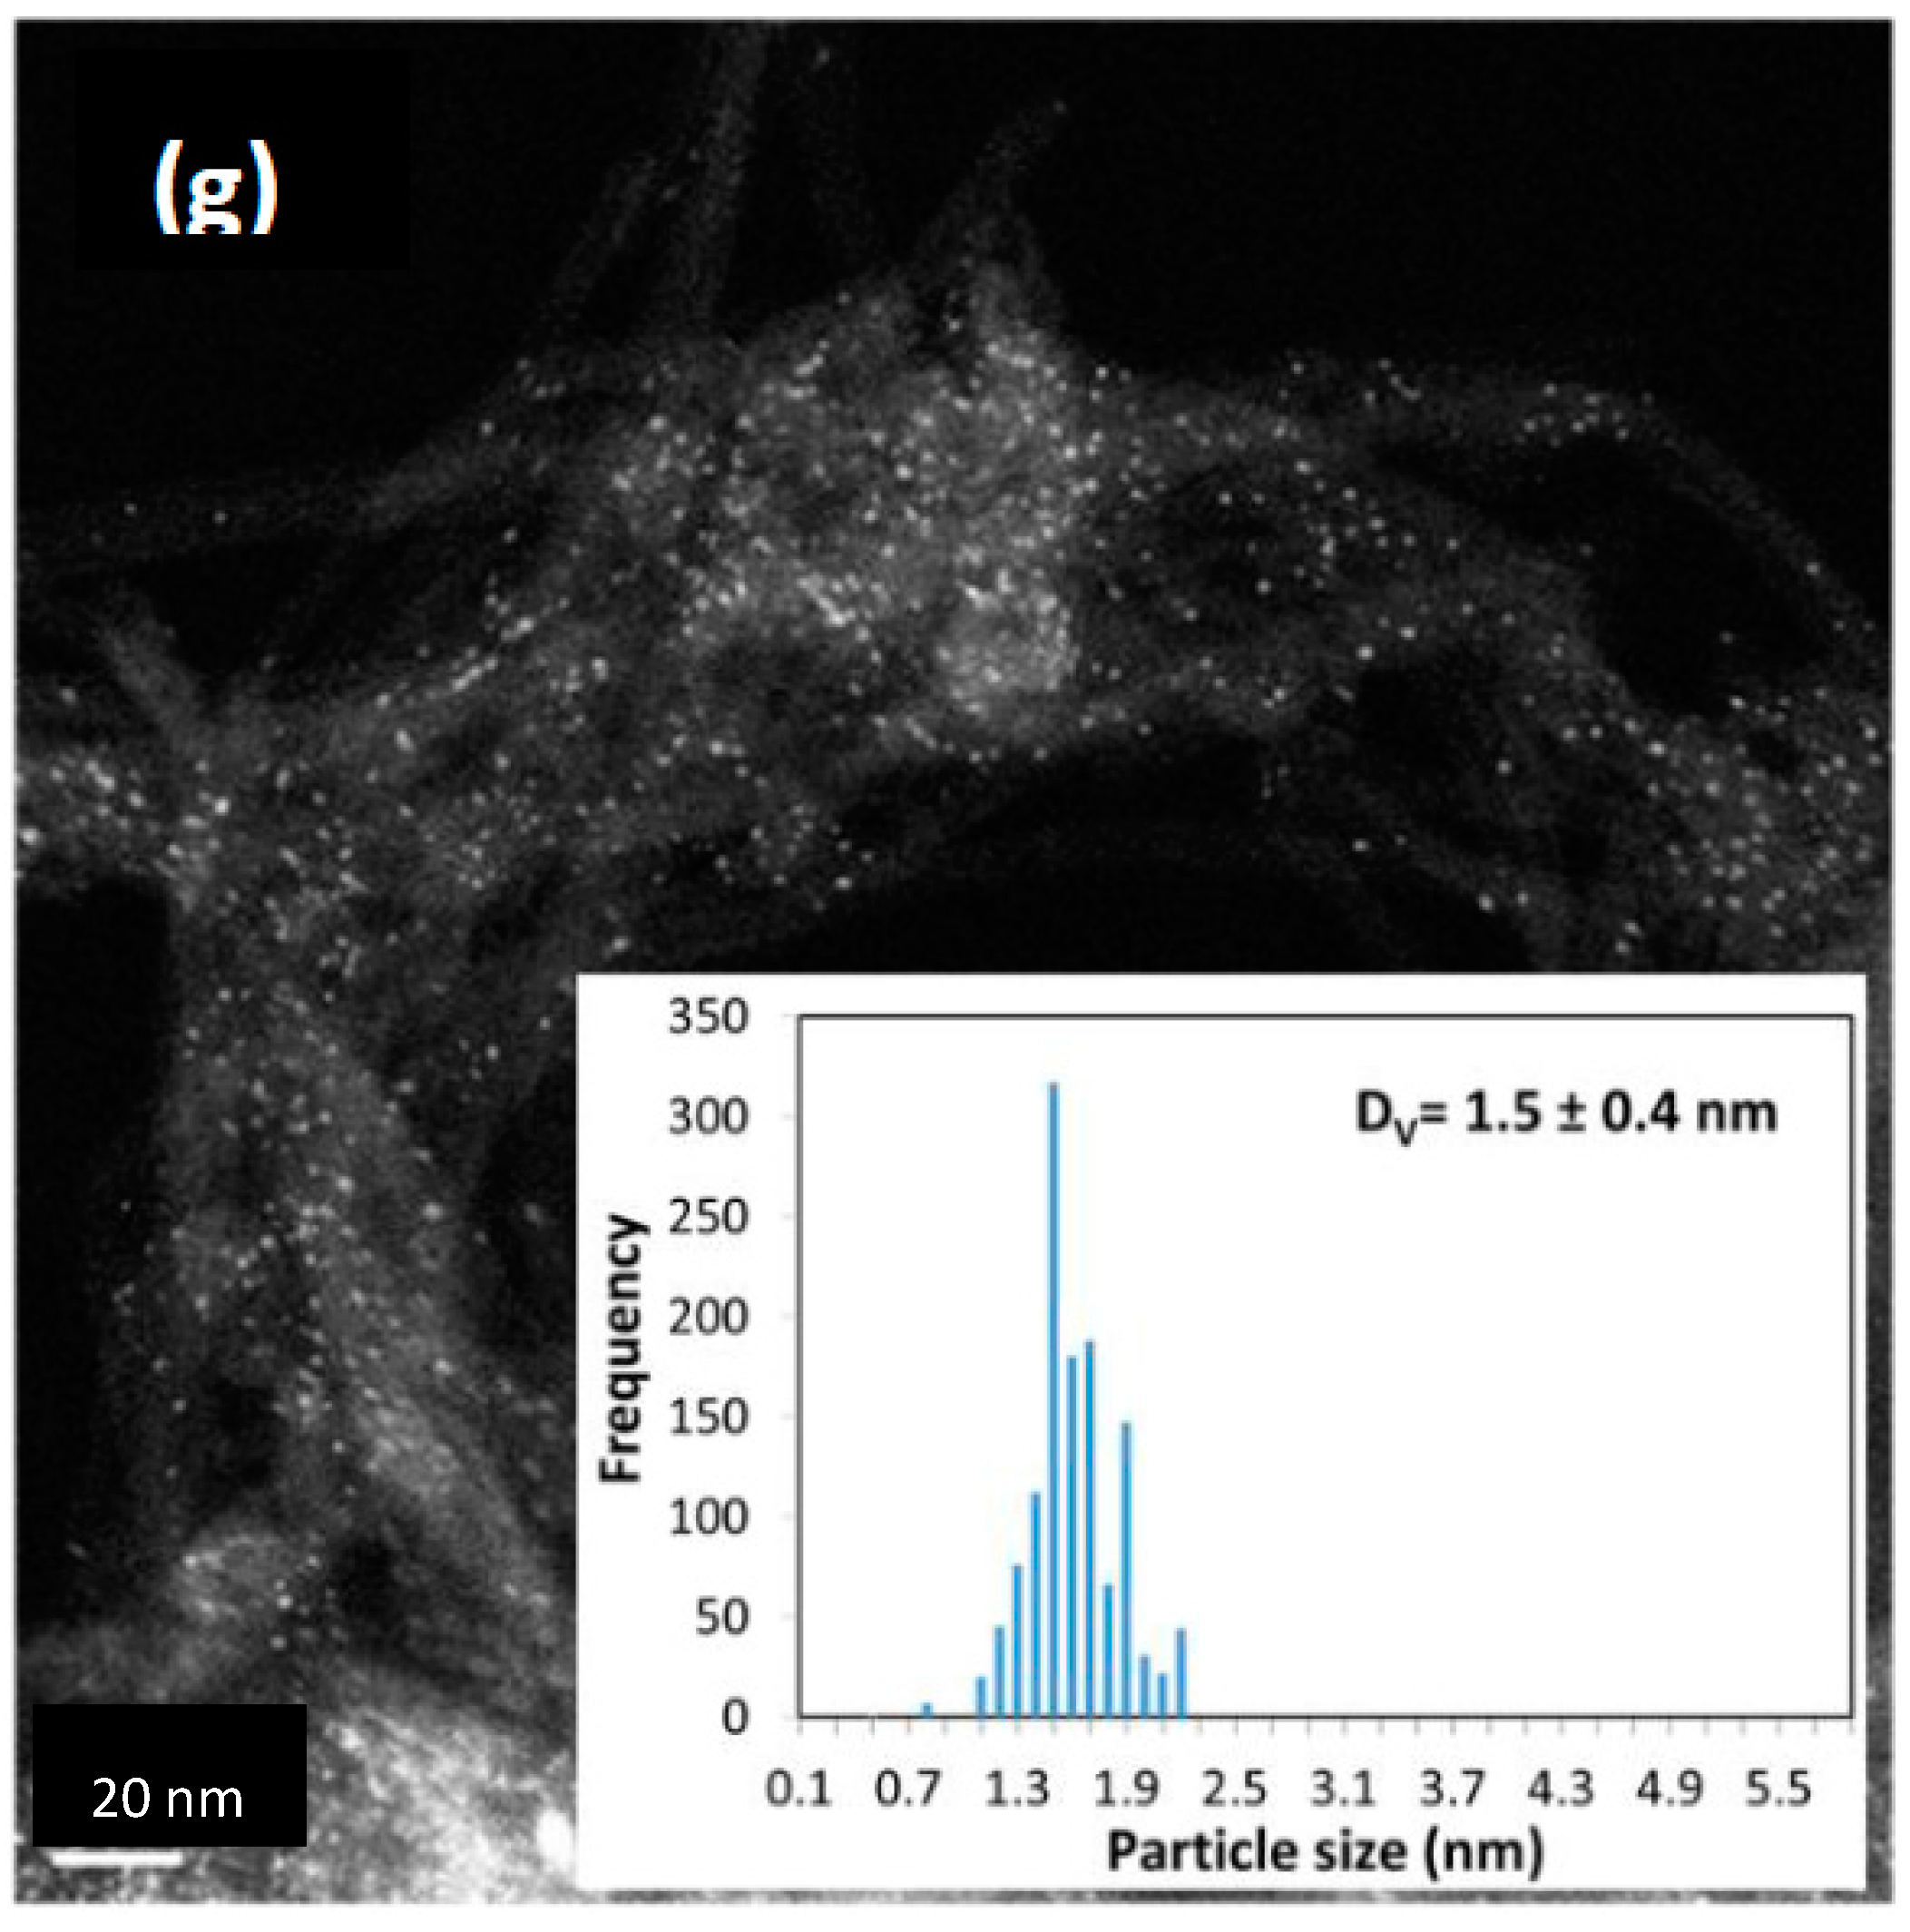
Scanning transmission electron microscopy (STEM) image analysis of each sample was performed to confirm the XRD particle sizes and size distributions. In Figure 4 all scale bars correspond to 20 nm. The larger macroscopic features of the relatively low surface area HB nanofibers, Figure 4c, stands out from the rest of the much higher surface area, much more porous MWCNT I and II samples. Trends in particle size are seen in general to mirror those from XRD; the largest particles appear over the MWCNT I sample (Figure 3a and Figure 4a), and both the STEM particle size distribution (Figure 4a inset) and the XRD pattern (Figure 3a) exhibit bimodality. In general, the sum of the sizes of the Pt oxide and Pt metal phases from XRD is somewhat larger than the (volume-averaged) STEM size summarized in Table 2. This is because the smallest nanoparticles are pure Pt oxide [37] so the XRD sizes are not additive. The STEM sizes are thus more representative of overall particle size.
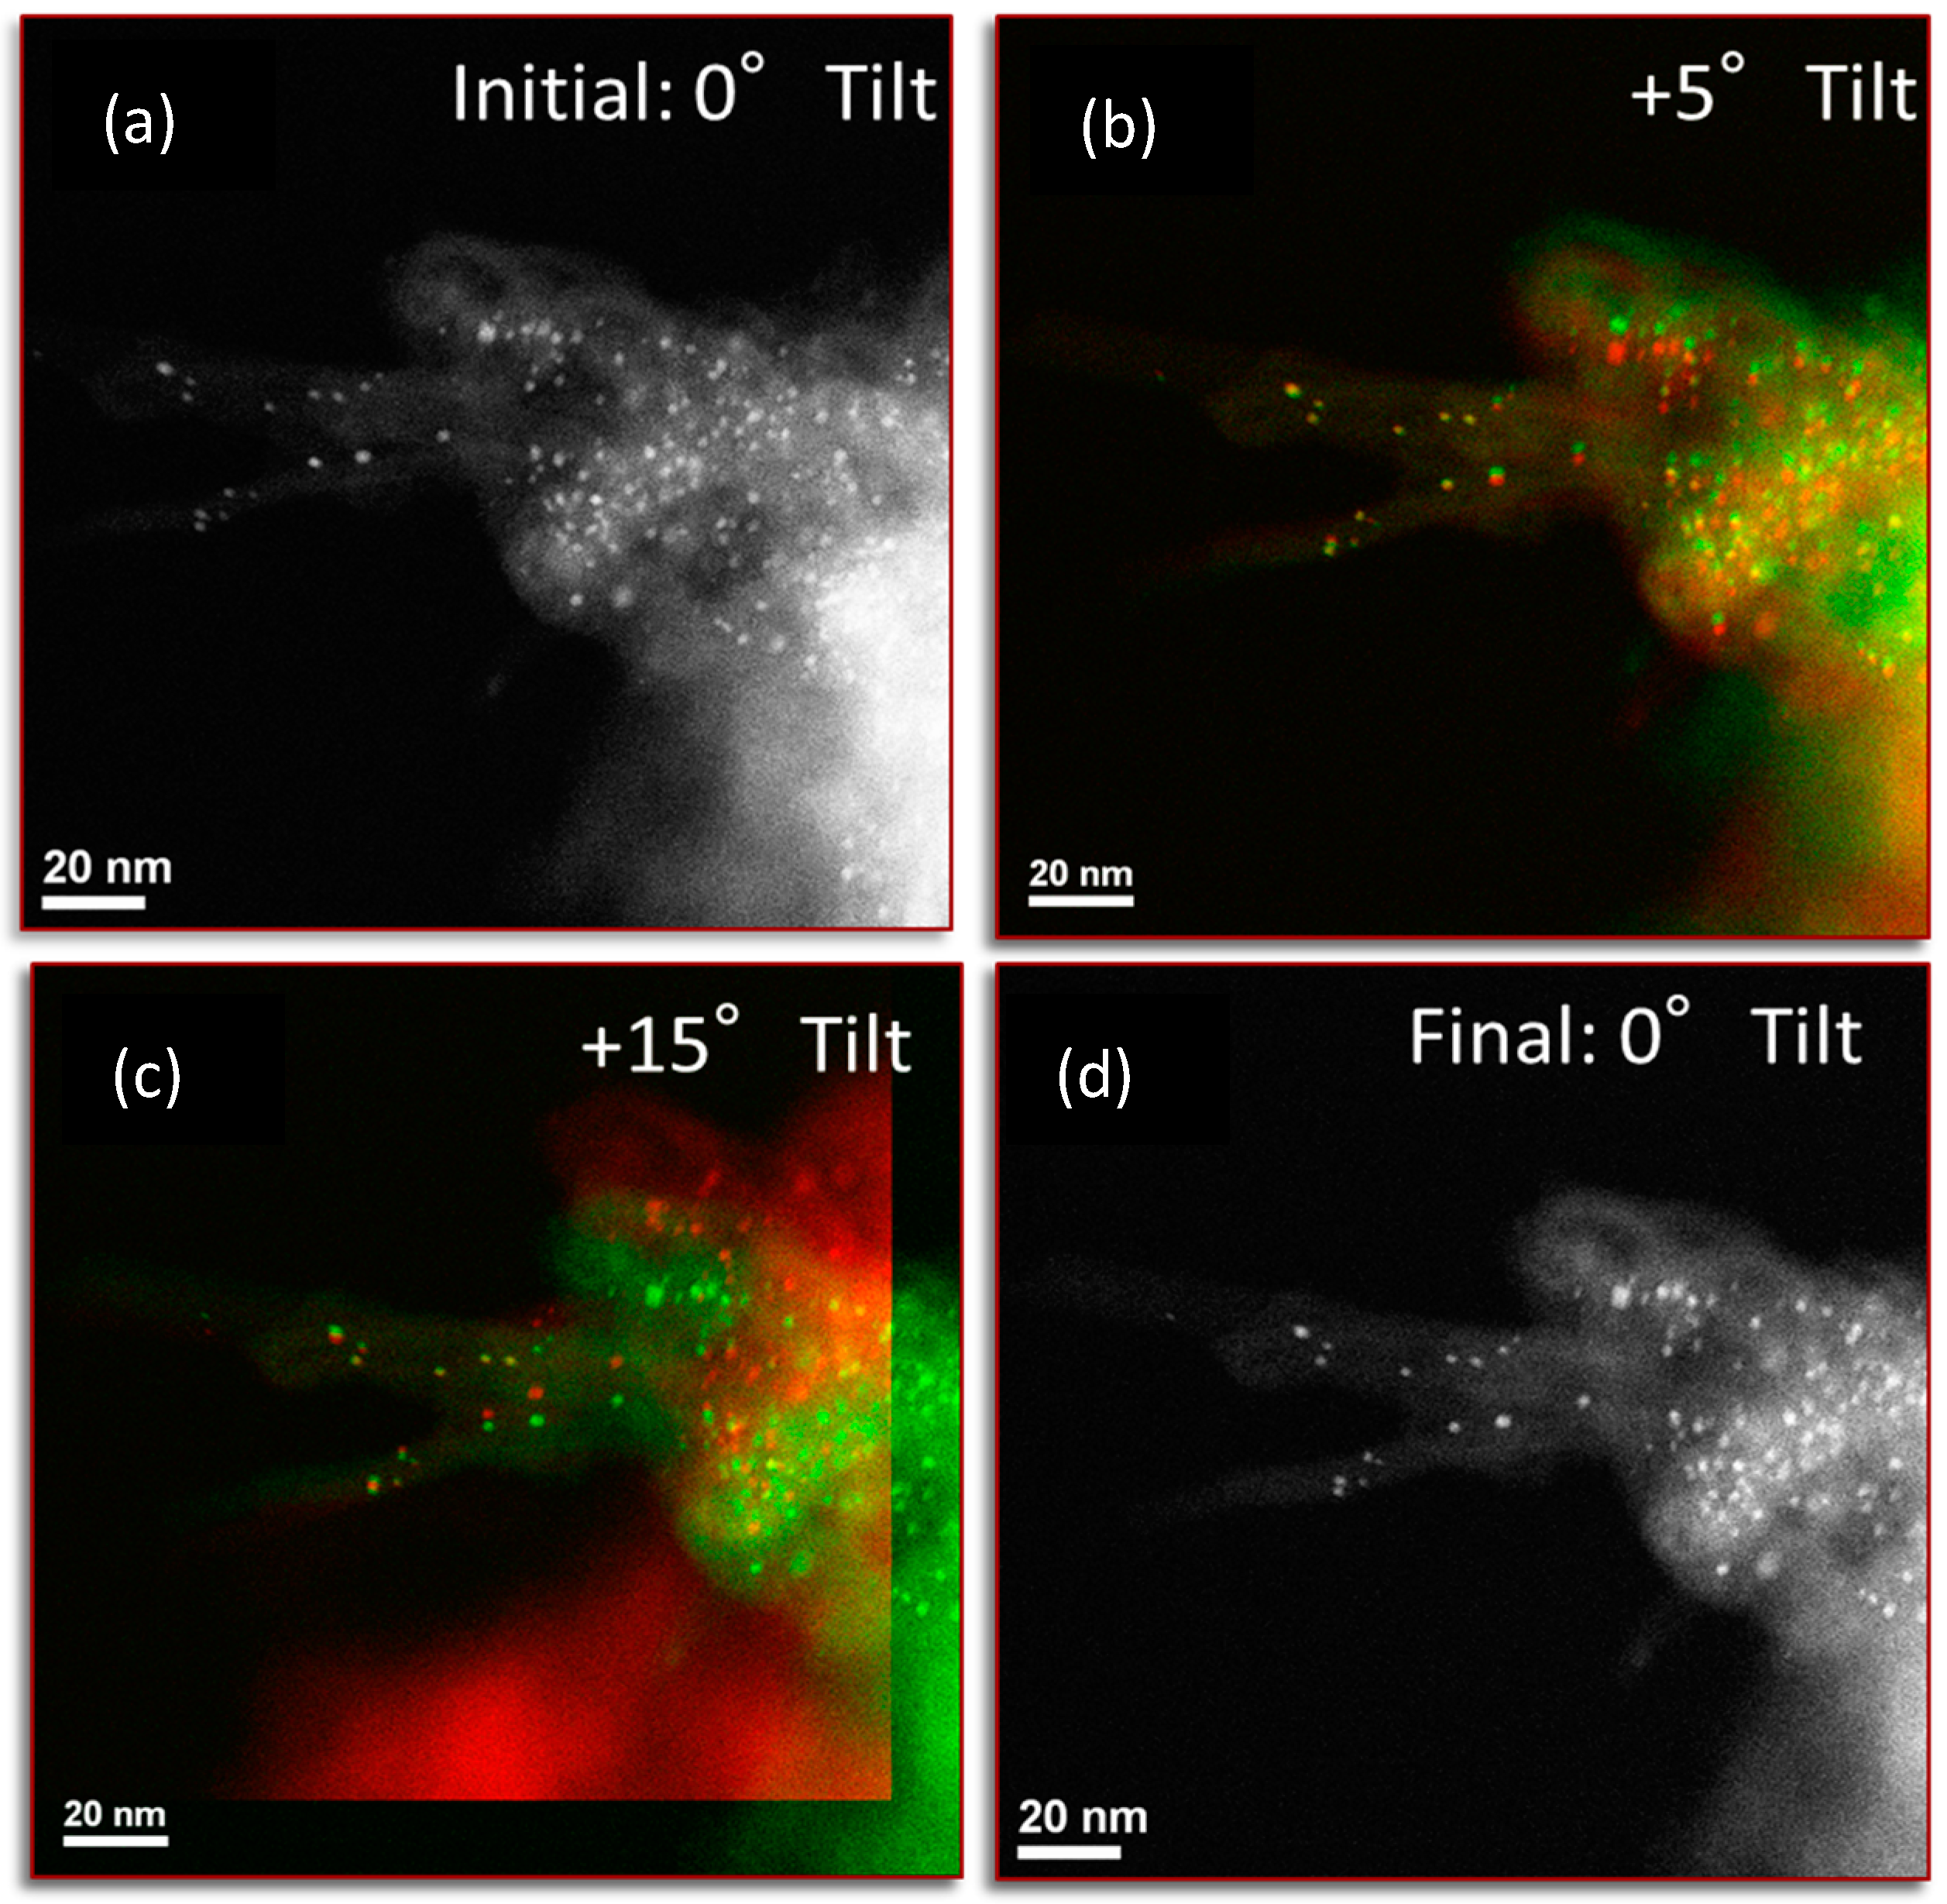
A final STEM tilting experiment was performed to determine whether the nanoparticles were distributed on the inside of nanotubes as well as on the outside. Figure 5 shows four STEM images of the MWCNT II COOH sample from no tilt to +5° and +15° clockwise tilt. Figure 5b is the composite image formed by superposing the no tilt image with the +5° tilt and Figure 5c is the image formed by superposing the +5° and +15° tilt. The particles that do not move as a function of tile are on the inside of the nanotube whereas the ones that move are on the outside. Several such particles deposited on the inner wall are indicated in the figure with arrows. The inner and outer walls of nanotubes are not functionalized differently and so it makes sense that inner and outer surfaces are equivalent for SEA.

2.2. Practical Considerations

SEA consistently yielded Pt nanoparticles less than 2 nm in diameter (Table 2) for those supports which contained surface oxygen. The carbon with the least oxygen, MXCNT I, gave 4.2 nm particles. Surface oxygen has been cited to anchor Pt precursors and so enhance Pt dispersion [33,34,40]. The trend seen here supports this hypothesis. It is notable that small size can be achieved with the anionic PHC precursor adsorbed at low pH (MWCNT II OH, MWCNT II COOH, and HB Nanofibers) as well as the cationic precursor adsorbed at high pH, as long as the surface contains oxygen groups to anchor the nascent nanoparticles which form from the adsorbed precursors during reduction. Comparing the two precursors over the same MWCNT II COOH support, the anionic PHC gave 1.7 nm particles at a loading of 11.1 wt %, while the cationic PTA gave 1.5 nm particles at a loading of 6.4%. The difference in loading, once again, is due to the smaller size of the hydrated anion, which retains one hydration sheath instead of two like the cation [29,34,35].
While the size of the SEA-derived nanoparticles is in general smaller than the solution or reduction-derived particles in Table 1, metal loading can be a major consideration and the loading achievable in a single SEA application can be a limitation for low surface area supports. The maximum surface density of 1.6 μmol/m2 of PHC corresponds to 6 wt % for a 200 m2/g support, and to 30 wt % for a 1500 m2/g support [29]. The latter loading has been achieved over a high surface area carbon black [29], while over a lower surface area Vulcan XC-72 support, a loading of 22 wt % was achieved with three SEA-reduction cycles. In lieu of repeated SEA applications, however, a single colloidal or reduction preparation may be advantageous in terms of time and effort for catalysts requiring high Pt loading with low surface area supports.

3. Materials and Methods

3.1. Specialty Carbons

The specialty carbons used in the study comprise a set of multi-walled carbon nanotubes with varying aspect ratio, surface functional groups and orientation of graphene sheets. Some of the carbons were un-oxidized whereas some were obtained in the oxidized form from the manufacturer. The carbons used in the study as listed in Table 1: for MWCNT I (OD × ID × L: 10 nm × 4.5 nm × (3–4) micrometer) and HB nanofibers were obtained from Sigma-Aldrich, Saint Louis, MO, USA and the other carbons: MWCNT II (OD × ID × L: <8 nm × (2–5) nm × (10–30) micrometer), MWCNT II OH, and MWCNT II COOH were obtained from Nanostructured and Amorphous Materials, Inc, (Los Alamos, NW, USA). The method for determining the PZC and choosing the right precursor for SEA can be found in the literature [14,15,16]. After determining the point of zero charge, the appropriate precursor, (platinum tetraammine, PTA from platinum tetraammine chloride or platinum hexachloride, PHC, from chloroplatinic acid, both from Sigma-Aldrich, Saint Louis, MO, USA) was chosen to perform the uptake experiment in order to determine the optimal pH of adsorption. As shown in the table, both the precursors were evaluated for all the carbon supports. As the standard for SEA, 1000 m2/L surface loading was used for cations and 500 m2/L was used for the anions. One of the carbon nanotubes, MWCNT I, was oxidized in boiling nitric acid for 3 h to oxidize the surface and lower the PZC.

3.2. Adsorption Surveys

Adsorption surveys were performed over the entire range of pH using both PTA and PHC on the as-received specialty carbons using established protocols [33,34]. The cationic precursor platinum tetraammine (PTA) from tetraammineplatinum(II) hydroxide (Pt(NH3)4(OH)2, 99.999%) was used and the anionic precursor, platinum hexachloride, PHC, from chloroplatinic acid (H2(PtCl6), 99.9%) was used. Aqueous solutions of 200 ppm Pt were prepared and dosed into 50 mL flasks. The pH values of these solutions were adjusted with HCl or NaOH between 1 and 13. Following this, supports were weighed out in amounts corresponding to 500 m2/L for the PHC solutions and 1000 m2/L for the PTA solutions. PTA and PHC solutions were then contacted with the respective carbon supports for one hour with mild shaking after which the final pH values were recorded. ICP was used to measure the initial and final metal concentrations. Once the pH of optimum adsorption is established from the uptake plots, the catalyst preparation is simply scaled up at the desired pH value to obtain sufficient sample for characterization (typically 1.0 g). The catalyst was filtered from this larger solution after the one hour contact time, dried in ambient air overnight, and then oven dried in static air at 120 °C for 16 h. The dried supports were reduced in a flowing 10% H2/balance He at 200 °C for 1 h at temperatures determined from temperature programmed reduction (listed in Table 2), with a ramp rate of 2.5 °C/min.

3.3. Characterization

A Rigaku Miniflex-II (The Woodlands, TX, USA) equipped with a D/teX Ultra silicon strip detector was used to perform powder XRD on the supported Pt particles. Diffraction patterns were recorded over a range of 10–80° 2θ using Cu-Kα radiation (k = 1.5406 Å) that was operated at 30 mA and 15 kV using Bragg-Brentano geometry. A slit width of 0.2 and scan rate of 1 °/min was used for all scans for both detectors. About 0.1 gms of the sample was placed in Rigaku XRD holders of diameter 20 mm and depth of 0.2 mm. XRD patterns were obtained for all metal free supports in addition to the supported metals. XRD patterns were obtained for all metal free supports in addition to the supported metals. Fityk 0.9.8 version software (open source software) [41] was used for background subtraction and deconvolutions using psuedo-Voigt shapes to take the peak asymmetry into account. The full width at half maximum (FWHM) values were input together with a shape factor of 0.94 in the Scherrer equation to estimate particle size.
STEM images were obtained using an aberration-corrected JEOL 2100F STEM equipped with a 200 kV field emission gun and a double tilt holder for tilting the sample across a range of angles (±20°). Sample preparation involved suspending the catalyst in isopropanol and depositing a drop of the suspension onto a holey carbon film attached to a Cu TEM grid. The images were recorded using Digital Micrograph software and particle size distributions were obtained by counting about 1000 particles on each sample. Volume average sizes (DV) were determined to compare with the sizes obtained from XRD. The volume average diameter is DV= ∑nidi4/∑nidi3 where ni is the number of particles with diameter di [42].

4. Conclusions

Strong Electrostatic Adsorption has been demonstrated as a simple, scientific method to prepare well dispersed Pt nanoparticles over several types of specialty carbons; multi-walled nanotubes and herring bone nanofibers. The specialty carbons generally displayed volcano-shaped uptake curves typical of electrostatic adsorption for both Pt anions at low pH and Pt cations at high pH. However, the regimes of uptake often did not correspond to the measured PZC. It is suggested that the PZC of many of the carbons are altered by the presence of residual impurities from the manufacturing process. This renders the measured PZC of these specialty carbons unreliable for predicting anion and cation uptake. On the other hand, the anion and cation uptake curves provide an “effective” PZC and do indicate the optimal pH for the synthesis of ultra-small nanoparticle synthesis. With SEA it is possible to disperse nanoparticles on the surface as well as the inner walls of the specialty carbons. For moderate Pt loadings, SEA gives a simple, scalable method to prepare ultrasmall (<2 nm) nanoparticles.

Acknowledgments

This work was completed with partial support from NSF grant IIP 1464630.

Author Contributions

John R. Regalbuto, Ritubarna Banerjee, and Jose L. Contreras-Mora conceived and designed the experiments; Ritubarna Banerjee, Jose L. Contreras-Mora, Susan K. McQuiston, and Brandon Bolton, performed the experiments; Ritubarna Banerjee, Jose L. Contreras-Mora, Bahareh Alsadat Tavakoli Mehrabadi and John R. Regalbuto analyzed the data; Ritubarna Banerjee and John R. Regalbuto wrote the paper.

Conflicts of Interest

The authors declare no conflict of interest.

References

  1. Kim, Y.A.; Hayashi, T.; Endo, M.; Dresselhaus, M.S. Carbon Nanofibers. In Springer Handbook of Nanomaterials; Vajtai, R., Ed.; Springer: Heidelberg, Berlin, 2013; pp. 233–262. ISBN 978-3-642-20594-1. [Google Scholar]
  2. De Jong, K.P.; Geuss, J.W. Carbon nanofibers: Catalytic synthesis and applications. Catal. Rev. Sci.-Eng. 2000, 42, 481–510. [Google Scholar] [CrossRef]
  3. Lee, S.; Zhang, Z.; Wang, X.; Pfefferle, L.D.; Haller, G.L. Characterization of multi-walled carbon nanotubes catalyst supports by point of zero charge. Catal. Today 2011, 164, 68–73. [Google Scholar] [CrossRef]
  4. Serp, P.; Corrias, M.; Kalck, P. Carbon nanotubes and nanofibers in catalysis. Appl. Catal. A Gen. 2003, 253, 337–358. [Google Scholar] [CrossRef]
  5. Gupta, C.; Maheshwari, P.H.; Sachdev, D.; Sahud, A.K.; Dhakate, S.R. Highly purified CNTs: An exceedingly efficient catalyst support for PEM fuel cell. RSC Adv. 2016, 6, 32258–32271. [Google Scholar] [CrossRef]
  6. Gupta, C.; Maheshwari, P.H.; Dhakate, S.R. Development of multiwalled carbon nanotubes platinum nanocomposite as efficient PEM fuel cell catalyst. Mater. Renew. Sustain. Energy 2016, 5, 1–11. [Google Scholar] [CrossRef]
  7. Zheng, Y.; Dou, Z.; Fang, Y.; Li, M.; Wu, X.; Zeng, G.; Hou, Z.; Liao, S. Platinum nanoparticles on carbon-nanotube support prepared by room-temperature reduction with H2 in ethylene glycol/water mixed solvent as catalysts for polymer electrolyte membrane fuel cells. J. Power Sources 2016, 306, 448–453. [Google Scholar] [CrossRef]
  8. Bedolla-Valdez, Z.I.; Verde-Gómez, Y.; Valenzuela-Muñiz, A.M.; Gochi-Poncec, Y.; Oropeza-Guzmánd, M.T.; Berhaulte, G.; Alonso-Núñeza, G. Sonochemical synthesis and characterization of Pt/CNT, Pt/TiO2, and Pt/CNT/TiO2 electrocatalysts for methanol electro-oxidation. Electrochim. Acta 2015, 186, 76–84. [Google Scholar] [CrossRef]
  9. Ning, X.; Yu, H.; Peng, F.; Wang, H. Pt nanoparticles interacting with graphitic nitrogen of N-doped carbon nanotubes: Effect of electronic properties on activity for aerobic oxidation of glycerol and electro-oxidation of CO. J. Catal. 2015, 325, 136–144. [Google Scholar] [CrossRef]
  10. Yu, J.H.; Li, W.W.; Zhu, H. Effect of the diameter of carbon nanotubes supporting platinum nanoparticles on the electrocatalytic oxygen reduction. Acta Phys. Chim. Sin. 2017, 33, 1838–1845. [Google Scholar]
  11. Zhang, M.; Shi, J.; Suna, Y.; Ning, W.; Hou, Z. Selective oxidation of glycerol over nitrogen-doped carbon nanotubes supported platinum catalyst in base-free solution. Catal. Commun. 2015, 70, 72–76. [Google Scholar] [CrossRef]
  12. Zhu, Z.Z.; Bukowski, B.; Deskins, N.A.; Zhou, H.S. Bamboo shaped carbon nanotube supported platinum electrocatalyst synthesized by high power ultrasonic-assisted impregnation method for methanol electrooxidation and related density functional theory calculations. Int. J. Hydrogen Energy 2015, 40, 2216–2224. [Google Scholar] [CrossRef]
  13. Ashikawa, A.; Yoshie, R.; Kato, K.; Miyazawa, K.; Murata, H.; Hotozuka, K.; Tachibana, M. Pt nanoparticles supported on carbon nanowalls with different domain sizes for oxygen reduction reaction. J. Appl. Phys. 2015, 118, 214303. [Google Scholar] [CrossRef]
  14. Han, Q.; Liu, Y.; Wang, D.; Yuan, F.; Niu, X.; Zhu, X. Effect of carbon nanosheets with different graphitization degrees as a support of noble metals on selective hydrogenation of cinnamaldehyde. RSC Adv. 2016, 6, 98356–98364. [Google Scholar] [CrossRef]
  15. Li, M.; Wu, X.; Zeng, J.; Hou, Z.; Liao, S. Heteroatom doped carbon nanofibers synthesized by chemical vapor deposition as platinum electrocatalyst supports for polymer electrolyte membrane fuel cells. Electrochim. Acta 2015, 182, 351–360. [Google Scholar] [CrossRef]
  16. Wang, Y.; Wang, Y.; Jin, J.; Yang, S.; Li, G.; Qiao, J. Highly active and stable platinum catalyst supported on porous carbon nanofibers for improved performance of PEMFC. Electrochim. Acta 2015, 177, 181–189. [Google Scholar] [CrossRef]
  17. Andersen, S.M.; Ma, S.; Borghei, M.; Lund, P.; Elina, Y.R.; Pasanen, A.; Kauppinen, E.; Ruiz, V.; Kauranen, P.; Skou, E.M. Durability of carbon nanofiber (CNF) & carbon nanotube (CNT) as catalyst support for Proton Exchange Membrane Fuel Cells. Solid State Ion. 2013, 231, 94–101. [Google Scholar] [Green Version]
  18. Zhao, L.; Zhao, L.; Wang, Z.B.; Sui, X.L.; Yin, G.P. Effect of multiwalled carbon nanotubes with different specific surface areas on the stability of supported Pt catalysts. J. Power Sources 2014, 245, 637–643. [Google Scholar] [CrossRef]
  19. Tao, L.; Tao, L.; Dou, S.; Ma, Z.; Wang, S. Platinum nanoparticles supported on nitrobenzene-functionalized multiwalled carbon nanotube as efficient electrocatalysts for methanol oxidation reaction. Electrochim. Acta 2015, 157, 46–53. [Google Scholar] [CrossRef]
  20. Chiang, Y.C.; Hsieh, M.K.; Hsu, H.H. The effect of carbon supports on the performance of platinum/carbon nanotubes for proton exchange membrane fuel cells. Thin Solid Films 2014, 570, 221–229. [Google Scholar] [CrossRef]
  21. Tian, Z.B.; Liu, C.; Li, Q.; Hou, J.; Li, Y.; Ai, S. Nitrogen- and oxygen-functionalized carbon nanotubes supported Pt-based catalyst for the selective hydrogenation of cinnamaldehyde. Appl. Catal. A 2015, 506, 134–142. [Google Scholar] [CrossRef]
  22. Wang, Y.R.; Wang, Y.; Clancey, J.; Lu, G.; Liu, J.; Liu, L.; Chaudhuri, J.; George, S.; Xie, M.; Wei, S.; et al. Enhanced methanol oxidation with annealed atomic layer deposited platinum nanoparticles on carbon nanotubes. J. Electrochem. Soc. 2016, 163, F1–F10. [Google Scholar] [CrossRef]
  23. Ribeiro, L.S.; Ribeiro, L.S.; Rodrigues, E.G.; Delgado, J.J.; Chen, X.; Fernando, M.; Pereira, R.; Órfão, J.J.M. Pd, Pt, and Pt-Cu Catalysts Supported on Carbon Nanotube (CNT) for the Selective Oxidation of Glycerol in Alkaline and Base-Free Conditions. Ind. Eng. Chem. Res. 2016, 55, 8548–8556. [Google Scholar] [CrossRef]
  24. Chen, S.S.; Chen, S.; Qi, P.; Chen, J.; Yuan, Y. Platinum nanoparticles supported on N-doped carbon nanotubes for the selective oxidation of glycerol to glyceric acid in a base-free aqueous solution. RSC Adv. 2015, 5, 31566–31574. [Google Scholar] [CrossRef]
  25. Zhu, J.L.; Zhu, J.; He, G.; Liang, L.; Wan, Q.; Shen, P.K. Direct anchoring of platinum nanoparticles on nitrogen and phosphorus-dual-doped carbon nanotube arrays for oxygen reduction reaction. Electrochim. Acta 2015, 158, 374–382. [Google Scholar] [CrossRef]
  26. Sharma, R.; Kar, K.K. Particle size and crystallographic orientation controlled electrodeposition of platinum nanoparticles on carbon nanotubes. Electrochim. Acta 2015, 156, 199–206. [Google Scholar] [CrossRef]
  27. Zhang, C.; Hua, J.; Zhang, X.; Wang, X.; Meng, Y. Certain nitrogen functionalities on carbon nanofiber support for improving platinum performance. Catal. Today 2015, 256, 193–202. [Google Scholar] [CrossRef]
  28. Brunelle, J.P. Preparation of catalysts by metallic complex adsorption on mineral oxides. Pure Appl. Chem. 1978, 50, 1211–1229. [Google Scholar] [CrossRef]
  29. Hao, X.; Barnes, S.; Regalbuto, J.R. A fundamental study of Pt impregnation of carbon: Adsorption equilibrium and particle synthesis. J. Catal. 2011, 279, 48–65. [Google Scholar] [CrossRef]
  30. Lambert, S.; Job, N.; D’Souza, L.; Pereira, M.F.R.; Pirard, R.; Heinrichs, B.; Figueiredo, J.L.; Pirard, J.-P.; Regalbuto, J. Synthesis of very highly dispersed platinum catalysts supported on carbon xerogels by the strong electrostatic adsorption method. J. Catal. 2009, 261, 23–33. [Google Scholar] [CrossRef]
  31. Hao, X.; Quach, L.; Korah, J.; Spieker, W.A.; Regalbuto, J.R. The control of platinum impregnation by PZC alteration of oxides and carbon. J. Mol. Catal. A Chem. 2004, 219, 97–107. [Google Scholar] [CrossRef]
  32. Zhang, L.; Wen, G.; Liu, H.; Wang, N.; Su, D. Preparation of carbon nanotubes supported Pd catalysts by an electrostatic adsorption method. ChemCatChem 2014, 6, 2600–2606. [Google Scholar] [CrossRef]
  33. Regalbuto, J.R. Strong electrostatic adsorption of metals onto catalyst supports. In Catalyst Preparation: Science and Engineering; Regalbuto, J.R., Ed.; Taylor and Francis: Boca Raton, FL, USA, 2007. [Google Scholar]
  34. Regalbuto, J.R. A scientific method to prepare supported metal catalysts. In Surface and Nanomolecular Catalysis; Richards, R., Ed.; CRC Press: Boca Raton, FL, USA, 2006. [Google Scholar]
  35. Seuser, G.S.; Banerjee, R.; Metavarayuth, K.; Brandt, A.J.; Maddumapatabandi, T.D.; Karakalos, S.; Lin, Y.; Regalbuto, J.R.; Chen, D.A. Understanding uptake of Pt precursors during strong electrostatic adsorption on single-crystal carbon surfaces. Top. Catal 2017. [Google Scholar] [CrossRef]
  36. O’Connell, K.; Regalbuto, J.R. High sensitivity silicon slit detectors for 1 nm powder XRD size detection limit. Catal. Lett. 2015, 145, 777–783. [Google Scholar] [CrossRef]
  37. Banerjee, R.; Liu, Q.; Tengco, J.M.M.; Regalbuto, J.R. Detection of Ambient Oxidation of Ultrasmall Supported Platinum Nanoparticles with Benchtop Powder X-Ray Diffraction. Catal. Lett. 2017, 147, 1754–1764. [Google Scholar] [CrossRef]
  38. Gupta, V.; Saleh, T.A. Syntheses of Carbon Nanotube-Metal Oxides Composites, Adsorption and Photo-degradation. In Carbon Nanotubes—From Research to Applications; Bianco, S., Ed.; IN TECH: Rijeka, Croatia, 2011; ISBN 978-953-307-500-6. [Google Scholar]
  39. Guadagno, L.; Raimondo, M.; Vittoria, V.; Vertuccio, L.; Lafdi, K.; Vivo, B.D.; Lamberti, P.; Spinelli, G.; Tucci, V. The role of carbon nanofiber defects on the electrical and mechanical properties of CNF-based resins. Nanotechnology 2013, 24, 305704–305714. [Google Scholar] [CrossRef] [PubMed]
  40. Rodriguez, F.R. The role of carbon materials in heterogeneous catalysis. Carbon 1998, 36, 159–175. [Google Scholar] [CrossRef]
  41. Wojdyr, M. Fityk: A general-purpose peak fitting program. J. Appl. Crystallogr. 2010, 43, 1126–1128. [Google Scholar] [CrossRef]
  42. Datye, A.K.; Xu, Q.; Kharas, K.C.; McCarty, J.M. Particle size distributions in heterogeneous catalysts: What do they tell us about the sintering mechanism? Catal. Today 2006, 111, 59–67. [Google Scholar] [CrossRef]
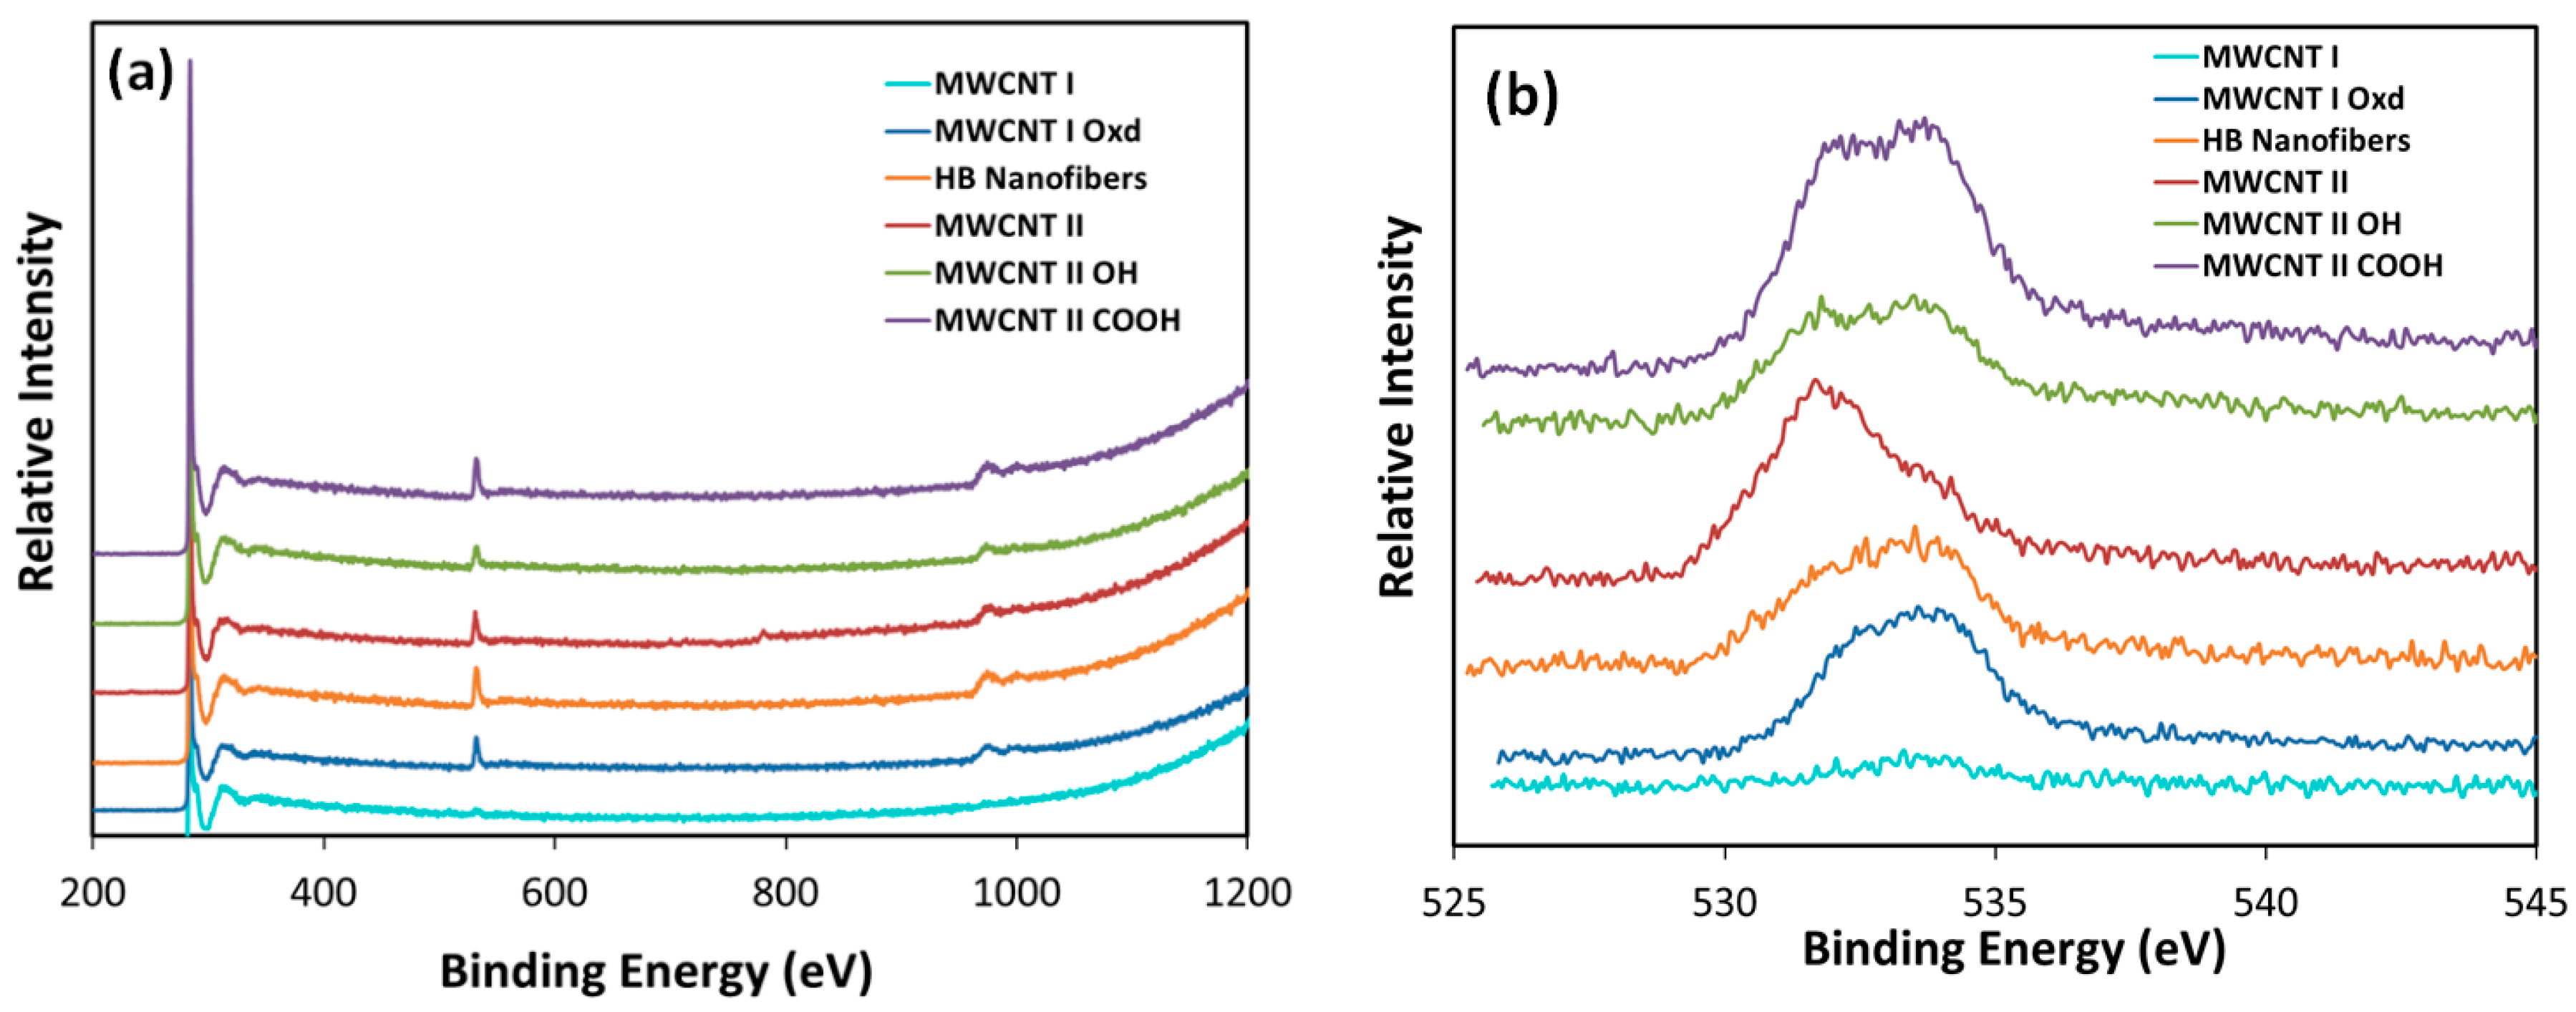
Figure 1. (a) XPS survey scans and (b) O 1s peaks for specialty carbons.
Carbon 04 00012 g001
Figure 2. Uptake plots using Pt (II) tetraammine (PTA) and Pt (IV) hexachloride (PHC) for: (a) MWCNT I; (b) MWCNT I Oxd; (c) HB Nanofibers; (d) MWCNT II; (e) MWCNT II OH; and (f) MWCNT II COOH. Asterisks indicate pH of large batch preparation.
Carbon 04 00012 g002aCarbon 04 00012 g002b
Figure 3. XRD plots with deconvolutions inset for: (a) MWCNT I; (b) MWCNT I Oxd; (c) HB Nanofibers; (d) MWCNT II; (e) MWCNT-II OH; and (f) MWCNT-II COOH using CPA and (g) MWCNT-II COOH using PTA.
Carbon 04 00012 g003
Figure 4. STEM images and particle size histograms for: (a) MWCNT I; (b) MWCNT I Oxd; (c) HB Nanofibers; (d) MWCNT II; (e) MWCNT II OH; (f) MWCNT II COOH using PHC; and (g) MWCNT II COOH using PTA.
Carbon 04 00012 g004aCarbon 04 00012 g004b
Figure 5. STEM images for 11.1Pt/ MWCNT II COOH showing (a) Initial- no tilt; (b) +5° tilt; (c) +15 tilt; and (d) Final-no tilt.
Carbon 04 00012 g005
Table 1. Summary of supports, precursors, synthesis pH, and particle sizes.
Preparation MethodMetal Loading %Carbon TypeParticle Size (nm)Method for SizeRef.
Reduction (ethylene glycol)10CNT2.7XRD[5]
Reduction (ethylene glycol)20CNT2.67XRD[6]
Reduction (ethylene glycol)20CNT3TEM[7]
Reduction10CNT2.95 ± 0.33TEM[8]
Reduction (ethylene glycol)4.87CNT3.42 ± 0.58TEM[9]
Reduction (ethylene glycol)19.6CNT4.7TEM[10]
Reduction (ethylene glycol)5MWCNT2.2XRD[11]
Reduction NaBH424.8MWCNT6.5TEM[12]
Reduction19–23CNW3.4–5.3XRD[13]
Reduction (Borohydride)3.5CNS5.2XRD[14]
Reduction (ethylene glycol)40CNF4.0XRD[15]
Reduction (ethylene glycol)20CNF3.1XRD[16]
Polyol20CNT2-3TEM[17]
Polyol20MWCNT1.7TEM[18]
Polyol12.4MWCNT3.9TEM[19]
Colloidal method20CNF2.9–4.4TEM[20]
Impregnation-reduction-deposition2CNT4.0–4.5TEM[21]
Atomic layer deposition16.2CNT2TEM[22]
Incipient-wetness impregnation1CNT4.6TEM[23]
Wet impregnation1CNT2.7TEM[24]
Microwave heating method19.5CNT2.5TEM[25]
Electrodeposition-CNT1.5XRD[26]
Radio frequency magnetron sputtering29.2CNF3.6TEM[27]
Table 2. Summary of supports, precursors, synthesis pH and particle, sizes.
SupportPrecursorBET Area (m2/g)PZCAdsorption pHMetal Loading (wt %)XRD Size (nm)STEM Size (nm)
PtPt3O4
MWCNT IPHC3015.44.38.32.71.34.2
MWCNT I OxdPTA3082.712.15.32.01.11.7
MWCNT IIPHC3029.35.77.61.61.62.9
MWCNT II OHPHC5585.95.5141.01.41.8
MWCNT II COOHPTA4163.111.96.41.21.11.5
PHC311.11.11.31.7
HB NanofibersPHC545.431.71.10.91.5