1. Introduction
Biochar is the solid carbonaceous product of lignocellulosic biomass heated under limited oxygen supply, a process known as slow pyrolysis. Its principal uses span soil amendment (carbon sequestration, water retention, and cation exchange capacity), the adsorption of heavy metals and organic pollutants from aqueous media, and acting as a structural support for catalysts and microbial communities [
1,
2,
3]. Across all three application domains, effectiveness depends on pore structure: surface area and micropore volume set adsorption capacity, while the meso- and macropore network governs mass transport resistance during both uptake and regeneration. Translating pyrolysis operating conditions into predictable pore structure is therefore a prerequisite for rational process design, yet no general predictive framework exists for slow pyrolysis biochar.
The pore structure of biochar is conventionally described by four scalar quantities determined from
physisorption at 77 K, BET surface area (
, m
2/g), total pore volume (
, cm
3/g), micropore volume (
, cm
3/g), and mean pore diameter (
, nm), computed by the BET and BJH methods [
4,
5,
6]. These scalar descriptors summarize a continuous pore size distribution (PSD) spanning micropores (<2 nm), mesopores (2–50 nm), and macropores (>50 nm). The shape of the PSD (how pore volume is partitioned across size classes) determines not only total capacity but also the selectivity and kinetics of mass transfer, so predicting it from operating conditions has direct engineering value. It should be stated at the outset that “porosity” in this work is operationalized through the three scalar descriptors
,
, and
; the full differential PSD curve and the surface fractal dimension are not modeled, because the compiled literature reports only these summary statistics. The correlations developed here therefore describe the magnitude of pore development, not the detailed evolution of pore size distribution, which remains future work.
Final pyrolysis temperature
T exerts strong, systematic control on pore development within a given feedstock. Below approximately 400 °C, the devolatilization of hemicellulose and cellulose produces an amorphous char with
typically below 50 m
2g
−1; above 400 °C, progressive graphitization and tar evolution open a micropore network, and
rises sharply, reaching 200 m
2g
−1 to 500 m
2g
−1 at 700 °C to 800 °C for wood-derived biochars [
7,
8]. Heating rate
and residence time modulate the temperature response curve by controlling exposure duration at intermediate temperatures during the charring sequence [
9]. Feedstock composition (cellulose, hemicellulose, and lignin fractions and mineral content) sets the amplitude of that response at any given temperature [
2]. A central result of the present work is that this compositional amplitude, rather than temperature itself, accounts for the larger share of the variance in
across the lignocellulosic feedstock space; temperature-only correlations, although mechanistically well-grounded, are therefore inherently limited as cross-feedstock predictors.
Current practice characterizes biochar pore structure on a case-by-case basis: for each feedstock–temperature combination,
adsorption isotherms are collected,
and
are extracted, and BJH analysis yields the PSD. This approach is resource-intensive, and the results are protocol-sensitive: Sigmund et al. [
10] report that degassing temperature alone can shift the measured
by up to
, compounding the inter-study variability that any predictive model must accommodate [
11]. Machine learning models have addressed this gap: Li et al. [
12] apply gradient boosting to predict
and
from 27 input features with high in-sample accuracy, but the approach requires large training datasets, lacks physical interpretability, and cannot extrapolate reliably beyond the feature range of the training corpus. Semi-empirical correlations with explicit functional forms linking
T and
to pore structure descriptors (the standard approach in activated carbon science [
13,
14]) have not been systematically developed for slow pyrolysis biochar across multiple feedstock categories.
Two methodological gaps stand out. First, no prior work has fitted parametric pore size distribution functions to BJH data from slow pyrolysis biochar and then correlated the PSD shape parameters to pyrolysis temperature, a connection that would enable PSD prediction from operating conditions alone. Second, while the qualitative relationship between
T and
is well documented [
7,
8], explicit functional forms with fitted parameters and uncertainty quantification have not been established for slow pyrolysis biochar across the five major lignocellulosic feedstock categories (wood, herbaceous, grass, shell, mixed). Without such correlations, practitioners cannot predict
or
for a new (feedstock,
T) combination without conducting new experiments.
This paper directly addresses the second gap through a systematic literature data approach. We compile a calibration dataset of 45 records from seven open access studies covering 12 distinct feedstocks over 300 °C to 800 °C and fit Arrhenius-type (phenomenological, not kinetic) and power-law semi-empirical correlations to , , and by nonlinear least squares. Full parametric pore size distribution modeling is beyond the present scope, since the compiled sources report only scalar descriptors rather than differential volume curves, and is identified as future work. The estimation requires only the summary pore structure statistics available in the published literature. The scope is explicitly restricted to the solid carbonaceous product; volatile-phase yields (syngas composition, bio-oil fractions, and global mass balances) are outside the present framework.
The main contributions of this work are:
- (i)
A compiled and quality-screened calibration dataset of 45 literature records from seven open access studies spanning 12 lignocellulosic feedstocks and 300 °C to 800 °C, with documented inclusion and exclusion criteria and per-record data quality flags.
- (ii)
Arrhenius-type correlations for (pooled and stratified by feedstock category, where identifiable), , and (pooled), with fitted parameters, confidence intervals, and AIC/BIC comparison against a power-law alternative.
- (iii)
The quantitative finding that feedstock category dominates variance in : pooled calibration achieves (MAPE = ), while stratification by feedstock reduces error to MAPE = for the grass category, which directly bounds the scope of temperature-only predictive models.
- (iv)
A leave-one-study-out cross-validation protocol that provides a study-level generalization test of the fitted correlations, independent of in-sample fit metrics.
Unlike machine learning surrogates that optimize predictive accuracy given large training sets [
12], the semi-empirical framework presented here is designed for settings where data are sparse and interpretability matters: (i) the fitted parameters (
,
) carry a physically meaningful interpretation as apparent structural activation energies or scaling exponents; (ii) calibration requires only the summary pore structure statistics already available in the published literature; and (iii) the calibration envelope is explicitly defined, which makes extrapolation boundaries transparent. To test whether these design choices come at the cost of predictive accuracy, we benchmark the correlations for all three descriptors against ordinary least squares and random forest surrogates trained on the same data (
Section 5.6); the data-driven models fit the training data better yet do not generalize better under study-level cross-validation, empirically supporting the parsimonious form for a dataset of this size.
The specific objectives of this work are: (1) to compile and quality-screen a calibration dataset of literature records spanning multiple lignocellulosic feedstock categories and the 300–800 °C temperature range; (2) to fit and compare Arrhenius-type and power-law semi-empirical correlations for , , and by nonlinear least squares, both pooled and stratified by feedstock category; (3) to quantify prediction uncertainty through bootstrapped confidence intervals and leave-one-study-out cross-validation; and (4) to delineate the calibration envelope within which the proposed correlations provide reliable estimates and beyond which extrapolation is unsupported.
This paper proceeds as follows.
Section 2 defines the pore structure descriptors and derives the semi-empirical correlation framework applied in this study.
Section 3 describes the literature compilation protocol, inclusion criteria, and summary statistics of the calibration dataset.
Section 4 details the nonlinear least squares fitting procedure, functional form selection, and model evaluation.
Section 5 presents the calibration results, feedstock-stratified fits, and the leave-one-study-out validation.
Section 6 interprets the results in their thermochemical and methodological context.
Section 7 states the main conclusions and the conditions under which the fitted correlations are applicable.
5. Results
5.1. Model Selection
AIC and BIC were computed for every target-by-group combination; the results are summarized in
Table 2. In every case,
(Arrhenius minus power-law) falls below 2, the conventional threshold below which both models are treated as empirically indistinguishable at the available sample size [
21]. Consequently, the available data do not provide statistical grounds for preferring one functional form over the other.
The Arrhenius form is selected as the primary model on the basis of physical interpretability: the fitted parameter
admits a mechanistic reading as an apparent composite activation energy for pore opening, linking the correlation to the overlapping devolatilization and polycondensation reactions that govern pore development (
Section 2.2.2), and is directly comparable to the structural activation energies reported in the activated carbon literature [
13,
14]. This follows the convention established in that literature for distinguishing phenomenological structural correlations from kinetic TGA measurements. The AIC margins do not alter this choice; at the available sample sizes, both functional forms are effectively equivalent predictors, and the Arrhenius parameterization offers the more physically interpretable result. Fitted parameter tables for
and for
and
appear in
Table 3 and
Table 4, respectively.
5.2. BET Surface Area Correlations
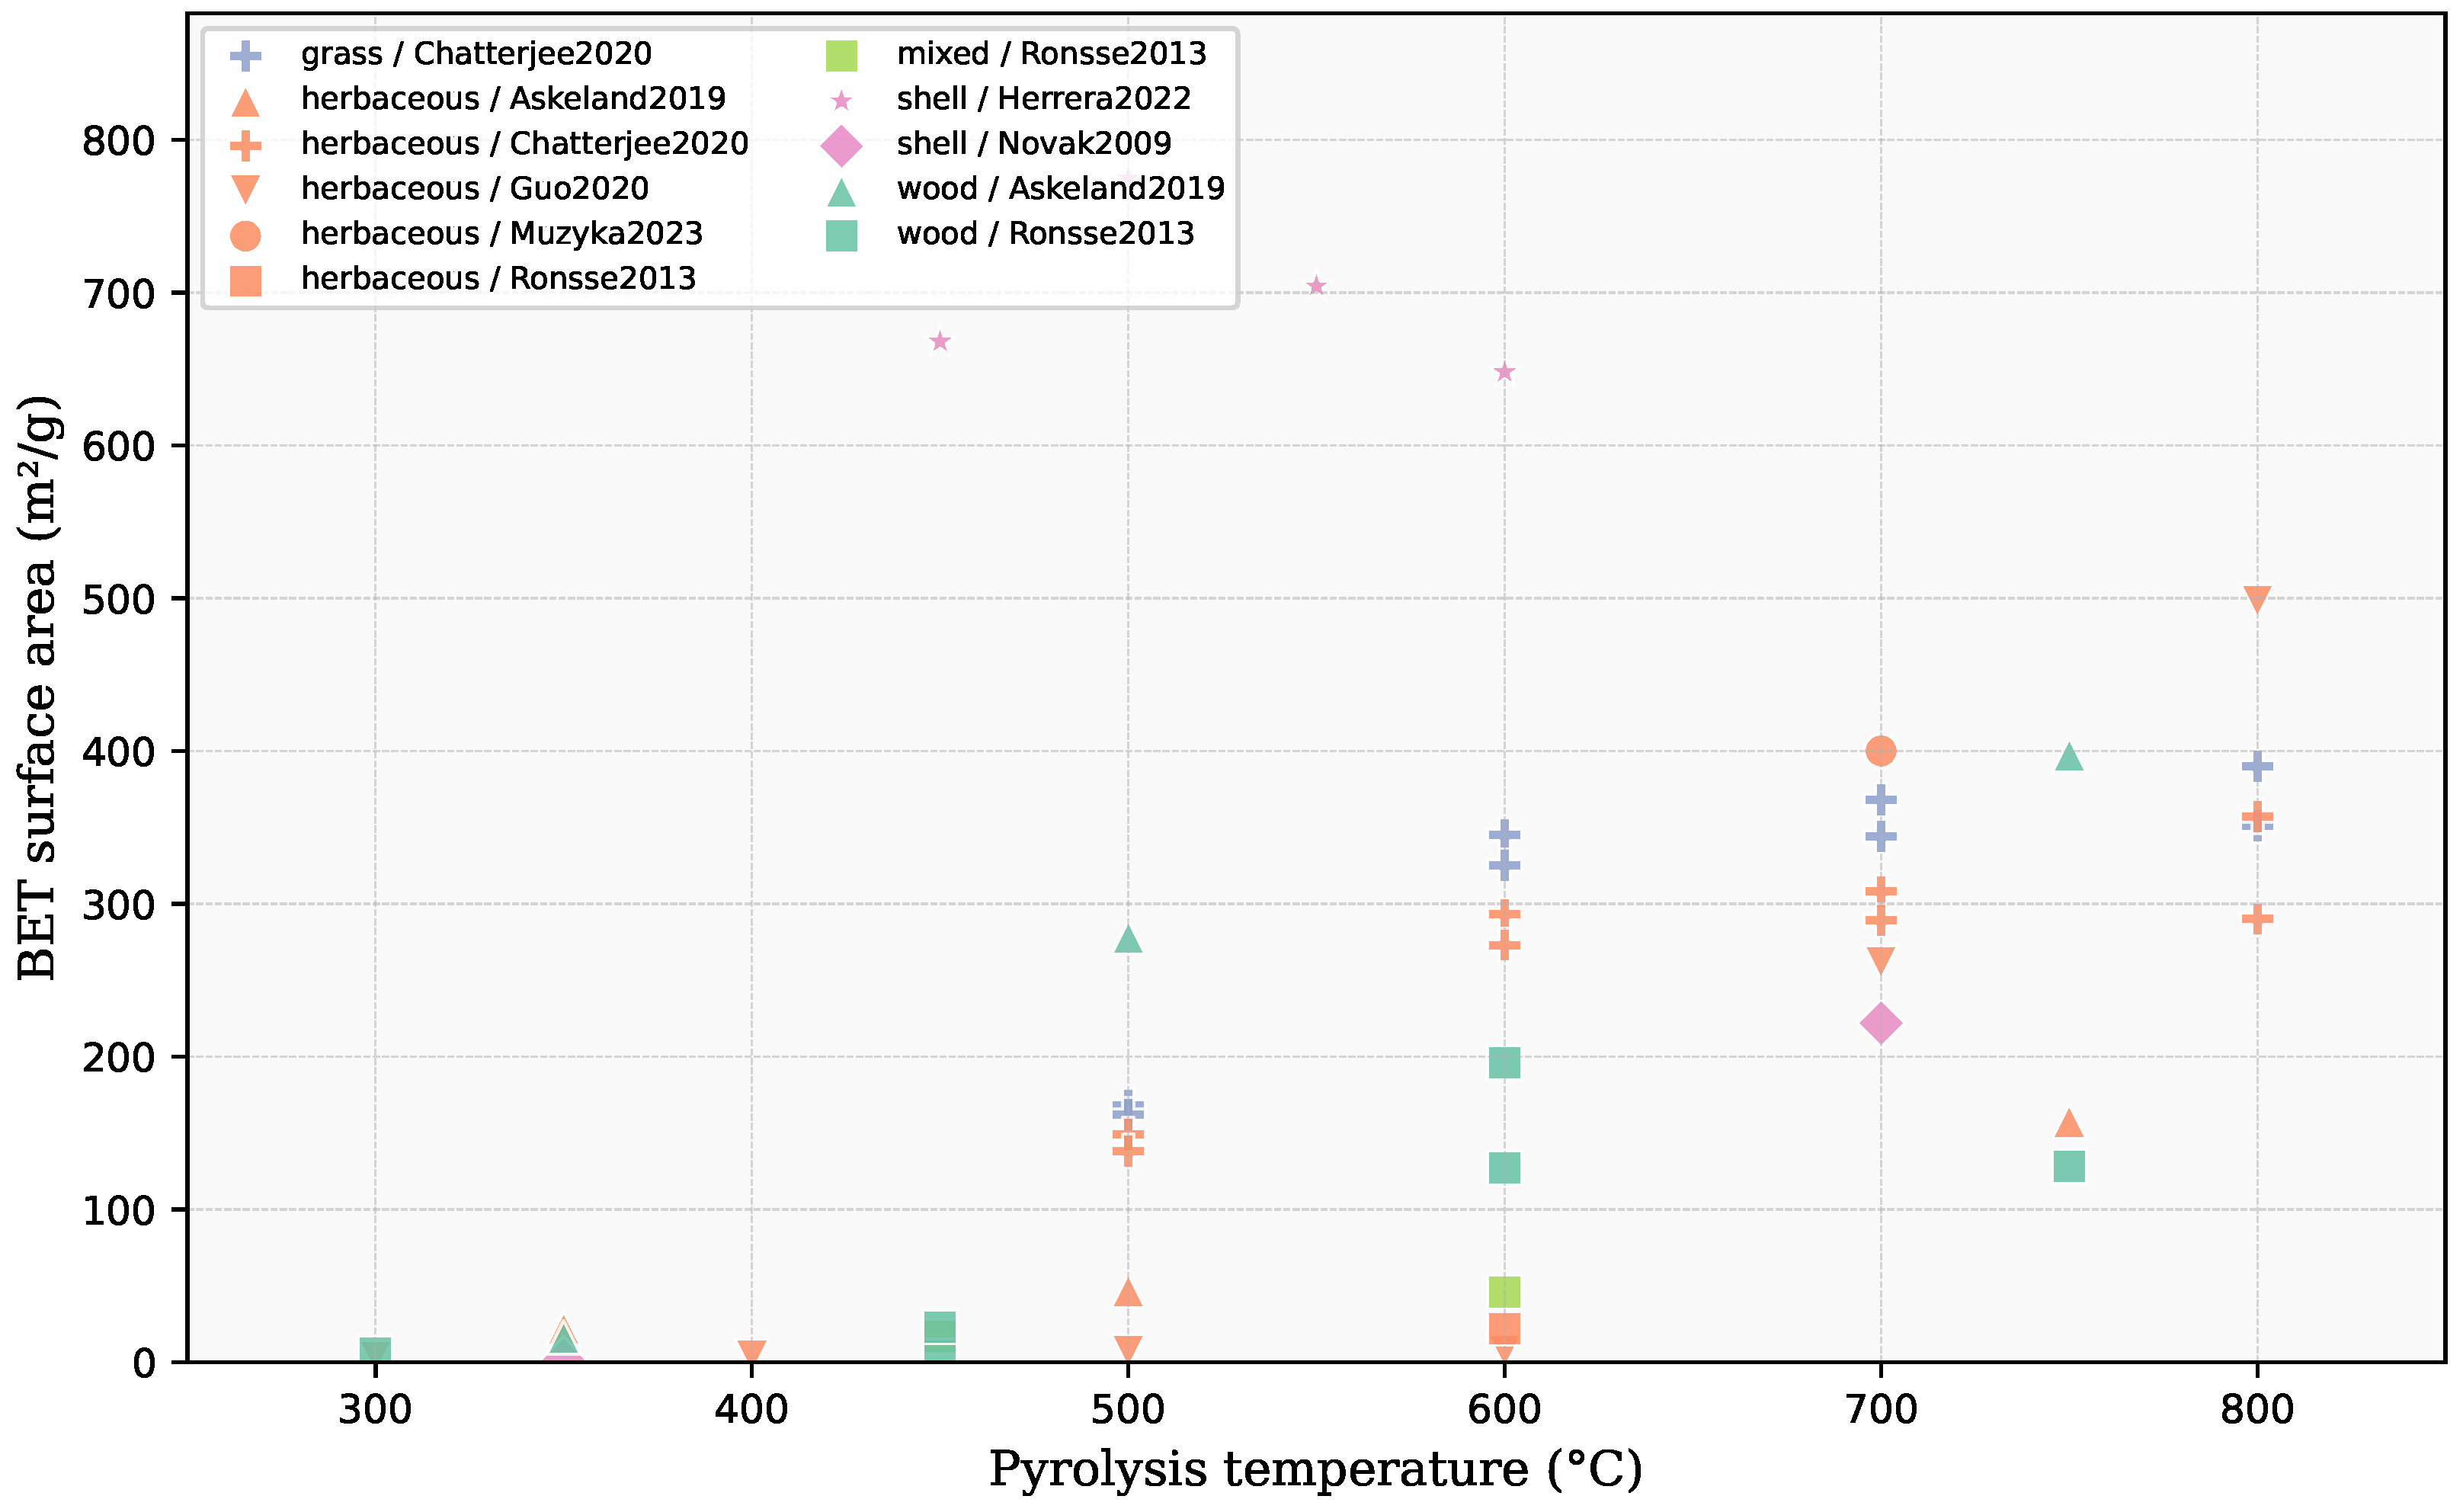
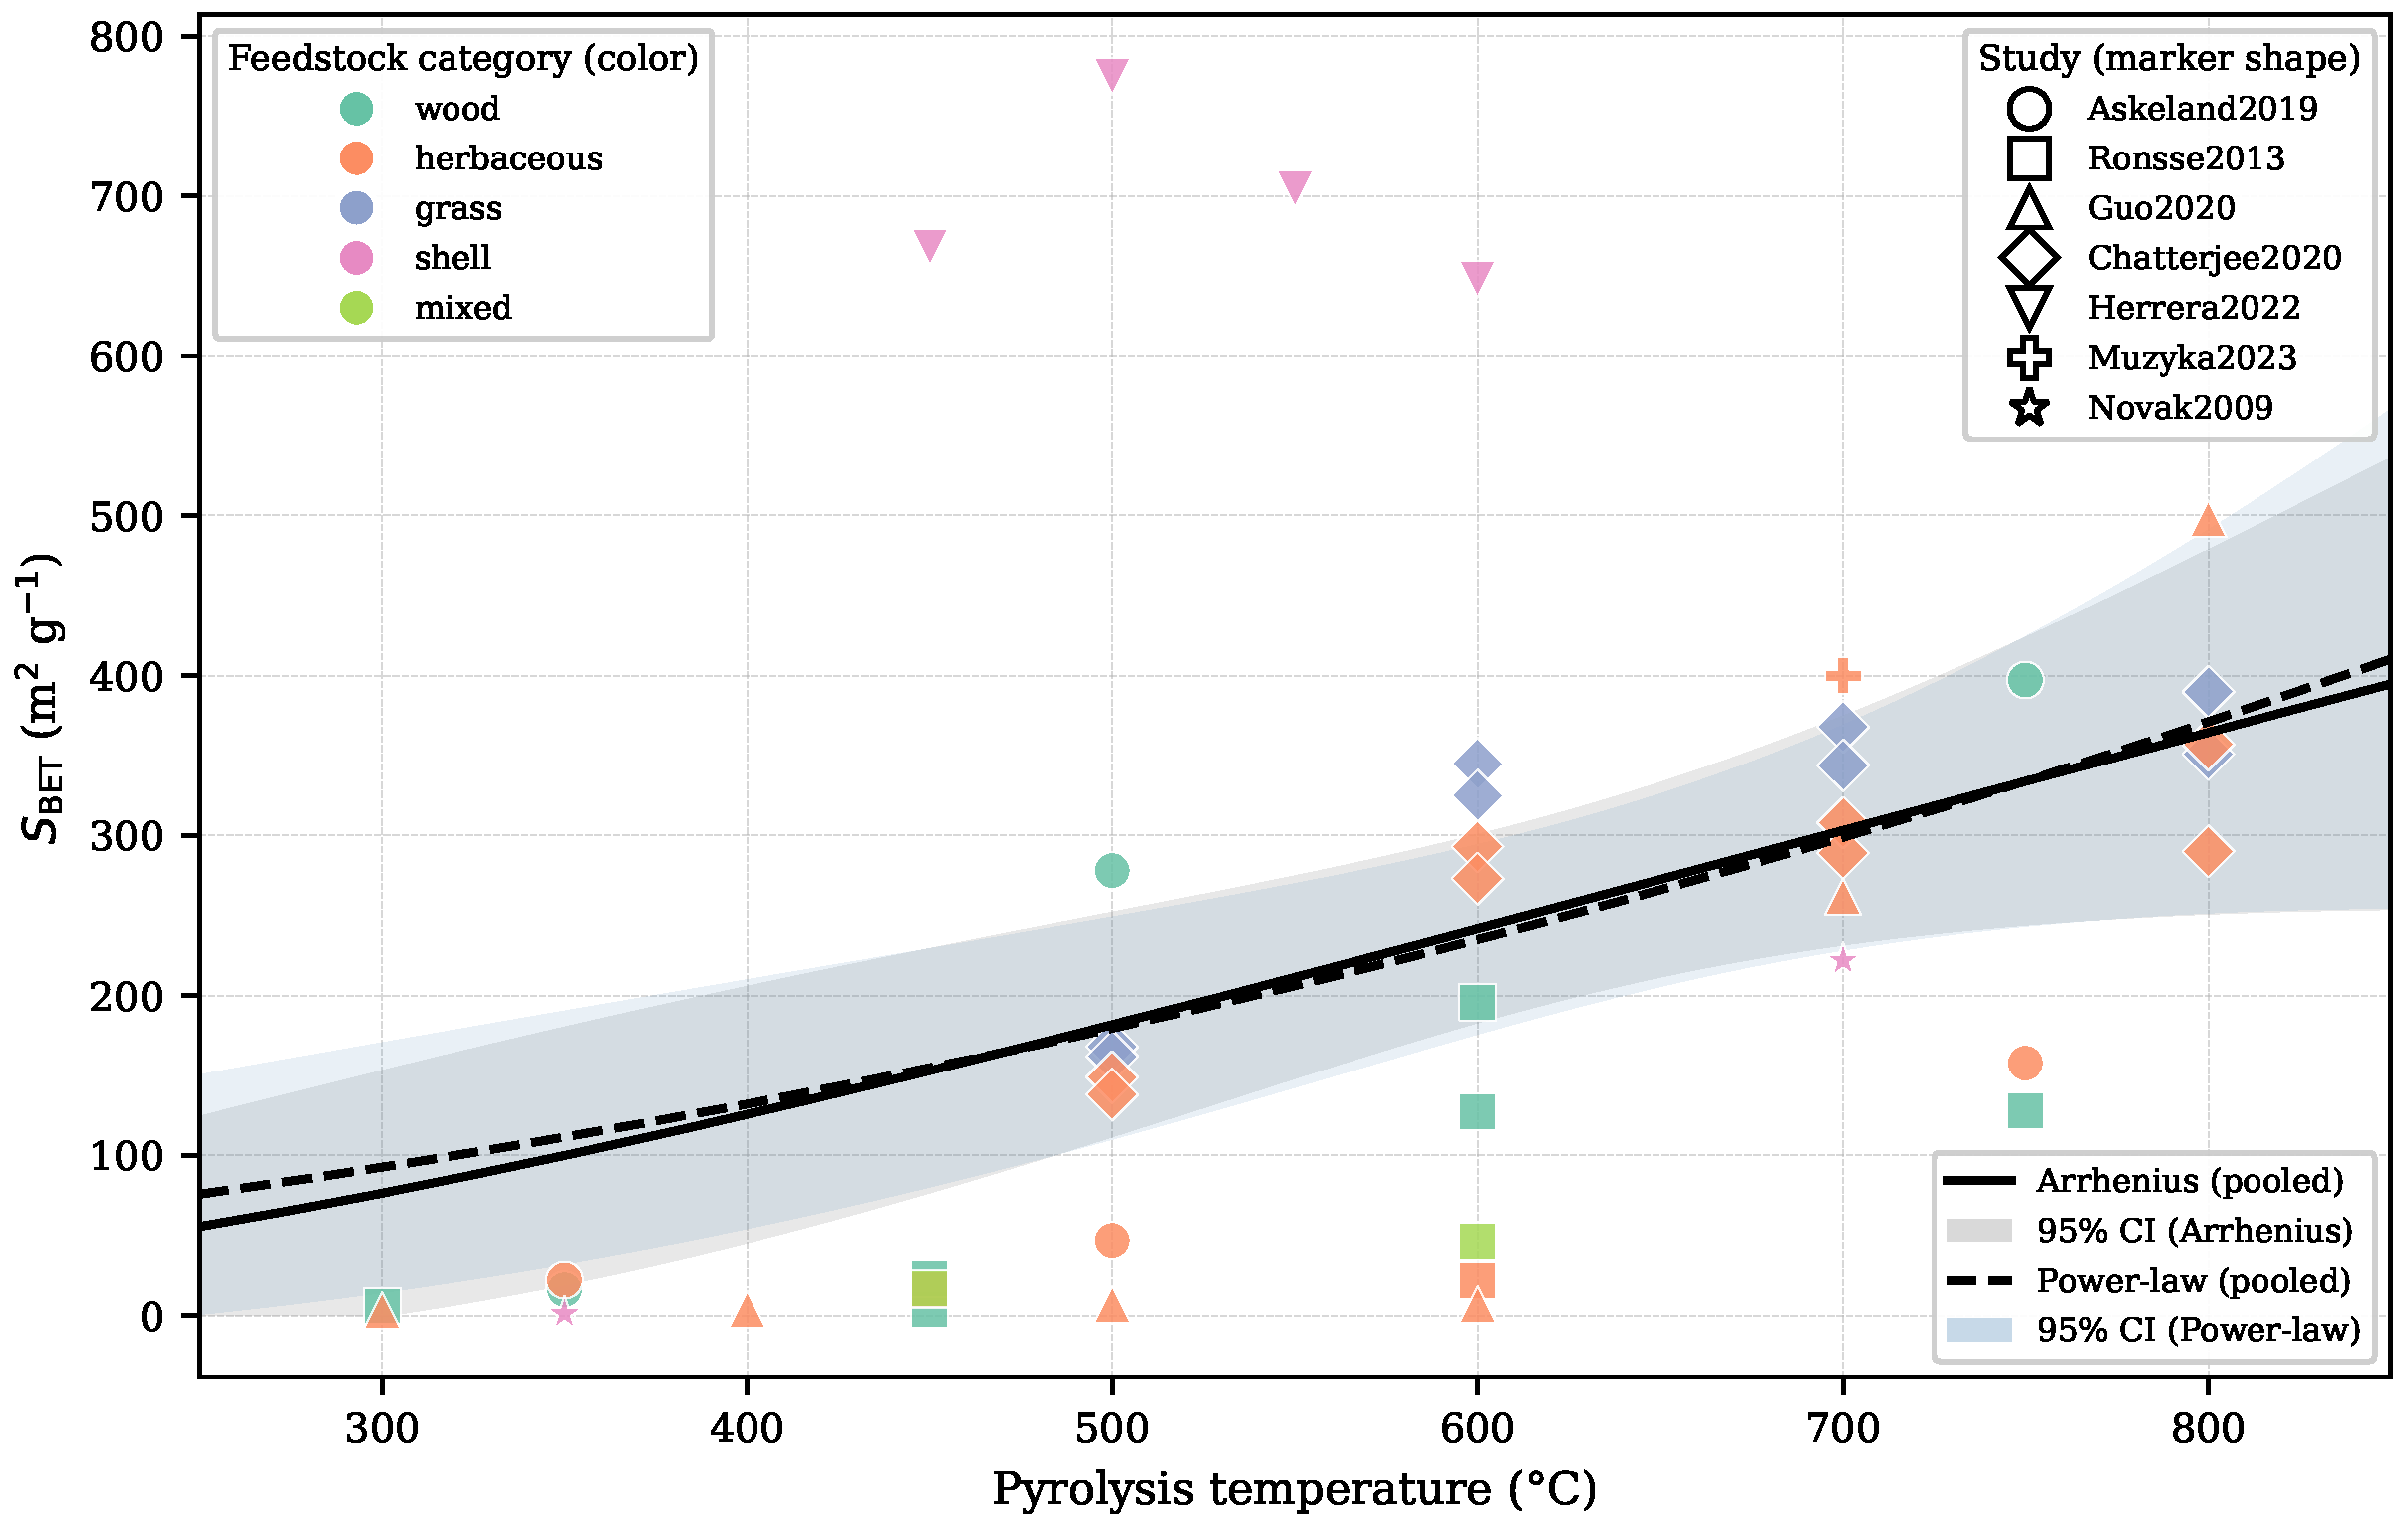
The pooled Arrhenius correlation fitted to all 45 records accounts for of the variance in (; ). Separating records by feedstock category reduces error sharply in groups with coherent temperature response: the grass group achieves and m2/g across records. The failure of the pooled model is not a fitting artifact; it reflects the structure of the data. The 45 records span a 250-fold range in —from approximately 1 m2/g at 300 °C for low-reactivity feedstocks to nearly 775 m2/g for rice husk at high temperatures—and temperature alone accounts for under of that range. The remaining variance is driven by feedstock differences in cell wall architecture, mineral content, and lignocellulosic composition, none of which enter the single-predictor correlation.
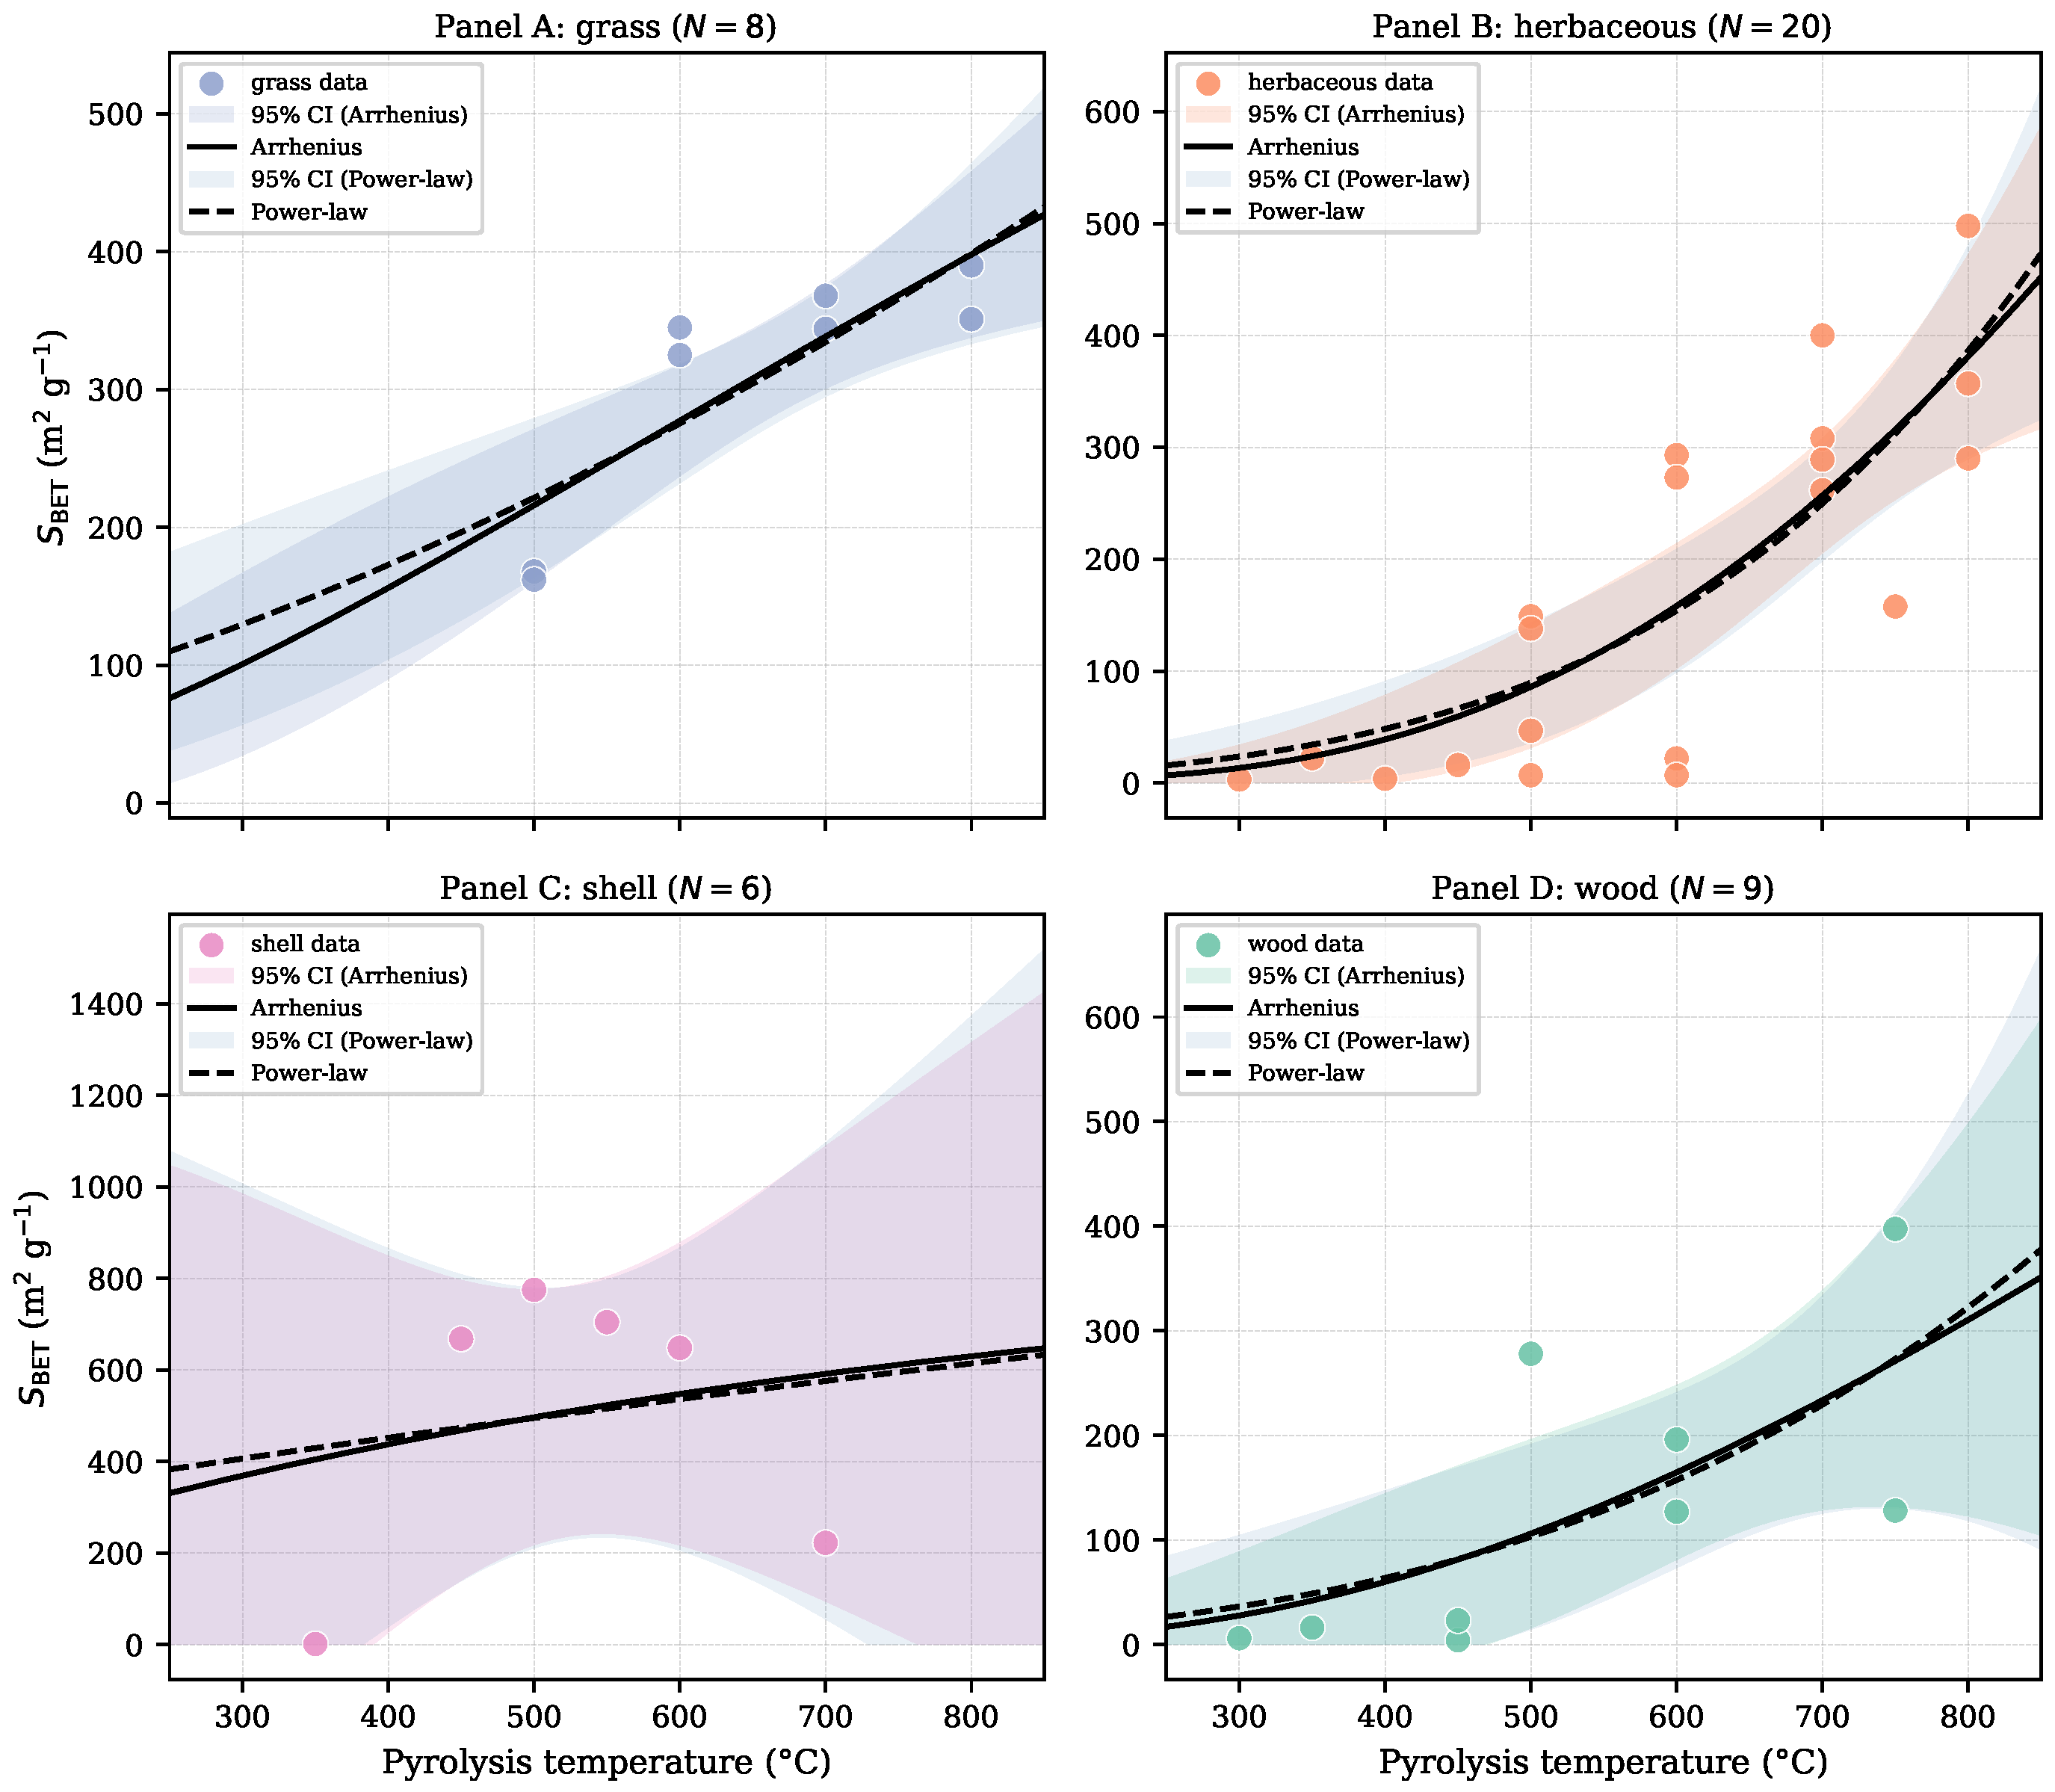
5.2.1. Grass Group (Best-Constrained Case)
The grass group pools miscanthus and switchgrass records exclusively from Chatterjee et al. [
17] (
). Both feedstocks show consistent temperature response across the 300 °C to 700 °C range, yielding estimated parameters
m
2/g and
J/mol (
CI: ±7676 J/mol; bootstrap
CI reported in
Table 3). The fitted
of 14.1 kJ/mol falls within the range of apparent activation energies reported for cellulosic devolatilization and is consistent with the mechanistic basis of Equation (
1).
Important caveat on generalization: Because all grass records originate from a single study with a common measurement protocol, the group MAPE of
reflects within-study prediction error rather than between-study generalization accuracy; see
Section 3.3 and
Section 6.3 for discussion.
5.2.2. Herbaceous Group
The herbaceous group () spans wheat straw, maize straw, and other crop residue materials drawn from multiple contributing studies, producing and = 90.1 m2/g. The high apparent activation energy ( = 34,248 J/mol, CI: ±17,180 J/mol) does not reflect a single kinetic mechanism; it is an artifact of pooling feedstocks with fundamentally different temperature response amplitudes. Maize straw undergoes an abrupt increase in above 700 °C (from approximately 7 m2/g to 498 m2/g as residual organic matter volatilizes at high pyrolysis severity), whereas wheat straw and other crop residues in the group remain below 100 m2/g at comparable temperatures. The single-curve correlation captures the average upward trend across these heterogeneous materials but cannot reproduce the between-feedstock amplitude difference that drives the large MAPE.
5.2.3. Wood and Shell Groups (Non-Identified)
Both groups exhibit
, for distinct structural reasons. In the wood group (
), pine sawdust from Askeland et al. [
16] reaches 397 m
2/g at 750 °C, while pine wood from Ronsse et al. [
8] yields 128 m
2/g to 196 m
2/g at 600 °C; both carry the same feedstock label at the category level. In the shell group (
), rice husk biochar from Herrera et al. [
18] records an
of 648 m
2/g to 775 m
2/g, an outlier among shell category materials that the correlation cannot anticipate from temperature alone. For both groups, the bootstrap confidence interval on the physically meaningful parameter (the apparent activation energy
) exceeds its point estimate: the shell group
carries a
CI half-width
the estimate, and the wood group half-width CI is
the estimate. (Identification is judged on
, which governs the temperature response; the pre-exponential
is an extrapolation to
far outside the data window and is expected to be imprecise even in well-identified groups such as the herbaceous one, so its wider interval is not by itself a sign of non-identification.) A CI half-width exceeding the estimate of
indicates that the temperature response itself is non-identified (the data do not constrain it) rather than merely imprecise. We therefore do not report fitted parameter values for the wood and shell groups: presenting numbers that the data cannot support would wrongly imply that they carry usable information. These two categories require additional data (and, for the shell group, subdivision by silica content) before any correlation can be identified, and no design use should be attempted in the interim.
The pooled and feedstock-specific
fits are shown in
Figure 2 and
Figure 3.
5.3. Total Pore Volume and Average Pore Diameter
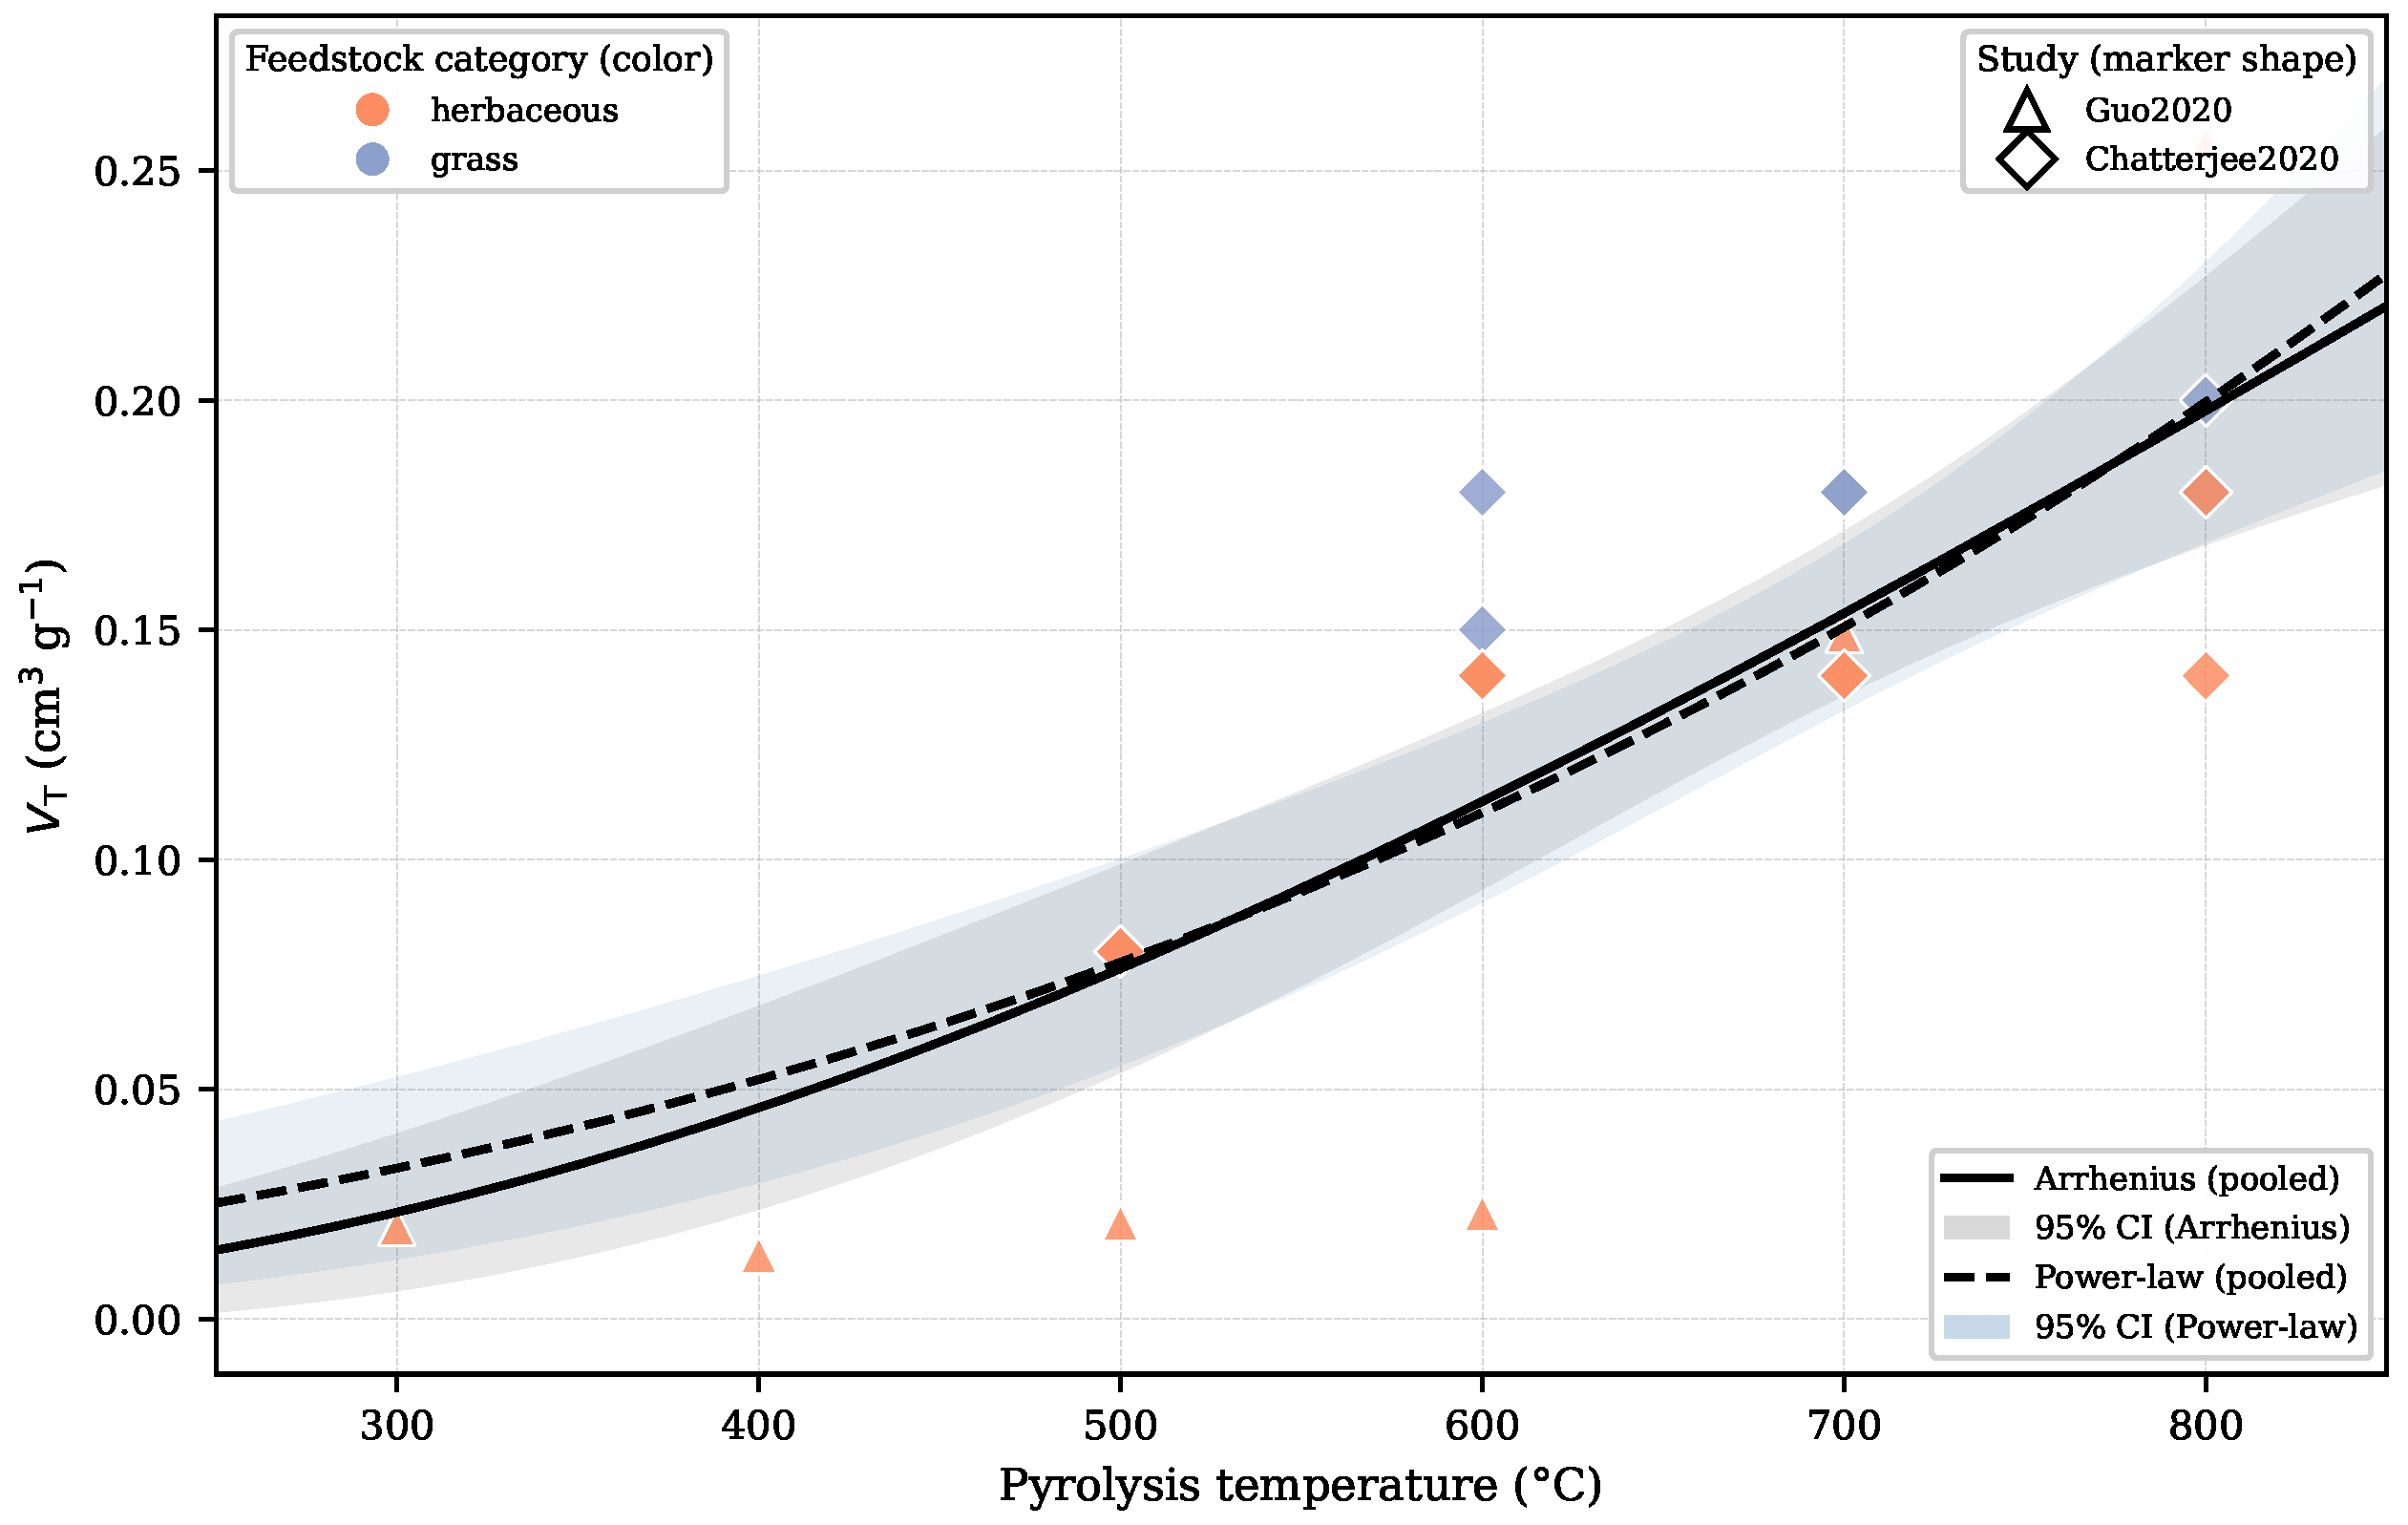
The pooled Arrhenius correlation for explains of variance across records (; ; = 0.0361 cm3/g). This is substantially higher predictive accuracy than that achieved for under the same pooled specification. The estimated pre-exponential is cm3/g, and the activation parameter is = 21,910 J/mol (95% CI: J/mol). The positive is consistent with the expected direction: increases with pyrolysis temperature as progressive devolatilization opens new pore channels above 500 °C. The relative insensitivity of to silica-rich outliers, compared with , explains the higher in the pooled fit.
The pooled fit for achieves across records (; nm). The estimated parameters are nm and J/mol (95% CI: ±6663 J/mol). The negative value of is physically meaningful: it implies that decreases as temperature rises, consistent with the preferential development of micropores at higher pyrolysis severity. As new micropores form with diameters well below 2 nm, the average across the pore population shifts downward even as total pore volume and surface area increase. This negative apparent activation parameter is an emergent consequence of the cylindrical geometry approximation (): when grows faster than with increasing , the ratio falls.
Subgroup fits for
were carried out for the grass and herbaceous groups, the only categories with
records after removing entries with missing
values; the results were consistent with the pooled trend in direction and order of magnitude.
Figure 4 shows the pooled
fit against the calibration data.
5.4. Cross-Validation Performance
Leave-one-study-out cross-validation (LOSO-CV) produces a mean MAPE of
and mean RMSE of 184 m
2/g across the 7 folds for
(
Table 5). A note on MAPE as a metric is warranted here. MAPE is inflated severely when any observation has a small true value near zero; a record with
m
2/g predicted as 10 m
2/g contributes
to the MAPE, whereas the same absolute error for a record near 100 m
2/g contributes only
. The large MAPE values reported here are therefore driven disproportionately by low-
records at pyrolysis temperatures below 400 °C, which are also the records most sensitive to degassing protocol variability [
10]. To clarify the model’s practical accuracy in the design-relevant range,
Table 5 also reports stratified MAPE separately for records with
m
2/g (the regime relevant for adsorption and soil amendment design) and records below that threshold. Restricted to the design-relevant range, the LOSO-CV MAPE falls to
(more than an order of magnitude below the pooled figure), whereas records below 50 m
2/g carry a MAPE near
. The headline
is thus dominated by near-zero low-temperature records and substantially overstates the error that matters for engineering design. RMSE provides a more stable overall error bound and should be consulted alongside MAPE when assessing practical prediction accuracy. The gap between LOSO-CV MAPE (
) and in-sample MAPE (
) signals that the correlation is shaped by the studies it sees; generalization across study boundaries is limited. The study-level MAPE figures span four orders of magnitude, which makes the mean a summary of heterogeneity rather than a single predictive benchmark.
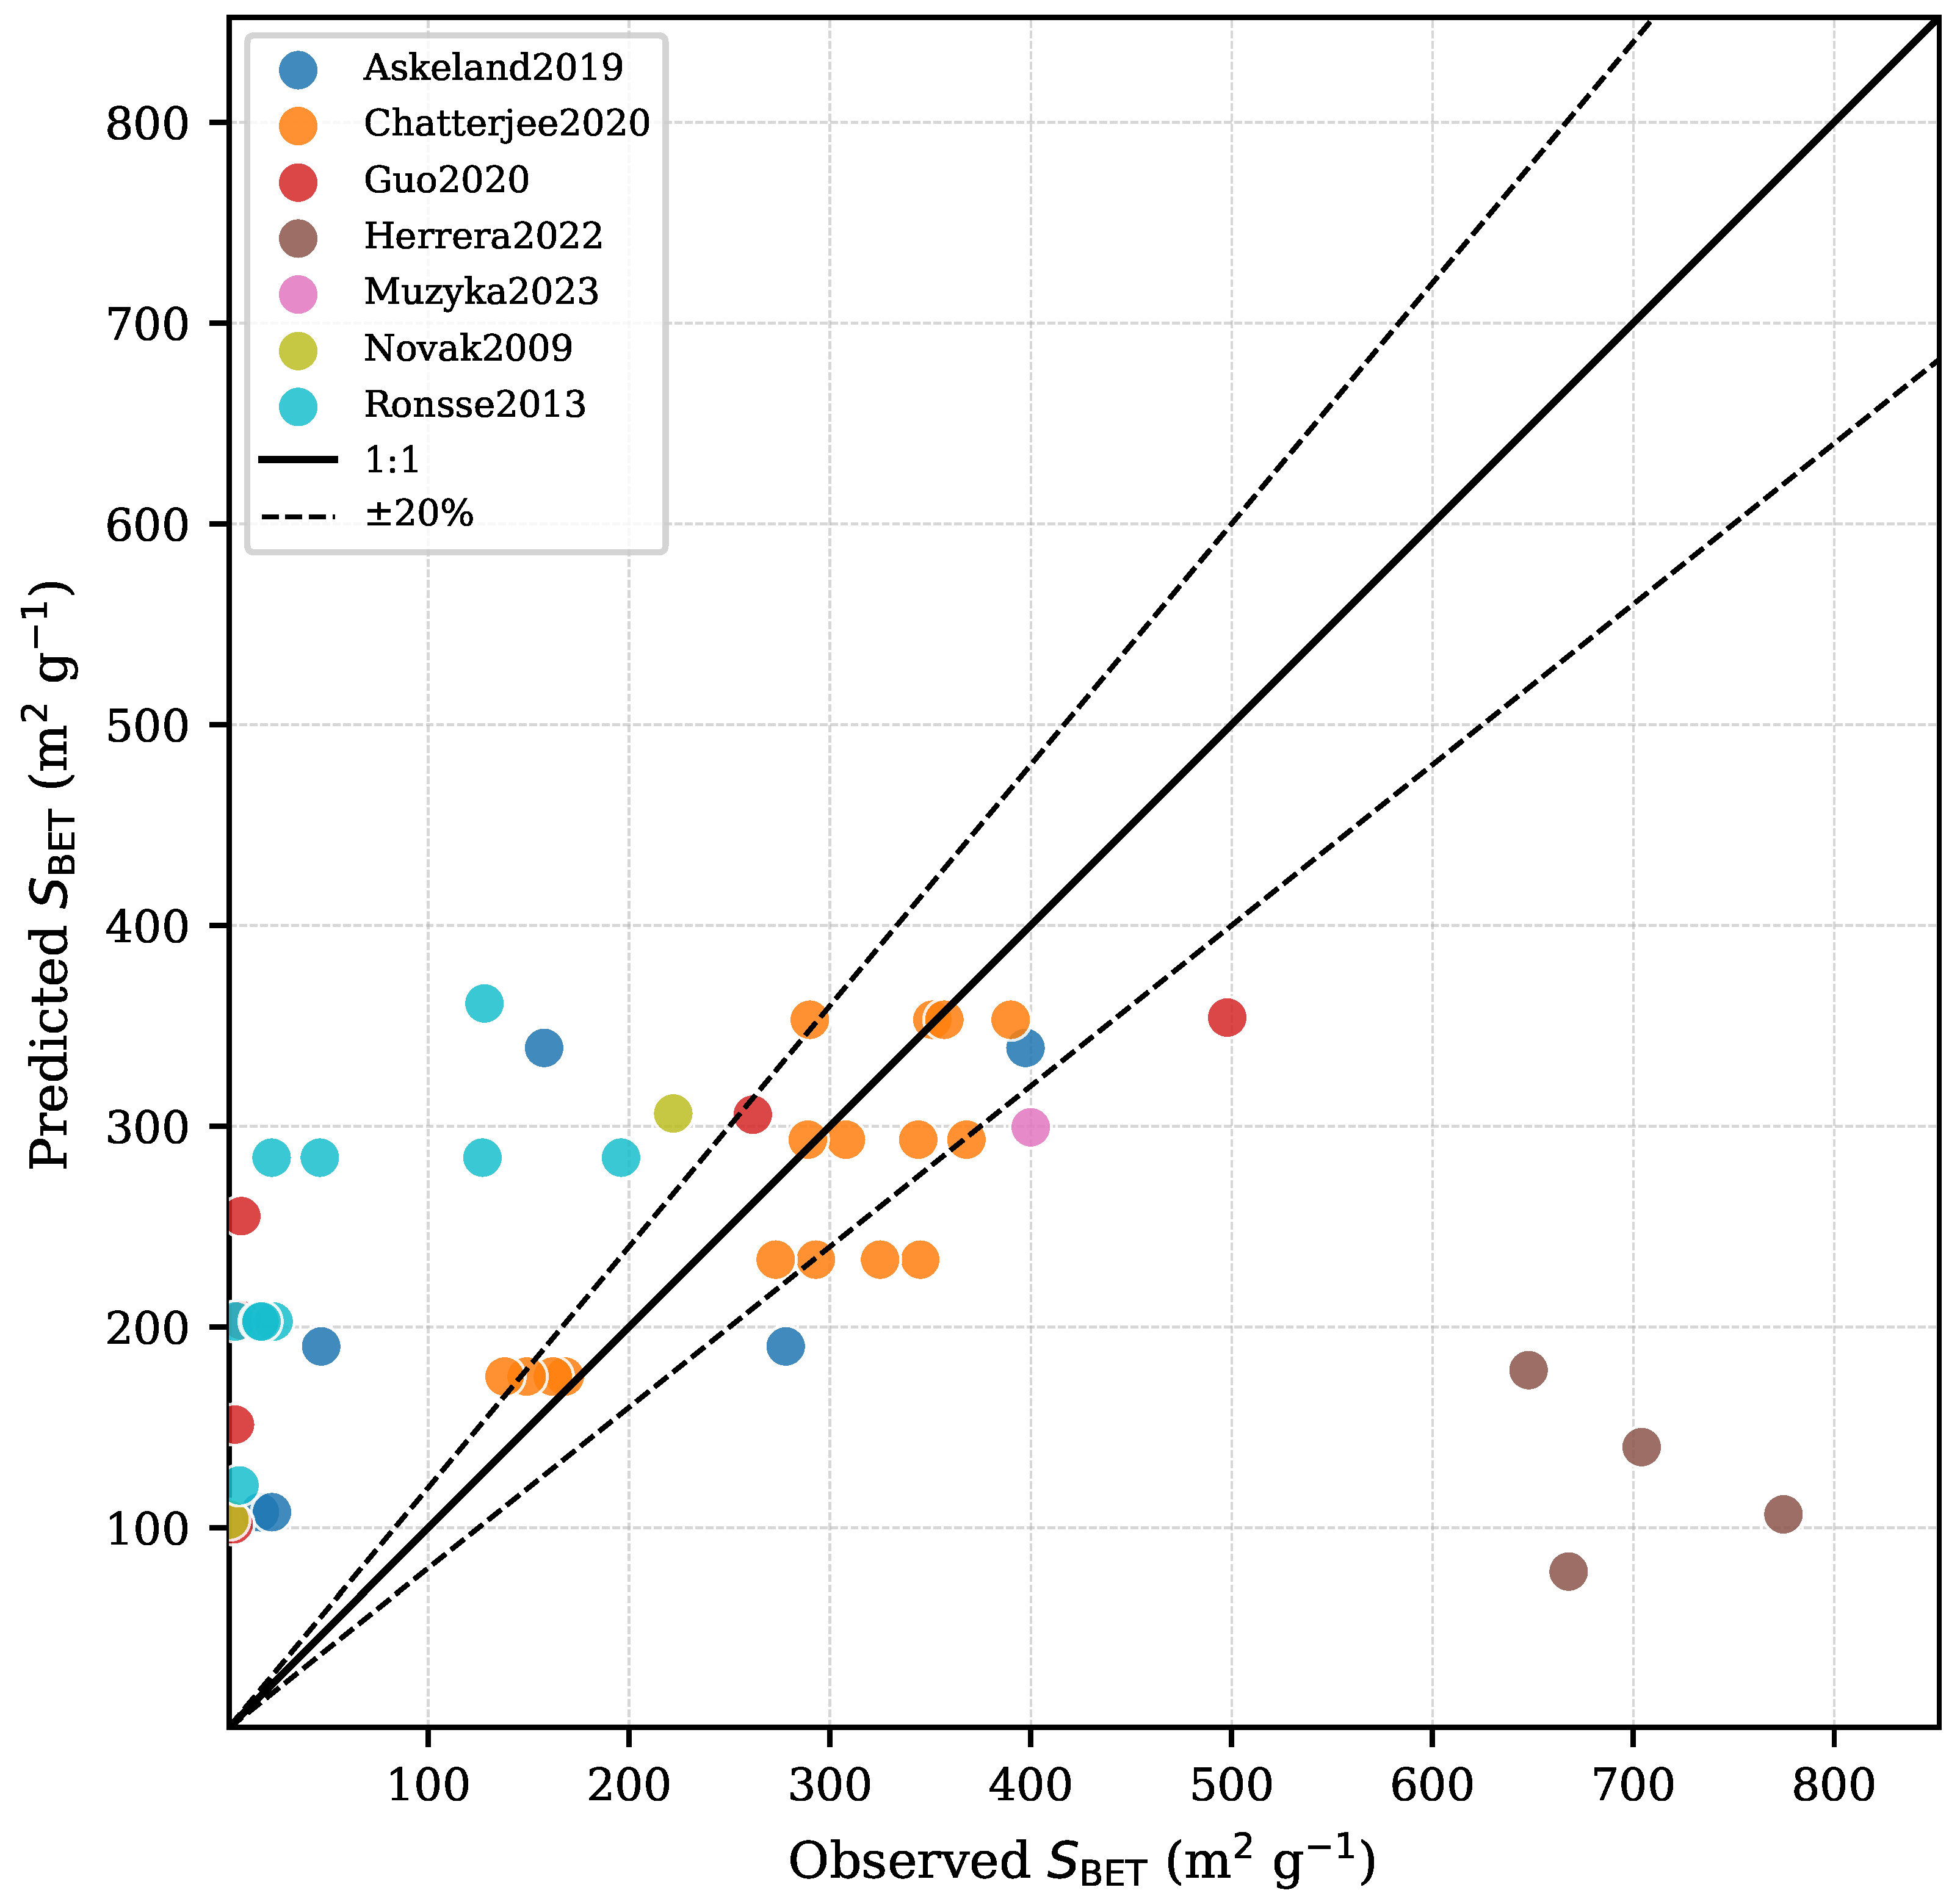
The held-out fold with the best performance is Chatterjee et al. [
17] (
;
;
= 51.2 m
2/g). This fold succeeds because the held-out records—four grass and herbaceous feedstocks pyrolyzed over a 500 °C to 800 °C range—occupy the same region of feedstock and temperature space as the training data. The trained model can interpolate within a populated region; it does so accurately.
The two worst-performing folds expose the limits of temperature-only extrapolation. Holding out Novak et al. [
19] (
,
) leaves the model without any shell category records in the training set yet asks it to predict pecan shell biochar. The model extrapolates into an unpopulated (feedstock,
) region and fails severely. Holding out (
,
) produces a comparable failure: maize straw biochar undergoes a sharp increase in
above 700 °C (from approximately 7 m
2/g to 498 m
2/g) that the remaining training studies give no basis for predicting. The intermediate folds for Herrera et al. [
18] (
) and Muzyka et al. [
9] (
) reflect partial overlap with training feedstock space.
Taken together, the LOSO-CV results confirm that the pooled Arrhenius correlation performs reliably only when the target feedstock and temperature range are already represented in the calibration data. Feedstock category is the dominant source of variation in
magnitude; temperature is secondary. Practitioners applying the correlation to a new feedstock outside the categories covered here should expect prediction errors that exceed the in-sample MAPE by one to two orders of magnitude.
Figure 5 shows the predicted versus observed values for each fold.
5.5. Residual Diagnostics
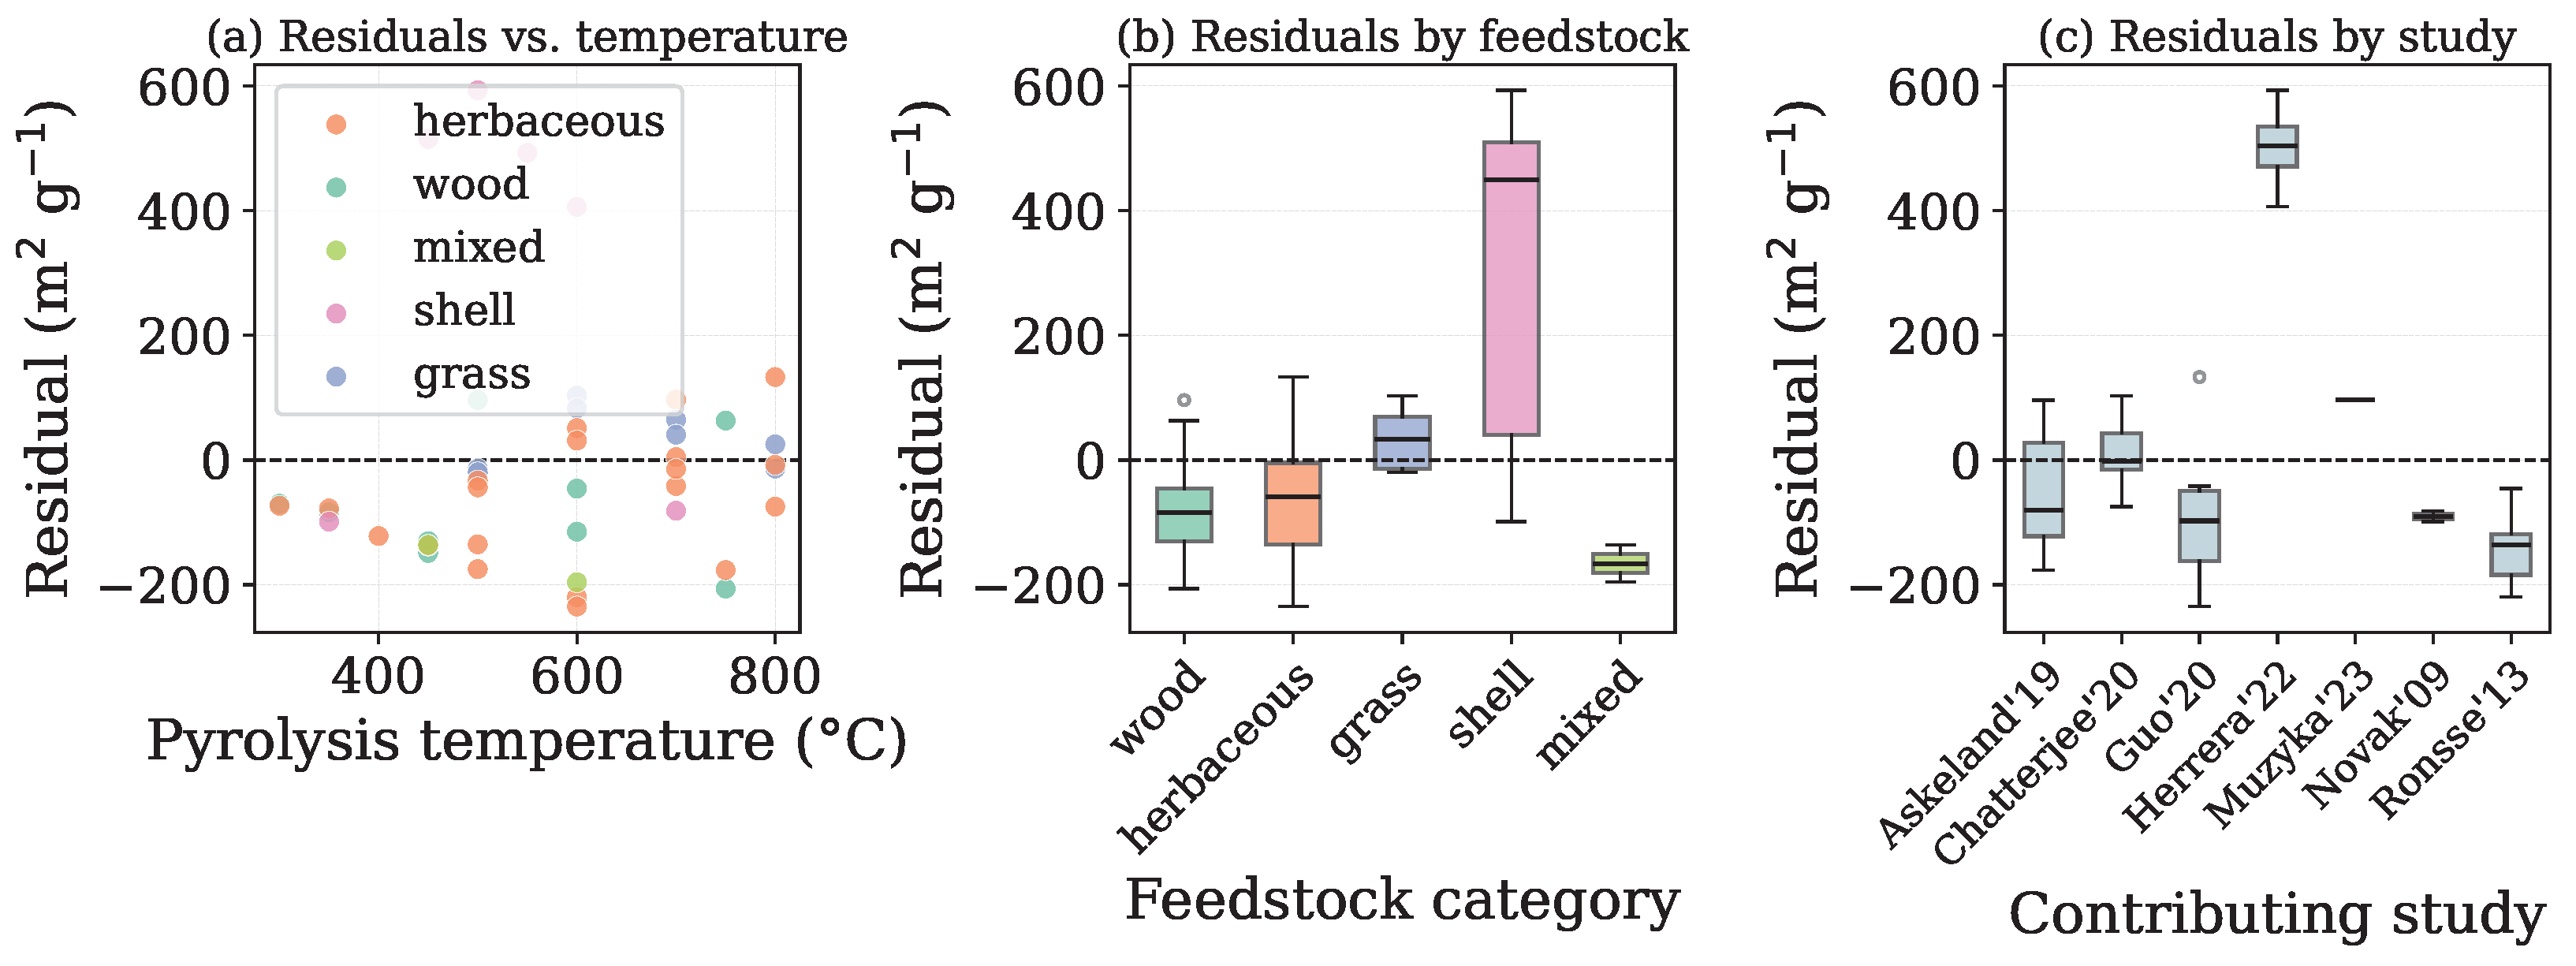
Figure 6 presents three complementary views of the in-sample residuals from the pooled Arrhenius fit to
.
Panel A (residuals versus pyrolysis temperature) reveals a heteroscedastic structure: residual magnitude grows with temperature, consistent with the exponential model amplifying small parameter errors at high . Large positive residuals at 600 °C are concentrated in silica-rich (shell) records and in the maize straw herbaceous records, confirming that composition-driven outlier behavior rather than model misspecification drives the bulk of the prediction error. Low-temperature records ( 400 °C) exhibit small absolute residuals, but these contribute disproportionately to MAPE because the observed values are near zero.
Panel B (residuals by feedstock category) shows that the grass group produces approximately symmetric residuals centered near zero with modest spread, confirming the in-sample fit quality reported in
Section 5.2. The herbaceous and shell groups exhibit positive skew: the model systematically underpredicts the highest-
records in both categories.
Panel C (residuals by contributing study) confirms that Chatterjee et al. [
17] (grass) has the smallest residual spread of any single-study contribution, while shows systematic underprediction at
°C, and Herrera et al. [
18] exhibits the largest positive bias, consistent with the silica-driven surface area enhancement discussed in
Section 6.2.
5.6. Benchmark Against Data-Driven Models
To test whether a flexible data-driven surrogate would outperform the semi-empirical correlation on the same evidence base, we benchmarked the pooled Arrhenius model for each of the three output descriptors (
,
, and
) against two alternatives trained on the identical records: ordinary least squares (OLS) linear regression and a random forest regressor (500 trees). Both alternatives received an expanded feature set—pyrolysis temperature together with a one-hot encoding of feedstock category—whereas the Arrhenius correlation used temperature alone. All models were evaluated under the identical leave-one-study-out protocol (
Section 3.4), with fold metrics aggregated as the unweighted mean across study folds—the same aggregation used for the main cross-validation (
Table 5)—so that the semi-empirical
values coincide between the two tables. The results are reported in
Table 6.
The same pattern recurs across all three descriptors: greater model flexibility improves the in-sample fit but does not translate into better generalization. In sample, the random forest attains the highest for every target (, , and for , , and ), well above the corresponding Arrhenius values (, , ). Under leave-one-study-out cross-validation, this advantage disappears. For , the target with the broadest study coverage (seven contributing studies), the semi-empirical correlation generalizes the best ( m2/g), while OLS and the random forest are worse (261 and 258 m2/g, respectively), despite their near-perfect training fit. For (four studies), the semi-empirical correlation is again the best out of sample (LOSO-CV nm), ahead of both OLS and the random forest. For , the three models are close, and the linear model edges ahead on relative error, but only two studies report , so the leave-one-study-out test reduces to two folds and cannot discriminate the models reliably; the cross-validation figures are therefore indicative only. In no case does the added flexibility of the random forest yield a meaningful out-of-sample improvement over the parsimonious correlation.
This benchmark supports two conclusions. First, the limited predictive capability documented throughout is a property of the available evidence—its size, heterogeneity, and study-level structure—rather than of the semi-empirical functional form: a high-capacity model trained on the same data does no better out of sample and usually does worse. Second, for a dataset of this size, a parsimonious, physically interpretable correlation is the more defensible choice than a higher-variance data-driven surrogate whose apparent in-sample accuracy does not survive study-level validation.
6. Discussion
6.1. Thermochemical Basis for Pore Development
The temperature dependence of
documented in this dataset can be grounded in the well-established thermal decomposition sequence of lignocellulosic biomass. Hemicellulose undergoes rapid devolatilization between approximately 200 °C and 350 °C, while cellulose decomposes over the narrower window from 320 °C to 450 °C; lignin decomposes more gradually from 200 °C to above 700 °C [
24,
25]. Typical lignocellulosic compositions span cellulose
to
, hemicellulose
to
, and lignin
to
on a dry basis, but the ratios differ substantially across categories: woody biomass contains
to
lignin and grasses
to
, and herbaceous crop residues are intermediate [
25]. These ranges are representative literature values rather than measurements of the specific feedstocks, because the compiled sources did not uniformly report lignocellulosic or proximate analyses; incorporating measured composition per record is identified as a route to finer, sub-category resolution. Beyond the organic fractions, alkali and alkaline earth minerals (notably potassium and calcium, which are abundant in herbaceous crop residues) catalyze char restructuring and can either enhance microporosity or, at high ash loadings, promote pore-blocking mineral sintering [
2,
25]; this catalytic dimension compounds the silica-scaffolding effect discussed below for the shell group and further limits any temperature-only description. The abrupt rise in
above 400 °C—from values typically below 50 m
2/g to above 200 m
2/g in coherent feedstock groups—corresponds directly to the onset of cellulosic char formation and the progressive volatilization of condensable organics that opens the nascent micropore network. At temperatures above 600 °C, secondary condensation reactions and incipient graphitization restructure the pore walls, contributing both to further increases in
for some feedstocks and to the appearance of a secondary mesopore population consistent with bimodal PSD fits at high pyrolysis severity.
This thermochemical picture reinforces the choice of the Arrhenius functional form as a phenomenological descriptor. The exponential temperature response over the 300 °C to 800 °C window reflects the superposition of several overlapping decomposition reactions whose individual rate constants exhibit Arrhenius-type dependencies. The fitted parameter
therefore represents an apparent, composite temperature sensitivity—a curve-fitting constant that captures the aggregate effect of pore opening across the charring sequence—not the activation energy of a single identifiable reaction as would be obtained from TGA/DTG kinetic analysis [
15]. This distinction between phenomenological structural correlations and kinetic measurements from thermoanalytical instruments is standard practice in the activated carbon literature [
13,
14] and applies equally here.
6.2. Feedstock Category as the Primary Variance Driver
The central quantitative finding—that feedstock category accounts for a larger fraction of variance in than temperature—has a direct mechanistic basis. Feedstock composition sets the structural template from which pore architecture develops: the cellulose/hemicellulose/lignin ratio, mineral content, and initial cell wall geometry collectively determine the amplitude and shape of the temperature response curve for a given material class.
Wood (high lignin, moderate surface area development).
Wood feedstocks contain
to
lignin, a structurally complex aromatic polymer that forms a thermally stable carbonaceous scaffold during pyrolysis [
7,
24]. This scaffold resists structural collapse and limits the rapid pore opening seen in cellulose-rich materials, producing moderate
values (50 m
2/g to 300 m
2/g) that increase gradually with temperature. Between-study variance in the wood group reflects primarily species-level differences in lignin structure and initial wood density rather than measurement protocol variability.
Grass (cellulose-dominated, low mineral content, predictable).
Grasses (miscanthus, switchgrass) contain
cellulose and relatively low ash (
to
), a combination that produces consistent, temperature-driven pore opening. Cellulose pyrolysis generates a highly microporous char at temperatures above 400 °C through rapid depolymerization and volatile release, and the absence of mineral interference allows the micropore network to develop along a reproducible trajectory [
25]. The apparent structural activation energy of
kJ/mol for the grass group is consistent with the composite temperature sensitivity of cellulosic devolatilization.
Herbaceous (compositionally heterogeneous, low predictive accuracy).
Herbaceous crop residues share approximate cellulose contents (
to
) but differ substantially in ash and silica. Maize straw (≈42% cellulose, ≈8% ash) undergoes an abrupt
increase above 700 °C because residual carbonaceous material persisting through lower-temperature charring volatilizes rapidly once temperatures exceed the secondary decomposition threshold [
24]. Wheat straw (≈38% cellulose, ≈7% ash) lacks this abrupt transition. The pooling of these two trajectories within the herbaceous category inflates within-group variance and drives the high
observed for that group.
Shell (silica-driven mineral scaffolding, extreme surface area).
Rice husk contains to SiO2 by mass, and this mineral fraction acts as a structural scaffold that inhibits pore wall collapse even at °C. The consequence is that continues to increase above 600 m2/g at 700 °C—a trajectory that is qualitatively different from all lignocellulosic-dominated feedstocks and cannot be described by the same Arrhenius parameters fitted to non-siliceous groups. Rice husk reaches above 648 m2/g at 700 °C because its naturally high silica content stabilizes the pore walls and inhibits structural collapse. Neither this extreme behavior nor the within-category heterogeneity between silica-rich and silica-poor shells is predictable from temperature alone.
Stratification by feedstock category recovers predictive accuracy only where within-group composition is approximately homogeneous, which is why the grass group succeeds and the compositionally heterogeneous herbaceous group does not. The five-category scheme is therefore necessary but not sufficient: finer sub-categorization by quantitative lignocellulosic and mineral composition (particularly silica content and ash yield at the target temperature) would further reduce within-category variance.
6.3. Predictive Performance and Residual Structure
The residual diagnostics of
Section 5.5 and the MAPE behavior of
Section 5.4 together carry one interpretive consequence for how the performance metrics should be read: because absolute errors are the largest for silica-rich feedstocks at high temperature while relative errors are dominated by near-zero low-temperature records, MAPE and RMSE rank the model very differently and should not be used interchangeably. For practical process design, RMSE is the more informative metric: the pooled RMSE of 183 m
2/g establishes an absolute error bound for the worst-case (pooled) predictor, while the grass group RMSE of
m
2/g characterizes the accuracy achievable when the feedstock category is well constrained. The LOSO-CV RMSE of 184 m
2/g confirms that the in-sample RMSE of the pooled model is not substantially optimistic; the model is not overfitting in absolute terms, even though the MAPE gap between in-sample (
) and LOSO-CV (
) is large—a divergence that reflects the metric’s sensitivity to low-
records rather than a collapse in absolute accuracy.
6.4. BJH Analysis: Scope and Limitations
All pore size distribution descriptors compiled from the literature were derived from a BJH analysis of nitrogen desorption isotherms, and this choice carries methodological implications that must be acknowledged. The BJH method provides a reliable description of mesopore volume distribution (pore widths 2 nm to 50 nm) but is fundamentally inadequate for micropores (width
nm), because the Kelvin equation underlying BJH assumes cylindrical geometry and breaks down when pore diameters approach the molecular scale [
6,
26]. For biochars pyrolyzed above 600 °C, where micropore fractions typically exceed 0.5, BJH systematically underestimates both pore volume and surface area in the micropore regime.
Modern density functional theory methods, in particular quenched solid density functional theory (QSDFT), provide more accurate micropore characterization and should be the preferred method for biochars produced at temperatures above 600 °C [
27]. The correlations presented here inherit the BJH convention of the calibration dataset and should therefore be applied within the same measurement framework. Practitioners using DFT-derived descriptors should expect systematic deviations from the BJH-based predictions, particularly for the micropore-dominated high-temperature regime. Future work should assess whether separate correlations calibrated on DFT descriptors yield more accurate predictions at
°C.
This limitation directly conditions the interpretation of the negative apparent activation energy fitted for ( kJ/mol). The downward shift in with increasing temperature was attributed above to the progressive dominance of micropore formation. However, is computed as from BJH-derived quantities, and BJH systematically underestimates micropore dimensions and misassigns micropore volume in exactly the high-temperature regime ( °C, ) where the trend is the steepest. The fitted therefore conflates a genuine physical shift toward smaller pores with a measurement artifact: part of the apparent decrease in reflects BJH’s inability to resolve pores below 2 nm rather than a true reduction in mean pore size. Because the calibration data do not include DFT-based descriptors, this study cannot quantify the two contributions separately, and the magnitude of should be regarded as a BJH-specific effective parameter rather than a transferable physical constant. Resolving the split requires isotherm-level reanalysis with QSDFT, which is identified as a priority for future work.
6.5. A Comparison with the Activated Carbon Literature
Semi-empirical Arrhenius-type correlations for structural descriptors have been applied to activated carbon production for several decades, providing a reference frame for interpreting the fitted parameters of the present model. Apparent structural activation energies for
reported in coconut shell and wood-based precursors during the pre-activation charring stage typically range from 8 kJ/mol to 40 kJ/mol [
13,
14]. The fitted
kJ/mol for the grass group falls within this range, lending cross-domain support to the phenomenological Arrhenius form and suggesting that the temperature sensitivity of pore opening in cellulose-dominated slow pyrolysis char is comparable in magnitude to that of pre-activation charring in activated carbon production. The herbaceous group value of
kJ/mol exceeds this range, consistent with the interpretation that pooling feedstocks with contrasting thermal behavior artificially inflates the apparent temperature sensitivity.
Power-law exponents
for
in the activated carbon literature are typically in the range 1.5–4.0 [
13]; the values obtained for the grass group are comparable in order of magnitude. Direct quantitative comparison is constrained by differences in temperature range, activation agent (water vapor or CO
2 versus inert atmosphere for slow pyrolysis), and precursor composition, but the order-of-magnitude agreement confirms that the functional form choice is appropriate. A systematic comparison table covering both biochar and activated carbon studies—including fitted parameter values, their
confidence intervals, and the measurement conditions—is identified as a priority for a future meta-analysis of the broader carbonaceous material literature.
6.6. Fractal Geometry: Status and Outlook
The surface fractal dimension , estimable from a Frenkel–Halsey–Hill analysis of the full nitrogen adsorption isotherm, was not calibrated in the present work because the compiled literature dataset provides only scalar summary statistics (, , ) and not the full isotherms required for FHH analysis. Calibrating correlations is identified as a priority for future work once full isotherm data become available, as this would add a qualitative dimension to the structural model that scalar area and volume metrics cannot capture.
6.7. Limitations and Outlook
Five methodological constraints bound the scope of the present results.
Small, heterogeneous, literature-derived dataset.
The correlations are calibrated on 45 records from only seven studies, and this limited size and compositional heterogeneity are the primary constraints on the robustness and generality of the conclusions. Three consequences follow. First, the fitted parameters are conditional on the particular corpus compiled: a different set of source studies—or additional records for under-represented categories—could shift the estimates and the between-group rankings, as the leave-one-study-out analysis (
Section 5.4) already illustrates. Second, because the dataset is assembled from the published literature, it is subject to publication bias, in that studies reporting well-developed, high-surface-area biochars may be over-represented relative to null or low-porosity results, biasing the calibrated temperature response. Third, the records originate from different laboratories using different instruments, analysts, and (largely unreported) degassing protocols, so inter-laboratory variability contributes an irreducible component to the residual scatter that no temperature-only model can capture [
10,
11]. These factors reinforce the fact that the correlations are calibration envelope interpolators rather than universal predictors and that the reported parameters should be updated as larger and more homogeneous datasets become available.
Uncontrolled process variables beyond final temperature.
The correlations use final pyrolysis temperature as the sole process predictor, but pore development is also governed by variables that the compiled literature does not report consistently and that could therefore not be incorporated as covariates. These include the full heating profile (heating rate and intermediate temperature holds, which alter residence time in the devolatilization window); the carrier gas type, composition, and flow rate (which control volatile removal and secondary char reactions); the chemical pretreatment of the feedstock (acid washing to remove alkali and alkaline earth minerals or alkaline swelling to enhance surface area); and the pyrolysis reactor configuration (which sets temperature uniformity, vapor residence time, and mass transfer conditions). Each of these factors can shift , , and the PSD appreciably at a fixed final temperature. Their omission is a deliberate consequence of the literature data design—the sources were selected for temperature coverage, not for the factorial control of these variables—and it means that the fitted correlations should be read as describing the average temperature response of slow pyrolysis biochar under conventional inert atmosphere conditions, not as isolating the effect of temperature with all other process variables held fixed. Extending the framework to these variables requires primary studies with systematic, controlled variation, which are currently scarce.
Incomplete PSD shape calibration.
A parametric PSD fitting framework covering lognormal, Weibull, and bimodal lognormal functions was not calibrated in this work because the compiled literature sources did not report full BJH differential volume curves. Calibrating the corresponding PSD shape parameters (log-mean, distribution width, and mixture weights) against temperature requires either digitized BJH curves from accessible publications or new experimental isotherms.
Shell category non-identifiability.
The shell category correlation is not reliably identified at the available sample size (, ) because silica-rich feedstocks such as rice husk behave as outliers within the group. Separate correlations for silica-rich and silica-poor shells are necessary before the framework can be applied to this category.
Heating rate not calibrated.
A heating rate multiplicative correction was not calibrated because heating rate variation is confounded with feedstock differences across the compiled studies and cannot be separated reliably at the available sample sizes. Calibrating this correction requires studies with factorial (, ) designs where both variables are independently controlled.
Four directions follow from these constraints. The most immediate is digitizing BJH incremental pore volume curves from the accessible literature to calibrate the lognormal and Weibull shape parameters against temperature, completing the full predictive PSD framework. Expanding the calibration dataset for the wood and shell categories, and subdividing the shell group by silica content, would improve identifiability for two commercially important feedstock classes. Validating the and correlations against independently measured biochar data would replace the LOSO-CV estimate of generalization error with a direct external test. Assembling a factorial (, ) dataset from studies reporting systematic heating rate variation would enable the calibration of a multiplicative heating rate correction and extend the model’s operating envelope to multi-variable prediction.



 ,
,