
Article

Microwave-Assisted N,S Co-Doped Reduced Graphene Oxide for Eco-Friendly Environmental Monitoring of Nitrobenzene

by
Prathingara Subramanian
1,
Tharini Jeyapragasam
2,
Kandasamy Muthusamy
3,4,
Vinitha Mariyappan
5 and
Rasu Ramachandran
1,*
1
Department of Chemistry, The Madura College (Affiliated to Madurai Kamaraj University), Vidya Nagar, Madurai 625011, India
2
Department of Biotechnology (DDE), Madurai Kamaraj University, Madurai 625021, India
3
Department of Chemistry, K. Ramakrishnan College of Technology, Samayapuram, Tiruchirappalli 621112, India
4
Department of Electrical Engineering, Faculty of Engineering, Universiti Malaya, Jalan Universiti, Kuala Lumpur 50603, Malaysia
5
Advanced Institute of Manufacturing with High-Tech Innovations and Department of Mechanical Engineering, National Chung Cheng University, Chiayi County 621301, Taiwan
*
Author to whom correspondence should be addressed.
Submission received: 26 March 2026 / Revised: 6 June 2026 / Accepted: 11 June 2026 / Published: 17 June 2026
(This article belongs to the Topic Environmental Pollutant Management and Control)

Abstract

A nitrogen/sulfur co-doped reduced graphene oxide (N,S-RGO) material was rationally prepared via a modified Hummers method followed by microwave-assisted reduction. The resulting material was uniformly deposited onto a glassy carbon electrode (GCE) to fabricate an electrochemical sensor for nitrobenzene (NB) detection. The prepared N,S-RGO material was characterized in detail using Fourier-transform infrared spectroscopy (FT-IR), field emission scanning electron microscopy (FESEM), transmission electron microscopy (TEM), X-ray photoelectron spectroscopy (XPS), and Raman spectroscopy, confirming the successful incorporation of heteroatoms. Furthermore, electrochemical studies, including cyclic voltammetry (CV) and linear sweep voltammetry (LSV), revealed the enhanced electrical conductivity of the material. The fabricated N,S-RGO/GCE sensor exhibited remarkable electroanalytical performance, achieving a low detection limit (LOD) of 7 nM within a linear concentration range of 0.05 to 147 µM. The enhanced sensing performance is attributed to the synergistic effect of nitrogen and sulfur doping, which improves electron transfer kinetics and abundant active sites for NB reduction. Furthermore, the sensor demonstrated outstanding selectivity toward NB in the presence of common interfering substances. Its practical applicability was confirmed through the successful detection of NB in environmental water samples, yielding convincing recovery rates. These results highlight the potential of the N,S-RGO/GCE platform as an efficient and reliable electrochemical sensor for environmental monitoring of NB contamination.

Graphical Abstract

1. Introduction

Water pollution arising from industrial effluents has become a growing global concern, posing severe threats to ecosystems and public health. Among various organic contaminants, nitrobenzene (NB) is particularly alarming due to its extensive industrial applications and high toxicity [1]. Similar to aniline, dyes, pesticides, explosives, and pharmaceuticals, nitrobenzene is widely used in industrial processes, leading to its frequent discharge into industrial effluents and subsequent detection in wastewater streams [2,3]. It is a persistent organic pollutant characterized by high toxicity and bioaccumulative potential, posing significant risks to both aquatic organisms and human health [4]. The World Health Organization (WHO) classified nitrobenzene as a Group 2B carcinogen in 2017, acknowledging its potential carcinogenicity in humans and animals [5]. Chronic exposure to nitrobenzene has been associated with methemoglobinemia, neurotoxicity, and other adverse health effects [6,7]. These serious concerns underscore the urgent need for effective strategies to detect, monitor, and eliminate NB from contaminated water sources, ensuring environmental sustainability and public health protection.
Traditional analytical methods for NB detection, such as gas chromatography–mass spectrometry (GC–MS) and high-performance liquid chromatography (HPLC), offer excellent sensitivity and precision [8,9]. However, these techniques rely on expensive, time-consuming, and sophisticated instrumentation, limiting their suitability for routine and on-site monitoring. In contrast, electrochemical sensing has emerged as a promising alternative due to its high sensitivity and selectivity, low cost, rapid response, and ease of operation [10]. Recently, Ahmad et al. published a comprehensive review on advanced functional materials for electrochemical NB detection [11], highlighting a wide range of nanomaterials, including metal oxides such as cerium dioxide [12], NiS2/Fe3S4 [13], MnO2 nanorods [14], and Gd2O3 [15]. In addition, carbon-based materials, including reduced graphene oxide, carbon nanotubes, graphitic carbon nitride, and graphene nanosheets, have received significant attention owing to their excellent electrical conductivity, chemical stability, and superior electrocatalytic activity [16,17,18,19,20,21,22]. For instance, Chelladurai et al. reported a reduced graphene oxide–based electrochemical sensor decorated with silver nanoparticles, which exhibited excellent selectivity toward the target analyte in the presence of structurally similar interfering species, achieving a sensitivity of 0.836 μA μM−1 cm−2 and a detection limit of 0.261 μM [23].
Among various carbon-based nanomaterials, heteroatom co-doped reduced graphene oxide has demonstrated outstanding electrocatalytic performance for the detection of nitroaromatic pollutants, including NB. Typically, co-doping graphene with nitrogen and sulfur introduces heteroatoms that effectively modulate the electronic band structure and generate a high density of catalytically active defect sites. Furthermore, nitrogen doping enhances electron (e) delocalization. It increases the electron-donating capability of the carbon framework, while sulfur doping induces localized electronic states that facilitate charge carrier mobility within the graphene lattice [24,25]. These synergistic effects promote faster electron-transfer kinetics and significantly reduce the overpotential for the reduction in NB. Moreover, N,S–RGO exhibits strong π–π stacking interactions and favorable electrostatic affinity toward the –NO2 group of NB, thereby enhancing surface adsorption and sensing sensitivity [26]. Collectively, these properties establish N,S–RGO as a highly effective material for the development of high-performance electrochemical sensors.
Herein, we report an eco-friendly, one-pot microwave-assisted strategy for the synthesis of nitrogen/sulfur co-doped reduced graphene oxide (N,S/RGO), employing thiourea as the heteroatom dopant and reduced graphene oxide as the carbon framework. Graphene oxide (GO) was first synthesized via a modified Hummers method and subsequently chemically reduced to obtain RGO. The physicochemical properties of the as-prepared N,S/RGO were systematically characterized using FESEM, TEM, XRD, FT-IR, and Raman spectroscopy. The synthesized material was then used to modify a glassy carbon electrode (GCE), resulting in an electrochemical sensor with superior performance toward NB detection. Compared with RGO-modified GCE and bare GCE, the N,S/RGO-modified GCE exhibited enhanced sensitivity and a markedly reduced potential. Key operational parameters, including solution pH, scan rate, and catalyst loading, were systematically optimized to achieve optimal sensing performance. Furthermore, the sensor’s practical applicability and selectivity were validated through analysis of environmental water samples and interference studies involving potentially coexisting species.

2. Experimental Section

2.1. Materials and Reagents

Nitrobenzene (99.0%), potassium permanganate (99.0%), sodium dihydrogen phosphate, potassium ferrocyanide, potassium ferricyanide, potassium chloride (KCl, 99.0–100%), NaOH, monosodium dihydrogen phosphate (99.0%), disodium hydrogen phosphate (99.0%), thiourea, 4-Nitrophenol, 2-Nitrophenol, p-Nitrobenzaldedye, 4-chloronitrobenzene, nitroaniline, picric acid and nitrophenol were received from Sigma-Aldrich (St. Louis, MO, USA). Raw graphite powder (average particle size 20 µm) was procured from Alfa Aesar (Thermo Fisher Scientific, Heysham, UK). A phosphate buffer (PBS, pH 7.0) was prepared using NaH2PO4 and Na2HPO4, and served as the supporting electrolyte in all electrochemical experiments. Double distilled water (DI) and ethanol were used for the preparation of the required solutions. All other reagents were used at analytical grade. All electrochemical measurements were carried out at room temperature in N2 atmosphere in order to avoid the diffusion of oxygen into the solution.

2.2. Microwave-Assisted Synthesis of Reduced Graphene Oxide (RGO)

Graphene oxide (GO) was synthesized from graphite powder using a modified Hummers’ method [27]. Reduced graphene oxide (RGO) was subsequently prepared via a rapid, solvent-free microwave-assisted approach, employed as an alternative to conventional hydrothermal techniques that typically require prolonged reaction times and elevated temperatures. In this process, dried GO was subjected to microwave irradiation at a power of 700 W for 40 s. The rapid thermal exfoliation yielded a black, porous, and fluffy material with enhanced electrical conductivity [28].

2.3. Microwave-Assisted Synthesis of N,S-RGO Material

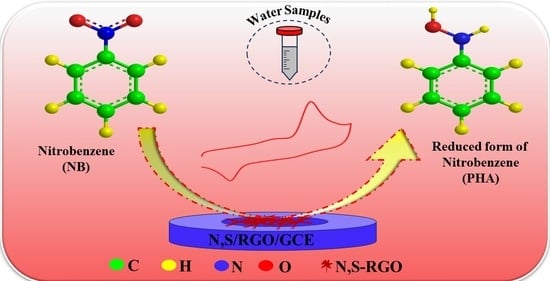
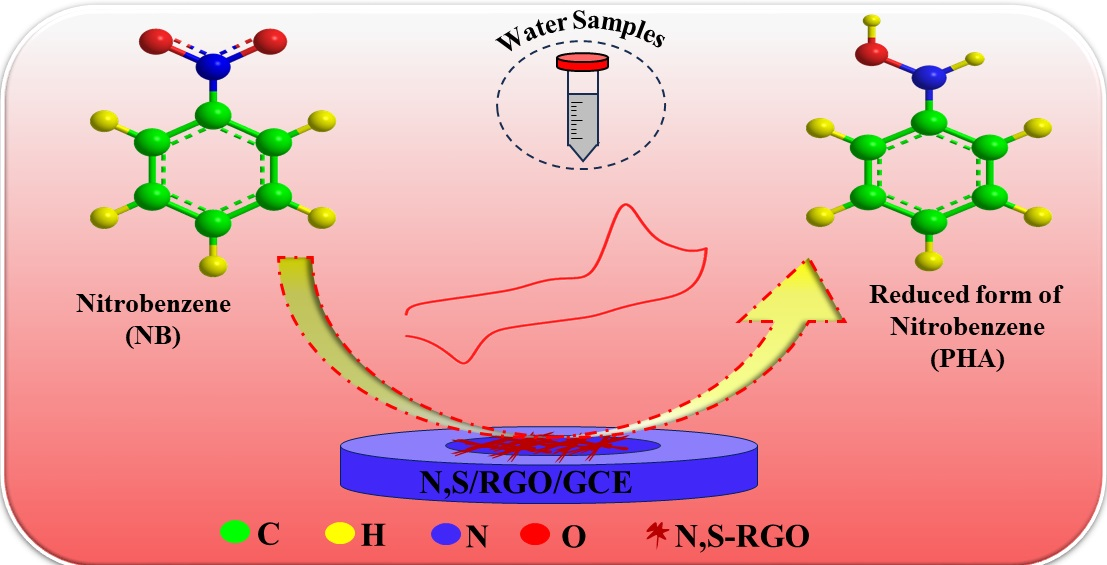
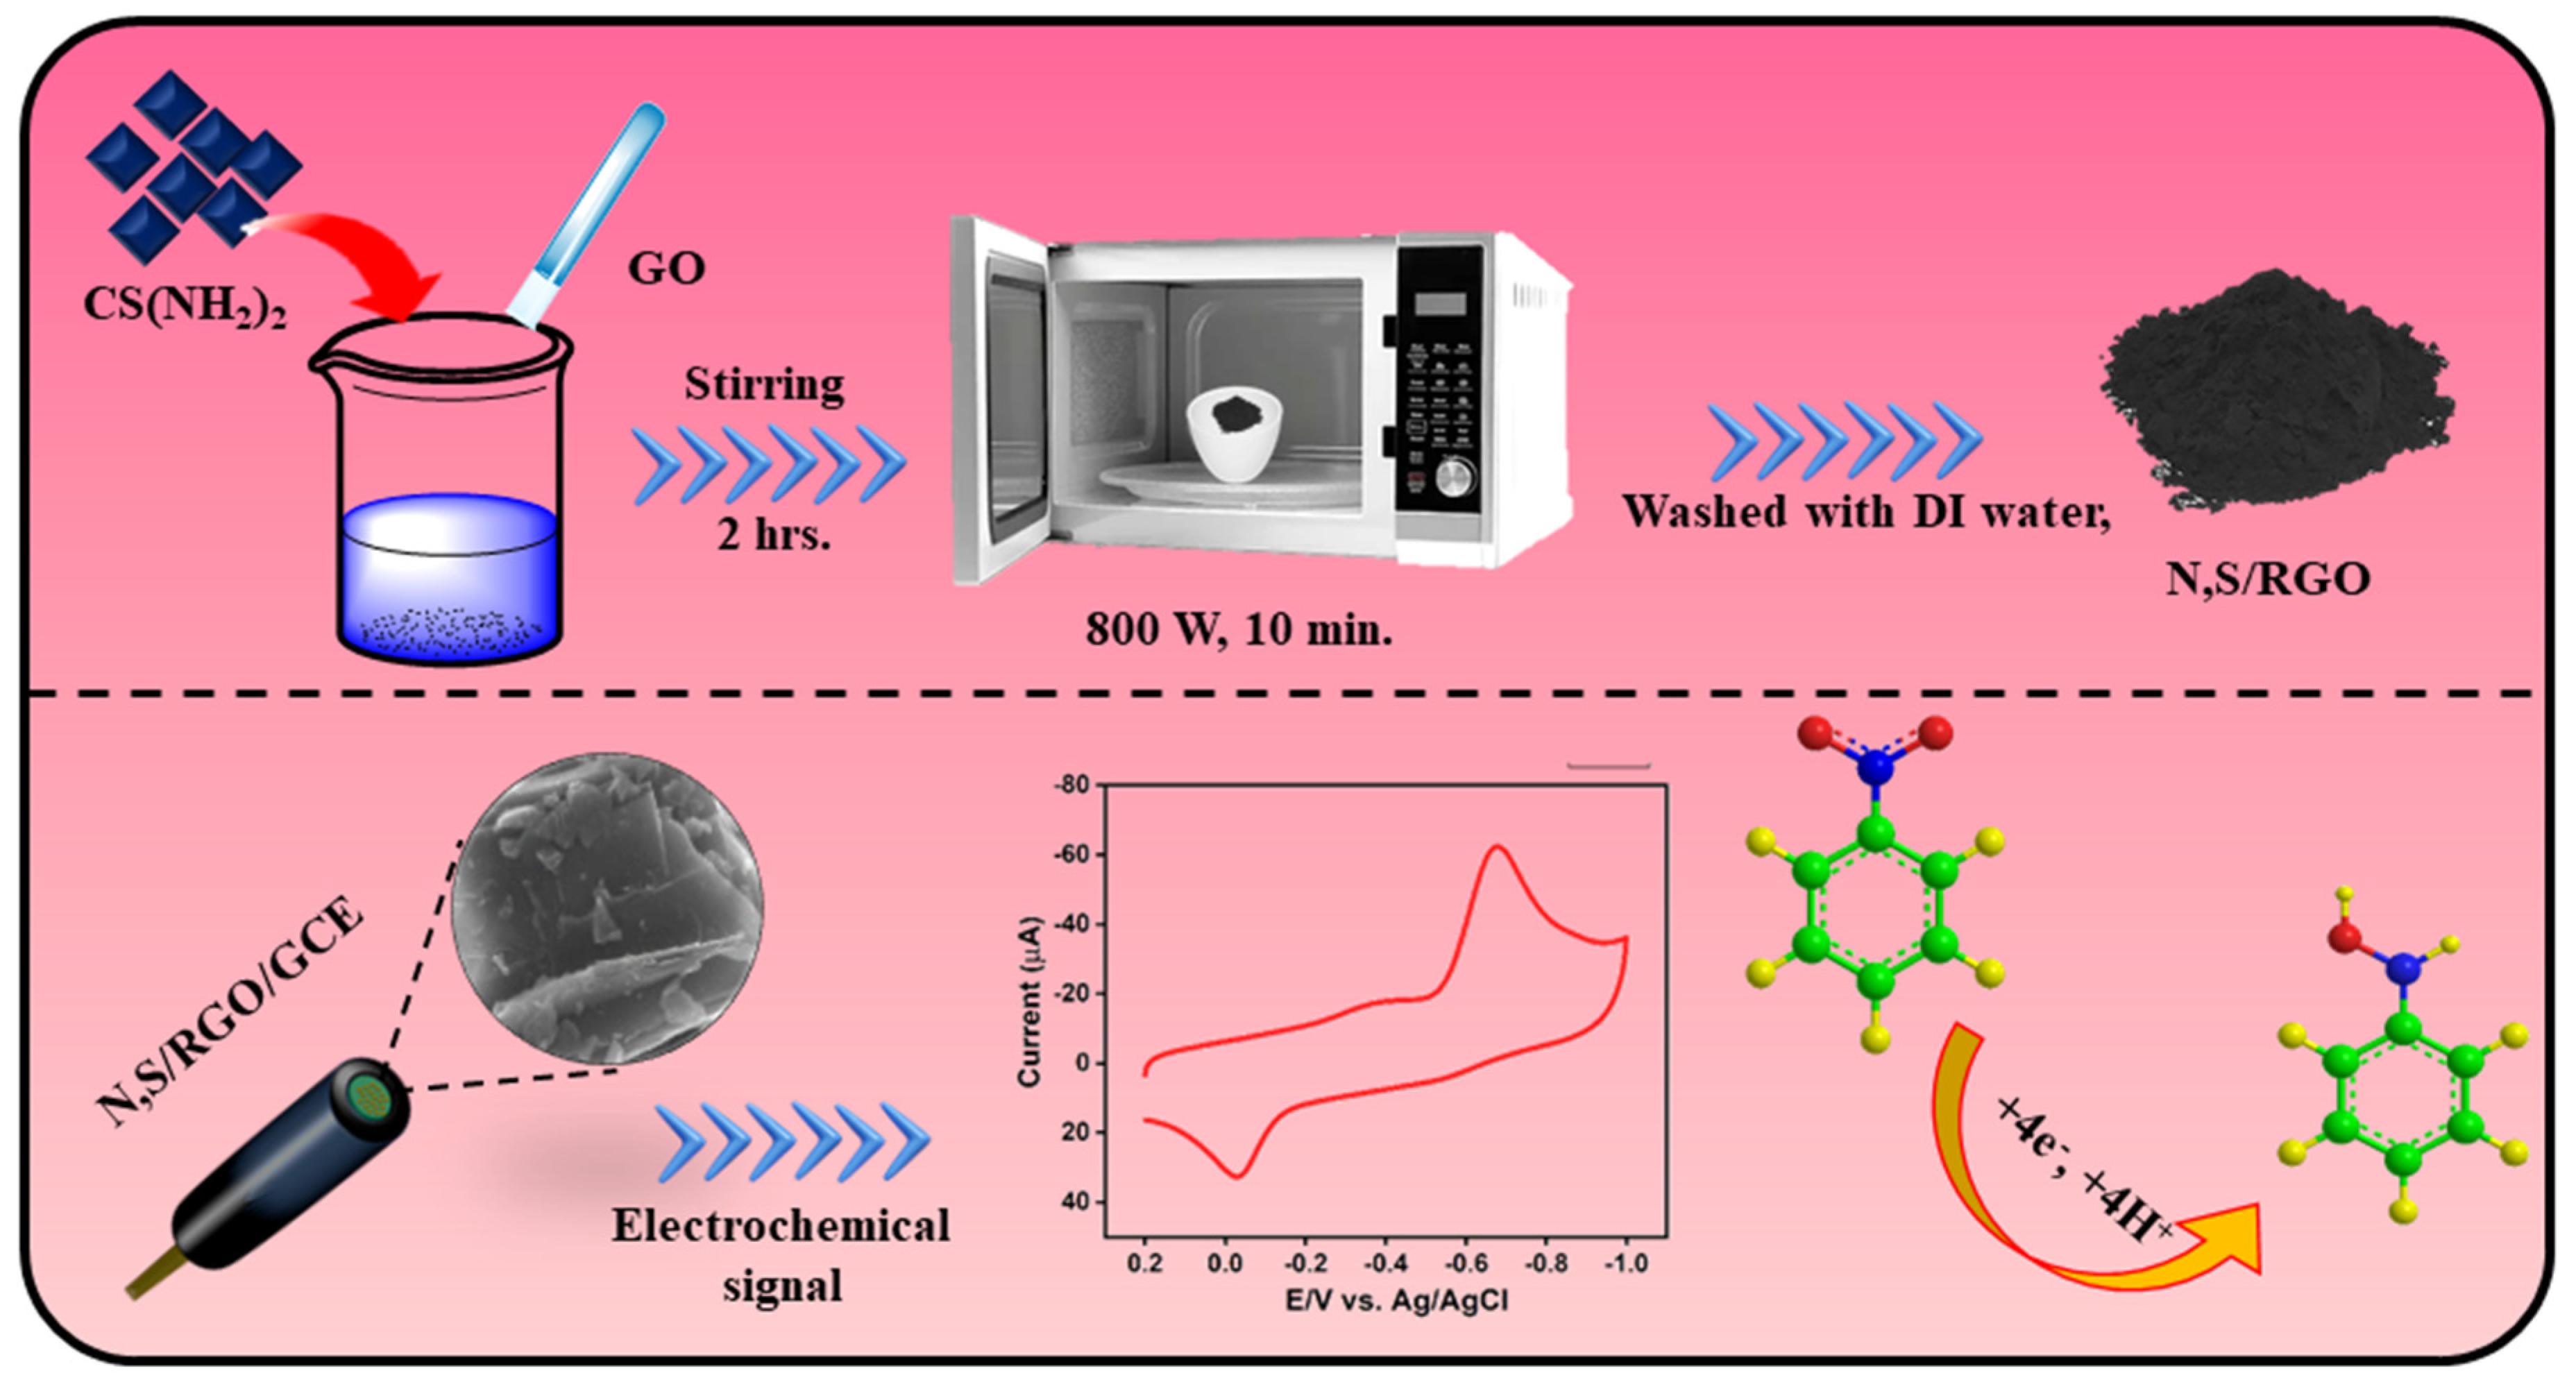
To prepare N,S-RGO, 500 mg of GO was dispersed in 250 mL ofdouble distilled water (DI) and stirred for 2 h to obtain a homogeneous suspension. Thiourea, serving as both the nitrogen and sulfur dopant, was then added, and the mixture was continuously stirred at ambient temperature for 3 h to promote effective doping interactions. The resulting suspension was subsequently subjected to microwave irradiation at 800 W for 10 min. This process induced simultaneous reduction and nitrogen/sulfur co-doping, yielding a lightweight, cotton-like black powder, indicative of the successful reduction and incorporation of N and S into the RGO framework. The product was allowed to cool and settle, collected by filtration, and thoroughly rinsed with DI to remove residual thiourea. The final N,S-RGO product was obtained with an approximate yield of 70%, as illustrated in Scheme 1.

2.4. Characterization Techniques

A detailed description of the characterization techniques is provided in the Supplementary Materials.

2.5. Preparation of Working Electrode

Before modification, the bare GCE was carefully polished using a 0.05 µm alumina slurry to obtain a mirror-like surface, followed by thorough rinsing with DI and drying at room temperature. The polished GCE was then allowed to dry under ambient conditions. Subsequently, a well-dispersed N,S-RGO suspension (1 mg mL−1) was prepared in DI and ultrasonicated for 30 min to ensure uniform dispersion. An aliquot of 3 µL of the N,S-RGO suspension was drop-cast onto the GCE surface and dried at room temperature for 20 min to fabricate the modified electrode. For comparison, an RGO-modified GCE (RGO/GCE) was also prepared following the same procedure. The electrochemical measurements were carried out in a standard three-electrode system with a working solution volume of 10 mL. The electrolyte solution was purged with N2 gas before measurements and maintained under N2 atmosphere during the experiments. Continuous stirring was applied during the standard addition of NB to ensure uniform distribution of the analyte. After each addition of NB, the solution was stirred for approximately 30 s and then allowed to stabilize before recording the electrochemical response.

3. Results and Discussion

3.1. Physicochemical Characterization

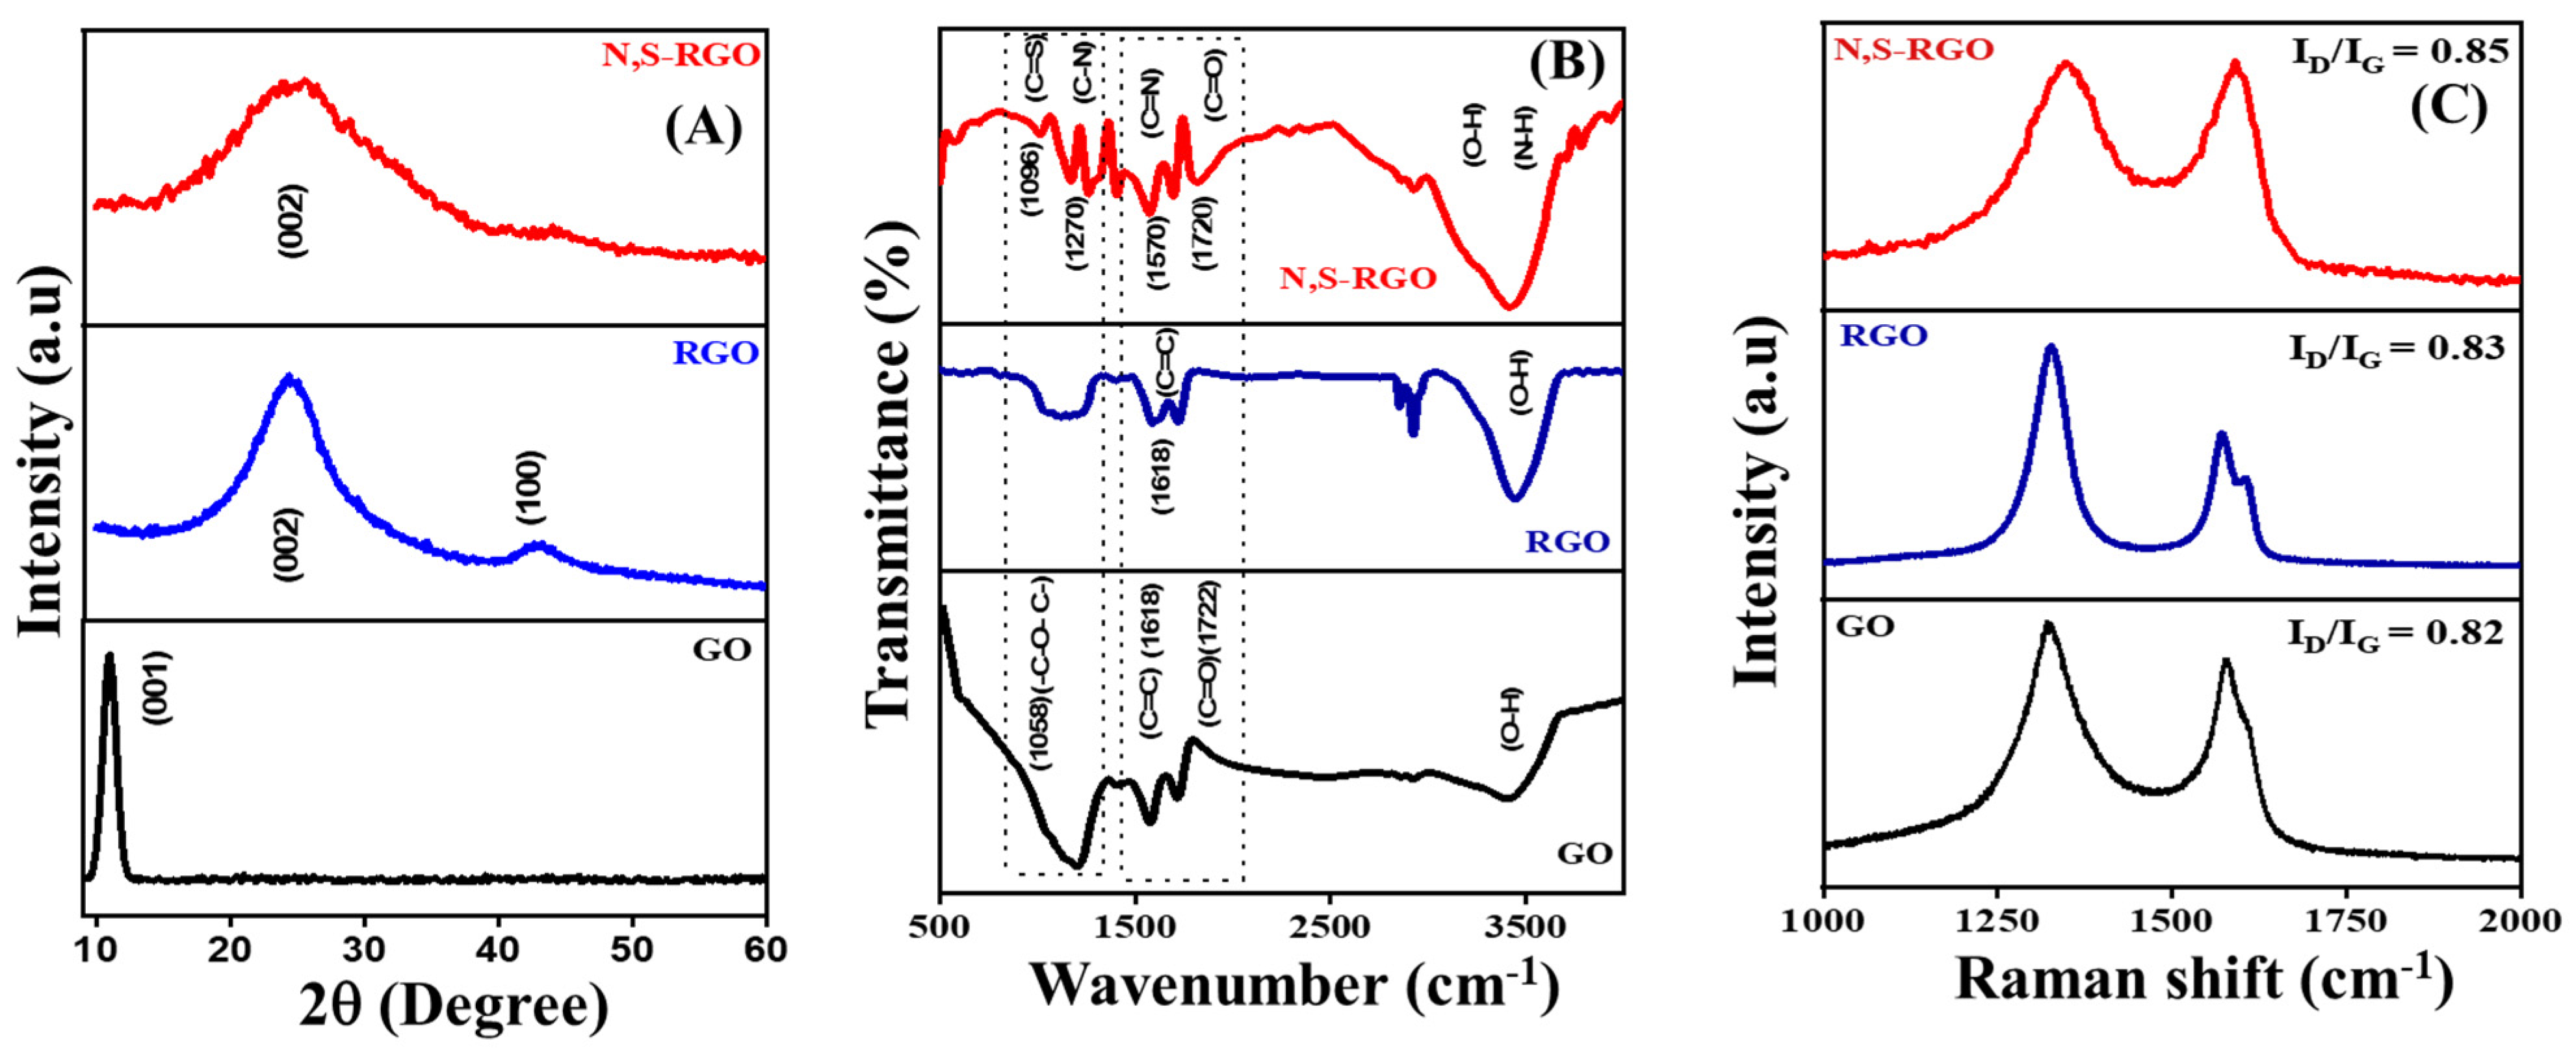
Figure 1A shows the XRD patterns of GO, RGO and N,S-RGO, illustrating the structural modifications induced by heteroatom co-doping. In GO the sharp diffraction peaks displayed at 10° belong to (001) plane reflections, indicating the formation of oxygen functional groups on the surface of the graphene layer. The RGO sample exhibits a sharp diffraction peak at 26.2°, corresponding to the (002) plane, which indicates partial restacking of graphene layers after reduction. A minor peak observed at 44.3° is attributed to the (100) plane. In contrast, the (002) peak of N,S-RGO becomes noticeably broader and slightly shifted, indicating increased structural disorder and reduced crystallinity as a result of nitrogen and sulfur incorporation. This peak broadening reflects successful exfoliation and the generation of abundant defect sites, leading to increased interlayer spacing. These structural changes confirm that heteroatom (N and S) doping effectively disrupts the graphitic order and enhances defect density. The average crystallite size of GO, RGO and N,S-RGO was estimated using the Debye–Scherrer equation [29] and calculated to be 3.5, 3.01 and 2.73 nm [28]. The observed variation in crystallite size reflects the progressive structural changes from graphene oxide to subsequent N,S-RGO doping, which introduces additional lattice distortions and modifies the scattering regions. Further supporting the successful integration of heteroatoms into the graphene lattice. Such structural disorder is advantageous for electrochemical applications, as it increases the effective surface area and introduces additional active sites that enhance electrochemical reactivity.
Figure 1B presents the FT-IR spectra illustrating the structural transformation from GO to RGO and subsequently to nitrogen- and sulfur-co-doped RGO (N,S-RGO) [30]. In the GO spectrum, characteristic absorption bands are observed at 1722 cm−1 (C=O stretching), 1618 cm−1 (C=C skeletal vibration), and 1058 cm−1 (C–O–C stretching), along with a broad O–H stretching band centered around 3400 cm−1. These features confirm the presence of abundant oxygen-containing functional groups. Upon reduction to RGO, the intensities of these bands are markedly reduced, indicating the effective removal of oxygen functionalities. In the N,S-RGO spectrum, new absorption peaks appear at 1096, 1270, and 1570 cm−1, corresponding to C–S, C–N, and C=N vibrations, respectively. Additionally, a broadened band in the O–H/N–H stretching region is observed, reflecting the successful incorporation of nitrogen and sulfur heteroatoms into the RGO framework. These FT-IR results confirm the progressive reduction in GO and the effective heteroatom doping of RGO.
Raman spectroscopy is a widely used non-destructive technique for evaluating the structural order and defect density in carbon-based materials. As shown in Figure 1C, the Raman spectra of GO, RGO, and N,S-RGO exhibit two prominent bands: the D band (~1350 cm−1), associated with structural defects, and the G band (~1590 cm−1), corresponding to the in-plane vibration of sp2-bonded carbon atoms [31]. In GO, a relatively high (ID/IG = 0.82) intensity ratio reflects the presence of abundant oxygen-containing defects. Upon reduction to RGO, the ID/IG ratio increases up to 0.83, indicating additional disorder introduced during the deoxygenation process. N,S-RGO exhibits an even higher (ID/IG = 0.85) ratio, suggesting further structural disorder induced by nitrogen and sulfur co-doping. These spectral changes confirm the successful reduction in GO and the effective incorporation of heteroatoms, resulting in a more defect-rich N,S-RGO structure that is favorable for electrocatalytic applications. The average crystalline size (La) value for GO, RGO and N,S-RGO calculated using the Tuinstra–Koenig equation; for graphene-based materials, the commonly used equation is La = (2.4 × 10⁻¹⁰) λ4 (ID/IG)−1 [32] where La is in-plane crystalline size (nm), λ is the Raman laser wavelength (nm) and ID/IG is the intensity ratio of the D band and G band. From the above equation, the calculated La values for GO, RGO and N,S-RGO are 23.4, 23.13 and 22.58 nm. From these results, a direct numerical comparison between the Raman and XRD crystallite size for GO, RGO and N,S-RGO is shown in Supplementary Materials (Table S1). The Raman-derived La values are greater than the corresponding XRD crystallite size; the difference is expected due to the different probes of Raman and XRD structural characteristics. Raman spectroscopy estimates the lateral size of sp2 graphitic domains, whereas XRD determines the size of coherent diffraction domains. Therefore, the two parameters are not directly equivalent; the difference between them is commonly reported for graphene frameworks, especially those possessing structural defects, disorder in stacking and heteroatom doping.

3.2. Morphological and Elemental Analysis of N,S-RGO

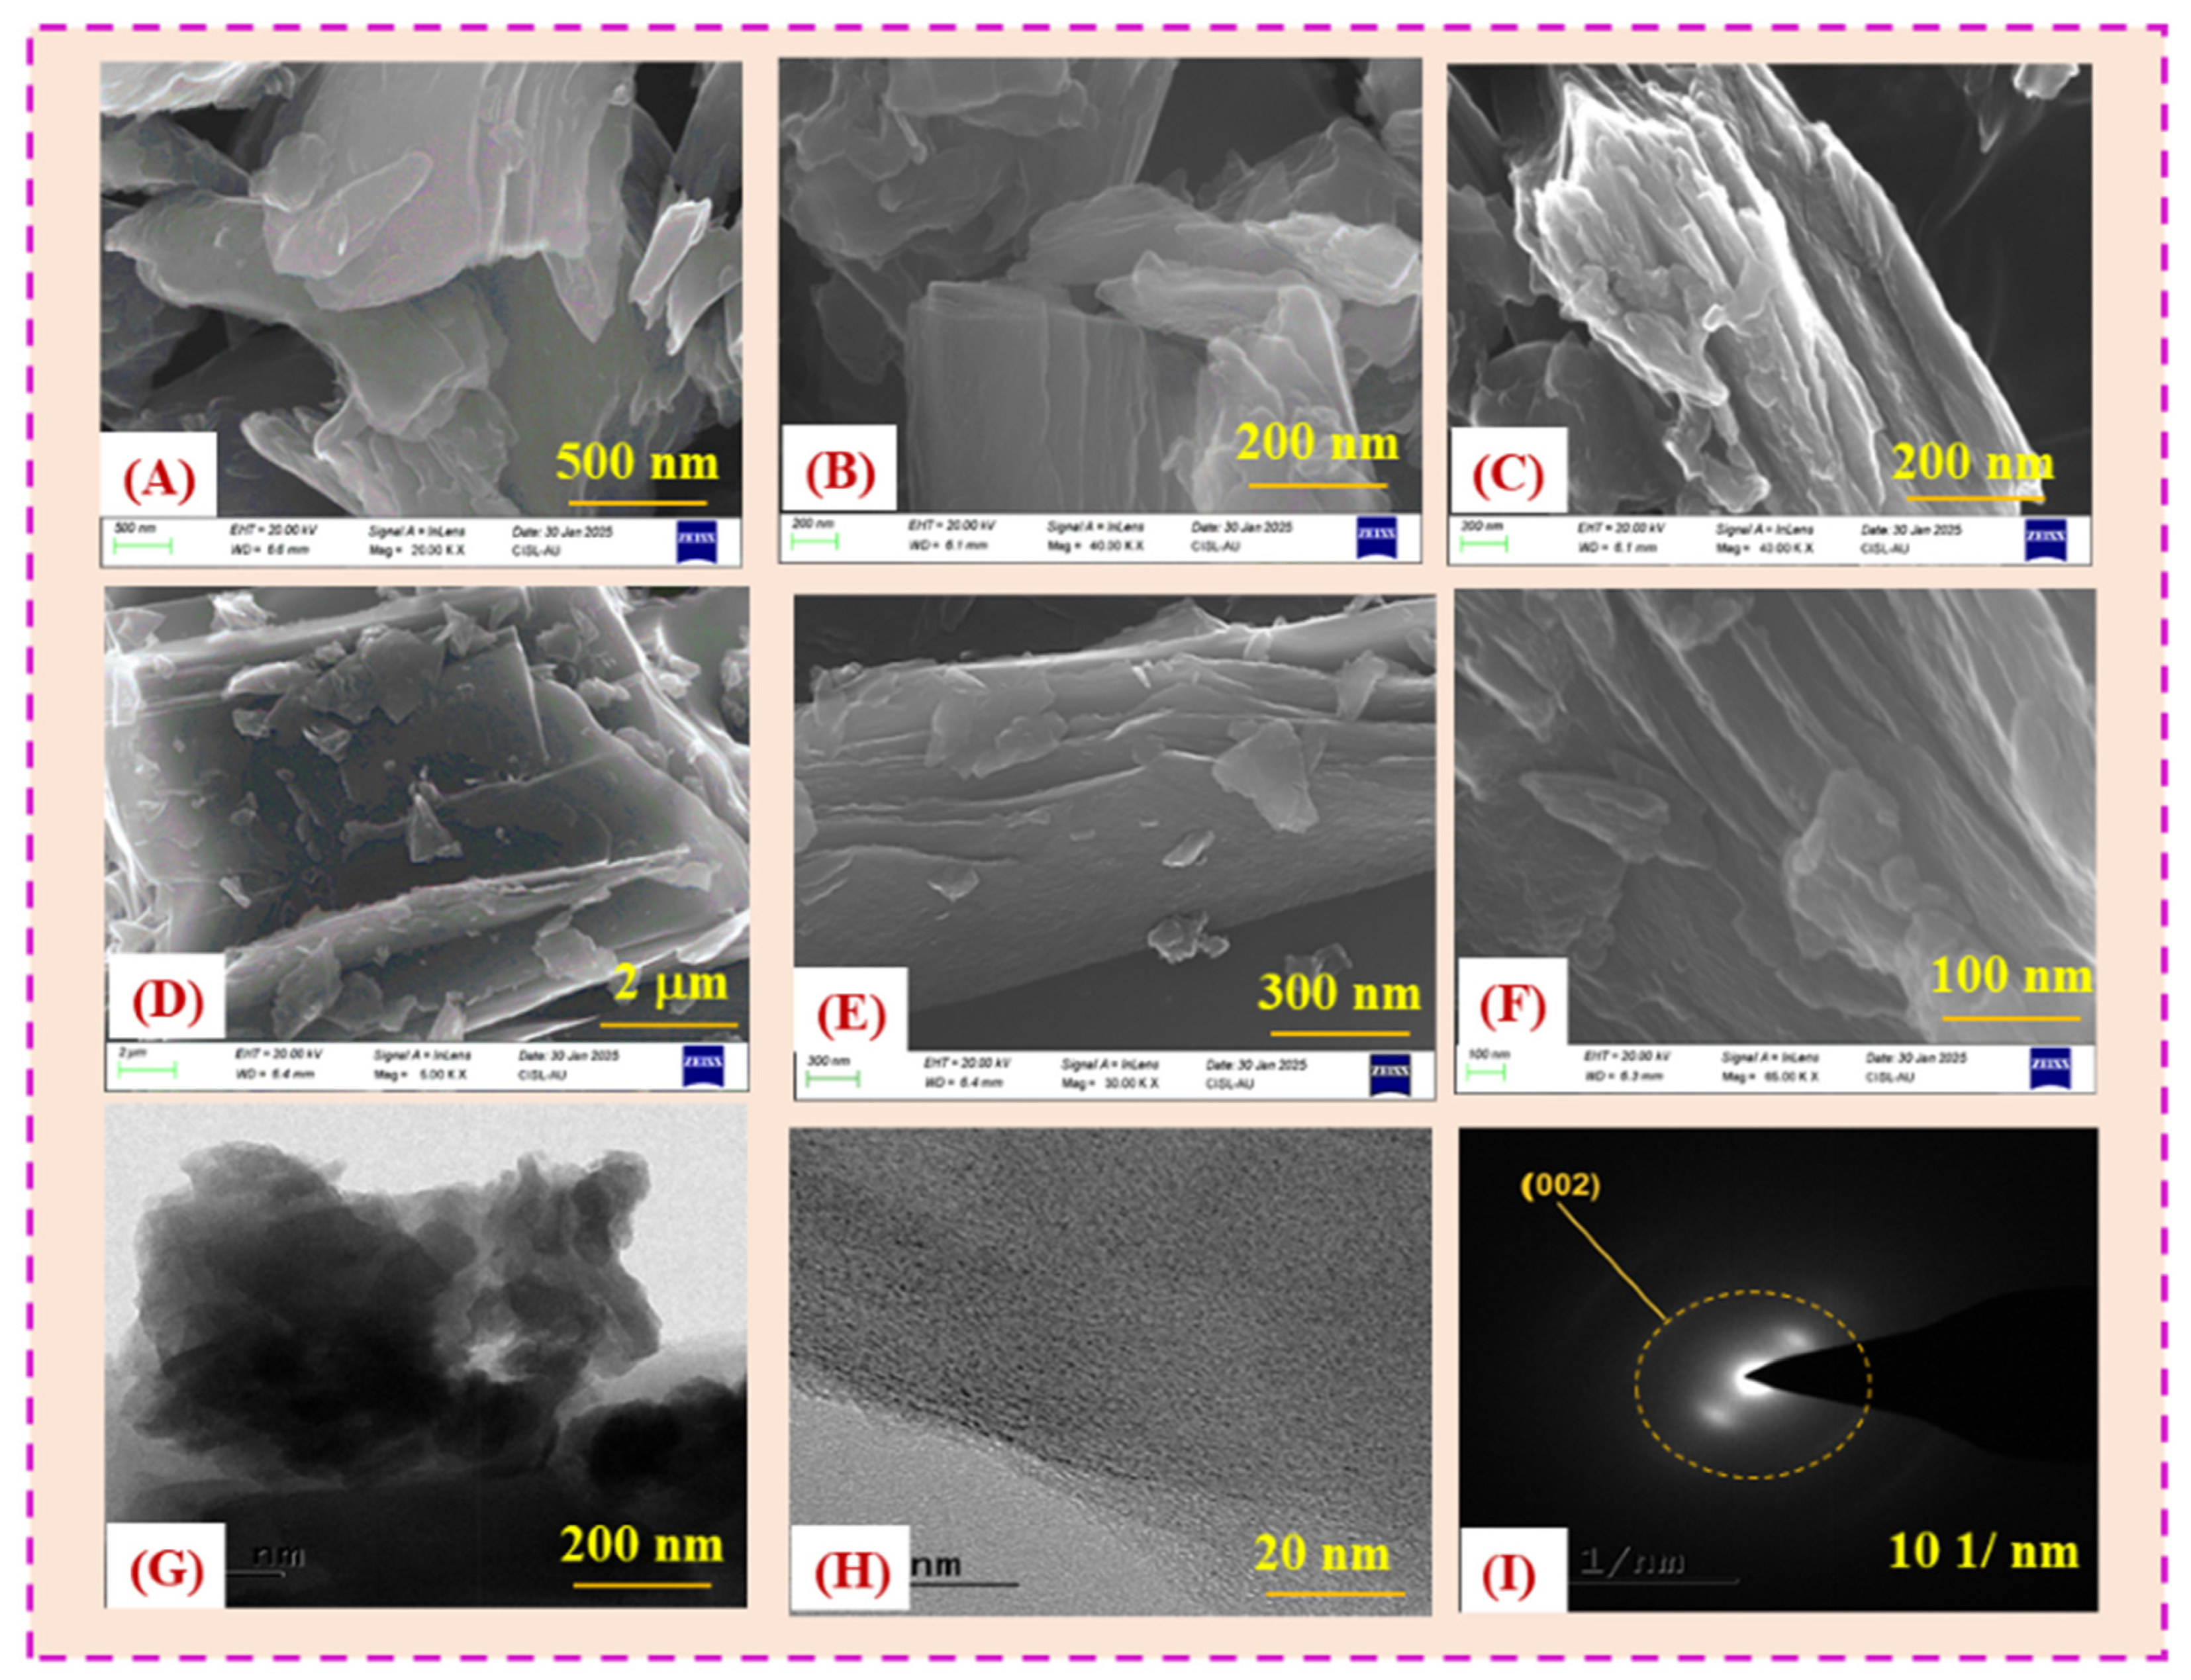
The morphological features of the materials were investigated using field-emission scanning electron microscopy (FE-SEM) and energy-dispersive X-ray (EDX) analyses. The FE-SEM images of GO (Figure 2A,B) reveal a typical layered, sheet-like morphology with wrinkled structures, characteristic of exfoliated graphene oxide. As shown in Figure 2C, RGO exhibits more aggregated and collapsed sheets, indicating the partial removal of oxygen-containing functional groups and the restacking of graphene layers due to π–π interactions. Figure 2D–F illustrate the morphology of N,S-RGO, which displays more disrupted and thinner nanosheets with pronounced surface roughness, arising from the incorporation of nitrogen and sulfur atoms into the graphene framework. The corresponding EDX spectrum and elemental quantification (Figure S1) confirm that carbon and oxygen are the predominant elements, accounting for 73.64 wt% (78.71 at%) and 20.78 wt% (16.67 at%), respectively. In addition, nitrogen and sulfur contents of 4.62 wt% (4.23 at%) and 0.96 wt% (0.38 at%), respectively, further verify the successful heteroatom doping of the RGO framework. Elemental mapping analysis of N,S-RGO (Figure S1) demonstrates the uniform spatial distribution of carbon (Figure S1), nitrogen (Figure S1), oxygen (Figure S1), and sulfur (Figure S1) across the nanosheets. Moreover, Figure 2G,H presents the HRTEM images of N,S-RGO, highlighting its morphological and structural characteristics at different magnifications. The selected area electron diffraction (SAED) pattern displayed in Figure 2I shows a distinct (002) diffraction ring, suggesting partial restoration of graphitic order within the material. A closer examination of Figure 2H further reveals the flexible and wrinkled nature of the N,S-RGO nanosheets. The SEM image recorded before the electrochemical experiment shows a well-defined layered and sheet-like morphology with a relatively rough surface. After the CV experiment, the SEM image (Figure S1) retains a similar layered morphology without any significant structural collapse, cracks or surface damage. Only slight aggregation of the sheets is observed, which may be attributed to repeated electrochemical cycling and adsorption of analyte molecules on the electrode surface.
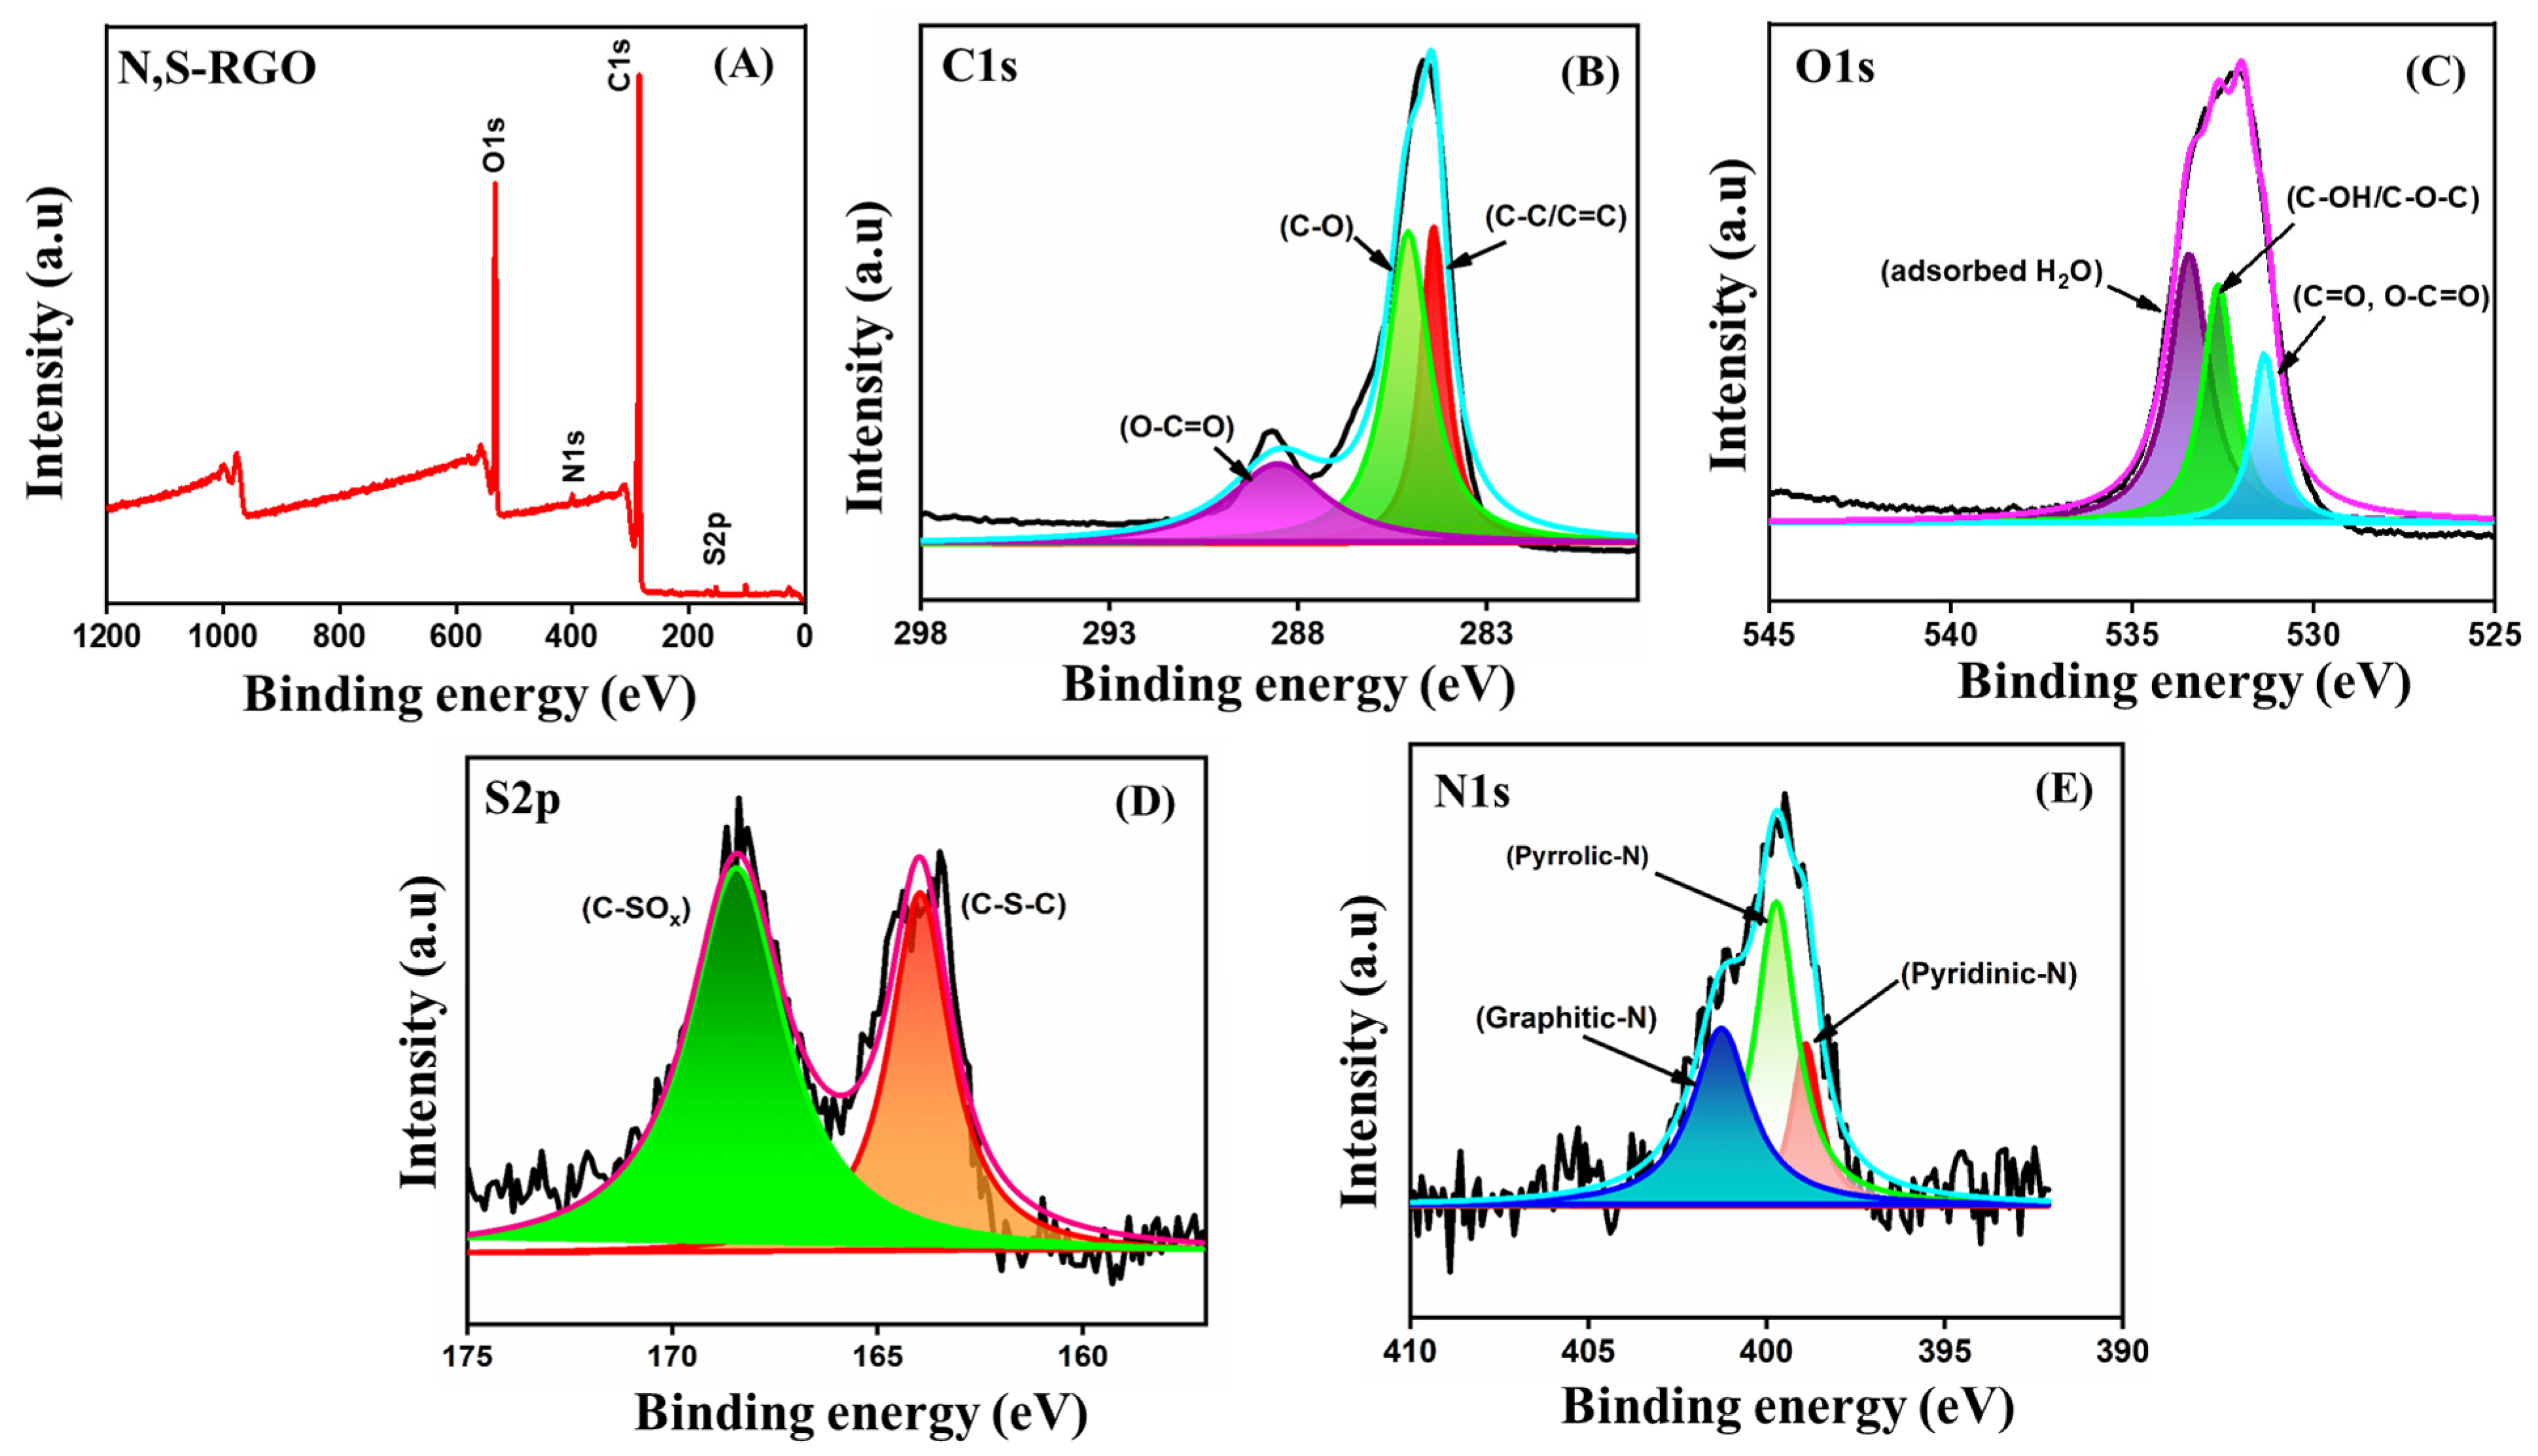
Figure 3 presents the XPS analysis of the N,S-RGO sample, providing detailed insight into the elemental composition and chemical states. The survey spectrum (Figure 3A) reveals the presence of C 1s, O 1s, N 1s, and S 2p signals, confirming the successful incorporation of nitrogen and sulfur into the RGO lattice. The high-resolution C 1s spectrum (Figure 3B) shows deconvoluted peaks at 284.8, 286.5, and 288.2 eV, corresponding to C–C/C=C, C-O, and O–C=O bonds, respectively. These features indicate the partial reduction in graphene oxide while retaining a small amount of oxygen-containing functional groups [33]. As shown in Figure 3C, the O 1s spectrum exhibits peaks at ~531.5–532.5 eV, which are assigned to oxygen in carbonyl/carboxyl groups (C=O, O-C=O), 533.5 eV is assigned to oxygen in hydroxyl/ether groups (C-OH/C-O-C), and the 534.4 eV peak belongs to adsorbed water or molecular oxygen, respectively. These oxygen functionalities enhance hydrophilicity and contribute to the formation of active sites on the RGO matrix [34]. The S 2p spectrum (Figure 3D) exhibits two distinct sulfur chemical states. The peak displayed at 164.08 eV is assigned to thiophene-like sulfur (C-S-C), representing reduced sulfur species incorporated into the carbon network, whereas the peak at 168.4 eV corresponds to oxidized sulfur species (C-SOx) such as sulfone or sulfonate groups [35]. Furthermore, the N 1s spectrum (Figure 3E) shows three distinct peaks at 398.7 eV (pyridinic-N), 400.1 eV (pyrrolic-N) and 401.2 eV (graphitic-N), respectively, where nitrogen atoms substitute carbon atoms within the graphene lattice. The atomic percentage of carbon (75.66 at%), oxygen (22.30 at%), nitrogen (1.17 at %) and sulfur (0.88%) as determined from the XPS survey analysis. These results confirm the successful co-doping of nitrogen and sulfur into the RGO framework, which enhances electronic conductivity and introduces additional electrochemically active sites. Such features are highly advantageous for high-performance electrochemical sensing applications [36].

3.3. Electrochemical Impedance Spectroscopy (EIS) Analysis

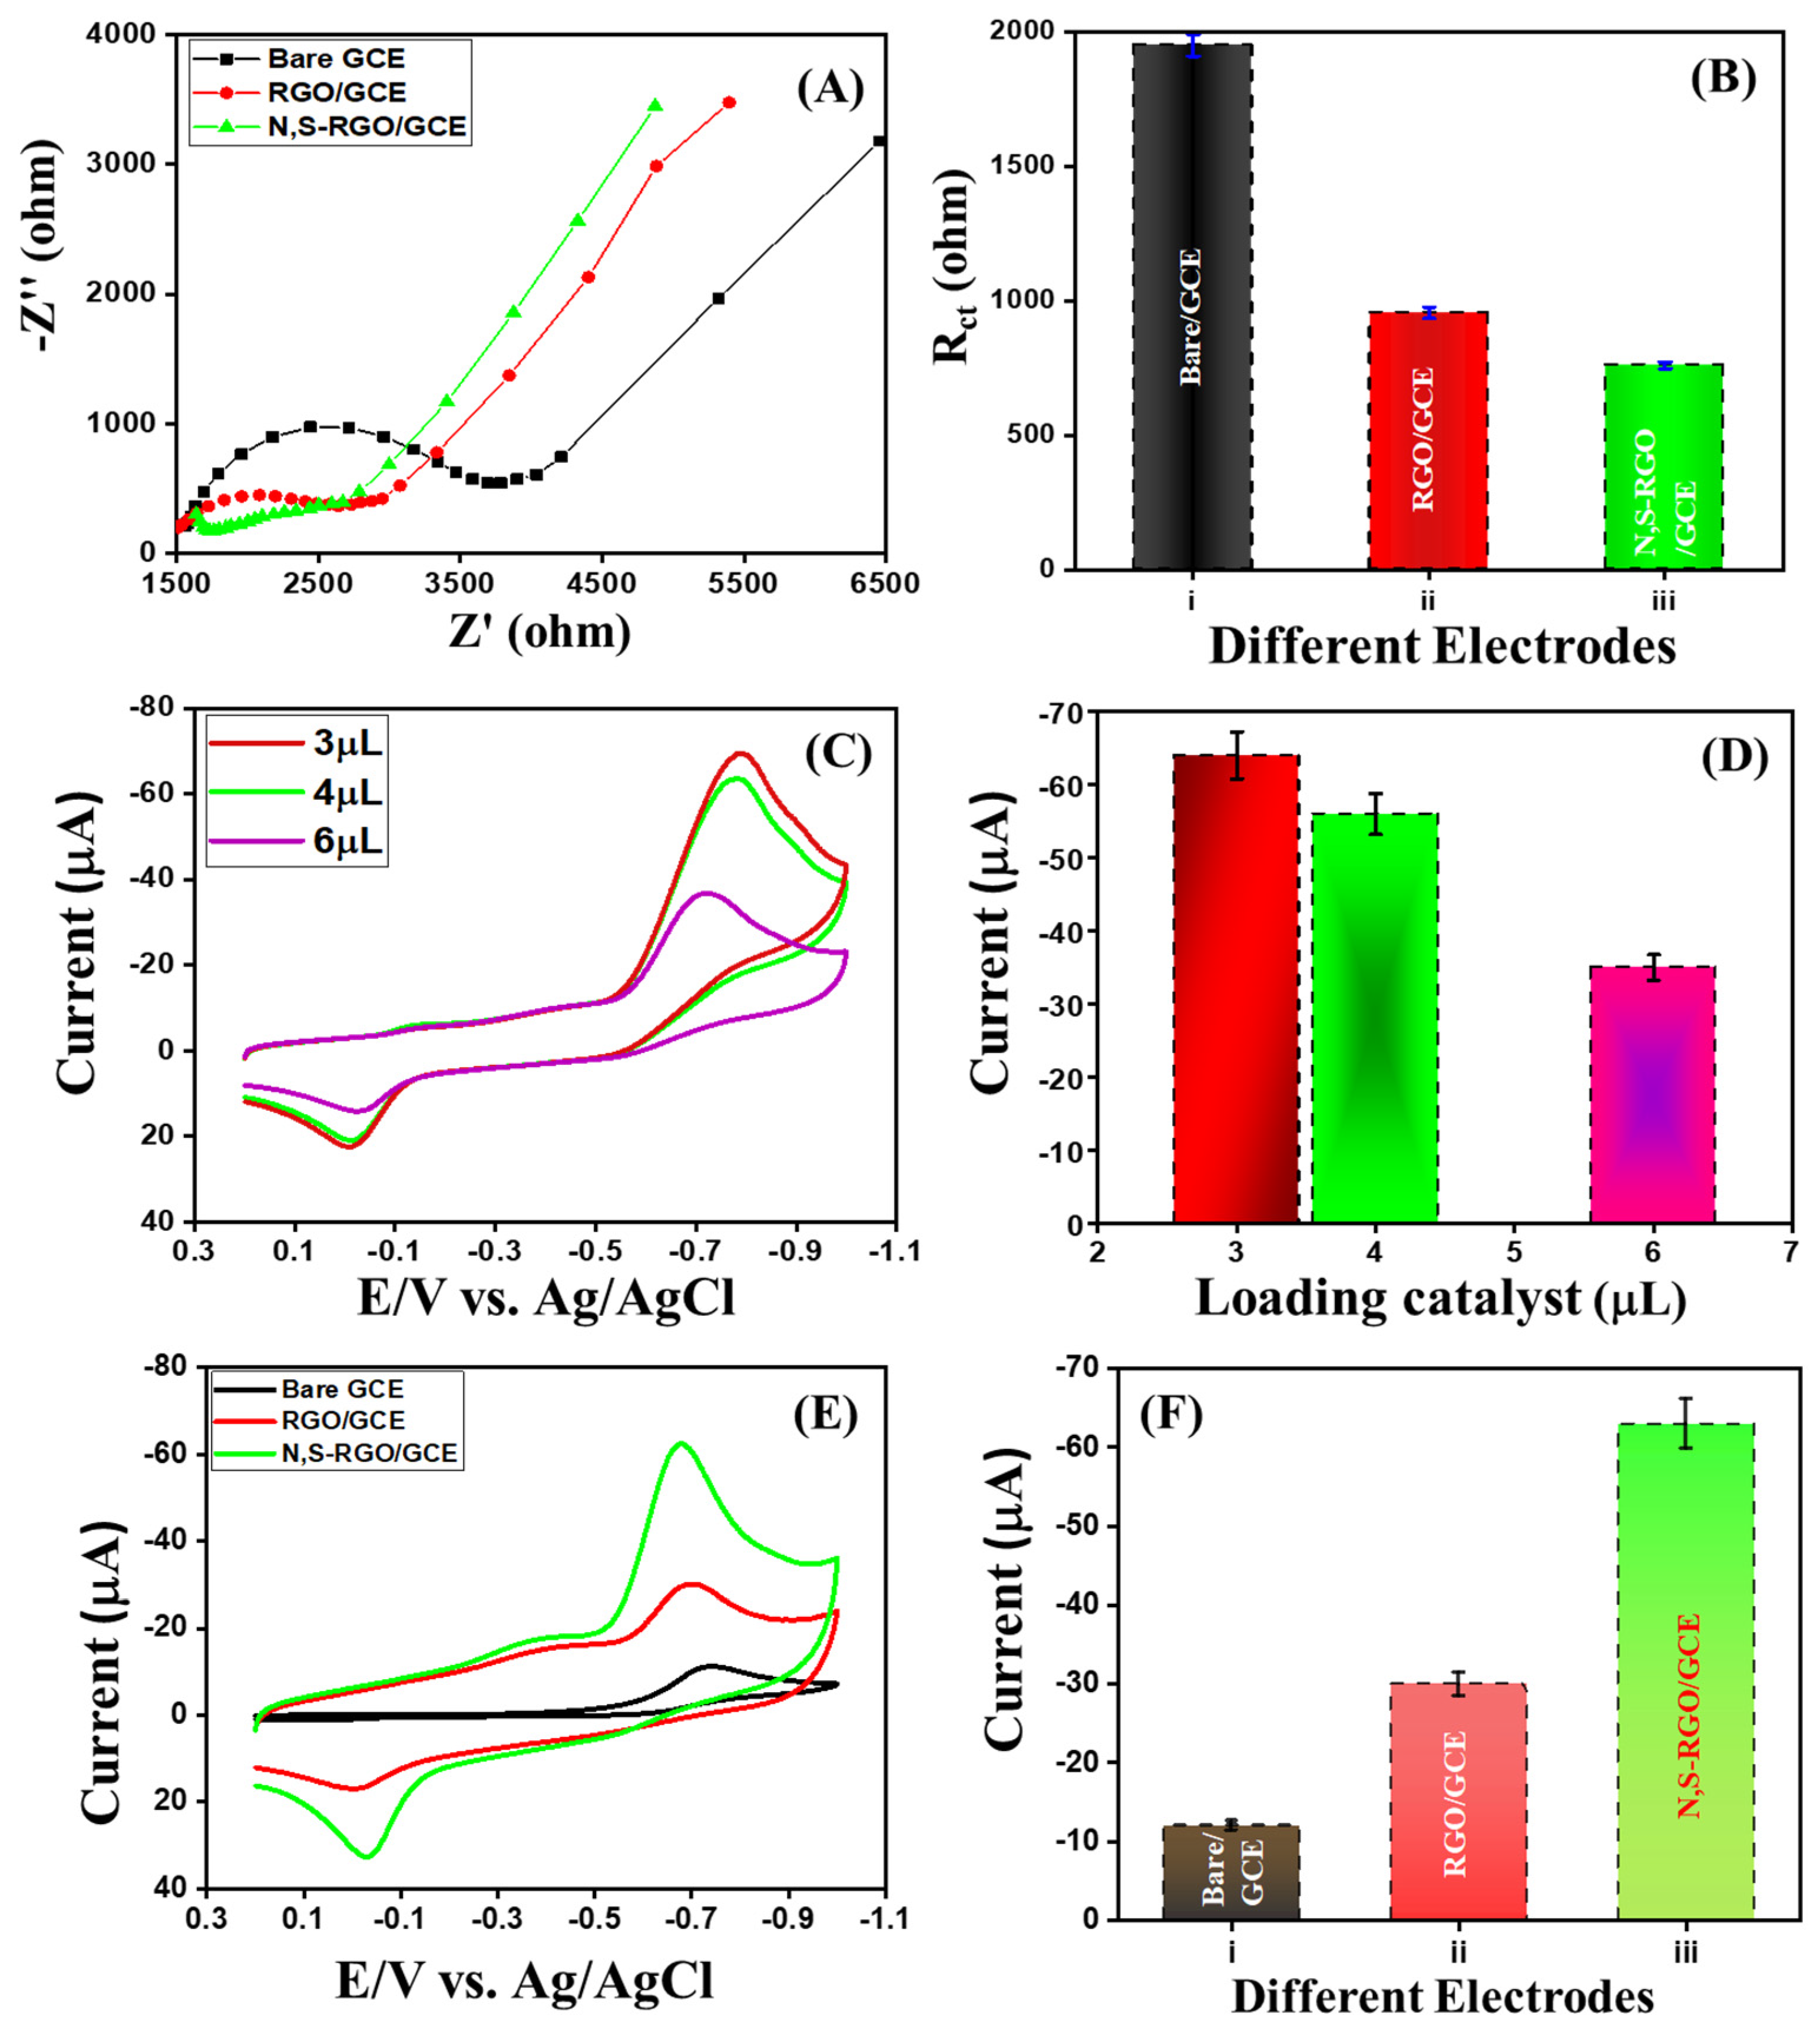
EIS is a powerful technique for evaluating interfacial electron-transfer behavior at the electrode–electrolyte interface [37]. Figure 4A presents the Nyquist plots of the bare glassy carbon electrode (GCE), RGO/GCE, and N,S-RGO/GCE, recorded in a 5 mM solution of [Fe(CN)6]3−/4− containing 0.1 M KCl as the supporting electrolyte. The Nyquist plots exhibit two distinct regions: a semicircular arc in the high-frequency region corresponding to the charge-transfer resistance (Rct) and a linear segment in the low-frequency region associated with diffusion-controlled kinetics. EIS measurements were carried out over a frequency range of 0.1 Hz to 100 kHz. The Rct values for the bare GCE, RGO/GCE, and N,S-RGO/GCE were calculated to be 1950.27, 955.47, and 760.25 Ω, respectively, and their corresponding bar graph is shown in Figure 4B. The pronounced decrease in Rct observed for the N,S-RGO/GCE indicates significantly enhanced charge-transfer efficiency, which can be attributed to the synergistic effects of nitrogen and sulfur co-doping combined with the conductive graphene network. Furthermore, the electrocatalytic activity of N,S-RGO/GCE was investigated in a 0.1 M KCl solution containing 0.005 M K3[Fe(CN)6] and K4[Fe(CN)6] at a scan rate of 50 mV s−1. Figure S2 shows that the bare GCE, RGO/GCE and N,S-RGO/GCE exhibit evidence of redox peaks for the redox reaction of K3[Fe(CN)6]3−/4−. The N,S-RGO-modified electrode displays a higher redox peak current value than other modified electrodes and bare GCE. To calculate the electrochemical active surface area (EASA) of bare/GCE, RGO/GCE, and N,S-RGO/GCE, a CV experiment was carried out in 0.1 M KCl solution containing 0.005 M K3[Fe(CN)6] and K4[Fe(CN)6] with different scan rates (20–300 mV s−1), as shown in Figure S3. Further, EASA calculation is briefly mentioned in the Supplementary File.

3.4. Electrocatalytic Activity of N,S-RGO/GCE Towards NB Reduction

The electrocatalytic activity of the modified electrodes toward NB reduction was investigated by CV under N2 gassaturated 0.1 M PBS (pH 7.0) at a scan rate of 50 mV s−1. Figure 4C,D further evaluate the effect of catalyst loading on the electrochemical response. CV measurements were performed using N,S-RGO/GCEs modified with different volumes of catalyst ink (3, 4, and 6 µL). As shown in Figure 4C, the cathodic peak current increases with increasing catalyst loading up to 3 µL, beyond which a gradual decline is observed. This behavior indicates that 3 µL is the optimal loading volume, providing an effective balance between active-site availability and efficient electron transport. Excessive catalyst loading likely leads to thicker films, which hinder electron diffusion and reduce catalytic efficiency. The corresponding bar plot in Figure 4D clearly confirms this trend, with the maximum current observed at 3 µL, validating it as the optimal catalyst loading for efficient NB detection.
Figure 4E presents the CV responses of NB at bare GCE, RGO/GCE, and N,S-RGO/GCE recorded in 0.1 M PBS (pH 7.0) containing 100 µM NB at a scan rate of 50 mV s−1. The corresponding bar diagram (Figure 4F) quantitatively compares the cathodic peak currents obtained at each electrode. The results clearly demonstrate that the catalytic activity follows the order: bare GCE < RGO/GCE < N,S-RGO/GCE. Notably, the N,S-RGO/GCE exhibits the highest reduction current of −62.6 µA at a peak potential of −660 mV, highlighting the critical role of nitrogen and sulfur co-doping in enhancing electrocatalytic performance. Moreover, the potentials required for NB reduction decrease progressively from bare GCE (−730 mV) to RGO/GCE (−690 mV) and N,S-RGO/GCE (−660 mV), further confirming that heteroatom doping effectively lowers the energy barrier for NB reduction by facilitating faster electron-transfer kinetics. The CVs of the bare GCE, RGO/GCE and N,S-RGO/GCE were recorded in the absence of NB (Figure S4) to demonstrate the electrochemical behavior before analyte addition. Among these, N,S-RGO shows a higher current response than RGO and bare GCE due to doping with heteroatoms in the carbon framework, which facilitates a higher background current. The RGO-modified electrode exhibits a higher background current than the bare GCE due to the enhanced electrical conductivity and faster electron-transfer characteristics of RGO. The small anodic current observed prior to the addition of NB is not related to analyte oxidation. It originates from the background current and surface electrochemical activity of the RGO-modified electrode in the supporting electrolyte. The presence of oxygen-containing functional groups and defect sites on the RGO surface can contribute to this non-faradic current response. Since no well-defined redox peak is observed in the blank electrolyte.
Importantly, the reduction current at the N,S-RGO/GCE is approximately six times higher than that of the bare GCE and nearly twice that of RGO/GCE, as illustrated in Figure 4F. This significant enhancement is primarily attributed to the synergistic effects of nitrogen and sulfur atoms incorporated into the graphene lattice, which modify the electronic structure, increase defect density, and alter the surface chemistry of the material. Nitrogen doping introduces n-type characteristics, increasing local electron density and facilitating electron transfer to the nitro group of nitrobenzene. Meanwhile, sulfur incorporation, owing to its larger atomic size, induces lattice distortion and generates defect-rich sites that enhance adsorption and activation of nitrobenzene molecules. The combined effects of N and S co-doping result in a higher density of catalytically active sites and improved charge-transfer kinetics [38,39,40].
Additionally, the presence of hydrophilic functional groups in N,S-RGO improves surface wettability, thereby enhancing interaction with the PBS electrolyte and facilitating efficient proton transport during proton-coupled electron transfer processes. The introduction of defect sites and heteroatom dopants increases the density of active sites and promotes adsorption of nitrobenzene molecules through π–π stacking interactions and defect-induced binding, leading to improved molecular preconcentration and accelerated reaction kinetics [41]. Furthermore, co-doping modulates the electronic structure of graphene, facilitating enhanced electron-transfer kinetics. Nitrogen species (particularly pyridinic and graphitic N) may contribute to proton transfer by acting as active/basic sites, while thiophenic sulfur functionalities may assist in stabilizing reaction intermediates via weak interactions. Collectively, these factors result in faster charge transfer, reduced potential, and increased reduction currents [42]. These synergistic effects enable sensitive and selective electrochemical detection of NB, with a lower detection limit, a wider linear range, and enhanced signal response. Also, the strong adhesion of N,S-RGO on the GCE surface can be attributed to the intrinsic properties of reduced graphene oxide, which acts as a natural binder due to its large surface area, high aspect ratio, and strong π–π interactions with the graphitic surface of the electrode. In addition, the presence of oxygen-, nitrogen-, and sulfur-containing functional groups further enhances interfacial interactions through hydrogen bonding and electrostatic attractions, thereby stabilizing the modified layer on the electrode surface. These combined effects contribute to the excellent mechanical integrity and stability of the N,S-RGO/GCE interface during measurements.
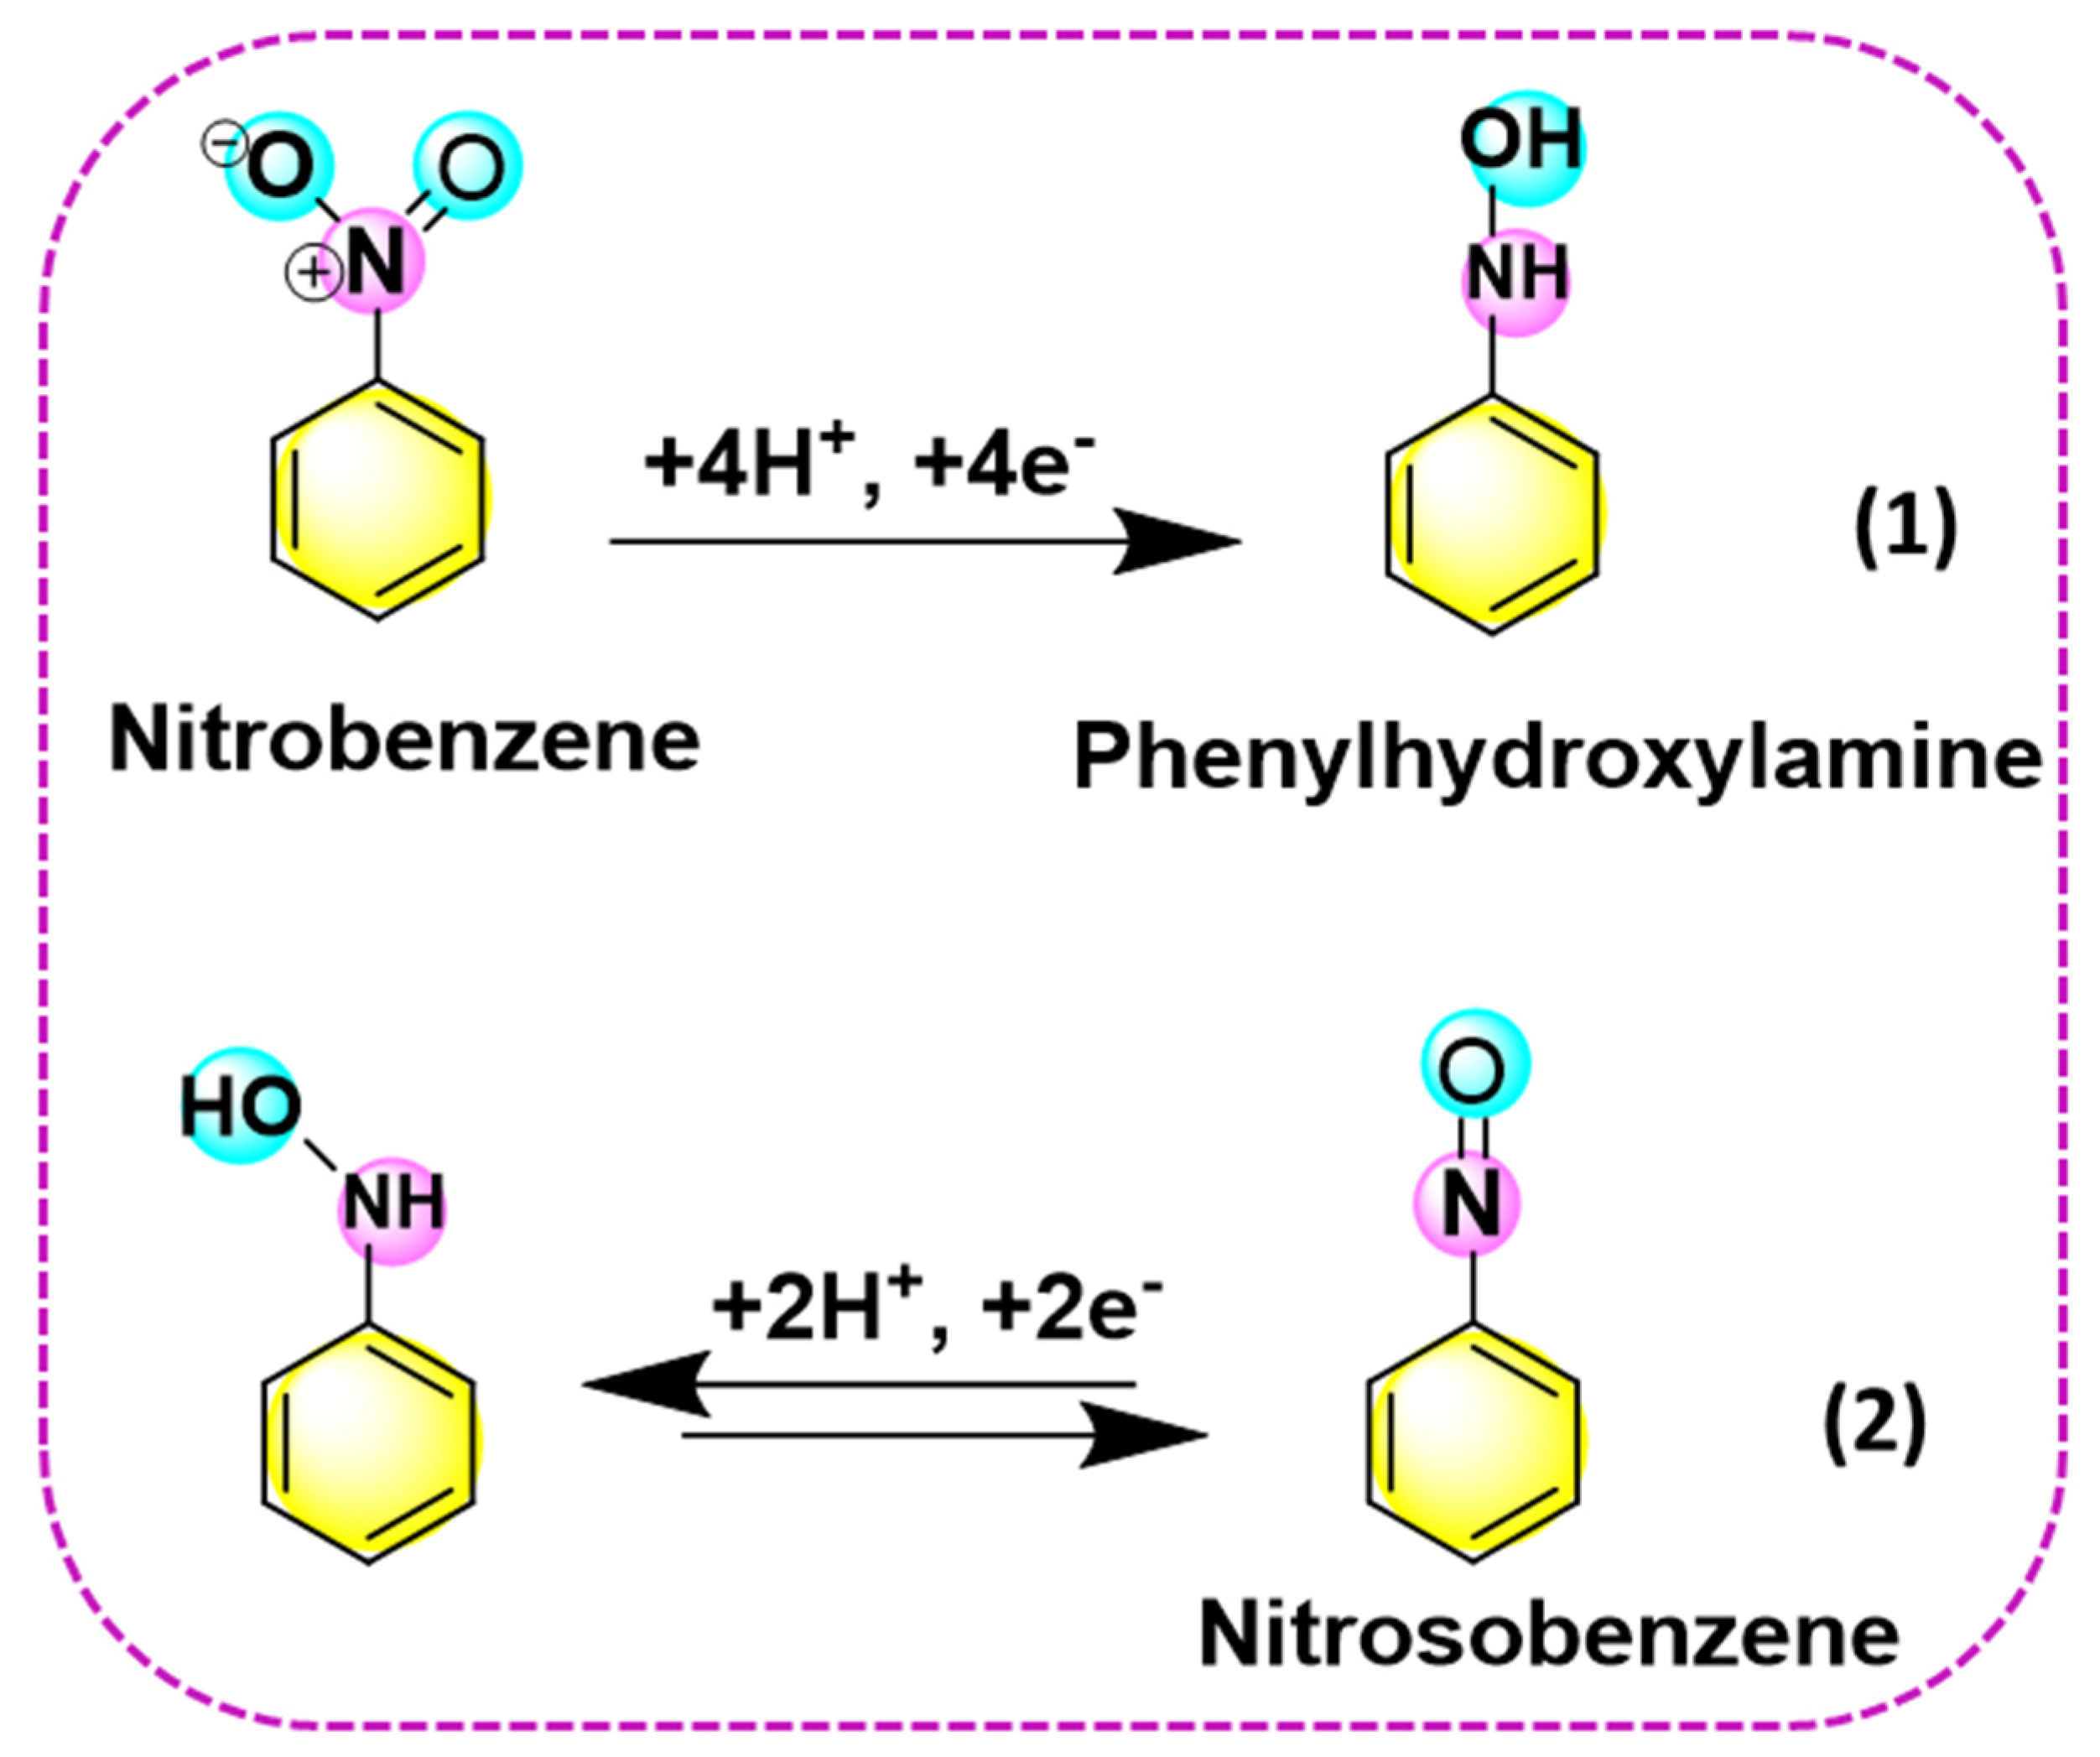
The electrochemical behavior of NB was studied at modified GCE and investigated using CV, as shown in Figure S5. The CV behavior of N,S-RGO/GCE in PBS containing 100 μM NB at a scan rate of 50 mV s−1. In the presence of NB, three distinct peaks, denoted as A, B and B’, were observed. A prominent reduction peak appeared at −0.676 V. This peak corresponds to the direct reduction in NB to phenylhydroxylamine, as illustrated in Scheme 2 (Step 1). The redox peak pair observed at −0.396/−0.03 V is attributed to the reversible electrochemical conversion between phenylhydroxylamine and nitrosobenzene [43]. The reduction peak intensity of B′ is significantly lower than that of peak A, indicating that the reduction in NB is more favorable at −0.676 V than −0.396 V, as depicted in Scheme 2 (Step 2).

3.4.1. Influence of pH on NB Reduction

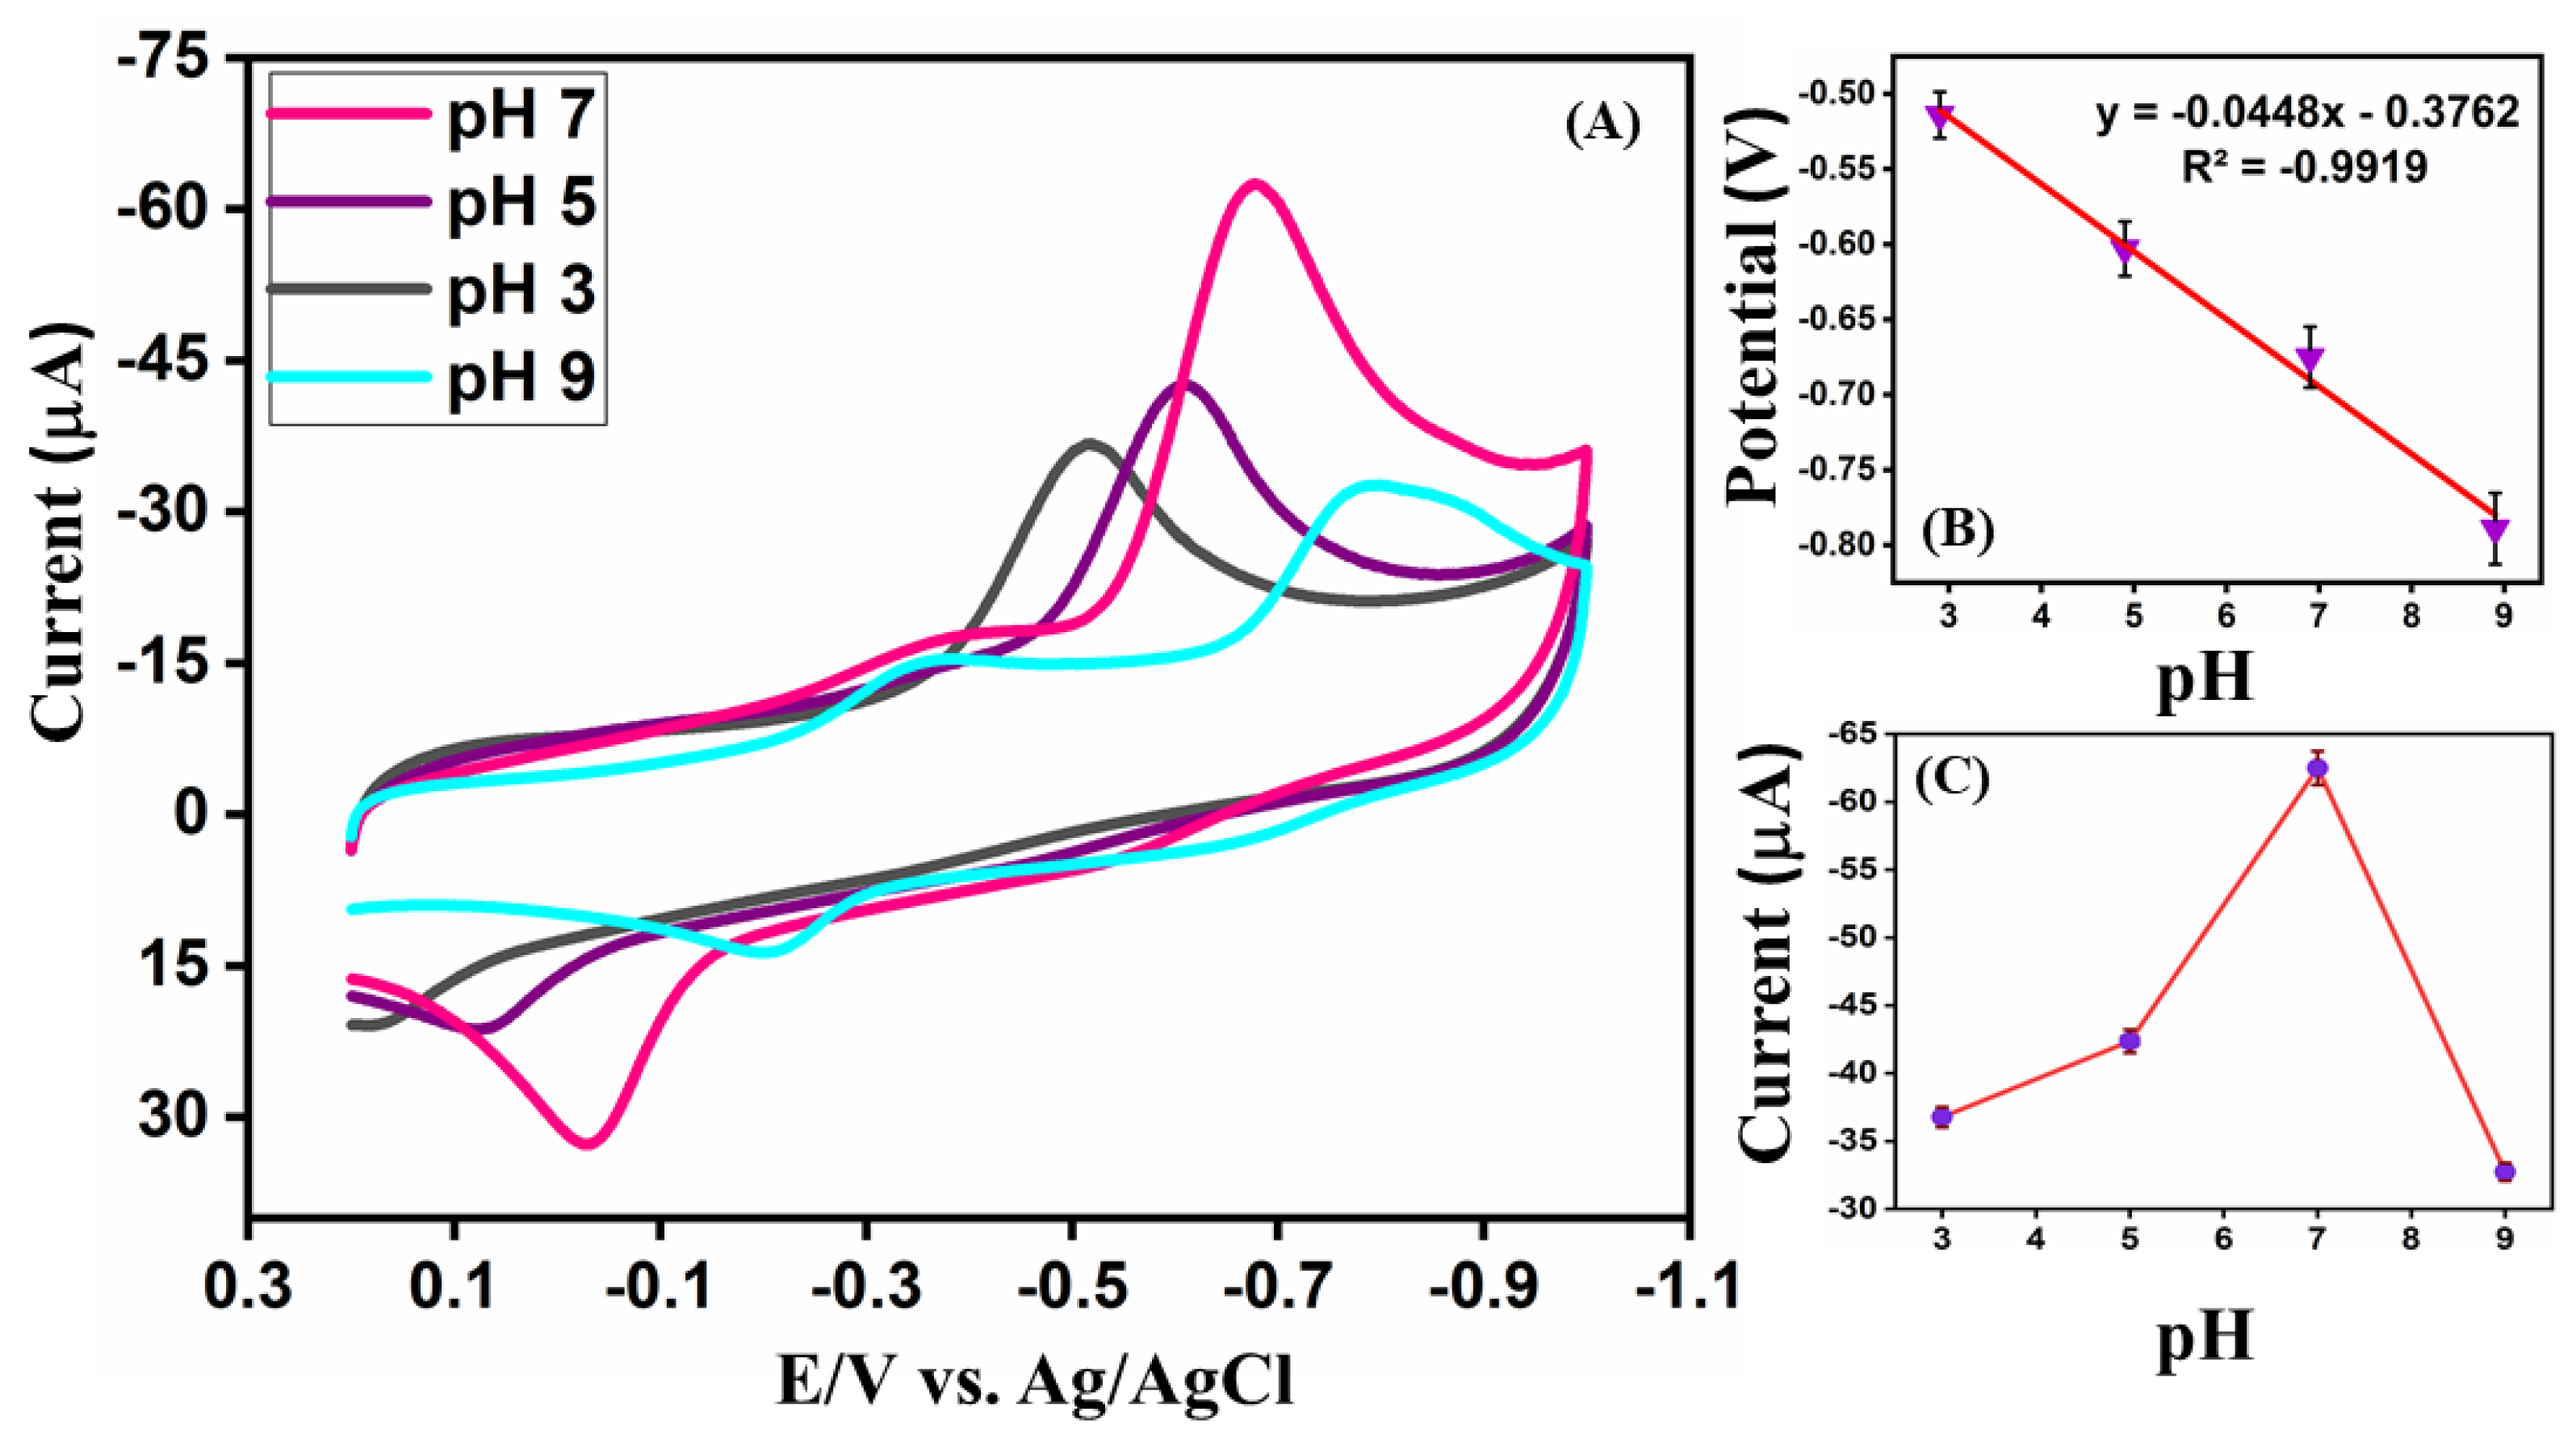
Figure 5 illustrates the electrochemical reduction of 100 μM NB at the N,S-RGO/GCE in 0.1 M PBS at different pH values. As observed from the CV curves (Figure 5A), both the reduction peak current and peak potential vary significantly with pH, indicating a proton-coupled electron transfer mechanism during NB reduction. The peak current increases progressively from pH 3 to 7, reaching a maximum at pH 7, and then decreases at higher pH values. This behavior suggests that a neutral pH provides the most favorable environment for efficient NB reduction. The linear shift in the reduction peak potential with pH (Figure 5B) exhibits a slope of −44.8 mV s−1 pH, which is close to the theoretical Nernstian value, indicating an approximately 1:1 proton-to-electron transfer ratio. The highest electrocatalytic activity is observed at pH 7, whereas the diminished performance at pH 3 and pH 9 can be attributed to unfavorable proton availability and slower electron-transfer kinetics, respectively (Figure 5C). These results clearly demonstrate that pH 7 is the optimal condition for NB detection using the N,S-RGO/GCE, highlighting its pH-sensitive and tunable electrochemical behavior.

3.4.2. Effect of Scan Rate and Concentration on NB Reduction

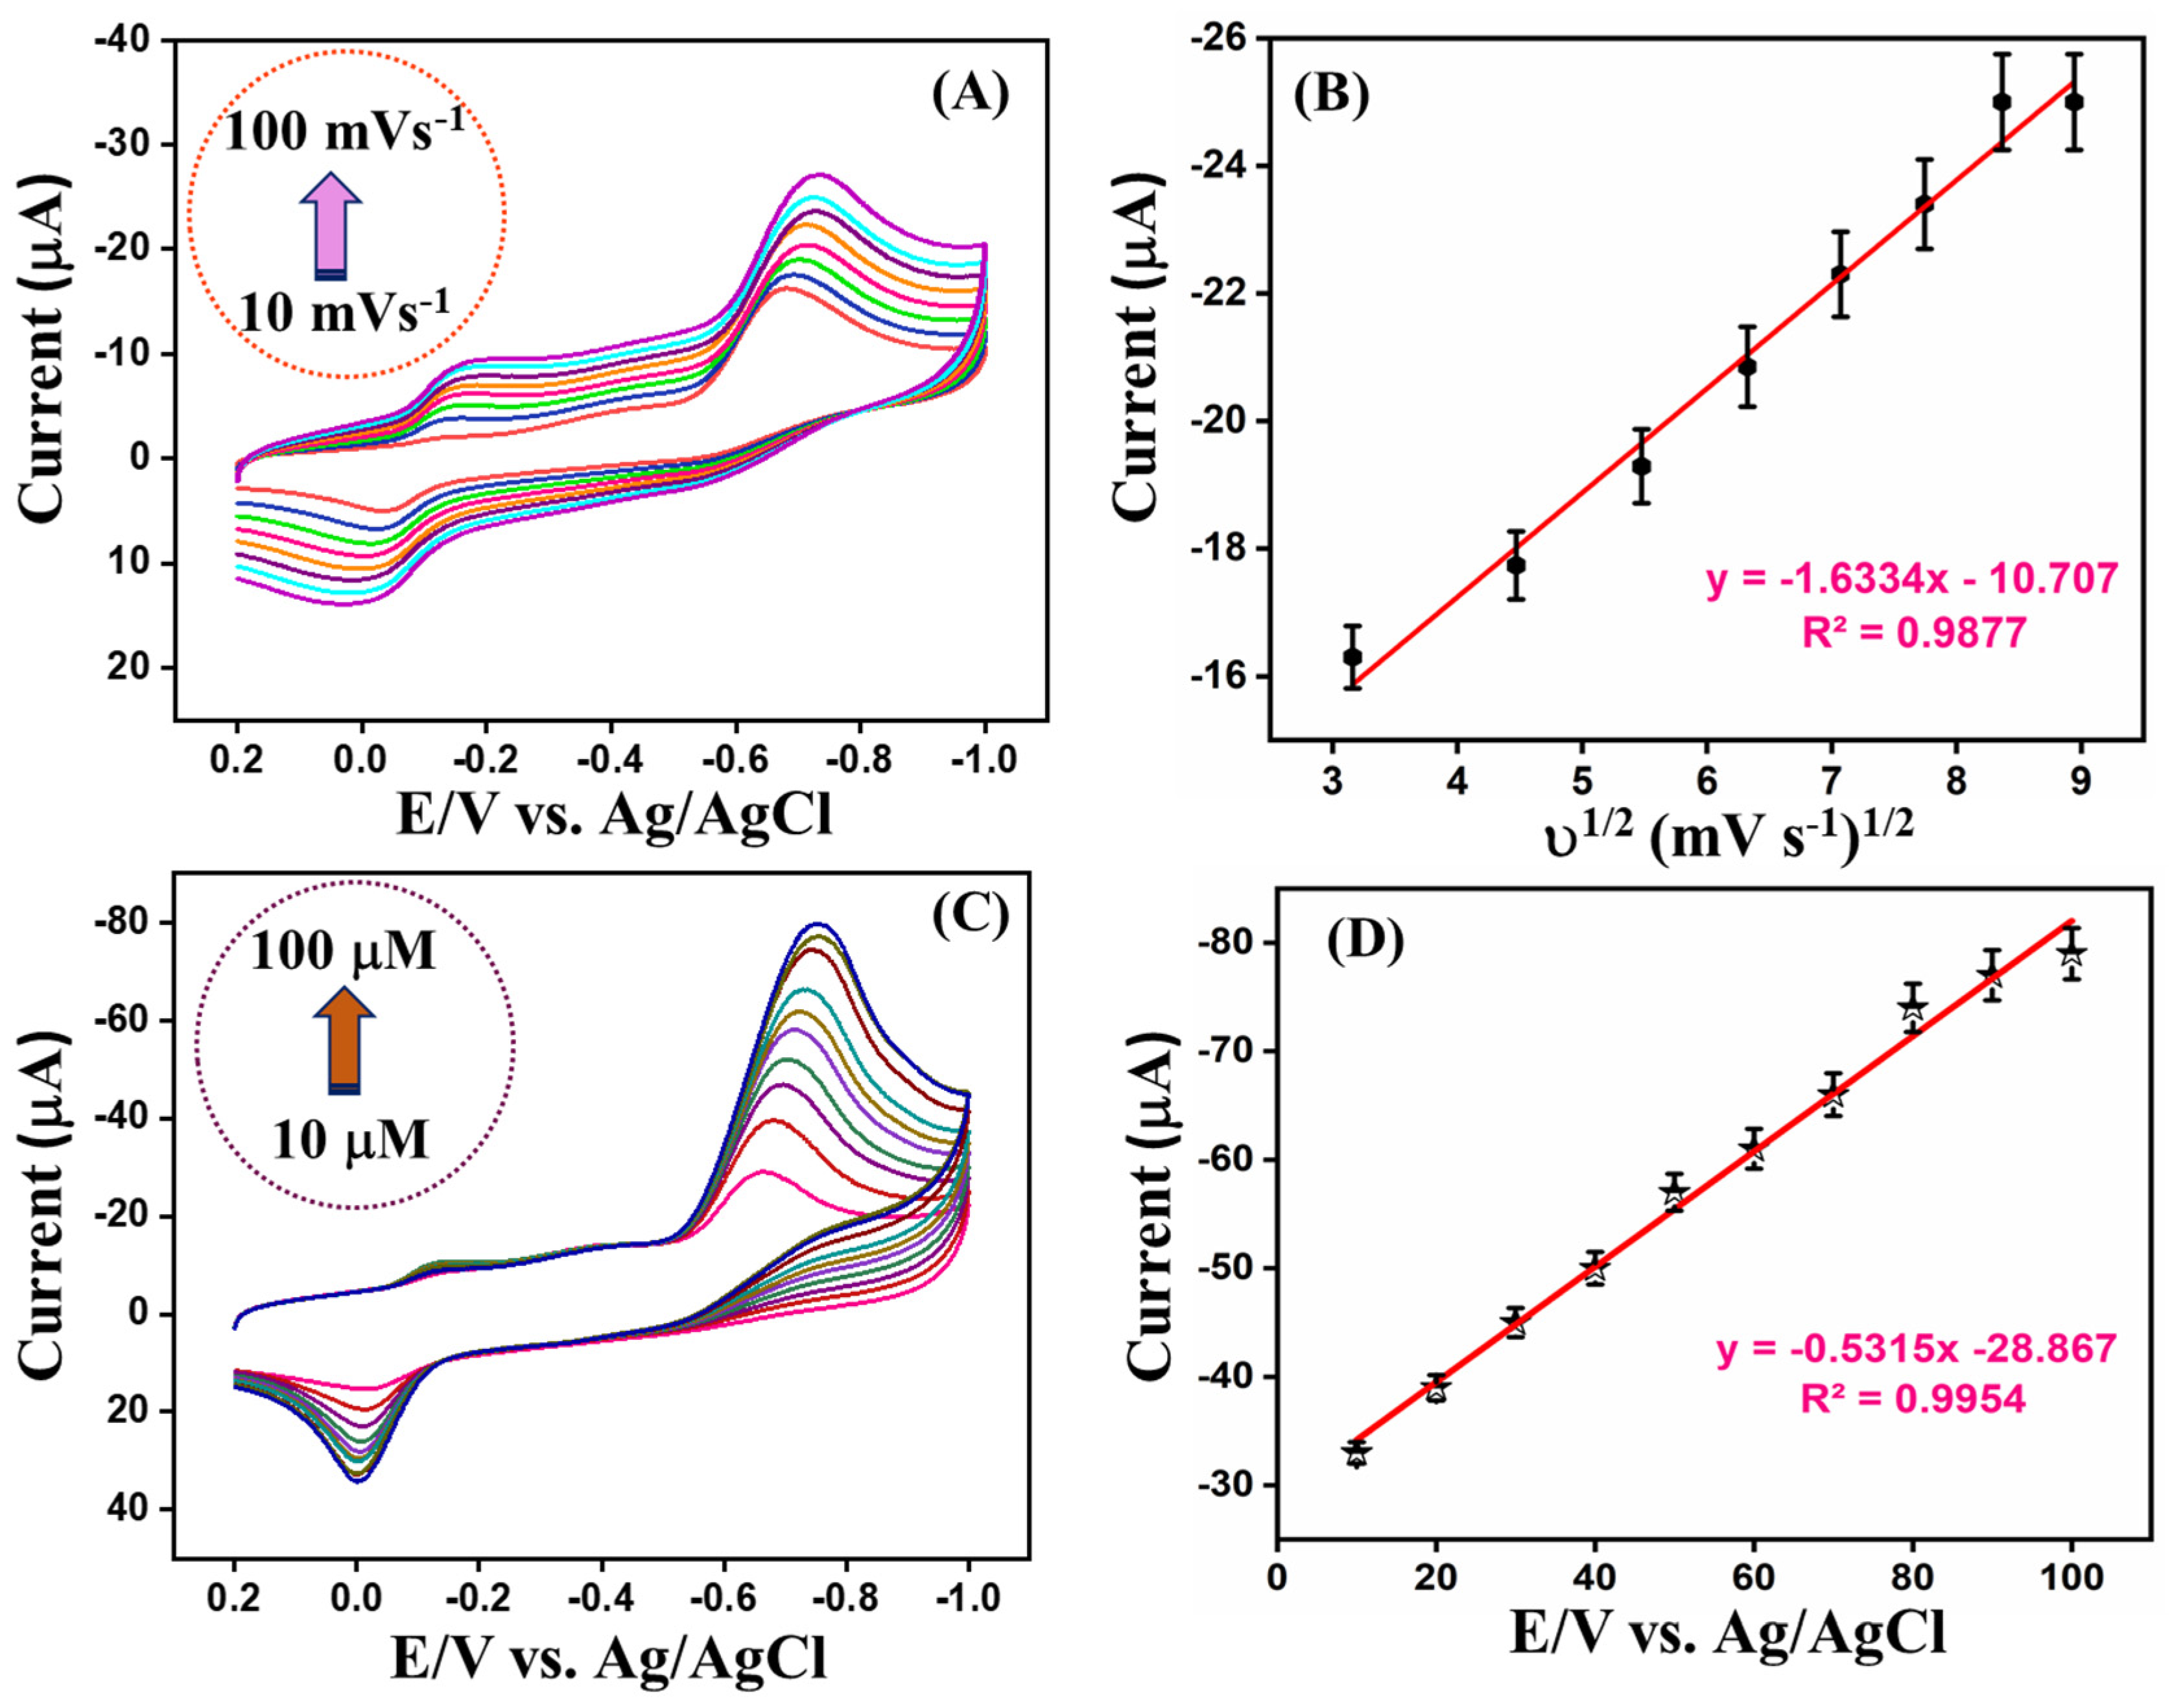
The electrochemical performance of N,S-RGO/GCE was further examined in the presence of various scan rates to be examined under N2 gas saturated in the presence of 100 µM NB containing 0.1 M PBS. Figure 6A presents the CV curves of 100 µM NB recorded at the N,S-RGO/GCE at various scan rates ranging from 10 to 100 mV s−1 in 0.1 M PBS (pH 7.0). The cathodic peak current gradually increases with increasing scan rate, indicating a clear dependence of the electrochemical response on the sweep rate. This behavior suggests that the electroreduction kinetics of NB at the N,S-RGO/GCE are influenced by the scan rate. The relationship between the cathodic peak current and the square root of the scan rate is shown in Figure 6B, exhibiting good linearity with the regression equation y = −1.6334x − 10.707 (R2 = 0.9877). Additionally, Figure S6 shows a linear correlation between the cathodic peak current and the scan rate, with the regression equation y = −0.1487x − 14.64 (R2 = 0.9978). The strong linear relationships between peak current and both the scan rate and its square root indicate that the electrochemical reduction in NB at the modified electrode is predominantly governed by a diffusion-controlled process rather than a surface-confined mechanism.
Furthermore, the electrocatalytic reduction behavior of NB at the N,S-RGO/GCE was systematically investigated by CV in 0.1 M PBS (pH 7.0) containing different NB concentrations ranging from 10 to 100 µM at a fixed scan rate of 50 mV s−1 (Figure 6C). As the NB concentration increases, the cathodic peak current correspondingly increases, which can be attributed to the higher availability of electroactive NB molecules at the electrode–electrolyte interface, facilitating more efficient electron transfer. This enhanced electrocatalytic activity is primarily due to the high electrical conductivity, large effective surface area, and synergistic effects of nitrogen and sulfur co-doping within the graphene framework.
Figure 6D illustrates the corresponding calibration plot of cathodic peak current versus NB concentration. A strong linear correlation is observed over the studied concentration range, demonstrating that the peak current response is directly proportional to NB concentration. This excellent linearity confirms the reliability and suitability of the N,S-RGO/GCE sensor for quantitative NB detection. Further, the CV curves with bare (without NB) along with additions are shown in Supplementary Materials (Figure S7) the overall current response of the modified electrode, which includes both capacitive (non-Faradaic) and Faradaic contributions. The capacitive current originates from the charging/discharging of the electrical double layer at the electrode/electrolyte interface and does not involve any electrochemical redox reaction. The current that slowly changes over the whole potential range, even before the NB reduction peak appears, is the capacitive (non-Faradaic) current. The sharp peak around −0.7 V is the Faradaic current due to NB detection.

3.5. Linear Sweep Voltammetry Detection of NB

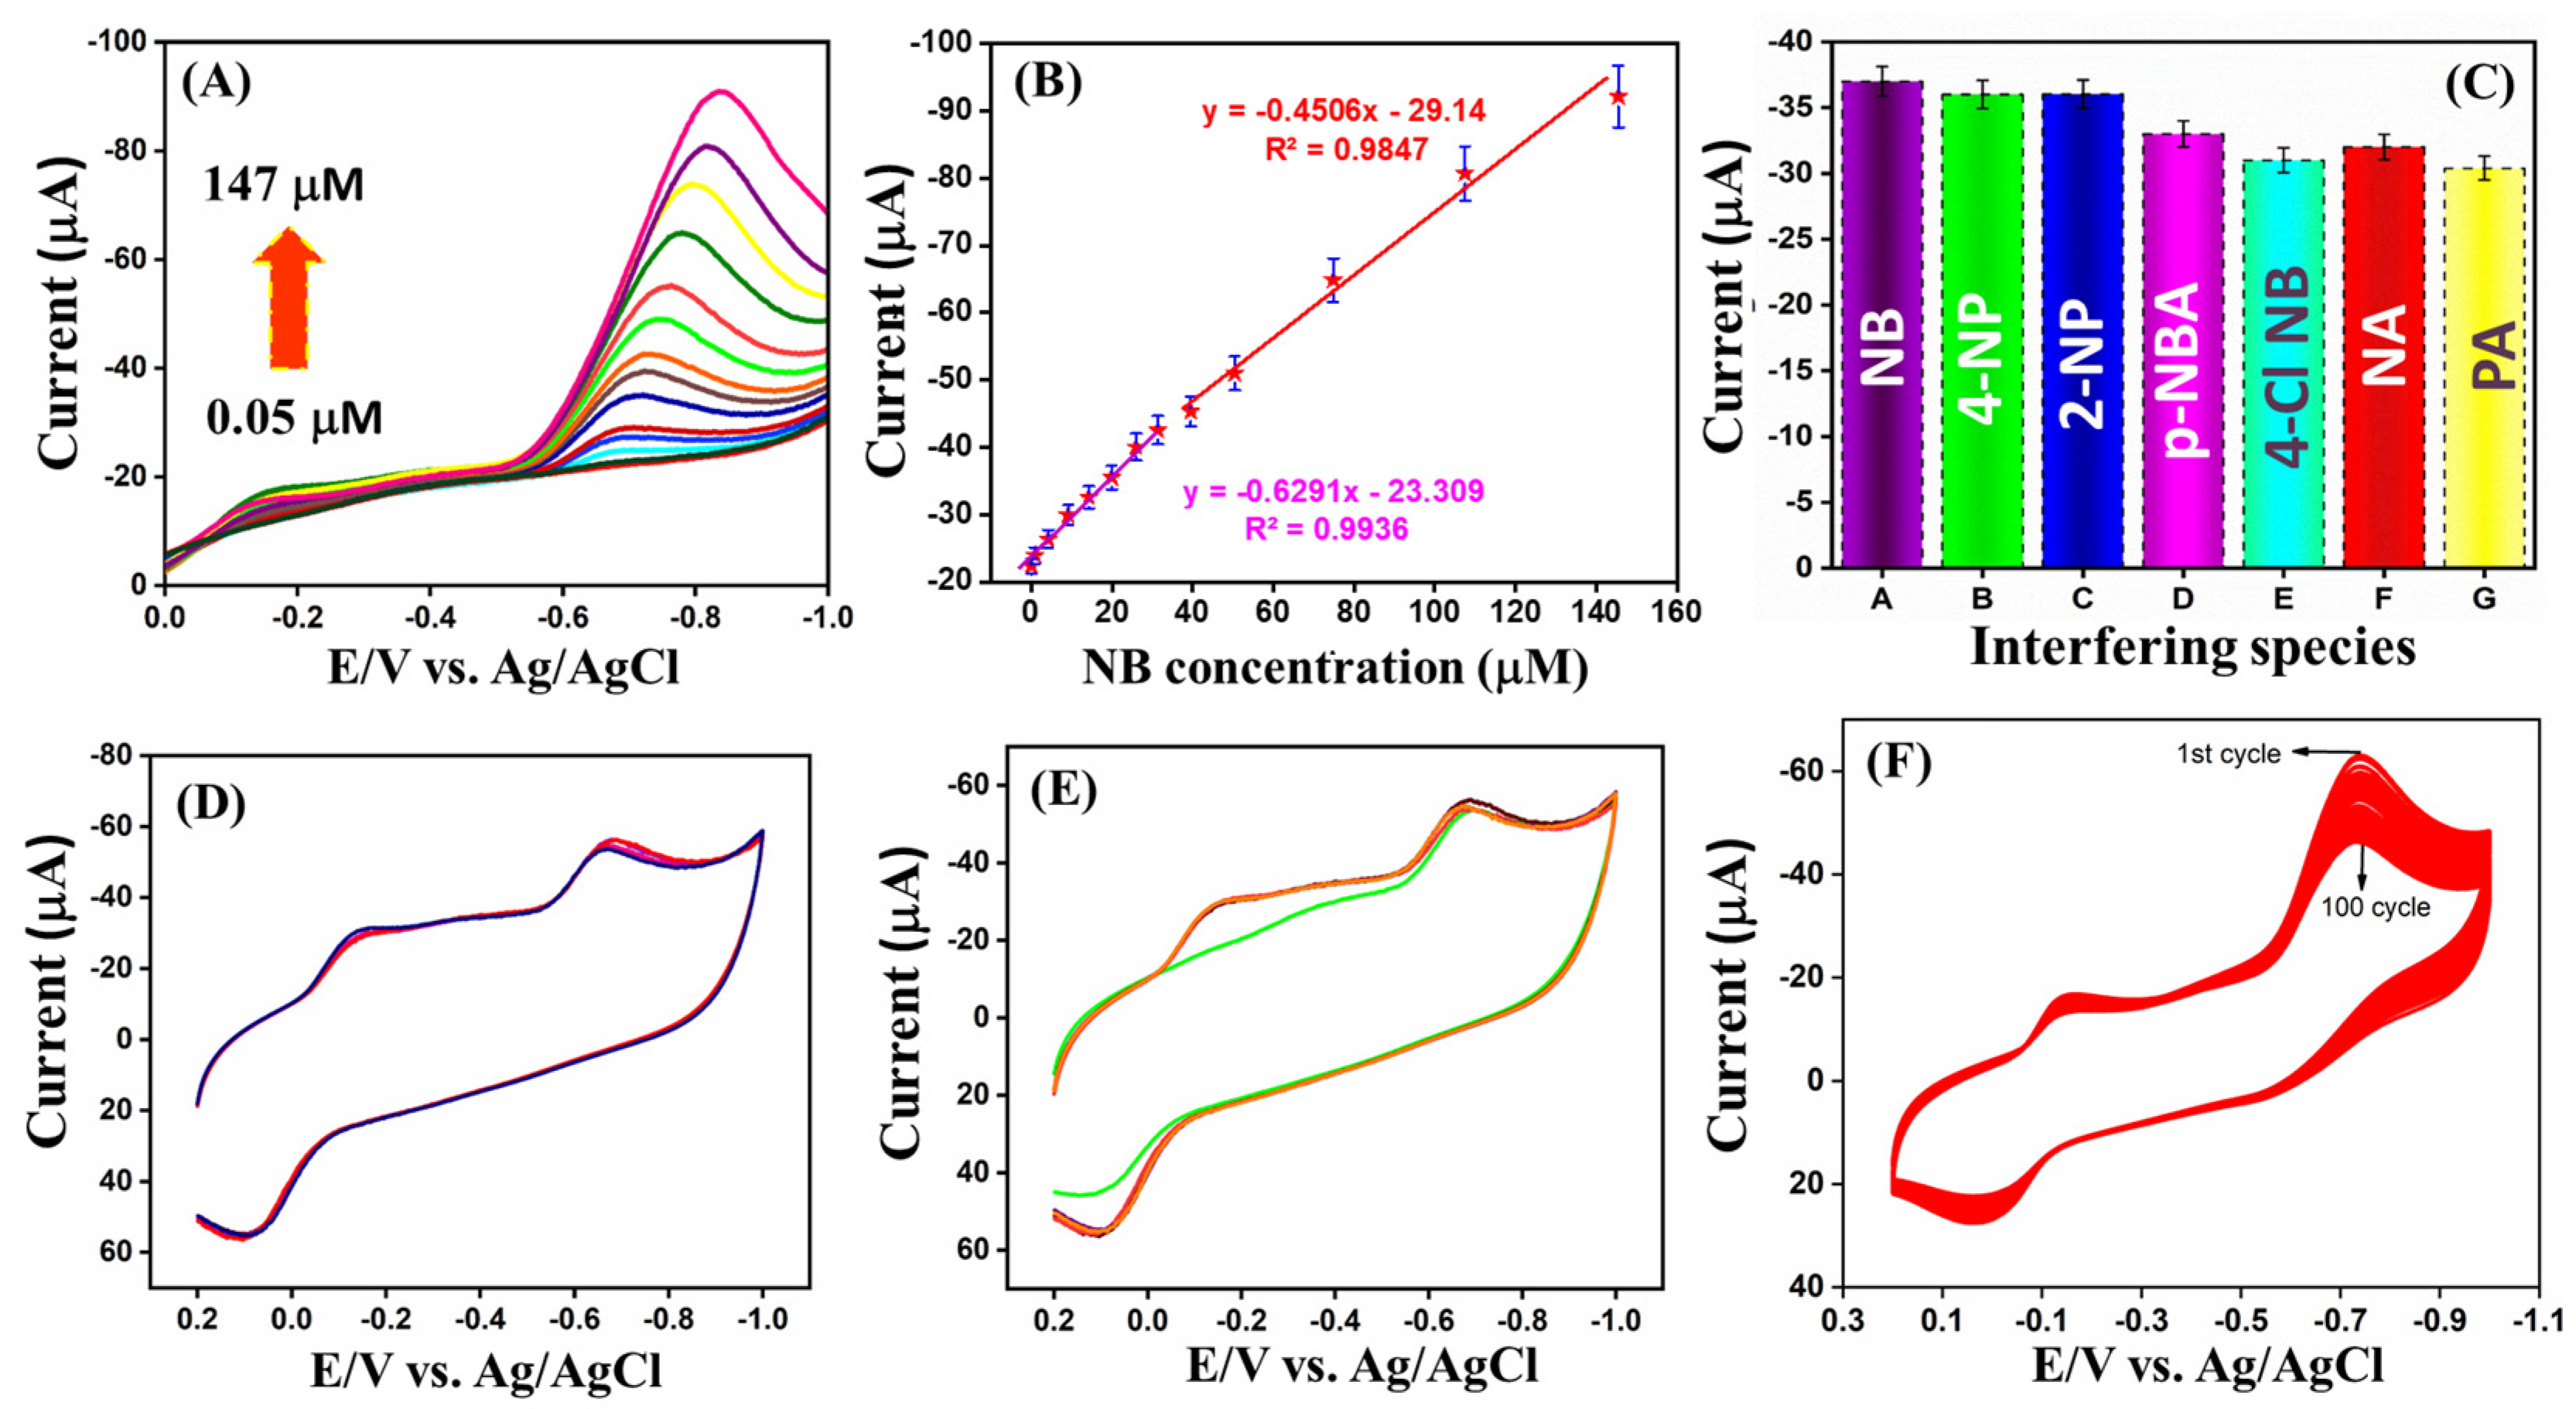
The electrochemical response of the N,S-RGO/GCE toward varying concentrations of NB was investigated using LSV. Figure 7A illustrates the LSV curves of NB recorded at the N,S-RGO/GCE over different concentrations. As shown, the reduction peak current increases progressively with increasing NB concentration, indicating efficient electrocatalytic activity of the modified electrode. A well-defined reduction peak is observed across a concentration range of 0.05 to 147 μM NB. A good linear plot was obtained for the reduction peak current value and various concentrations of NB; the corresponding plot is shown in Figure 7B. The obtained linear regression equation and coefficient were Ipc (μA) = −0.6291 (μM) −23.309 and R2 = 0.9936; for higher concentrations, Ipc (μA) = −0.4506 (μM) −29.14 and R2 = 0.9847, respectively. The electrochemical detection of NB at N,S-RGO/GCE in LSV exhibits an LOD = 0.0077 μM for lower concentrations; for higher concentrations, an LOD = 0.01087 μM is calculated from the standard equation of LOD = 3 Sb/S, where Sb is the standard deviation of the blank signals and S is the slope of the calibration curve. The calculated LOD was 0.0077 μM, indicating excellent sensitivity of the proposed sensor. Table 1 compares the analytical performance of the present sensor with previously reported NB sensors.

3.5.1. Interference Analysis

The selectivity of the N,S-RGO-modified electrode toward NB is a critical parameter, particularly in complex environments where structurally similar nitro compounds and other potentially interfering species may coexist. To evaluate selectivity, LSV was performed under optimized experimental conditions. Interference studies were conducted by the successive addition of 200 µM of various interfering species, including 4-nitrophenol, 2-nitrophenol, p-nitrobenzaldehyde, 4-chloronitrobenzene, nitroaniline, and picric acid in the presence of 100 µM NB using the N,S-RGO/GCE sensor. Notably, the reduction peak current of NB remained essentially unchanged upon the addition of these interfering compounds, indicating the satisfactory selectivity of the N,S-RGO-modified electrode toward NB, as evidenced by the LSV results (Figure S8). The corresponding bar graph illustrating the current responses in the presence of interfering analytes is presented in Figure 7C. These results clearly demonstrate that the N,S-RGO/GCE sensor exhibits acceptable discrimination against common nitroaromatic interferents during the electrochemical detection of NB. The minimal interference observed underscores the strong potential of this sensor for selective NB detection in complex environmental and analytical samples.

3.5.2. Effect of Repeatability, Reproducibility, and Stability

CV was employed to evaluate the repeatability, reproducibility, and stability of the electrochemical sensor in order to assess its reliability, robustness, and suitability for real-time applications. Repeatability was examined using a single N,S-RGO/GCE under identical experimental conditions over multiple successive measurements, as shown in Figure 7D. The reduction peak current exhibited only slight variations, and the consistent current response across cycles demonstrates the acceptable repeatability of the N,S-RGO–modified electrode. Reproducibility was evaluated using five independently prepared N,S-RGO/GCEs in the presence of 100 μM NB to assess sensor-to-sensor consistency. As illustrated in Figure 7E, all modified electrodes displayed comparable reduction peak currents, indicating excellent reproducibility of the proposed sensor. The corresponding bar diagram is presented in Figure S9. The long-term stability of the N,S-RGO/GCE sensor was investigated by cyclic voltammetry using 50 μM NB over 100 continuous cycles (Figure 7F). It was observed that the reduction peak current decreased by only 10.5%, demonstrating that the sensor retained a stable electrochemical response with minimal signal degradation during prolonged operation. The consistent peak shape and current values throughout the cycling confirm the strong operational stability of the sensor. Furthermore, the prolonged stability of the N,S-RGO electrode was evaluated using a single proposed modified electrode for the response of NB (100 μM) for 15 days (Figure S10). The experiments were performed every day, and the modified electrode was kept in a refrigerator at 5 °C. The N,S-RGO electrode retained 96.3% of the initial current value, thereby demonstrating the withstanding stability of our N,S-RGO sensor.

3.5.3. Analysis of NB in Real Water Samples

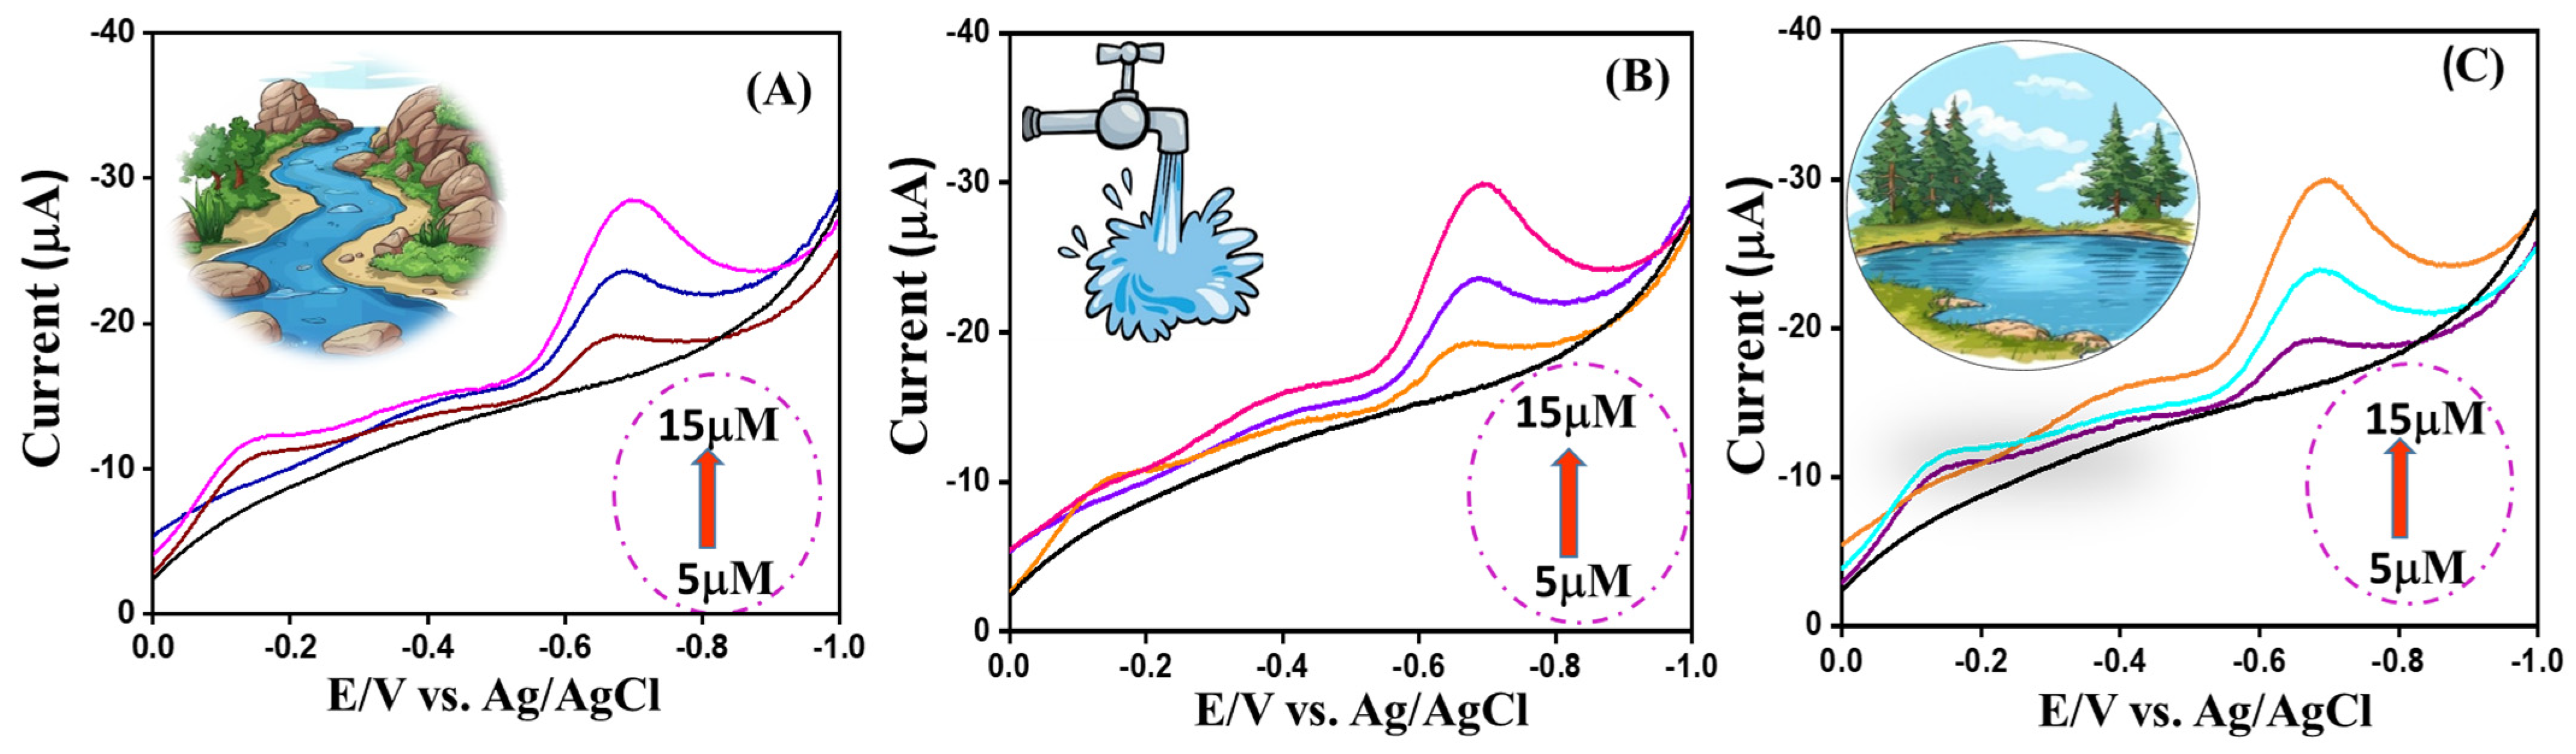
To evaluate the practical applicability of the fabricated N,S-RGO/GCE sensor, NB was detected in real water samples collected from Thirupparamkundram Lake (Madurai), Vaigai River water, and tap water obtained from Madura College. The collected water samples were mixed with 0.1 M PBS (pH 7.02) in a 1:9 ratio without any prior pretreatment [47,53]. No electrochemical signal corresponding to NB was observed in the unspiked samples, confirming the absence of NB contamination. Subsequently, known concentrations of NB were spiked into the real samples, and the corresponding LSV responses are presented in Figure 8A–C. The recovery results for river, lake, and tap water samples were evaluated using the standard addition method, as summarized in Table 2. The obtained results demonstrate satisfactory recoveries, indicating good accuracy and reliability of the sensor. These findings confirm the practical feasibility of the N,S-RGO modified electrode for effective NB detection in real water samples.
The overall results demonstrate that the microwave-assisted synthesis successfully produced N,S co-doped reduced graphene oxide with a defect-rich structure and enhanced electronic properties. Structural and spectroscopic analyses confirmed effective heteroatom incorporation and increased disorder, which contributed to improved electrochemical performance. The N,S-RGO-modified electrode exhibited significantly enhanced charge-transfer efficiency, higher reduction currents, and lower potential toward nitrobenzene reduction compared to bare and RGO-modified electrodes. Under optimized conditions, the sensor achieved a wide linear detection range, low detection limit, and excellent selectivity in the presence of interfering species. Furthermore, reliable recovery values obtained from real water samples validate the practical applicability of the proposed sensor for environmental monitoring.

4. Conclusions

In summary, nitrogen and sulfur co-doped reduced graphene oxide (N,S-RGO) was successfully synthesized via a microwave-assisted approach using thiourea as a dual heteroatom source. The structural and morphological analyses confirmed effective heteroatom incorporation and the formation of wrinkled, defect-rich nanosheets, which are beneficial for electrochemical applications. The N,S-RGO-modified GCE exhibited significantly enhanced electrocatalytic activity towards NB reduction, which can be attributed to the synergistic effect of nitrogen and sulfur doping. Specifically, nitrogen atoms improve electron-donor characteristics and conductivity, while sulfur atoms induce structural defects and modulate charge density, collectively facilitating faster electron-transfer kinetics and increasing the density of active sites. LSV showed a wide linear detection range of 0.05–147 µM with a low detection limit of 0.007 µM, demonstrating competitive or superior performance compared to previously reported graphene-based sensors.
Furthermore, the real water samples achieved satisfactory recovery values in the range of 92.0–98.4%, displaying good accuracy and reliability. Minor variation in recovery may be attributed to matrix effects from coexisting ions and organic matter. Despite these promising results, the cyclic stability and long-term stability show electrode durability, exploring portable sensing platforms, and extending this strategy to detect other environmental pollutants.
Overall, the developed N,S-RGO/GCE sensor presents a simple, cost-effective and efficient platform for the sensitive detection of NB, highlighting its potential for practical environmental monitoring applications.

Supplementary Materials

The following supporting information can be downloaded at https://www.mdpi.com/article/10.3390/c12020052/s1, Figure S1. Morphological Characterization, Figure S2. CV response of bare GCE, RGO/GCE and N,S-RGO/GCE at a scan rate 50 mV s−1 these experiments were carried out in 0.005 M [Fe(CN)6]3−/4− containing 0.1 M KCl solution, Figure S3. (A–C) CV response of bare/GCE, RGO/GCE and N,S-RGO/GCE at scan rate from 20 to 300 mV s−1 all these experiments were carried out in 0.005 M [Fe(CN)6]3−/4− containing 0.1 M KCl solution and (D–F) calibration curves of current response versus square root of scan rates, Figure S4. CV curves of the bare GCE and RGO/GCE in the absence of NB 0.1 M PBS, Figure S5. CV behavior of N,S-RGO/GCE recorded in 0.1 M PBS containing 100 μM NB at a scan rate of 50 mV s−1, Figure S6. linear calibration plot of scan rate vs. current, Figure S7. (A) CV curves of N,S-RGO/GCE recorded in 0.1M PBS (pH 7.0) containing 100 μM NB at various scan rates ranging from 10 to 100 mV s−1 along with bare without NB (black peak) (B) linear plot of cathodic peak current vs. square root of scan rate (υ12), (C) CV curves of N,S-RGO/GCE in 0.1M PBS (pH 7.0) with increasing concentrations of NB (0–100 μM) at a scan rate of 50 mV s−1 and (D) linear plot of cathodic peak current vs. concentration, Figure S8. LSV records of 100 μM NB with various interferents (4-nitrophenol, 2-nitrophenol, p-nitrobenzaldehyde, 4-chloro nitrobenzene, nitroaniline, picric acid), Figure S9. (A) CV responses of N,S-RGO/GCE for the five repeating experiments its bar graph (B) CV responses of five independent N,S-RGO/GCEs its bar graph, Figure S10. The bar diagram for stability of N,S-RGO/GCE over 15 days.

Author Contributions

Conceptualization, P.S. and R.R.; methodology, P.S. and V.M.; software, P.S.; validation, K.M. and T.J.; formal analysis, V.M.; resources, V.M. and R.R.; data curation, P.S.; writing—original draft preparation, P.S., V.M. and R.R.; writing—review and editing, P.S. and V.M.; visualization, T.J. and K.M.; supervision, R.R. All authors have read and agreed to the published version of the manuscript.

Funding

This work was financially/partially supported by the Advanced Institute of Manufacturing with High-tech Innovations (AIM-HI) from the Featured Areas Research Center Program within the framework of the Higher Education Sprout Project by the Ministry of Education (MOE) in Taiwan. The authors also extend their sincere appreciation to the Deanship of Scientific Research and Graduate Studies at King Khalid University for funding this research through the Large Research Project under grant number RGP2/139/1446.

Data Availability Statement

The original contributions presented in this study are included in the article/Supplementary Materials. Further inquiries can be directed to the corresponding author.

Acknowledgments

The authors gratefully acknowledge Mohammed Mujahid Alam for providing resources that supported this research.

Conflicts of Interest

The authors declare that they have no known competing financial interests or personal relationships that could have appeared to influence the work reported in this paper.

References

  1. Wu, Y.; Qi, H.; Li, B.; Zhanhua, H.; Li, W.; Liu, S. Novel hydrophobic cotton fibers adsorbent for the removal of nitrobenzene in aqueous solution. Carbohydr. Polym. 2017, 155, 294–302. [Google Scholar] [CrossRef] [Scilit] [PubMed]
  2. Sarasa, J.; Roche, M.P.; Ormad, M.P.; Gimeno, E.; Puig, A.; Ovelleiro, J.L. Treatment of a wastewater resulting from dyes manufacturing with ozone and chemical coagulation. Water Res. 1998, 32, 2721–2727. [Google Scholar] [CrossRef] [Scilit]
  3. Agrawal, A.; Tratnyek, P.G. Reduction of nitro aromatic compounds by zero-valent iron metal. Environ. Sci. Technol. 1995, 30, 153–160. [Google Scholar] [CrossRef] [Scilit]
  4. Wilbur, S.; Wohlers, D.; Paikoff, S.; Keith, L.S.; Faroon, O. ATSDR evaluation of potential for human exposure to benzene. Toxicol. Ind. Health 2008, 24, 399–442. [Google Scholar] [CrossRef] [Scilit]
  5. Li, M.; Peng, X.; Liu, X.; Wang, H.; Zhang, S.; Hu, G. Single-atom niobium doped BCN nanotubes for highly sensitive electrochemical detection of nitrobenzene. RSC Adv. 2021, 11, 28988–28995. [Google Scholar] [CrossRef] [Scilit] [PubMed]
  6. Beauchamp, R.O.; Irons, R.D.; Rickert, D.E.; Couch, D.B.; Hamm, T.E.; Lyon, J.P. A critical review of the literature on nitrobenzene toxicity. CRC Crit. Rev. Toxicol. 1982, 11, 33–84. [Google Scholar] [CrossRef] [Scilit]
  7. Shen, J.; Wang, F.; Bi, W.; Liu, B.; Liu, S.; Okamoto, Y. Synthesis of cellulose carbamates bearing regioselective substituents at 2, 3-and 6-positions for efficient chromatographic enantioseparation. J. Chromatogr. A 2018, 1572, 54–61. [Google Scholar] [CrossRef] [Scilit] [PubMed]
  8. Zhang, D.; Zeng, X.; Yu, Z.; Sheng, G.; Fu, J. Determination of nitrobenzenes and nitrochlorobenzenes in water samples using dispersive liquid-liquid microextraction and gas chromatography-mass spectrometry. Anal. Methods 2011, 3, 2254–2260. [Google Scholar] [CrossRef] [Scilit]
  9. Yang, X.; Ren, Y.; Chai, H.; Hou, X.; Wang, Z.; Wang, J. Highly sensitive detection of nitrobenzene by a series of fluorescent 2D zinc (ii) metal–organic frameworks with a flexible triangular ligand. RSC Adv. 2021, 11, 23975–23984. [Google Scholar] [CrossRef] [Scilit]
  10. Zhang, Y.; Zeng, L.; Bo, X.; Wang, H.; Guo, L. Electrochemical study of nitrobenzene reduction using novel Pt nanoparticles/macroporous carbon hybrid nanocomposites. Anal. Chim. Acta 2012, 752, 45–52. [Google Scholar] [CrossRef] [Scilit]
  11. Ahmad, K.; Oh, T.H. Advanced-functional-material-modified electrodes for the monitoring of nitrobenzene: Progress in nitrobenzene electrochemical sensing. Processes 2024, 12, 1884. [Google Scholar] [CrossRef] [Scilit]
  12. Sangili, A.; Annalakshmi, M.; Chen, S.M.; Chen, T.W.; Kumaravel, S.; Govindasamy, M. A Facile synthesis of ultra-small cerium oxide nanoparticles for enhanced electrochemical detection of nitrobenzene in water samples. Int. J. Electrochem. Sci. 2018, 13, 6135–6143. [Google Scholar] [CrossRef] [Scilit]
  13. Nazir, I.; Haq, Z.U.; Bashir, A.; Qureashi, A.; Ganaie, F.A.; Fatima, K.; Irfan, S.; Dar, G.N.; Pandith, A.H. Electrochemical detection and catalytic reduction of nitrobenzene using a bimetallic NiS2/Fe3S4 magnetic heterostructure: An innovative approach for environmental remediation. New J. Chem. 2024, 48, 4909–4921. [Google Scholar] [CrossRef] [Scilit]
  14. Chellappa, V.; Meenakshisundaram, N.; Annaraj, J.; Sagadevan, S. Hydrothermal synthesis of MnO2 nanorods for efficient electrochemical detection of environmental anthropogenic pollutants and nitrobenzene. Inorg. Chem. Commun. 2024, 160, 112015. [Google Scholar] [CrossRef] [Scilit]
  15. Sharma, B.; Jain, S.; Dilbaghi, N. A novel electrochemical sensing platform for detection of nitrobenzene using gadolinium oxide nanorods modified gold electrode. Indian J. Microbiol. 2025, 65, 505–514. [Google Scholar] [CrossRef] [Scilit]
  16. Thali, B.G.; Agrahari, D.S.; Kamble, R.A. A Review on Recent Developments in Carbon Nanotube-Based Composite Materials for Electrochemical Sensors and Supercapacitor Applications. ChemistrySelect 2025, 10, e01857. [Google Scholar] [CrossRef] [Scilit]
  17. Kamble, B.B.; Sharma, K.K.; Sonawane, K.D.; Tayade, S.N.; Grammatikos, S.; Reddy, Y.V.M.; Reddy, S.L.; Shin, J.H.; Park, J.P. Graphitic carbon nitride-based electrochemical sensors: A comprehensive review of their synthesis, characterization, and applications. Adv. Colloid Interface Sci. 2024, 333, 103284. [Google Scholar] [CrossRef] [Scilit]
  18. Vinoth, S.; Devi, K.S.; Pandikumar, A. A comprehensive review on graphitic carbon nitride based electrochemical and biosensors for environmental and healthcare applications. TrAC Trends Anal. Chem. 2021, 140, 116274. [Google Scholar] [CrossRef] [Scilit]
  19. Kour, R.; Arya, S.; Young, S.J.; Gupta, V.; Bandhoria, P.; Khosla, A. Recent advances in carbon nanomaterials as electrochemical biosensors. J. Electrochem. Soc. 2020, 167, 037555. [Google Scholar] [CrossRef] [Scilit]
  20. Kumunda, C.; Adekunle, A.S.; Mamba, B.B.; Hlongwa, N.W.; Nkambule, T.T. Electrochemical detection of environmental pollutants based on graphene derivatives: A review. Front. Mater. 2021, 7, 616787. [Google Scholar] [CrossRef] [Scilit]
  21. Ozbey, S.; Keles, G.; Kurbanoglu, S. Innovations in graphene-based electrochemical biosensors in healthcare applications. Microchim. Acta 2025, 192, 290. [Google Scholar] [CrossRef] [Scilit]
  22. Vadivel, R.P.; Venkatesh, K.; Alagarsamy, S.; Albeshr, M.F.; Krishnapandi, A.; Sivaganesh, D.; Arulanandam, X.; Ramaraj, S.K. Efficient amperometric detection of ornidazole: An antibiotic drug based on rare-earth metal oxide entrapped with graphene nanosheets nanocomposite. J. Electrochem. Soc. 2024, 171, 037512. [Google Scholar] [CrossRef] [Scilit]
  23. Karuppiah, C.; Muthupandi, K.; Chen, S.M.; Ali, M.A.; Palanisamy, S.; Rajan, A.; Prakash, P.; Al-Hemaid, F.M.; Lou, B.S. Green synthesized silver nanoparticles decorated on reduced graphene oxide for enhanced electrochemical sensing of nitrobenzene in waste water samples. RSC Adv. 2015, 5, 31139–31146. [Google Scholar] [CrossRef] [Scilit]
  24. Rodríguez, E.; García, R. Characterisation of boron-doped coal-derived carbon foams and their oxidation behaviour. Fuel 2012, 93, 288–297. [Google Scholar] [CrossRef] [Scilit]
  25. Zhao, X.; Li, A.; Quan, X.; Chen, S.; Yu, H.; Zhang, S. Efficient electrochemical reduction of nitrobenzene by nitrogen doped porous carbon. Chemosphere 2020, 238, 124636. [Google Scholar] [CrossRef] [Scilit]
  26. Kumar, R.; Khuntey, B.; Rai, V.K.; Rai, A.; Singh, M. Graphene-based nanomaterials for the electrochemical sensing of nitroaromatic compounds. Compr. Anal. Chem. 2024, 106, 201–236. [Google Scholar] [CrossRef] [Scilit]
  27. Marcano, D.C.; Kosynkin, D.V.; Berlin, J.M.; Sinitskii, A.; Sun, Z.; Slesarev, A.; Alemany, L.B.; Lu, W.; Tour, J.M. Improved synthesis of graphene oxide. ACS Nano 2010, 4, 4806–4814. [Google Scholar] [CrossRef] [Scilit]
  28. Umrao, S.; Gupta, T.K.; Kumar, S.; Singh, V.K.; Sultania, M.K.; Jung, J.H.; Oh, I.K.; Srivastava, A. Microwave-assisted synthesis of boron and nitrogen co-doped reduced graphene oxide for the protection of electromagnetic radiation in Ku-band. ACS Appl. Mater. Interfaces 2015, 7, 19831–19842. [Google Scholar] [CrossRef] [Scilit]
  29. Stout, G.H.; Jensen, L.H. X-Ray Structure Determination: A practical Guide; John Wiley & Sons: Hoboken, NJ, USA, 1989. [Google Scholar]
  30. Chen, L.; Song, L.; Zhang, Y.; Wang, P.; Xiao, Z.; Guo, Y.; Cao, F. Nitrogen and sulfur codoped reduced graphene oxide as a general platform for rapid and sensitive fluorescent detection of biological species. ACS Appl. Mater. Interfaces 2016, 8, 11255–11261. [Google Scholar] [CrossRef] [Scilit]
  31. Vignesh, G.; Devendran, P.; Nallamuthu, N.; Sudhahar, S.; Kumar, P.S.; Kumar, M.K. Effects of nitrogen, sulphur, and temperature treatments on the spectral, structural, and electrochemical characteristics of graphene oxide for energy storage applications. Carbon Trends 2023, 11, 100262. [Google Scholar] [CrossRef] [Scilit]
  32. Cançado, L.G.; Takai, K.; Enoki, T.; Endo, M.; Kim, Y.A.; Mizusaki, H.; Pimenta, M.A. General equation for the determination of the crystallite size La of nanographite by Raman spectroscopy. Appl. Phys. Lett. 2006, 88, 163106. [Google Scholar] [CrossRef] [Scilit]
  33. Turunc, E.; Ucar, A.; Binzet, R.; Martinez, F. N, S-doped reduced graphene oxide via plant extract reduction for highly sensitive electrochemical detection of metronidazole. Microchem. J. 2025, 220, 116697. [Google Scholar] [CrossRef] [Scilit]
  34. Liu, X.Q.; Yu, L.; Ma, Z.C.; Chen, Q.D. Silicon three-dimensional structures fabricated by femtosecond laser modification with dry etching. Appl. Opt. 2017, 56, 2157–2161. [Google Scholar] [CrossRef] [Scilit] [PubMed]
  35. Atar, N.; Eren, T.; Yola, M.L.; Karimi-Maleh, H.; Demirdögen, B. Magnetic iron oxide and iron oxide@ gold nanoparticle anchored nitrogen and sulfur-functionalized reduced graphene oxide electrocatalyst for methanol oxidation. RSC Adv. 2015, 5, 26402–26409. [Google Scholar] [CrossRef] [Scilit]
  36. Shao, J.; Wang, Y.; Che, M.; Liu, Y.; Jiang, Y.; Xiao, Q.; Demir, M.; Wang, L.; Hu, X. Sustainable CO2 capture: N,S-codoped porous carbons derived from petroleum coke with high selectivity and stability. Molecules 2025, 30, 426. [Google Scholar] [CrossRef] [Scilit] [PubMed]
  37. Thirumalraj, B.; Palanisamy, S.; Chen, S.M.; Thangavelu, K.; Periakaruppan, P.; Liu, X.H. A simple electrochemical platform for detection of nitrobenzene in water samples using an alumina polished glassy carbon electrode. J. Colloid Interface Sci. 2016, 475, 154–160. [Google Scholar] [CrossRef] [Scilit]
  38. Vadivel, R.P.; Venkatesh, K.; Alagumalai, K.; Karuppasamy, P.; Arulanandam, X.; Ansari, M.A.; Amanulla, B.; Kim, S.C.; Ramaraj, S.K. Fabrication of iron manganese oxide-reduced graphene oxide nanocomposite: A highly effective synergistic electrocatalyst for sensitive metronidazole detection. Ceram. Int. 2024, 50, 44659–44670. [Google Scholar] [CrossRef] [Scilit]
  39. Selvam, S.p.; Alagarsamy, S.; Chen, T.W.; Dong, C.D.; Sengodan, S.; Yu, J.; Chen, S.M. Bismuth Intercalated Zinc Oxide on Heteroatom Doped Reduced Carbon Sheets for a Sensitive Electroanalytical Detection of Hazardous Organic Pollutant: N-methylaminophenol. Process Saf. Environ. Prot. 2025, 202, 107584. [Google Scholar] [CrossRef] [Scilit]
  40. Karthik, R.; Chavan, P.R.; Sukanya, R.; Dhakal, G.; Shim, J.J.; Breslin, C.B. Flower-like strontium molybdate anchored on 3D N-rich reduced graphene oxide aerogel composite: An efficient catalyst for the detection of lethal pollutant nitrobenzene in water samples. Compos. Part B Eng. 2023, 256, 110649. [Google Scholar] [CrossRef] [Scilit]
  41. Narayan, J.; Bezborah, K. Recent advances in the functionalization, substitutional doping and applications of graphene/graphene composite nanomaterials. RSC Adv. 2024, 14, 13413–13444. [Google Scholar] [CrossRef] [Scilit]
  42. Selvam, S.P.; Alagarsamy, S.; Chen, T.W.; Chen, S.M.; Ramachandran, R.; Al-Mohaimeed, A.M.; Ali, M.A.; Yu, J.; Elshikh, M.S. Gadolinium doped ZnO nanorods on chalcogenide-modified graphene for enhanced voltammetric detection of methyl carbamate. Compos. Part B Eng. 2025, 291, 112061. [Google Scholar] [CrossRef] [Scilit]
  43. Yuan, C.; Li, N.; Zhang, X.; Wang, Y.; Zhou, S.; Zhang, L.; Hu, G. Flower-like copper sulfide-decorated boron-nitrogen co-doped carbon-modified glassy carbon electrode for selective and sensitive electrochemical detection of nitrobenzene in natural water. Colloids Surf. A Physicochem. Eng. Asp. 2023, 675, 132011. [Google Scholar] [CrossRef] [Scilit]
  44. Liang, F.; Liu, B.; Deng, Y.; Yang, S.; Sun, C. Preparation and characterization of attapulgite-silver nanocomposites, and their application to the electrochemical determination of nitrobenzene. Microchim. Acta 2011, 174, 407–412. [Google Scholar] [CrossRef] [Scilit]
  45. Rastogi, P.K.; Ganesan, V.; Krishnamoorthi, S. Palladium nanoparticles incorporated polymer-silica nanocomposite based electrochemical sensing platform for nitrobenzene detection. Electrochim. Acta 2014, 147, 442–450. [Google Scholar] [CrossRef] [Scilit]
  46. Kariuki, V.M.; Fasih-Ahmad, S.A.; Osonga, F.J.; Sadik, O.A. An electrochemical sensor for nitrobenzene using π-conjugated polymer-embedded nanosilver. Analyst 2016, 141, 2259–2269. [Google Scholar] [CrossRef] [Scilit]
  47. Velmurugan, M.; Karikalan, N.; Chen, S.M.; Dai, Z.C. Studies on the influence of β-cyclodextrin on graphene oxide and its synergistic activity to the electrochemical detection of nitrobenzene. J. Colloid Interface Sci. 2017, 490, 365–371. [Google Scholar] [CrossRef] [Scilit]
  48. Gupta, R.; Rastogi, P.K.; Ganesan, V.; Yadav, D.K.; Sonkar, P.K. Gold nanoparticles decorated mesoporous silica microspheres: A proficient electrochemical sensing scaffold for hydrazine and nitrobenzene. Sens. Actuators B Chem. 2017, 239, 970–978. [Google Scholar] [CrossRef] [Scilit]
  49. Balasubramanian, P.; Balamurugan, T.S.T.; Chen, S.M.; Chen, T.W.; Tseng, T.W.; Lou, B.S. A simple architecture of cellulose microfiber/reduced graphene oxide nanocomposite for the electrochemical determination of nitrobenzene in sewage water. Cellulose 2018, 25, 2381–2391. [Google Scholar] [CrossRef] [Scilit]
  50. Li, H.; Huang, C.; Li, Y.; Yang, W.; Liu, F. Electrocatalytic reduction of trace nitrobenzene using a graphene-oxide@ polymerized-manganese-porphyrin composite. RSC Adv. 2019, 9, 22523–22530. [Google Scholar] [CrossRef] [Scilit]
  51. Yadav, D.K.; Ganesan, V.; Sonkar, P.K.; Gupta, R.; Rastogi, P.K. Electrochemical investigation of gold nanoparticles incorporated zinc based metal-organic framework for selective recognition of nitrite and nitrobenzene. Electrochim. Acta 2016, 200, 276–282. [Google Scholar] [CrossRef] [Scilit]
  52. Rameshkumar, P.; Viswanathan, P.; Ramaraj, R. Silicate sol–gel stabilized silver nanoparticles for sensor applications toward mercuric ions, hydrogen peroxide and nitrobenzene. Sens. Actuators B Chem. 2014, 202, 1070–1077. [Google Scholar] [CrossRef] [Scilit]
  53. Priya Selvam, S.; Chen, T.W.; Vadivel, R.P.; Sengodan, S.; Chen, S.M.; Venkatesh, K.; Arulanandam, X. An ultrasensitive electrochemical quantification of carbendazim via strontium molybdate nanospheres anchored heteroatom-doped carbon nanofiber electrocatalyst. J. Alloys Compd. 2025, 1046, 184839. [Google Scholar] [CrossRef] [Scilit]
Scheme 1. Illustration of the microwave synthesis procedure of N,S-RGO and the sensor fabrication.
Carbon 12 00052 sch001
Figure 1. (A) XRD; (B) FT-IR; (C) Raman analyses of GO, RGO, and N,S-RGO.
Carbon 12 00052 g001
Figure 2. FE-SEM images of (A,B) GO, (C) RGO, and (DF) N,S-RGO. (G,H) HRTEM images and (I) SAED for N,S-RGO.
Carbon 12 00052 g002
Figure 3. XPS analysis of N, S-RGO: (A) survey spectrum, (B) deconvoluted C 1s, (C) O 1s, (D) S 2p, and (E) N 1s spectrum.
Carbon 12 00052 g003
Figure 4. (A) EIS Nyquist plot for bare GCE and modified GCEs in 5 mM [Fe(CN)6]3−/4− and 0.1 M KCl solution (B) Corresponding bar graph (C) CV curves of N,S-RGO/GCE with different catalyst loadings (3–6 µL), and (D) bar diagram representing the effect of catalyst loading on cathodic peak current. (E) CV responses of various electrodes in NB reduction at 0.1 M PBS (pH 7.0) with 100 µM NB at 50 mV s−1 (F) bar diagram representing current responses.
Carbon 12 00052 g004
Scheme 2. Plausible electrochemical mechanism of NB.
Carbon 12 00052 sch002
Figure 5. (A) CV responses of 100 μM NB at N,S-RGO/GCE in 0.1 M PBS at various pH (3.0 to 9.0); (B) linear plot of cathodic peak potential vs. pH; and (C) plot of peak current vs. pH.
Carbon 12 00052 g005
Figure 6. (A) CVcurves of N,S-RGO/GCE recorded in 0.1 M PBS (pH 7.0) containing 100 μM NB at various scan rates ranging from 10 to 100 mV s−1 (B) linear plot of cathodic peak current vs. square root of scan rate (υ1/2), (C) CV curves of N,S-RGO/GCE in 0.1 M PBS (pH 7.0) with increasing concentrations of NB (10–100 μM) at a scan rate of 50 mV s−1 and (D) linear plot of cathodic peak current vs. concentration.
Carbon 12 00052 g006
Figure 7. (A) LSV curve of N,S-RGO/GCE at different concentration levels, (B) calibration plot between current response vs. NB concentrations, (C) interference bar diagram for analytes vs. relative current, (D) CV responses of N,S-RGO/GCE for the five repeating experiments. (E) CV responses of five independent N,S-RGO/GCEs and (F) Cycle stability of N,S-RGO/GCE + NB.
Carbon 12 00052 g007
Figure 8. LSV result of spiked NB in (A) river water, (B) tap water, and (C) lake water.
Carbon 12 00052 g008
Table 1. Comparison of the analytical performance of N,S-RGO modified GCE with other reported modified electrodes for the detection of NB.
Modified ElectrodesAnalysis MethodsLinear Range (µM) LOD (µM)Ref.
1 Ag/ATP10 LSV3–301.1[44]
2 Pd-GG-g-PAM-silica11 DPV1–19000.06[45]
3 PAA–AgNPsDPV10–6001.68[46]
4 β-CD/GOLSV0.5–1000.184[47]
5 Au-MSMAmperometry0.1 to 25000.015[48]
6 CMF-RGODPV0.2–927.70.088[49]
7 GMPP@AMPDPV34–246 0.243[50]
8 Au-MOF-5CV20–50015.3[51]
9 TPDT-Ag NPsLSV-0.5[52]
N,S-RGOLSV0.05 to 1470.007This work
1 Attapulgite–silver; 2 palladium nanoparticle-decorated polymer–silica nanocomposite; 3 Poly(amic) acid-embedded nanosilver; 4 β-Cyclo dextrin on graphene oxide; 5 gold nanoparticle-decorated mesoporous silica microspheres; 6 reduced graphene oxide (RGO)-supported cellulose microfiber (CMF); 7 graphene oxide@polymerized-manganese-porphyrin composite; 8 gold nanoparticle metal–organic framework; 9 [3-(trimethoxysilyl)propyl] diethylenetriamine-stabilized silver nanoparticles; 10 linear sweep voltammetry; 11 differential pulse voltammetry.
Table 2. Recovery of NB in a real water sample using N,S-RGO/GCE sensor.
SamplesAdded (µM)Found (µM)Recovery (%)
Tap water54.6993.80
109.8498.40
1514.6697.73
Lake water54.6492.80
109.7297.20
1514.4796.47
River water54.692.00
109.5195.10
1514.596.67
Disclaimer/Publisher’s Note: The statements, opinions and data contained in all publications are solely those of the individual author(s) and contributor(s) and not of MDPI and/or the editor(s). MDPI and/or the editor(s) disclaim responsibility for any injury to people or property resulting from any ideas, methods, instructions or products referred to in the content.