Article

Stability of Carbon Quantum Dots for Potential Photothermal and Diagnostic Applications

by
María Fernanda Amezaga Gonzalez
1,
Abdiel Ramirez-Reyes
1,
Monica Elvira Mendoza-Duarte
2,
Alejandro Vega-Rios
2,
Daniel Martinez-Ozuna
1,
Claudia A. Rodriguez-Gonzalez
1,
Santos-Adriana Martel-Estrada
3 and
Imelda Olivas-Armendariz
1,*
1
Instituto de Ingeniería y Tecnología, Universidad Autónoma de Ciudad Juárez, Av. Del Charro 450 Norte, Ciudad Juárez 32310, Mexico
2
Centro de Investigación en Materiales Avanzados, S.C., Av. Miguel de Cervantes #120, Chihuahua 31136, Mexico
3
Instituto de Arquitectura, Diseño y Arte, Universidad Autónoma de Ciudad Juárez, Av. Del Charro 450 Norte, Ciudad Juárez 32310, Mexico
*
Author to whom correspondence should be addressed.
Submission received: 6 June 2025 / Revised: 11 July 2025 / Accepted: 23 July 2025 / Published: 29 July 2025
(This article belongs to the Special Issue Carbon Nanohybrids for Biomedical Applications (2nd Edition))

Abstract

Theranostic agents enable the simultaneous diagnosis and treatment of diseases, and they are particularly useful in fluorescent imaging and cancer therapies. In this study, carbon quantum dots were synthesized via a microwave-assisted method using citric acid and bovine serum albumin (BSA) as precursors. The resulting CQDs exhibited spherical morphology, an average size of 4 nm, and an amorphous graphitic structure. FT-IR characterization revealed the presence of amide bonds and oxygenated functional groups. At the same time, optical analysis showed excitation at 320 nm and emission between 360 and 400 nm, with fluorescent stability maintained for one month. Furthermore, the CQDs demonstrated good thermal stability and photothermal efficiency, reaching temperatures above 41 °C within 15 min under NIR irradiation, with a mass loss of less than 1%. Their stability was evaluated in media with different pH levels, simulating physiological and tumor environments. While their behavior was affected under acidic conditions, their excellent photothermal conversion capacity and overall stability in triple-distilled water positioned them as promising candidates for theranostic applications in cancer, effectively combining diagnostic imaging and thermal therapy.

1. Introduction

In 2004, carbon quantum dots (CQDs) were unexpectedly discovered during studies on single-walled carbon nanotubes (SWCNTs) [1]. Since then, they have proven to be exceptional biocompatible nanomaterials with unique fluorescent properties, making them ideal candidates for various biomedical applications [2]. Their tiny size, at less than 10 nanometers, allows them to interact effectively with nanoscale biological structures. Furthermore, their low toxicity and high biocompatibility make them safe for use in living systems. CQDs possess remarkable physicochemical properties, such as luminescence, thermal and chemical stability, and drug-carrying capacity [3]. These characteristics make them highly versatile. Another significant advantage is their sustainability and low production cost, making them economically and environmentally attractive. Their functionality can be enhanced through functionalization processes, while multi-functionalization with peptides, carbohydrates, or proteins enables the development of nanomaterials with expanded capabilities. Since their discovery, CQDs have been employed in nanomedicine, particularly in chemical sensing, biosensing, biological imaging, and treatments such as phototherapy, photocatalysis, and electrocatalysis [4,5,6,7,8,9].
For example, the study by Hsu et al. demonstrated using CQDs for diagnostics, leveraging their photoluminescent properties to localize in cell membranes and cytoplasm, producing cellular images at specific wavelengths. They also showed effectiveness in inhibiting the growth of MCF-7 and MDA-MB-231 cancer cells, with minimal toxicity toward normal MCF-10A cells [10]. Jia et al. functionalized CQDs with PEGylated oxidized alginate (mPEG-OAL) and conjugated them to doxorubicin (DOX) via a Schiff base, developing a pioneering theranostic agent for image-guided, controlled drug release [11]. Similarly, Singh et al. engineered CQDs with polychromatic emission, high photothermal efficiency, NIR photostability, and high DOX loading (90%), enabling pH/NIR-triggered release [12].
Ge et al. further demonstrated that CQDs (6–10 nm) could be used in photothermal and photodynamic therapies, emitting red light upon excitation and generating fluorescence images in vitro and in vivo. These materials also produce singlet oxygen under laser irradiation, which is beneficial for cancer treatment [13]. In a subsequent study, Shi et al. demonstrated multicolor fluorescence imaging, showing that CQDs allow wavelength-specific visualization. In HEPG2 cells treated with CQDs, blue, green, and red fluorescence was observed at 435, 525, and 597 nm excitation wavelengths, respectively. Cell viability remained above 95% after 24 h incubation with up to 400 μg/mL of CQDs [14]. Rani et al. also highlighted the work of Huang et al., in which CQDs incubated with HeLa cells emitted blue and green fluorescence when excited at 405 and 488 nm, respectively [15].
Theranostics implies integrating diagnosis and therapy into a single agent to develop targeted treatments and enable earlier, more accurate diagnoses [16]. The current research focuses on enhancing the efficiency of these agents through chemical modifications and bioconjugation, allowing them to act selectively at tumor sites while minimizing side effects. These agents can provide luminescent imaging and deliver therapies such as hyperthermia, offering a promising multifunctional approach to treating diseases such as cancer [17].
Despite the vast potential of CQDs as theranostic agents, their stability under varying environmental conditions remains a critical and underexplored issue [18]. This research addresses this gap by systematically analyzing different types of stability, including photostability, thermal stability, temporal stability, and stability under various pH conditions. Understanding and improving CQDs’ stability is essential for their practical clinical application. This study underscores the importance of this aspect and provides valuable insights for the development and use of CQDs in nanomedicine.

2. Materials and Methods

2.1. Synthesis of Carbon Quantum Dots

The synthesis of CQDs was based on the method described by Milosavljevic et al. [19], with modifications introduced by Jaramillo in 2022 [20]. First, 1 g of citric acid monohydrated (Sigma-Aldrich, St. Louis, MO, USA, ≥99.5% purity, endotoxin-free) was dissolved in 15 mL of distilled water. Then, 1 g of the buffering agent bovine serum albumin (BSA non-acetylate, Sigma-Aldrich) was added, and the mixture was stirred continuously for 30 min. After mixing, 2 mL of the solution was transferred to a beaker and heated in a microwave oven (model MSF0B1000072352; input: 120 V AC, 60 Hz, 1100 W; output: 700 W; frequency: 2450 MHz), operated in intermittent cycles at medium power (approximately 400 W) for 60 min. An infrared thermometer was used to monitor the external temperature of the system, maintaining it between 120 °C and 140 °C. After heating, the resulting CQDs were stored in the dark at 4 °C. The concentration of BSA functionalized on the surface of the CQDs was quantified using a BCA Protein Assay Kit (Thermo Scientific™, Waltham, MA, USA), following the manufacturer’s microplate protocol. Briefly, serial dilutions of BSA standard (ranging from 25 to 2000 µg/mL) were prepared in phosphate-buffered saline to generate a calibration curve. An aliquot of 25 µL of each CQDs sample was added to a 96-well plate in triplicate. Then, 200 µL of working reagent (prepared by mixing Reagent A and Reagent B in a 50:1 ratio) was added to each well. The plate was incubated at 37 °C for 30 min. After incubation, absorbance at 562 nm was measured using a microplate reader (Microplate spectrophotometer Benchmark Plus, BIO-RAD). The BSA content on the CQDs surface was calculated by interpolating the absorbance values of the samples against the BSA standard curve. The results were reported as µg BSA/mL CQDs solution.

2.2. Turbidimetry Stability Index

Colloid stability was quantified using the Turbidimetric Stability Index (TSI) over 15 days. For this evaluation, a CQDs concentration of 50 µg/mL was used, consistent with the concentration applied in the photothermal experiments. The relationship between the amount of light emitted at 340 nm via the microplate spectrophotometer (Benchmark Plus) and the amount of light reaching the detector after passing through 200 µL of colloid at different time points was determined. Absorbance percentages were plotted in graphs, and the TSI values of the samples were calculated using Equation (1) [21,22].
T S I = i = 1 n ( x i x B S ) 2 n 1
where the following applies: xi; is the absorbance measured at each time point (percentages recommended), xbs is the average of all xi values, and n is the number of scans performed using the equipment [21,22].

2.3. CQD Characterization

The particle size was measured using a Microtrac Nanosizer with a CQDs concentration of 50 µg/mL. A 10 µL aliquot of the sample was diluted in 3 mL of distilled water, using 2.44 as the refractive index.
A zeta potential measurement was performed using a NanoTrac Wave II analyzer on CQDs samples at different pH levels, including CQDs, CQDs 7.2, CQDs 7.4, and CQDs 4.1. For each measurement, 1 mL of sample was used. After the particle size measurement was acquired using dynamic light scattering (DLS), the zeta potential was recorded during an additional 60 s measurement under the same conditions.
An X-ray diffraction (XRD) analysis was conducted with a Panalytical X’Pert Powder diffractometer over a 2Θ range of 10–80° to determine the carbon structure present in the sample.
Functional groups (amide, carboxyl, and hydroxyl) were identified using a Nicolet 6700 FTIR spectrophotometer, with 120 scans per run to detect vibrational bands associated with CQDs and BSA.
UV–Vis absorbance spectra were acquired using a StellarNet Silver Nova spectrometer, equipped with an SL5 deuterium–halogen light source, a UV–Vis optical fiber (200–400 nm), and a Vis-NIR optical fiber (480–900 nm). Samples were resuspended in distilled water and analyzed at room temperature.
Fluorescence was measured using a Fluorolog-3 spectrofluorometer (Horiba Scientific Jobin Yvon Inc., Piscataway, NJ, USA). Samples were diluted to 10% in distilled water and analyzed at room temperature using an excitation wavelength of 345 nm, a 5 nm excitation slit, and an emission range of 375–600 nm. Luminescence was further visualized using the OmniCure® LX40 UV LED spot curing system.
Thermogravimetric analysis (TGA) was performed using a TA Instrument SDT Q600 system, with a temperature ramp of 10 °C/min from room temperature to 700 °C, under a nitrogen (N2) atmosphere to prevent oxidative degradation during heating.
The morphology and size of the CQDs were examined using a TEM JEOL 2200 CS/UHR (200.00 kV) transmission electron microscope (TEM).
A cell viability analysis was conducted using the MTT assay. Primary fibroblasts were isolated from Balb/c mice via enzymatic digestion with collagenase and used in this study, which was approved by the Research Ethics Committee (approval number CEI-2025-1-31). Cells were cultured in Dulbecco’s Modified Eagle’s Medium supplemented with 10% heat-inactivated fetal bovine serum and 2% penicillin–streptomycin and then treated with various concentrations of CQDs. The cells were incubated at 37 °C for 24 and 48 h in a humidified atmosphere containing 5% CO2. The control groups consisted of cells cultured under identical conditions but without exposure to CQDs. At each time point, the culture medium was carefully removed and replaced with 250 μL of MTT solution (5 mg/mL). The cells were then incubated for 2 h under the same conditions. After incubation, the resulting formazan crystals were dissolved in 250 μL of dimethyl sulfoxide per well. Absorbance was measured at 570 nm using a PKL model 142 microplate reader. Cell viability was expressed as the percentage of surviving cells using Equation (2) and reported as the mean of triplicate measurements.
C e l l   v i a b i l i t y   ( % ) = O D t O D c × 100
where ODt and ODc represent the optical densities of the treated and control samples, respectively.
The relative quantum yield (QY) of the CQDs was determined with Rhodamine B as the reference standard. The absorbance of the solution was measured at an excitation wavelength of 460 nm and kept below 0.1 to minimize reabsorption effects. The integrated emission intensity was calculated as the area under the emission curves in the range of 480–700 nm. A linear fitting was performed by plotting the integrated emission intensity (ordinate) against absorbance (abscissa), and the slope of the resulting line was used to calculate the relative QY. The QY value was calculated according to Equation (3).
QY = Q R d ( A C Q D s / A R d ) ( PL R d / PL C Q D s ) ( η C Q D s / η R d ) 2 × 100
where QRd is quantum yield of Rhodamine 6G (QY = 0.92, in water, adjusting at pH of 8 with NaOH 0.1 M); A is the absorbance of Rhodamine 6G (ARd) or absorbance of CQDs (ACQDs), PLCQDs is the integrated emission fluorescence intensity and η is the index of refraction of the solvent (ηCQDs = 1.36, ηRd = 1.33). The subscript Rd refers to the rhodamine 6G standard aqueous solution.

2.4. Photothermal Effect

The photothermal effect was measured using a CQDs concentration of 50 µg/mL at a controlled room temperature of 37 °C. An 808 nm infrared laser diode module (Q-BAIHE) with a constant power output of 2.4 W was used as an irradiation source. Each sample consisted of 1 mL of carbon quantum dots, irradiated for 15 min. During irradiation, the sample temperature was recorded every minute using a thermocouple thermometer (Fluke 51II), and thermographic images were captured at the beginning and end of the experiment using a thermal imaging camera (Keysight U5857A). As a negative control, 1 mL of triple-distilled water (J.T. Baker) was subjected to the same irradiation and temperature monitoring protocol. The entire procedure was performed in triplicate for each sample, and the results were averaged for analysis. The thermal change rate (°C/min) was calculated and plotted for each sample using the following Equation:
R e a c t i o n   r a t e = d T / d t
where the following applies: dT is the temperature difference (final temperature minus initial temperature), and dt is the time difference (final time minus initial time).

3. Results and Discussion

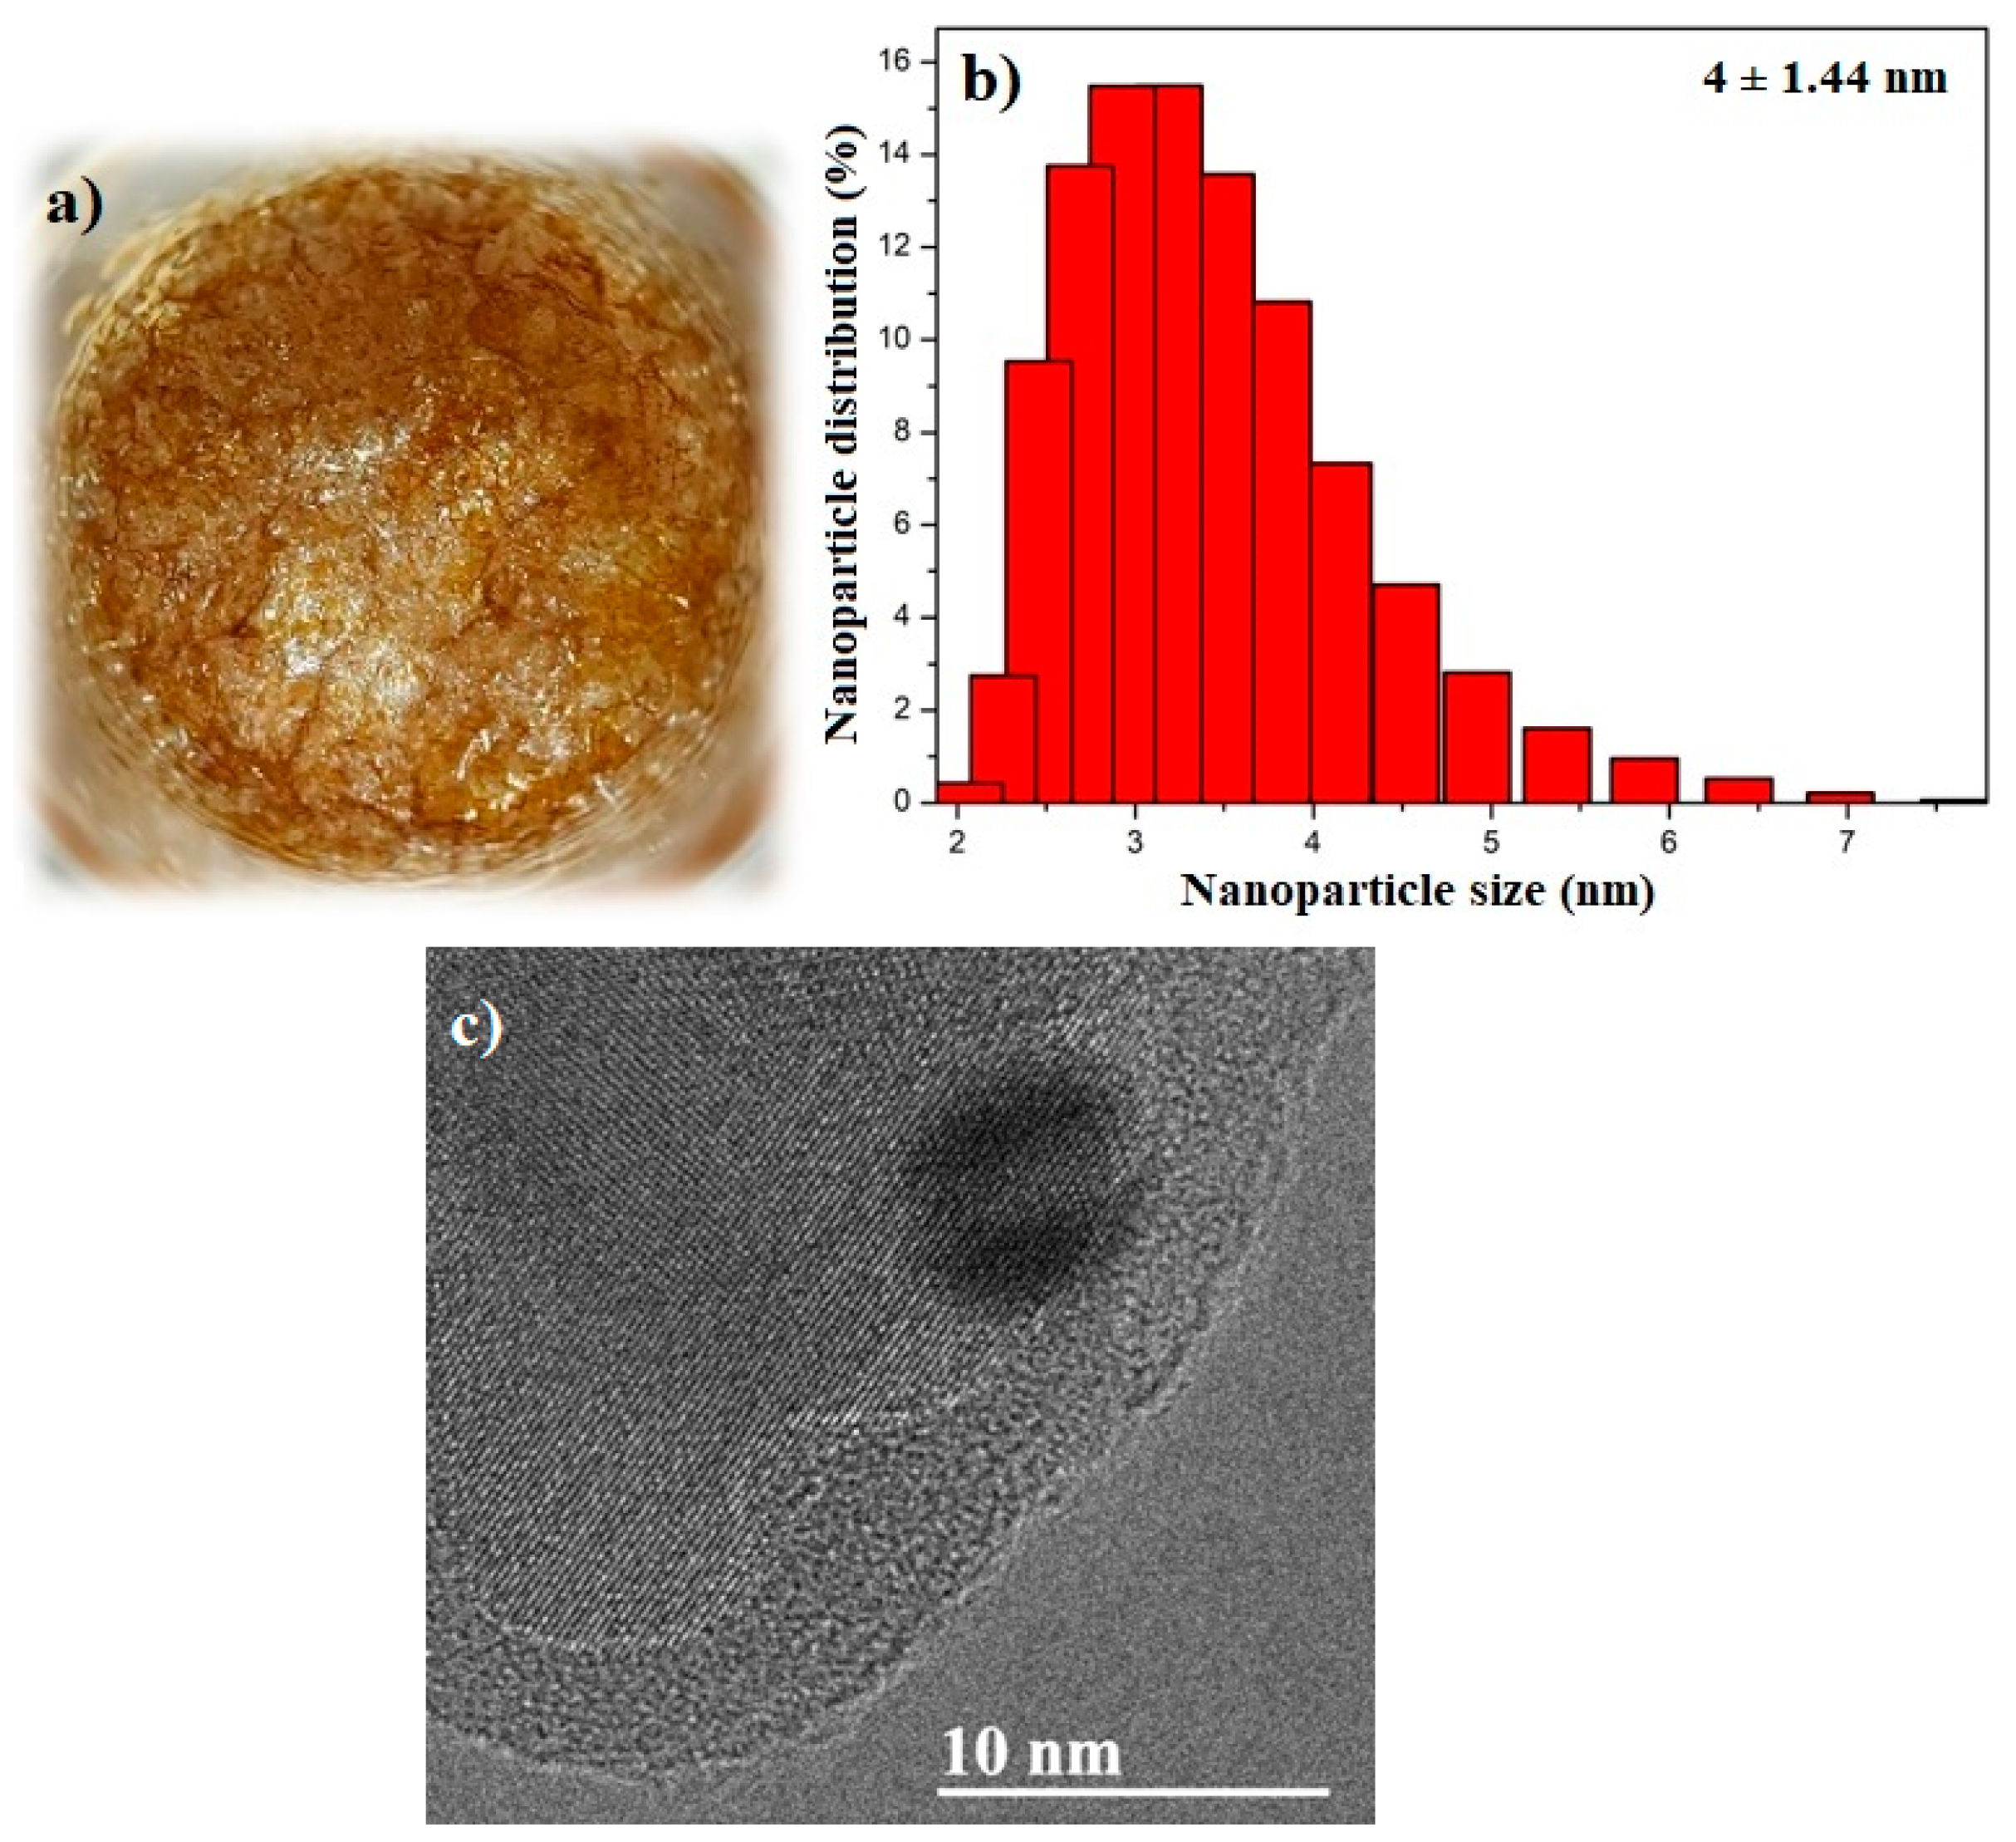
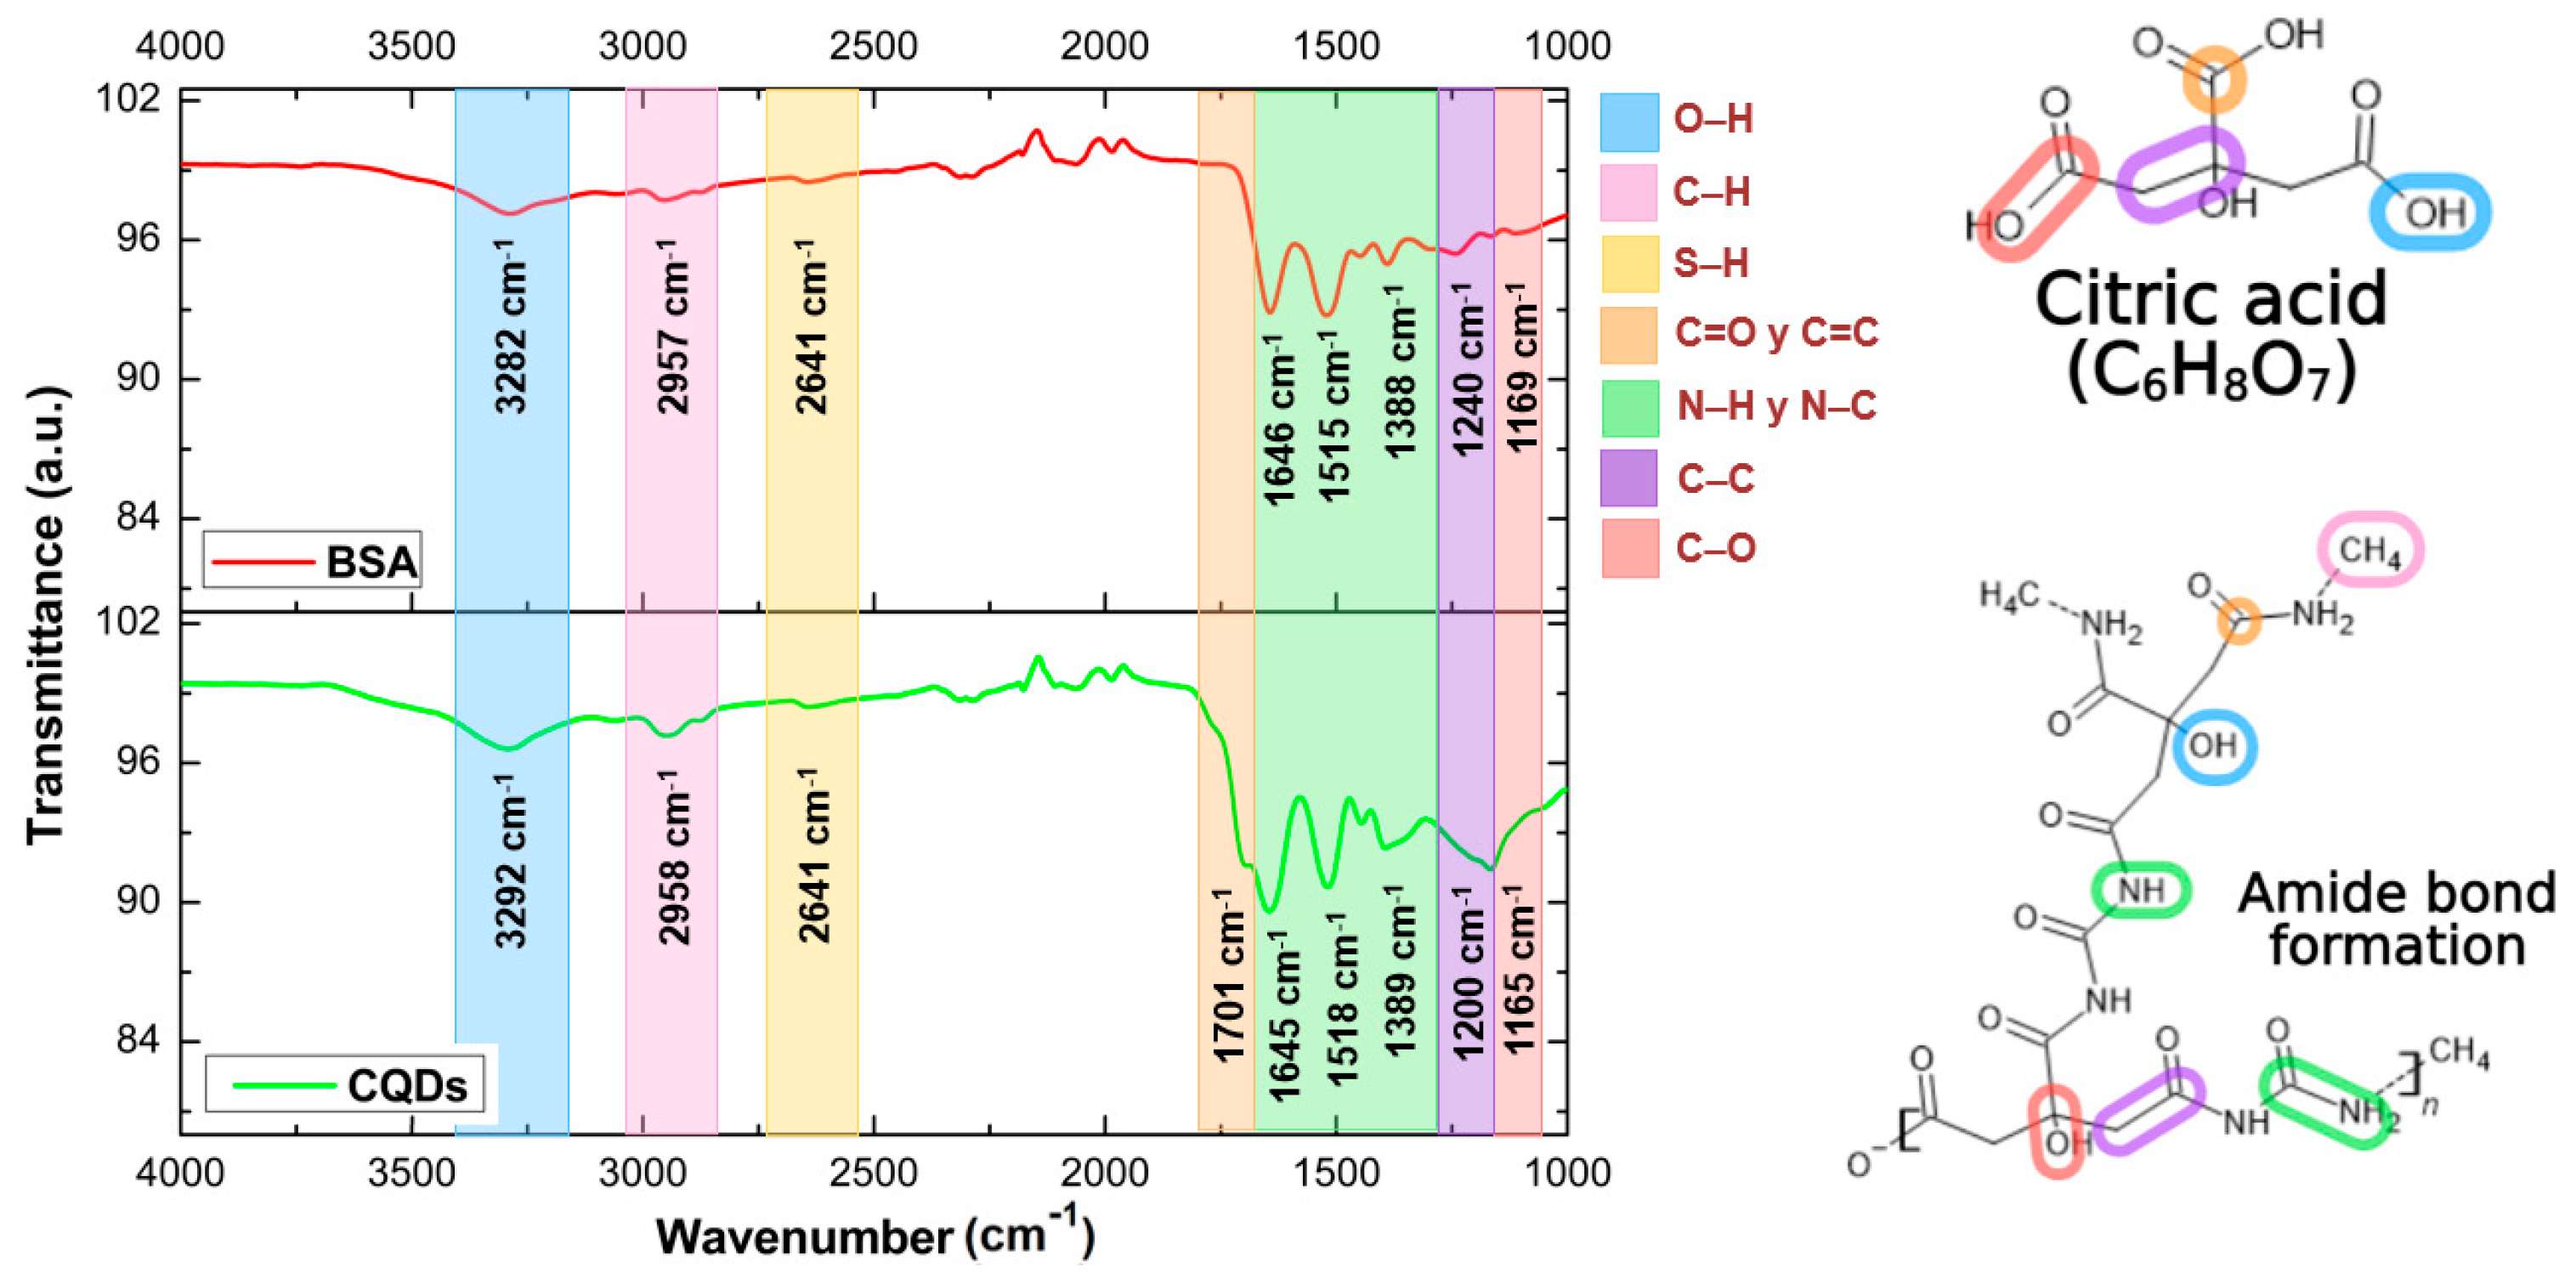
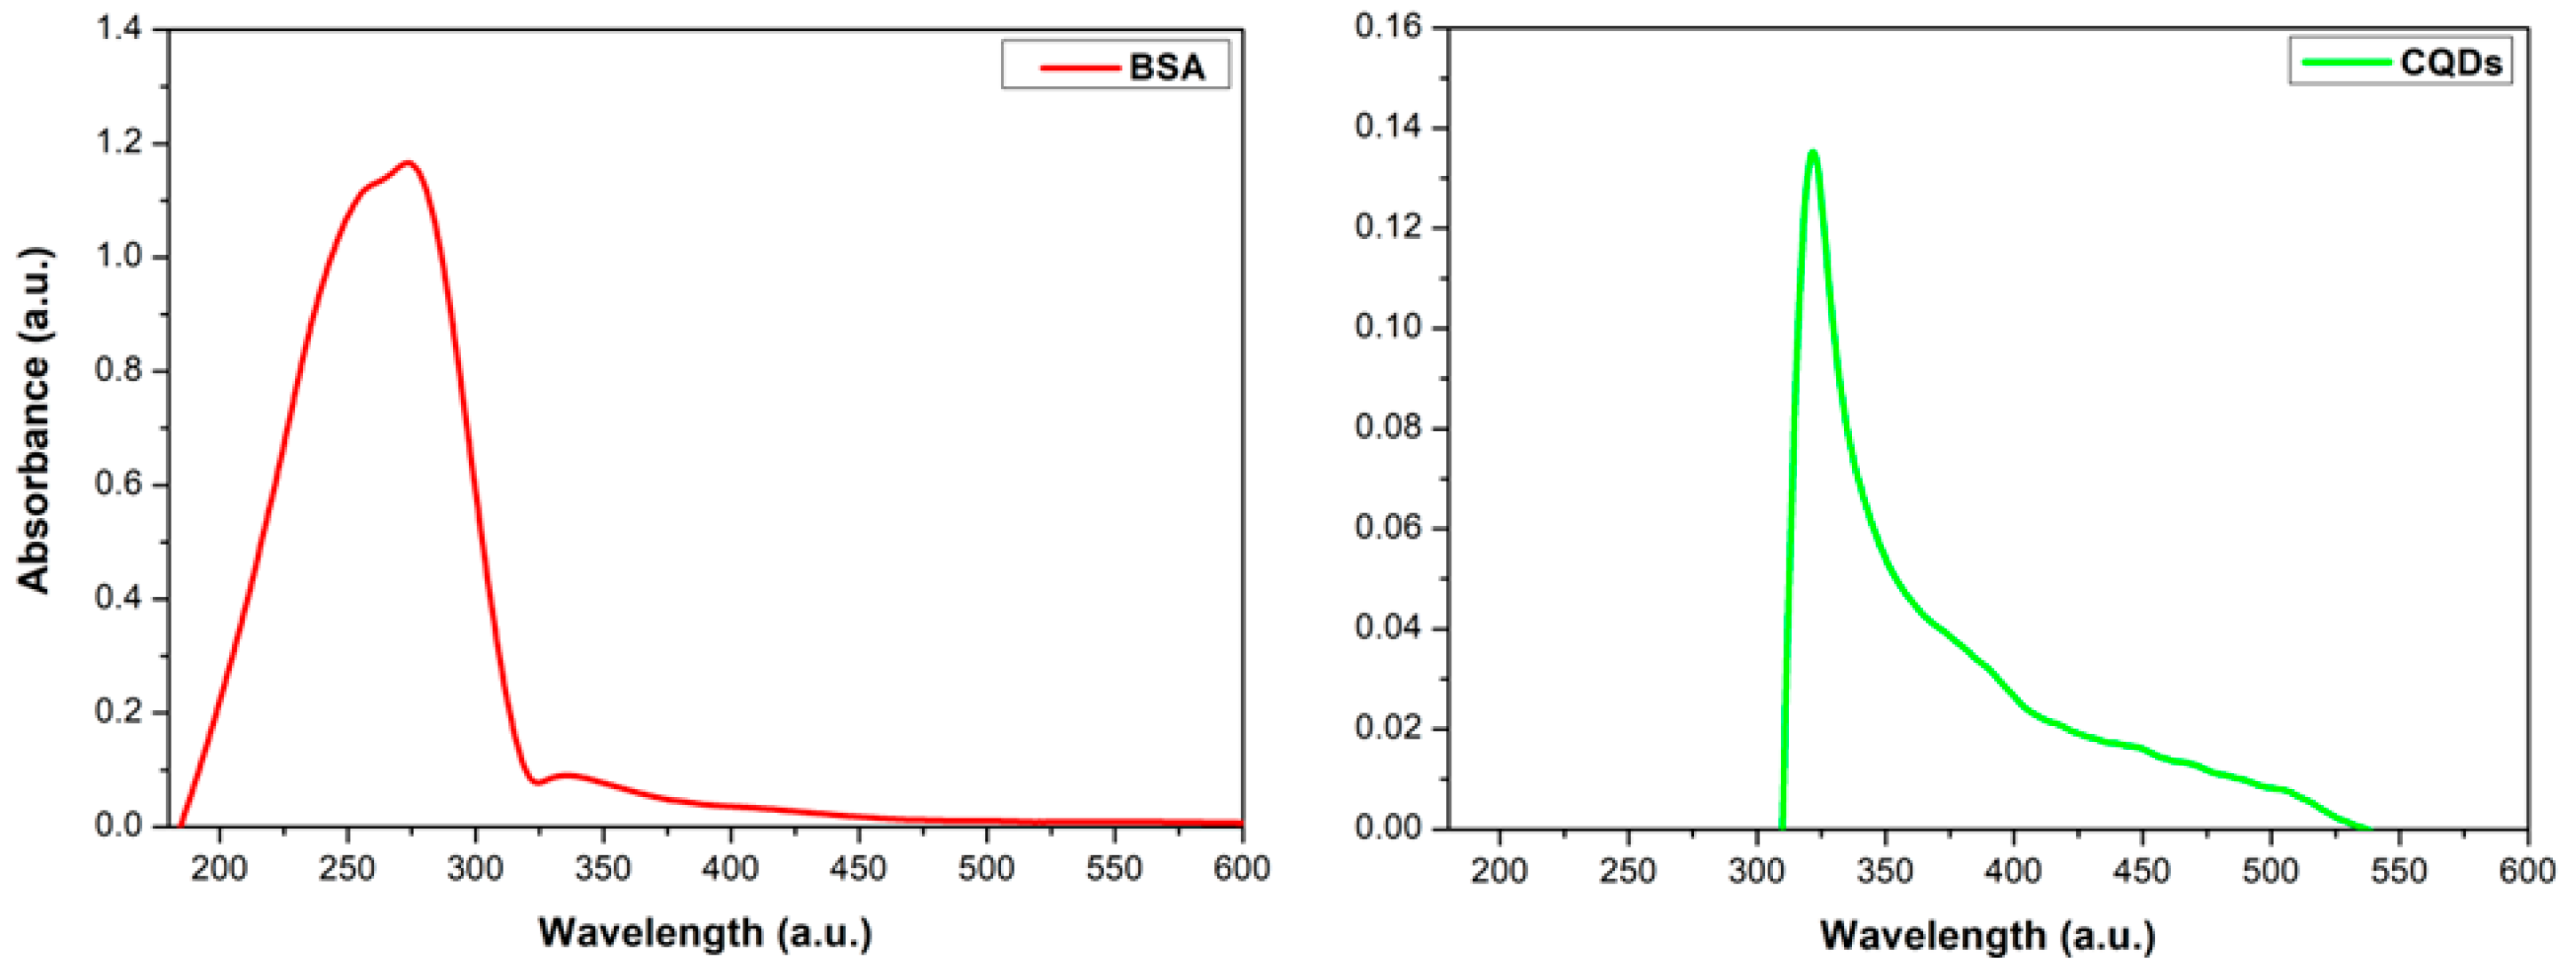
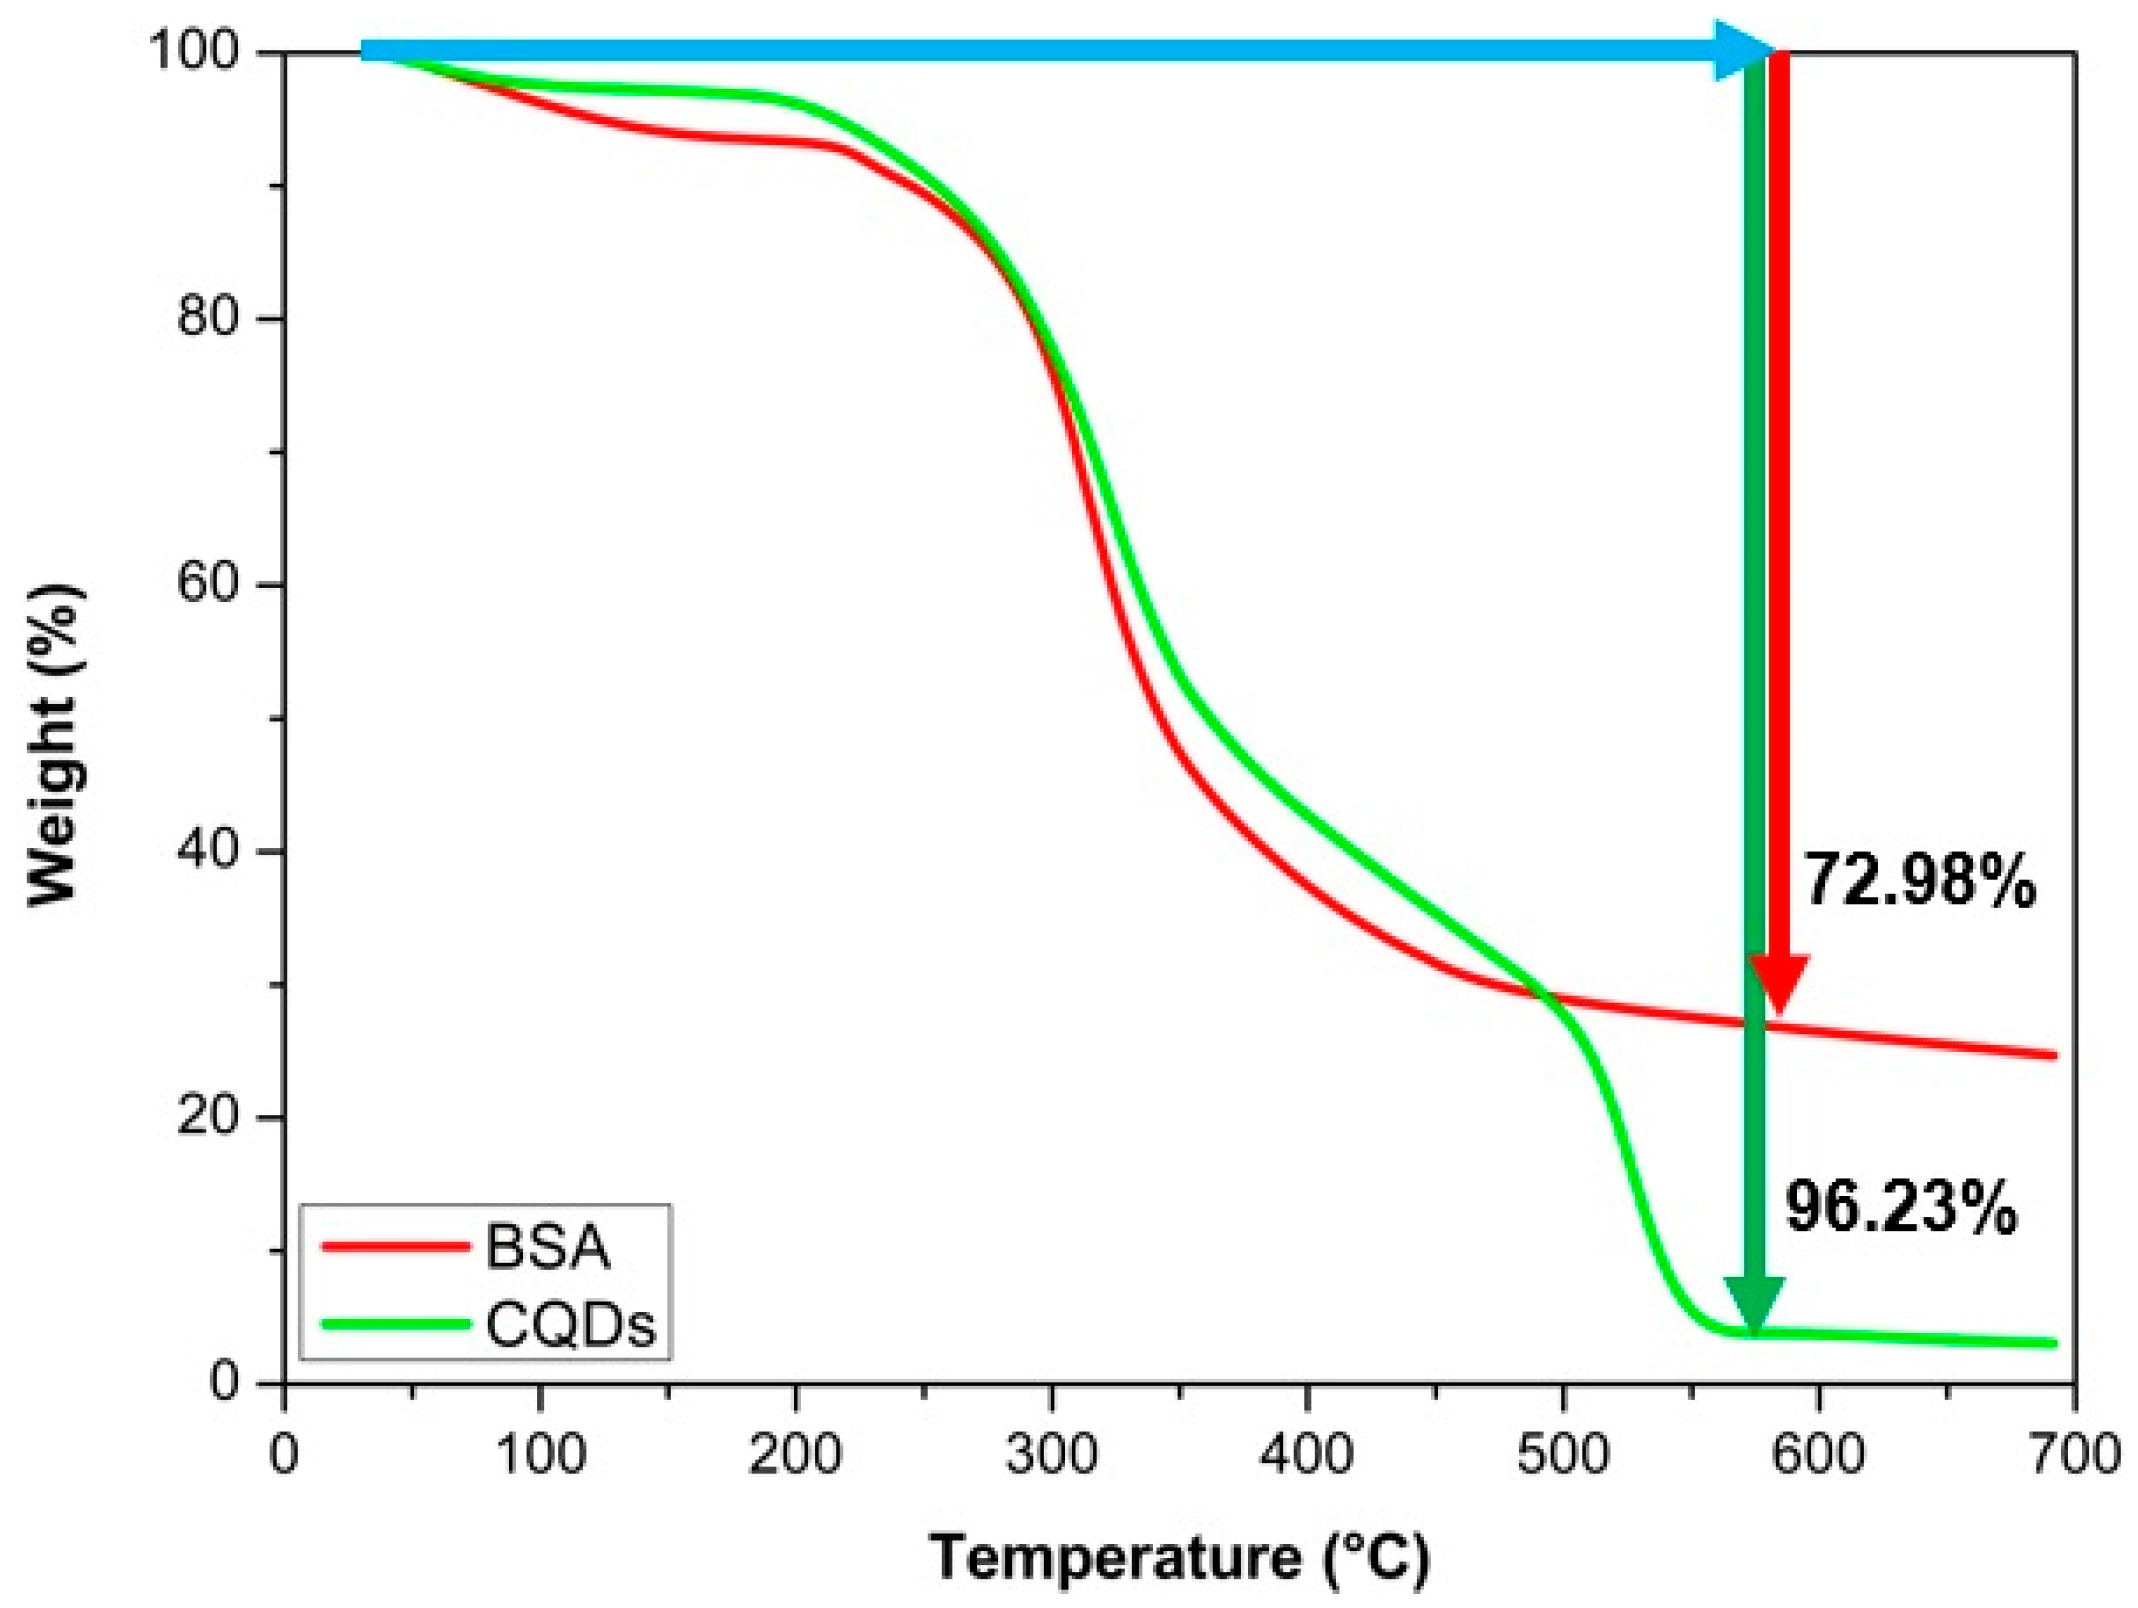
3.1. Synthesis and Characterization of Carbon Quantum Dots

Microwave-assisted synthesis produced a characteristic residue adhering to the walls of the brown-colored beaker (Figure 1a) [20,23]. The CQDs were analyzed using dynamic light scattering (DLS), yielding an average particle size of 4 ± 1.44 nm (Figure 1b). Transmission electron microscopy (TEM) was performed to confirm this particle size, revealing spherical particles approximately 4 nm in diameter (Figure 1c).
The diffractograms obtained for BSA and CQDs are shown in Figure 2. The analysis was conducted over a 2θ range of 10 to 80°. BSA exhibited an amorphous nature (Figure 2, red line), with a characteristic broad band at 2θ ≈ 19–21°, which is typical for this material [20,24]. Similarly, the CQDs display the same band at 2θ ≈ 19–21° (Figure 2, green line). However, this broad band is attributed to the [002] plane, with an interlayer spacing of 0.448 nm, indicating a graphitic–amorphous structure [20,23,25]. Cutrim et al. reported the presence of another band associated with the graphitic [100] plane at 2θ ≈ 42° (Figure 2, green line), corresponding to an interlayer spacing of 0.217 nm [23]. Ansi et al. also identified a band at 2θ ≈ 44°, corresponding to the amorphous graphitic [101] plane, with an interplanar spacing of 0.202 nm, which is also observed in Figure 2 (green line) [20,25]. It is worth noting that the organic phase of BSA can significantly hinder the detection of crystalline signals. Additionally, variations in CQDs synthesis methods and precursor materials may lead to differences in the resulting diffraction patterns.
Figure 3 shows the infrared spectrum of BSA (red line), displaying characteristic bands at 3282 and 2957 cm−1, corresponding to the stretching vibrations of hydroxyl (O–H) and amine (N–H) groups, respectively. Additional bands appear at 1646 and 1515 cm1, associated with the stretching vibration of the carbonyl group (C=O) in amide I and the bending and stretching vibrations of nitrogen-containing functional groups (N–H and C–N) in amide II [26,27]. Bands at 1388 and 1240 cm−1 are attributed to the stretching vibrations of C–N and C–C bonds within amino groups [20,28], while the band at 1169 cm−1 corresponds to the stretching vibration of carbon–oxygen (C–O) bonds [15,29].
The FT-IR spectrum of CQDs is also shown in Figure 3 (green line). This spectrum exhibits bands at 3292 and 2958 cm−1, assigned to the stretching vibrations of hydroxyl groups (O–H) and carbon–hydrogen (C–H) bonds from aliphatic and aromatic hydrocarbons (alkyl and aryl groups) [25]. A band at 2641 cm−1, also observed in BSA, is associated with the stretching of sulfur–hydrogen (S–H) bonds, indicative of sulfur-containing amino acids [28]. A prominent band at 1701 cm−1 corresponds to carbon–carbon double bonds (C=C) in aromatic rings and the stretching of carbon–oxygen double bonds (C=O) from BSA-derived amino acids [15,29]. Bands at 1645, 1518, and 1389 cm−1 are related to forming amide bonds (C–N and N–H), reflecting the nitrogen content from BSA amino acids [20,30,31,32]. Finally, bands observed at 1200 and 1165 cm−1 are attributed to the stretching vibrations of carbon–carbon (C–C) and carbon–oxygen (C–O) bonds, respectively [15,29].
Through FT-IR analysis and the work of Larsson and co-workers, the chemical reaction between citric acid and BSA to form N-doped carbon quantum dots (N-CQDs) via microwave-assisted synthesis can be deduced (Figure 4). The dehydration and carbonization of the precursors occur because of thermal treatment from microwave irradiation. Initially, citric acid and BSA are converted into their respective salts (COO and NH3+), followed by thermal dehydration. This leads to the formation of amide bonds that generate long polymer chains. As heating continues, these chains shrink due to further intramolecular dehydration. C–C bonds form at this stage, synthesizing aromatic structures within the polymers—a key aspect of the carbonization process. Dehydration and carbonization proceed simultaneously until N-CQDs are formed. During carbonization, nitrogen atoms are incorporated into the carbon framework (nitrogen doping), likely due to incomplete carbonization. As a result, polymer chains and various functional groups remain on the surface of the N-CQDs [33].
The UV–Vis spectrum of BSA shows a maximum absorption band centered at 280 nm, within the 260–280 nm range, indicating the presence of amino acids in its structure [34]. Buddanavar reports that absorption at 274 and 280 nm is associated with the amino acid residues tyrosine and tryptophan present in BSA [35]. This study used BSA as a precursor, so its characteristic signal is not observed in the CQDs spectrum (Figure 5, green line). Ref. [9] reported that CQDs exhibit strong optical absorption in the UV region (340–451 nm), with a tail extending into the visible range. The maximum absorbance at 340 nm is attributed to the n–π transition of C=O bonds [15,36,37,38]. A similar behavior is observed in Figure 5 (green line), showing a blue shift with a maximum absorbance at 320 nm, extending up to 540 nm.
The synthesized CQDs displayed a yellow-green color under visible light and strong blue luminescence under UV illumination (Figure 6), indicative of quantum confinement effects [39]. Fluorescence analysis revealed a broad emission peak from 375 to 600 nm, with a maximum close to 415 nm (Figure 7). This emission remained stable for approximately six months, demonstrating adequate optical stability.
The narrow emission range and absence of additional peaks suggest a uniform particle size distribution and minimal agglomeration, consistent with the effective passivation of surface defects. Nitrogen doping from BSA likely influenced the emission behavior by modifying surface states and limiting non-radiative trap sites. This is supported by the observed stability and absence of red-shifted emissions typically associated with high surface defect density [40].
These findings highlight the role of controlled surface chemistry in achieving stable and efficient blue emission, supporting the suitability of the synthesized CQDs for bioimaging and diagnostic applications.
The objective of synthesizing a theranostic agent using CQDs is based on their ability to withstand high temperatures without decomposing (for photothermal therapy) while remaining stable in physiological solutions across a range of pH levels. This stability enhances their physicochemical performance, providing thermal properties for treatment and fluorescence for diagnostic applications. A thermogravimetric analysis (Figure 8) was conducted to evaluate thermal stability on BSA and CQDs, showing weight losses of 72.98 and 96.23% at 590 °C, respectively. The significant mass loss observed is primarily attributed to the thermal decomposition and pyrolysis of the organic components, specifically the denaturation and fragmentation of the protein matrix (BSA), and the breakdown of oxygen-containing functional groups derived from citric acid. These decomposition events typically occur between 200 °C and 450 °C, a range characteristic of carbon-based materials synthesized from organic precursors [41]. Since photothermal therapy typically requires temperatures below 41 °C [42], the weight losses at this temperature for BSA and CQDs were only 0.4364 and 0.3137%, respectively. These values are considered negligible, and they confirm the thermal stability of CQDs under therapeutic conditions.
The MTT assay results demonstrated that the cell viability in the CQDs-treated groups remained at or slightly above 100% compared to the untreated controls (Figure 9). These minor increases in metabolic activity are consistent with observations reported in other nanoparticle studies involving biocompatible materials [43]. Such results may indicate that the CQDs not only exhibit low cytotoxicity but could also promote mild cellular proliferation or enhance mitochondrial activity. This effect is likely attributable to the intrinsic functionalization provided using citric acid and BSA as precursors, which contribute to the favorable interaction of CQDs with cells [43].
The relative quantum yield (QY) of the synthesized CQDs was calculated to be 3.88%, with Rhodamine used as the reference fluorophore. This value falls within the typical range reported for carbon quantum dots synthesized from natural or biomolecular precursors without extensive post-functionalization [44]. Although modest compared to some CQDs reported in the literature (which can achieve > 10–20% QY with surface passivation or doping), this value reflects the intrinsic fluorescence of the material and supports its suitability for bioimaging applications where moderate brightness is acceptable and biocompatibility and green synthesis are prioritized [45]. The CQDs still exhibit strong fluorescence visible under UV light. This behavior can be attributed to the presence of BSA as a surface-functionalizing agent, which likely contributes to fluorescence stabilization, as evidenced by the observed spectral stability and emission intensity. Additionally, the mild synthesis conditions (microwave-assisted heating) help preserve aspects of the protein structure, which may influence the emission properties.

3.2. Photothermal Effect and Colloidal Stability

A theranostic agent must achieve temperatures above 41 °C to exert effective therapeutic action, particularly in photothermal therapy, where the goal is to destroy cancer cells while selectively minimizing damage to healthy tissue [42]. This study evaluated CQDs for their photothermal performance under 808 nm NIR laser irradiation (Figure 10). The temperature profile demonstrated that CQDs reached the therapeutic threshold of 41 °C within 15 min and continued to increase to 42 °C by the 23-min mark. In contrast, the control sample (triple-distilled water) exhibited a significantly lower temperature increase, reaching only 39.3 °C. The heating rates were 0.37 °C/min for the control and 0.47 °C/min for the CQDs. While seemingly modest, this 0.10 °C/min difference reflects a consistent and reproducible enhancement in photothermal conversion efficiency due to the presence of CQDs. The higher rate of temperature increases and the greater final temperature in the CQDs increases their ability to absorb NIR light and convert it into heat more effectively than water, which lacks such photothermal properties.
The initial temperature in both cases was 37 °C. However, the CQDs achieved a net increase of 4 °C compared to only 2.3 °C in the controlled sample. This additional heating of approximately 2 °C can be directly attributed to the photothermal conversion capabilities of CQDs. The enhanced performance is likely due to their nanoscale size, high surface area, carbon-rich core structure, and surface functional groups, which facilitate efficient NIR absorption and thermal energy generation [42]. Although the temperature difference may appear modest, it is significant in the biomedical context. Mild photothermal therapy (PTT) aims to operate within a 40–45 °C therapeutic window, sufficient to induce apoptosis or sensitize cancer cells to other treatments without causing extensive damage to surrounding healthy tissues. Therefore, the ability of CQDs to generate even a slight but sustained increase in temperature under NIR irradiation can be therapeutically meaningful.
Using triple-distilled water as a control was essential to distinguish between passive heating effects from the laser and active photothermal conversion. The results demonstrate that the CQDs’ heating effect is not a result of general absorption or environmental warming but is specifically due to their intrinsic photothermal behavior. Finally, the thermographic image obtained at the end of the experiment (Figure 11) visually supports the thermal evolution observed in the heating curve, providing further evidence of the CQDs’ photothermal activity. This visual confirmation aligns well with the quantitative data and reinforces the potential of CQDs as effective, light-activated agents for cancer theranostics.
The CQDs showed good colloidal stability over 15 days, with TSI values of 75.87 for BSA and 74.85 for CQDs, showing comparable behavior between the precursor and CQDs (Figure 12). When evaluated under different pH conditions relevant to physiological environments (Table 1), CQDs exhibited the greatest stability at pH 7.4 (TSI = 30.38), moderate stability at pH 7.2 (TSI = 77.49), and the lowest stability at pH 4.1 (TSI = 100).
The reduced stability at acidic pH is likely due to protonation of functional groups on the CQDs surface, particularly carboxyl and amine groups, which can weaken electrostatic repulsion between particles. This loss of repulsive forces eases aggregation and results in increased turbidity over time. Such behavior is consistent with other reports on pH-sensitive nanomaterials, where colloidal destabilization is triggered by surface charge neutralization in acidic media [45]. Additionally, PBS as a dispersing medium led to further instability, attributed to its high ionic strength. Salts in PBS can compress the electrical double layer around CQDs, further reducing repulsion and promoting aggregation.
The zeta potential of the CQDs was measured under various pH conditions to evaluate their colloidal stability and surface charge behavior (Table 2). High positive values were seen across all conditions, with +200 mV at both pH 4.1 and pH 7.0, decreasing to +160.7 mV at pH 7.2 and +140.2 mV at pH 7.4. These results show excellent colloidal stability throughout the physiological pH range and are consistent with the TSI data. Previous studies have shown that nanomaterials with zeta potential values greater than ±30 mV generally exhibit good colloidal stability [46]. In this study, all measured values exceeded +140 mV, suggesting that the CQDs remain well-dispersed without the need for added stabilizers, even under physiological conditions. The gradual decrease in zeta potential with an increasing pH is likely due to the partial deprotonation of surface functional groups such as carboxyl and amine moieties. Despite this reduction, the surface charge remained sufficiently high to prevent aggregation. This stable electrostatic behavior across a range of pH conditions is particularly helpful for biomedical applications, as it supports colloidal stability in both neutral and mildly acidic environments commonly associated with tumor microenvironments.

4. Conclusions

CQDs were successfully synthesized using a microwave-assisted method with citric acid and BSA, resulting in spherical nanoparticles with an average diameter of 4 nm. A characterization confirmed an amorphous graphitic structure and the presence of amide bonds and oxygen-containing functional groups, as identified via FT-IR spectroscopy. The CQDs exhibited excitation and emission wavelengths of 320 nm and 360–400 nm, respectively, and demonstrated stability for approximately one month. The relative quantum yield (QY) of the synthesized CQDs was calculated to be 3.88%, which reflects the intrinsic fluorescence of the material and supports its applicability for bioimaging applications where moderate brightness is acceptable. Zeta potential measurements further demonstrated that the CQDs maintained good dispersion and colloidal stability under physiological conditions. A thermogravimetric analysis indicated minimal weight loss at temperatures relevant to thermal therapy, although colloidal stability under physiological conditions remains a challenge and warrants further optimization for biomedical applications. Notably, the CQDs exhibited efficient photothermal conversion under NIR laser irradiation, reaching temperatures above 41 °C within 15 min. This performance surpassed triple-distilled water under identical conditions, highlighting their suitability as photothermal agents for mild hyperthermia. Achieving therapeutic temperatures without harming surrounding healthy tissues underscores their potential for future theranostic applications in cancer treatment.

Author Contributions

M.F.A.G., D.M.-O. and I.O.-A.; methodology, M.F.A.G., D.M.-O., A.R.-R., M.E.M.-D., A.V.-R., C.A.R.-G. and I.O.-A.; formal analysis, M.F.A.G.; writing—original draft preparation, A.R.-R.; conceptualization, M.F.A.G., A.R.-R. and I.O.-A.; investigation.; A.V.-R., S.-A.M.-E. and I.O.-A.; writing—review and editing, I.O.-A.; project administration. All authors have read and agreed to the published version of the manuscript.

Funding

This research received no external funding.

Data Availability Statement

The original contributions presented in this study are included in the article. Further inquiries can be directed to the corresponding author.

Acknowledgments

María Fernanda Amézaga González thanks the Secretary of Science, Humanities, Technology and Innovation (SECIHTI) for their support of the PhD Program in Materials Sciences, as well as the Universidad Autónoma de Ciudad Juárez (UACJ) working group for the facilities that were shared to develop this investigation. The authors would like to acknowledge the Laboratorio Nacional de Nanotecnología (Nanotech), with special thanks to Raúl Armando Ochoa Gamboa and Marco Antonio Ruiz Esparza Rodríguez for their technical support in obtaining the TEM images.

Conflicts of Interest

The authors declare no conflicts of interest.

Abbreviations

The following abbreviations are used in this manuscript:
CQDsCarbon quantum dots
BSABovine serum albumin
TSITurbidimetric stability index
PTTPhotothermal therapy

References

  1. Xu, X.; Ray, R.; Gu, Y.; Ploehn, H.J.; Gearheart, L.; Raker, K.; Scrivens, W.A. Electrophoretic Analysis and Purification of Fluorescent Single-Walled Carbon Nanotube Fragments. J. Am. Chem. Soc. 2004, 126, 12736–12737. [Google Scholar] [CrossRef]
  2. Sun, Y.-P.; Zhou, B.; Lin, Y.; Wang, W.; Fernando, K.A.S.; Pathak, P.; Meziani, M.J.; Harruff, B.A.; Wang, X.; Wang, H.; et al. Quantum-Sized Carbon Dots for Bright and Colorful Photoluminescence. J. Am. Chem. Soc. 2006, 128, 7756–7757. [Google Scholar] [CrossRef]
  3. Mendes, R.G.; Bachmatiuk, A.; Büchner, B.; Cuniberti, G.; Rümmeli, M.H. Carbon Nanostructures as Multi-Functional Drug Delivery Platforms. J. Mater. Chem. B 2013, 1, 401–428. [Google Scholar] [CrossRef]
  4. Chen, D.; Dougherty, C.A.; Zhu, K.; Hong, H. Theranostic Applications of Carbon Nanomaterials in Cancer: Focus on Imaging and Cargo Delivery. J. Control. Release 2015, 210, 230–245. [Google Scholar] [CrossRef] [PubMed]
  5. Lim, S.Y.; Shen, W.; Gao, Z. Carbon Quantum Dots and Their Applications. Chem. Soc. Rev. 2015, 44, 362–381. [Google Scholar] [CrossRef] [PubMed]
  6. Wu, X.; Lin, Q.; Chen, G.; Lu, J.; Zeng, Y.; Chen, X.; Yan, J. Sentinel Lymph Node Detection Using Carbon Nanoparticles in Patients with Early Breast Cancer. PLoS ONE 2015, 10, e0135714. [Google Scholar] [CrossRef]
  7. Yu, W.; Cao, X.; Xu, G.; Song, Y.; Li, G.; Zheng, H.; Zhang, N. Potential Role for Carbon Nanoparticles to Guide Central Neck Dissection in Patients with Papillary Thyroid Cancer. Surgery 2016, 160, 755–761. [Google Scholar] [CrossRef]
  8. Zhang, Y.; Wu, M.; Wu, M.; Zhu, J.; Zhang, X. Multifunctional Carbon-Based Nanomaterials: Applications in Biomolecular Imaging and Therapy. ACS Omega 2018, 3, 9126–9145. [Google Scholar] [CrossRef]
  9. Zhao, H.; Chao, Y.; Liu, J.; Huang, J.; Pan, J.; Guo, W.; Wu, J.; Sheng, M.; Yang, K.; Wang, J.; et al. Polydopamine Coated Single-Walled Carbon Nanotubes as a Versatile Platform with Radionuclide Labeling for Multimodal Tumor Imaging and Therapy. Theranostics 2016, 6, 1833–1843. [Google Scholar] [CrossRef] [PubMed]
  10. Hsu, P.-C.; Chen, P.-C.; Ou, C.-M.; Chang, H.-Y.; Chang, H.-T. Extremely High Inhibition Activity of Photoluminescent Carbon Nanodots toward Cancer Cells. J. Mater. Chem. B 2013, 1, 1774. [Google Scholar] [CrossRef]
  11. Jia, X.; Pei, M.; Zhao, X.; Tian, K.; Zhou, T.; Liu, P. PEGylated Oxidized Alginate-DOX Prodrug Conjugate Nanoparticles Cross-Linked with Fluorescent Carbon Dots for Tumor Theranostics. ACS Biomater. Sci. Eng. 2016, 2, 1641–1648. [Google Scholar] [CrossRef]
  12. Singh, R.K.; Patel, K.D.; Mahapatra, C.; Kang, M.S.; Kim, H.-W. C-Dot Generated Bioactive Organosilica Nanospheres in Theranostics: Multicolor Luminescent and Photothermal Properties Combined with Drug Delivery Capacity. ACS Appl. Mater. Interfaces 2016, 8, 24433–24444. [Google Scholar] [CrossRef] [PubMed]
  13. Ge, J.; Jia, Q.; Liu, W.; Lan, M.; Zhou, B.; Guo, L.; Zhou, H.; Zhang, H.; Wang, Y.; Gu, Y.; et al. Carbon Dots with Intrinsic Theranostic Properties for Bioimaging, Red-Light-Triggered Photodynamic/Photothermal Simultaneous Therapy in Vitro and in Vivo. Adv. Healthc. Mater. 2016, 5, 665–675. [Google Scholar] [CrossRef] [PubMed]
  14. Shi, C.; Qi, H.; Ma, R.; Sun, Z.; Xiao, L.; Wei, G.; Huang, Z.; Liu, S.; Li, J.; Dong, M.; et al. N,S-Self-Doped Carbon Quantum Dots from Fungus Fibers for Sensing Tetracyclines and for Bioimaging Cancer Cells. Mater. Sci. Eng. C 2019, 105, 110132. [Google Scholar] [CrossRef]
  15. Rani, U.A.; Ng, L.Y.; Ng, C.Y.; Mahmoudi, E. A Review of Carbon Quantum Dots and Their Applications in Wastewater Treatment. Adv. Colloid Interface Sci. 2020, 278, 102124. [Google Scholar] [CrossRef] [PubMed]
  16. Xie, J.; Lee, S.; Chen, X. Nanoparticle-Based Theranostic Agents. Adv. Drug Deliv. Rev. 2010, 62, 1064–1079. [Google Scholar] [CrossRef]
  17. Kandasamy, G.; Maity, D. Multifunctional Theranostic Nanoparticles for Biomedical Cancer Treatments—A Comprehensive Review. Mater. Sci. Eng. C 2021, 127, 112199. [Google Scholar] [CrossRef]
  18. Dua, S.; Kumar, P.; Pani, B.; Kaur, A.; Khanna, M.; Bhatt, G. Stability of Carbon Quantum Dots: A Critical Review. RSC Adv. 2023, 13, 13845–13861. [Google Scholar] [CrossRef]
  19. Milosavljevic, V.; Moulick, A.; Kopel, P.; Adam, V.; Kizek, R. Microwave Preparation of Carbon Quantum Dots with Different Surface Modification. Available online: https://web.archive.org/web/20180410075023id_/http://web2.mendelu.cz/af_239_nanotech/J_Met_Nano/0314/pdf/jmn3-03.pdf (accessed on 22 July 2025).
  20. Jaramillo Martínez, S.M.; Rodríguez González, C.A.; Olivas, I. Armendáriz Síntesis de Puntos Cuánticos de Carbono Para El Desarrollo de Biomarcadores Ópticos Fluorescentes; Universidad Autónoma de Ciudad Juárez: Chihuahua Juárez, México, 2022. [Google Scholar]
  21. Amézaga González, M.F.; Acosta Bezada, J.; Gómez Flores, V.; Chapa González, C.; Farias Mancilla, J.R.; Castillo, S.J.; Avila Orta, C.; García-Casillas, P.E. Effect of Physiological Fluid on the Photothermal Properties of Gold Nanostructured. Int. J. Mol. Sci. 2023, 24, 8339. [Google Scholar] [CrossRef]
  22. Matusiak, J.; Grzadka, E. Stability of Colloidal Systems—A Review of the Stability Measurements Methods. Chemia 2017, 72, 33. [Google Scholar] [CrossRef]
  23. Cutrim, E.S.M.; Vale, A.A.M.; Manzani, D.; Barud, H.S.; Rodríguez-Castellón, E.; Santos, A.P.S.A.; Alcântara, A.C.S. Preparation, Characterization and in Vitro Anticancer Performance of Nanoconjugate Based on Carbon Quantum Dots and 5-Fluorouracil. Mater. Sci. Eng. C 2021, 120, 111781. [Google Scholar] [CrossRef]
  24. Rai, S.; Arun, S.; Kureel, A.K.; Dutta, P.K.; Mehrotra, G.K. Preparation of Dextran Aldehyde and BSA Conjugates from Ligno-Cellulosic Biowaste for Antioxidant and Anti-Cancer Efficacy. Waste Biomass Valor. 2021, 12, 1327–1339. [Google Scholar] [CrossRef]
  25. Ansi, V.A.; Renuka, N.K. Table Sugar Derived Carbon Dot—A Naked Eye Sensor for Toxic Pb2+ Ions. Sens. Actuators B Chem. 2018, 264, 67–75. [Google Scholar] [CrossRef]
  26. Li, J.; Wang, W.; An, B.; Jia, X.; Zhang, Y.; Li, J.; Bai, Y.; Xu, J. Luminescence Color Regulation of Carbon Quantum Dots by Surface Modification. J. Lumin. 2022, 246, 118811. [Google Scholar] [CrossRef]
  27. Ganesan, S.; Kalimuthu, R.; Kanagaraj, T.; Kulandaivelu, R.; Nagappan, R.; Pragasan, L.A.; Ponnusamy, V.K. Microwave-Assisted Green Synthesis of Multi-Functional Carbon Quantum Dots as Efficient Fluorescence Sensor for Ultra-Trace Level Monitoring of Ammonia in Environmental Water. Environ. Res. 2022, 206, 112589. [Google Scholar] [CrossRef]
  28. Arrondo, J.L.R.; Muga, A.; Castresana, J.; Goñi, F.M. Quantitative Studies of the Structure of Proteins in Solution by Fourier-Transform Infrared Spectroscopy. Prog. Biophys. Mol. Biol. 1993, 59, 23–56. [Google Scholar] [CrossRef]
  29. Sabet, M.; Mahdavi, K. Green Synthesis of High Photoluminescence Nitrogen-Doped Carbon Quantum Dots from Grass via a Simple Hydrothermal Method for Removing Organic and Inorganic Water Pollutions. Appl. Surf. Sci. 2019, 463, 283–291. [Google Scholar] [CrossRef]
  30. Liang, Q.; Ma, W.; Shi, Y.; Li, Z.; Yang, X. Easy Synthesis of Highly Fluorescent Carbon Quantum Dots from Gelatin and Their Luminescent Properties and Applications. Carbon 2013, 60, 421–428. [Google Scholar] [CrossRef]
  31. Mai, X.-D.; Phan, Y.T.H.; Nguyen, V.-Q. Excitation-Independent Emission of Carbon Quantum Dot Solids. Adv. Mater. Sci. Eng. 2020, 1, 1–5. [Google Scholar] [CrossRef]
  32. Widyasari, D.A.; Kristiani, A.; Randy, A.; Manurung, R.V.; Dewi, R.T.; Andreani, A.S.; Yuliarto, B.; Jenie, S.N.A. Optimized Antibody Immobilization on Natural Silica-Based Nanostructures for the Selective Detection of E. coli. RSC Adv. 2022, 12, 21582–21590. [Google Scholar] [CrossRef]
  33. Larsson, M.A.; Ramachandran, P.; Jarujamrus, P.; Lee, H.L. Microwave Synthesis of Blue Emissive N-Doped Carbon Quantum Dots as a Fluorescent Probe for Free Chlorine Detection. J. Sex. Med. 2022, 51, 1197–1212. [Google Scholar] [CrossRef]
  34. Arya, B.D.; Malik, N. Quantitative Estimation of Bovine Serum Albumin Protein Using UV—Visible Spectroscopy. World Wide J. Multidiscip. Res. Dev. 2025, 1, 66–69. [Google Scholar]
  35. Buddanavar, A.T.; Nandibewoor, S.T. Multi-Spectroscopic Characterization of Bovine Serum Albumin upon Interaction with Atomoxetine. J. Pharm. Anal. 2017, 7, 148–155. [Google Scholar] [CrossRef]
  36. Feng, S.; Gao, Z.; Liu, H.; Huang, J.; Li, X.; Yang, Y. Feasibility of Detection Valence Speciation of Cr(III) and Cr(VI) in Environmental Samples by Spectrofluorimetric Method with Fluorescent Carbon Quantum Dots. Spectrochim. Acta Part A Mol. Biomol. Spectrosc. 2019, 212, 286–292. [Google Scholar] [CrossRef]
  37. Vibhute, A.; Patil, T.; Gambhir, R.; Tiwari, A.P. Fluorescent Carbon Quantum Dots: Synthesis Methods, Functionalization and Biomedical Applications. Appl. Surf. Sci. Adv. 2022, 11, 100311. [Google Scholar] [CrossRef]
  38. Zhao, Y.; Liu, X.; Yang, Y.; Kang, L.; Yang, Z.; Liu, W.; Chen, L. Carbon Dots: From Intense Absorption in Visible Range to Excitation-Independent and Excitation-Dependent Photoluminescence. Fuller. Nanotub. Carbon Nanostruct. 2015, 23, 922–929. [Google Scholar] [CrossRef]
  39. Bano, D.; Kumar, V.; Singh, V.K.; Hasan, S.H. Green Synthesis of Fluorescent Carbon Quantum Dots for the Detection of Mercury(Ii) and Glutathione. New J. Chem. 2018, 8, 5814–5821. [Google Scholar] [CrossRef]
  40. Vela, J.; Htoon, H.; Chen, Y.; Park, Y.-S.; Ghosh, Y.; Goodwin, P.M.; Werner, J.H.; Wells, N.P.; Casson, J.L.; Hollingsworth, J.A. Effect of Shell Thickness and Composition on Blinking Suppression and the Blinking Mechanism in ‘Giant’ CdSe/CdS Nanocrystal Quantum Dots. J. Biophoton. 2010, 3, 706–717. [Google Scholar] [CrossRef]
  41. Javed, M.; Saqib, A.N.S.; Ata-ur-Rehman; Ali, B.; Faizan, M.; Anang, D.A.; Iqbal, Z.; Abbas, S.M. Carbon Quantum Dots from Glucose Oxidation as a Highly Competent Anode Material for Lithium and Sodium-Ion Batteries. Electrochim. Acta 2019, 297, 250–257. [Google Scholar] [CrossRef]
  42. Wang, M.; Zhou, G.; Pan, Y.; Xue, Y.; Zhu, S.; Yan, Y.; Yuan, H.; Li, S.; Huang, Q. Design and Fabrication of Cascade Novel Fenton Catalytic Nanocomposite as Theranostic Agent for Chemodynamic/Photothermal Synergistic Tumor Therapy. Mater. Des. 2022, 219, 110794. [Google Scholar] [CrossRef]
  43. Alkilany, A.M.; Bani Yaseen, A.I.; Kailani, M.H. Synthesis of Monodispersed Gold Nanoparticles with Exceptional Colloidal Stability with Grafted Polyethylene Glycol-g-Polyvinyl Alcohol. J. Nanomater. 2015, 1, 712359. [Google Scholar] [CrossRef]
  44. Singh, I.; Arora, R.; Dhiman, H.; Pahwa, R. Carbon quantum dots: Synthesis, characterization and biomedical applications. Turk. J. Pharm. Sci. 2018, 15, 219–230. [Google Scholar] [CrossRef] [PubMed]
  45. Ghataty, D.S.; Amer, R.I.; Amer, M.A.; Abdel Rahman, M.F.; Shamma, R.N. Green Synthesis of Highly Fluorescent Carbon Dots from Bovine Serum Albumin for Linezolid Drug Delivery as Potential Wound Healing Biomaterial: Bio-Synergistic Approach, Antibacterial Activity, and In Vitro and Ex Vivo Evaluation. Pharmaceutics 2023, 15, 234. [Google Scholar] [CrossRef] [PubMed]
  46. Silva, M.R.F.; Alves, M.F.R.P.; Ananias, D.; Ivanov, M.; Fernandes, M.H.V.; Vilarinho, P.M.; Ferreira, P. Development of Carbon Quantum Dots-Based Transparent Coatings for Enhanced UV Shielding. Appl. Surf. Sci. 2024, 669, 160414. [Google Scholar] [CrossRef]
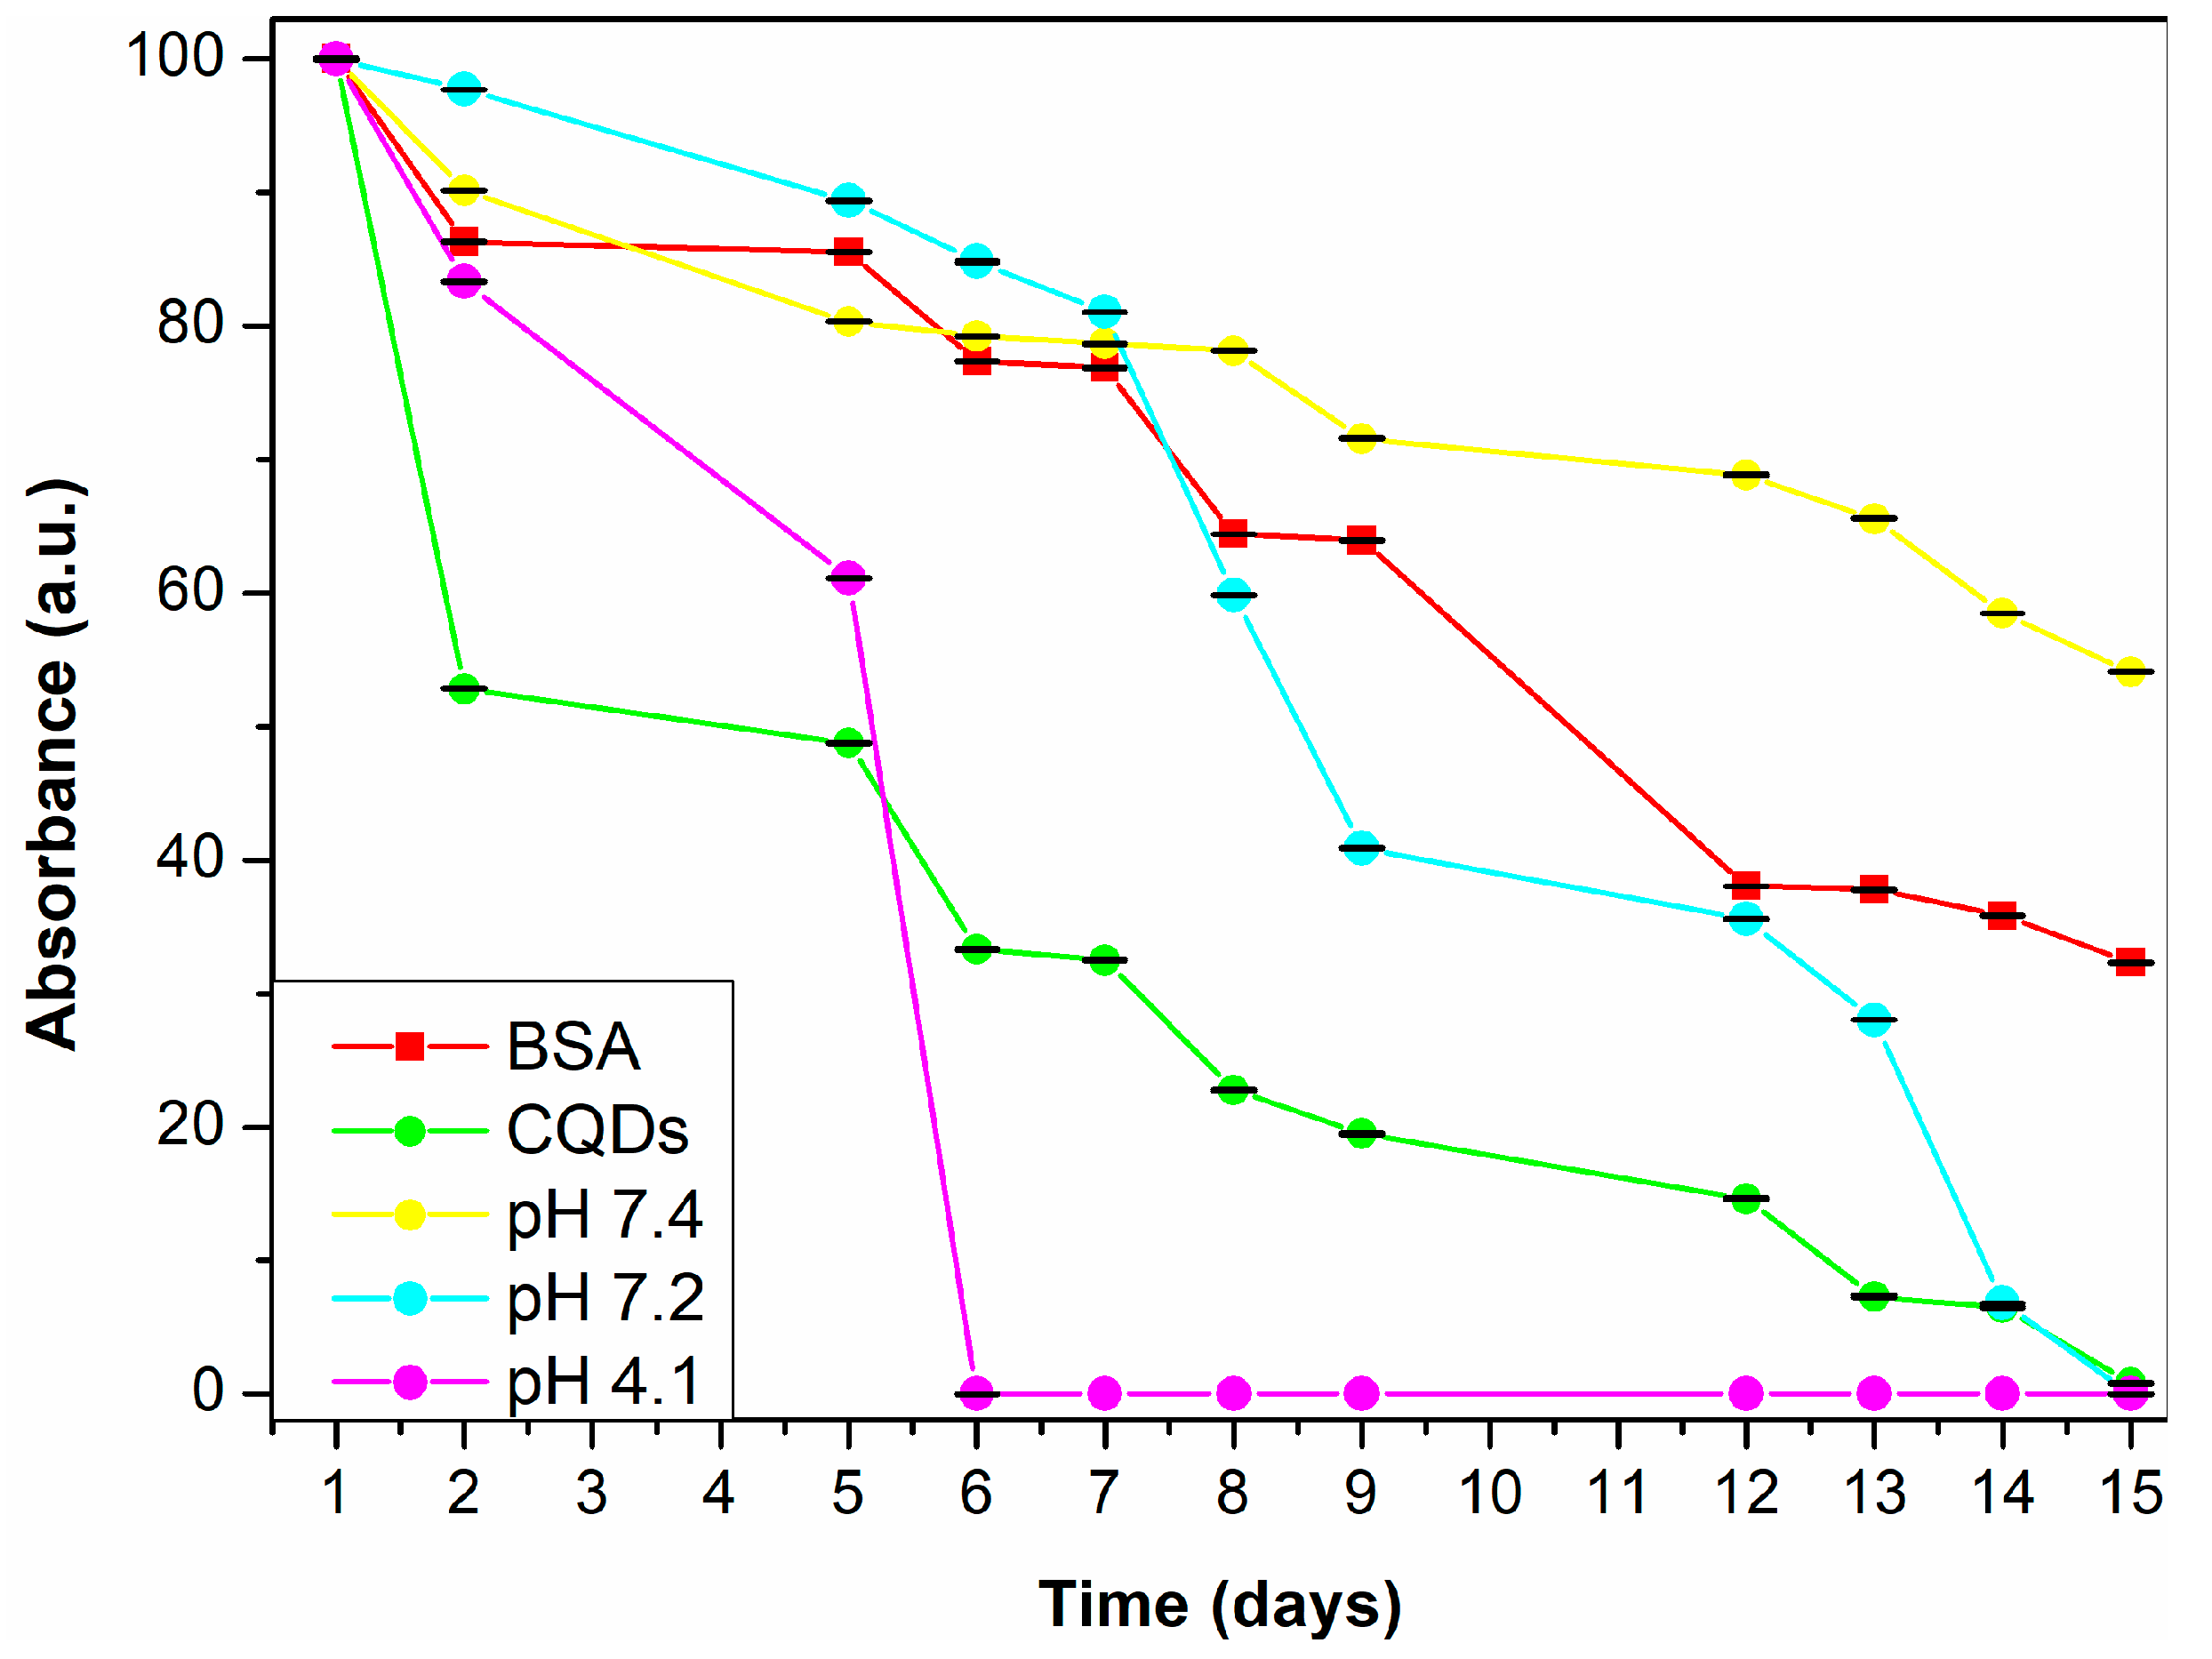
Figure 1. (a) Brown-colored CQDs synthesized via microwave-assisted method; (b) particle size distribution obtained via DLS and (c) TEM micrograph of the CQDs.
Carbon 11 00056 g001
Figure 2. X-ray diffraction patterns of BSA and CQDs.
Carbon 11 00056 g002
Figure 3. FT-IR spectra of BSA (red) and CQDs (green).
Carbon 11 00056 g003
Figure 4. Schematic representation of the chemical reaction between citric acid (C6H8O7) and BSA that leads to N-CQDs forming via microwave-assisted synthesis.
Carbon 11 00056 g004
Figure 5. UV–Vis absorption spectra of BSA (red line) and CQDs (green line).
Carbon 11 00056 g005
Figure 6. CQDs under UV light, exhibiting blue fluorescence.
Carbon 11 00056 g006
Figure 7. Fluorescence spectrum of CQDs.
Carbon 11 00056 g007
Figure 8. Thermogravimetric analysis of BSA and CQDs. The red arrow indicates the thermal degradation of BSA (72.96% weight loss), while the green arrow marks the degradation of CQDs (96.23% weight loss), highlighting their higher thermal stability.
Carbon 11 00056 g008
Figure 9. Cell viability percentage of fibroblast cell against CQDs at 25 and 50 µg/mL for 24 and 48 h.
Carbon 11 00056 g009
Figure 10. Photothermal heating curve of CQDs under NIR irradiation. A gradual temperature increase is observed over time, demonstrating the material’s ability to convert NIR light into heat.
Carbon 11 00056 g010
Figure 11. Thermographic images were obtained using an infrared camera. (a) Overview of the measurement setup. (b) CQDs sample after 15 min of irradiation, showing a surface temperature of 41 °C.
Carbon 11 00056 g011
Figure 12. Absorbance percentage of BSA and CQDs at different pH (7.4, 7.2, and 4.1).
Carbon 11 00056 g012
Table 1. Turbidimetry stability index (TSI) of BSA and CQDs at different pH levels.
SampleBSACQDsCQDs (pH 7.4)CQDs (pH 7.2)CQDs (pH 4.1)
TSI75.8774.8530.3877.49100
Table 2. Zeta potential of CQDs at different pH levels.
SampleCQDs (pH 7)CQDs (pH 7.4)CQDs (pH 7.2)CQDs (pH 4.1)
Potential Zeta (mV)+200.0+140.2+160.7+200.0
Disclaimer/Publisher’s Note: The statements, opinions and data contained in all publications are solely those of the individual author(s) and contributor(s) and not of MDPI and/or the editor(s). MDPI and/or the editor(s) disclaim responsibility for any injury to people or property resulting from any ideas, methods, instructions or products referred to in the content.

