Article

Carbon Footprint and Uncertainties of Geopolymer Concrete Production: A Comprehensive Life Cycle Assessment (LCA)

1
School of Engineering and Technology, Central Queensland University, Melbourne, VIC 3000, Australia
2
School of Engineering, RMIT University, GPO Box 2476, Melbourne, VIC 3001, Australia
3
Centre for Hydrogen and Renewable Energy, Gladstone Marina Campus, Callemondah, Central Queensland University, Gladstone, QLD 4680, Australia
4
Faculty of Science and Engineering, Southern Cross University, East Lismore, NSW 2480, Australia
*
Author to whom correspondence should be addressed.
Submission received: 4 June 2025 / Revised: 11 July 2025 / Accepted: 24 July 2025 / Published: 28 July 2025
(This article belongs to the Section Carbon Cycle, Capture and Storage)

Abstract

This study aims to estimate the carbon footprint and relative uncertainties for design components of conventional and geopolymer concrete. All the design components of alkaline-activated geopolymer concrete, such as fly ash, ground granulated blast furnace slag, sodium hydroxide (NaOH), sodium silicate (Na2SiO3), superplasticizer, and others, are assessed to reflect the actual scenarios of the carbon footprint. The conjugate application of the life cycle assessment (LCA) tool SimPro 9.4 and @RISK Monte Carlo simulation justifies the variations in carbon emissions rather than a specific determined value for concrete binders, precursors, and filler materials. A reduction of 43% in carbon emissions has been observed by replacing cement with alkali-activated binders. However, the associative uncertainties of chemical admixtures reveal that even a slight increase may cause significant environmental damage rather than its benefit. Pearson correlations of carbon footprint with three admixtures, namely sodium silicate (r = 0.80), sodium hydroxide (r = 0.52), and superplasticizer (r = 0.19), indicate that the shift from cement to alkaline activation needs additional precaution for excessive use. Therefore, a suitable method of manufacturing chemical activators utilizing renewable energy sources may ensure long-term sustainability.

Graphical Abstract

1. Introduction

The construction industry is considered the third-largest contributing sector to carbon emissions, following electricity generation and transportation [1]. The primary reason for higher carbon emissions is the manufacturing of cement by burning fossil fuels and using electricity. Combustion of limestone (CaCO3) to convert into lime (CaO), the prime component of cement clinker, causes a significant contribution of carbon dioxide (CO2) emissions to the atmosphere [2]. Around 1.5 million tons of CO2 are generated globally each year due to the manufacturing process of cement [3]. The production of cement clinker results in a range of 0.8–1.2 kg CO2 equivalent per kg of Ordinary Portland Cement (OPC) at the embodied phase [4].
The alternative solution to reducing conventional concrete’s carbon footprint is replacing cement with industrial by-products. Moreover, the transition of electricity generation from fossil fuel-based sources (coal, oil, and gas) to renewable ones (solar, wind, hydro, and others) and alternative fuel for transportation will lead to a sustainable solution [5]. The innovative way of minimizing OPC in concrete is to transform industrial by-products or waste, such as fly ash and slag, into cementitious materials. Transforming industrial waste into concrete requires an alkali solution as the activator to enhance bonding and strength, which is known as geopolymer concrete [6]. This study evaluates the environmental assessment of alkali-activated geopolymer concrete based on design components, fly ash, and slag. Although the transition to green energy will diminish fly ash availability over time, the conceptual methodology of geopolymer concrete remains adaptable [7]. In this case, an alternative aluminosilicate-rich material, such as glass powder, rice husk, fine demolition, calcined clay, and others, will substitute for fly ash [8]. Hence, this research reinforces assessing environmental impacts for low-carbon infrastructure and a long-term decarbonization strategy.
The strength-gaining mechanism of geopolymers depends on the polymerization process between aluminum silicate-enriched materials (e.g., fly ash, slag) and alkali-activated solution (e.g., NaOH, Na2SiO3, and others) [9]. A higher concentration of hydrogen ions (pH) in sodium hydroxide (NaOH) and sodium silicate (Na2SiO3) dissolves the silicate (Si-O) and aluminum (Al-O) bond of the precursors, i.e., fly ash or slag, as shown in Equation (1). Formed monomers in the dissolution process begin to react with alkali cations to generate geopolymer gel and ultimately result in three-dimensional gel sodium aluminosilicate hydrate (N-A-S-H), as in Equation (2). Additionally, blended ground granulated blast furnace slag (GGBFS) enhances the calcination process to gain early strength and form gel calcium aluminosilicate hydrate (C-A-S-H), as in Equation (3). Hydration is the main mechanism for gaining strength of cement, reacting with water to produce calcium silicate hydrate (C-S-H), as in Equation (4). Therefore, the formation of a sustainable geopolymer concrete requires the integrated application of alkaline-activated fly ash and slag to comply with the desired strength [10].
A l 2 O 3 \ S i O 2 + O H S i O 4 4   ,   A l O 4 5   D i s s o l u t i o n
n S i O 4 4 + m A l O 4 5 + a l k N a , K + . ( S i O 2 ) z A l O 2 n . w H 2 O   G e l   f o r m a t i o n
C a 2 + + n S i O 4 4 + m A l O 4 5 C A S H   g e l   ( C a l c i n a t i o n )
2 C 3 S + 6 H C 3 S 2 H 3 C S H + 3 C H   H y d r a t i o n
Over the past decade, a growing interest in research has been observed in relation to substituting cement with alternative alkali-activated binders [11,12]. Aluminosilicate-enriched industrial by-products, namely fly ash and slag, show potential as alternative binders [13]. However, the associated environmental trade-offs of alkali-activated geopolymer concrete need further investigation to optimize it from a sustainability perspective. Therefore, life cycle assessment (LCA) has been considered as a systematic methodology to calculate the carbon footprint and other impact categories for all design components [14].
LCA consists of different phases of the life cycle, such as extraction, manufacturing, construction, operation, maintenance, disposal, and recycling [15]. This study compares raw materials composition, extraction, and the manufacturing process to evaluate the environmental impacts of one cubic meter (1 m3) of conventional and geopolymer concrete. A detailed Monte Carlo simulation has been adopted in this assessment, not only to quantify specific emissions but also the variability of input design parameters. The relevant uncertainties of this analysis provide a transparent framework to identify influential parameters and guidelines to optimize design. The feasible outcomes of the uncertainty analysis address the data gap, model variability, and ensure transparent decision making in adopting sustainability.

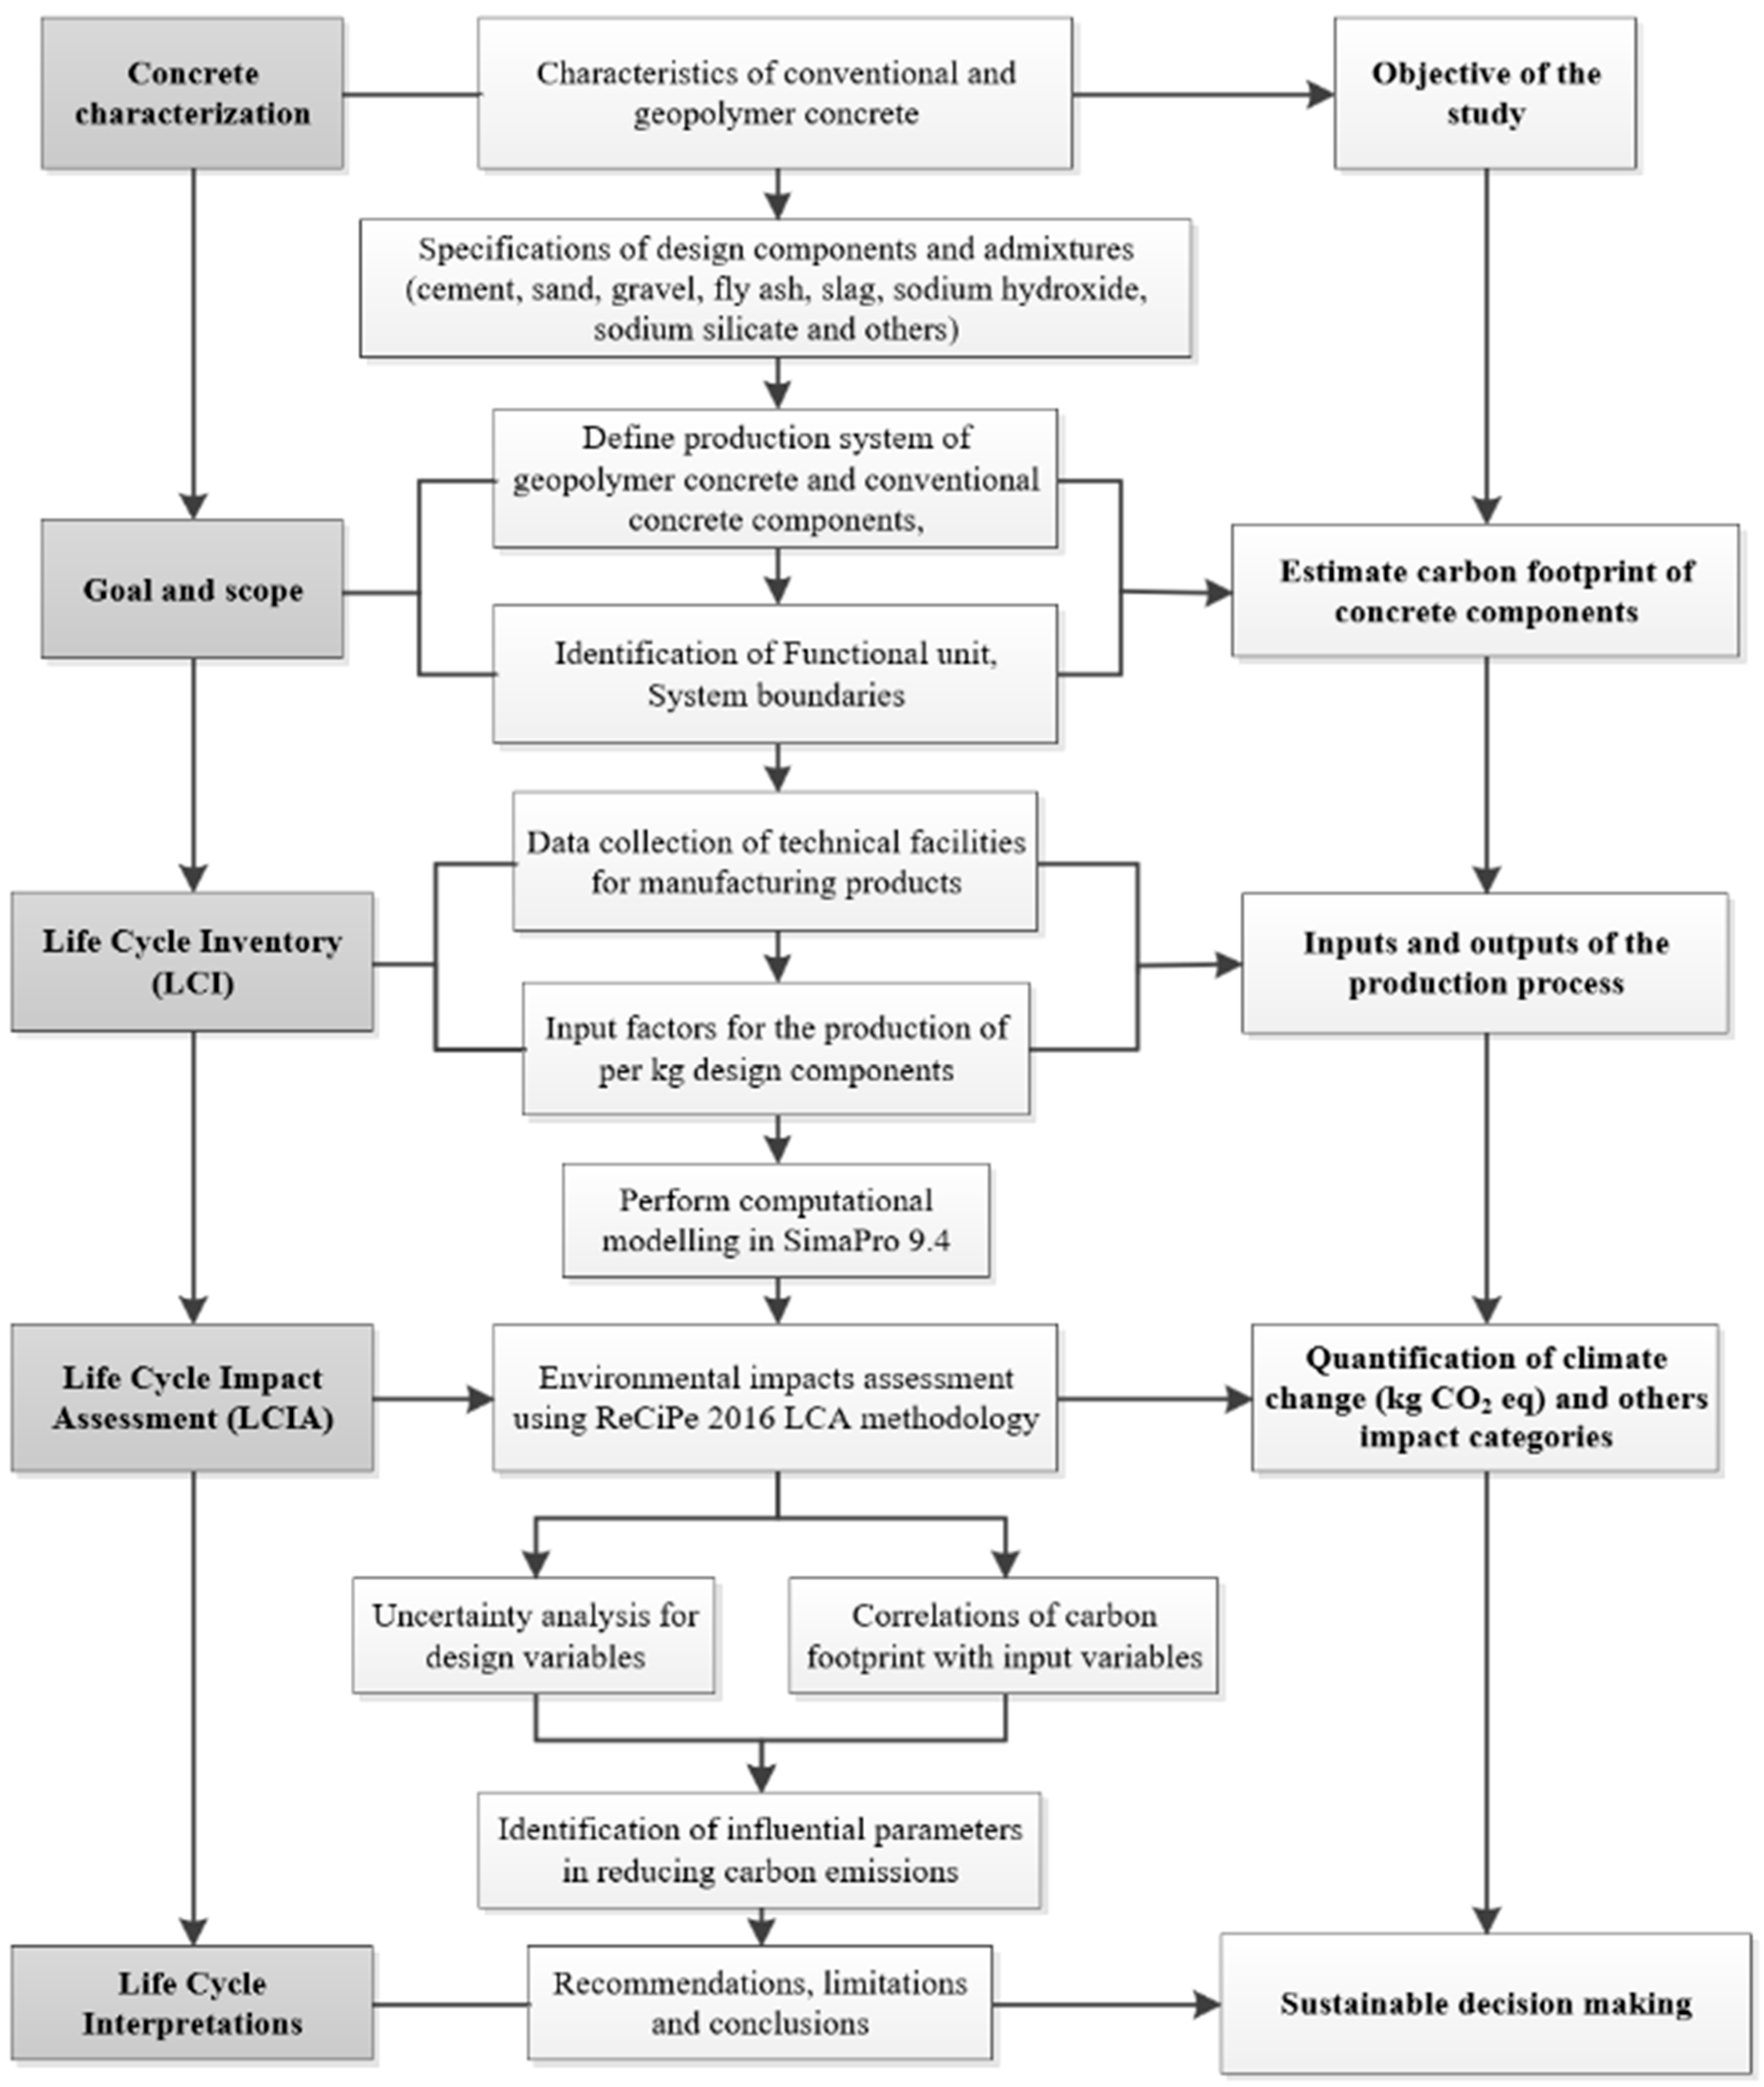
2. Materials and Methods

The study conducts a comparative LCA of geopolymer concrete components compared to conventional concrete, as shown in Figure 1. Relative uncertainties in the production system have been justified in this study to prioritize the design parameters in geopolymer concrete. An exhaustive Monte Carlo simulation has been performed to identify the association of individual impact with relative design parameters. M20 (20 MPa) concrete design mix has been considered in this study with the proportion of cement, fine aggregate, and coarse aggregate as 1:1.5:3, with a water–cement ratio of 0.5 [16]. Alkali-activated fly ash, slag, and plasticizer have replaced the cement to form 1 m3 of geopolymer concrete as per the experimental study. The conventional and geopolymer concrete are designed based on the optimal use of materials for 1 m3 of concrete, as shown in Table 1.
The formulation of geopolymer concrete is derived from experimental studies and well-practiced within the research community. The primary concept of geopolymer development is the activation of aluminosilicate using an alkali solution [17]. This innovative design employs aluminosilicate-enriched materials, such as fly ash and slag, as the binders, activated with the combination of sodium hydroxide and sodium silicate [18,19]. The addition of slag enhances calcination to form both C-A-S-H and N-A-S-H gels [20]. Additionally, the adoption of superplasticizer enhances the workability of geopolymer concrete against the high viscosity resulting from activators [21]. The composition of design components is validated by experimental research to achieve sustainable concrete solutions.
A composition of fly ash (Class F), around 75% to 100% of the total binder, is suitable for the replacement of cement [22,23]. The presence of alumino-silicate initiates a reaction with the alkali solution and forms a geopolymer gel. However, the lower content of calcination results in slower setting of concrete and requires the necessity of adding slag. To accelerate the setting and hardening of concrete, a certain proportion of ground granulated blast furnace slag (GGBFS) up to 40% is recommended to replace fly ash [24,25]. The calcium content of slag enhances the gain of early strength and acts as a partial hydraulic binder. Typically, sodium hydroxide (NaOH) and sodium silicate (Na2SiO3) are applied together as an alkali activator solution within the range of 35–45% of the binder. A ratio of Na2SiO3–NaOH between 1.5–2.5 has been found effective to initiate geopolymer reaction by activating fly ash and slag particles [26]. Higher NaOH molarity has been observed to be effective in the dissolution of alumino-silicates. Generally, 12 M NaOH is used as a balanced solution due to its safety of handling and to avoid brittleness. Additionally, the use of superplasticizer (0.5–2% of binder) reduces the water content and improves the concrete workability [27]. Fine and coarse aggregates are used as fillers of concrete, not as reactive components in concrete, as in a conventional concrete mixture [28]. The compositions and proportions of required materials to perform LCA are shown in Table 1.

2.1. Goal and Scope Definition

This study quantifies the design components of geopolymer concrete to comply with the compressive strength of conventional concrete of 20 MPa, as mentioned in Section 2. The goal of this study is to assess the environmental impacts and relevant uncertainties of geopolymer concrete components compared to conventional concrete. The comparative study will set the benchmark for alkali-activated fly ash- or slag-based geopolymer concrete and prioritize influential variables in contributing to the carbon footprint. The ISO 14040/44 standard has been followed in this study to perform the LCA, and relative uncertainties have been identified by applying the pedigree matrix of uncertainty [29,30].

2.2. Functional Unit and System Boundary

The functional unit of this study is one cubic meter (1 m3) of conventional and geopolymer concrete. It is the reference unit to quantify the comparative performance of environmental impacts across different categories of products or processes [31]. All the components have been selected as per the design standard of a 20 MPa design mix. Climate change (kg CO2 equivalent) has been selected as the potential environmental impact for in-depth analysis due to its contribution to global warming [32]. Other impact categories, such as ozone depletion, acidification, eutrophication, and others, are also expressed to show the relevant changes.
The upstream chain of the production process, cradle-to-gate, has been selected as the system boundary of the materials [33]. The boundary includes the process of raw materials extraction, transportation, and manufacturing of the products, whereas cradle-to-grave includes the complete life cycle of extraction, transportation, manufacturing, operation, and disposal or recycling [34].

2.3. Life Cycle Inventory

The Australian life cycle inventory (AusLCI) has been used to quantify the associated production processes of the materials [35]. Primary data of the concrete design mix have been assessed from the batching plant and laboratory mix design, as mentioned in the methodology section. Secondary data on assessing the environmental impacts have been collected from the sequential production process of the Australian industry facilities. In some cases, the Ecoinvent version 2.2 database has been adopted in the AusLCI by substituting the input flows of the industrial production process [36]. The manufacturing process includes several steps of production, such as raw materials extraction, transportation, energy, and diesel consumption by machinery for production [37]. Occupation of land, transformation area, and use of roads and buildings are also included in the inventory. The LCA tool Simapro 9.4 shows the network of product manufacturing, including the variable steps of production. Some of the clearly visible network of the life cycle inventory for manufacturing a product has been shown in Table 2.

2.4. Sensitivity Analysis

A sensitivity analysis defines the uncertainties of the production system and identifies the feasible ranges of the possible outcomes [38]. The probabilistic outcomes of the production system identify how the allocation of a particular product influences the decision-making process [39]. Important parameters can be prioritized based on the uncertainty analysis. To address the associated uncertainties of the carbon footprint, the Monte Carlo simulation is a suitable tool to see the variations in outcome and correlation with individual inputs. The conjugated approach of applying Monte Carlo with the @RISK (Palisade Decision Tools, version 8.9.0) and SimaPro 9.4 identifies the possible input variations, correlations, and desirable outcomes for conventional and geopolymer concrete [40]. The simulation is performed over thousands of input iterations to obtain the probabilistic outcome for the carbon footprint. In this analysis, variations in data have resulted from a normal distribution of each design component, such as cement, fly ash, slag, alkaline solutions, and others. Primarily, the LCA tool SimaPro 9.4 defines the statistical indicators of these parameters, including the mean, standard deviation, coefficient of variation, and confidence interval, as shown in Table 3. Then, the @RISK Palisade decision tool further investigates the influential input by ranking and the Pearson correlation coefficient of the influential input.
Impact categories of the designed materials have been obtained by performing a simulation in SimaPro 9.4, as adopted by the AusLCI. The pedigree matrix determines the geological uncertainty of the products based on materials sourcing, regional production, temporal production, and others (the six criteria are outlined in ISO 14044) [41,42]. The main six criteria that are outlined in the ISO 14044 include the following: (1) Data reliability by experts (e.g., estimated vs. measured), (2) data completeness from sites (e.g., site-specific data), (3) temporal corrections between 3–15 years (e.g., age of obtaining data for relative operations), (4) geographical correlations from different areas (e.g., regional relevance of data source), (5) technological correlations from lab processes (e.g., maintain consistency with other established production system), and (6) uncertainty focusing on carbon and fine particle (PM10, PM2.5) emissions. The uncertainty (σ2) of these six identical factors was calculated by summing up all the variations, as shown in Equation (5).
σ 2 = n = 1 6 σ n 2
Statistical indicators and ranges of all possible outcomes, including a 95% confidence interval, are outlined in Table 3. It clearly indicates that sodium hydroxide (NaOH), superplasticizer, sodium silicate (Na2SiO3), and cement are the dominant factors for emissions with a higher mean and 95% confidence interval, whereas water has the lowest carbon footprint (e.g., 0.0010 kg CO2 eq per kg), with a higher CV of 31.88%. Even a minor variation in water treatment, distribution, and sourcing, such as municipal and groundwater, leads to a larger deviation in the smallest mean value. However, the higher CV does not reflect the higher uncertainty; rather, it is more variable and is an indicator of dividing the standard deviation (SD) by the mean.

3. Results

A life cycle impact assessment for the designed components was estimated using the most up-to-date version of ReCiPe 2016. Pré Consultants, RIVM, Leiden University, and Radboud University Nijmegen developed this impact assessment methodology for the design inputs of the products [43]. The eighteen (18) midpoint impact categories are as follows: (1) climate change, (2) ozone depletion, (3) terrestrial acidification, (4) freshwater eutrophication, (5) marine eutrophication, (6) human toxicity, (7) photochemical oxidant formation, (8) particulate matter formation, (9) terrestrial ecotoxicity, (10) freshwater ecotoxicity, (11) marine ecotoxicity, (12) ionizing radiation, (13) agricultural land occupation, (14) urban land occupation, (15) natural land transformation, (16) water depletion, (17) metal depletion, and (18) fossil depletion. This study considers the midpoint impact for these two types of concrete. Global warming potential (kg CO2 eq) has been prioritized for relevant uncertainties of concrete components.

3.1. Impact Assessment of Conventional Concrete

Life cycle assessment of 1 m3 of conventional concrete shows that cement is the primary contributor in the mix design, which accounts for 95% of the carbon footprint, which is 376.7 out of 397.6 kg CO2 eq, as shown in Table 4. Similarly, in the case of other impact categories, namely ozone depletion, acidification, eutrophication, human toxicity, ecotoxicity, and depletion of metals and fuel, the ranges of cement contribution lie between 80% and 90% of the total impacts. The primary cause lies in the cement industry’s impact, which involves the energy-intensive production of clinker and raw materials extraction. Compared to cement, minor environmental impacts are observed for gravel, sand, and water, respectively. The finding of this LCA highlights the importance of substituting cement with industrial by-products to reduce emissions. Geopolymer concrete provides this opportunity to reduce impacts. However, all the design components of geopolymer concrete need to be considered, reflecting real scenarios.

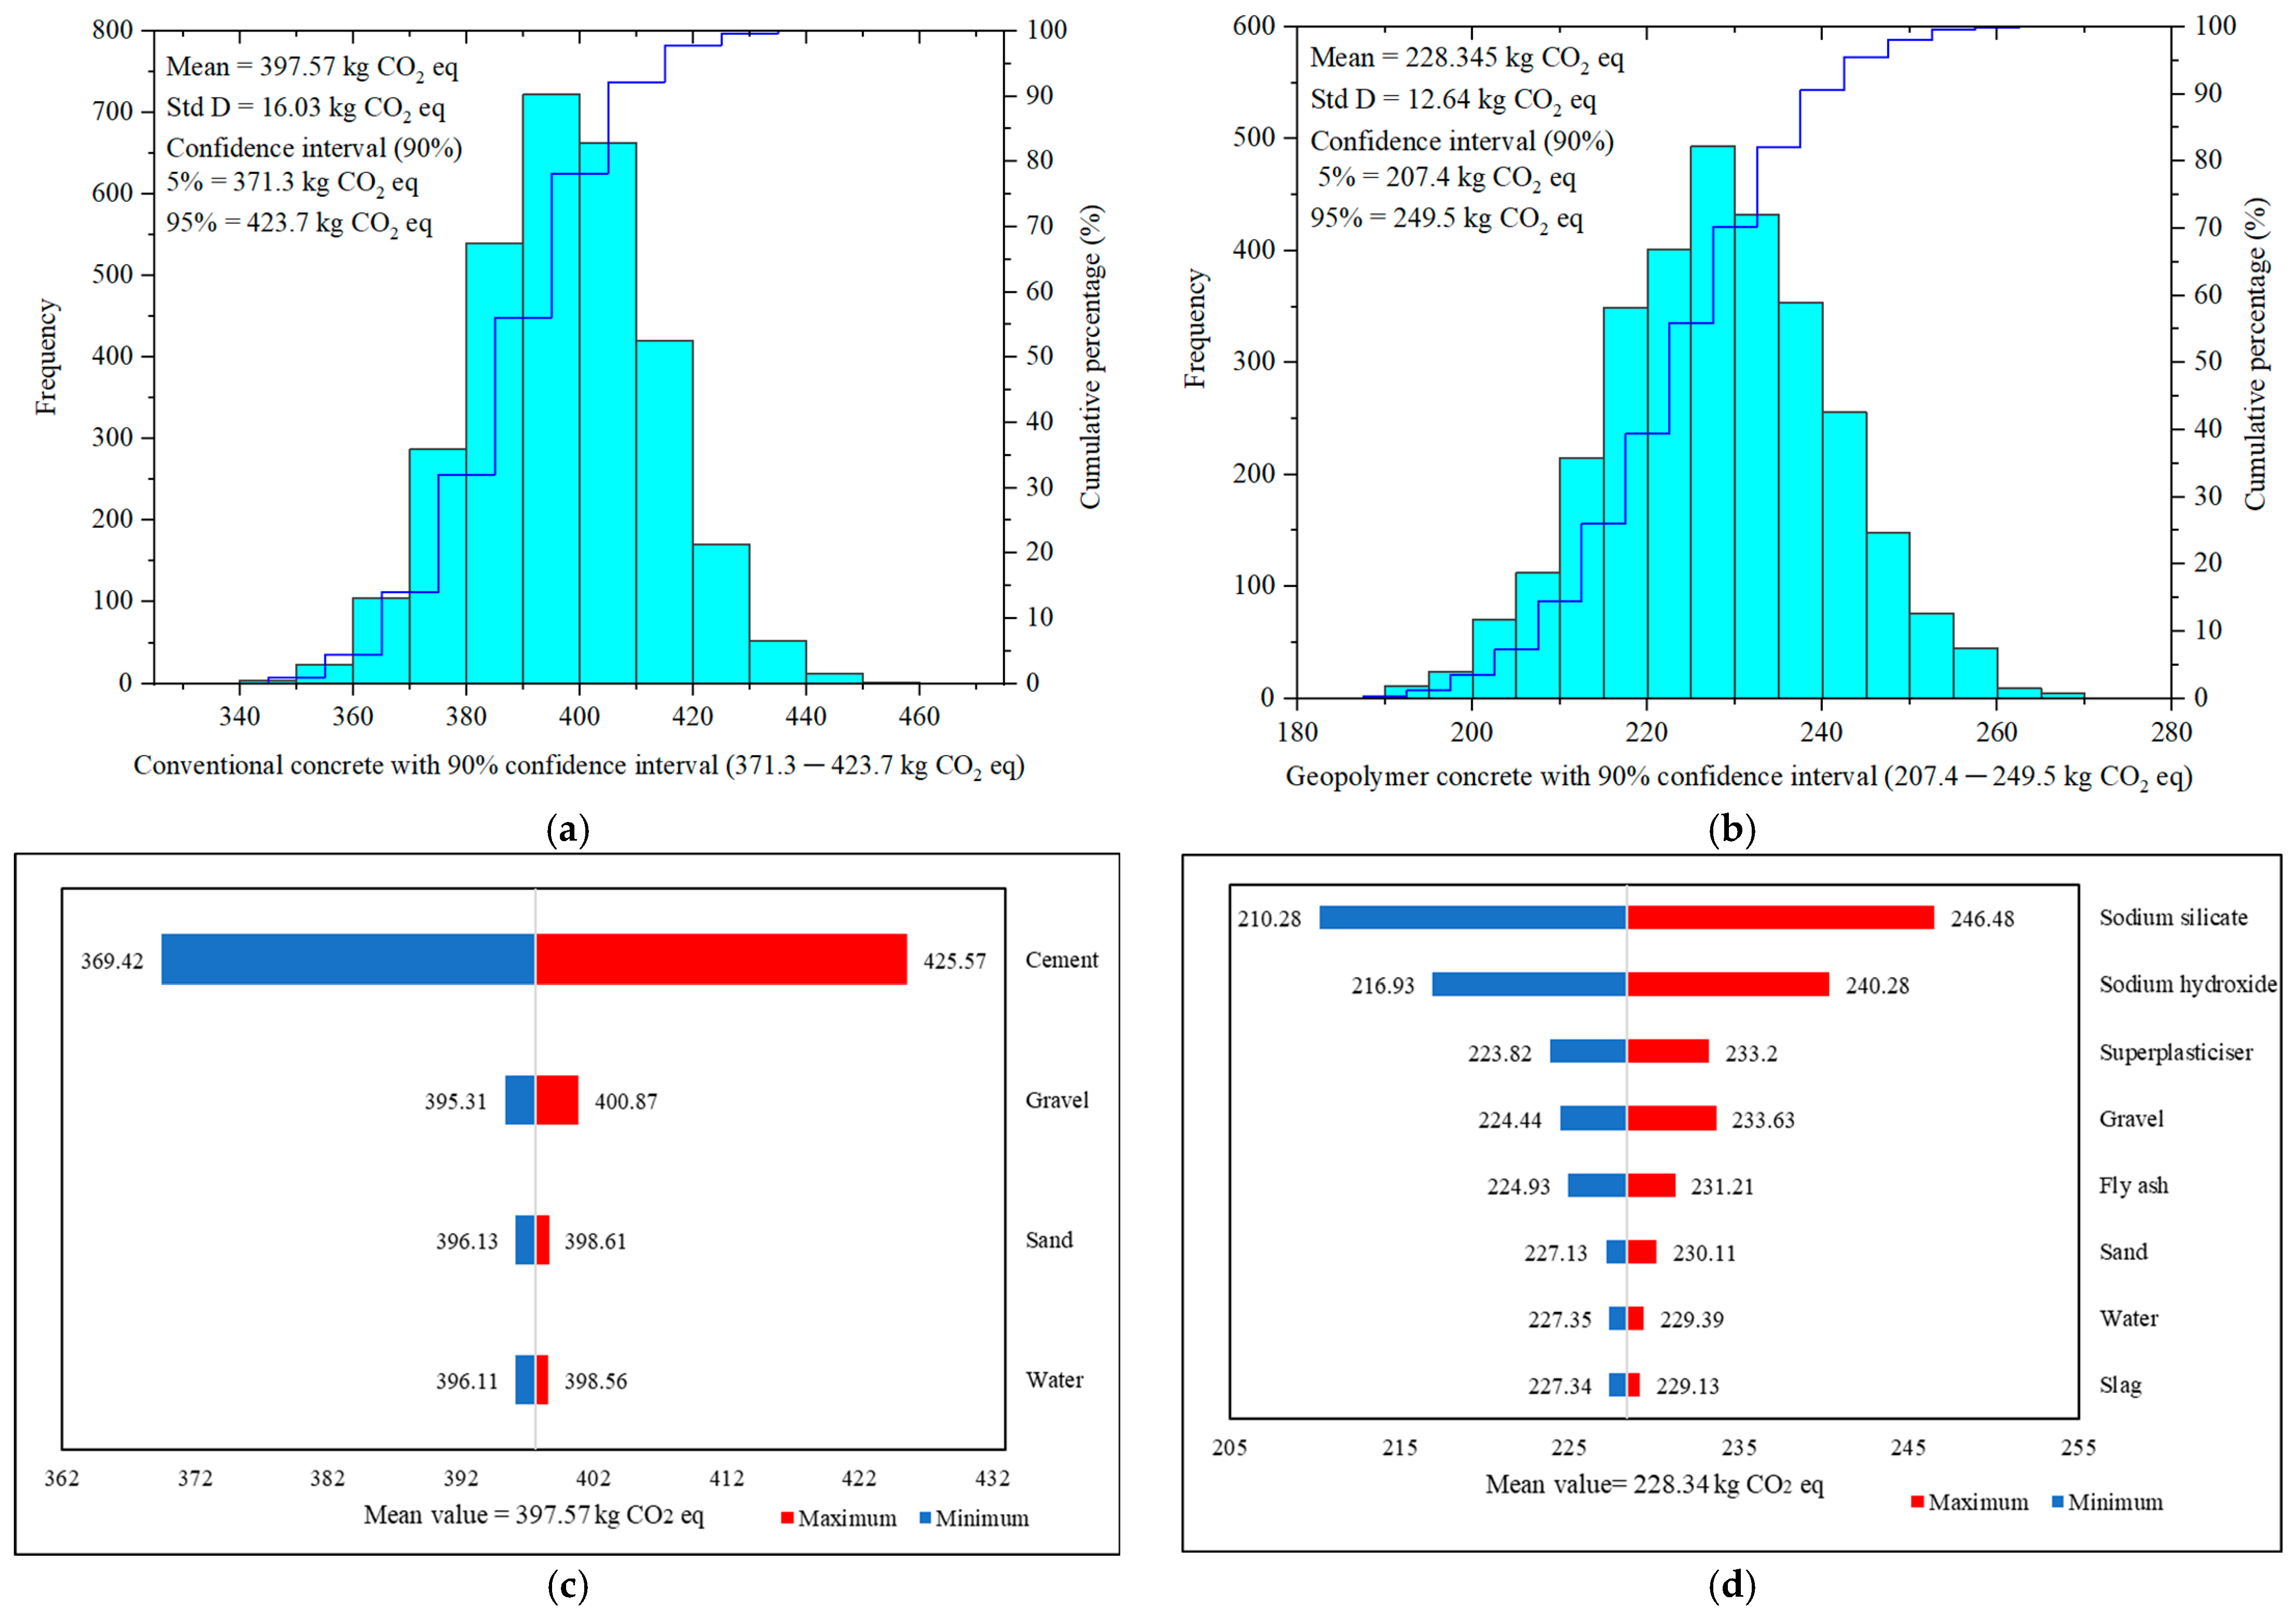
3.2. Comparative Assessment of Conventional and Geopolymer Concrete

A comparative analysis of the carbon footprint for two types of concrete reveals a significant advantage of geopolymer concrete over conventional concrete (397.57 kg CO2 eq) per cubic meter. Around a 43% reduction in carbon emissions is observed for manufacturing geopolymer concrete (228.34 kg CO2 eq), as shown in Table 5. Aligning with the findings of earlier conducted studies, a feasible range of carbon reduction between 30–60% has been observed for other studies [44,45,46]. However, the consecutive carbon footprint of NaOH and Na2SiO3 represents 74.71 and 100.66 kg CO2 eq, respectively, which is almost 77% of geopolymer emissions. The alternative binders, like fly ash and slag, combinedly generate 21.02 kg of carbon emissions, which is very low compared to the other chemicals. The 95% confidence interval of the traditional concrete represents a variation between 365.9–428.5 kg CO2 eq with a standard deviation (SD) of 16.03 and a small coefficient of variation (CV) of 4.03%. However, in the case of geopolymer concrete, it lies between 203.3 and 253.3 kg CO2 eq, even in the worst-case scenario. The results highlight the potential of geopolymer concrete as a sustainable solution over conventional concrete. However, it also emphasizes the environmental trade-off, focusing on the relevant uncertainty of applying the alkali solution as a chemical activator.

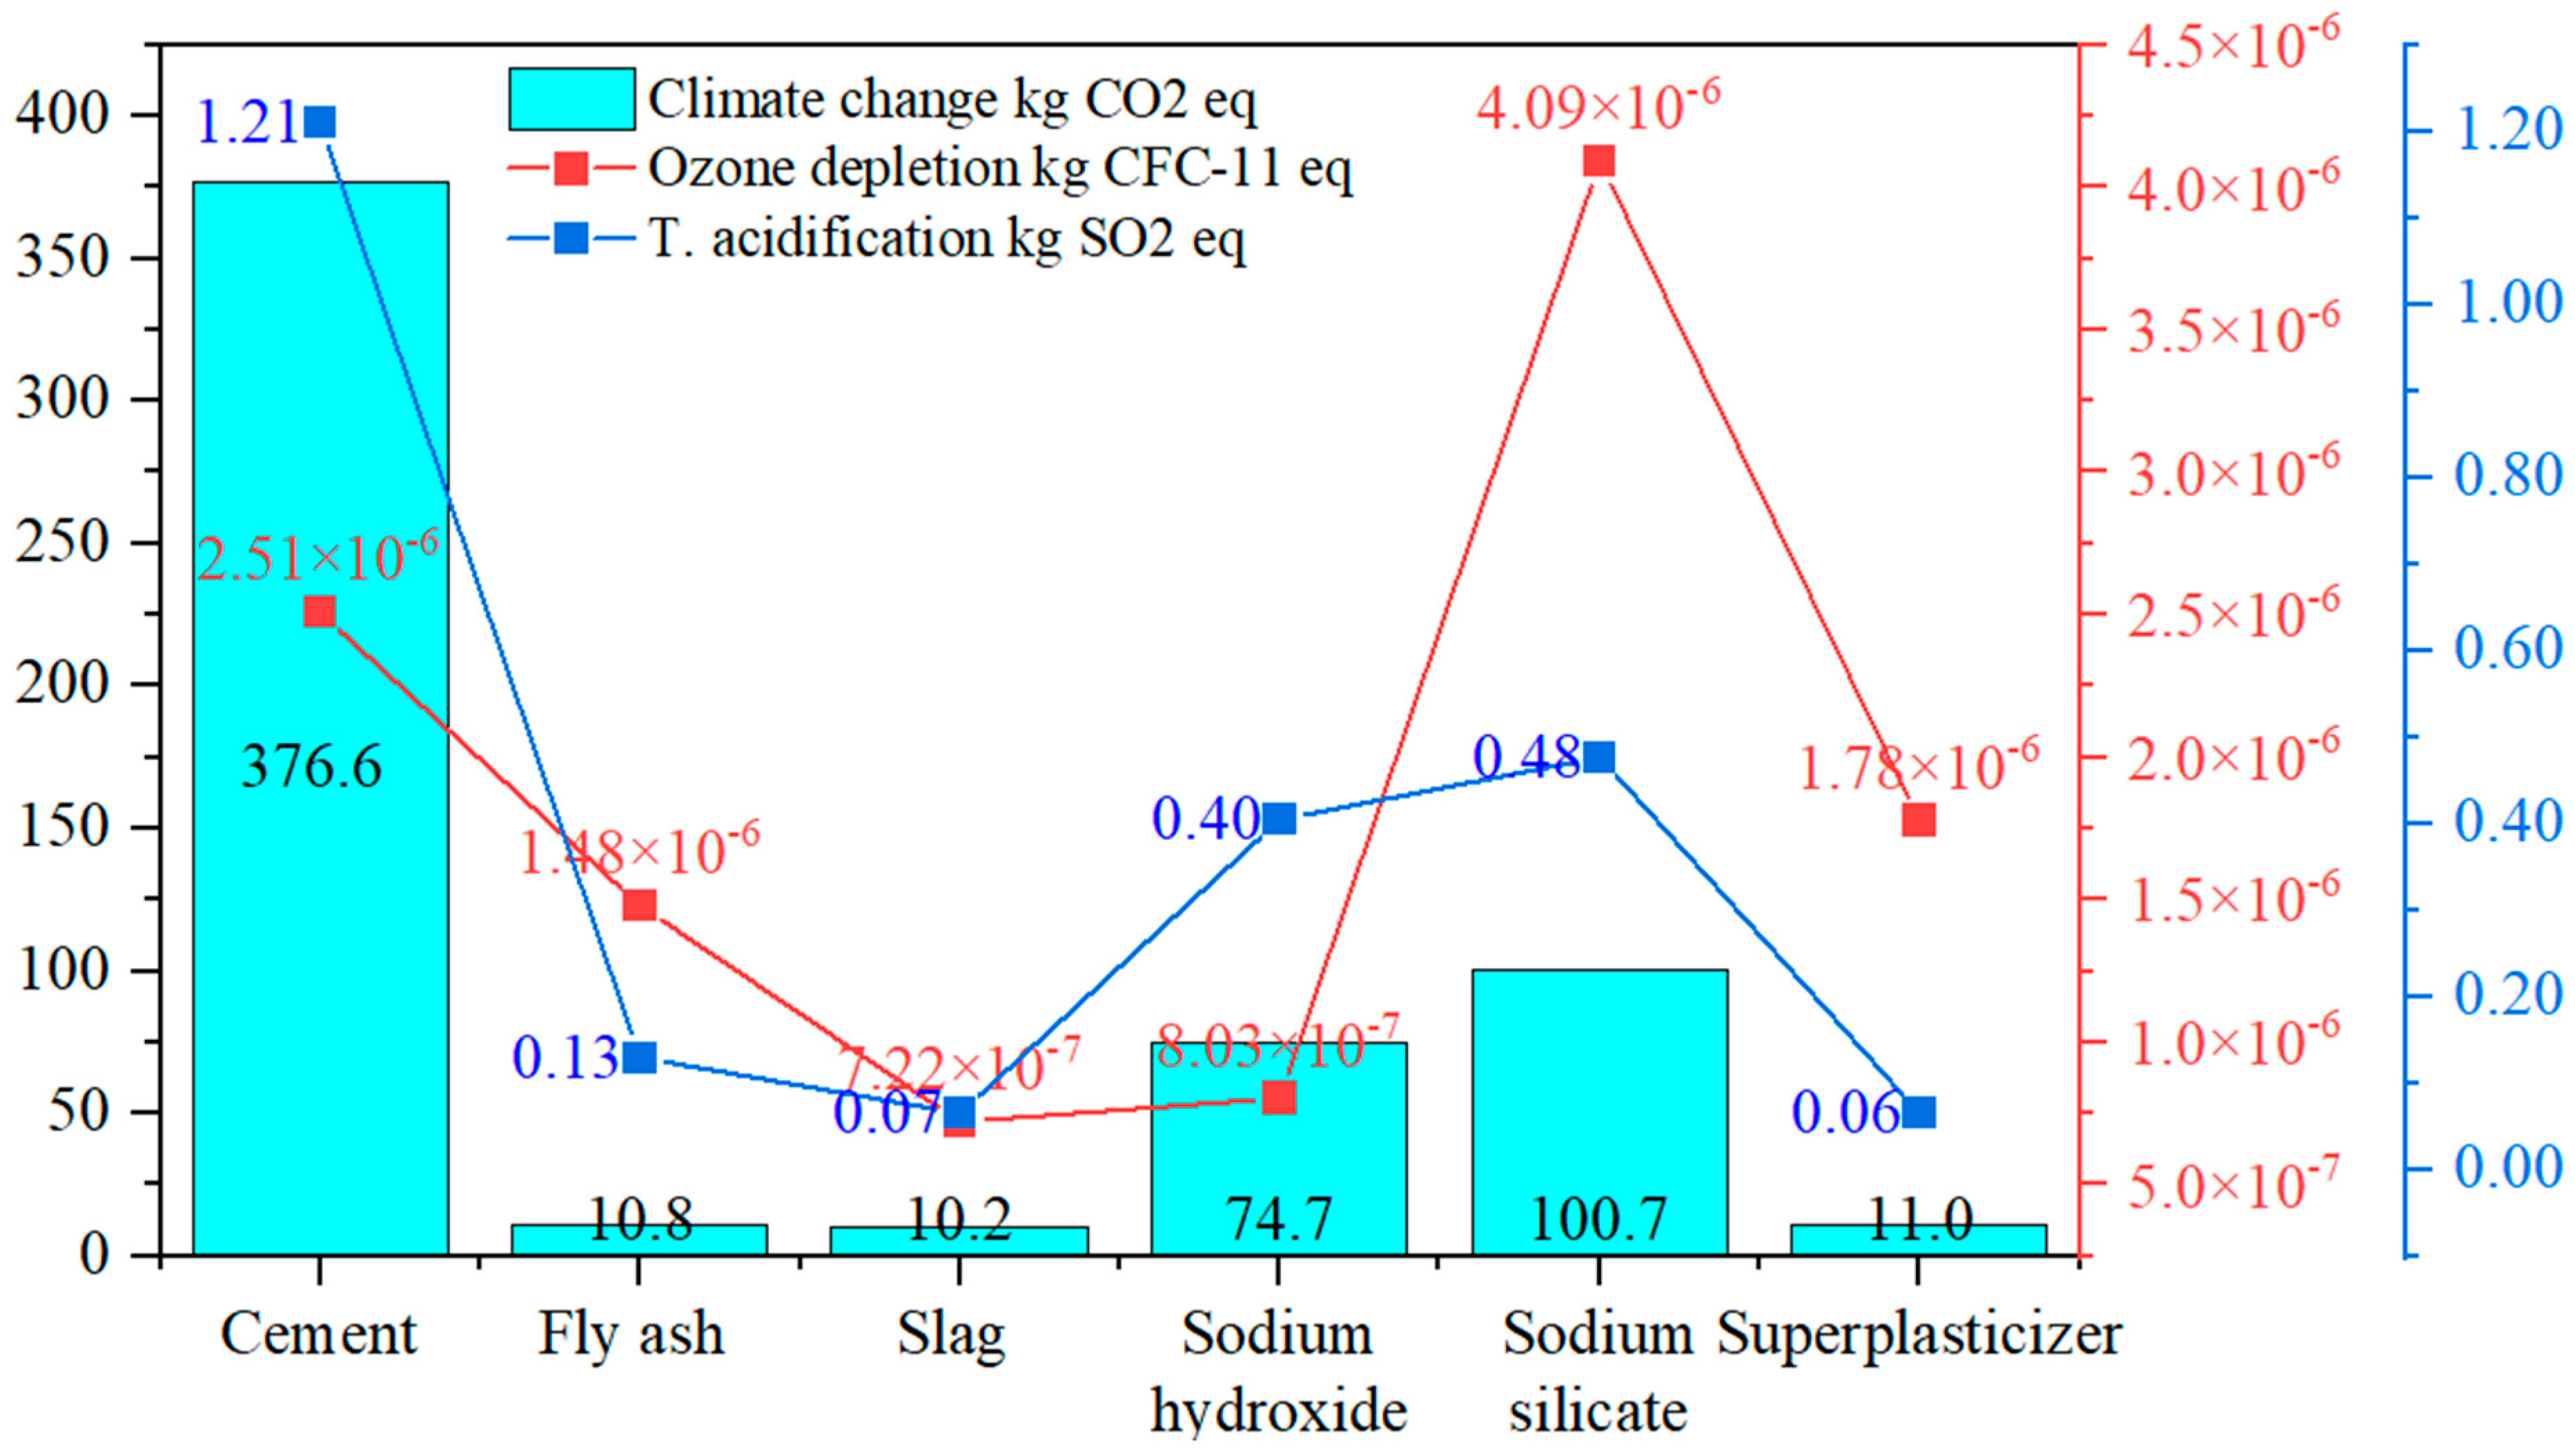
3.3. Impact Categories for Design Components

Chemical activators, like sodium hydroxide (NaOH) and sodium silicate (Na2SiO3), are the primary contributors to the carbon emissions in geopolymer concrete, as shown in Figure 2. The successive contributions of cement, NaOH, and Na2SiO3 represent carbon footprints of 376.6, 74.7, and 100.7 kg CO2 eq, respectively. Moreover, the ozone depletion potentials of Na2SiO3 (111 kg) and superplasticizer (8.34 kg) represent a higher amount of CFC emissions, namely 4.09 × 10⁻⁶ and 1.78 × 10⁻⁶, respectively. Similarly, NaOH and Na2SiO3 are significant contributors to acidification, representing 0.404 and 0.476 kg SO2 eq, respectively. Surprisingly, combinedly, they possess nearly the impacts of cement (1.21 kg SO2 eq), even with small amounts of 41 and 111 kg. The comprehensive LCA reveals that a notable amount of alkali activators may cause environmental degradation instead of bringing environmental benefits. These findings support earlier studies by highlighting the need for the careful management of chemical application for traditional concrete decarbonization [47,48]. Hence, the correlations and individual component distribution have been elaborated in terms of the environmental impacts and uncertainties associated with alternative binders and chemical activators.

3.4. Ranking of Inputs by Their Effect on the Probabilistic Distribution

Probabilistic distribution has been performed for conventional and geopolymer concrete to identify the influence of individual input parameters and to rank them according to their impacts, as shown in Figure 3. The sensitivity of chemical production shows that sodium hydroxide (NaOH) and sodium silicate (Na2SiO3) have a wider variation in carbon emissions, ranging from 210.28–246.48 and 216.93–240.28 kg CO2 eq, respectively. On the contrary, the deviation in carbon footprint is mostly related to the cement production, varying between 369.42–425.57 kg CO2 eq. A representation of the tornado plot reveals that all the chemical activators are on top of the carbon emissions, sequentially sodium silicate, sodium hydroxide, and superplasticizer. Hence, the findings emphasize the sensitivity of chemical activators in terms of quantities and emissions. A sustainable method of chemical production can be prioritized by using a source of renewable energy to minimize the impacts.

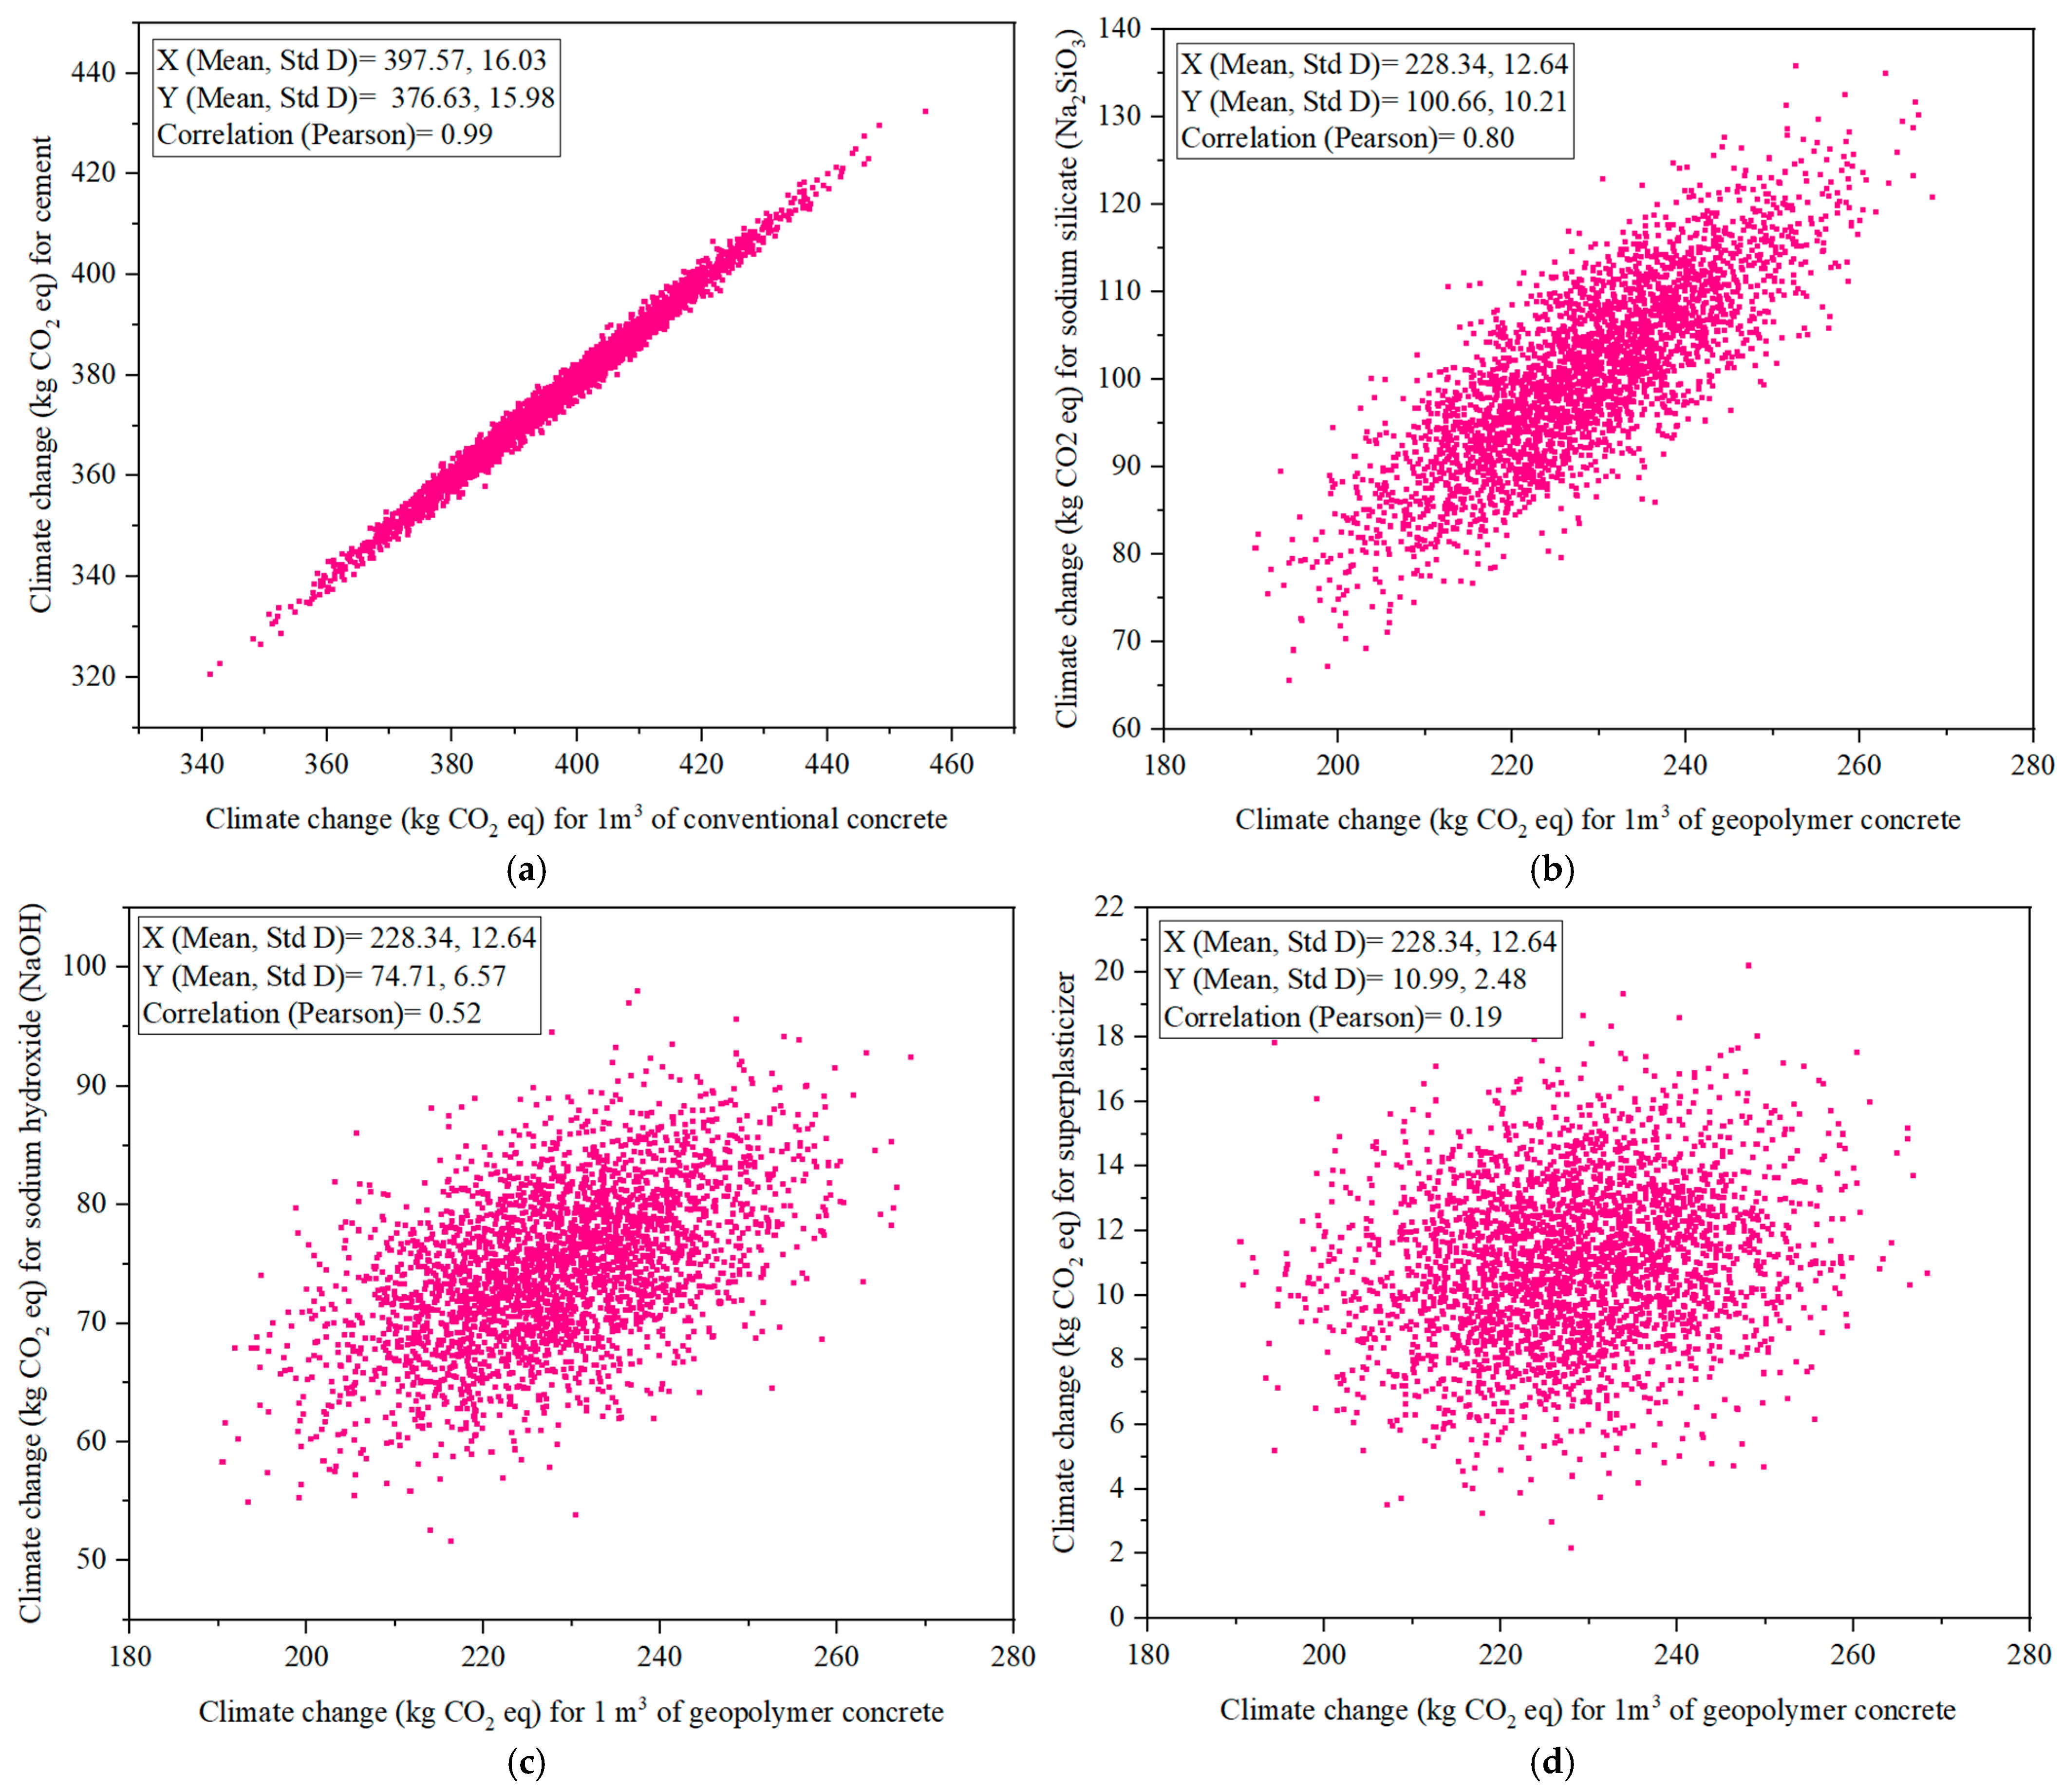
3.5. Correlation Coefficient of the Design Variable with the Carbon Footprint

Pearson’s correlation coefficient is an important statistical indicator to identify the possible association of individual design components with the estimated carbon footprint [49]. For conventional concrete, cement almost aligns with carbon emissions, indicating that a value of 0.99 means that substitute cement is the only feasible way of minimizing impacts. During their transformation into geopolymer concrete, sodium silicate (r = 0.80) followed by sodium hydroxide (r = 0.52) represent strong and moderate relationships with carbon footprint, as shown in Figure 4. However, a lower correlation value (r = 0.19) has been observed when using superplasticizer. The correlation analysis indicates that the shift from cement to the alkaline solution of NaOH and Na2SiO3 is very sensitive in the case of excessive use.

4. Discussion and Conclusions

This study conducts a comparative life cycle assessment to estimate the carbon footprint for conventional and geopolymer concrete. The findings of the LCA suggest replacing cement with industrial by-products, such as fly ash and slag, to minimize the carbon footprint of conventional concrete. Considering all the design components of geopolymer concrete, the assessment reveals that a reduction of 43% in carbon emissions is feasible when compared to the traditional approach. The substitution of cement with fly ash or slag is the key component of this significant reduction, where cement accounts for 95% carbon emissions. Therefore, the promising aspects of reducing the carbon footprint have been in alkali-activated geopolymer concrete without compromising the design strength have been considered.
However, the alkaline solution of sodium hydroxide (NaOH) and sodium silicate (Na2SiO3) combinedly contributes 77% of the total geopolymer carbon footprint. The impact categories of the individual design components show the successive contribution of cement, NaOH, and Na2SiO3, representing carbon footprint values of 376.6, 74.7, and 100.7 kg CO2 eq, respectively. Moreover, acidification (kg SO2 eq) and ozone depletion potential (CFC-11 eq) are relatively higher as per the weight of sodium hydroxide (41 kg) and sodium silicate (111 kg). For example, the acidification potential impacts of NaOH and Na2SiO3 have been noted as 0.404 and 0.476 kg SO2, respectively, close to the cement impact of 1.21 kg SO2. Despite being used in smaller quantities, substantial impacts have been observed across all categories. Hence, notable variations in chemical admixture may cause considerable environmental damage in addition to global warming. Therefore, the relative uncertainty of alkaline solutions is important when considering the possible variations in environmental impacts due to their excessive use.
The uncertainty analysis justifies the sensitivity of the individual chemical activators in geopolymer concrete using probabilistic distribution and correlation coefficients. Probabilistic distribution of ranked inputs shows a variation in the carbon footprint ranges from 210.28–246.48, 216.93–240.28, and 223.82–233.20 kg CO2 eq for Na2SiO3, NaOH, and superplasticizer, respectively. The distribution suggests the requirement for sustainable chemical manufacturing, and its small fluctuation in dosage may increase the impact categories significantly.
The Pearson correlation coefficient (r) emphasizes the relationship between carbon footprint and chemical activators. Alkaline solutions show a moderate and strong relationship with the alkaline solutions NaOH (r = 0.52) and Na2SiO3 (r = 0.80). The results highlight the dual challenges in designing sustainable concrete, where the formation of geopolymer concrete replaces cement, but the required alkaline solution is highly sensitive to environmental degradation. The full potential of geopolymer concrete can be unlocked through the decarbonization of alkaline production and shifting it to renewable energy-based sources.
Regional-specific environmental impact assessment using the AusLCI (Australian Life Cycle Inventory) ensures its relevance in the decision-making process. Australian energy mixes, industrial processes, and transportation are the basis of this calculation. However, the associated uncertainty factors of calculated emissions enhance their global acceptability and the overall generalization of the findings.

Author Contributions

Q.T.: Writing—original draft, Software, Methodology, Investigation, Formal analysis, Data curation, Conceptualization. M.A.B.: Writing—review and editing, Visualization, Validation, Supervision, Investigation, Conceptualization. Z.A.: Writing—review and editing, Resources, Project administration, Conceptualization. C.L.: Writing—review and editing, Validation, F.G.: Writing—review and editing, Validation. All authors have read and agreed to the published version of the manuscript.

Funding

The authors would like to acknowledge the financial and technical support of the School of Engineering and Technology, Central Queensland University, Southern Cross University, and RMIT University. The APC was covered by the author’s voucher discount code (bd2ce38f28b3350e).

Data Availability Statement

The data will be available from the corresponding author upon request.

Conflicts of Interest

The authors declare no conflicts of interest.

References

  1. Nejat, P.; Jomehzadeh, F.; Taheri, M.M.; Gohari, M.; Majid, M.Z.A. A global review of energy consumption, CO2 emissions and policy in the residential sector (with an overview of the top ten CO2 emitting countries). Renew. Sustain. Energy Rev. 2015, 43, 843–862. [Google Scholar] [CrossRef]
  2. Nuhu, S.; Ladan, S.; Muhammad, A.U.; Cao, A. Effects and control of chemical composition of clinker for cement production. Int. J. Control Sci. Eng. 2020, 10, 16–21. [Google Scholar]
  3. Andrew, R.M. Global CO2 emissions from cement production, 1928–2018. Earth Syst. Sci. Data 2019, 11, 1675–1710. [Google Scholar] [CrossRef]
  4. Benhelal, E.; Zahedi, G.; Shamsaei, E.; Bahadori, A. Global strategies and potentials to curb CO2 emissions in cement industry. J. Clean. Prod. 2013, 51, 142–161. [Google Scholar] [CrossRef]
  5. Kabeyi, M.J.B.; Olanrewaju, O.A. Sustainable energy transition for renewable and low carbon grid electricity generation and supply. Front. Energy Res. 2022, 9, 743114. [Google Scholar] [CrossRef]
  6. Ryu, G.S.; Lee, Y.B.; Koh, K.T.; Chung, Y.S. The mechanical properties of fly ash-based geopolymer concrete with alkaline activators. Constr. Build. Mater. 2013, 47, 409–418. [Google Scholar] [CrossRef]
  7. Prasittisopin, L. Power plant waste (fly ash, bottom ash, biomass ash) management for promoting circular economy in sustainable construction: Emerging economy context. Smart Sustain. Built Environ. 2024. [Google Scholar] [CrossRef]
  8. Snellings, R.; Suraneni, P.; Skibsted, J. Future and emerging supplementary cementitious materials. Cem. Concr. Res. 2023, 171, 107199. [Google Scholar] [CrossRef]
  9. Zhang, M.; Deskins, N.A.; Zhang, G.; Cygan, R.T.; Tao, M. Modeling the polymerization process for geopolymer synthesis through reactive molecular dynamics simulations. J. Phys. Chem. C 2018, 122, 6760–6773. [Google Scholar] [CrossRef]
  10. Arbi, K.; Nedeljkovic, M.; Zuo, Y.; Ye, G. A review on the durability of alkali-activated fly ash/slag systems: Advances, issues, and perspectives. Ind. Eng. Chem. Res. 2016, 55, 5439–5453. [Google Scholar] [CrossRef]
  11. Mendes, B.C.; Pedroti, L.G.; Vieira, C.M.F.; Marvila, M.; Azevedo, A.R.; De Carvalho, J.M.F.; Ribeiro, J.C.L. Application of eco-friendly alternative activators in alkali-activated materials: A review. J. Build. Eng. 2021, 35, 102010. [Google Scholar] [CrossRef]
  12. Song, Q.; Guo, M.-Z.; Ling, T.-C. A review of elevated-temperature properties of alternative binders: Supplementary cementitious materials and alkali-activated materials. Constr. Build. Mater. 2022, 341, 127894. [Google Scholar] [CrossRef]
  13. Gao, X.; Yuan, B.; Yu, Q.L.; Brouwers, H.J. Chemistry, design and application of hybrid alkali activated binders. In Cementitious Materials: Composition, Properties, Application; Walter de Gruyter GmbH: Berlin, Germany, 2017; pp. 253–284. [Google Scholar]
  14. Tushar, Q.; Bhuiyan, M.A.; Zhang, G.; Maqsood, T.; Tasmin, T. Application of a harmonized life cycle assessment method for supplementary cementitious materials in structural concrete. Constr. Build. Mater. 2022, 316, 125850. [Google Scholar] [CrossRef]
  15. Tushar, Q.; Santos, J.; Zhang, G.; Robert, D.; Giustozzi, F. Recycled used cooking oil (UCO) as a rejuvenator in high content reclaimed asphalt pavement (RAP) mixes: A life cycle assessment (LCA). Sci. Total Environ. 2025, 961, 178376. [Google Scholar] [CrossRef]
  16. Rafi, S.M.; Ambalal, B.; Rao, B.K.; Baseer, M.A. Analytical study on special concretes with M20 & M25 grades for construction. Int. J. Curr. Eng. Technol. 2014, 2, 338–343. [Google Scholar]
  17. Davidovits, J. Geopolymer Chemistry and Applications; Geopolymer Institute: Saint-Quentin, France, 2008. [Google Scholar]
  18. Ali, B. Evaluation of Alkali-Activated Mortar Incorporating Combined and Uncombined Fly Ash and GGBS Enhanced with Nano Alumina. Civ. Eng. J. 2024, 10, 902–914. [Google Scholar] [CrossRef]
  19. Nath, P.; Sarker, P.K. Effect of GGBFS on setting, workability and early strength properties of fly ash geopolymer concrete cured in ambient condition. Constr. Build. Mater. 2014, 66, 163–171. [Google Scholar] [CrossRef]
  20. Ye, H.; Radlińska, A. Fly ash-slag interaction during alkaline activation: Influence of activators on phase assemblage and microstructure formation. Constr. Build. Mater. 2016, 122, 594–606. [Google Scholar] [CrossRef]
  21. Alaneme, G.U.; Olonade, K.A.; Esenogho, E.; Lawan, M.M. Proposed simplified methodological approach for designing geopolymer concrete mixtures. Sci. Rep. 2024, 14, 15191. [Google Scholar] [CrossRef]
  22. Wardhono, A. Comparison study of class F and class C fly ashes as cement replacement material on strength development of non-cement mortar. In IOP Conference Series: Materials Science and Engineering; IOP Publishing: Bristol, UK, 2018. [Google Scholar]
  23. Woszuk, A.; Bandura, L.; Franus, W. Fly ash as low cost and environmentally friendly filler and its effect on the properties of mix asphalt. J. Clean. Prod. 2019, 235, 493–502. [Google Scholar] [CrossRef]
  24. Cheah, C.B.; Tiong, L.L.; Ng, E.P.; Oo, C.W. The engineering performance of concrete containing high volume of ground granulated blast furnace slag and pulverized fly ash with polycarboxylate-based superplasticizer. Constr. Build. Mater. 2019, 202, 909–921. [Google Scholar] [CrossRef]
  25. Zhao, H.; Sun, W.; Wu, X.; Gao, B. The properties of the self-compacting concrete with fly ash and ground granulated blast furnace slag mineral admixtures. J. Clean. Prod. 2015, 95, 66–74. [Google Scholar] [CrossRef]
  26. Ghafoor, M.T.; Khan, Q.S.; Qazi, A.U.; Sheikh, M.N.; Hadi, M. Influence of alkaline activators on the mechanical properties of fly ash based geopolymer concrete cured at ambient temperature. Constr. Build. Mater. 2021, 273, 121752. [Google Scholar] [CrossRef]
  27. Hameed, A.; Rasool, A.M.; Ibrahim, Y.E.; Afzal, M.F.U.D.; Qazi, A.U.; Hameed, I. Utilization of fly ash as a viscosity-modifying agent to produce cost-effective, self-compacting concrete: A sustainable solution. Sustainability 2022, 14, 11559. [Google Scholar] [CrossRef]
  28. Awoyera, P.O.; Adesina, A.; Gobinath, R. Role of recycling fine materials as filler for improving performance of concrete-a review. Aust. J. Civ. Eng. 2019, 17, 85–95. [Google Scholar] [CrossRef]
  29. Finkbeiner, M.; Inaba, A.; Tan, R.; Christiansen, K.; Klüppel, H.-J. The new international standards for life cycle assessment: ISO 14040 and ISO 14044. Int. J. Life Cycle Assess. 2006, 11, 80–85. [Google Scholar] [CrossRef]
  30. Tan, E.C.; Tu, Q.; Martins, A.A.; Yao, Y.; Sunol, A.; Smith, R.L. Uncertainty in inventories for life cycle assessment: State-of-the-art, challenges, and new technologies. Environ. Prog. Sustain. Energy 2025, e14644. [Google Scholar] [CrossRef]
  31. Weidema, B.; Wenzel, H.; Petersen, C.; Hansen, K. The product, functional unit and reference flows in LCA. Environ. News 2004, 70, 1–46. [Google Scholar]
  32. Tushar, Q.; Zhang, G.; Giustozzi, F.; Bhuiyan, M.A.; Hou, L.; Navaratnam, S. An integrated financial and environmental evaluation framework to optimize residential photovoltaic solar systems in Australia from recession uncertainties. J. Environ. Manag. 2023, 346, 119002. [Google Scholar] [CrossRef]
  33. Tait, M.W.; Cheung, W.M. A comparative cradle-to-gate life cycle assessment of three concrete mix designs. Int. J. Life Cycle Assess. 2016, 21, 847–860. [Google Scholar] [CrossRef]
  34. Ahmed, B.; Rana, M.M.; Nguyen, H.T. Life cycle assessment of construction materials: Cradle-to-Gate and Cradle-to-Grave approach. J. Sustain. Constr. Eng. Proj. Manag 2019, 2, 1–9. [Google Scholar]
  35. Grant, T. AusLCI Database Manual; Australian Life Cycle Assessment Society (ALCAS): Melbourne, Australia, 2016. [Google Scholar]
  36. Grant, T.; Eady, S.; Cruypenninck, H.; Simmons, A. AusLCI Methodology for Developing Life Cycle Inventory for Australian Agriculture; Lifecycles: Melbourne, Australia, 2019. [Google Scholar]
  37. Pehlken, A.; Decker, A.; Kottowski, C.; Kirchner, A.; Thoben, K.-D. Energy efficiency in processing of natural raw materials under consideration of uncertainties. J. Clean. Prod. 2015, 106, 351–363. [Google Scholar] [CrossRef]
  38. Rosenbaum, R.K.; Georgiadis, S.; Fantke, P. Uncertainty management and sensitivity analysis. In Life Cycle Assessment: Theory and Practice; Springer: Cham, Switzerland, 2017; pp. 271–321. [Google Scholar]
  39. Paxton, P.; Curran, P.J.; Bollen, K.A.; Kirby, J.; Chen, F. Monte Carlo experiments: Design and implementation. Struct. Equ. Model. 2001, 8, 287–312. [Google Scholar] [CrossRef]
  40. Tushar, Q.; Bhuiyan, M.; Zhang, G.; Sandanayake, M. Correlation of Building Parameters with Energy Reduction. In Proceedings of the 2018 5th Asia-Pacific World Congress on Computer Science and Engineering (APWC on CSE), Nadi, Fiji, 10–12 December 2018; pp. 116–120. [Google Scholar]
  41. Lewis, A. Comparative Assessment of the Environmental Footprint of Infant Formula Packaging Containers: A Cradle-to-Gate Plus End-of-Life LCA Using Full and Streamlined Software. Master’ Thesis, Michigan State University, East Lansing, MI, USA, 2023. [Google Scholar]
  42. Spreafico, C.; Landi, D.; Russo, D. A new method of patent analysis to support prospective life cycle assessment of eco-design solutions. Sustain. Prod. Consum. 2023, 38, 241–251. [Google Scholar] [CrossRef]
  43. Huijbregts, M.A.; Steinmann, Z.J.; Elshout, P.M.; Stam, G.; Verones, F.; Vieira, M.D.; Hollander, A.; Zijp, M.; Van Zelm, R. ReCiPe 2016: A harmonized life cycle impact assessment method at midpoint and endpoint level Report I: Characterization. RIVM Rep. 2016, 22, 138–147. [Google Scholar]
  44. Chen, G.; Zheng, D.-P.; Chen, Y.-W.; Lin, J.-X.; Lao, W.-J.; Guo, Y.-C.; Chen, Z.-B.; Lan, X.-W. Development of high performance geopolymer concrete with waste rubber and recycle steel fiber: A study on compressive behavior, carbon emissions and economical performance. Constr. Build. Mater. 2023, 393, 131988. [Google Scholar] [CrossRef]
  45. Shayan, A.; Xu, A.; Andrews-Phaedonos, F. Field applications of geopolymer concrete: A measure towards reducing carbon dioxide emission. Concr. Aust. 2013, 39, 34–44. [Google Scholar]
  46. Das, S.; Saha, P.; Jena, S.P.; Panda, P. Geopolymer concrete: Sustainable green concrete for reduced greenhouse gas emission–A review. Mater. Today Proc. 2022, 60, 62–71. [Google Scholar] [CrossRef]
  47. Zannerni, G.M.; Fattah, K.P.; Al-Tamimi, A.K. Ambient-cured geopolymer concrete with single alkali activator. Sustain. Mater. Technol. 2020, 23, e00131. [Google Scholar] [CrossRef]
  48. Raza, M.H.; Khan, M.; Zhong, R.Y. Investigating the impact of alkaline activator on the sustainability potential of geopolymer and alternative hybrid materials. Mater. Today Sustain. 2024, 26, 100742. [Google Scholar] [CrossRef]
  49. Obilor, E.I.; Amadi, E.C. Test for significance of Pearson’s correlation coefficient. Int. J. Innov. Math. Stat. Energy Policies 2018, 6, 11–23. [Google Scholar]
Figure 1. Methodological framework for conducting LCA of conventional and geopolymer concrete.
Carbon 11 00055 g001
Figure 2. Impact categories across individual design components.
Carbon 11 00055 g002
Figure 3. Inputs rank the design components by the allocated probabilistic distribution. (a) Output distribution of conventional concrete. (b) Output distribution of geopolymer concrete. (c) Inputs ranked for conventional concrete. (d) Inputs ranked for geopolymer concrete.
Carbon 11 00055 g003
Figure 4. Correlations of carbon footprints with cement and chemical activators. (a) Correlation of carbon footprint with cement, (b) Correlation of carbon footprint with sodium silicate, (c) Correlation of carbon footprint with sodium hydroxide, and (d) Correlation of carbon footprint with superplasticizer.
Carbon 11 00055 g004
Table 1. Design and proportions of conventional and geopolymer concrete for 1 m3 of concrete.
NoDesign ComponentsDensity
(kg/m3)
Quantity (kg)Percentage of Total Mass (%)
Conventional concrete
1Cement144041815.05%
2Fine aggregate (sand)160068824.77%
3Coarse aggregate (gravel)1700146252.64%
4Water10002097.52%
Total mass 2777100%
Geopolymer concrete
1Fly ash (Class F)105038912.56%
2Slag (GGBFS)11001675.39%
3Fine aggregate (sand)160068822.22%
4Coarse aggregate (gravel)1700146247.23%
5Water10002297.39%
6Sodium hydroxide (NaOH)480411.32% (12 M solution)
7Sodium silicate (Na2SiO3)14001113.58 %
8Superplasticizer11308.341.5% of the binder
Total mass 3087100%
Table 2. Life cycle inventory for design components.
Inputs for Emissions FactorsQuantityUnit
Ordinary Portland Cement (OPC)1 kgKilogram
Limestone-milled1.4 kgKilogram
Transport truck—28 t fleet0.429 tkmTon–kilometer
Electricity—low voltage0.633 MJMegajoule
Energy from coal1.34 MJMegajoule
Energy from natural gas2.54 MJMegajoule
Gravel, crushed at the mine1 kgKilogram
Diesel is burned in the machine0.0161 MJMegajoule
Building hall—steel construction3 × 10−6 m2Square meter
Electricity—medium voltage0.0332 MJMegajoule
Heat—light fuel oil0.00492 MJMegajoule
Sand, at mine1 kgKilogram
Energy from diesel0.025 MJMegajoule
Energy from natural gas0.018 MJMegajoule
Fly ash from the stove1 kgKilogram
Transport lorry—20-to-28 ton0.0683 tkmTon–kilometer
Natural gas is burned in a furnace0.05 MJMegajoule
Low-voltage electricity at grid0.000606 MJMegajoule
Ground granulated blast furnace slag1 kgKilogram
Aluminum primary ingot0.000566 kgKilogram
Steel unalloyed market0.00386 kgKilogram
Sinter iron market0.0174 kgKilogram
Electricity—medium voltage0.0393 MJMegajoule
Sodium hydroxide 12 M (membrane cell)1 kgKilogram
Sodium chloride—powder0.854 kgKilogram
Electricity—medium voltage6.13 MJMegajoule
Sodium silicate (furnace process)1 kgKilogram
Soda powder0.403 kgKilogram
Electricity—medium voltage0.551 MJMegajoule
Heat—heavy fuel oil in the furnace2.25 MJMegajoule
Heat—natural gas2.22 MJMegajoule
Superplasticizer1 kgKilogram
Chemical (organic)0.649 kgKilogram
Sodium hydroxide without water0.125 kgKilogram
Electricity—medium voltage2.05 MJMegajoule
Water use1 kgKilogram
Electricity—low voltage0.00313 MJMegajoule
Ozone—liquid at plant3.33 × 10−6 kgKilogram
Water works1.19 × 10−11 pProcess
Note: Gray colour indicates the production of 1 kg (Kilogram) main design components such as Ordinary Portland Cement (OPC), Gravel, Fly ash, Ground granulated blast furnace slag, Sodium hydroxide, Sodium silicate, Superplasticizer, and Water. Required components and energy consumption have been added below to produce the main design component.
Table 3. Sensitivity indicators (kg CO2 eq) per unit of individual design components.
Design
Components
Impact
Unit
Statistical Indicators for Per Unit (kg)95% Confidence Interval
MeanMedianSDCV (%)2.5%97.5%
Cementkg CO2 eq0.90100.89690.03824.24410.83240.9839
Sandkg CO2 eq0.00310.00310.000310.39860.00250.0038
Gravelkg CO2 eq0.01270.01270.00118.90700.01070.0150
Waterkg CO2 eq0.00100.00090.000331.87650.00050.0017
Fly ashkg CO2 eq0.02770.02750.003311.78020.02220.0354
Slagkg CO2 eq0.06130.06100.00457.37720.05400.0714
NaOHkg CO2 eq1.82241.81700.16038.79561.51202.1630
Na2SiO3kg CO2 eq0.90680.88940.092110.15590.78061.1589
Superplasticiserkg CO2 eq1.31781.27110.297622.58710.86012.0422
Table 4. Impact assessment of one cubic meter (1 m3) of conventional concrete.
Impact CategoryUnitCementSandGravelWaterTotal
Climate changekg CO2 eq376.6372.14618.5870.202397.570
Ozone. Dkg CFC-11 eq2.5 × 10−62.3 × 10−104.7 × 10−71.0 × 10−93.0 × 10⁻⁶
T. acidificationkg SO2 eq1.2140.0130.1080.0011.335
F. eutrophicationkg P eq1.2 × 10−34.2 × 10−73.3 × 10−42.7 × 10−61.5 × 10−3
M. eutrophicationkg N eq4.3 × 10−28.0 × 10−43.1 × 10−32.4 × 10−54.7 × 10−2
Human toxicitykg 1,4-DB eq8.0890.8100.9200.0119.830
Photochem. OFkg NMVOC1.1630.0220.0780.0011.263
Particulate. MFkg PM10 eq4.4 × 10−14.8 × 10−33.7 × 10−23.2 × 10−44.8 × 10−1
T. ecotoxicitykg 1,4-DB eq3.1 × 10−32.5 × 10−66.5 × 10−41.2 × 10−53.7 × 10−3
F. ecotoxicitykg 1,4-DB eq4.1 × 10−26.7 × 10−36.7 × 10−34.1 × 10−45.5 × 10−2
M. ecotoxicitykg 1,4-DB eq6.3 × 10−26.7 × 10−39.7 × 10−31.2 × 10−48.0 × 10−2
Ionizing radiationkBq U235 eq9.0 × 10−33.9 × 10−66.4 × 10−31.8 × 10−51.5 × 10−2
Agricultural. LOm2a1.7610.0010.5750.0512.388
Urban. LOm2a3.3990.0011.2700.0114.681
Natural land. Tm29.3 × 10−32.9 × 10−62.2 × 10−21.8 × 10−53.1 × 10−2
Water depletionm37.6831.3762.0610.23711.357
Metal depletionkg Fe eq5.2260.0011.8250.0077.059
Fossil depletionkg oil eq65.8440.7935.0530.05071.740
Table 5. Uncertainty analysis of carbon footprint for conventional and geopolymer concrete components.
Design Components Statistical Indicators (kg CO2 eq)95% Confidence Interval
QuantityMeanMedianSDCV2.5%97.5%
1Cement418376.637374.91415.9854.264347.962411.265
2Sand6882.1462.1390.22310.4331.7272.647
3Gravel146218.58718.5061.6558.94615.60021.958
4Water2090.2020.1920.06433.5110.1080.359
Conventional concrete (Output)397.570395.75016.034.031365.9428.5
1Fly ash38910.78010.6821.27011.8888.65213.788
2Slag16710.24310.1810.7567.4239.01311.925
3Sand6882.1462.1390.22310.4331.7272.647
4Gravel146218.58718.5061.6558.94615.60021.958
5Water2290.2210.2100.07033.5110.1190.394
6NaOH4174.71874.4986.5728.82261.99488.681
7Na2SiO3111100.6698.7310.2210.1586.65128.64
8Superplasticizer8.3410.99010.6012.48223.4177.17317.032
Geopolymer concrete (Output)228.34228.2112.645.535203.3253.2
Disclaimer/Publisher’s Note: The statements, opinions and data contained in all publications are solely those of the individual author(s) and contributor(s) and not of MDPI and/or the editor(s). MDPI and/or the editor(s) disclaim responsibility for any injury to people or property resulting from any ideas, methods, instructions or products referred to in the content.

