
Diffusion of C-O-H Fluids in a Sub-Nanometer Pore Network: Role of Pore Surface Area and Its Ratio with Pore Volume


Abstract
1. Introduction
2. Materials and Methods
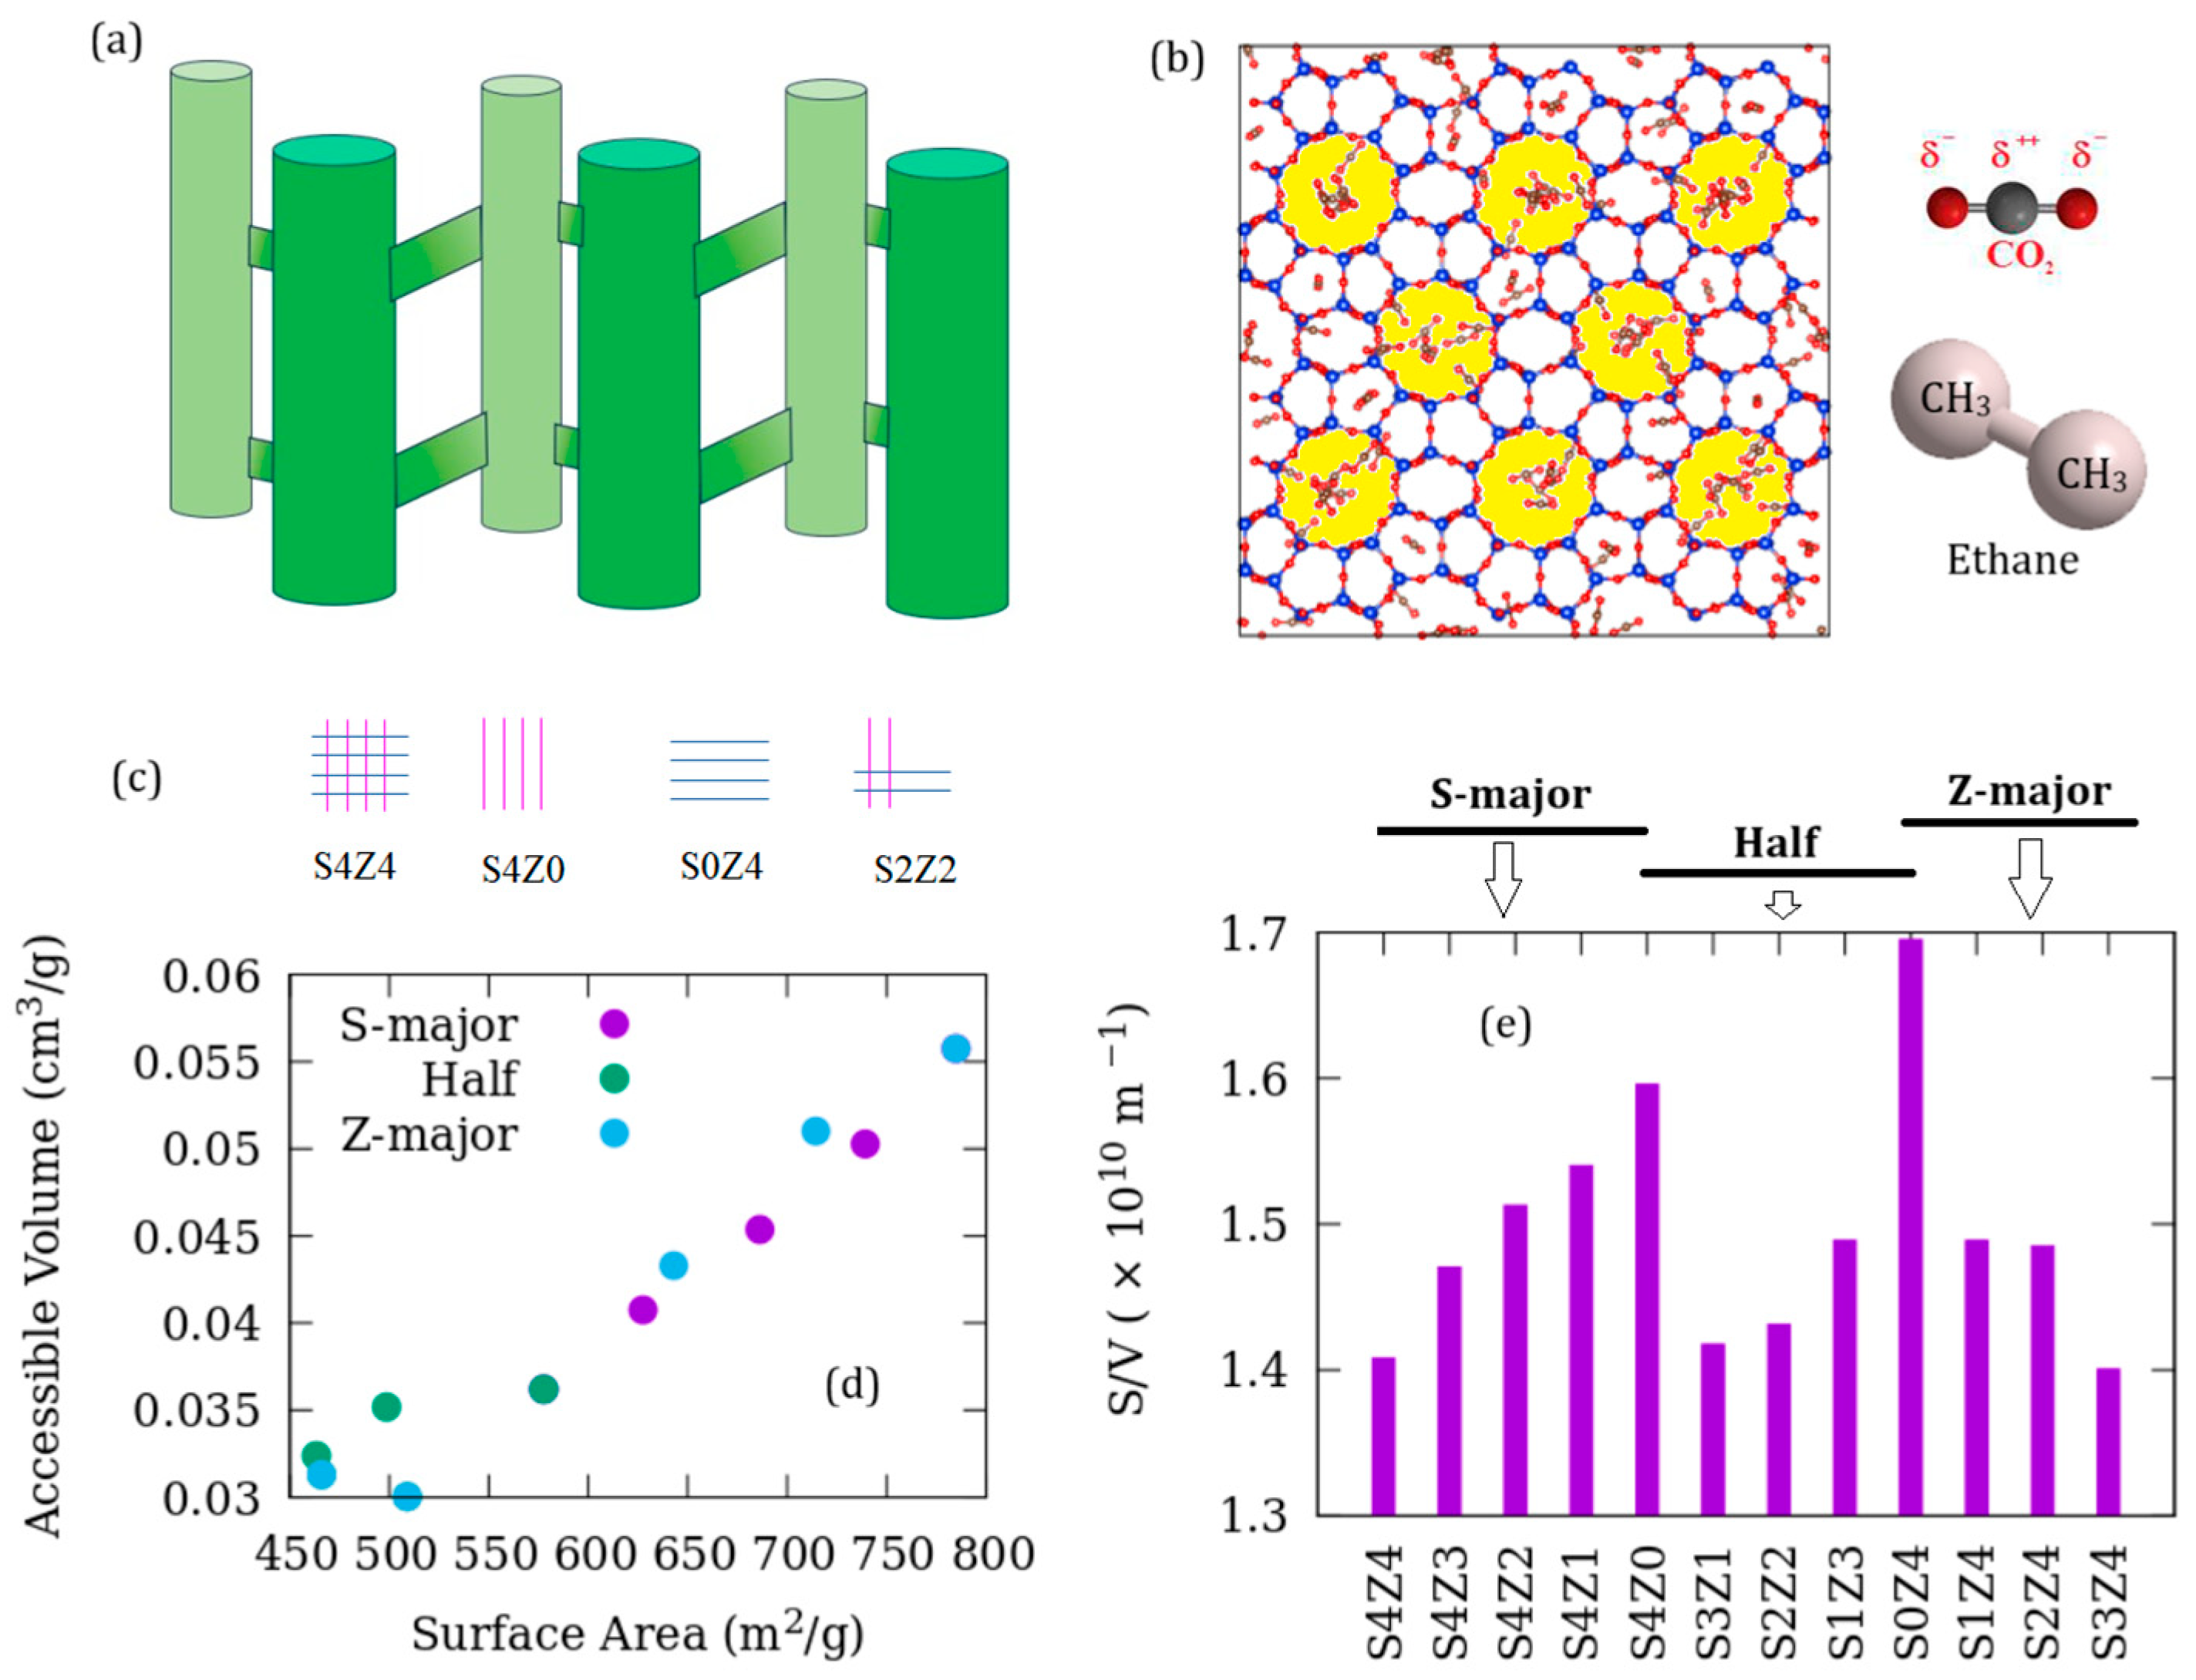
2.1. Adsorbent Models
2.2. Force-Fields
2.3. Simulations
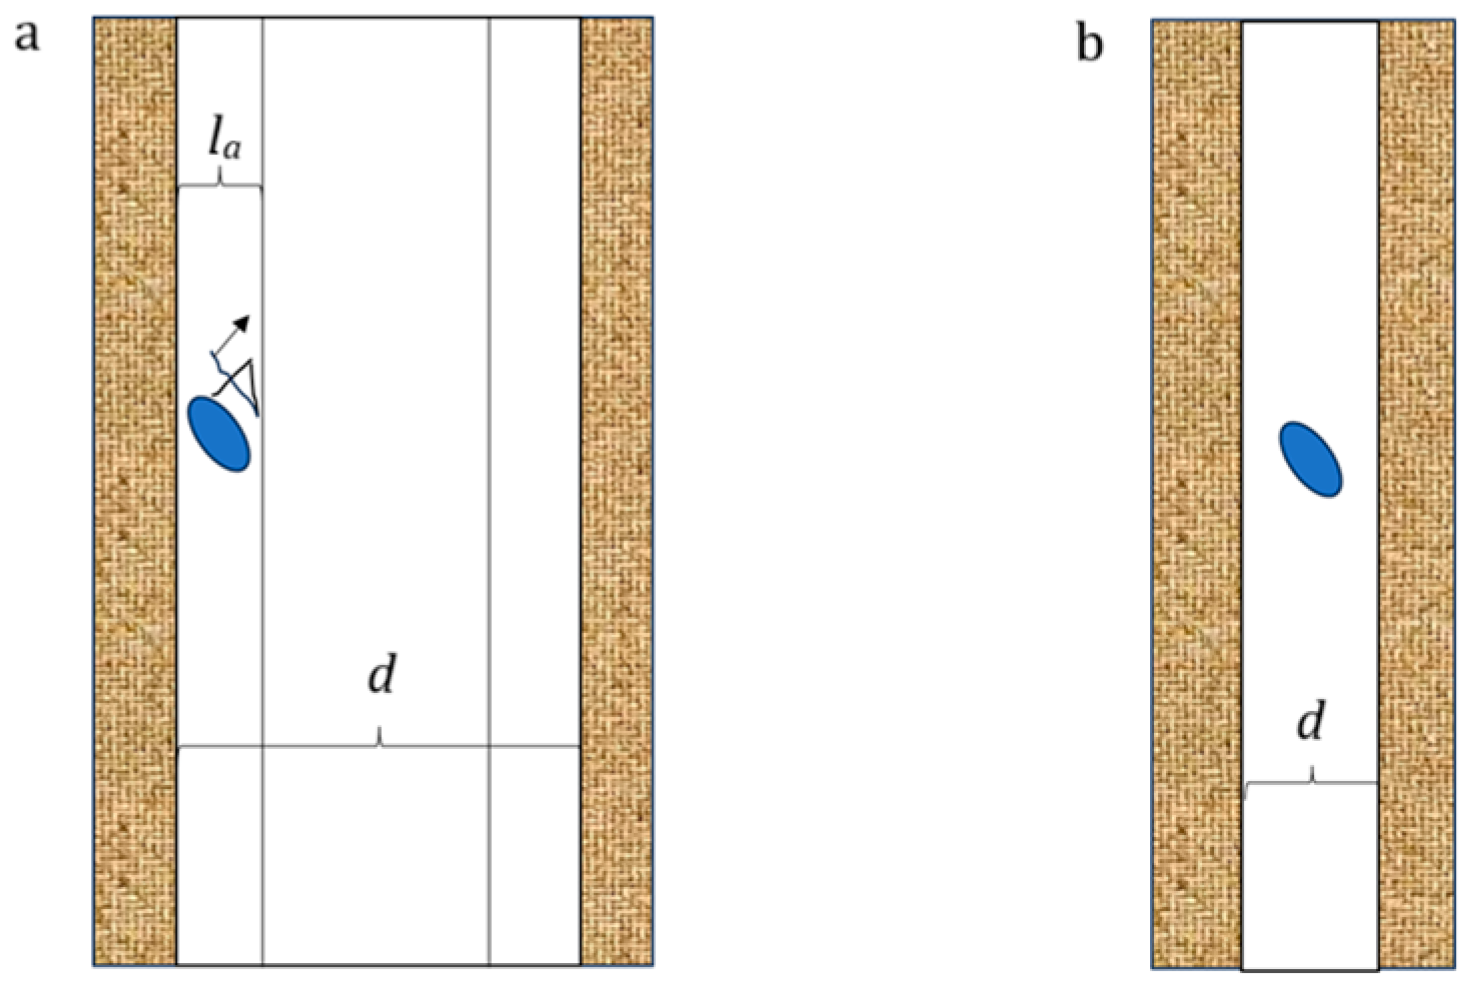
2.4. Pore Characterization
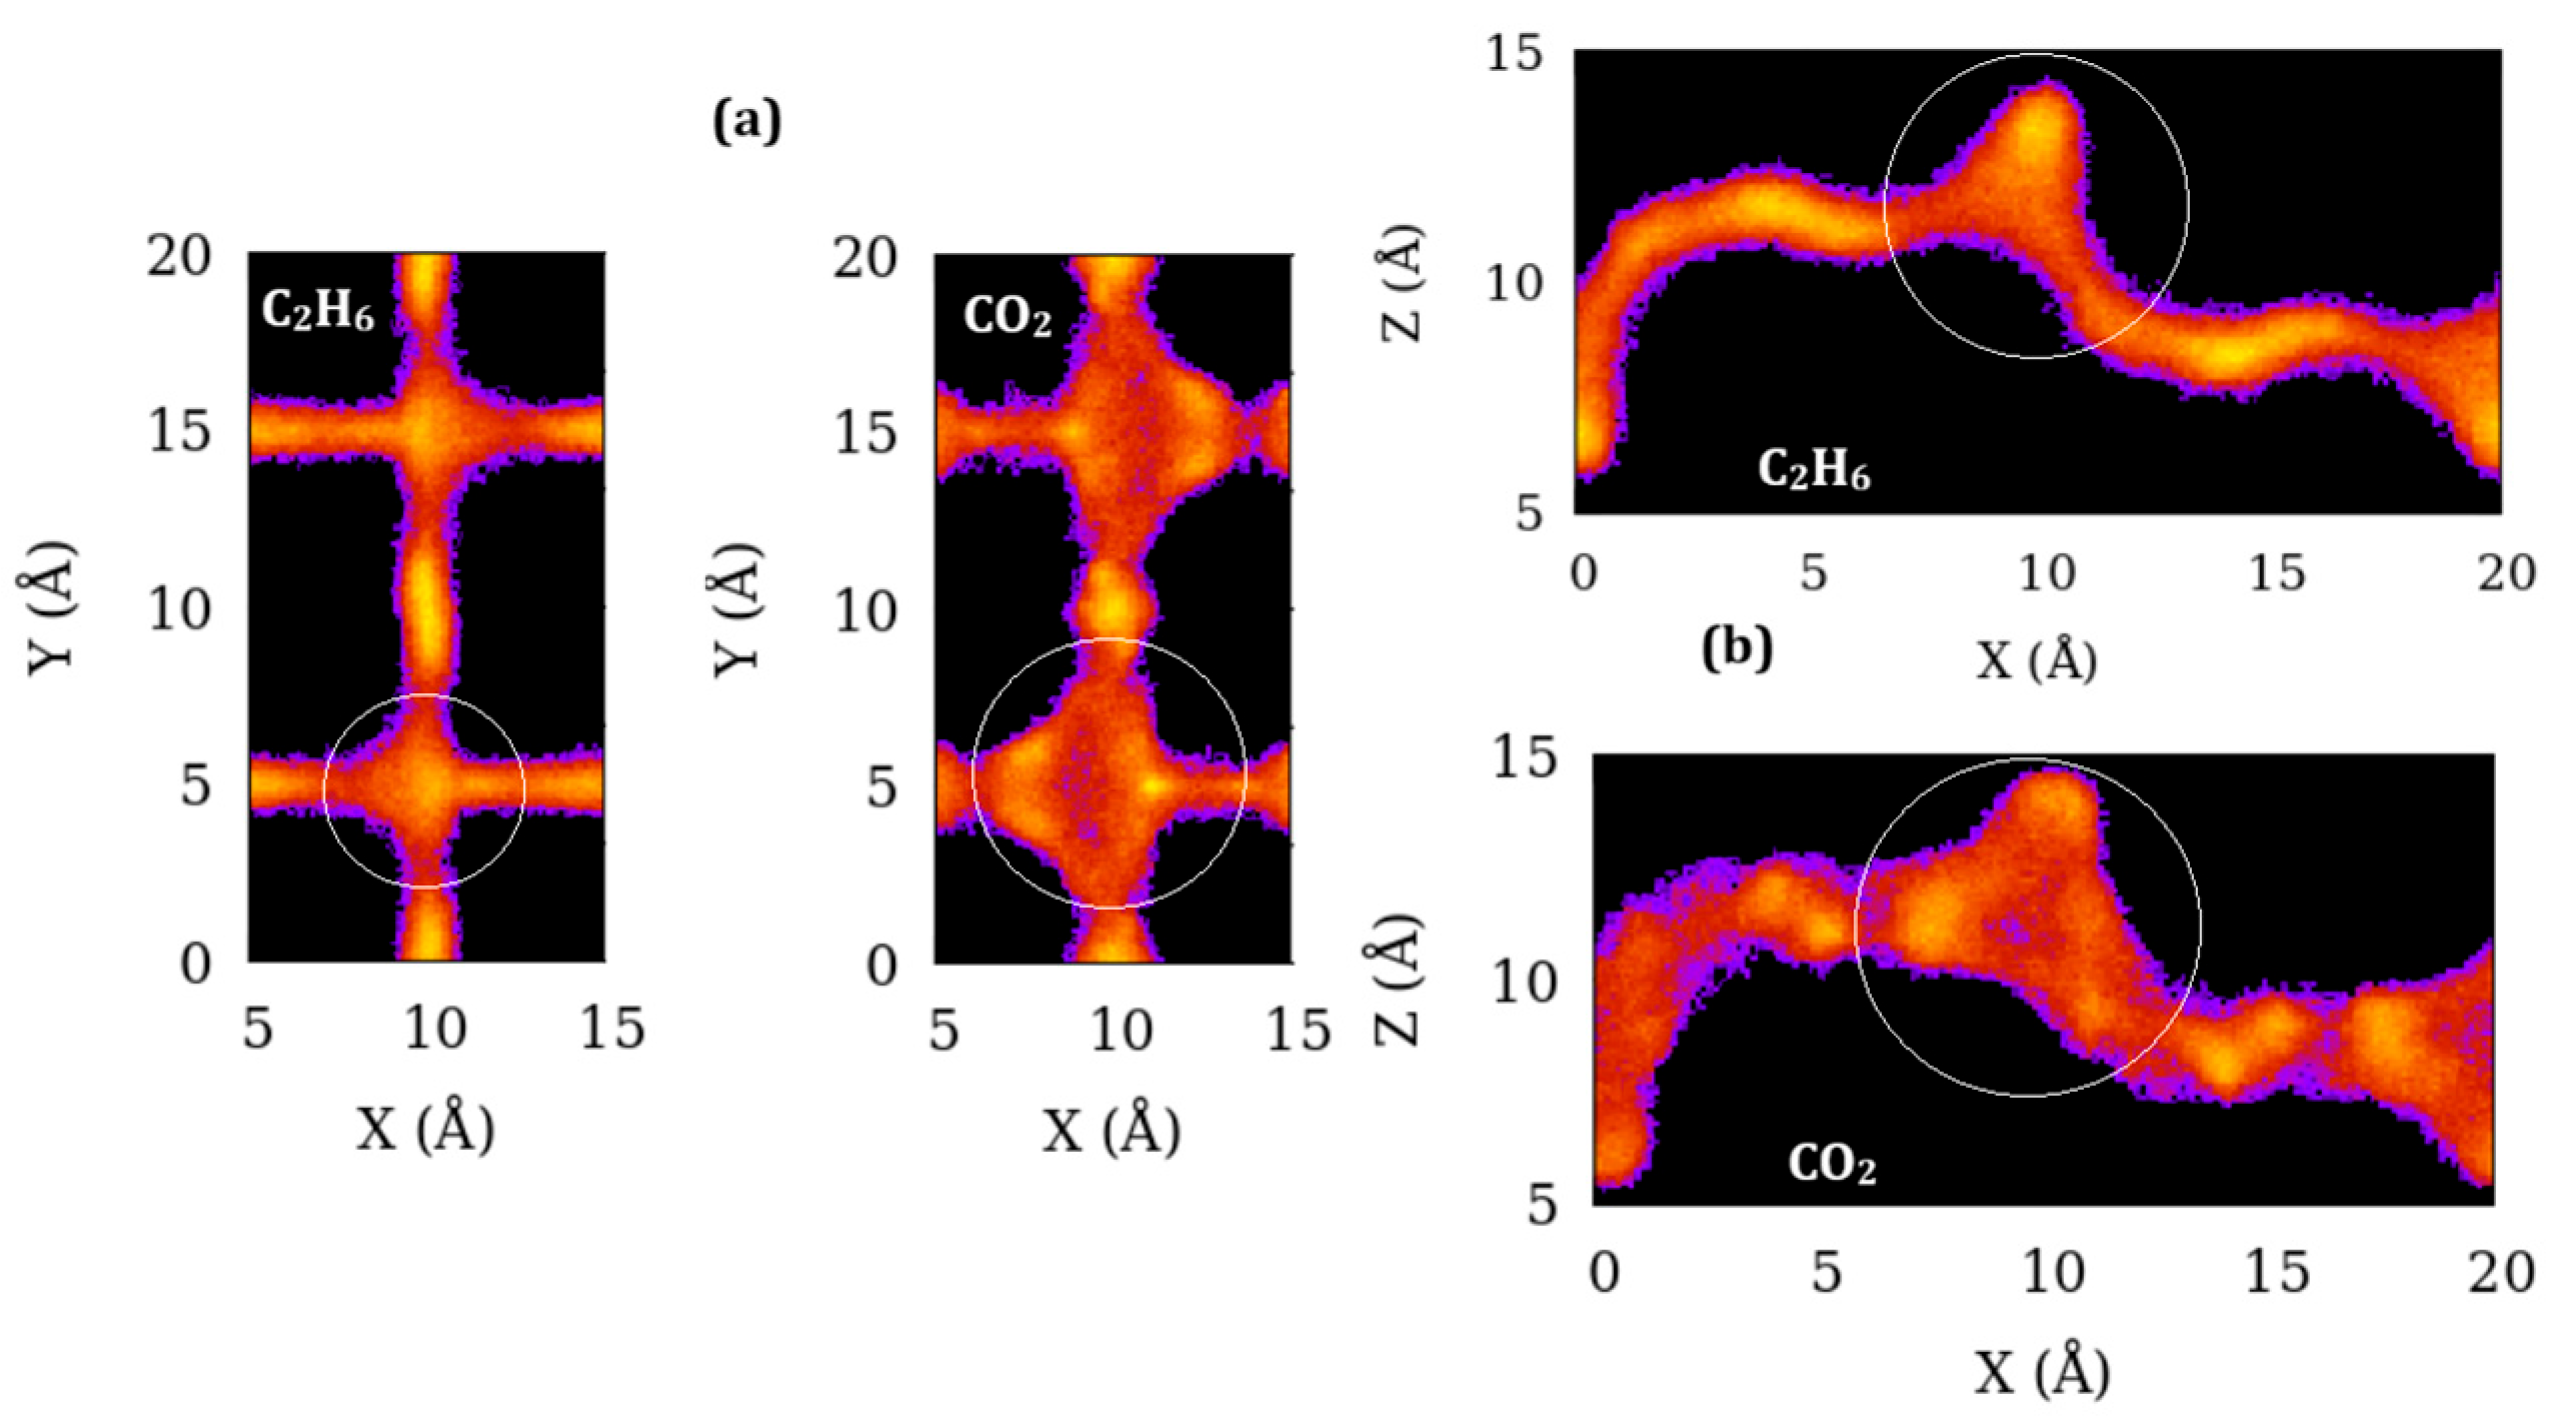
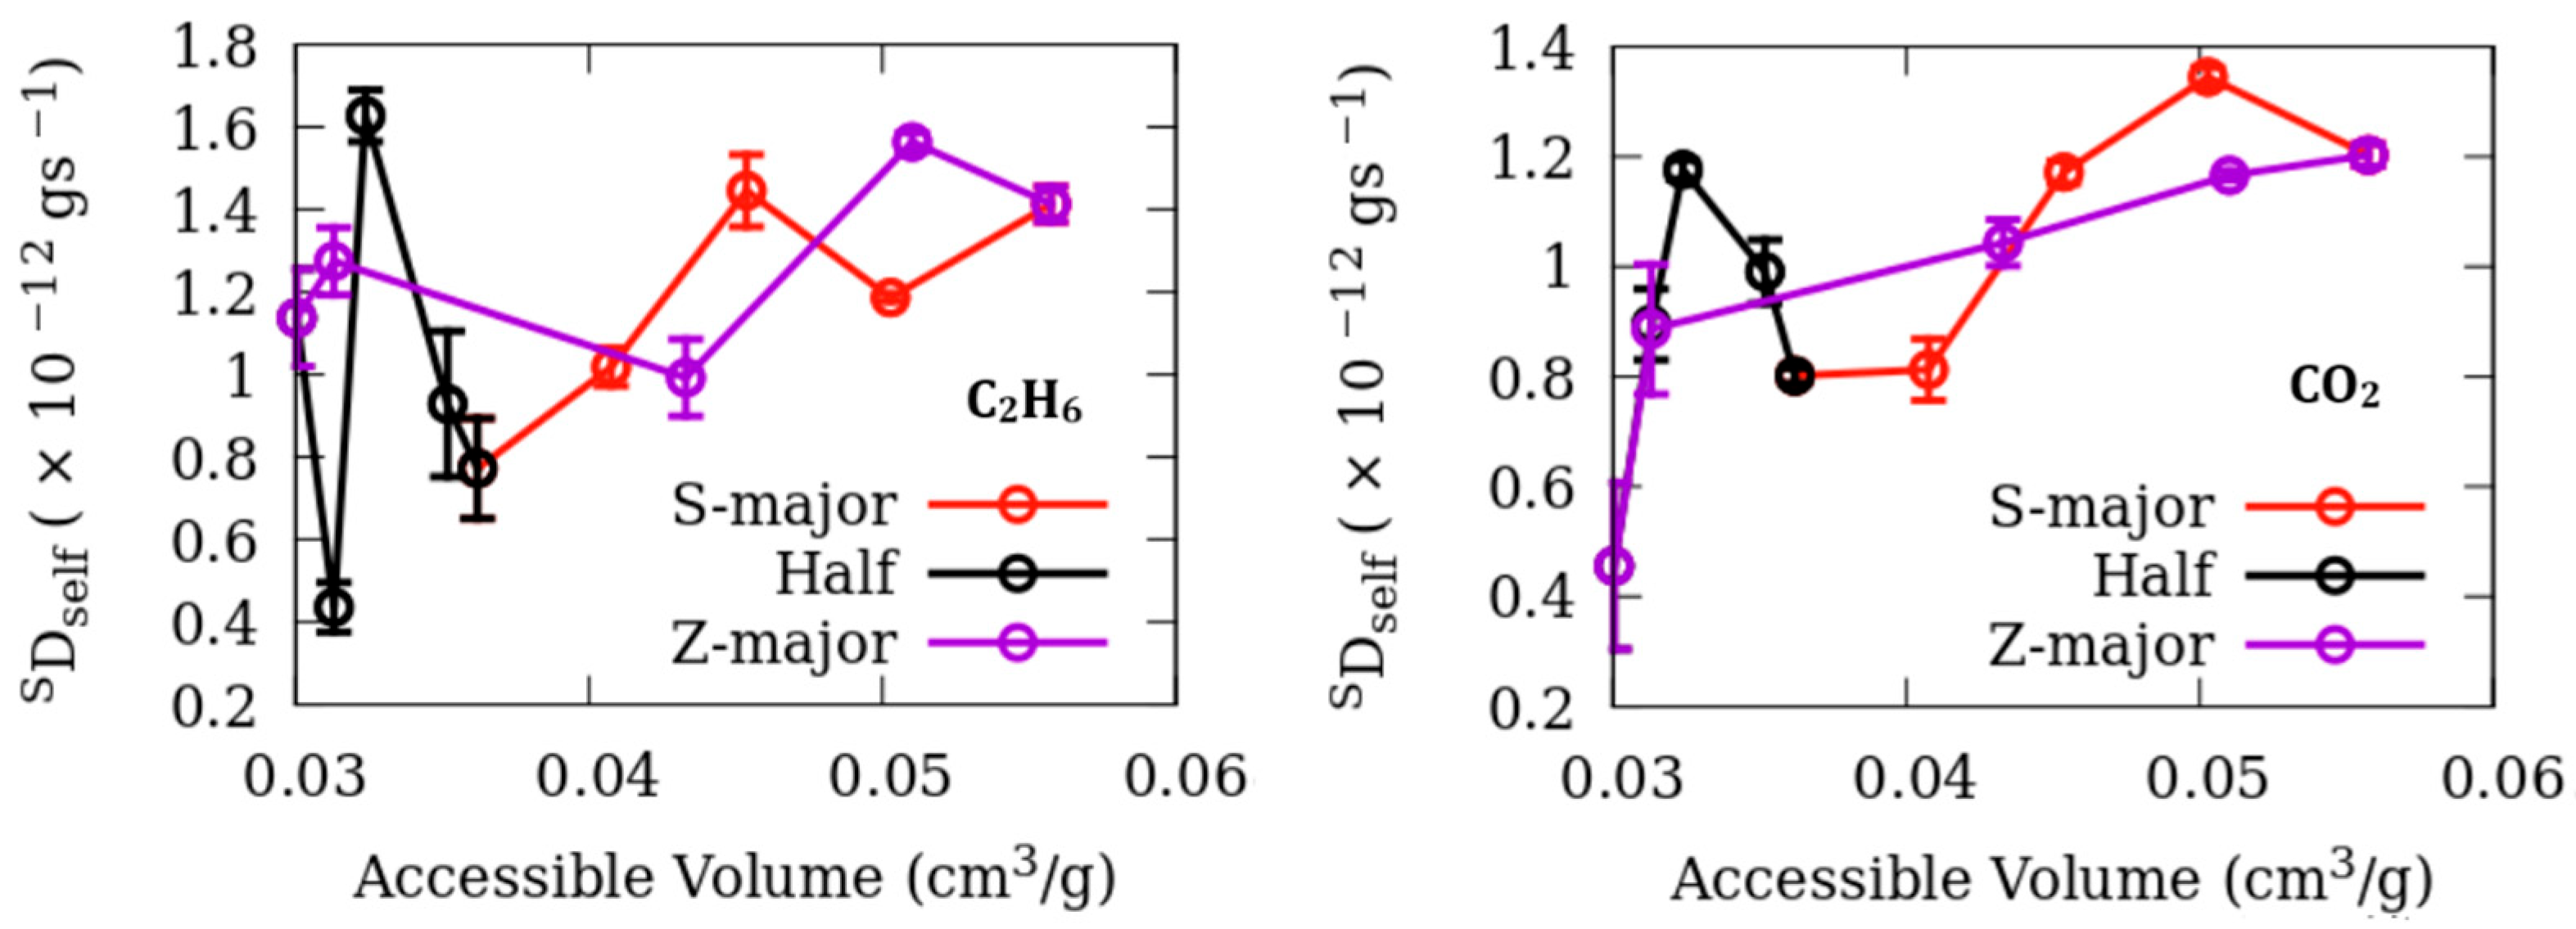
3. Results
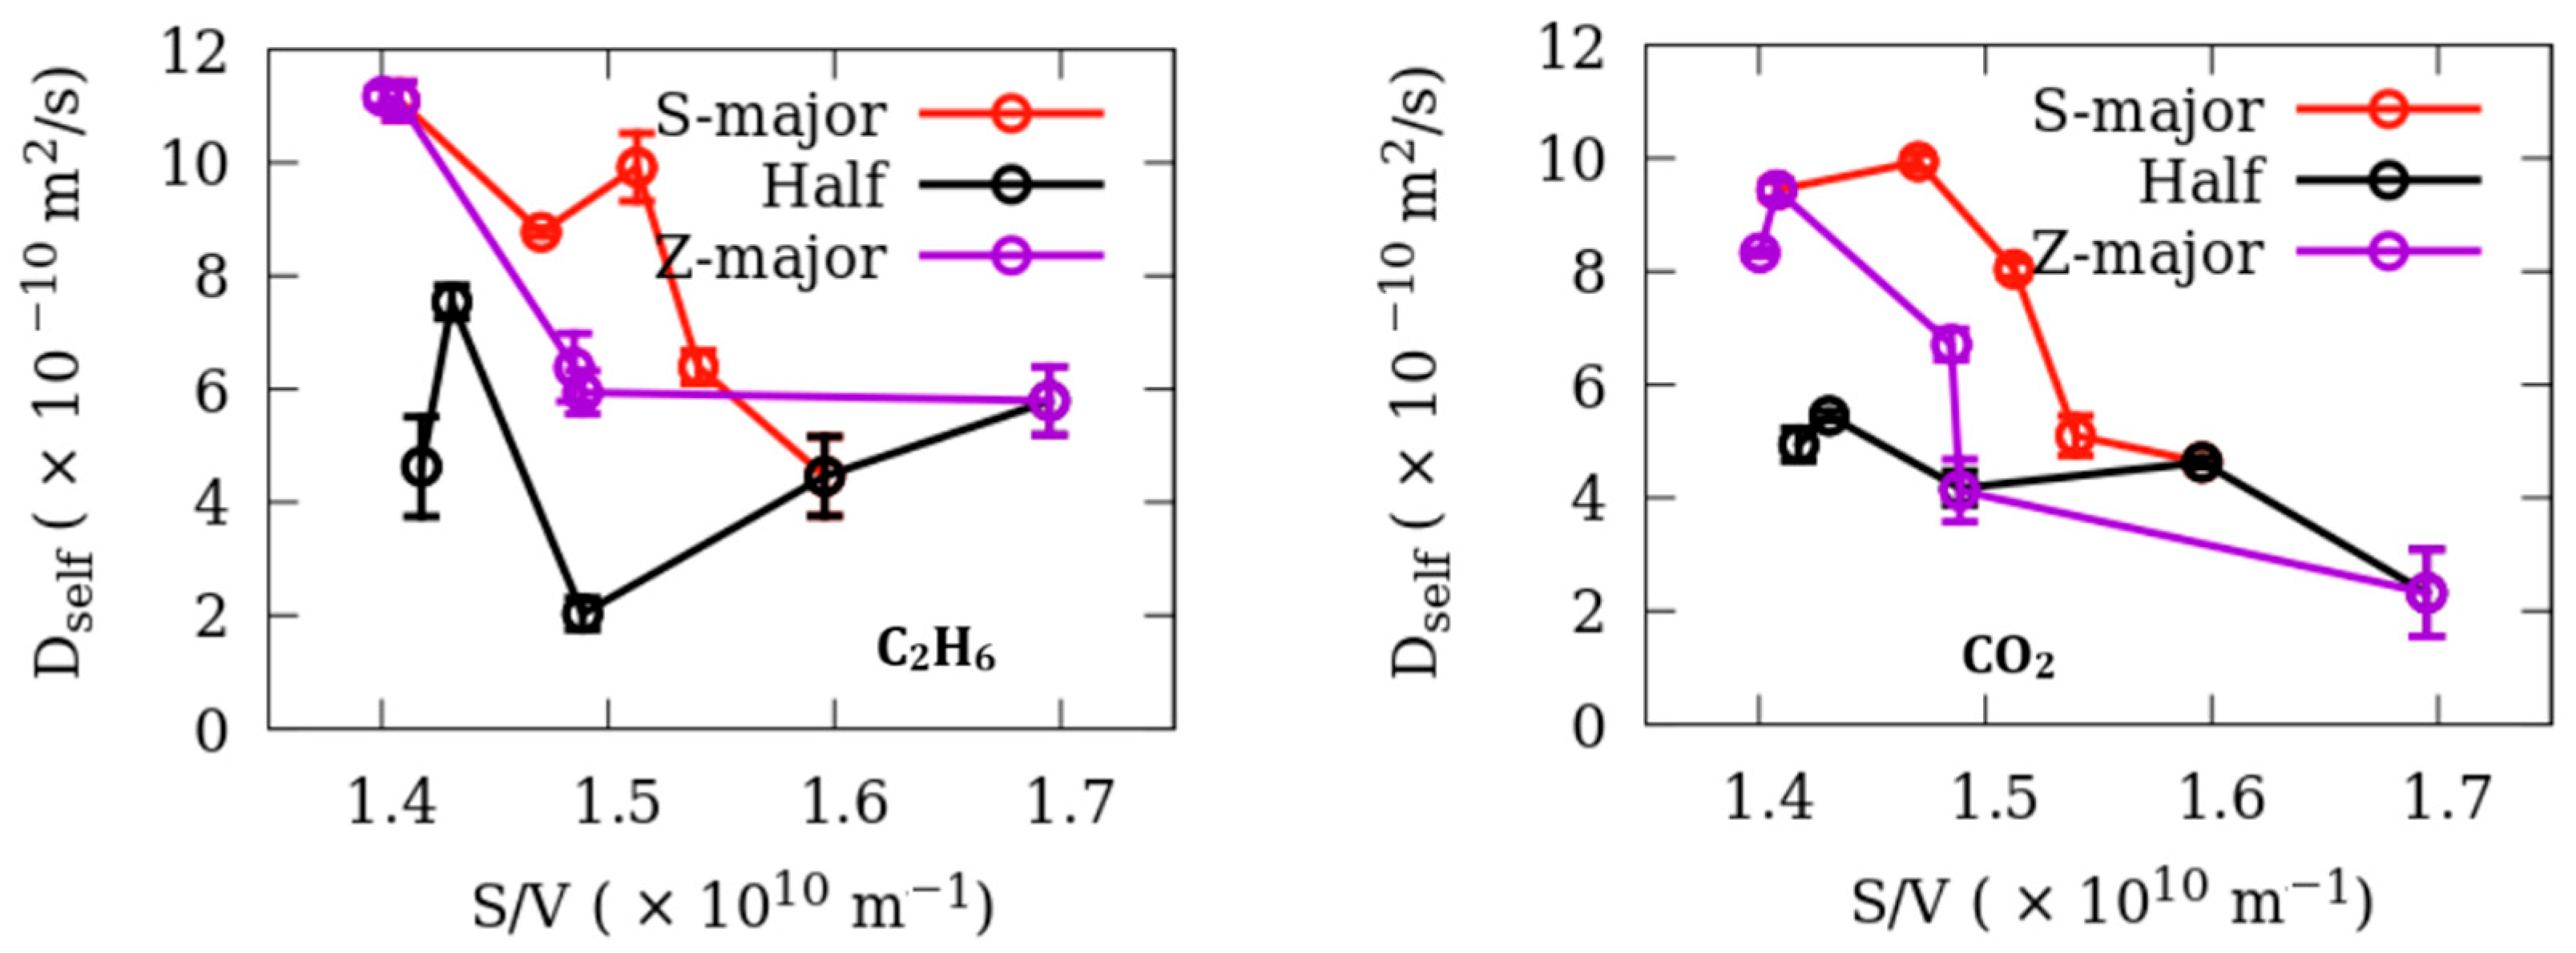
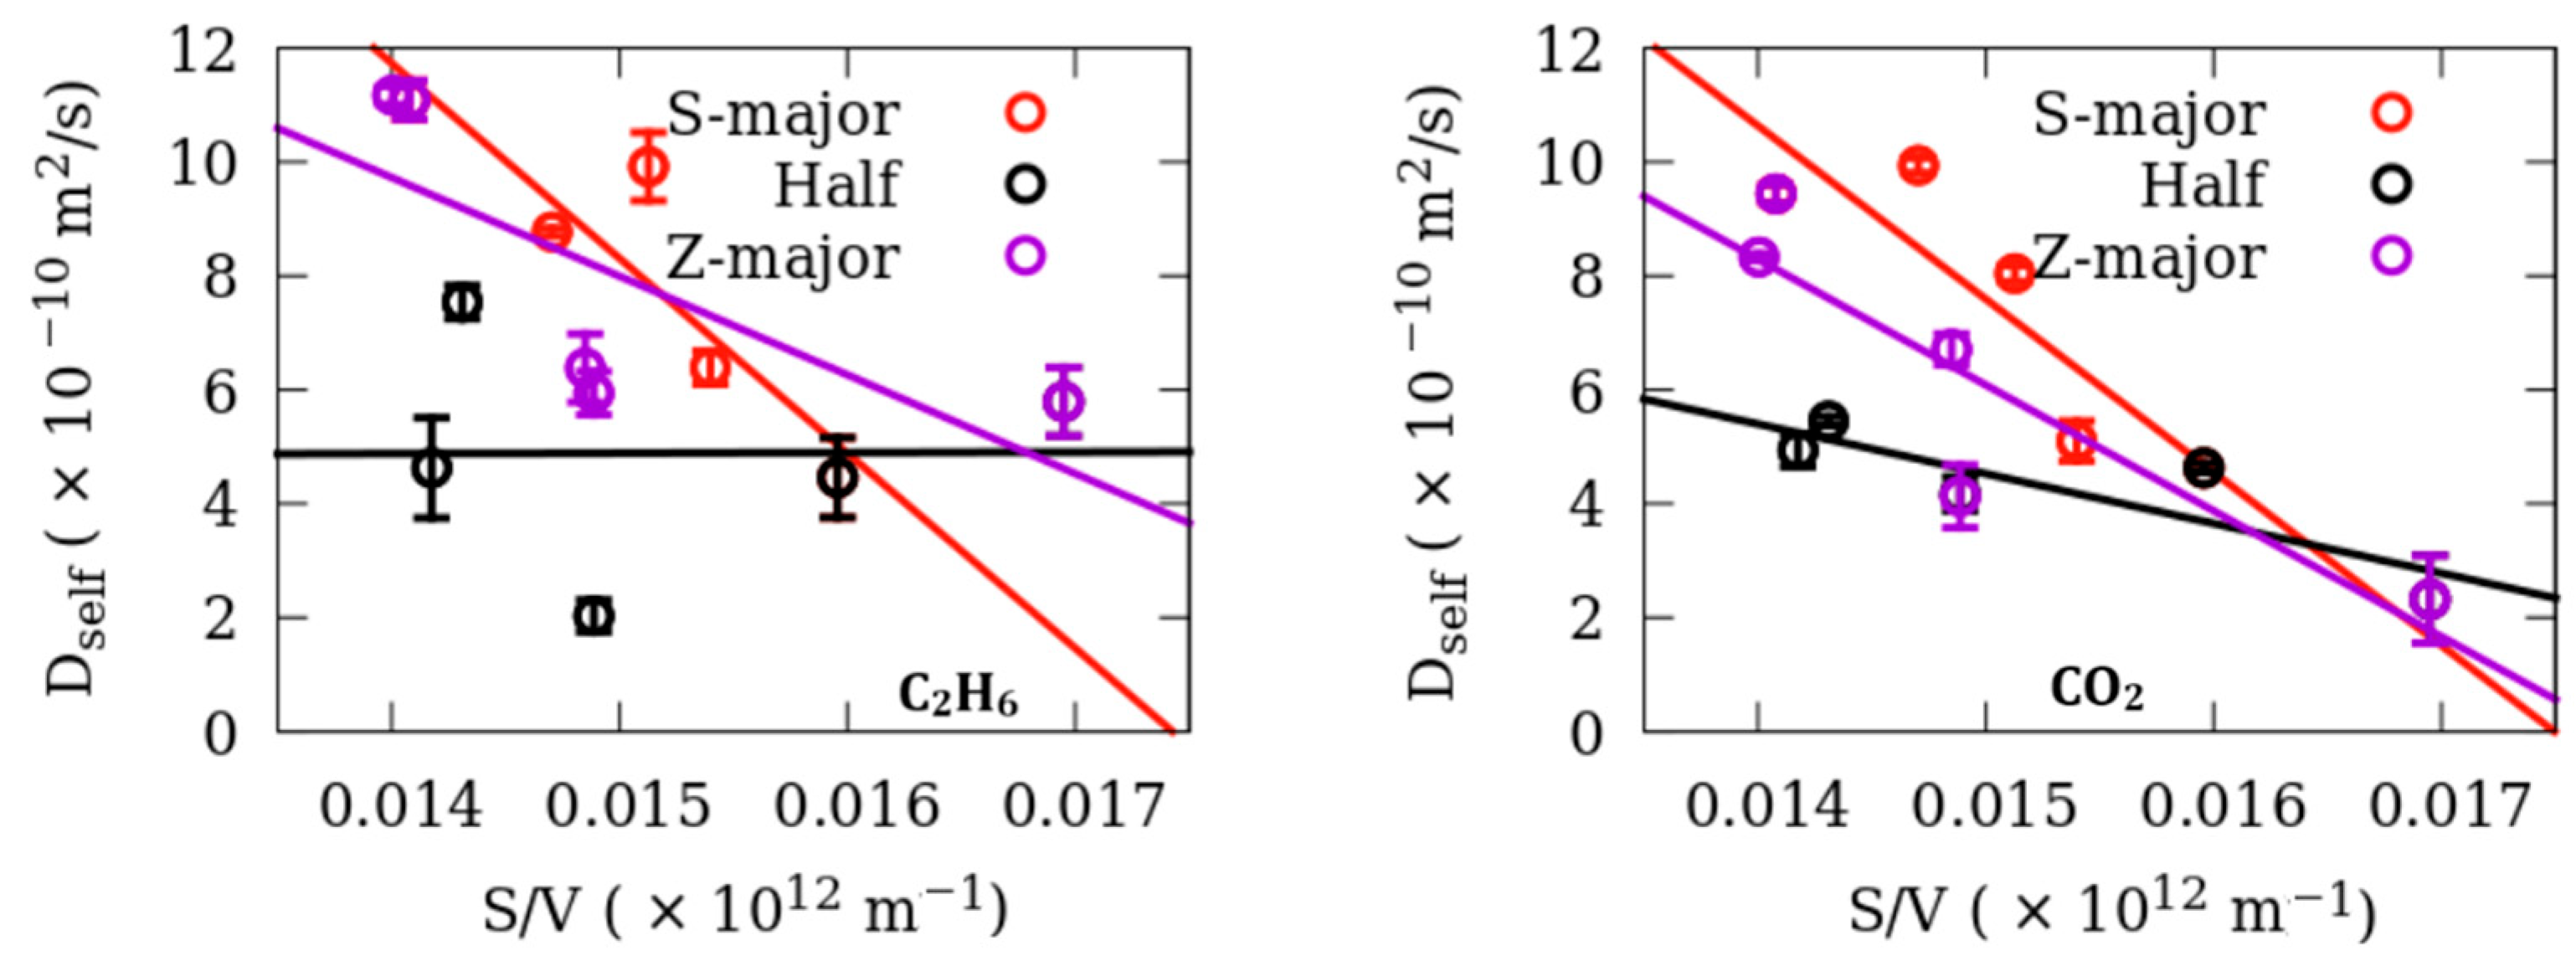
Dynamics
4. Discussion and Conclusions
Author Contributions
Funding
Data Availability Statement
Acknowledgments
Conflicts of Interest
References
- Mitra, S.; Sharma, V.K.; Mukhopadhyay, R. Diffusion of confined fluids in microporous zeolites and clay materials. Rep. Prog. Phys. 2021, 84, 066501. [Google Scholar] [CrossRef]
- Granick, S. Motions and relaxations of confined liquids. Science 1991, 253, 1374–1379. [Google Scholar] [CrossRef] [PubMed]
- Aluru, N.R.; Aydin, F.; Bazant, M.Z.; Blankschtein, D.; Brozena, A.H.; de Souza, J.P.; Elimelech, M.; Faucher, S.; Fourkas, J.T.; Koman, V.B.; et al. Fluids and Electrolytes under Confinement in Single-Digit Nanopores. Chem. Rev. 2023, 123, 2737. [Google Scholar] [CrossRef]
- Mansoori, G.A.; Rice, S.A. Confined fluids: Structure, properties and phase behavior. Adv. Chem. Phys. 2014, 156, 197–294. [Google Scholar]
- Cole, D.; Striolo, A.; Orcutt, B.N.; Daniel, I.; Dasgupta, R. The influence of nanoporosity on the behavior of carbon-bearing fluids. Deep Carbon Past Present 2019, 358–387. [Google Scholar] [CrossRef]
- Chevallier-Boutell, I.J.; Acosta, R.H.; Franzoni, M.B.; Olmos-Asar, J.A. Coverage-dependent adsorption of n-hexane and isopropanol on silica: A density-functional study. Microporous Mesoporous Mater. 2024, 375, 113174. [Google Scholar] [CrossRef]
- Ghanbarian, B.; Hunt, A.G.; Ewing, R.P.; Sahimi, M. Tortuosity in porous media: A critical review. Soil Sci. Soc. Am. J. 2013, 77, 1461–1477. [Google Scholar] [CrossRef]
- Elola, M.D.; Rodriguez, J. Preferential adsorption in ethane/carbon dioxide fluid mixtures confined within silica nanopores. J. Phys. Chem. C 2019, 123, 30937–30948. [Google Scholar] [CrossRef]
- Simeski, F.; Wu, J.; Hu, S.; Tsotsis, T.T.; Jessen, K.; Ihme, M. Local rearrangement in adsorption layers of nanoconfined ethane. J. Phys. Chem. C 2023, 127, 17290–17297. [Google Scholar] [CrossRef]
- Sun, Z.; Wu, K.; Shi, J.; Zhang, T.; Feng, D.; Wang, S.; Liu, W.; Mao, S.; Li, X. Effect of pore geometry on nanoconfined water transport behavior. AIChE J. 2019, 65, e16613. [Google Scholar] [CrossRef]
- Melián-Cabrera, I.; Zarubina, V. Surface area per volumetric loading and its practical significance. Microporous Mesoporous Mater. 2023, 354, 112549. [Google Scholar] [CrossRef]
- Sinha, P.; Datar, A.; Jeong, C.; Deng, X.; Chung, Y.G.; Lin, L.C. Surface area determination of porous materials using the Brunauer–Emmett–Teller (BET) method: Limitations and improvements. J. Phys. Chem. C 2019, 123, 20195–20209. [Google Scholar] [CrossRef]
- Mangun, C.L.; Daley, M.A.; Braatz, R.D.; Economy, J. Effect of pore size on adsorption of hydrocarbons in phenolic-based activated carbon fibers. Carbon 1998, 36, 123–129. [Google Scholar] [CrossRef]
- Valiullin, R.; Kärger, J. Confined Fluids: NMR Perspectives on Confinements and on Fluid Dynamics; Royal Society of Chemistry: London, UK, 2016. [Google Scholar] [CrossRef]
- Mitra, P.P.; Sen, P.N.; Schwartz, L.M. Short-time behavior of the diffusion coefficient as a geometrical probe of porous media. Phys. Rev. B 1993, 47, 8565. [Google Scholar] [CrossRef]
- Latour, L.L.; Mitra, P.P.; Kleinberg, R.L.; Sotak, C.H. Time-dependent diffusion coefficient of fluids in porous media as a probe of surface-to-volume ratio. J. Magn. Reson. Ser. A 1993, 101, 342–346. [Google Scholar] [CrossRef]
- Dvoyashkina, N.; Freude, D.; Stepanov, A.G.; Böhlmann, W.; Krishna, R.; Kärger, J.; Haase, J. Alkane/alkene mixture diffusion in silicalite-1 studied by MAS PFG NMR. Microporous Mesoporous Mater. 2018, 257, 128–134. [Google Scholar] [CrossRef]
- Jost, S.; Bär, N.K.; Fritzsche, S.; Haberlandt, R.; Kärger, J. Diffusion of a mixture of methane and xenon in silicalite: A molecular dynamics study and pulsed field gradient nuclear magnetic resonance experiments. J. Phys. Chem. B 1998, 102, 6375–6381. [Google Scholar] [CrossRef]
- Jobic, H.; Ernst, H.; Heink, W.; Kärger, J.; Tuel, A.; Bée, M. Diffusion of ammonia in silicalite studied by QENS and PFG NMR. Microporous Mesoporous Mater. 1998, 26, 67–75. [Google Scholar] [CrossRef]
- Jelfs, K.E. (Ed.) Computer Simulation of Porous Materials; Royal Society of Chemistry: London, UK, 2021; Volume 8. [Google Scholar]
- Gautam, S.; Cole, D.R. Effects of Pore Connectivity on the Sorption of Fluids in Nanoporous Material: Ethane and CO2 Sorption in Silicalite. ChemEngineering 2021, 5, 55. [Google Scholar] [CrossRef]
- Gautam, S.; Cole, D.R. Effects of pore connectivity and tortuosity on the dynamics of fluids confined in sub-nanometer pores. Phys. Chem. Chem. Phys. 2022, 24, 11836–11847. [Google Scholar] [CrossRef]
- Gautam, S.; Cole, D. Ethane-CO2 mixture adsorption in silicalite: Influence of tortuosity and connectivity of pores on selectivity. C 2023, 9, 116. [Google Scholar] [CrossRef]
- Momma, K.; Izumi, F. VESTA 3 for three-dimensional visualization of crystal, volumetric and morphology data. J. Appl. Crystallogr. 2011, 44, 1272–1276. [Google Scholar] [CrossRef]
- Van Koningsveld, H.; Van Bekkum, H.; Jansen, J.C. On the location and disorder of the tetrapropylammonium (TPA) ion in zeolite ZSM-5 with improved framework accuracy. Acta Crystallogr. Sect. B Struct. Sci. 1987, 43, 127–132. [Google Scholar] [CrossRef]
- Martin, M.G.; Siepmann, J.I. Transferable potentials for phase equilibria. 1. United-atom description of n-alkanes. J. Phys. Chem. B 1998, 102, 2569–2577. [Google Scholar] [CrossRef]
- Potoff, J.J.; Siepmann, J.I. Vapor–liquid equilibria of mixtures containing alkanes, carbon dioxide, and nitrogen. AIChE J. 2001, 47, 1676–1682. [Google Scholar] [CrossRef]
- Cygan, R.T.; Liang, J.J.; Kalinichev, A.G. Molecular models of hydroxide, oxyhydroxide, and clay phases and the development of a general force field. J. Phys. Chem. B 2004, 108, 1255–1266. [Google Scholar] [CrossRef]
- Allen, M.P.; Tildesley, D.J. Computer Simulation of Liquids; Oxford University Press: Oxford, UK, 2017. [Google Scholar]
- Gautam, S.; Cole, D.R. Effects of inter-crystalline space on the adsorption of ethane and CO2 in silicalite: Implications for enhanced adsorption. Phys. Chem. Chem. Phys. 2020, 22, 13951–13957. [Google Scholar] [CrossRef]
- Sun, M.S.; Shah, D.B.; Xu, H.H.; Talu, O. Adsorption Equilibria of C1 to C4 Alkanes, CO2, and SF6 on Silicalite. J. Phys. Chem. B 1998, 102, 1466–1473. [Google Scholar] [CrossRef]
- Purton, J.A.; Crabtree, J.C.; Parker, S.C. DL_MONTE: A general purpose program for parallel Monte Carlo simulation. Mol. Simul. 2013, 39, 1240–1252. [Google Scholar] [CrossRef]
- Todorov, I.T.; Smith, W.; Trachenko, K.; Dove, M.T. DL_POLY_3: New dimensions in molecular dynamics simulations via massive parallelism. J. Mater. Chem. 2006, 16, 1911–1918. [Google Scholar] [CrossRef]
- Lemmon, E.W. Thermophysical Properties of Fluid Systems; NIST Chemistry WebBook: Gaithersburg, MD, USA, 2010. [Google Scholar]
- Willems, T.F.; Rycroft, C.H.; Kazi, M.; Meza, J.C.; Haranczyk, M. Algorithms and tools for high-throughput geometry-based analysis of crystalline porous materials. Microporous Mesoporous Mater. 2012, 149, 134–141. [Google Scholar] [CrossRef]
- Rouquerol, J.; Avnir, D.; Fairbridge, C.W.; Everett, D.H.; Haynes, J.M.; Pernicone, N.; Ramsay, J.D.F.; Sing, K.S.W.; Unger, K.K. Recommendations for the characterization of porous solids (Technical Report). Pure Appl. Chem. 1994, 66, 1739–1758. [Google Scholar] [CrossRef]
- Yang, J.; Zhao, Q.; Xu, H.; Li, L.; Dong, J.; Li, J. Adsorption of CO2, CH4, and N2 on gas diameter grade ion-exchange small pore zeolites. J. Chem. Eng. Data 2012, 57, 3701–3709. [Google Scholar] [CrossRef]
- Aguado, S.; Bergeret, G.; Daniel, C.; Farrusseng, D. Absolute molecular sieve separation of ethylene/ethane mixtures with silver zeolite A. J. Am. Chem. Soc. 2012, 134, 14635–14637. [Google Scholar] [CrossRef]
- Etesse, P.; Zega, J.A.; Kobayashi, R. High pressure nuclear magnetic resonance measurement of spin–lattice relaxation and self-diffusion in carbon dioxide. J. Chem. Phys. 1992, 97, 2022–2029. [Google Scholar] [CrossRef]
- Greiner-Schmid, A.; Wappmann, S.; Has, M.; Lüdemann, H.D. Self-diffusion in the compressed fluid lower alkanes: Methane, ethane, and propane. J. Chem. Phys. 1991, 94, 5643–5649. [Google Scholar] [CrossRef]
- Williams, T.; Kelley, C.; Lang, R.; Kotz, D.; Campbell, J. Gnuplot 4.6. 6: An Interactive Plotting Program. 2014. Available online: http://gnuplot.info (accessed on 4 October 2023).


| Fluid | Adsorbent | D0 (×10−10 m2/s) | a (×10−12 m) | RMS Residuals |
|---|---|---|---|---|
| Ethane | S-major | 59.66 ± 14.07 | 57.38 ± 2.2 | 1.33 |
| Half | 4.75 ± 15.1 | −1.91 ± 213 | 2.33 | |
| Z-major | 33.99 ± 13.75 | 50.99 ± 6.57 | 2.18 | |
| CO2 | S-major | 53.23 ± 14.16 | 57.16 ± 2.55 | 1.33 |
| Half | 17.62 ± 4.65 | 49.55 ± 4.31 | 0.71 | |
| Z-major | 39.22 ± 9.61 | 56.32 ± 2.76 | 1.52 |
Disclaimer/Publisher’s Note: The statements, opinions and data contained in all publications are solely those of the individual author(s) and contributor(s) and not of MDPI and/or the editor(s). MDPI and/or the editor(s) disclaim responsibility for any injury to people or property resulting from any ideas, methods, instructions or products referred to in the content. |
© 2025 by the authors. Licensee MDPI, Basel, Switzerland. This article is an open access article distributed under the terms and conditions of the Creative Commons Attribution (CC BY) license (https://creativecommons.org/licenses/by/4.0/).
Share and Cite
Gautam, S.; Cole, D. Diffusion of C-O-H Fluids in a Sub-Nanometer Pore Network: Role of Pore Surface Area and Its Ratio with Pore Volume. C 2025, 11, 57. https://doi.org/10.3390/c11030057
Gautam S, Cole D. Diffusion of C-O-H Fluids in a Sub-Nanometer Pore Network: Role of Pore Surface Area and Its Ratio with Pore Volume. C. 2025; 11(3):57. https://doi.org/10.3390/c11030057
Chicago/Turabian StyleGautam, Siddharth, and David Cole. 2025. "Diffusion of C-O-H Fluids in a Sub-Nanometer Pore Network: Role of Pore Surface Area and Its Ratio with Pore Volume" C 11, no. 3: 57. https://doi.org/10.3390/c11030057
APA StyleGautam, S., & Cole, D. (2025). Diffusion of C-O-H Fluids in a Sub-Nanometer Pore Network: Role of Pore Surface Area and Its Ratio with Pore Volume. C, 11(3), 57. https://doi.org/10.3390/c11030057