Article

Mechanism of Fluorescence Characteristics and Application of Zinc-Doped Carbon Dots Synthesized by Using Zinc Citrate Complexes as Precursors

1
Henan International Joint Laboratory of Medicinal Plants Utilization, School of Pharmacy, Henan University, Kaifeng 475004, China
2
STA Pharmaceutical Co., Ltd., Pudong, Shanghai 200120, China
3
Department of Chemical Engineering, Jashore University of Science and Technology, Jashore 7408, Bangladesh
*
Authors to whom correspondence should be addressed.
Submission received: 31 May 2025 / Revised: 3 July 2025 / Accepted: 3 July 2025 / Published: 7 July 2025
(This article belongs to the Special Issue Carbon Nanohybrids for Biomedical Applications (2nd Edition))

Abstract

Zn-doped carbon dots (Zn@C-210 calcination temperature at 210 °C and Zn@C-260 calcination temperature at 260 °C) were synthesized via an in situ calcination method using zinc citrate complexes as precursors, aiming to investigate the mechanisms of their distinctive fluorescence properties. A range of analytical methods were employed to characterize these nanomaterials. The mechanism study revealed that the coordination structure of Zn-O, formed through zinc doping, can induce a metal–ligand charge-transfer effect, which significantly increases the probability of radiative transitions between the excited and ground states, thereby enhancing the fluorescence intensity. The Zn@C-210 in a solid state and Zn@C-260 in water exhibited approximately 71.50% and 21.1% quantum yields, respectively. Both Zn@C-210 and Zn@C-260 exhibited excitation-independent luminescence, featuring a long fluorescence lifetime of 6.5 μs for Zn@C-210 and 6.2 μs for Zn@C-260. Impressively, zinc-doped CDs displayed exceptional biosafety, showing no acute toxicity even at 1000 mg/kg doses. Zn@C-210 has excellent fluorescence in a solid state, showing promise in anti-photobleaching applications; meanwhile, the dual functionality of Zn@C-260 makes it useful as a folate sensor and cellular imaging probe. These findings not only advance the fundamental understanding of metal-doped carbon dot photophysics but also provide practical guidelines for developing targeted biomedical nanomaterials through rational surface engineering and doping strategies.

Graphical Abstract

1. Introduction

Carbon dots (CDs), a type of zero-dimensional carbon-based nanomaterial with many unique characteristics due to their special size effects, have garnered significant attention across diverse scientific fields since their discovery in 2004. Compared to large-particle carbon materials like activated carbon, graphite, and other common carbon materials, many unique characteristics of CDs have been found, such as good water solubility, biocompatibility, photostability, and highly tunable photoluminescence. These features have made CDs a hot topic in the fields of biomedicine, chemical sensors, catalysis, etc. Various methods, including microwaves, chemical oxidation, hydrothermal processes, etc., based on “top–down and bottom–up” strategies by using various kinds of carbon sources, have been reported for CD synthesis [1,2,3]. However, due to their unique size characteristics—typically quasi-spherical, rod-like, or irregular structures measuring 2 to 10 nm—CDs exhibit a strong tendency to aggregate in solid states, resulting in significant fluorescence quenching. Thus, most CDs exhibit fluorescence solely in solution rather than in solid states, restricting their utility across optoelectronics and photocatalysis. The elusive interplay between CDs’ fluorescence, electronic dynamics, dimensional attributes, compositional nuances, and surface modifications remains shrouded in mystery. Unraveling these intricate connections promises to elevate their functional prowess, unlocking more targeted applications in domains like optoelectronic innovation and precision medical breakthroughs.
Methods have been developed to enhance their applications. Doping or surface passivation of CDs enhances their physicochemical properties, light absorption capabilities, and quantum yield by controlling their size, morphology, structure, and bandgap energy [4]. In order to improve their fluorescence efficiency and electron transport performance, various types of CDs have been invented by means of heteroatom doping. Some doped CDs show excitation-dependent fluorescence with tunable emission, some with pH-dependent fluorescence emission, and some with upconversion fluorescence. The most common non-metallic doping elements are nitrogen, boron, silicon, sulfur, and phosphorus. Although doping or surface passivation techniques are employed to significantly increase the CDs’ quantum yield, the quantum yield of CDs is still less than 50% [5]. Compared with the traditional semiconductor quantum dots with a yield of more than 80%, the low quantum yield of CDs remains unsolved at present [6]. Metal-doped CDs have recently emerged as a significant class of nanomaterials with diverse biomedical applications. It has been found that the structure and bandgap of CDs can be adjusted via doping with metal atoms, such as Cu, Gd(III), Ni, Eu(III), α-Bi2O3, TiO2, Cu-Al2O3, etc., to improve their optical properties and functions. However, doping with heavy metal atoms not only increases the toxicity of CDs and limits the possibility to apply them in biology and medicine, it also pollutes the environment [7,8,9].
Zinc is one of the essential dietary trace metals for human physiological and biochemical functions [10]. Unlike the fluorescence quenching effect of calcium and iron ions on CDs, zinc can significantly increase their fluorescence intensity compared with undoped CDs and exhibits low biological toxicity. Although the synthesis or applications have been discussed in the literature, the fluorescence mechanisms have seldom been studied [11,12,13,14]. Xu achieved a quantum yield of up to 35% for zinc-doped carbon dots prepared by reacting sodium citrate and zinc chloride at 185 °C in a Teflon-lined stainless steel autoclave for varying durations [15]. In the present study, an in situ calcination method using zinc citrate complexes as precursors was designed to prepare zinc-doped CDs. To investigate the unique fluorescence characteristics and potential applications of zinc-doped carbon dots, Zn@C-210 (calcined at 210 °C), exhibiting bright solid fluorescence, and Zn@C-260 (calcined at 260 °C), demonstrating fluorescence in aqueous solution, were synthesized separately. The photoluminescence quantum yield of solid Zn@C-210 was as high as 71.50%, and the fluorescence lifetime reached 6.5 μs. The mechanism of fluorescence change was discussed according to the process of fluorescence generation and transformation.

2. Materials and Methods

2.1. Materials and Animals

All chemicals were of analytical reagent grade (AR), including zinc chloride (≧98.0%) and trisodium citrate dihydrate (≧99.0%), obtained from Tianjin Guangfu Technology Development Co., Ltd. (Tianjin, China). All chemicals were used without any further purification, and deionized water (pH 7, 18.2 mΩ) was used for all experimental works.
Male and female Kunming mice (20–24 g) and the normal diet were purchased from Center of Laboratory Animals of Henan Province (Zhengzhou, China). All animals were housed with temperature maintained at 22 ± 3 °C under natural light/dark conditions, and with free access to food and water. All animal experimental procedures were approved by the Henan University Institutional Animal Care and Use Committee (No. 41003100004267).

2.2. Methods

2.2.1. Synthesis of Zinc-Doped CDs

Initially, 2.0 mmol of trisodium citrate and 1.6 mmol of zinc chloride were added into 20.0 mL of water, and 1.0 mol/L NaOH was used to adjust the pH to 5.0 with constant stirring at 70 °C for 5 h. Various pH values (1.0–10.0) were investigated, and the optimal pH value was 5.0. Subsequently, absolute ethanol was added to a concentration of 80% v/v, and the white precipitate was obtained by centrifuging at 4000 rad/min for 5 min. The sediment was washed with 80% v/v ethanol three times and then lyophilized (Christ Delta 1-24 LSC plus, Osterode am Harz, Germany). The citrate–zinc complex was obtained as a precursor named TC-Zn. Finally, the series of TC-Zn complexes were calcined in a tube furnace at different temperatures (180–290 °C) for 1–5 h but available upon request). After careful evaluation, the optimal zinc-doped CDs (Zn@C-210 and Zn@C-260) were prepared at 210 °C and 260 °C (±1 °C) for 2 h, respectively, for further study.

2.2.2. Yield and Zinc Content

The yields of TC-Zn, Zn@C-210, and Zn@C-260 were calculated as follows:
Yield   % = The   weight   of   complex Total   mass   of   raw   materials ×   100 %
The quantification of zinc content was detected using an ICP-AES system (Optima 2100DV, Perkin Elmer, Springfield, IL, USA). TC-Zn, Zn@C-210, and Zn@C-260 were dissolved in 1 mL of 0.1 mol/L HCl to destroy the structure of the complex, and then water was added to a volume of 500 mL. The concentration of Zn2+ in each solution was determined by ICP-AES systems (Optima 2100DV, Perkin Elmer) [16,17].

2.2.3. Physiochemical Characterization of Zinc-Doped CDs

The morphology and microstructures of the complexes were observed by field-emission scanning electron microscope (SEM) at an accelerating voltage of 5.0 kV (JSM-7001F, JEOL, Tokyo, Japan) and equipped with energy-dispersive spectroscopy (EDS), and by transmission electron microscopy (TEM) at an accelerating voltage of 300 kV (JEM2100Plus, JEOL). A Thermo Scientific Nicolet iS 50 (Waltham, MA, USA) was employed for the measurement of the Fourier-transform infrared (FT-IR) spectrum in the wavelength range of 4000–400 cm−1. The crystal phase of the products was characterized by X-ray powder diffraction (XRD) on a D8 Advance (Bruker, Bremen, Germany) device with Ni-filtered Cu Kα radiation (λ = 1.5406 Å) at a voltage of 40 kV and a current of 40 mA. X-ray Photoelectron Spectroscopy (XPS) analysis was performed using a spectrometer (EscaLab 250Xi, Thermo, Waltham, MA, USA) with a monochromatic X-ray source of Al Kα excitation (1486.6 eV). Thermal studies were carried out on a TGA/DSC 3+ Thermogravimetric Analyzer (Mettler Toledo, Zurich, Switzerland), and the samples were heated up to 1000 °C at a rate of 10 °C/min in an inert nitrogen atmosphere. The 1H spectra were recorded in D2O as a solvent on a Bruker AVANCE Digital 300 MHz NMR spectrometer (Switzerland). The ultraviolet–visible (UV−Vis) absorption spectra of the samples were recorded using a UV−Vis spectrometer (UV2600, Shimadzu, Duisburg, Germany). Fluorescence measurements were carried out using a fluorescence spectrophotometer (Cary Eclipse, Agilent, Santa Clara, CA, USA). The photoluminescence quantum yield (QY) and lifetime were measured by steady-state and transient-state fluorescence spectrometry (FLS980, Edinburgh Instrument, Edinburgh, UK).

2.2.4. Acute Toxicity of Zinc-Doped CDs

To investigate the potential application of this nanomaterial in biological systems, the acute toxicity of both Zn@C-210 and Zn@C-260 was assessed via oral administration [18]. For each administration, the mice were divided into five dose groups and one control group (5 males and 5 females in each group). The mice were administered with increasing doses at 200, 400, 600, 800, and 1000 mg/kg body weight (BW). The control group was provided with isometric saline solution in the same way. All mice were permitted food and water freely and were observed for 14 days after the administration of the doses.

2.2.5. Applications of Zinc-Doped CDs

The application of Zn@C-210 in fluorescent printing, dyeing, and printing was investigated. The Zn@C-210 was dissolved in 2 g/L water and marked on paper; subsequently, the images were observed under sunlight and 365 nm.
The application of Zn@C-260 in measuring folic acid was studied. Folic acid with different concentrations was added (10 µL, concentration range of 2.0–20.0 × 10⁻⁵ mol/L) to a 2 mg/mL Zn@C-260 solution. The fluorescence emission intensity at 440 nm of the samples excited at 350 nm was measured.
The Zn@C-260 was also feasible for biological/cell imaging. Zn@C-260 solution (800 μg/mL) was added to a Petri dish containing human breast cancer cells (MCF-7) according to the method described in [19]. After incubation for 2 h, the culture medium was removed and washed with phosphate-buffered saline (PBS) 3 times. Then, high-content screening (Array-Scan VTI HCS 600, Thermo) was used to observe the phagocytic activity of Zn@C-260 by MCF-7 cells. The cytotoxicity of Zn@C-260 was evaluated by the conventional MTT method.

2.2.6. Statistical Analysis

Each sample was repeated at least three times, and the resulting data were analyzed by one-way analysis of variance (ANOVA) and presented as mean values ± standard deviations.

3. Results and Discussion

3.1. Yields and Zinc Contents of TC-Zn, Zn@C-210, and Zn@C-260

Table 1 shows the yields and zinc contents of TC-Zn, Zn@C-210, and Zn@C-260. The yield of the precursor TC-Zn was approximately 53.15 wt.%, and the yields of Zn@C-210 and Zn@C260 were approximately 42.58 wt.% and 40.31 wt.%, respectively.

3.2. Characterization of TC-Zn, Zn@C-210, and Zn@C-260

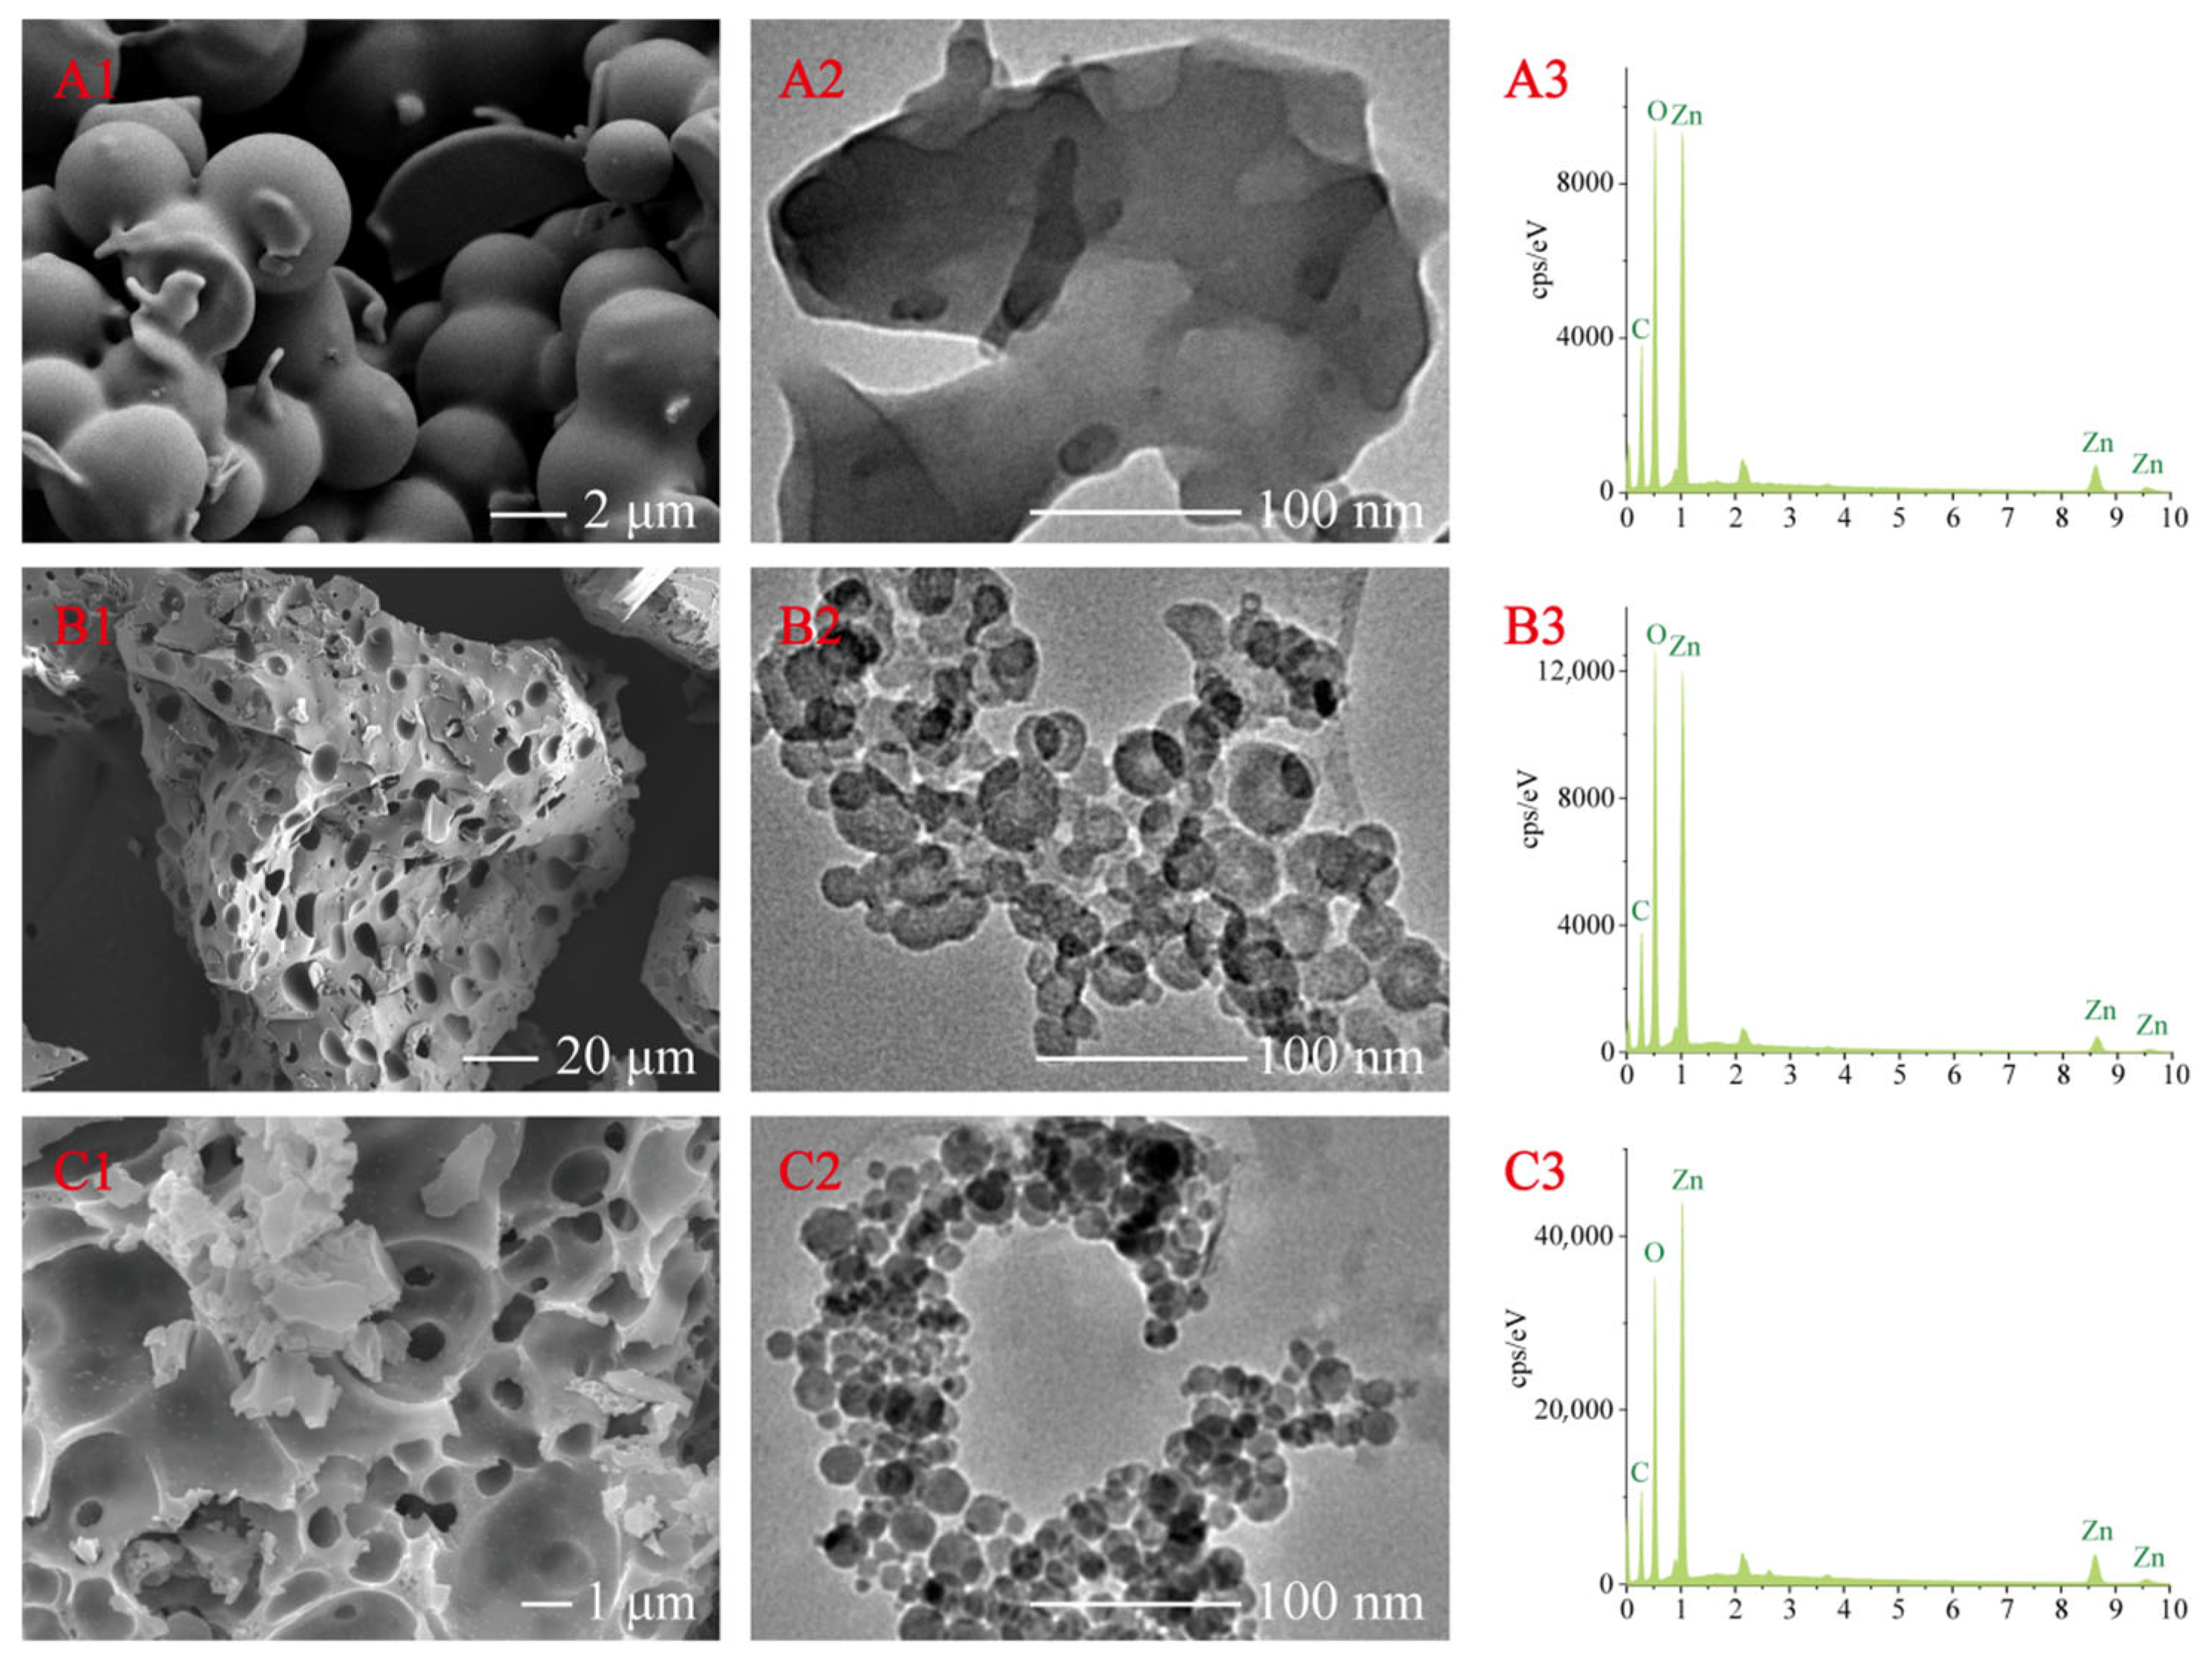
3.2.1. Morphology by SEM and TEM

The TC-Zn complex was synthesized using sodium citrate and zinc chloride as precursors. Based on our previous studies, as well as the literature, the quantum yield of Zn@C was controlled by the structure of the precursors (TC-Zn), the calcination temperature, and the duration of calcination [20]. Therefore, a series of experiments with different reactant ratios, pH, temperature, and time for synthesizing TC-Zn were investigated, and the optimal synthesis conditions of TC-Zn were as follows: the ratio of trisodium citrate to zinc chloride was 1:0.8 at pH 5.0, in a water bath at 50 °C for 5 h. Subsequently, the calcination temperature and time of the QY of Zn@C were analyzed, and optimal zinc-doped CDs (Zn@C-210 and Zn@C-260) were prepared at 210 °C and 260 °C (±1 °C) for 2 h, respectively.
The microscopy and spectroscopy techniques were applied to study the morphology, structure, and surface chemistry of TC-Zn, Zn@C-210, and Zn@C-260 (as shown in Figure 1). The morphological characterization of TC-Zn showed that its appearance was smooth and spherical. After calcination, Zn@C-210 generated pores on the surface, which was caused by the loss of moisture and resulted in defects in molecular lattice formation. The pores formed by Zn@C-260 were larger and more numerous, which might have been caused by carbonization and the collapse of the whole structure. Figure 1(B2,C2) reveals the molecular structures of the Zn@C-210 and Zn@C-260 complexes, which were uniform and well distributed. They were all spherical nanoparticles, and the diameters of Zn@C-210 and Zn@C-260 were in the ranges of 10–60 nm and 3–30 nm, respectively. The hydrodynamic diameter size of Zn@C-210 and Zn@C-260, as measured by dynamic light scattering, was 10.1 nm and 24.1 nm, respectively, which was consistent with the TEM results. The EDX energy spectra (Figure 1(A3,B3,C3)) showed that TC-Zn, Zn@C-210, and Zn@C-260 were mainly composed of C, O, and Zn elements, which was consistent with the results of XPS.

3.2.2. FT-IR

Figure 2A shows the FT-IR spectra of trisodium citrate, TC-Zn, Zn@C-210, and Zn@C-260. It is easily observed that the novel complex (TC-Zn) was formed by sodium citrate and zinc chloride. The stretching vibration peak of saturated C-H at 2948–2874 cm−1 in sodium citrate was weakened to almost invisible in TC-Zn, indicating that the carboxyl group in citrate formed an intermolecular hydrogen bond with the hydroxyl group, so the hydroxyl stretching vibration peak at 3300 cm−1 was more broadened. Therefore, the stretching vibration peak of methylene shifted to a high wavenumber and was covered by the hydroxyl peak at approximately 3400 cm−1. However, the -C-H stretching vibration peak reappeared at 2980 cm−1 for Zn@C-210 and Zn@C-260. This indicates that TC-Zn lost water or that the intermolecular hydrogen bond structure changed during calcination, leading to a narrowing of the O-H stretching vibration peak [21,22]. The stretching vibration of the hydroxyl group in sodium citrate was observed at 3300 cm−1, which shifted to 3400 cm−1 in TC-Zn, Zn@C-210, and Zn@C-260, merging into a wide peak. The peaks of Zn@C-210 and Zn@C-260 located at 3400 cm−1, 1600 cm−1, and 1400 cm−1 were weaker and narrower than those of TC-Zn, indicating that zinc ions might bind to groups on the surface of carbon points, such as -OH, -C=O, and -COO- [23].

3.2.3. XRD

The X-ray diffraction patterns of TC-Zn, Zn@C-210, and Zn@C-260 are illustrated in Figure 2B. No sharp peaks were found, indicating that the three complexes were amorphous structures. Compared with TC-Zn, Zn@C-210 and Zn@C-260 showed a wide peak at approximately 2θ = 20°, suggesting that the organic matter of the CDs connected to Zn2+ was amorphous, and that coated CDs were present in the interior. The results showed that Zn@C-210 and Zn@C-260 were amorphous and tended to be in an amorphous phase with a graphite structure [24]. The peak of 20° corresponded to the layer spacing of widened graphite at 0.41 nm, due to the functional group on the edge of graphite, which increased the steric hindrance. The rich surface functional groups resulted in a number of lattice defects in CDs, leading to a wide peak [25,26]. The highly conjugated region of the sp2 hybrid was the main part of the core of Zn@C-210 and Zn@C-260, with the functional group or sp3 hybrid part existing at the edge, which increased the interlayer spacing. This proved the formation of zinc composite CDs in Zn@C-210 and Zn@C-260.

3.2.4. XPS

Figure 2C presents the XPS scanning spectra of TC-Zn, Zn@C-210, and Zn@C-260, showing that the compositional elements were C, O, and Zn. The O1s energy spectra of TC-Zn, Zn@C-210, and Zn@C-260 are illustrated in Figure 2(D1,D2,D3), respectively. The binding energy of O1s in TC-Zn was composed of four parts: C=O 533.2 eV, C-O 532.3 eV, H-O 531.6 eV, and Zn-O 531.1 eV. Meanwhile, the binding energy of O1s in Zn@C-210 and Zn@C-260 was C=O 533.4 eV, C-O 532.3 eV, H-O 531.6 eV, and Zn-O 531.0 eV. The high-side peak O1s in surface carbonyl groups, carboxy groups, or water (H-O-Zn) shifted to the high-energy offset 0.1 eV, and the low-side peak of O1s in Zn-O shifted to the low-side offset 0.1 eV. The results indicated that part of the water and carboxyl group in Zn@C-210 and Zn@C-260 was lost, which led to the significant reduction in the area of the high-energy side peak.
According to the results of the C1s energy spectra (Figure 2(E1–E3)), there were noticeable differences in chemical structure between TC-Zn and Zn@C-210/Zn@C-260. The peaks at 284.8 eV, 286.4 eV, and 288.4 eV corresponded to -C=C-/-C–C- (sp2 hybridization), C–O (sp3 hybridization), and C=O (sp3 hybridization), respectively. The contents of different carbon bonds in TC-Zn, Zn@C-210, and Zn@C-260 are shown in Table 1. The contents of non-oxygen carbon (-C=C-/-C–C-) in TC-Zn, Zn@C-210, and Zn@C-260 were 43.67 wt.%, 52.26 wt.%, and 50.56 wt.%, respectively. The increase in non-oxygen carbon groups after calcination proved the formation of graphitized carbon nuclei. It also indicated that the active functional groups, including hydroxyl groups and carboxy groups, were found on the surface [25]. The results showed that Zn@C-210 and Zn@C-260 were mainly composed of sp2 hybrid carbon and had functional groups on the surface consistent with the results of TEM and FT-IR.
Additionally, the Zn 2p spectra for TC-Zn, Zn@C-210, and Zn@C-260 (Figure 2(F1,F2,F3), respectively) had significant differences. By deconvolution of the XPS spectra, two characteristic peaks with binding energies of around 1021.98 eV and 1022.28 eV were observed, indicating that two types of Zn species were distinguished in TC-Zn. In consideration of the pure ZnO showing a peak around 1021.6 eV, it was reasonable to ascribe these binding energies of TC-Zn to the Zn-O and Zn-O-H [27]. In Zn@C-210 and Zn@C-260, only one peak appeared, located at 1022.33 eV and 1022.13 eV, respectively, which was consistent with the reported value of 1022.25 eV [28]. The chemical environment of the change due to the coordination reaction indicated that some of the fluorescence was caused by the structural defects of zinc ions or by carbon points. The results were consistent with the two-stage attenuation of the fluorescence lifetime.

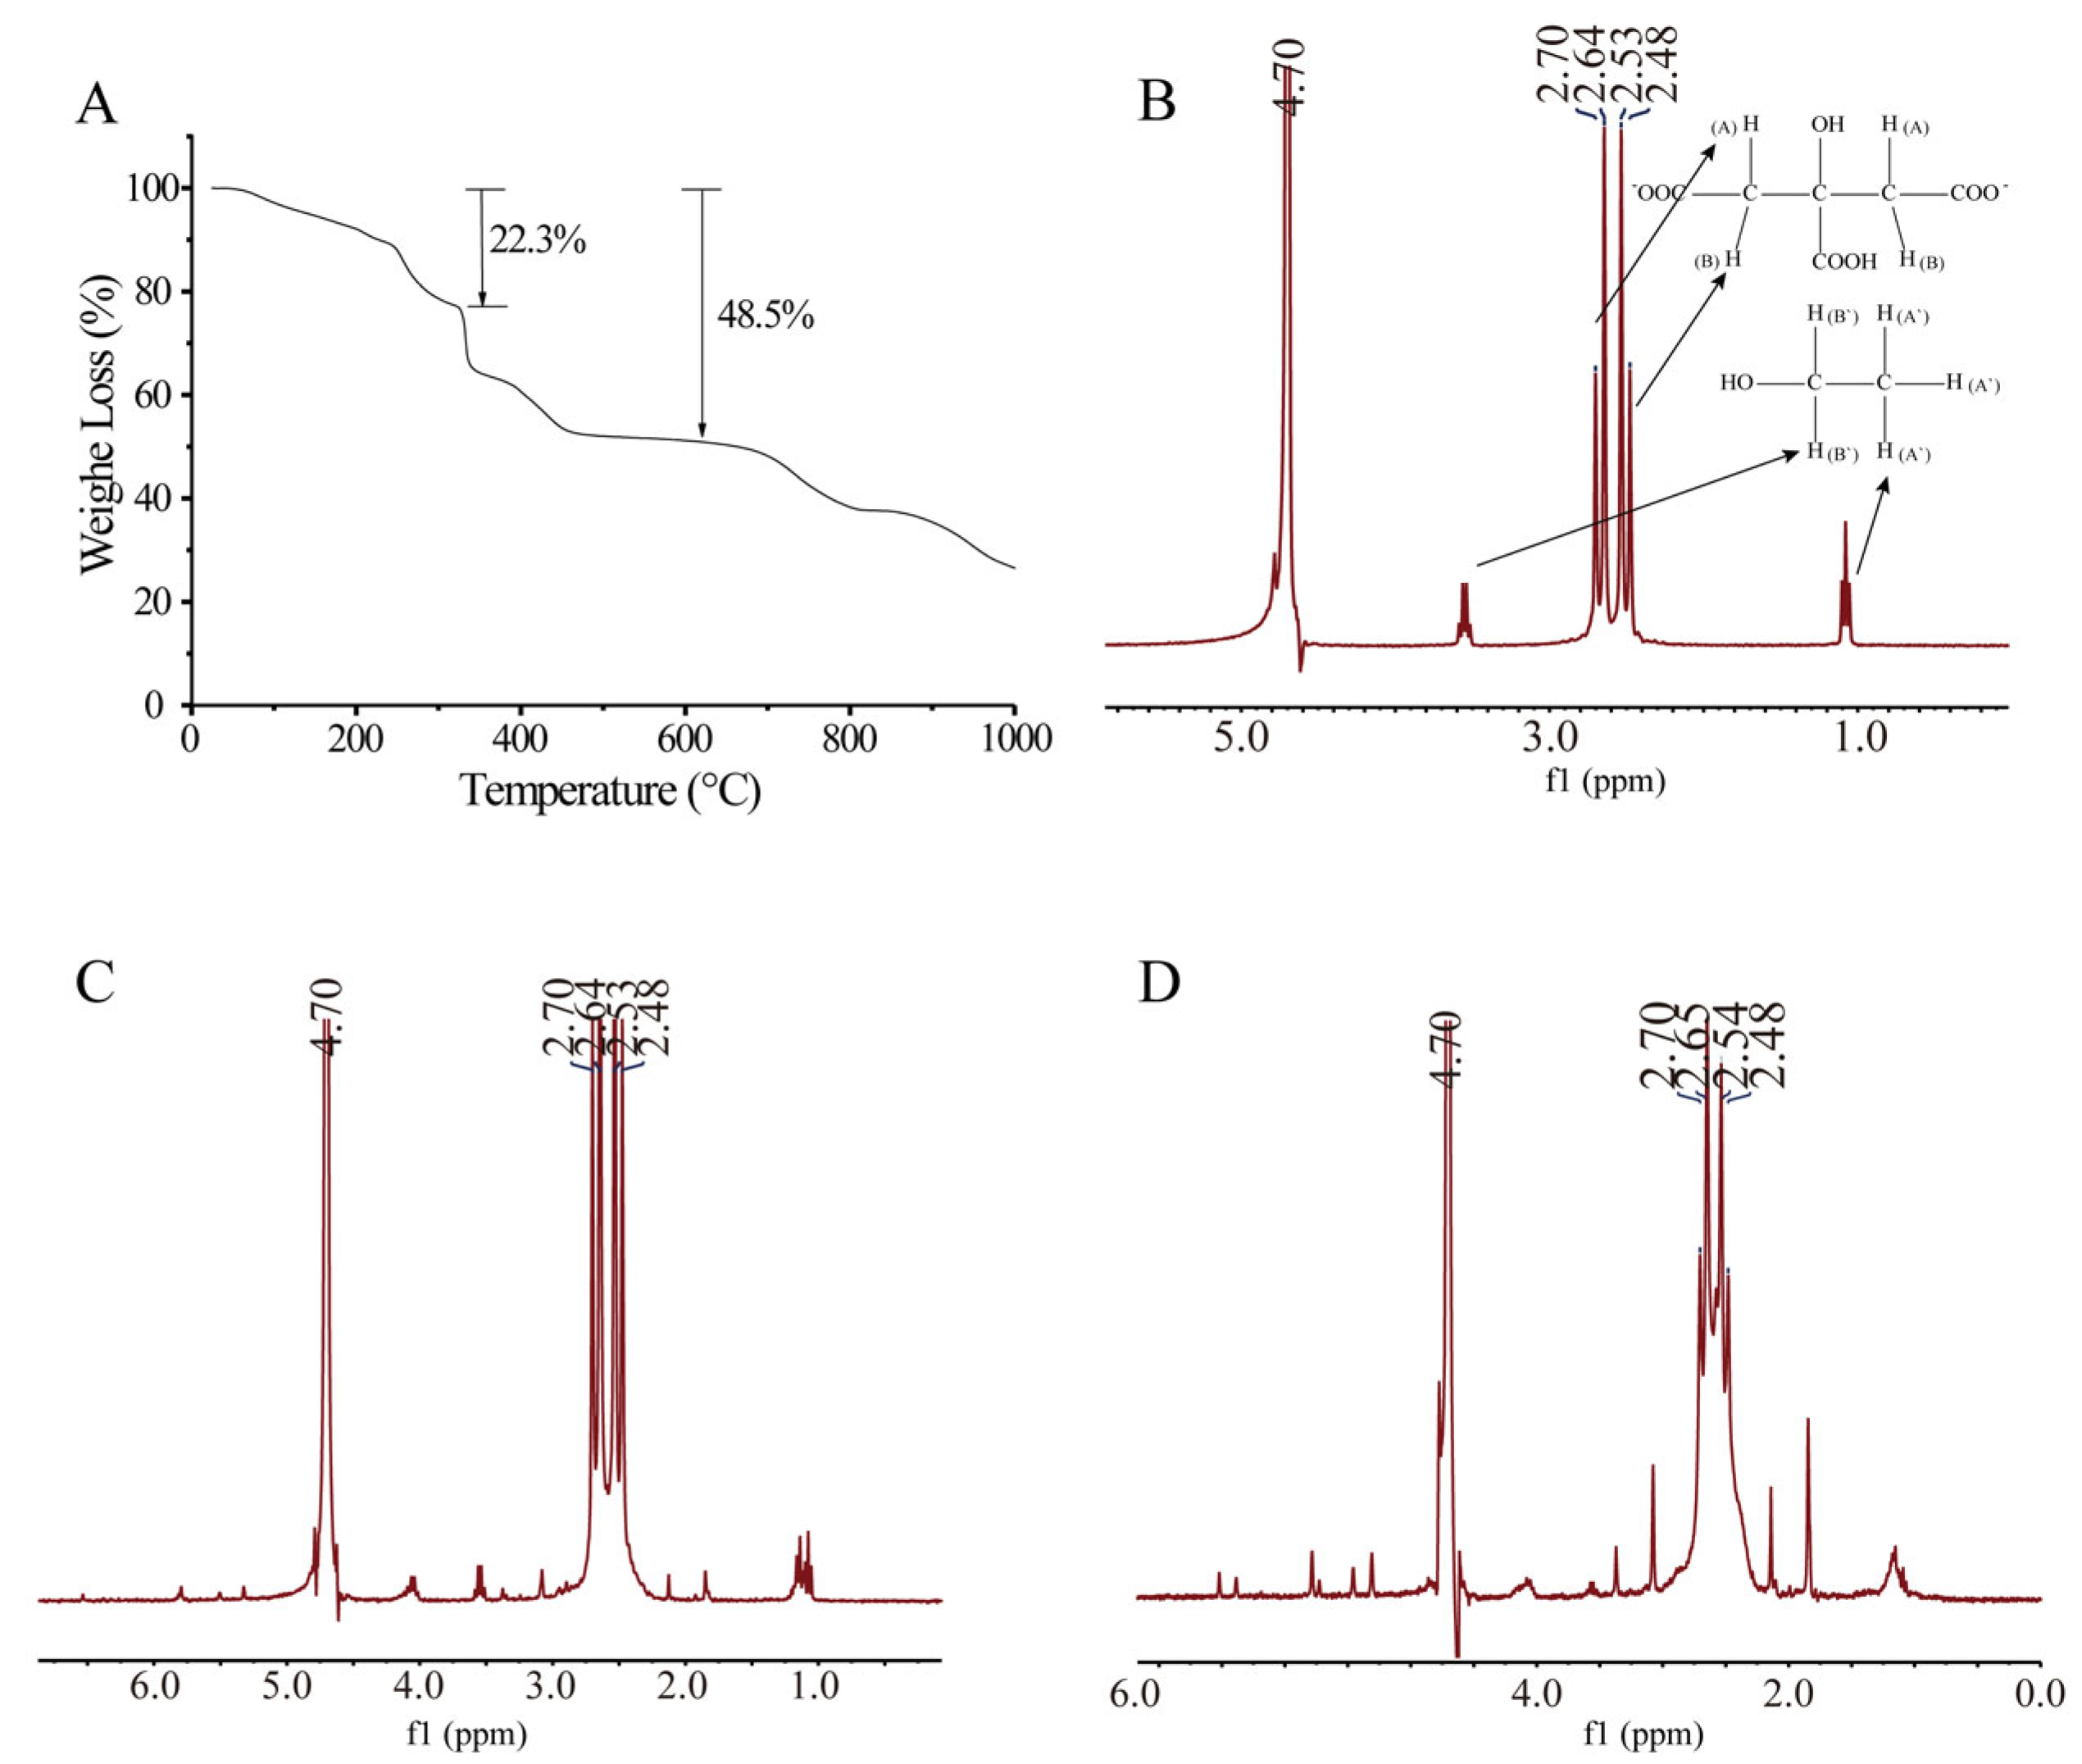
3.2.5. Thermogravimetric Analysis

Thermal analysis was performed to determine the behavior changes, fusion regions, and phase transition range. The TGA curves of TC-Zn are shown in Figure 3A, illustrating the weight loss stages. Firstly, an approximately 22.30% weight loss was observed in the range of 80–300 °C, which was caused by the loss of crystal water in the molecule [29]. This result was precisely the same as the theoretical value of 22.28% of the molecular structure of the precursor TC-Zn (Figure 4). The curve revealed gradual mass loss before 240 °C, indicating minimal structural alteration, primarily attributable to water evaporation. It was suggested that the structure of Zn@C-210 might not have changed significantly. Beyond 240℃, the mass dropped significantly, forming a brief plateau near 325 °C. The mass change observed at 260℃ was about the midpoint of this transition zone, indicating the initiation of structural changes before full carbonization occurs or large carbon particles emerge. When the structural changes were insufficient, zinc-doped CDs failed to form properly. Conversely, under severe carbonization, zinc detached from the surface of the CDs as chemical bonds ruptured, resulting in reduced fluorescence. Zinc doping onto the carbon dots’ surface can markedly enhance their fluorescence intensity, which is why the Zn@C-260 aqueous solution fluoresced strongly. These inferences are consistent with the results of nuclear magnetic resonance studies. There was a clear platform at 500–700 °C with approximately 48.5% weight loss. The TC-Zn was composed of Zn, C, Na, and Cl, and the predicted structure is shown in Figure 4, which was calculated at the theoretical value of 48.50%. Therefore, the results of the TGA were completely consistent with the estimated molecular structure.
The zinc content of TC-Zn was 15.58 wt.%, which was quite close to the theoretical value. According to the structure of TC-Zn speculated in Figure 4, the theoretical zinc content of TC-Zn was calculated to be approximately 16.19%. The zinc contents obtained for Zn@C-210 and Zn@C-260 were 18.73 wt.% and 19.22 wt.%, respectively. A significant increase was observed compared with the zinc content of TC-Zn, which might have been caused by the reduction in total mass after calcination. According to the results, there was no significant difference between Zn@C-210 and Zn@C-260, illustrating that the yield and zinc content in both complexes were similar.

3.2.6. 1H NMR Analysis

The 1H NMR spectra of TC-Zn, Zn@C-210, and Zn@C-260 are shown in Figure 3B,C,D, respectively. The four peaks of TC-Zn corresponding to methylene in citrate were in the same position in Zn@C-210 and Zn@C-260 (δ 2.48, 2.53, 2.64, and 2.70). New peaks caused by fractures of the molecular structure and the formation of carbon points showed that active groups on the surface of Zn@C-210 and Zn@C-260 were generated. The small carbon nucleus was formed by molecular fracture. Compared to TC-Zn, Zn@C-210 exhibited new peaks, although their intensity was relatively low. This suggests that only a small fraction of the structure changed, with the citrate still being the primary component. The structural collapse resulting from limited carbonization and zinc doping can be dispersed by the uncarbonized molecules rather than aggregated, thereby preserving the solid fluorescence. In contrast, Zn@C-260 displays far more complex peaks with higher intensity, signifying substantial structural changes, including alterations to the citrate peak. Consequently, the Zn@C-260 solid-state fluorescence vanishes as the carbon dots formed by structural collapse and zinc doping fail. Therefore, active groups were retained, forming molecular structural defects and showing fluorescence [30]. The 1H NMR results were consistent with the structural consequences that we speculated.

3.3. Formation of Zn@C-210 and Zn@C-260

As an important surface-passivating agent, zinc ion charge can effectively inhibit the aggregation of graphene π-π stacking, thus forming an sp3/sp2 hybrid state. This is a key step to improve the quantum yield of zinc-doped carbon dots (ZnCDs) [31]. Generally, two different mechanisms have been proposed to illustrate the fluorescence mechanism of the CDs: emissive traps, and electronic conjugate structures (as shown in Figure 4) [32,33,34]. The formation mechanism of Zn@C-210 and Zn@C-260 was hypothesized as follows: When the calcination temperature reached above 200 °C, dehydration polymerization would occur between molecules of TC-Zn. With the progress of the reaction, zinc in the formed polyacid polymer would be reacted to form a polymer by intermolecular dehydration, polymerization, and crosslinking with each other, triggering explosive rapid nucleation. Finally, the formed carbon core and hydrophilic surface would be rearranged to form a conjugated system or aromatic hydrocarbons by dehydration reaction.
Zn@C-210 with solid fluorescence was obtained by incomplete carbonization of the precursor TC-Zn after the crosslinking reaction, and Zn@C-260 was obtained by further carbonization. The formation mechanism of Zn@C-210 and Zn@C-260 was similar to the mechanism reported by Poushali Das [35]. From the functional group of the reaction products, this process was consistent with the transformation process of other hydrocarbon carbonization products. The inclusion of zinc ions gave rise to new energy levels of carbon dots, which resulted in more diverse surface states. There were numerous defect bands and functional groups, such as -COOH and -OH, on the surface of the Zn@C-210 and Zn@C-260 particles.

3.4. Fluorescence Analysis

3.4.1. Temperature Effects

The Zn@C calcined at different temperatures for 1 h was characterized by UV-vis spectrophotometry (shown in Figure 5A). The precursor TC-Zn, after calcination at 150 °C, began to show a weak absorption peak at 280 nm, representing the absorption of the R band. The absorption peak was caused by the eigenstate transition composed of the sp2 hybrid region (C=C, C=O), which indicated that CDs began to form.
When the calcination temperature was raised to 200 °C, a new absorption peak appeared at 335 nm, corresponding to the start of the solid fluorescence at this temperature, which was due to the change in the zinc ion coordination structure belonging to p-π* or π-π* transitions of carbonyl groups on the surface of CDs. When the temperature was raised to 260 °C, the peak moved to the left, and a shoulder peak appeared. At the same time, the solid fluorescence decreased greatly. The results showed that with the increase in the reaction temperature, the carbonization degree increased. The carbonyl π-π* transition could not be formed on the surface of the carbon points, which led to fluorescence quenching and solid fluorescence weakening. Citric acid and its salt are commonly used for carbon dots’ synthesis by heating, hydrothermal, or microwave strategies [35,36,37]. It is possible that under experimental conditions, with zinc citrate complexes as precursors, organic fluorophores partially form in the zinc-bonding area, which is consistent with the broad peak at 350 nm (π-π*) in the UV spectrum. The UV−vis absorption spectra of citric acid-based GQDs show one absorption peak at 330 nm, corresponding to a π→π∗ transition attributed to aromatic sp2 [31]. Furthermore, zinc doping led to an evident redshift of the fluorescence spectrum compared with undoped CDs [38].

3.4.2. Excitation Wavelength Effects

The fluorescence spectra of Zn@C-210 and Zn@C-260 with different excitation wavelengths are shown in Figure 5(B1,B2), respectively. Fluorescence excitation dependence was a typical feature of CDs. When the excitation wavelength changed from 310 nm to 380 nm, the emission peak position of Zn@C-210 and Zn@C-260 remained, but the intensity of emission increased and then decreased. Therefore, the fluorescence was mainly bulk luminous, and the emission peak was less affected by the excitation wavelength [39].
Since the structure of the CDs was complex and their surface morphology was not completely clear, so far, the luminous mechanism of the CDs had not been completely determined. Some researchers believe that the excitation wavelength of CDs is independent of the existence of organic fluorescence groups, while the excitation-wavelength-dependent emission is caused by the entire emission of carbon nuclei [37]. This emission, which did not change with the wavelength of excitation, was usually attributed to the surface organic fluorescence group, that is, molecular state fluorescence [40,41,42]. These results might be due to the emission sites or defects caused by zinc modification on the surface of the CDs.

3.4.3. pH Effects

The fluorescence of CDs is very sensitive to pH, and its application is limited by pH [43]. Therefore, Figure 5C,D show the effects of pH on the fluorescence intensity of Zn@C-210 and Zn@C-260, respectively. The results illustrate that the fluorescence intensity of Zn@C-210 and Zn@C-260 was stable in the range of 3.0–12.0, which indicates that Zn@C-210 and Zn@C-260 are less affected by pH and have a wide range of applications.

3.4.4. Anion Solution Effects

Zn@C-210 and Zn@C-260 were dissolved in 0.1 mol/L NaCl, NaNO3, Na2SO4, Na2CO3, NaHCO3, Na3PO4, Na2HPO4, NaH2PO4, NaAc, and KSCN. The different anion solutions’ effects on the fluorescence intensity of Zn@C-210 and Zn@C-260 are shown in Figure 5(E1). The results suggest that the fluorescence intensity of Zn@C-210 and Zn@C-260 changed little in different anion solutions, but Na2CO3, Na3PO4, and Na2HPO4 had enormous influence on the fluorescence intensity of Zn@C-210 and Zn@C-260. White flocculent precipitation was formed in the three solutions, which led to a rapid decay of fluorescence. The content of Zn2+ on the surface of the CDs decreased due to the white flocculent precipitates, because of combining with CO32−, PO43−, and HPO42− [44]. Although the fluorescence intensity weakened, the carbon nucleus retained the same structure, with weak fluorescence of CDs.

3.4.5. Stability of CDs

Zn@C-210 and Zn@C-260 solids were stored in a dry and sealed environment for 4 weeks, and the fluorescence stability of both was investigated (as shown in Figure 5(E2)). Regardless of the use of distilled water or 0.1 mol/L NaCl as the solvent, the fluorescence intensity of Zn@C-210 and Zn@C-260 remained the same after 24 hours and followed the same tendency.
Taking distilled water as the solvent, the intensity of both complexes reduced by approximately 4.8% and 6.4%, respectively, in 48 hours, and then decreased dramatically after 48 hours. The fluorescence intensity dropped to approximately 32.2% and 11.3%, respectively, in a week. Four weeks later, the fluorescence of the Zn@C-210 solution almost disappeared, due to the formation of flocculation precipitation caused by the hydrolysis of Zn2+ on the surface of the CDs. The fluorescence intensity of Zn@C-260 decreased by approximately 50.4% in 4 weeks, suggesting that less available Zn2+ appeared on the surface of Zn@C-260 due to its higher carbonization degree. However, no precipitation was formed in the NaCl solution, indicating that NaCl inhibited the hydrolysis of Zn2+. The fluorescence intensity of Zn@C-210 and Zn@C-260 in NaCl solution was higher than that in distilled water under the same conditions, suggesting that the salt solution had a stable effect on the fluorescence intensity.

3.4.6. Fluorescence Lifetime

The photoluminescence quantum yield of solid Zn@C-210 was as high as 71.50%. The photoluminescence quantum yield of Zn@C-260 aqueous solution was measured by the quinine sulfate method (Φ = 0.54), and the result was 21.1% according to Formula (2):
Φ = Φ R I I R × A R A × η η R 2
where Φ is the quantum yield, I is the measured intensity of luminescent spectra, A is the optical density at the wavelength of excitation, and η is the refractive index.
The fluorescence lifetime of solid Zn@C-210 and Zn@C-260 in water was 6.5 μs and 6.2 μs, respectively (Figure 5(F1,F2)), according to Formulae (3) and (4), in accordance with the double exponential decay kinetics. The long fluorescence lifetimes might be due to the fact that zinc and rich groups on the surface of CDs could provide a better capture effect [43,44,45,46]. This is more suitable for optoelectronics and bioluminescence.
R ( t ) = B 1 e x p ( t τ 1 ) + B 2 e x p ( t τ 2 )
τ = B 1 τ 1 2 + B 2 τ 2 2 B 1 τ 1 + B 2 τ 2
where τ is the fluorescence lifetime, while B1 and B2 are fluorescence decay parameters.

3.5. Mechanism of Fluorescence

In Figure 5A, as the temperature rises, the bright solid-state fluorescence of the zinc-doped carbon dots gradually diminishes, while their fluorescence in aqueous solutions intensifies. With further increases in temperature, the fluorescence intensity rapidly decreases, potentially due to surface defect passivation and adjustments in the energy level structure of the carbon dots. In the solid state, undoped carbon dots typically experience fluorescence quenching due to aggregation-induced π-π stacking and fluorescence resonance energy transfer between particles, resulting in a significant reduction in fluorescence intensity [34,35]. Zinc doping modifies the surface chemical state and band structure of the carbon dots, which reduces direct energy transfer between particles. This may decrease the likelihood of non-radiative transitions among carbon dots by means of surface passivation, thereby suppressing aggregation-induced fluorescence quenching and preserving their luminescent properties in the solid state. The introduction of zinc ions could create new emission centers or enhance existing ones, maintaining efficient radiative transitions even in the solid state. Furthermore, NMR spectra indicate that the surface of citric acid-formed carbon dots is abundant in functional groups such as carboxyl and hydroxyl. These groups may inhibit close packing in the aggregated state through hydrogen bonding or steric hindrance, thus reducing fluorescence quenching. Zinc doping may also decrease non-radiative recombination channels by filling surface defect sites, maintaining high fluorescence efficiency in the solid state. This passivation effect is common in metal-doped carbon dots and is a key mechanism for enhancing optical performance. This could be the primary reason for the high fluorescence quantum yield of Zn@C-210. Zinc ions bind to the carbon matrix via coordination. As the temperature increases, the extent of this coordination changes, thereby modulating the band structure and electron transition paths of the carbon dots, and reducing non-radiative recombination channels. Concurrently, higher temperatures reduce the presence of functional groups such as carboxyl and hydroxyl on the surface of the carbon dots, leading to aggregation-induced fluorescence quenching and the loss of solid-state fluorescence. However, in aqueous solutions, the formation of hydrogen bond networks improves the solution dispersibility. Zinc doping alters the electronic band structure of the carbon dots, creating new surface state levels that promote an increase in radiative recombination efficiency during electron transitions. This could be the primary reason for the strong fluorescence of Zn@C-260 in aqueous solutions, while it does not fluoresce in its solid state. The Zn-O coordination structure resulting from zinc doping can induce metal–ligand charge-transfer effects, markedly increasing the probability of radiative transitions between excited and ground states, thus enhancing the fluorescence intensity. As the temperature continues to rise, the Zn-O coordination structure is disrupted, and the fluorescence of the carbon dots in aqueous solutions is mainly produced by the carbon dots themselves, with the fluorescence intensity rapidly declining. Consequently, the fluorescence generation in zinc-doped carbon dots is closely associated with the number of functional groups on the surface of the carbon dots.

3.6. Acute Toxicity

The respiratory distress, emaciation, posture, mortality, and behavioral, autonomic, and toxic responses of mice receiving different doses of Zn@C-210 and Zn@C-260 were not significantly changed in the low-dose groups. In the 1000 mg/kg body weight Zn@C-210 and Zn@C-260 groups, the mice showed decreased activity, lethargy, and poor appetite within 24 h, which began to normalize 48 hours later. No animal death was found at any dose during the observation period of 14 days, indicating that neither Zn@C-210 nor Zn@C-260 had acute toxicity. Therefore, Zn@C-210 and Zn@C-260 have low toxicity, indicating that Zn@C-210 and Zn@C-260 could be used as potential bioluminescence probes.

3.7. Applications of Zn@C-210 and Zn@C-260

3.7.1. Fluorescence Labeling by Zn@C-210

Zn@C-210 presented good water solubility, low toxicity, white fluorescence in sunlight, and excellent photobleaching resistance, which could be considered useful for applications in fluorescent dyes, printing, marking, etc. A clear font could be seen at 365 nm UV (Figure 6A,B), with the presence of the watermark in daylight. As shown in Figure 5(B2), the maximum emission wavelength of Zn@C-210 remained at about 450 nm under different excitation wavelengths, exhibiting blue fluorescence characteristics. If Zn@C-210 was combined with red and yellow fluorescent materials, it could produce white fluorescence, which is expected for applications in the field of white-light LED. The specific applications need further research.

3.7.2. Detection of Folic Acid by Zn@C-260

With the increase in folic acid concentration, the fluorescence intensity of the solution decreased gradually at 440 nm. Figure 6C shows the linear relationship between the concentration of folic acid and the fluorescence intensity of Zn@C-260 in the range of 2.0 × 10⁻⁵–20.0 × 10⁻⁵ mol/L. The linear equation was as follows: y = −462.49x + 609.23, (R2 = 0.9880). When the concentration of folic acid reached 8.0 × 10⁻⁴ mol/L, the fluorescence of Zn@C-260 could be completely quenched. In order to determine the protocol and reproducibility for folic acid detection, results were obtained six times. The results pointed to a 356.949 (counts) value of average fluorescence intensity, with a relative standard deviation (RSD) of 3.0%, indicating the great potential of this material as a fluorescent probe for chemical sensing.

3.7.3. Biological Imaging by Zn@C-260

Zn@C-260 with high fluorescence yield as a precursor could be used as a fluorescence probe for biological imaging. The cytotoxicity of Zn@C-260 was evaluated by MTT assay (shown in Figure 6D). The results showed that approximately 90% of MCF-7 cells survived after 24 h of incubation at 600 µg/mL, indicating low cytotoxicity of Zn@C-260. High-content screening was used to observe the phagocytic activity of Zn@C-260 by MCF-7 cells. Figure 6E,F show the morphology of MCF-7 cells cultured by Zn@C-260 in bright field and under fluorescence, respectively. The images revealed better fluorescence, suggesting that Zn@C-260 could be used as a fluorescence probe for cell imaging.

4. Conclusions

In summary, an in situ calcination method using zinc citrate complexes as precursors was developed to prepare zinc-doped CDs. It was found that the fluorescence characteristics of zinc-doped carbon dots vary greatly with the change in calcination temperature. By controlling the calcination temperature at 210 °C and 260 °C, Zn@C-210, with the fluorescence lifetime of 6.5 μs in a solid state, and Zn@C-260, with a fluorescence lifetime of 6.2 μs in water, were synthesized, respectively. Zinc ions bind to the carbon matrix via coordination, which is likely the primary reason for the high fluorescence quantum yield of 71.50% for Zn@C-210 in a solid state. The enhanced aqueous fluorescence of Zn@C-260 likely stems from zinc-doping-induced modifications in electronic band structures and surface state configurations, coupled with Zn-O coordination-mediated metal–ligand charge-transfer effects. The fluorescence quenching observed above 260℃ further corroborates the critical role of coordination structures in emission properties. Importantly, both zinc-doped CDs demonstrated excellent biosafety profiles, with no acute toxicity observed even at 1000 mg/kg doses, fulfilling the fundamental requirements for biological applications. The dual functionality of Zn@C-260 as a folate sensor (detection limit: 8.0 × 10⁻⁴ mol/L) and cellular imaging probe (90% cell viability at 600 μg/mL) highlights its potential as a multifunctional nanoplatform. Meanwhile Zn@C-210 has excellent fluorescence in a solid state, which overcomes the fluorescence quenching from the aggregation of solid CDs and shows promise in anti-photobleaching applications for fluorescent marking and white LED development. Compared with the direct mixture calcination of the two, zinc chloride and sodium citrate were prepared as precursors and calcined to show better thermal stability and higher fluorescence efficiency of zinc-doped CDs. These findings not only advance the fundamental understanding of metal-doped carbon dots’ photophysics but also provide practical guidelines for developing targeted biomedical nanomaterials through rational surface engineering and doping strategies.

Author Contributions

Conceptualization, methodology, writing—original draft preparation, data curation, Y.Z.; software, visualization, validation, Y.G. and K.S.; investigation, resources, X.L. (Xiaojing Li); project administration, writing—review and editing, supervision, X.L. (Xiuhua Liu); funding acquisition, J.Z.; writing—review and editing, M.Z.H.K. All authors have read and agreed to the published version of the manuscript.

Funding

This study has been sponsored by Key Science and Technology Research and Development Projects in Henan Province [grant number: 252102311243, 242102310442], the Henan Province International Science & Technology Cooperation Program [grant numbers: 252102520015], and the College Students’ Innovation and Entrepreneurship Training Program [grant number: XJ2024320].

Data Availability Statement

Data will be made available upon request.

Conflicts of Interest

Xiaojing Li is employed by the STA Pharmaceutical Co. The remaining authors declare that this research was conducted in the absence of any commercial or financial relationships that could be construed as potential conflicts of interest.

References

  1. Sen, S.; Bose, A. Carbon dots: A review of innovations, applications, challenges, and future prospects. Inorg. Chem. Commun. 2025, 173, 113852. [Google Scholar] [CrossRef]
  2. Chung, Y.J.; Kim, J.; Park, C.B. Photonic carbon dots as an emerging nanoagent for biomedical and healthcare applications. ACS Nano 2020, 14, 4005–4019. [Google Scholar] [CrossRef] [PubMed]
  3. Liang, K.; Ge, J.; Wang, P. Emerging metal doped carbon dots for promising theranostic applications. Biomed. Mater. 2022, 17, 065001. [Google Scholar] [CrossRef] [PubMed]
  4. Tejwan, N.; Saini, A.K.; Sharma, A.; Singh, T.A.; Kumar, N.; Das, J. Metal-doped and hybrid carbon dots: A comprehensive review on their synthesis and biomedical applications. J. Control. Release 2021, 330, 132–150. [Google Scholar] [CrossRef]
  5. Han, Y.; Tang, B.; Wang, L.; Bao, H.; Lu, Y.; Guan, C.; Zhang, L.; Le, M.; Liu, Z.; Wu, M. Machine learning driven synthesis of carbon dots with enhanced quantum yields. ACS Nano 2020, 14, 1475–1488. [Google Scholar] [CrossRef]
  6. Cheng, X.; Liu, M.; Zhang, Q.; He, M.; Liao, X.; Wan, Q.; Zhan, W.; Kong, L.; Li, L. A novel strategy to enhance the photostability of InP/ZnSe/ZnS quantum dots with Zr doping. Nanomaterials 2022, 12, 4044. [Google Scholar] [CrossRef]
  7. Gao, F.; Huang, J.; Ruan, Y.; Li, H.; Gong, P.; Wang, F.; Tang, Q.; Jiang, Y. Unraveling the structure transition and peroxidase mimic activity of copper sites over atomically dispersed copper-doped carbonized polymer dots. Angew. Chem. Int. Ed. 2023, 62, e202214042. [Google Scholar] [CrossRef]
  8. Li, X.; Fu, Y.; Zhao, S.; Xiao, J.; Lan, M.; Wang, B.; Zhang, K.; Song, X.; Zeng, L. Metal ions-doped carbon dots: Synthesis, properties, and applications. Chem. Eng. J. 2022, 430, 133101. [Google Scholar] [CrossRef]
  9. Liu, J.; Li, Q.; Tu, H.; Feng, J.; Fan, X.; Mi, Z.; Han, H.; Ma, X.; Zhang, Z. Bismuth/manganese-doped carbon dots in calcium phosphate matrix: Dynamic conformational nanoparticles enhancing tumor accumulation, deep penetration, and radiosensitivity. Chem. Eng. J. 2025, 504, 158683. [Google Scholar] [CrossRef]
  10. Hamid, M.A.A.; Elagamy, S.H.; Gamal, A.; Mansour, F.R. Eco-friendly cobalt-doped carbon quantum dots for spectrofluorometric determination of pregabalin in pharmaceutical capsules. J. Pharm. Biomed. Anal. 2024, 248, 116270. [Google Scholar] [CrossRef]
  11. Pei, R.; He, P.; Qin, F.; Ma, J.; Xu, C.; Qin, L.; Gao, W. Light on multi-mode optical properties of carbon dots through rational surface engineering tuning strategies. Chem. Eng. J. 2024, 484, 149459. [Google Scholar] [CrossRef]
  12. Chen, F.; Shen, Z.; Shi, R.; Zhang, X.; Zhang, H.; Li, W.; Lei, B. Carbon dots-mediated plant adaptive responses to abiotic stress. Mater. Res. Bull. 2025, 182, 113137. [Google Scholar] [CrossRef]
  13. Li, S.; Yang, Q.; Liu, X.; Jiang, F.; Xiong, J.; Jiang, P.; Liu, Y. Zn-doped Cu2S quantum dots as new high-efficiency inhibitors against human insulin fibrillation based on specific electrostatic interaction with oligomers. Int. J. Biol. Macromol. 2021, 179, 161–169. [Google Scholar] [CrossRef] [PubMed]
  14. Ashritha, K.S.S.; Rufuss, D.D.W. Carbon quantum dots for sustainable water treatment: A critical review on synthesis, properties, challenges and applications in forward osmosis desalination technologies. Chem. Eng. J. 2025, 514, 163059. [Google Scholar] [CrossRef]
  15. Xu, Q.; Cai, W.; Zhang, M.; Su, R.; Ye, Y.; Li, Y.; Zhang, L.; Guo, Y.; Yu, Z.; Li, S.; et al. Photoluminescence mechanism and applications of Zn-doped carbon dots. RSC Adv. 2018, 8, 17254–17262. [Google Scholar] [CrossRef]
  16. Sohail, M.; Xie, B.; Li, B.; Huang, H. Zn-doped carbon dots-based versatile bioanalytical probe for precise estimation of antioxidant activity index of multiple samples via fenton chemistry. Sens. Actuators B Chem. 2022, 363, 131558. [Google Scholar] [CrossRef]
  17. Kolekar, A.G.; Nille, O.S.; Koparde, S.V.; Patil, A.S.; Waghmare, R.D.; Sohn, D.; Anbhule, P.V. Green, facial zinc doped hydrothermal synthesis of cinnamon derived fluorescent carbon dots (Zn-Cn-CDs) for highly selective and sensitive Cr6+ and Mn7+ metal ion sensing application. Spectrochim. Acta A Mol. Biomol. Spectrosc. 2024, 304, 123413. [Google Scholar] [CrossRef]
  18. Zhang, J.; Gao, X.; Pan, Y.G.; Xu, N.; Jia, L. Toxicology and immunology of Ganoderma lucidum polysaccharides in Kunming mice and Wistar rats. Int. J. Biol. Macromol. 2016, 85, 302–310. [Google Scholar] [CrossRef]
  19. Yang, X.; Zhang, Y.; Liu, W.; Gao, J.; Zheng, Y. Confined synthesis of phosphorus, nitrogen co-doped carbon dots with green luminescence and anion recognition performance. Polyhedron 2019, 171, 389–395. [Google Scholar] [CrossRef]
  20. Zhang, Y.; Li, X.; Li, J.; Khan, M.Z.H.; Ma, F.; Liu, X. A novel zinc complex with antibacterial and antioxidant activity. BMC Chem. 2021, 15, 17. [Google Scholar] [CrossRef]
  21. Huang, Y.; Hu, X.; Li, Y.; Zhong, X.; He, Z.; Geng, Z.; Gan, S. Demystifying the Influence of Precursor Structure on S-Doped Hard Carbon Anode: Taking Glucose, Carbon Dots, and Carbon Fibers as Examples. Adv. Funct. Mater. 2024, 34, 2403648. [Google Scholar] [CrossRef]
  22. Lestari, R.; Kamiya, Y.; Wahyuningsih, T.D.; Kartini, I. Tailoring plastic bag derived carbon dots by sulfur-nitrogen passivation for highly selective Fe (III) ion sensing. Inorg. Chem. Commun. 2025, 175, 114187. [Google Scholar] [CrossRef]
  23. Liang, C.; Xie, X.; Shi, Q.; Feng, J.; Zhang, D.; Huang, X. Nitrogen/sulfur-doped dual-emission carbon dots with tunable fluorescence for ratiometric sensing of ferric ions and cell membrane imaging. Appl. Surf. Sci. 2022, 572, 151447. [Google Scholar] [CrossRef]
  24. Jan, A.; Batool, M.; Akram, S.; Malik, A.H.; Khanday, W.A.; Wani, W.A.; Sheikh, R.A. Functionalized Graphene Quantum Dots (FGQDs): A review of their synthesis, properties, and emerging biomedical applications. Carbon Trends 2025, 18, 100442. [Google Scholar] [CrossRef]
  25. Ramachandran, T.; Khan, R.; Ghosh, A.; Hussien, M.; Kumar, Y.A.; Reddy, N.P.; Moniruzzaman, M. Sustainable carbon electrode materials from biomass for redox flow batteries. Biomass Bioenergy 2025, 198, 107846. [Google Scholar] [CrossRef]
  26. Abdulla, N.S.; Fernandez, M.J.F.; Balanay, M.P. Upcycling biomass waste into luminescent solid-state carbon dots. Next Mater. 2024, 3, 100155. [Google Scholar] [CrossRef]
  27. Pan, D.; Xu, S.; Miao, Y.; Xu, N.; Wang, H.; Song, X.; Gao, L.; Xiao, G. A highly active and stable Zn@C/HZSM-5 catalyst using Zn@C derived from ZIF-8 as a template for conversion of glycerol to aromatics. Catal. Sci. Technol. 2019, 9, 739–752. [Google Scholar] [CrossRef]
  28. Pan, D.; Xu, S.; Miao, Y.; Xu, N.; Wang, H.; Song, X.; Gao, L.; Xiao, G. Biologically active dual functional zinc-doped biomass-derived carbon dots. RSC Sustain. 2024, 2, 3114–3122. [Google Scholar]
  29. Mazrad, Z.A.I.; Kang, E.B.; Nuraeni; Lee, G.; In, I.; Park, S.Y. Temperature-sensitive carbon dots derived from poly(N-isopropylacrylamide) for fluorescence on-off properties. RSC Adv. 2017, 7, 11149–11157. [Google Scholar] [CrossRef]
  30. Kohli, H.K.; Parab, D. Green synthesis of carbon quantum dots and applications: An insight. Next Mater. 2025, 8, 100527. [Google Scholar] [CrossRef]
  31. Ozyurt, D.; Al Kobaisi, M.; Hocking, R.K.; Fox, B. Properties, synthesis, and applications of carbon dots: A review. Carbon Trends 2023, 12, 100276. [Google Scholar] [CrossRef]
  32. Tammina, S.K.; Wan, Y.; Li, Y.Y.; Yang, Y. Synthesis of N, Zn-doped carbon dots for the detection of Fe3+ ions and bactericidal activity against Escherichia coli and Staphylococcus aureus. J. Photochem. Photobiol. B 2020, 202, 111734. [Google Scholar] [CrossRef] [PubMed]
  33. Zuo, G.; Hu, J.; Wang, Y.; Xie, A.; Dong, W. Dramatic red fluorescence enhancement and emission red shift of carbon dots following Zn/ZnO decoration. Luminescence 2019, 34, 759–766. [Google Scholar] [CrossRef]
  34. Ding, H.; Yu, S.; Wei, J.; Xiong, H. Full-Color Light-Emitting Carbon Dots with a Surface-State-Controlled Luminescence Mechanism. ACS Nano 2016, 10, 484–491. [Google Scholar] [CrossRef]
  35. Das, P.; Ganguly, S.; Bose, M.; Mondal, S.; Choudhary, S.; Gangopadhyay, S.; Das, A.K.; Banerjee, S.; Das, N.C. Zinc and nitrogen ornamented bluish white luminescent carbon dots for engrossing bacteriostatic activity and Fenton based bio-sensor. Mat. Sci. Eng. C Mater. 2018, 88, 115–129. [Google Scholar] [CrossRef]
  36. Liu, S.; Liu, R.; Xing, X.; Yang, C.; Xu, Y.; Wu, D. Correction: Highly photoluminescent nitrogen-rich carbon dots from melamine and citric acid for the selective detection of iron(iii) ion. RSC Adv. 2025, 15, 16257–16265. [Google Scholar] [CrossRef]
  37. Bhaisare, M.L.; Talib, A.; Khan, M.S.; Pandey, S.; Wu, H. Synthesis of fluorescent carbon dots via microwave carbonization of citric acid in presence of tetraoctylammonium ion, and their application to cellular bioimaging. Microchim. Acta 2015, 182, 2173–2181. [Google Scholar] [CrossRef]
  38. Li, Y.; Ma, C.; Ma, J.; Guo, W. Promoting potential direct interspecies electron transfer (DIET) and methanogenesis with nitrogen and zinc doped carbon quantum dots. J. Hazard. Mater. 2021, 410, 124886. [Google Scholar] [CrossRef]
  39. Razavi, F.S.; Razavi, Z.S.; Shahsavari, H. Advanced synthesis and biomedical applications of colloidal quantum dots: Innovations in Imaging, drug delivery, and theranostics. Inorg. Chem. Commun. 2025, 178, 114533. [Google Scholar] [CrossRef]
  40. Sharma, S.; Chowdhury, P. Tunable dual photoluminescence from synthesized urea-based carbon quantum dots: A DFT based simulation on structural insights. Opt. Mater. 2024, 153, 115617. [Google Scholar] [CrossRef]
  41. Li, J.; Ma, X.; Ma, M. Preparation and performance study of dye-based carbon quantum dots. Inorg. Chem. Commun. 2023, 150, 110541. [Google Scholar] [CrossRef]
  42. Ghanbarlou, S.; Kahforoushan, D.; Abdollahi, H.; Zarrintaj, P.; Alomar, A.; Villanueva, C.; Davachi, S.M. Advances in quantum dot-based fluorescence sensors for environmental and biomedical detection. Talanta 2025, 294, 128176. [Google Scholar] [CrossRef] [PubMed]
  43. Quang, N.K.; Hieu, N.N.; Bao, V.V.Q.; Phuoc, V.T.; Ngoc, L.X.D.; Doc, L.Q.; Tri, N.M.; Son, L.V.T. Hydrothermal synthesis of carbon nanodots from waste wine cork and their use in biocompatible fluorescence imaging. New Carbon Mater. 2022, 37, 595–602. [Google Scholar] [CrossRef]
  44. Arul, E.; Chandrasekaran, P.; Sivaraman, G.; Sethuraman, M.G. Biogenic preparation of undoped and heteroatoms doped carbon dots: Effect of heteroatoms doping in fluorescence, catalytic ability and multicolour in-vitro bio-imaging applications–A comparative study. Mater. Res. Bull. 2023, 162, 112204. [Google Scholar] [CrossRef]
  45. Promcharoen, P.; Chumkaeo, P.; Charoenchaidet, S.; Somsook, E. PET-derived heteroatom-doped carbon quantum dots as color-modulated solid-state fluorescent materials. RSC Adv. 2025, 15, 14420–14427. [Google Scholar] [CrossRef]
  46. Ahmed, N.; Abbas, A.; Qamar, T.H.; Hassan, S.U.; Jamali, S.B.; Deng, L. Highly efficient, ultralong-lifetime, phosphorescent nitrogen-doped carbon dots via multi-confinement for anticounterfeiting applications. J. Alloys Compd. 2025, 1013, 178586. [Google Scholar] [CrossRef]
Figure 1. SEM (1), TEM (2), and EDX energy spectra (3) of TC-Zn (A), Zn@C-210 (B), and Zn@C-260 (C).
Carbon 11 00048 g001
Figure 2. FT-IR (A), XRD (B), XPS scanning spectra (C), and XPS spectra for TC-Zn (1), Zn@C-210 (2), and Zn@C-260 (3); O1s (D), C1s (E), and Zn2p (F) spectra.
Carbon 11 00048 g002
Figure 3. TGA (A); 1H NMR spectra of TC−Zn (B), Zn@C−210 (C), and Zn@C−260 (D).
Carbon 11 00048 g003
Figure 4. The predicted structure and mechanism of TC-Zn and Zn@C.
Carbon 11 00048 g004
Figure 5. The UV−vis spectra (A) of Zn@C at different temperatures; the fluorescence spectra of Zn@C−210 (B1) and Zn@C−260 (B2) at different excitation wavelengths; the fluorescence spectra of Zn@C−210 (C1,D1) and c at different pH; the fluorescence spectra of Zn@C−210 and Zn@C−260 in different anion solutions (E1) and at different times (E2); the fluorescence lifetime of solid Zn@C−210 (F1) and Zn@C−260 solution (F2).
Carbon 11 00048 g005
Figure 6. Writing using Zn@C-210 in sunlight (A) and under fluorescence at 365 nm (B). The relationship between the concentration of folic acid and the fluorescence intensity of Zn@C-260 (n = 5) (C). Cell viability (D) estimated by MTT assay in MCF-7 cells. The images of Zn@C-260 in bright field (E) and under fluorescence (F) in MCF−7 cells.
Carbon 11 00048 g006
Table 1. The yields, contents of zinc, and different carbon bonds in TC-Zn, Zn@C-210, and Zn@C-260 (%, n = 5).
SamplesYieldZinc Content-C=C-/-C–C--C–O--C=O-
284.8 eV286.4 eV288.5 eV
TC-Zn53.15 ± 0.1515.58 ± 0.0843.6722.1934.14
Zn@C-21042.58 ± 0.0618.73 ± 0.1252.2613.4434.30
Zn@C-26040.31 ± 0.0619.22 ± 0.0350.5613.7335.71
Disclaimer/Publisher’s Note: The statements, opinions and data contained in all publications are solely those of the individual author(s) and contributor(s) and not of MDPI and/or the editor(s). MDPI and/or the editor(s) disclaim responsibility for any injury to people or property resulting from any ideas, methods, instructions or products referred to in the content.

