1. Introduction
Urea is a widely utilized fertilizer that has been demonstrated to enhance agricultural productivity and ensure global food security. Its applications extend to various sectors, including pharmaceuticals, resins, and numerous industrial sectors [
1,
2,
3]. The current predominant approach to industrial urea production involves the utilization of Bosch–Meiser processes. In these processes, ammonia (NH
3) reacts with carbon dioxide (CO
2) under elevated temperatures (150–200 °C) and substantial pressures (150–250 bar). These processes are characterized by their substantial energy demands, accounting for approximately 2% of global energy consumption. This energy consumption is a significant contributor to carbon emissions, underscoring the environmental implications of these industrial processes [
4,
5,
6]. Furthermore, nitrate (NO
3−) pollution resulting from industrial and agricultural activities significantly contaminates water resources and disrupts ecosystems. Consequently, the development of sustainable methods for urea synthesis that concurrently mitigate carbon emissions and nitrate pollution is imperative. The integration of electrocatalytic CO
2 reduction with nitrogen-containing sources presents a novel paradigm for sustainability, offering an energy-efficient and environmentally friendly alternative. This approach effectively balances the carbon and nitrogen cycles, thereby facilitating the conversion of CO
2 and nitrogen-rich wastewater into valuable chemical products [
7,
8].
The electrocatalytic carbon–nitrogen (C-N) coupling reaction was discovered more than two decades ago and has recently regained significant attention as a promising approach to mitigating carbon emissions. In the process of urea electrosynthesis, CO
2 and NO
3⁻ undergo a co-reduction process involving 16 electron transfers. This process is often complicated by parallel reactions, including the hydrogen evolution reaction (HER), carbon dioxide reduction reaction (CO
2RR), and nitrate reduction reaction (NO
3RR) [
9,
10]. Therefore, it can be concluded that catalysts that are efficient in both CO
2RR and NO
3RR are essential for optimal urea synthesis. In electrocatalytic applications, catalysts play a crucial role in enhancing reaction efficiency and optimizing energy conversion processes [
11,
12,
13,
14]. Considerable research efforts have been directed toward the development of catalysts derived from metal materials. For instance, Liu et al. developed FeNi
3 alloy nanoparticles supported on N-doped porous carbon (FeNi
3/NC) for electrocatalytic urea synthesis from CO
2 and NO
3−. The catalyst delivered a urea yield of 496.5 mg h
−1 mg
cat−1 with a Faradaic efficiency of 16.58% at −0.9 V vs. RHE. Electrochemical measurements and in situ Raman spectroscopy indicated a synergistic C-N coupling activity at the Fe-Ni alloy sites [
15]. He et al. developed a CuO/In
2O
3 heterojunction electrocatalyst, where the formation of interfacial structures induced abundant oxygen vacancies that enhanced NO
3− activation, while the heterojunction interface facilitated CO
2 adsorption and activation. The synergistic interaction between oxygen vacancies and heterointerfaces promoted efficient C-N coupling, resulting in a urea yield of 794.72 μg mg
−1 h
−1 and a Faradaic efficiency of 9.11% at −0.9 V vs. RHE. Urea formation was proposed to proceed via the surface-mediated coupling of *NH
2 and *CO
2 intermediates [
16]. Yu et al. demonstrated that engineering semiconductor behavior on catalyst surfaces effectively suppresses HER. Specifically, they showed that CO
2 adsorption on n-type In(OH)
3 induced p-type behavior, creating a proton-repellent hole accumulation layer that inhibited HER. This, in turn, enhanced urea selectivity to 53.4% [
17]. Furthermore, doping has been widely adopted to improve catalytic performance. Wang et al. anchored single Cu atoms onto a CeO
2 support (L-Cu
1-CeO
2), achieving an average urea yield of 52.84 mmol h
−1 g
cat−1 at −1.6 V vs. RHE, a nearly 3.5 times improvement over pristine CeO
2 [
18]. Similarly, He et al. introduced the heteroatom In into TiO
2, creating abundant oxygen vacancies (Vo). A combination of experimental and theoretical analyses revealed that Vo significantly enhanced NO
3RR activity, while In incorporation improved CO
2 adsorption capability, collaboratively boosting electrocatalytic urea synthesis performance [
19].
In the process of electrocatalysis, metal properties have been demonstrated to directly influence catalytic performance. Copper (Cu) has attracted considerable attention in the field of nitrate reduction due to its strong adsorption capacity for oxygen-containing intermediates (*NO
3−, NO
2−) and its moderate hydrogen adsorption strength. Indium (In) has been observed to exhibit exceptional selectivity (>90%) towards formic acid (HCOOH) formation in CO
2RR, and its p orbital interaction with the π orbital of oxygen-containing intermediates has been shown to stabilize crucial intermediates such as *OCHO [
20,
21]. The combination of these metals has the potential to leverage their complementary catalytic functions, thereby expanding the range of possibilities for the design of urea electrosynthesis catalysts. Titanium dioxide (TiO
2) has also been the focus of extensive research due to its low cost, chemical stability, environmental friendliness, and tunable electronic properties, which make it an ideal support material [
22]. Wang et al. anchored PdCu alloy nanoparticles on TiO
2 nanosheets, proposing that urea formation occurs via the thermodynamically favorable coupling of surface-bound N=N species and CO intermediates. PdCu-TiO
2 exhibited a urea yield of 201.8 μg h
−1 mg
cat−1 and a Faradaic efficiency of 8.92% at −0.4 V vs. RHE [
23]. The research by Zheng et al. involved the doping of Cu into TiO
2 nanotubes, which resulted in the formation of abundant oxygen vacancies and Ti
3+ defect sites. This process led to an enhancement in nitrite adsorption and activation. The favorable alignment of key intermediates (CO* and NH
2*) on the catalyst surface played a crucial role in accelerating urea synthesis [
24]. As shown in
Table S1, various reported catalysts demonstrate strengths in either urea yield or Faradaic efficiency. Nonetheless, a comprehensive understanding of the electrocatalytic urea synthesis process is still lacking. This is primarily due to the complexity of the C–N coupling pathway, which involves multi-electron transfer steps and poses significant challenges for mechanistic validation. Therefore, alongside the development of high-performance catalysts, gaining mechanistic insight is equally crucial. Continuous innovation in catalyst design is essential to advance the field and inspire future research directions.
In this study, we have innovatively prepared a highly efficient catalyst by co-doping copper and indium (CuIn-TiO
2) on TiO
2 nanoscale particles. The synthesis of urea is catalyzed by the process of electrocatalysis of C-N bonding. Preliminary theoretical calculations indicate that CuIn-TiO
2 demonstrates superior electronic conductivity and is more conducive to the adsorption of *CO
2 and *NO
3− intermediates. It is noteworthy that the CuIn-TiO
2 catalyst demonstrated a urea yield of 411.8 μg h
−1 mg
cat−1 and 6.7% Faradaic efficiency at −0.8 V vs. RHE, underscoring its superior electrocatalytic performance in comparison to numerous reported catalysts (see
Table S1 for details). The present work proposes a novel bimetallic co-doped synergistic strategy for the design of efficient urea electrocatalytic synthesis catalysts.
2. Experimental Section
2.1. Chemicals and Materials
Tetrabutyl titanate (C16H36O4Ti) 98.0%, potassium bicarbonate (KHCO3) 99.5%, thiosemicarbazide (CH5N3S) 99%, and potassium nitrate—15N (K15NO3) 98.5% were purchased from Aladdin Industrial Corporation; copper nitrate trihydrate (Cu(NO3)2·3H2O) 99.99%, indium nitrate hydrate (In(NO3)3) 99.99%, diacetyl monoxime (C4H7NO2) 99%, sodium hypochlorite (NaClO) available chlorine ≥ 10%, and potassium nitrite (KNO2) 97% were purchased from Macklin Biochemical Co., Ltd., Shanghai, China; glucose (C6H12O6) 99%, isopropanol (C3H8O) 99.7%, absolute ethyl alcohol 99.7%, potassium nitrate (KNO3) analytical reagent, ferric chloride (FeCl3) reagent grade, sodium hydroxide (NaOH) analytical reagent, sodium citrate dihydrate (C6H5Na3O7·2H2O) analytical reagent, salicylic acid (C7H6O3) 99.5%, sodium nitroprusside dihydrate (Na2[Fe(CN)5NO]·2H2O) 98%, sulfanilamide (C6H8N2O2S) analytical reagent, N-(1-Naphthyl)ethylenediamine dihydrochloride (C12H16Cl2N2) analytical reagent, phosphoric acid (H3PO4) analytical reagent, and sulfuric acid (H2SO4) analytical reagent were received from Sinopharm Chemical Reagent Co., Ltd. Shanghai, China; hydrochloric acid (HCl) analytical reagent was purchased from Chron Chemicals, Chengdu, China; deuterated dimethyl sulfoxide (DMSO-d6) analytical reagent was purchased from Innochem Beijing, China; urease, model U1500-20KU, was purchased from Sigma-Aldrich, St. Louis, MO, USA.
2.2. Synthesis of TiO2 Particles
The synthesis of TiO
2 was carried out based on a modified literature-reported protocol [
25]. The initial preparation of carbon spheres involved a hydrothermal procedure. Nine grams of glucose was dissolved in 90 mL of deionized water to form a homogeneous solution. This solution was then sealed in a 100 mL autoclave and heated at 180 °C for 12 h. Following the completion of the reaction, the product was rinsed sequentially with water and ethanol, then subjected to three rounds of centrifugation. Finally, it was vacuum-dried at 80 °C for 8 h to yield the desired carbon spheres.
Subsequently, TiO2 particles were generated via a sol-gel approach. A mixture of 5 mL of tetrabutyl titanate and 0.1 g of carbon spheres was dispersed in 50 mL of anhydrous ethanol by means of ultrasonication. Following 2 h of magnetic stirring, an ethanol–water mixture (4:1 v/v) was gradually introduced dropwise, resulting in observable stratification. The solution was left undisturbed for 1 h, then washed thoroughly with water and ethanol, subjected to centrifugation, and vacuum-dried again at 80 °C for 6 h. Finally, the obtained precursor was calcined under a nitrogen atmosphere at 500 °C for 4 h with a ramp rate of 5 °C/min to yield TiO2 nanoscale particles.
2.3. Synthesis of CuIn-TiO2
The synthesis procedure for CuIn-TiO2 closely follows the preparation of TiO2, with the primary difference being the addition of metal salts as dopants. Notably, Cu and In were introduced before the formation of the TiO2 precursor, with tetraisobutyl titanate serving as the titanium source, as typically used in TiO2 synthesis. The precursors utilized for the Cu and In doping processes were copper nitrate trihydrate (Cu(NO3)2·3H2O) and indium nitrate hydrate (In(NO3)3·xH2O), respectively. Specifically, to initiate the co-doping, 199.6 mg of Cu(NO3)2·3H2O and 133.6 mg of In(NO3)3·xH2O were initially added to the precursor solution. Thereafter, a 4:1 ethanol–water solvent was introduced gradually, with continuous stirring, to complete the reaction. Subsequently, the reaction mixture was permitted to stand for approximately 12 h, resulting in the formation of a gel. Following the drying and calcining processes, the resulting product was designated as 7.5% CuIn-TiO2, where the percentage denotes the mass ratio of the total dopant metal (Cu and In) to titanium. To this end, additional CuIn-TiO2 samples with doping ratios of 5% and 10% were prepared by adjusting the masses of the metal salt precursors accordingly.
2.4. Synthesis of Cu-TiO2 and In-TiO2
Cu-TiO2 and In-TiO2 were synthesized using identical procedures to CuIn-TiO2, differing only in the specific metal precursors used. For Cu-TiO2, a quantity of 199.6 mg (Cu(NO3)2·3H2O) was introduced into the reaction solution, whereas for In-TiO2, only 133.6 mg of In(NO3)3·xH2O was utilized.
2.5. Characterization of Catalysts
The electrocatalysts were characterized using field emission scanning electron microscopy (SEM, ZEISS VLTRA-55, Oberkochen, Germany) and transmission electron microscopy (TEM, FEI Tecnai G2 F20, Hillsboro, OR, USA). X-ray diffraction (XRD) was performed using a D8 ADVANCE X-ray diffractometer (BRUKER AXS GMBH, Karlsruhe, Germany). X-ray photoelectron spectroscopy (XPS) analysis was conducted on an ESCALAB 250 Xi X-ray photoelectron spectrometer, (Thermo Scientific, Waltham, MA, USA). The quantification of the catalytic reaction products was performed using a GC9790 plus gas chromatograph (FULI Instruments, Zhejiang, China). 1H nuclear magnetic resonance (NMR) tests were investigated using an Ascend 600 MHz NMR spectrometer (Bruker, Billerica, MA, USA).
2.6. Electrochemical Measurements
All electrochemical measurements were conducted in a three-electrode H-type cell using a CHI 760F electrochemical workstation. A Nafion 117 membrane (Dupont, Wilmington, DE, USA), which had been pretreated prior to use, was utilized to separate the cathodic and anodic chambers. The working electrode was prepared by drop-casting the catalyst ink onto carbon paper (Hesen), while a carbon rod and a saturated KCl-filled Ag/AgCl electrode served as the counter and reference electrodes, respectively. The catalyst ink was prepared by ultrasonically dispersing 2 mg of electrocatalyst for 40 min in a mixed solvent containing deionized water (350 μL), isopropanol (600 μL), and a 5 wt% Nafion solution (50 μL). Subsequently, 50 μL of the homogeneous dispersion was deposited onto half of the carbon paper, which has a geometric surface area of 1 × 2 cm−2.
Prior to the electrochemical measurements, CO
2 gas (99.999%) was continuously introduced into the electrolyte at a flow rate of 50 sccm for 30 min to achieve complete saturation and degassing. During the electrocatalytic process, the flow rate was reduced to 30 sccm and maintained for 30 min. Subsequent to the completion of the experiment, the catholyte was collected for subsequent analysis. All the sample tests were conducted in an electrolyte solution of 0.1 M KHCO
3 containing 50 mM KNO
3. All applied potentials were converted to the reversible hydrogen electrode (RHE) scale using the following equation:
2.7. ECSA Measurements
The determination of the catalyst’s electrochemical active surface area (ECSA) was performed through the implementation of double-layer capacitance (Cdl) measurements, which were conducted using a CHI 760F workstation. All the sample tests were conducted in an electrolyte solution of 0.1 M KHCO3 containing 50 mM KNO3. CV curves were recorded in the non-Faradaic region (0.61–0.85 V vs. RHE) at scan rates ranging from 50 to 100 mV s−1. The current at 0.73 V vs. RHE was extracted from the center of each curve, and the average of their absolute values was taken as the Y-axis. The scan rates were plotted on the X-axis, and the slope of the resulting line corresponds to the Cdl value.
2.8. EIS Measurements
The linear sweep voltammetry (LSV) curve of the catalyst was initially recorded using a CHI 760F workstation. All the sample tests were conducted in an electrolyte solution of 0.1 M KHCO3 containing 50 mM KNO3. The potential corresponding to a current density of 10 mA cm−2 was utilized as the initial potential for the electrochemical impedance spectroscopy (EIS) measurements. The frequency range was set from 0.1 to 106 Hz, with an amplitude of 5 mV. The resulting data were then analyzed and modeled using Zview 2.70 software.
2.9. Quantification of NH3 and Urea
The quantification of NH
3 was performed using the indophenol blue method in conjunction with UV-Vis spectrophotometry [
26]. In a typical procedure, 2.0 mL of the electrolyte was sequentially mixed with 2.0 mL of a 1 M NaOH solution (containing 5 wt% sodium citrate and 5 wt% salicylic acid), 1.0 mL of a 0.05 M sodium hypochlorite solution, and 0.2 mL of a 1 wt% sodium nitroprusside dihydrate solution. The resulting solution was stored in the dark for 2 h, after which the optical density between 550 and 750 nm was measured. The NH
3 concentration was determined from a calibration curve based on its absorbance at 655 nm. The urea concentration was calculated based on enzymatic hydrolysis using urease. Specifically, 0.2 mL of urease solution (5 mg·mL⁻
1) was added to 1.8 mL of electrolyte and incubated at 37 °C for 1 h to catalyze the hydrolysis of urea into CO
2 and NH
3 (1:2 stoichiometry). The resulting NH
3 was quantified using the same method as previously described, and the urea concentration was subsequently deduced.
The mole concentration of urea (m
urea) was obtained by the following equation:
where m
2 and m
1 are the NH
3 concentrations after and before the decomposition of urease, respectively.
The quantification of urea concentration was performed through the implementation of a colorimetric method that was based on diacetyl monoxime (DAMO) and thiosemicarbazide (TSC) [
26]. The color reagent (Solution B) was prepared by first dissolving 5 g of DAMO and 100 mg of TSC in deionized water. The solution was then brought to a final volume of 1000 mL. Conversely, the acidic iron solution (Solution A) was formulated by combining 100 mL of concentrated phosphoric acid, 300 mL of concentrated sulfuric acid, and 600 mL of deionized water, followed by the incorporation of 100 mg of FeCl
3. The measurement was conducted by sequentially mixing 1 mL of the electrolyte sample with 1 mL of Solution B and 2 mL of Solution A. The resulting mixture was then subjected to heating at 100 °C for a duration of 15 min. Following this heating step, the mixture was allowed to cool to room temperature, which is equivalent to 25 °C. The colored complex’s degree of absorption was recorded using UV-Vis spectrophotometry within the range of 450–650 nm. The urea concentration was determined based on a calibration curve derived from standard urea solutions, with the characteristic peak intensity measured at 525 nm.
The urea yield rate could be obtained by following the equation below:
where
c represents the urea concentration (μg·mL
−1);
v represents the electrolyte volume (mL);
t represents the electrolysis time (h); and
m represents catalyst loading (mg).
The FE of urea can be calculated using the following equation:
where n represents the number of electron transfers, which is 16; F is the Faraday constant (96,485.3 C·mol
−1);
c is the urea concentration;
v is the electrolyte volume (mL); and Q is the electric quantity.
The FE of NH
3 was calculated using the following equation:
where n denotes the number of electrons transferred, which is 8;
F is the Faraday constant (96,485.3 C·mol
−1);
c is the NH
3 concentration;
v is the electrolyte volume (mL), and Q denotes the electric quantity.
2.10. Quantification of CO and H2
The gaseous products were quantified by gas chromatography. The presence of H₂ and CO was determined through the use of a thermal conductivity detector (TCD) and a flame ionization detector (FID), respectively. The Faradaic efficiencies (FEs) of H
2 and CO were calculated according to the following equation:
where n denotes the number of electron transfers, which is 2; F represents the Faraday constant (96,485.3 C·mol
−1); S
1 stands for the product peak area; and C
2 stands for the standard gas product concentration. P is a standard atmospheric pressure (101,325 Pa), and V stands for the gas flow rate of CO
2 (mL·min
−1). S
2 is the standard gaseous product peak area. I is the total current. R is 8.314 J·mol
−1·K
−1, and T is 298.15 K.
2.11. Quantification of NO2−
The color reagent was prepared by dissolving 8.0 g of sulfanilamide, 0.4 g of N-(1-naphthyl) ethylenediamine dihydrochloride, and 20 mL of phosphoric acid (ρ = 1.685 g·mL
−1) in 100 mL of deionized water. For the measurement, 0.5 mL of electrolyte was diluted to 5 mL, followed by the addition of 0.1 mL of the color reagent. Following a thorough mixing process, the solution was permitted to react for a period of 20 min. UV-Vis absorption was recorded in the range of 440–640 nm, and the nitrite (NO
2−) concentration was determined using a calibration curve based on the absorbance at 540 nm. The FE for NO
2− was calculated according to the following equation:
where
n represents the number of electron transfers, which is 2;
F represents the Faraday constant (96,485.3 C·mol
−1);
c stands for the NO
2− concentration;
v stands for electrolyte volume; and Q represents the electric quantity.
2.12. H NMR Measurements
To determine the nitrogen source in the synthesized urea, isotope labeling experiments using 14N and 15N were conducted. The urea produced was first hydrolyzed into NH4+ using urease. Subsequently, 50 μL of hydrochloric acid was added to 500 μL of the electrolyte solution, followed by the addition of 100 μL of DMSO-d6 as the deuterated solvent. The final analysis was performed on a 600 MHz NMR spectrometer, with spectra acquired over 64 accumulated scans.
2.13. Theoretical Calculations
The crystallographic information file (CIF) of TiO
2 was obtained from the Inorganic Crystal Structure Database (ICSD), and the computational model was constructed using the Hongzhiwei computational platform. Density functional theory (DFT) calculations were performed using the first-principles calculation software DS-PAW from Hongzhiwei Device Studio. The Perdew–Burke–Ernzerhof (PBE) functional within the generalized gradient approximation (GGA) was applied to treat the exchange–correlation interactions between electrons [
27]. Structural relaxation calculations were executed employing a 2 × 2 × 1 Gamma-centered k-point grid, with a cutoff energy designated at 450 eV. The convergence criterion for the structural relaxation and energy calculations was set to an atomic force of 0.03 eV Å
−1 [
28]. To circumvent interactions between different unit cells, a vacuum layer of 15 Å was implemented along the Z-axis direction of the TiO
2 unit cell. The density of states (DOS) was calculated using the aforementioned parameters to obtain information on electronic interactions during the reaction process.
The adsorption energy of the key intermediate in urea synthesis (E
(CO2)/E
(NO3−)) is determined by the following formula:
The expression E(CO2+slab)/E(NO3−+slab) denotes the energy of the CO2/NO3− adsorbed on the substrate slab system, while E(CO2)/E(NO3−) represents the energy of CO2/NO3− alone, and E(slab) signifies the energy of the substrate slab.
3. Results and Discussion
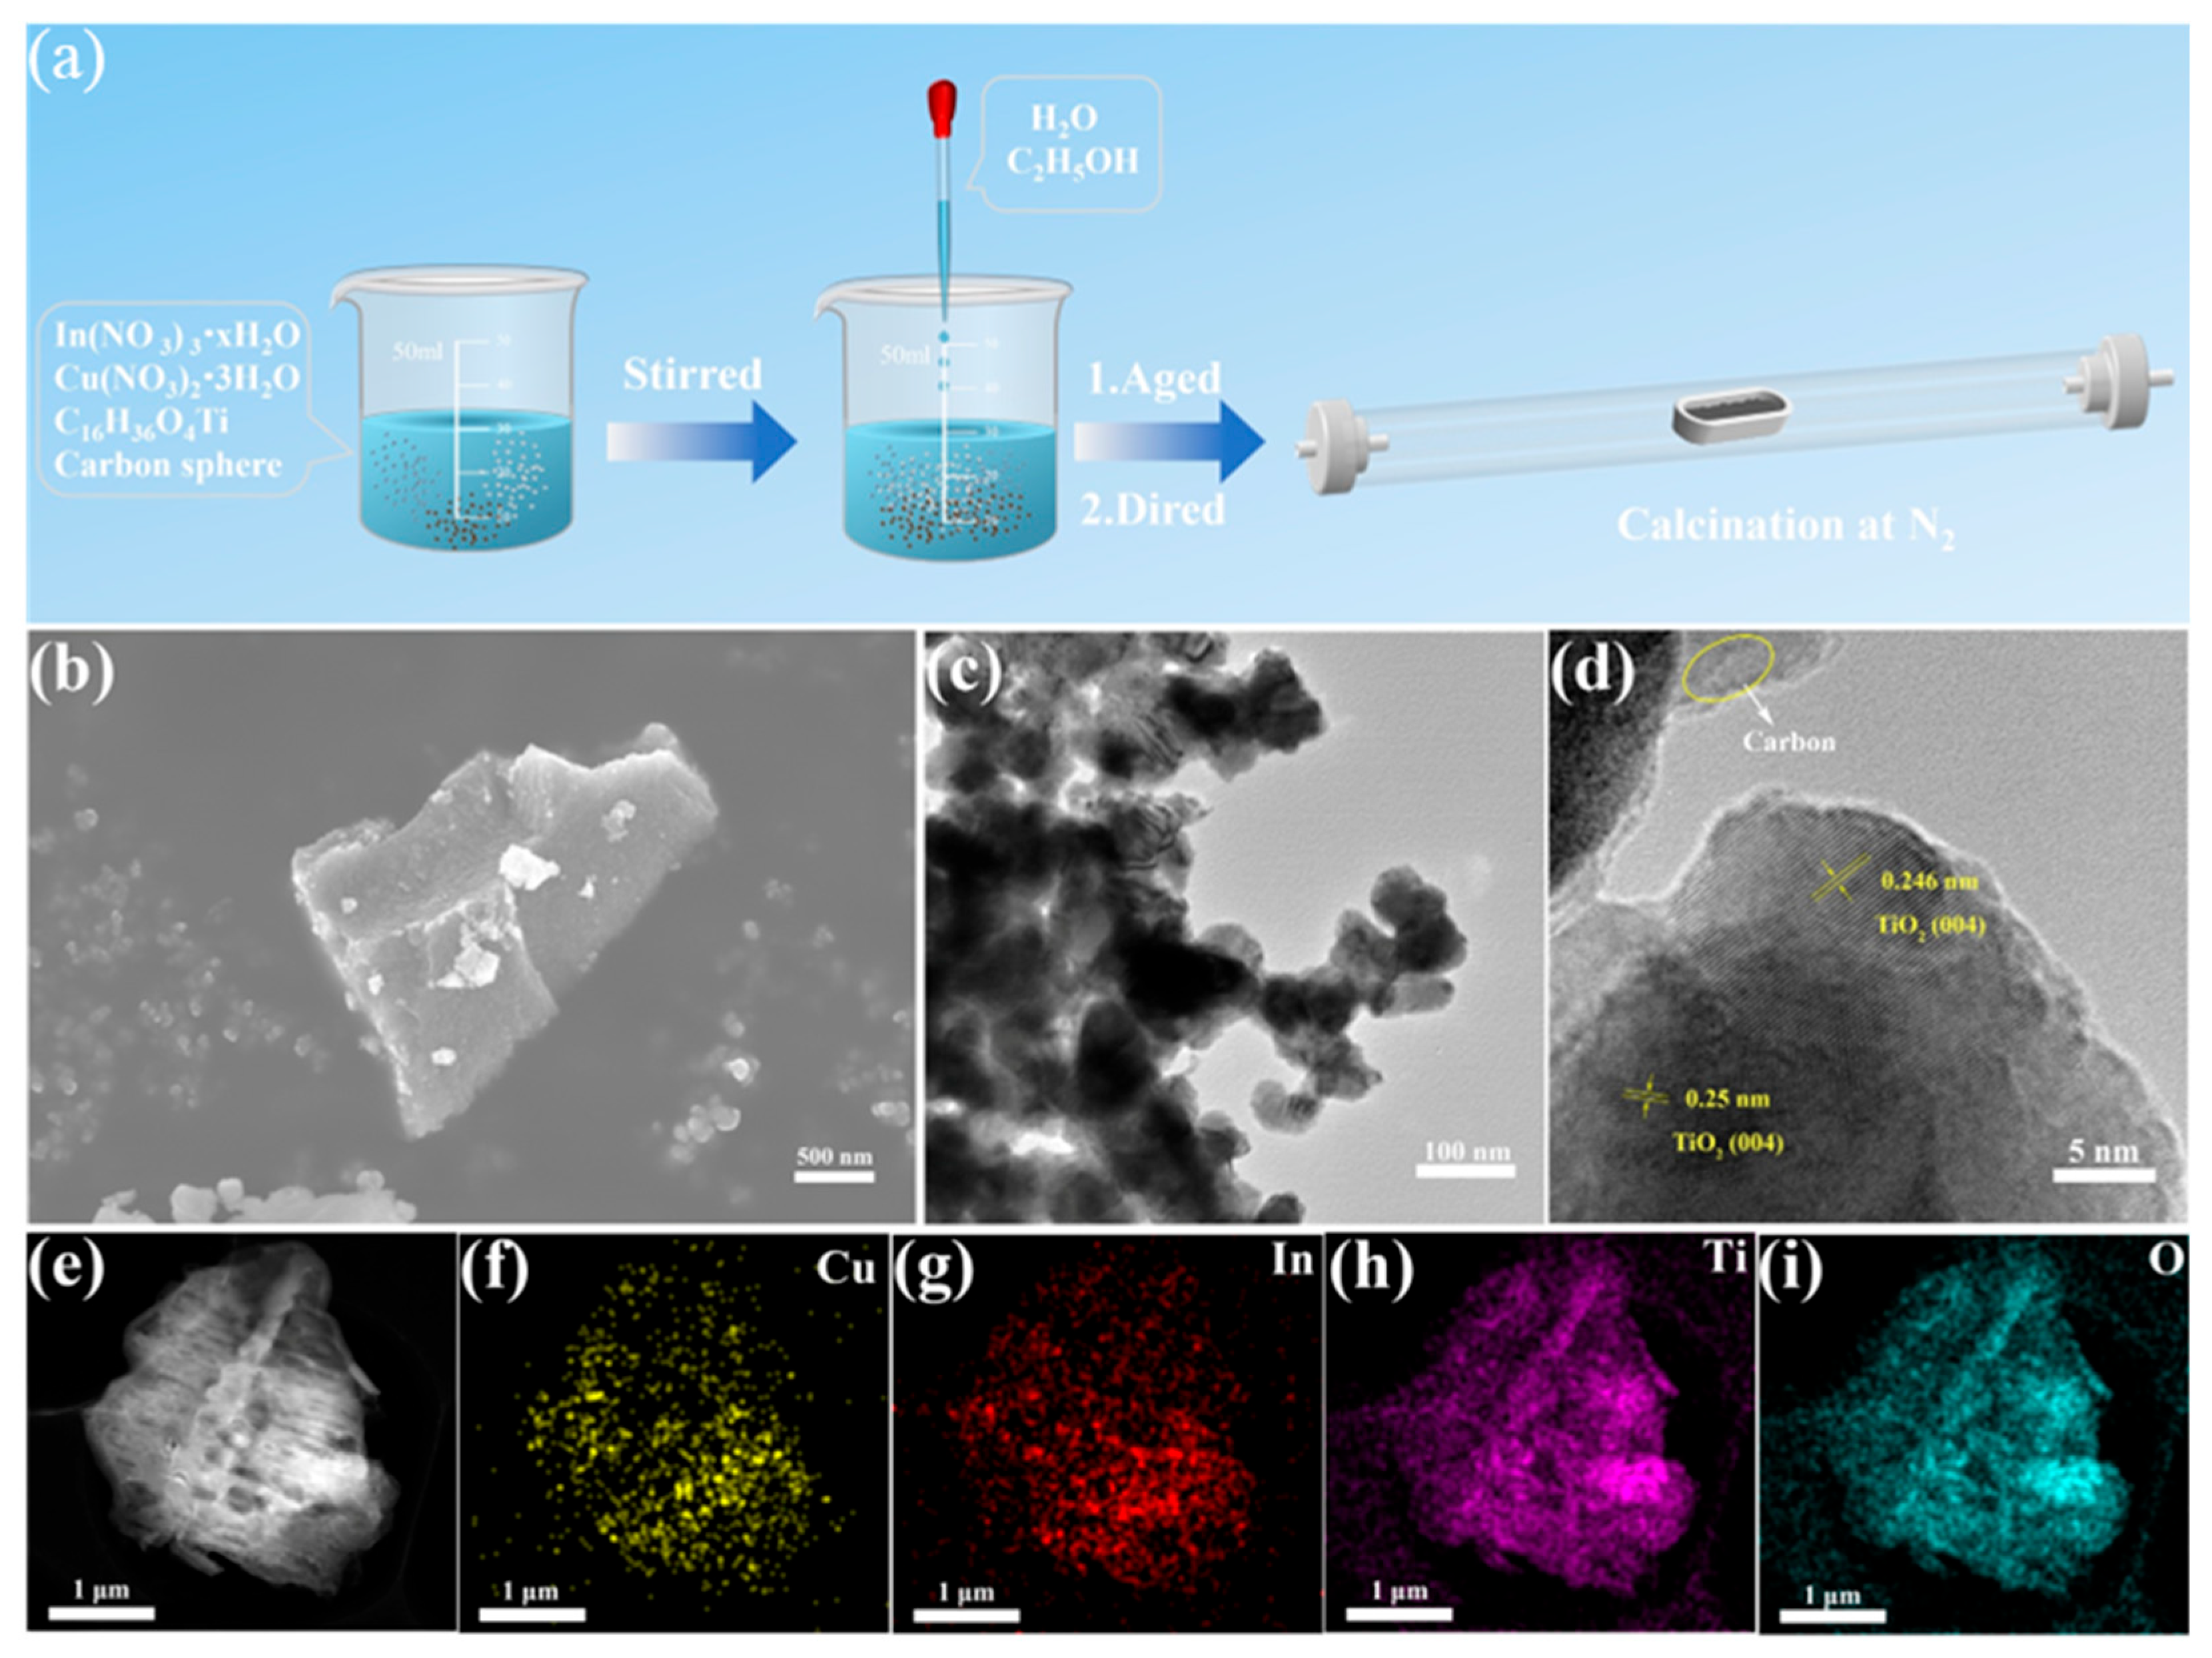
As demonstrated in
Figure 1a, the synthesis of CuIn-TiO
2 involved a comparable sol-gel method, followed by calcination. Titanium tetraisopropoxide, carbon spheres, and metal salts (copper nitrate trihydrate and indium nitrate hydrate) were thoroughly mixed. Subsequently, an ethanol–water solution was introduced to the mixture, inducing a process known as hydrolysis. This step resulted in the formation of a gelatinous substance. Subsequent to the drying process, the gel underwent calcination at an elevated temperature to yield the desired catalyst. SEM and TEM images (
Figure 1b,c) indicate that metal incorporation increased particle aggregation, leading to irregular, block-like morphologies. These morphologies are distinct from pristine TiO
2 (see
Figure S1a). Additionally,
Figures S1b and S1c present the SEM images of the singly doped samples, Cu-TiO
2 and In-TiO
2, respectively. Both samples exhibit irregular bulk-like morphologies. High-resolution transmission electron microscopy (HR-TEM) in
Figure 1d reveals a lattice spacing of 0.246 nm and 0.25 nm, corresponding to the {004} plane of anatase TiO
2 (JCPDS #21-1272), slightly larger than the typical spacing of 0.238 nm [
29,
30]. The observed expansion is indicative of successful doping, which can be attributed to the larger ionic radii of Cu and In in comparison to Ti. CuIn-TiO
2 was synthesized using carbon spheres as sacrificial templates. Given the inert atmosphere during calcination, complete removal of the carbon template is unlikely. As indicated in the TEM images (
Figure 1d), some regions may still contain residual carbon. This residual carbon is expected to enhance the electrical conductivity of the composite, thereby benefiting its catalytic performance. Moreover, the XRD patterns (
Figure S2) show no distinct diffraction peaks corresponding to carbon, suggesting that the carbon spheres were largely decomposed or disordered during high-temperature treatment and effectively participated in the formation of the TiO
2 matrix. Overall, the carbon spheres functioned as both a structural template and a conductive component, contributing to improved material dispersion and charge transport. As demonstrated in
Figure 1e–i, energy-dispersive X-ray spectroscopy (EDS) elemental mapping revealed a homogeneous distribution of Cu and In on the TiO
2 surface, thereby substantiating the effective incorporation of dopants.
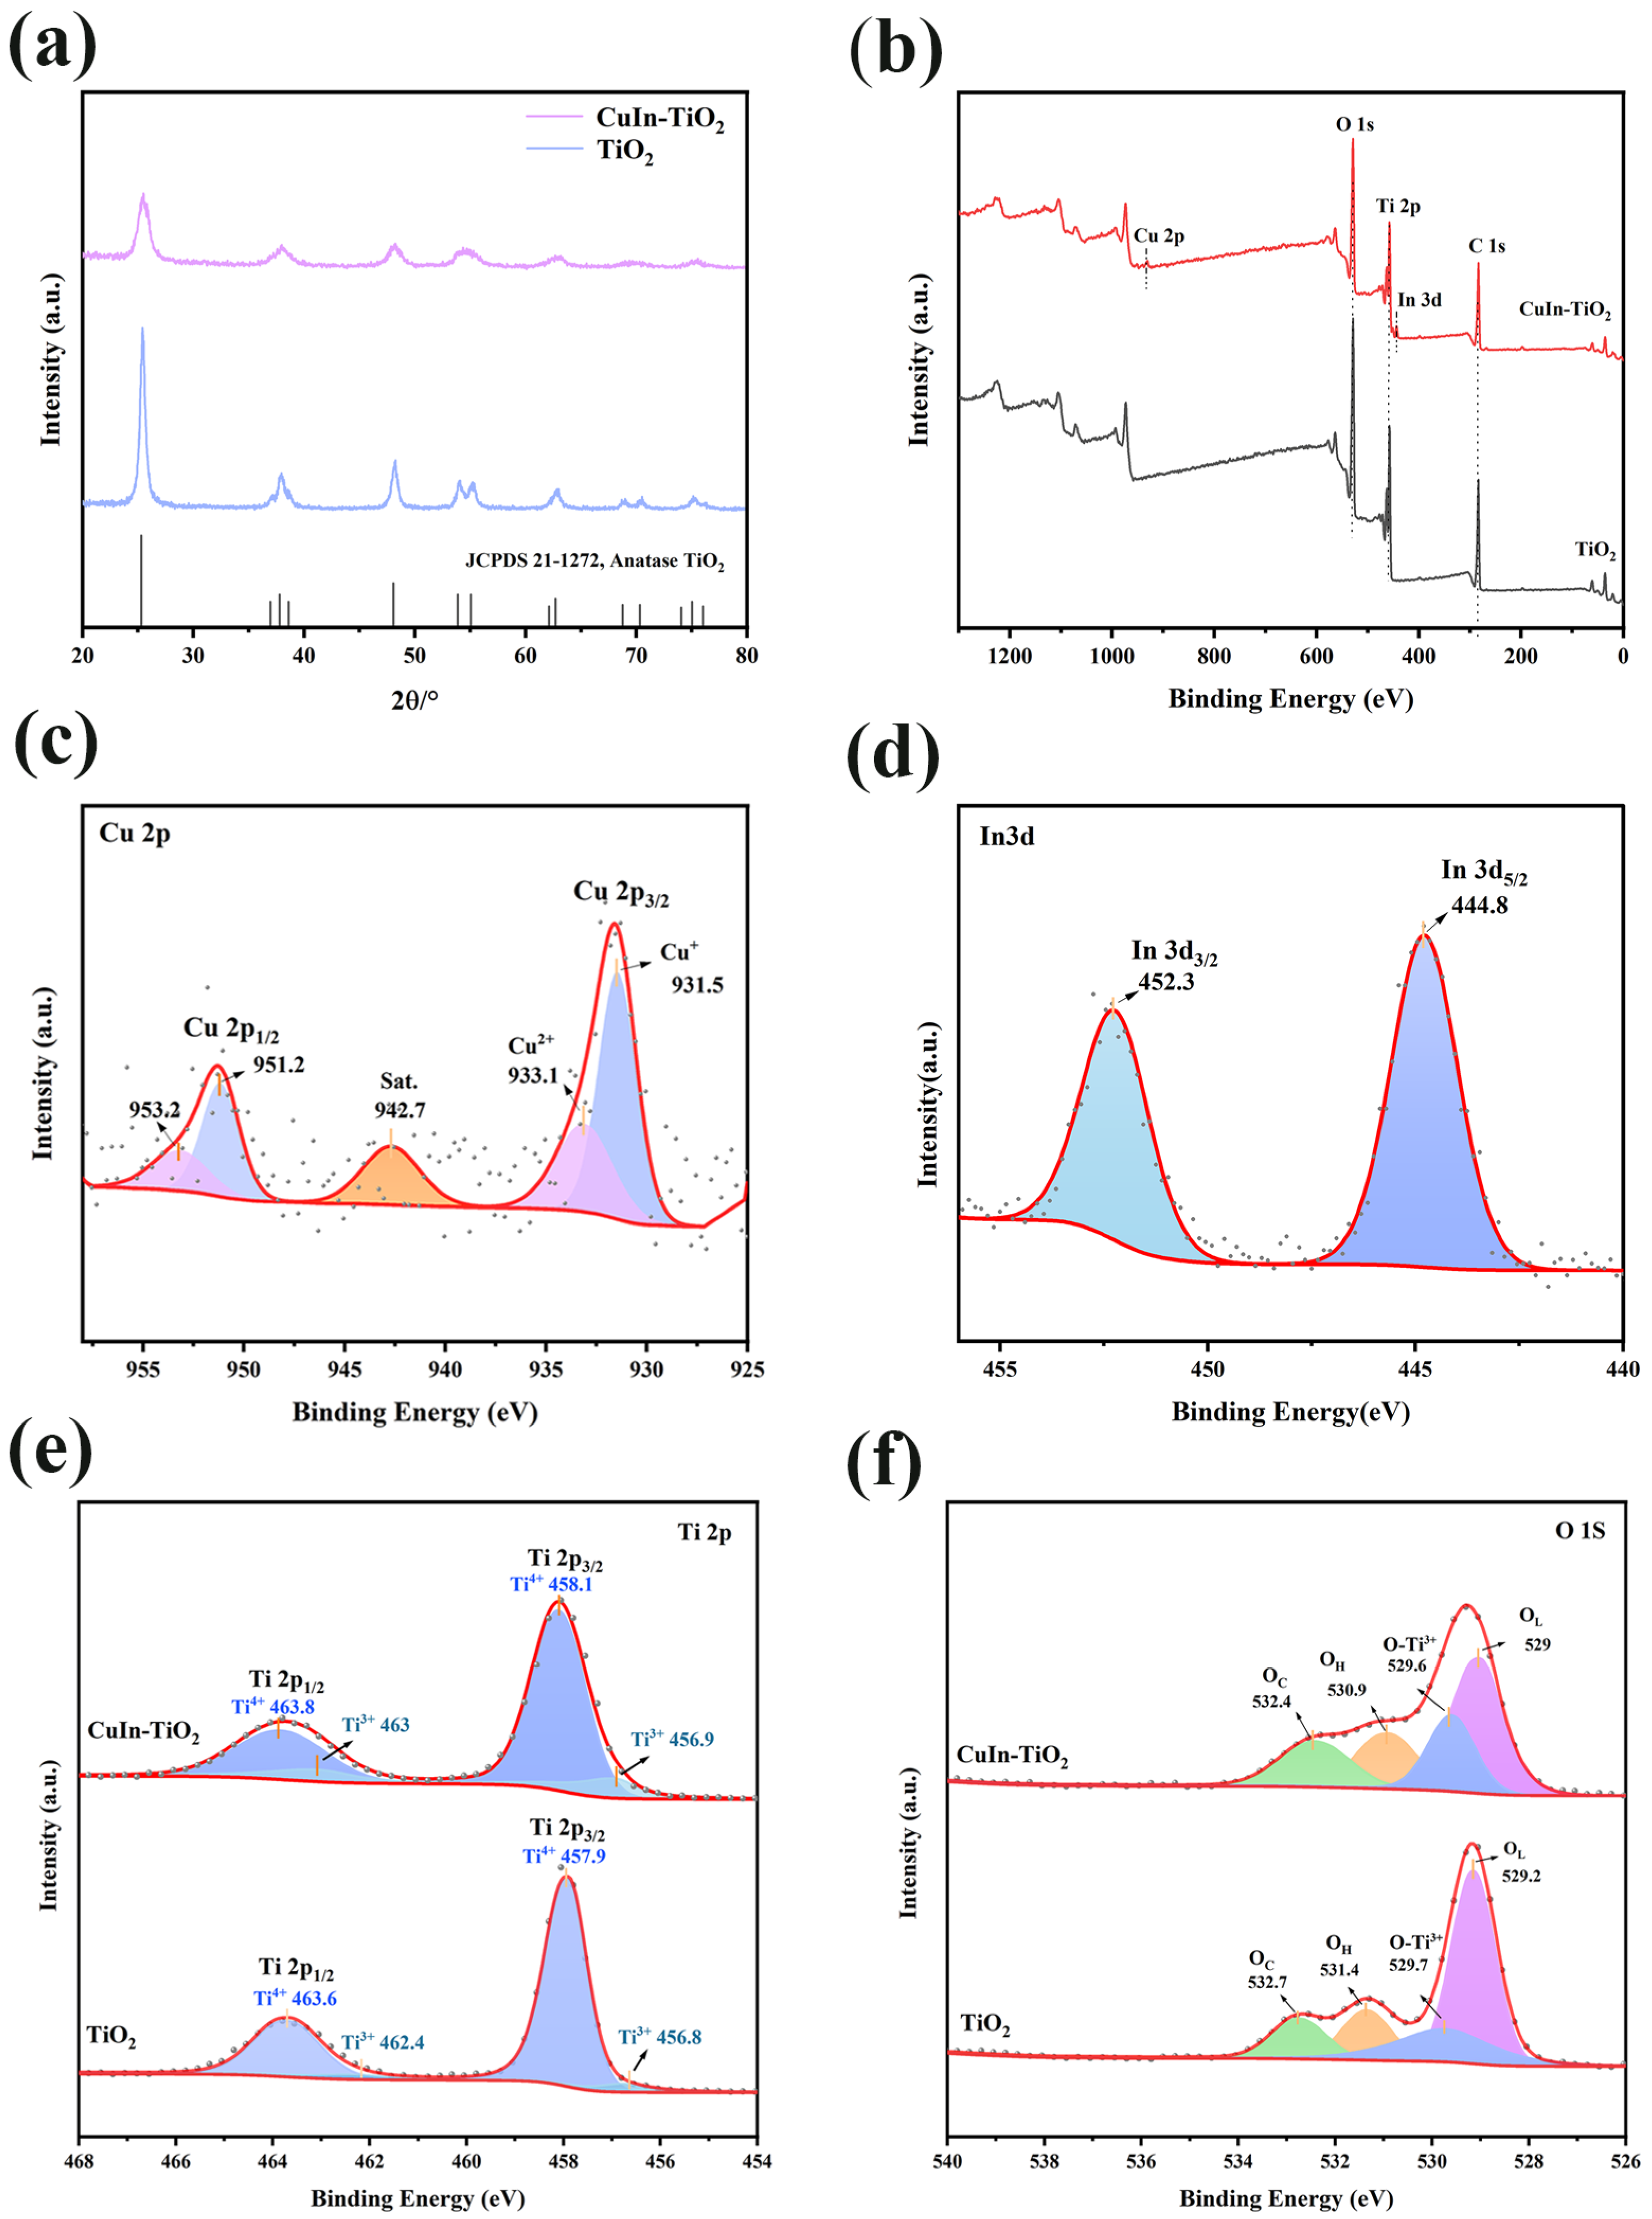
The synthesized samples were characterized by X-ray diffraction (XRD), with the resulting diffraction patterns displayed in
Figure 2a. XRD analysis demonstrates that the diffraction signals for both pristine TiO
2 and CuIn-TiO
2 are in excellent agreement with those of the anatase phase (JCPDS #21-1272). This finding indicates that the introduction of Cu and In does not alter the primary crystalline phase. The diffraction peaks of the doped samples are significantly weaker than those of the pristine TiO
2 (
Figure S2), suggesting that the metal doping inhibits the formation of the TiO
2 crystal phase. This observation aligns with the findings of previous studies [
31]. Furthermore, no supplementary diffraction peaks corresponding to metallic copper or indium were detected, indicating that the doping of these two metals does not modify the crystal structure of TiO
2. The absence of discernible Cu or In signals in the XRD patterns indicates that the dopants do not exist as discrete oxide phases. Instead, it is probable that they are incorporated into the TiO
2 lattice as substitutional ions or interstitial species [
32,
33]. The surface composition and oxidation states of the catalyst were examined using X-ray photoelectron spectroscopy (XPS). The XPS spectrum of
Figure 2b once again demonstrates the successful doping of Cu and In into TiO
2.
As illustrated in
Figure 2c, the high-resolution Cu 2p spectra of CuIn-TiO
2 exhibit two prominent peaks at 932 and 952 eV, corresponding to Cu 2p
3/2 and Cu 2p
1/2, respectively [
24]. The subsequent fitting of these two main peaks of CuIn-TiO
2 resulted in the identification of two subpeaks, namely Cu
+ 2p
3/2 at 931.5 eV, Cu
2+ 2p
3/2 at 933.1 eV, Cu
+ 2p
1/2 at 951.2 eV, and Cu
2+ 2p
1/2 at 953.2 eV. The peak at 942.7 eV corresponds to the satellite peak of Cu
2+. This finding indicates that the copper species under investigation contains both Cu
+ and Cu
2+. This phenomenon can be attributed to the high-temperature calcination process that was carried out under a nitrogen atmosphere. The presence of carbon spheres within the samples has been identified as a potential factor that may have facilitated the reduction of Cu
2+ to Cu
+ at elevated temperatures. Furthermore,
Figure 2d illustrates the XPS spectra of In 3d, and the two main peaks located at 444.8 eV and 452.3 eV correspond to In 3d
5/2 and In 3d
3/2, respectively, suggesting that In primarily exists in the +3 valence state [
34].
Additionally,
Figure 2e provides a comparison of the Ti 2p XPS spectra of CuIn-TiO
2 and pristine TiO
2, exhibiting four discernible peaks. For pristine TiO
2, peaks at 456.8 eV, 457.9 eV, 462.4 eV, and 463.6 eV correspond to Ti
3+ 2p
3/2, Ti
4+ 2p
3/2, Ti
3+ 2p
1/2, and Ti
4+ 2p
1/2, respectively. In the CuIn-TiO
2 compound, these peaks exhibit a slight shift towards higher binding energies, specifically at 456.9 eV, 458.1 eV, 463.0 eV, and 463.8 eV, respectively. This shift is indicative of a reduction in electron density surrounding the Ti atom, a consequence of the incorporation of Cu and In into the structure. This reduction in electron density leads to the formation of an electron-deficient state within the compound [
35]. In addition,
Figure 2f presents O 1s XPS spectra, which were deconvoluted into four characteristic peaks corresponding to lattice oxygen (O
L), oxygen bonded to Ti
3+ (O-Ti
3+), hydroxyl groups (O
H), and chemically adsorbed species (O
C). Specifically, for pristine TiO
2, these peaks manifest at binding energies of 529.2 eV (O
L), 529.7 eV (O-Ti
3+), 531.4 eV (O
H), and 532.7 eV (O
C), whereas CuIn-TiO₂ exhibits slightly lower binding energies at 529.0 eV (O
L), 529.6 eV (O-Ti
3+), 530.9 eV (O
H), and 532.4 eV (O
C). This shift towards lower binding energies suggests a modification in the electronic structure of oxygen species due to Cu and In doping, which likely increases the number of active sites and enhances electron transfer, thus positively influencing the electrocatalytic reaction kinetics [
36,
37].
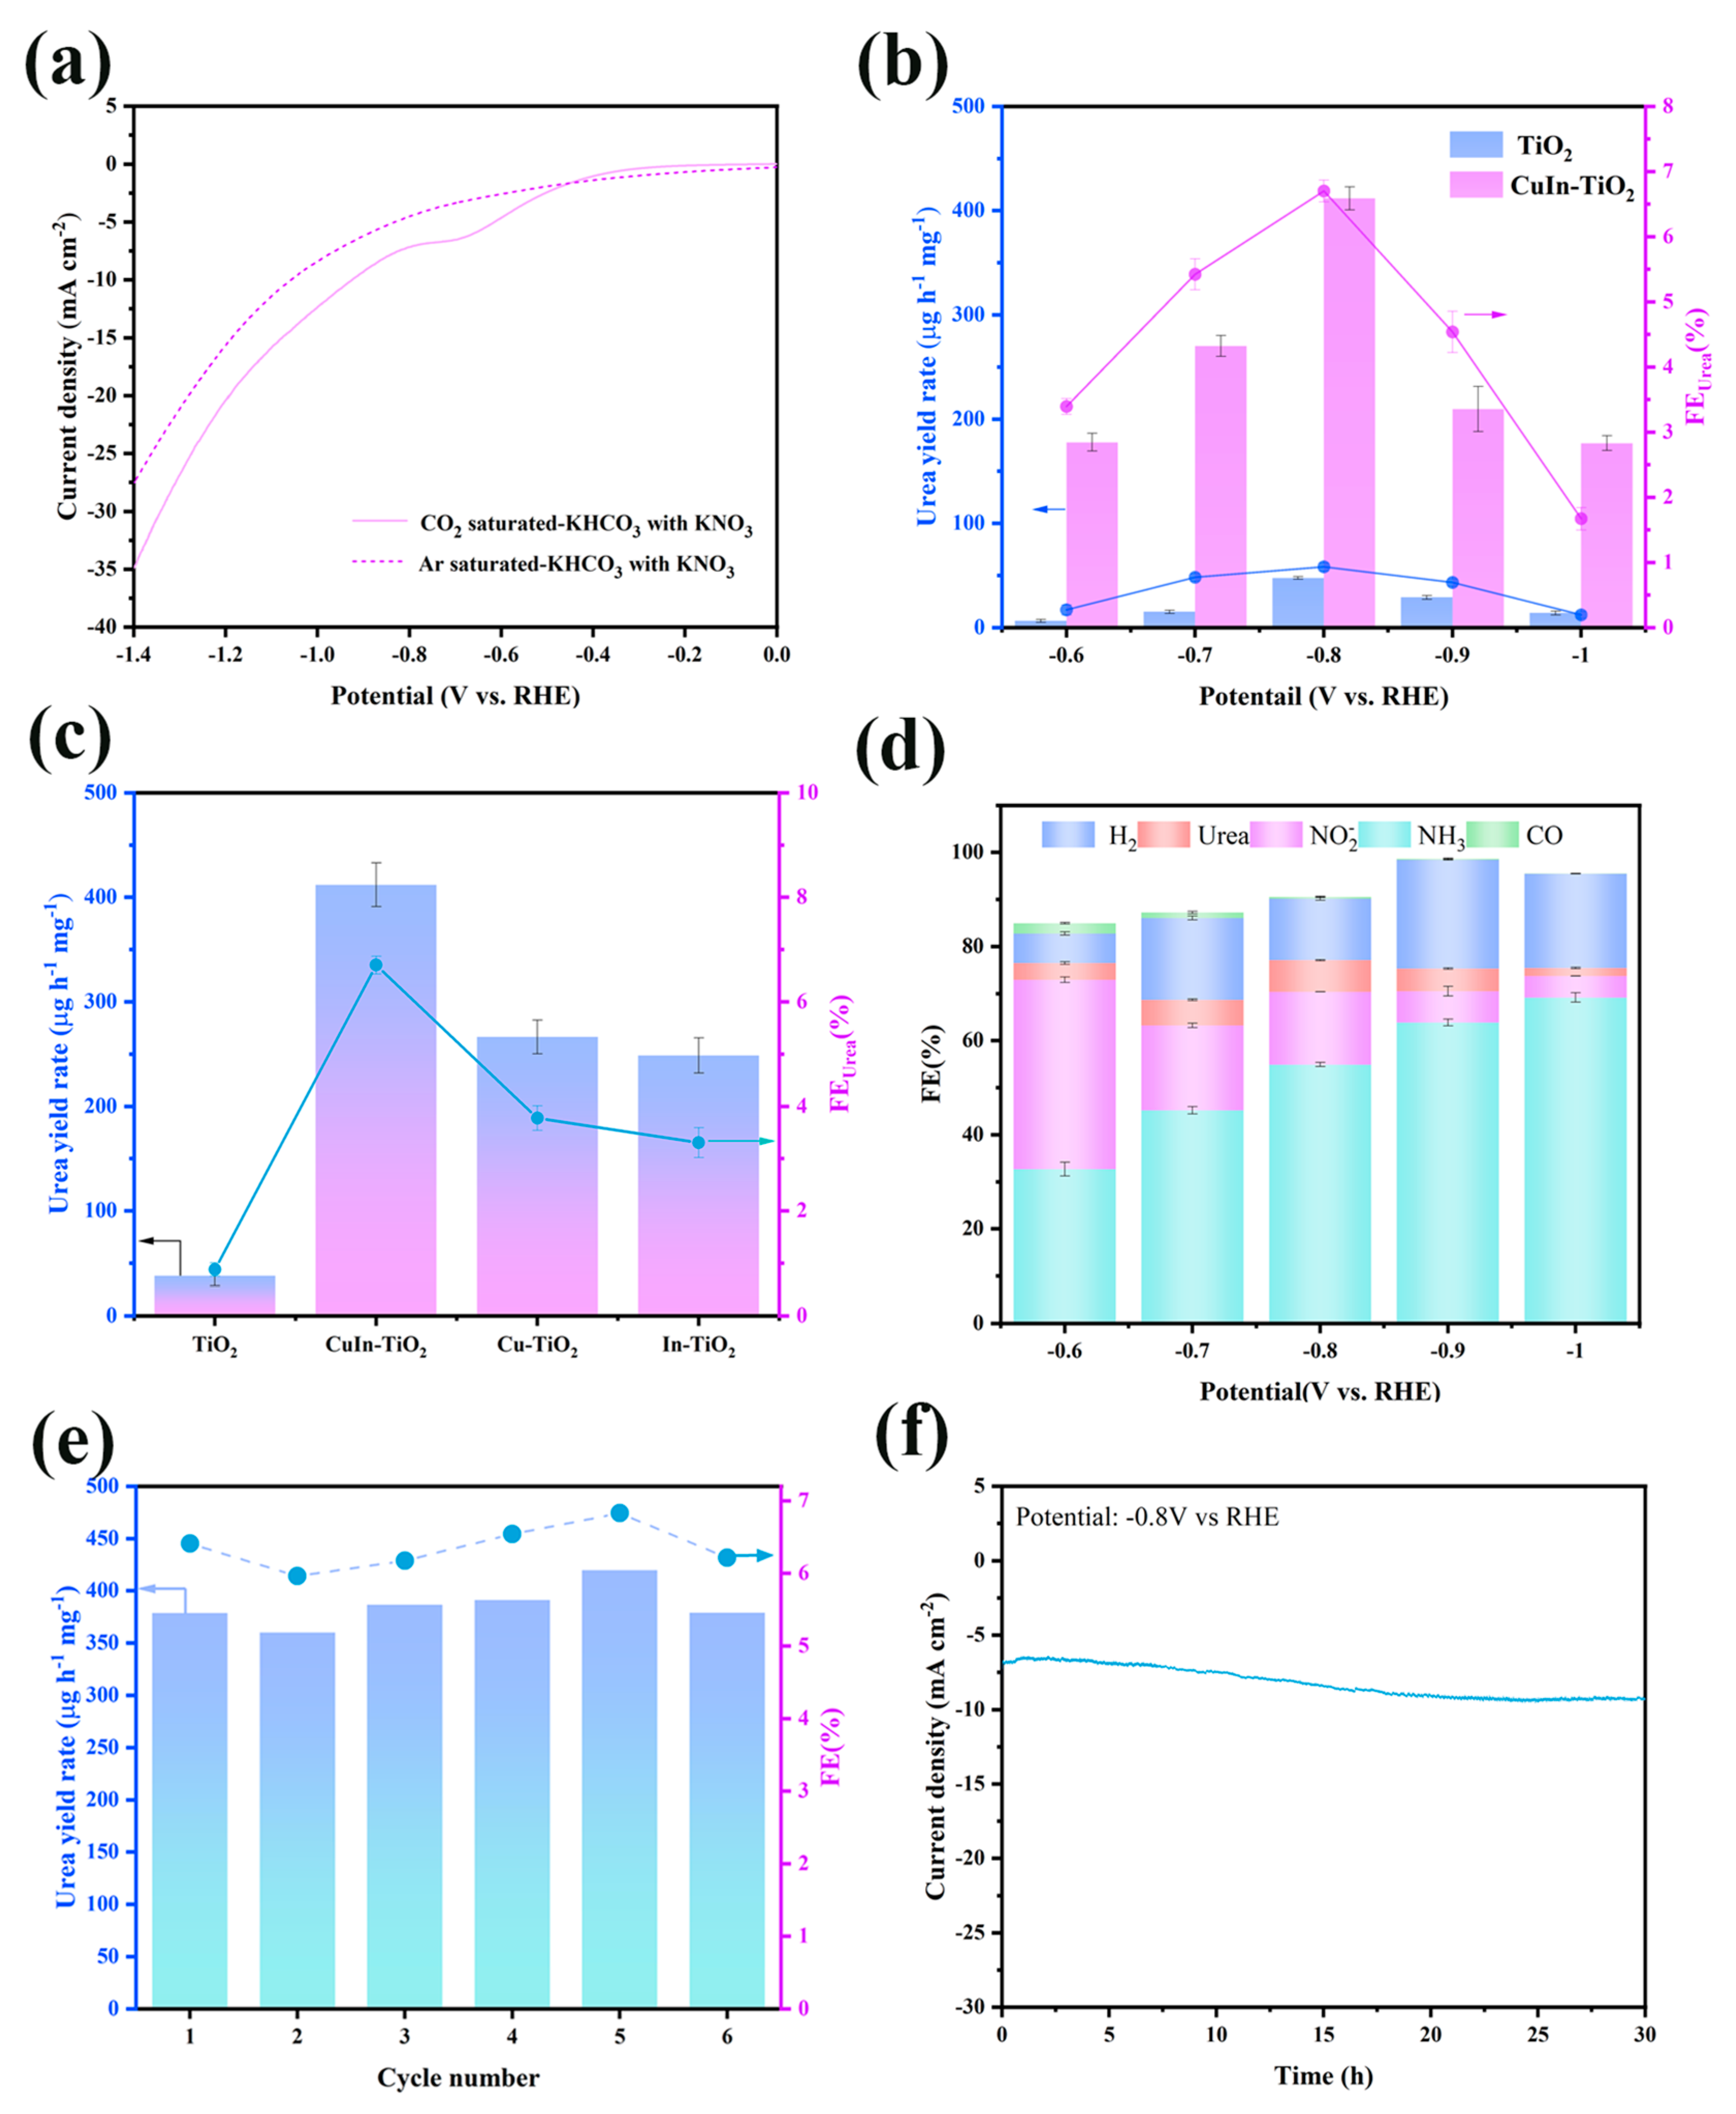
Subsequently, the electrocatalytic performance of CuIn-TiO
2 and TiO
2 was evaluated and compared using an H-type electrochemical cell. To investigate the catalytic efficiency toward urea synthesis, a linear sweep voltammetry (LSV) was conducted in a CO₂-saturated 0.1 M KHCO
3 electrolyte containing 50 mM KNO
3. The resulting LSV curves for CuIn-TiO
2, TiO
2, Cu-TiO
2, and In-TiO
2 are presented in
Figure 3a and
Figure S3. To evaluate the catalytic activity for urea formation, CO
2 was continuously bubbled through the electrolyte throughout the electrochemical measurements. The metal-doped catalysts (CuIn-TiO
2, Cu-TiO
2, and In-TiO
2) exhibited significantly higher current responses in comparison to pristine TiO
2, indicating enhanced electrocatalytic activity. It is noteworthy that CuIn-TiO
2 exhibited the highest current density within the same potential range, suggesting that co-doping with Cu and In enhances the catalytic performance for urea electrosynthesis from CO₂ and NO
3− in a synergistic manner. To further ascertain the activity of the electrolytic synthesis of urea, chronoamperometry tests were performed at varying potentials ranging from −0.6 to −1.0 V vs. RHE in a CO
2-saturated 0.1 M KHCO
3 electrolyte containing 50 mM KNO
3.
The quantification of urea was performed using two distinct methodologies: the urease decomposition method and chromogenic analysis via UV-Vis absorption spectra. The calibration curve for NH
4+ is presented in
Figure S4. As shown in
Figure 3b, a gradual increase in both urea yield and Faradaic efficiency was observed as the applied potential became more negative. The CuIn-TiO
2 catalyst exhibited optimal electrocatalytic activity at −0.8 V vs. RHE, yielding a maximum urea production of 411.8 μg h
−1 mg
−1 along with a Faradaic efficiency of 6.7% and exhibiting a substantial enhancement over the unmodified TiO
2 reference. In order to provide additional validation of the urea yield in the electrocatalytic process, the oxalyl monoxime method was employed as an independent quantification technique. A corresponding standard calibration curve was established (see
Figure S5). As shown in
Figure S6a, the urea yields obtained from both quantification methods at the optimal potential of −0.8 V vs. RHE exhibited excellent consistency, thereby confirming the reliability of the measurement results. To unambiguously verify the nitrogen source of the produced urea, we performed
15N isotope labeling experiments using
15NO
3−. As shown in the
1H NMR spectra (
Figure S6b), the sample derived from
15NO
3− exhibited a characteristic doublet corresponding to
15NH
4+ after urease-catalyzed hydrolysis, while the use of
14NO
3− produced a typical triplet signal for
14NH
4+. This distinct spectral difference provides compelling evidence that the nitrogen in urea originates from nitrate reduction and its coupling with CO
2 [
38,
39]. The CuIn-TiO
2 catalyst demonstrates a superior electrocatalytic performance for urea synthesis in comparison to several previously reported systems. Although the Faradaic efficiency is relatively low, the urea yield is still comparable to that of reported catalysts such as In(OH)
3-S (533.1 μg·h
−1·mg
cat.−1), FeNi
3/NC (496.5 μg·h
−1·mg
cat−1), and Vo-In-TiO
2 (759.8 μg·h
−1·mg
cat.−1), as outlined in
Table S1. To optimize the doping ratio, three samples of CuIn-TiO
2 with varying Cu/In contents were synthesized (see
Figure S7a). The highest urea yield was observed at a doping ratio of 7.5%, indicating that this composition offers the most effective synergistic interaction. To support this result, EIS analysis was conducted (
Figure S7b), showing that the 7.5% doped sample exhibits the lowest charge transfer resistance, further confirming its favorable interfacial electronic properties. Furthermore, the performance of CuIn-TiO
2 significantly surpasses that of pristine TiO
2, thereby underscoring the critical role of bimetallic doping in the synthesis of efficient catalysts. To further elucidate the promotional effect of individual metal dopants, the urea synthesis activity of Cu-TiO
2 and In-TiO
2 was measured at −0.8 V vs. RHE (
Figure 3c). The activity of both singly doped catalysts was found to be noticeably enhanced in comparison to that of pristine TiO
2, thereby reinforcing the beneficial contribution of Cu and In to the catalytic process. While the individual incorporation of either Cu or In enhances electrocatalytic urea production to a certain extent, the bimetallic CuIn co-doping exhibits significantly higher activity. This improvement is attributed to the synergistic interaction between copper and indium, which collectively facilitates the C-N coupling process, thereby leading to an augmented urea yield.
The electrocatalytic synthesis of urea is a multi-step process that entails a complex reaction pathway. In addition to urea, the process yielded by-products such as NH
3 and NO
2−, which were subsequently analyzed. The concentrations of these by-products were determined through the implementation of chromogenic assays in conjunction with UV-Vis absorption spectroscopy [
40]. The details of the corresponding standard curves can be found in
Figures S4 and S8. The potential gas-phase products, comprising hydrogen (H
2) and carbon monoxide (CO), were identified through the utilization of gas chromatography. As illustrated in
Figure 3d, a range of products that may play a role in the electrocatalytic urea synthesis process are outlined. Despite the low CO selectivity, a clear decline in CO formation is observed at more negative potentials, likely due to the suppression of the competing CO₂RR pathway, which, in turn, favors the C-N coupling process. At more negative potentials, particularly beyond −0.8 V vs. RHE, a notable increase in the HER was observed, which competes with the nitrate reduction reaction for active sites and electrons. This competitive behavior likely accounts for the observed decline in both urea yield and Faradaic efficiency at higher overpotentials [
41]. Moreover, the production of H
2 may indicate an increased proton consumption pathway that diverts the reaction away from C-N coupling, further reducing urea selectivity. The stability of the catalyst was assessed by subjecting CuIn-TiO
2 to electrocatalytic durability tests in a CO
2-saturated 0.1 M KHCO
3 electrolyte with 50 mM KNO
3. These tests included cyclic operations and chronoamperometry measurements. As depicted in
Figure 3e, the stability of urea output and Faradaic efficiency over six repeated cycles at −0.8 V vs. RHE underscores the catalyst’s exceptional operational reproducibility. Moreover, no substantial current decay or crystalline phase destruction was observed during the extended electrolysis over 30 h (see
Figure 3f and
Figure S9). This observation serves to further reinforce the conclusions drawn from the study, namely, the robust structural and electrochemical stability of the CuIn-TiO
2 catalyst when subjected to continuous operation. These results confirm that the co-doped catalyst exhibits remarkable long-term durability for the practical electrosynthesis of urea.
In order to eliminate potential interferences from environmental or chemical factors, a series of parallel control experiments was designed to validate the urea formation pathway. The experimental setup comprised three distinct electrochemical conditions: (i) CuIn-TiO
2 immersed under open-circuit conditions in a CO
2-saturated 0.1 M KHCO
3 electrolyte with 50 mM KNO
3 for 30 min; (ii) constant potential electrolysis at −0.8 V vs. RHE for 30 min in an Ar-saturated 50 mM KNO
3 electrolyte; and (iii) electrolysis under identical conditions in a CO
2-saturated 0.1 M KHCO
3 electrolyte. Subsequent to the reaction, the electrolyte samples were subjected to UV-Vis spectrophotometric analysis, with samples treated with and without urease. As illustrated in
Figure S10, characteristic absorption signals corresponding to urea were not detected in any control group. These findings confirm that the urea detected in the main reaction system originates exclusively from the electrochemical co-reduction of CO
2 and NO
3⁻ facilitated by the CuIn-TiO
2 catalyst.
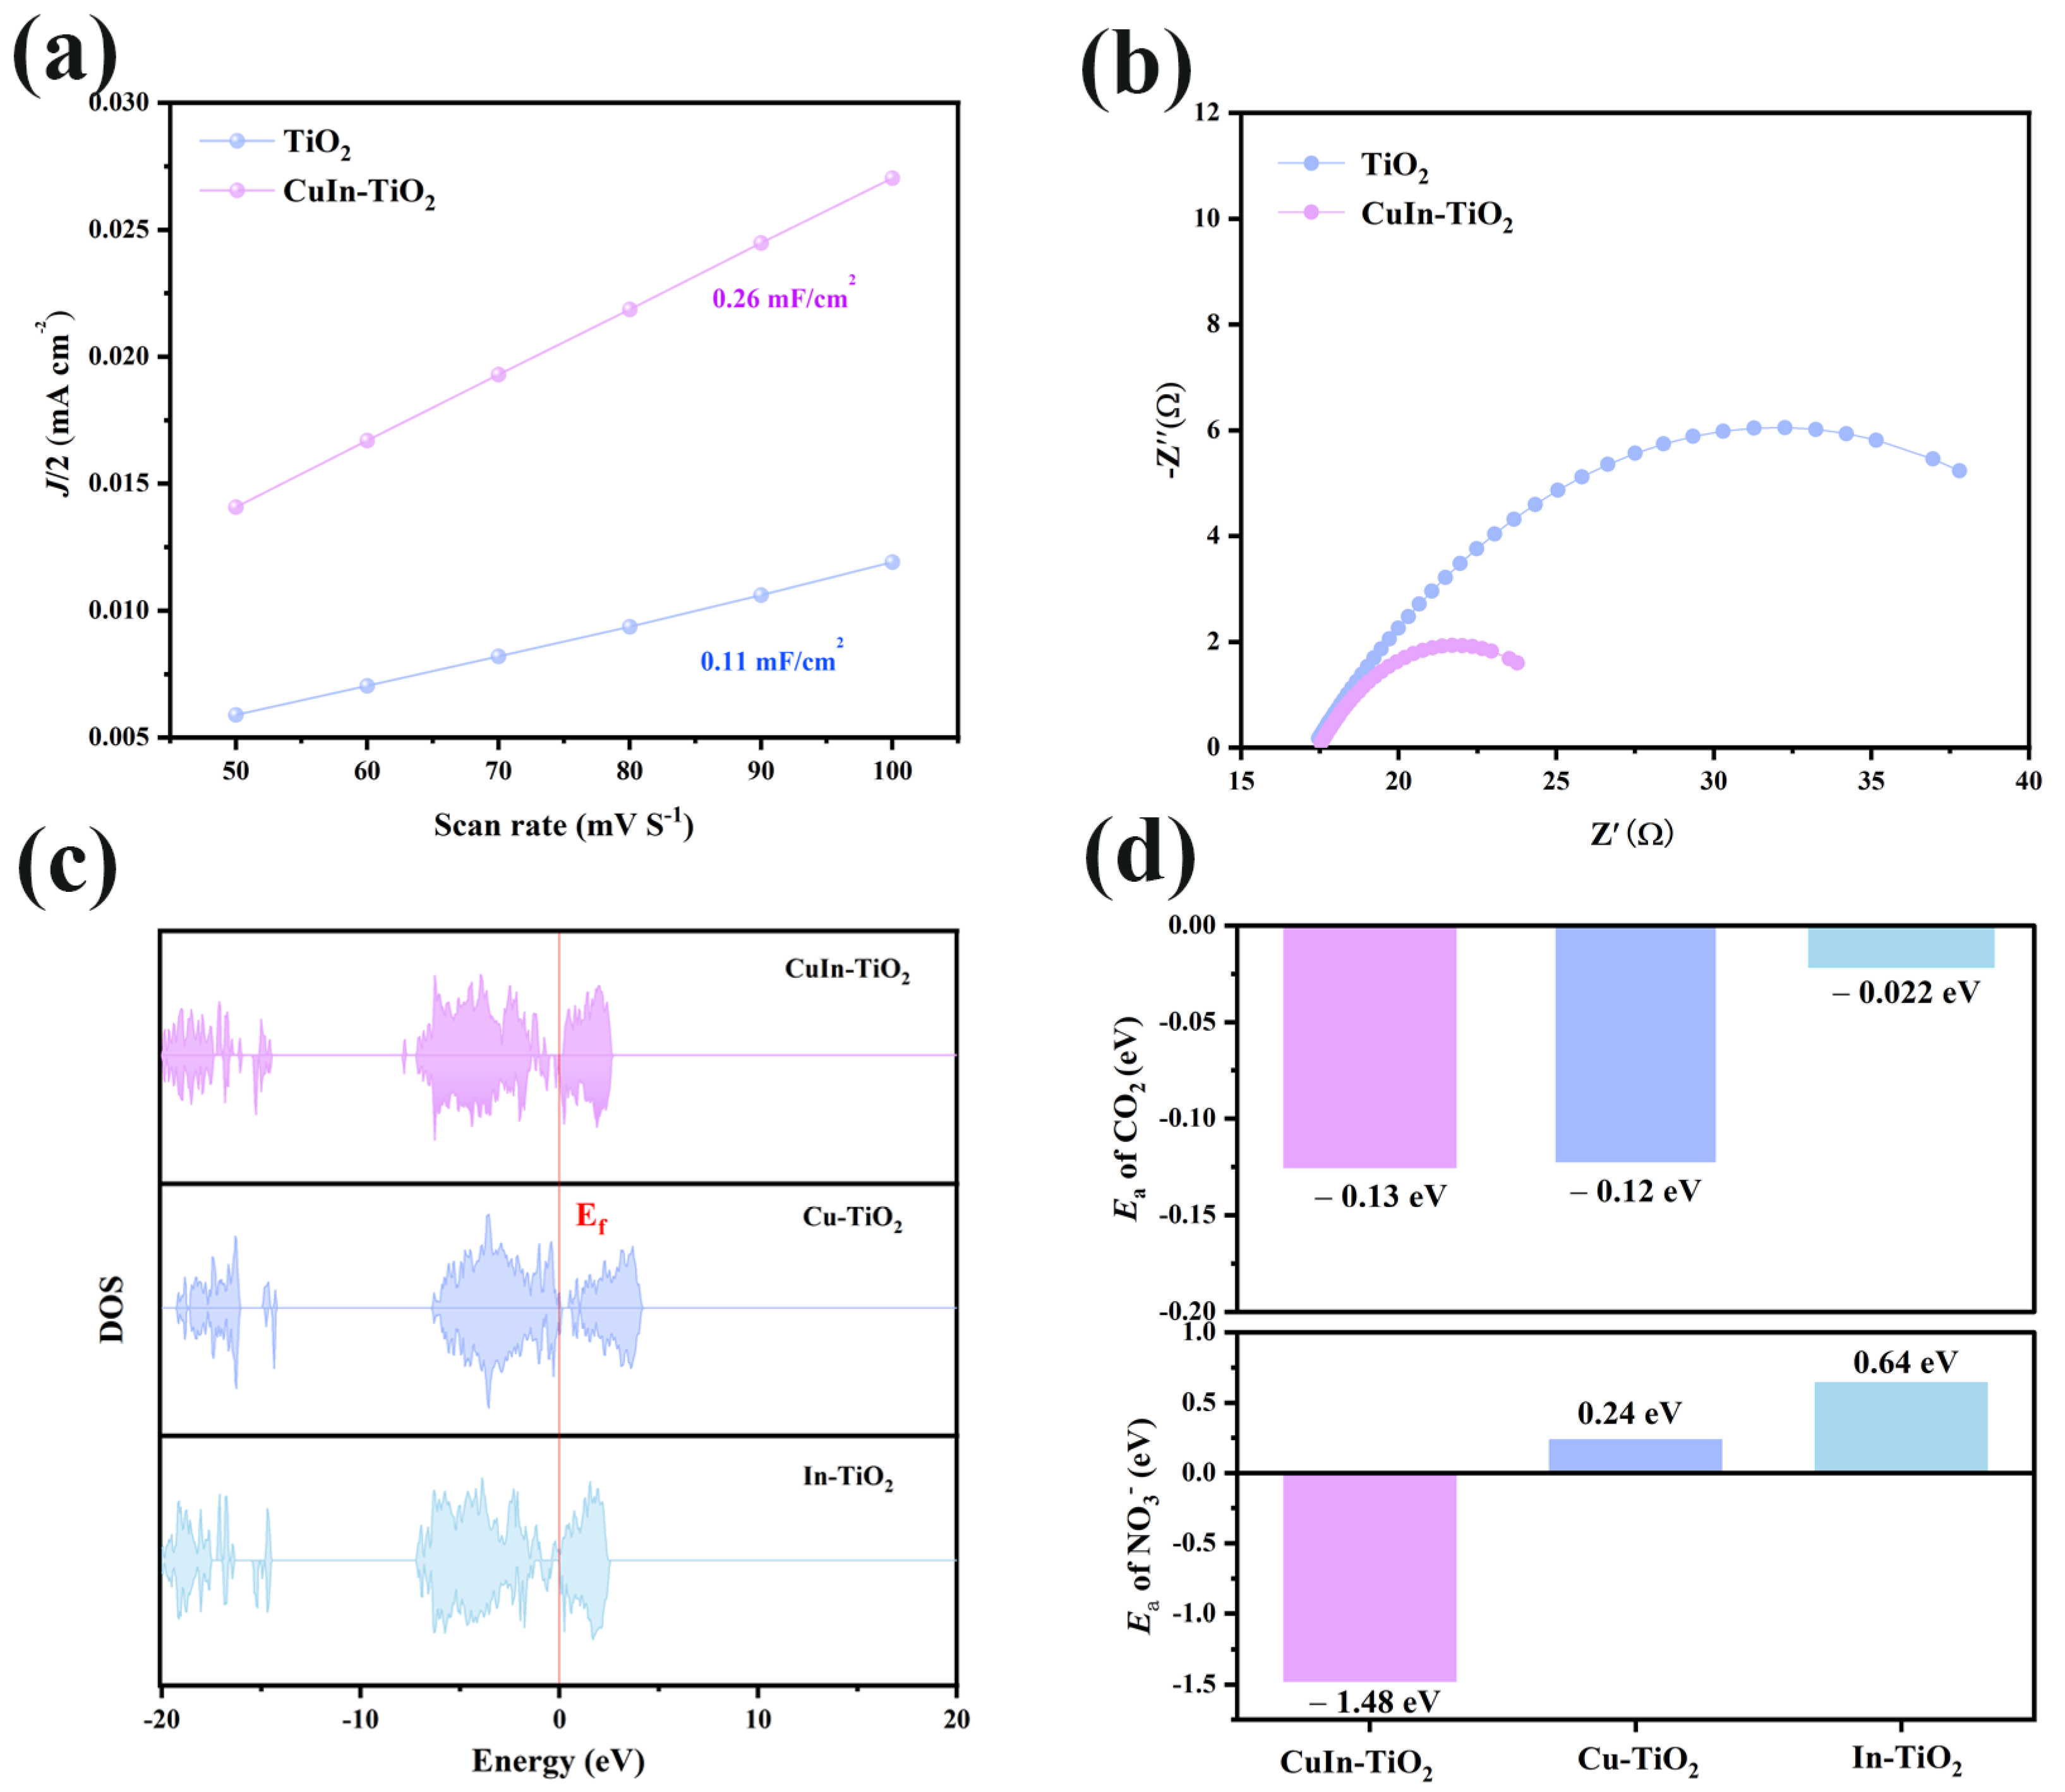
Furthermore, the ECSA was determined by measuring the double-layer capacitance (C
dl) to further evaluate the intrinsic catalytic activity. As shown in
Figure 4a, CuIn-TiO
2 displays a substantially higher C
dl value (0.26 mF cm
−2) in comparison to pristine TiO
2 (0.11 mF cm
−2), signifying an augmented electrochemically accessible surface. This increase can be attributed to the co-doping of Cu and In, which likely generates more exposed catalytic sites, thereby promoting the efficient adsorption and activation of reactant molecules during urea formation. Furthermore, we also conducted tests on two additional samples, Cu-TiO
2 and In-TiO
2. The C
dl values for these samples were 0.17 and 0.18 mF cm
−2, respectively (
Figure S11). This indicates that doping can effectively increase the active area on the TiO
2 surface, providing more active sites. Although doping can effectively increase the electrochemical surface area of the catalyst, from the results, it is clear that this is not a significant factor. Therefore, we will analyze the reasons for the performance improvement from another perspective. Additionally, electron impact spectroscopy (EIS) was conducted under neutral conditions to investigate charge-transfer characteristics (see
Figure 4b). The Nyquist plots reveal that the CuIn-TiO
2 sample exhibits a significantly diminished semicircular radius in comparison to its undoped counterpart, indicative of a reduced interfacial charge-transfer resistance. This enhanced conductivity facilitates faster electron migration between the catalyst and the electrolyte, thereby accelerating the overall electrocatalytic process.
Figure S12 provides the EIS results for four samples, and the results indicate that CuIn-TiO
2 has the best electron charge-transfer capability. The findings, when considered collectively, demonstrate that the synergistic incorporation of Cu and In tunes the surface structure and improves the electronic properties. These alterations contribute to the superior urea electrosynthesis performance observed.
Finally, to gain deeper insight into the C-N coupling mechanism underlying urea electrosynthesis, density functional theory (DFT) calculations were conducted to analyze the electronic structure of the catalyst [
42,
43]. In metallic materials, the Fermi level typically lies within the conduction band, meaning that the energy levels below it are fully occupied by electrons, while a large number of empty states exist above it. As a result, electrons can be readily excited into the conduction band, thereby facilitating electrical conductivity [
44,
45]. An increase in the density of states, particularly in the vicinity of the Fermi level, has been observed to generally enhance the material’s conductive ability. For the doped titanium dioxide variants (CuIn-TiO
2, Cu-TiO
2, In-TiO
2), density of states calculations were performed (see
Figure 4c). The findings indicate that CuIn-TiO
2 demonstrates remarkably enhanced electronic conductivity, aligning with our predictions. This assertion is further substantiated by the observation of an augmented electrochemical active surface area and diminished electrochemical impedance. These phenomena underscore the enhanced electronic conductivity exhibited by the material under scrutiny. The adsorption behavior of the catalyst is a critical component of elucidating its reaction mechanism [
46,
47,
48]. In the course of the C-N coupling reaction, theoretical calculations were conducted to determine the adsorption energies of two pivotal intermediates, *CO
2 and *NO
3−. As demonstrated in
Figure 4d, the three catalysts (CuIn-TiO
2, Cu-TiO
2, and In-TiO
2) demonstrated disparate activities toward the adsorption of *CO
2 and *NO
3−. The results indicate that, for *CO
2 adsorption, CuIn-TiO
2 (−0.13 eV) exhibits the lowest adsorption energy, outperforming Cu-TiO
2 (−0.12 eV) and In-TiO
2 (−0.022 eV). While CuIn-TiO
2 exhibits only a modest benefit in terms of *CO₂ adsorption when compared to Cu-TiO
2, it demonstrates a clear superiority for *NO
3− adsorption, with an adsorption energy of −1.48 eV, which is significantly lower than that of Cu-TiO
2 (0.24 eV) and In-TiO
2 (0.64 eV). This finding suggests that CuIn-TiO
2 exhibits higher activity in C-N coupling, which is a critical factor in urea synthesis [
49,
50,
51]. Complementary to this, the charge density difference analysis (
Figure S13) further reveals a clear direction of electron transfer: *CO
2 acts as an electron donor, transferring 0.98 e
− to the catalyst, while *NO
3− and *H serve as electron acceptors, each withdrawing 0.34 e
−. The spatially and electronically balanced interactions between oxidized *CO
2 and reduced *NO
3− intermediates highlight CuIn-TiO
2’s unique ability to mediate C-N coupling, a crucial step in urea synthesis. In summary, the co-doping of Cu and In effectively modifies the electronic structure of titanium dioxide, enhancing its electrical conductivity and promoting the adsorption of *CO
2 and *NO
3−. The optimization of the electronic structure and the enhancement of the adsorption ability function in a synergistic manner to facilitate the efficient urea synthesis reaction.


 and
and 
