Article

Fracture Mechanics of Tetragraphene: Effects of Structural Variations and Loading Conditions

by
Elnaz Haddadi
1 and
Alireza Tabarraei
1,2,*
1
Department of Mechanical Engineering and Engineering Science, The University of North Carolina at Charlotte, Charlotte, NC 28223, USA
2
School of Data Science, The University of North Carolina at Charlotte, Charlotte, NC 28223, USA
*
Author to whom correspondence should be addressed.
Submission received: 2 April 2025 / Revised: 9 June 2025 / Accepted: 12 June 2025 / Published: 24 June 2025
(This article belongs to the Special Issue 10th Anniversary of C — Journal of Carbon Research)

Abstract

Despite the promising electronic properties of graphene, its lack of an intrinsic bandgap limits its applicability in semiconductor technologies. This has catalyzed the investigation of newly developed two-dimensional carbon materials, including tetragraphene (TG), a quasi-2D semiconducting material featuring a combination of hexagonal and tetragonal rings. This study aims to investigate the mechanical and fracture behaviors of TG using density functional theory (DFT) and molecular dynamics (MD) simulations, studying two distinct atomic configurations of tetragraphene. DFT simulations assess the mechanical properties, while MD simulations explore the fracture dynamics subjected to mixed mode I (opening mode) and mode II (in-plane shear mode) loading. Our analysis focuses on the influence of loading phase angle, crack edge chirality, crack tip configuration, and temperature on crack propagation paths and critical stress intensity factors (SIFs) in TG structures. Our results show that the critical SIF varies by 12.5–21% depending on the crack chirality. Across all loading conditions, increasing the temperature ranging from 300 K to 2000 K reduces the critical SIF by 10–45%, with the largest reductions observed under pure mode I loading. These outcomes offer important insights into the structural integrity of TG and inform its potential integration into flexible nanoelectronic devices, where mechanical reliability is essential.

1. Introduction

In recent years, the emergence of nanomaterials has significantly transformed materials science and engineering [1,2,3,4], giving rise to new technological innovations with exceptional properties. Tetragraphene (TG), one of these materials, is a 2D carbon allotrope and has garnered considerable attention due to its unique properties and structural integrity. Unlike graphene, which behaves as a semimetal with no intrinsic band gap, limiting its use in many electronic applications, TG’s distinctive lattice structure offers the ability to tailor its electronic band structure. This tunability makes TG a promising candidate for electronic devices, addressing one of graphene’s most significant limitations [5,6,7]. Furthermore, TG’s fourfold symmetry introduces electronic anisotropy, meaning its electronic properties can vary with direction, opening the door for designing novel electronic devices with highly specific functionalities. Such directional dependence provides unique opportunities to design materials with enhanced performance and adaptability for various applications.
While graphene’s mechanical properties and fracture behavior are well-documented [8,9,10,11,12], the fracture properties of TG and other two-dimensional materials similar to graphene remain underexplored. TG’s atomic structure is more complex than that of graphene, consisting of a triple-layered arrangement within each sheet, which introduces additional intricacies in its failure mechanisms. Therefore, a detailed investigation of TG’s fracture behavior is essential, as they could vary considerably from those of graphene or other 2D materials.
Beyond its electronic properties, understanding TG’s mechanical robustness is essential for assessing its practical applications in nanodevices, flexible electronics, and structural materials. Unlike monolayer graphene, TG’s multi-layered structure may introduce unique deformation mechanisms that influence its load-bearing capacity, resistance to crack propagation, and overall durability. The ability of TG to withstand mechanical stress without catastrophic failure is particularly important for its integration into real-world applications where mechanical reliability is critical. Moreover, exploring the interplay between TG’s atomic structure and fracture mechanics can provide valuable insights into tailoring its properties for specific engineering applications, such as impact-resistant coatings or high-performance composites.
Previous studies have provided important insights into TG’s mechanical properties. For instance, Brandao et al. [13] applied MD simulations to explore TG’s mechanical response, demonstrating a structural transition from crystalline to amorphous under the influence of temperature and/or tensile stress. Similarly, De Vasconcelos et al. [14] conducted DFT simulations to examine TG’s electronic properties, identifying how factors like chirality and edge reconstruction influence its electronic behavior. Wei et al. [7] found that TG exhibits superior strength and ductility under uniaxial tensile strain. In addition, Kilic and Lee [15] investigated the stability and mechanical properties of TG and its derivatives, noting significant changes in properties such as thermal conductivity and in-plane stiffness.
Given the difficulties associated with nanoscale experimentation, computational techniques such as MD simulations and DFT play a crucial role in studying two-dimensional materials. DFT simulations are particularly effective for investigating the material’s mechanical properties, such as stress–strain responses, elasticity, and structural stability. Meanwhile, MD simulations provide a more direct way to explore the fracture behavior, focusing on the crack growth path, critical SIFs, and failure mechanisms under different loading conditions, including mixed mode I and II fractures. Many studies have been conducted to explore SIFs in different applications, utilizing various computational and experimental approaches [16,17,18,19,20,21,22], highlighting their crucial role in understanding fracture mechanics across various materials and structures.
This research takes a dual approach to study TG by combining DFT and MD simulations. First, DFT simulations are utilized to examine the mechanical characteristics of TG, including its response to tensile stress and strain in two different atomic configurations of TG. These simulations help determine key mechanical properties such as Young’s modulus, failure stress, and Poisson’s ratio. As part of this investigation, the effect of lattice configuration on the mechanical response of TG is also explored, providing insight into how variations in atomic arrangement impact the material’s overall strength and elasticity.
Following the mechanical characterization, MD simulations are employed to investigate TG’s fracture properties. Although prior works have examined mechanical properties of TG under uniaxial loading conditions [7,13,23], the critical SIFs under mixed mode I and II loading across different temperatures have not been studied. We investigate the hypothesis that crack geometry, chirality, and temperature influence the fracture response of tetragraphene. For this purpose, we use MD simulations to analyze crack propagation behavior, identify the critical SIFs for different crack tip geometries, and explore how TG fails under mixed-mode loading conditions. The results from MD simulations help to understand TG’s fracture resistance, elucidating how its complex atomic structure influences crack growth and material failure.

2. Materials and Methods

In this study, we examine two distinct atomic structures of tetragraphene, referred to as the 2-even and 2-odd configurations [24]. To date, the tetragraphene’s configurations including 2-even and 2-odd structures have been explored through theoretical studies employing computational methods such as density functional theory and molecular dynamics simulations [13,15,24,25,26,27,28]. These configurations have not yet been synthesized or observed experimentally. Our study builds upon this theoretical foundation to further investigate the fracture mechanics of these proposed structures under various loading conditions. These structures, depicted in Figure 1 and Figure 2, exhibit a shared three-layered framework, yet differ in the spatial arrangement of their atomic bonding patterns. Both configurations consist of a central layer composed of tetra-coordinated (sp3 hybridized) carbon atoms, flanked by two outer layers of tri-coordinated (sp2 hybridized) carbon atoms. In the visual representations, the tri-coordinated carbon atoms in the top layer are highlighted in blue, while those in the bottom layer are marked in red. The tetra-coordinated carbon atoms in the middle layer are shown in gray. This arrangement of layers, incorporating both sp2 and sp3 hybridizations, provides a unique combination of two- and three-dimensional bonding characteristics, which underpins the material’s mechanical and electronic properties.
The two configurations considered in this study are termed TG 2-even and TG 2-odd, reflecting key differences in their structural symmetry. These designations arise from the arrangement of sp3-hybridized carbon atoms across the layers. In the 2-even configuration, the sp3 atoms alternate symmetrically between layers, creating a regular and balanced pattern. In contrast, the 2-odd configuration lacks this symmetry, resulting in an irregular alternation of sp3 atoms between layers.
For the 2-even configuration, a simple translation by a distance l, corresponding to the separation between the centers of adjacent tetragonal lines, is sufficient to achieve symmetry along the x-direction. On the other hand, the 2-odd configuration requires an additional mirror reflection across the plane containing the sp3 atoms to restore symmetry, as it follows a glide plane symmetry. Consequently, the minimum translational symmetry along the x-axis for the odd system is 2 l . The index “2” refers to the structural nature of the hexagonal lines, which can be understood as being composed of two interconnected zigzag chains of atoms. It is worth noting that other structural configurations of tetragraphene can be envisioned by adding more zigzag strips between the sequences of 4-membered rings.
The unit cells of the TG 2-even and 2-odd structures are depicted in Figure 1a and Figure 2a, respectively. The rectangular unit cell for the 2-even structure contains 6 carbon atoms, while the 2-odd structure’s unit cell comprises 12 carbon atoms. The lattice vectors associated with these unit cells are defined as follows:
a 1 = ( a x , 0 ) ,       a 2 = ( 0 , a y )
The atomic geometry of tetragraphene can be characterized using the parameters a, b, c, and δ , as illustrated in Figure 1b,c and Figure 2b,c. The parameter a represents the length between two neighboring tri-coordinated carbon atoms, b denotes the spacing between two tetra-coordinated carbon atoms along the a 1 direction, and c corresponds to the length of the diagonal across the tetragonal rings in the a 2 direction. Additionally, the parameter δ specifies the layer thickness. The specific values of these parameters for the TG structures are indicated in Table 1.

2.1. Mechanical Properties of Tetragraphene Using DFT

We employ DFT calculations to analyze the mechanical characteristics of bulk tetragraphene. The unit cells used in the simulations, containing 6 and 12 atoms, are depicted in Figure 1a and Figure 2a. To remove unwanted interactions between periodic images in the z-direction (perpendicular to the tetragraphene sheets), a vacuum gap of at least 15 Å is applied, ensuring that the interlayer interactions do not artificially affect the results.
The DFT simulations are performed using the SIESTA [29,30] implementation of density functional theory. The exchange-correlation effects are handled using the Perdew–Burke–Ernzerhof (PBE) functional within the framework of the generalized gradient approximation (GGA) [31]. A double-zeta polarized (DZP) orbital basis set is applied to enhance the accuracy of the calculations. Troullier–Martins pseudopotentials [32] are used to model the ionic cores, factorized via the Kleinman–Bylander nonlocal projector [33] to efficiently describe core–valence interactions.
A real-space integration energy cutoff of 300 Rydbergs is applied to ensure numerical convergence. For Brillouin zone sampling, a Monkhorst–Pack grid of 15 × 15 × 1  k-points is utilized to achieve accurate reciprocal space integrations. The choice of this grid is based on a k-mesh convergence study, which confirmed that denser meshes produced negligible changes in total energy and stress, ensuring computational efficiency without loss of accuracy. The atomic structures are optimized using the conjugate gradient algorithm, with convergence criteria set to reduce atomic forces to less than 0.01 eV/Å, ensuring stable equilibrium configurations.
To determine the equilibrium lattice parameters, the initial calculations are performed with a variable unit cell size, allowing the dimensions to adjust dynamically during the simulation. This enables the system to reach an energetically favorable configuration under zero external stress. The optimized unit cell dimensions obtained from the DFT simulations for each configuration are summarized in Table 2.
The mechanical behavior of tetragraphene is examined by evaluating its response to stretching along the X and Y directions. Strains are introduced through an increase in the tetragraphene lattice constant, defined as Δ a = ϵ a 0 , where ϵ is the applied strain and a 0 is the relaxed size of the unit cell in the loading direction. The strain increments are set to 1%, and at each strain increment, the atomic structure is geometrically optimized to determine the corresponding energy and stress. To accelerate convergence, the atomic coordinates from the preceding step are utilized as the initial configuration for the subsequent optimization. SIESTA reports the supercell stress as an average taken across the whole supercell volume. Since the supercell dimension in the z-direction differs from the actual thickness of the tetragraphene sheet, scaling the supercell stress is necessary to determine the corresponding continuum Cauchy stress acting on the tetragraphene sheets. The equivalent Cauchy stress results from scaling the supercell stress by c t where c is the DFT unit cell dimensions in the z-direction, and t is the thickness of tetragraphen, which is assumed to be t = 3.4   Å .
The stress–strain response of tetragraphene for the 2-even and 2-odd configurations, presented in Figure 3, highlights distinct mechanical behaviors subjected to tensile loading. As shown in Figure 3a, the 2-even structure exhibits strong anisotropic behavior from the outset, whereas the 2-odd structure remains nearly isotropic up to a strain of 9%. The anisotropy in the 2-even configuration results in higher tensile strength along the x-direction than the y-direction, while the 2-odd configuration maintains nearly identical mechanical responses in both directions.
A notable distinction between these two configurations lies in their failure stress. The 2-odd structure demonstrates significantly greater resistance to mechanical failure, with a failure stress of approximately 120 GPa in both loading directions. In contrast, the 2-even structure exhibits a pronounced directional dependence, failing at 76 GPa when loaded along the x-direction and at 106 GPa along the y-direction. This indicates that the 2-even configuration is mechanically weaker, particularly along the x-axis.
The failure strain, defined as the strain at which the material ruptures, also differs between the two configurations. The 2-even structure reaches failure at 17% strain in both loading directions, whereas the 2-odd structure exhibits direction-dependent failure strains—19% in the x-direction and 21% in the y-direction. This suggests that the 2-odd configuration possesses higher ductility, allowing it to endure greater deformation before breaking.
Young’s modulus, a measure of material stiffness, is derived from the initial slope of the stress–strain curve at 1% strain. The 2-even configuration exhibits Young’s modulus values of 657 GPa in the x-direction and 919 GPa in the y-direction, reaffirming its anisotropic nature. In contrast, the 2-odd structure behaves isotropically, with a Young’s modulus of 860 GPa in both directions. The results for Young’s modulus are consistent with previous studies, where the values are reported per unit thickness [13,15,23]. These findings indicate that while the 2-even configuration is stiffer along the y-axis, it is overall less mechanically robust than the 2-odd configuration.
To further characterize the mechanical behavior of tetragraphene, the Poisson’s ratio ( ν ) is analyzed through uniaxial tensile tests. The Poisson’s ratio is described as
ν = ϵ 2 ϵ 1
where ϵ 1 represents the applied axial strain and ϵ 2 denotes the transverse strain. The Poisson’s ratio evolution with increasing strain is illustrated in Figure 4, illustrating significant differences between the 2-even and 2-odd structures under tension in both the x- and y-directions. The results indicate that Poisson’s ratio decreases as axial strain increases, with some cases transitioning into negative values, implying auxetic behavior.
For the 2-even structure, the initial Poisson’s ratio is 0.035 in the x-direction and 0.061 in the y-direction. Under x-direction loading, Poisson’s ratio decreases linearly up to a strain of 0.08, reaching 0.02, and then remains nearly constant. Under y-direction loading, Poisson’s ratio decreases steadily and becomes negative beyond 10% strain, reaching −0.022 at failure. This negative Poisson’s ratio indicates an auxetic response, where the material expands transversely when stretched.
The 2-odd configuration exhibits a different trend. Initially, Poisson’s ratio is 0.072 for both loading directions. Under x-direction loading, it decreases linearly and becomes negative beyond 13% strain, reaching a minimum of −0.025 at 17% strain before slightly increasing to −0.01 at failure. Conversely, in the y-direction, Poisson’s ratio remains positive throughout, steadily decreasing to 0.01 at failure. This suggests that while auxetic behavior is observed in the 2-odd configuration under x-direction loading, it does not occur in the y-direction.
Overall, these results highlight the unique mechanical properties of tetragraphene, which vary significantly depending on structural configuration. The 2-odd structure demonstrates superior strength, ductility, and isotropy, making it a promising candidate for applications requiring high mechanical resilience. In contrast, the 2-even structure, while stiffer in the y-direction, exhibits anisotropic behavior and a lower failure threshold. Additionally, the emergence of auxetic behavior in both configurations under specific loading conditions suggests that tetragraphene may have potential applications in advanced materials requiring negative Poisson’s ratio characteristics, such as impact-resistant coatings and tunable nanomechanical devices.

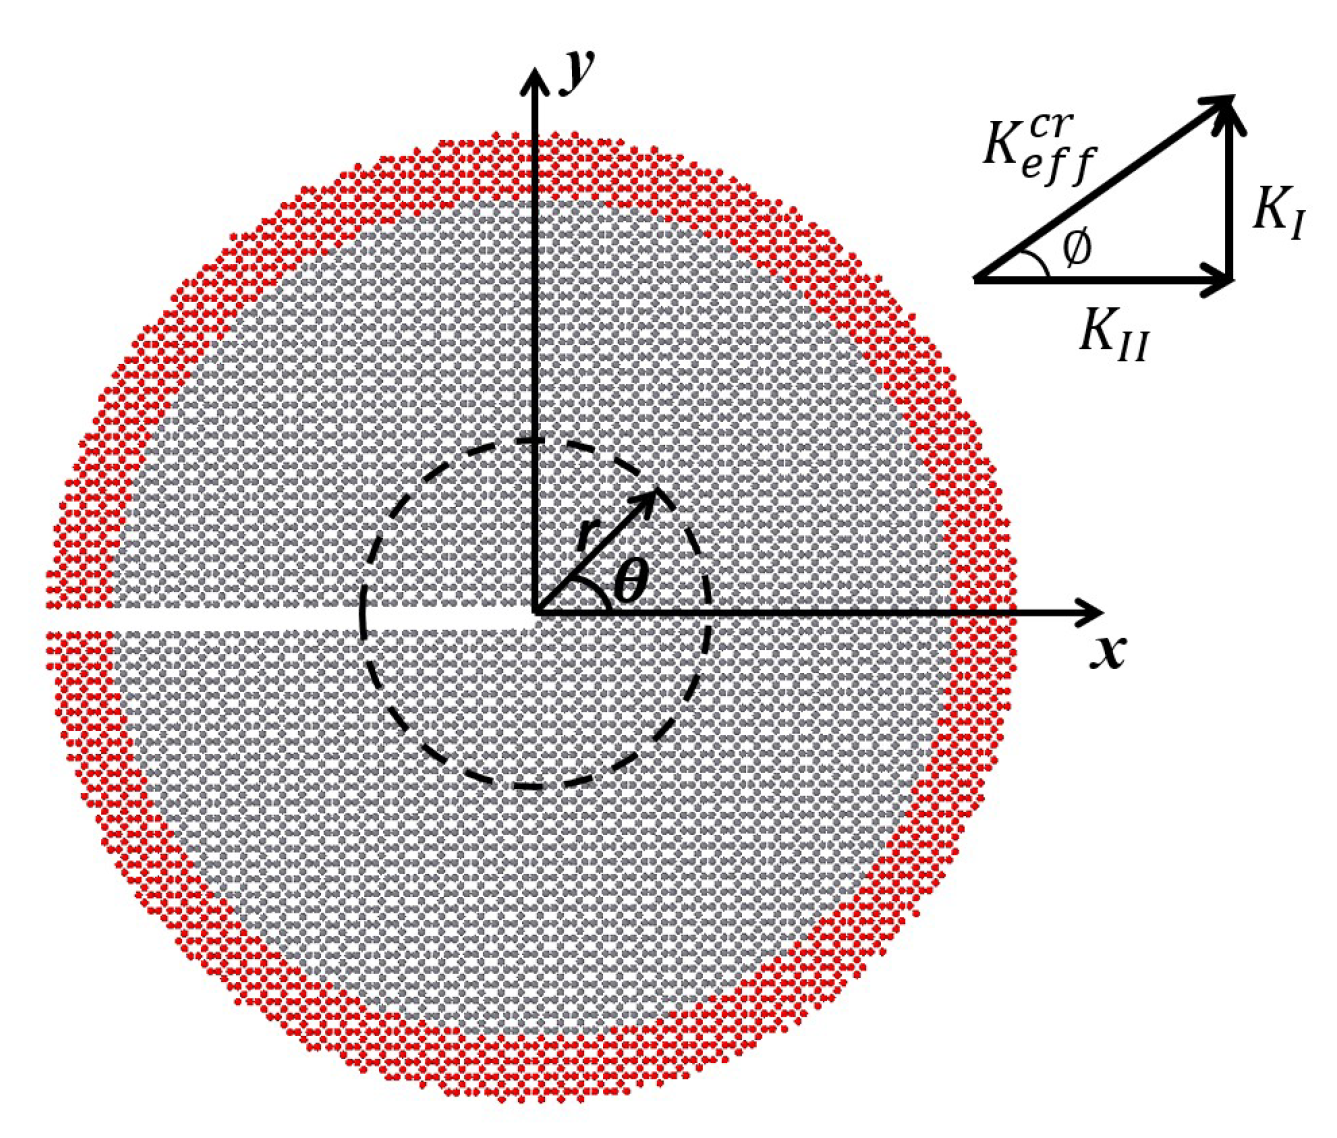
2.2. Fracture Properties of Tetragraphene
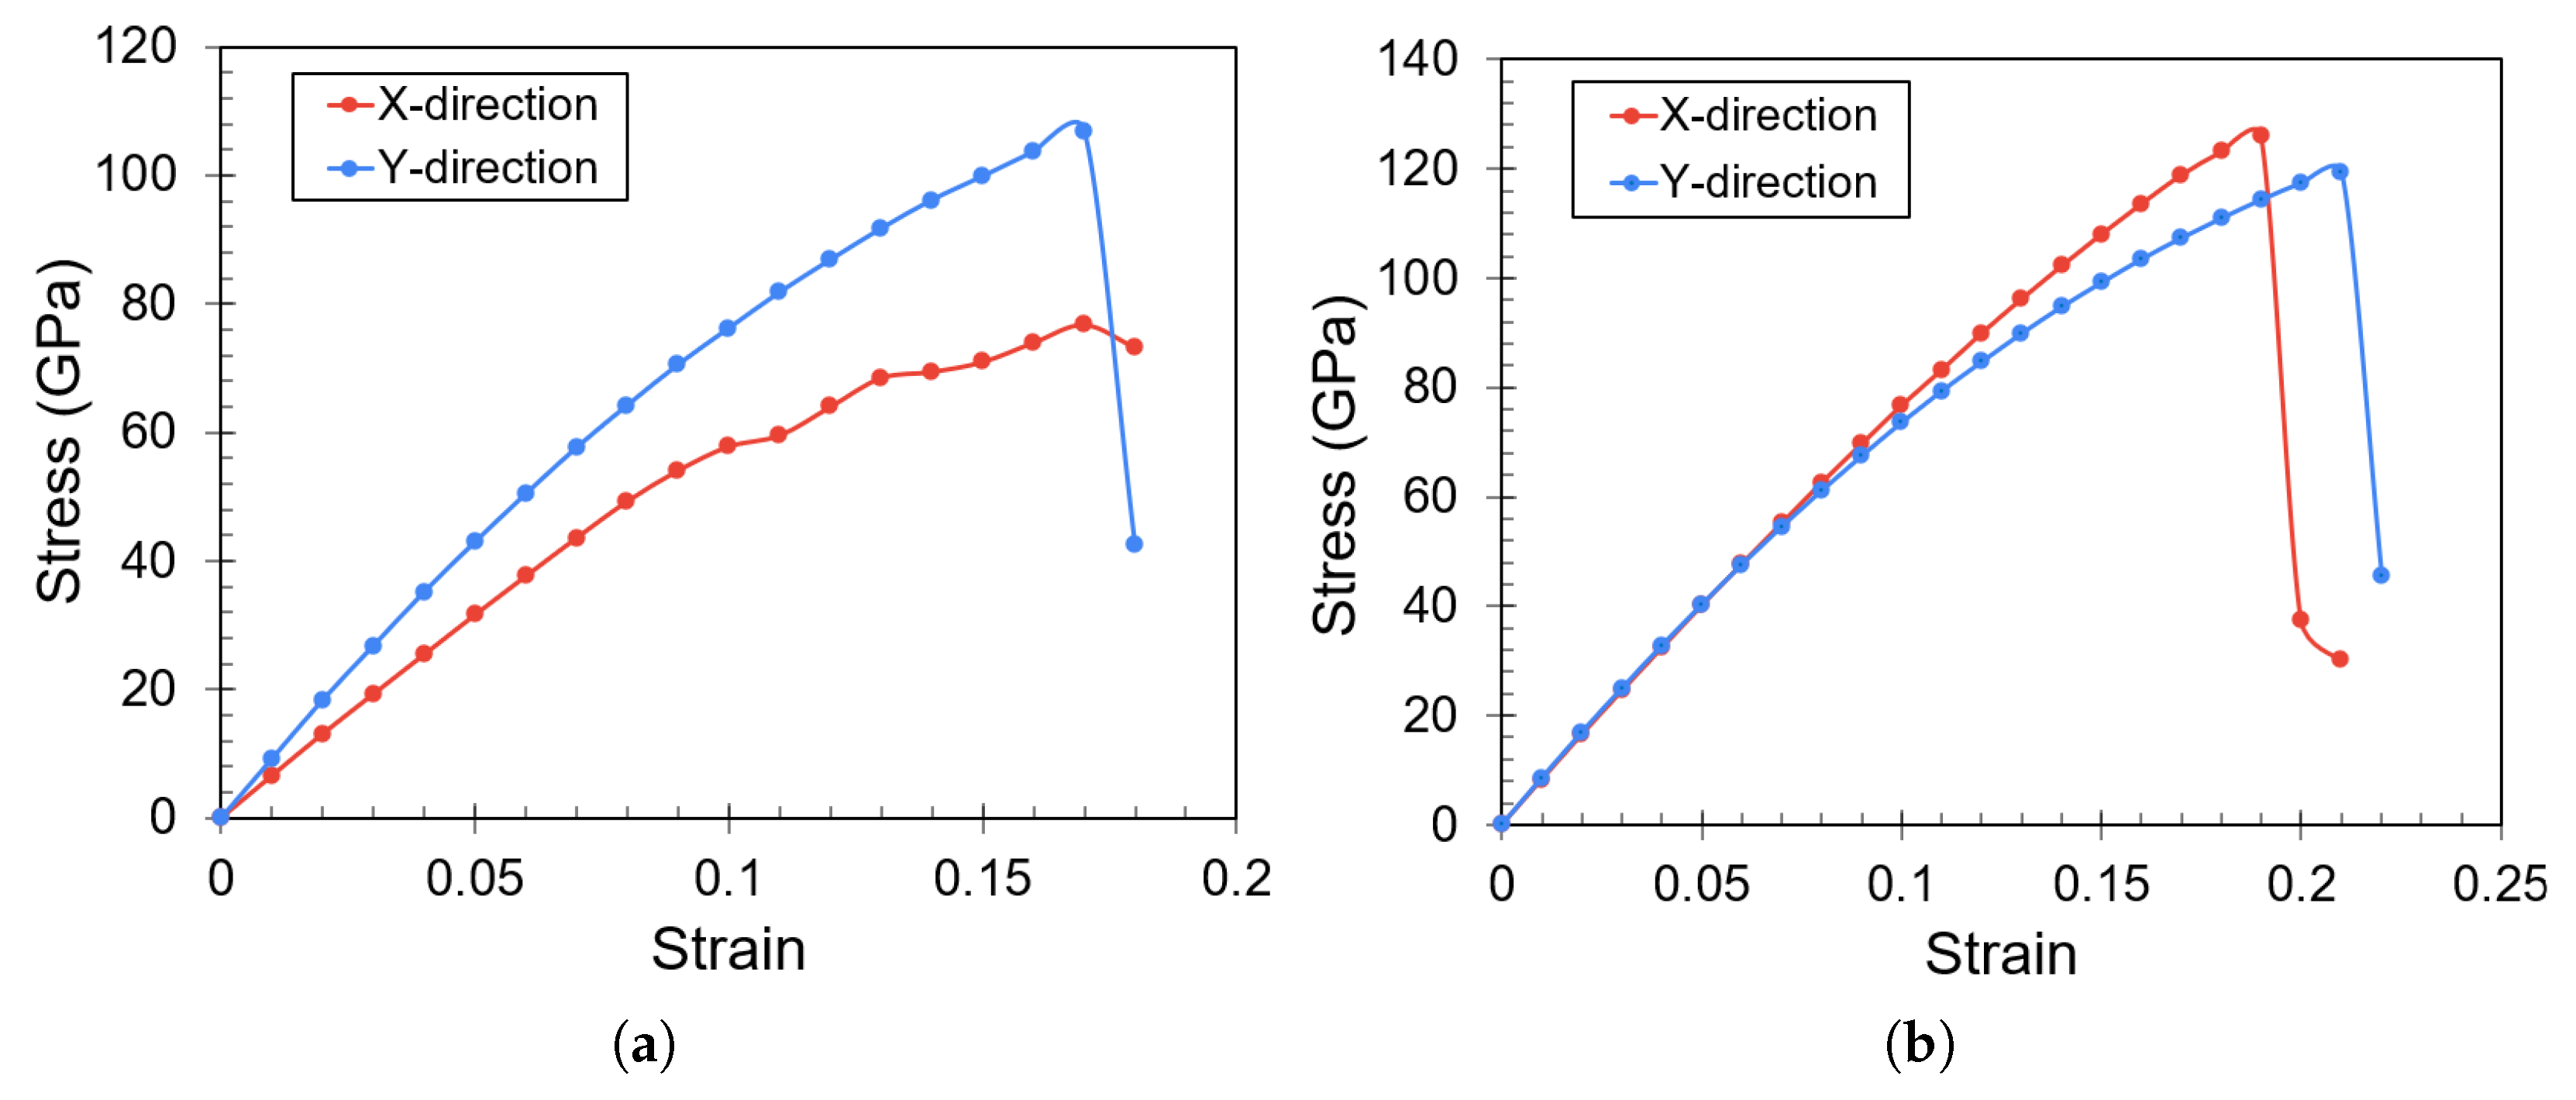
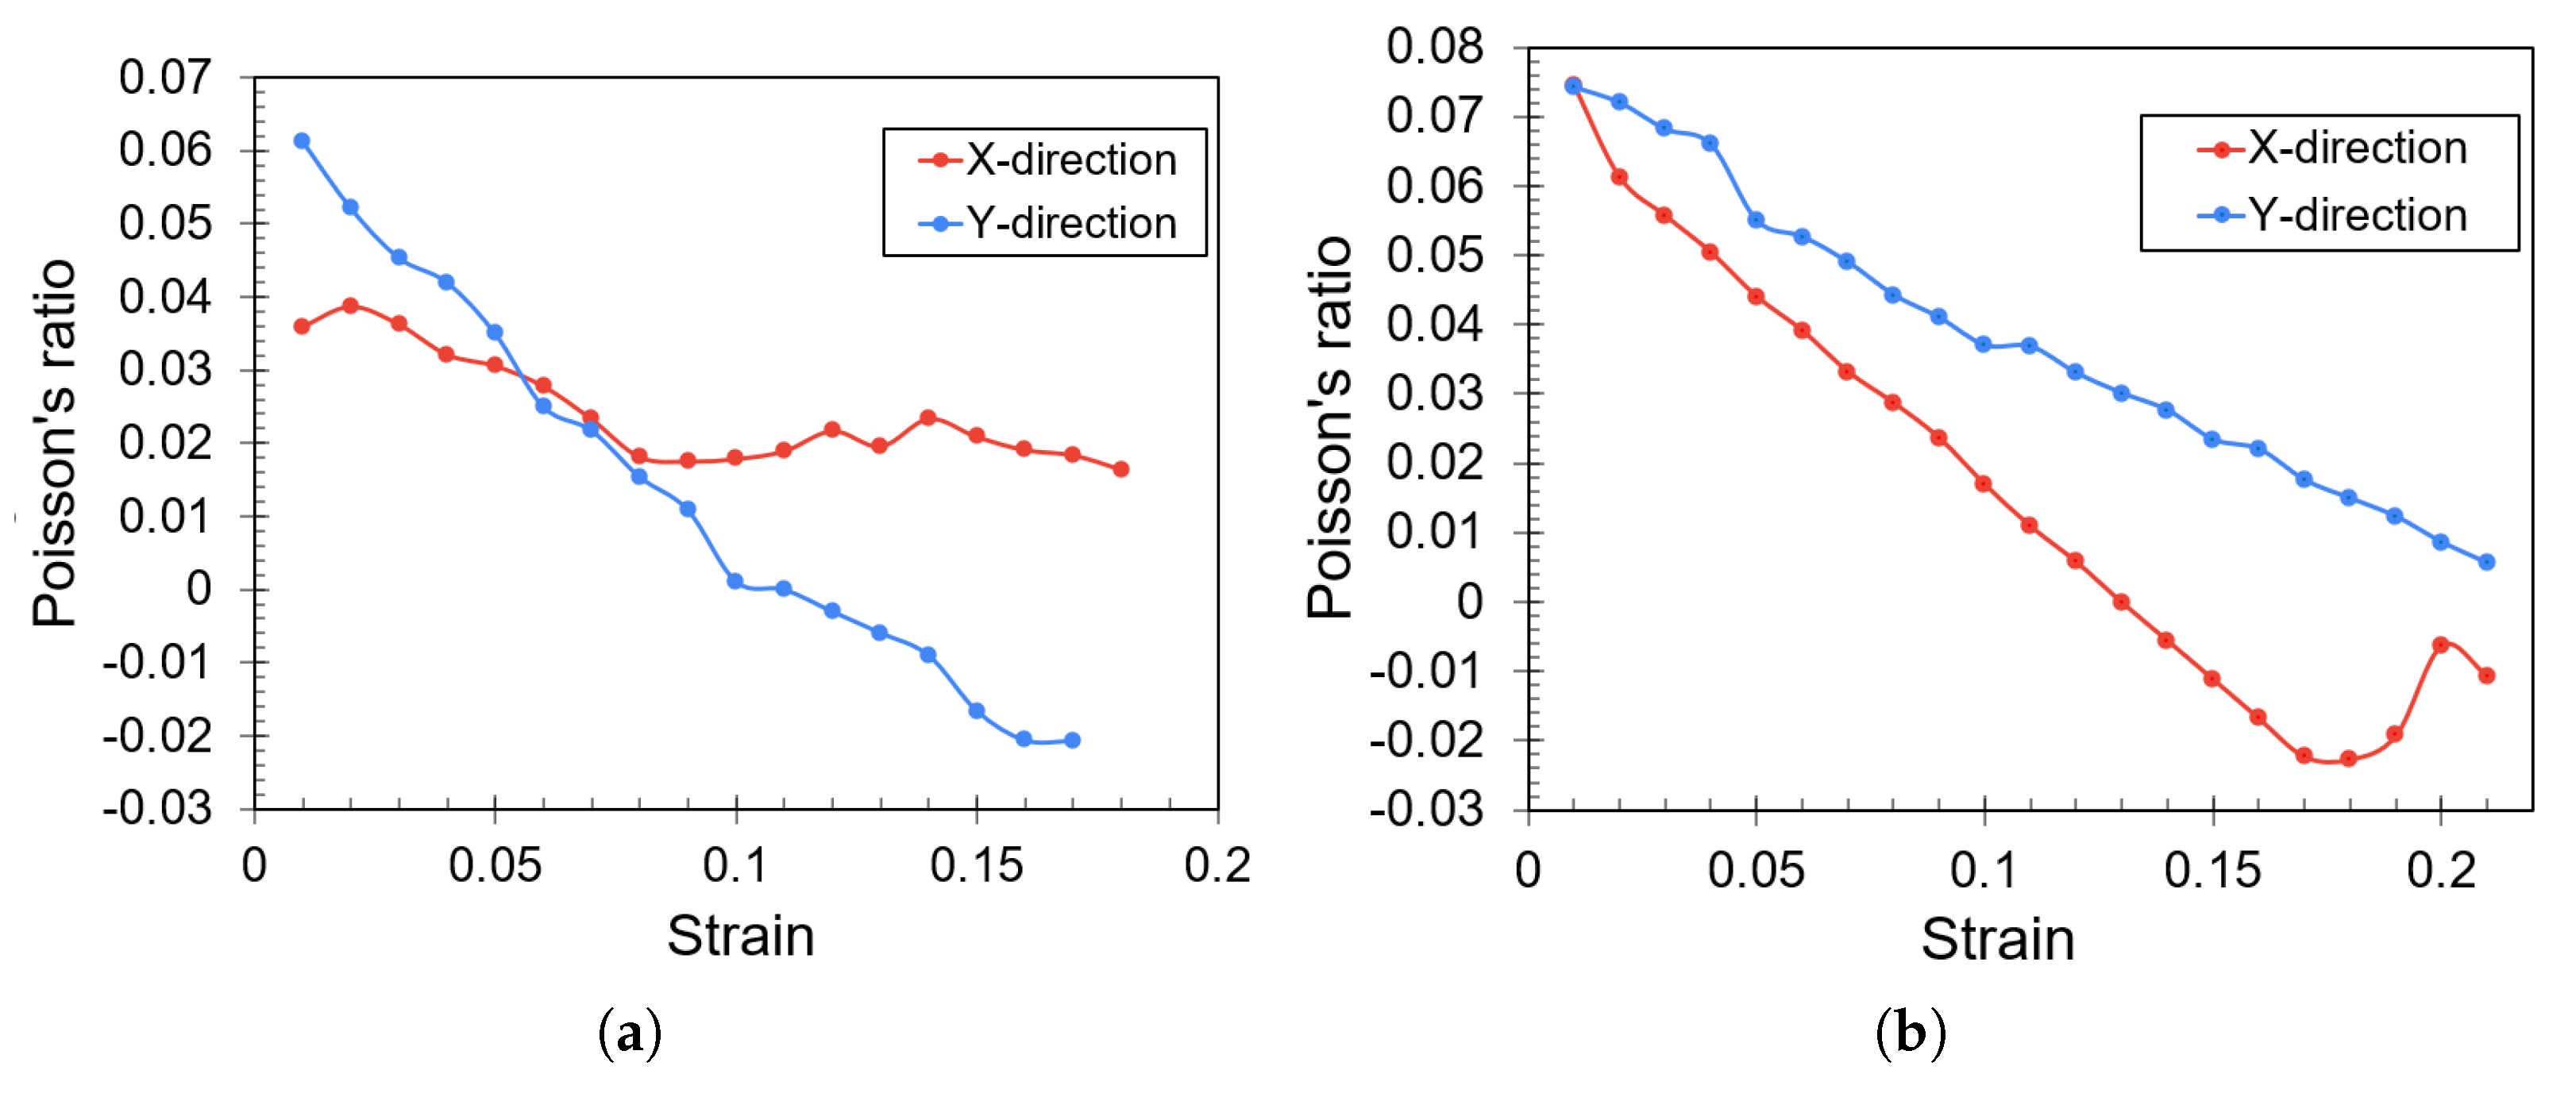
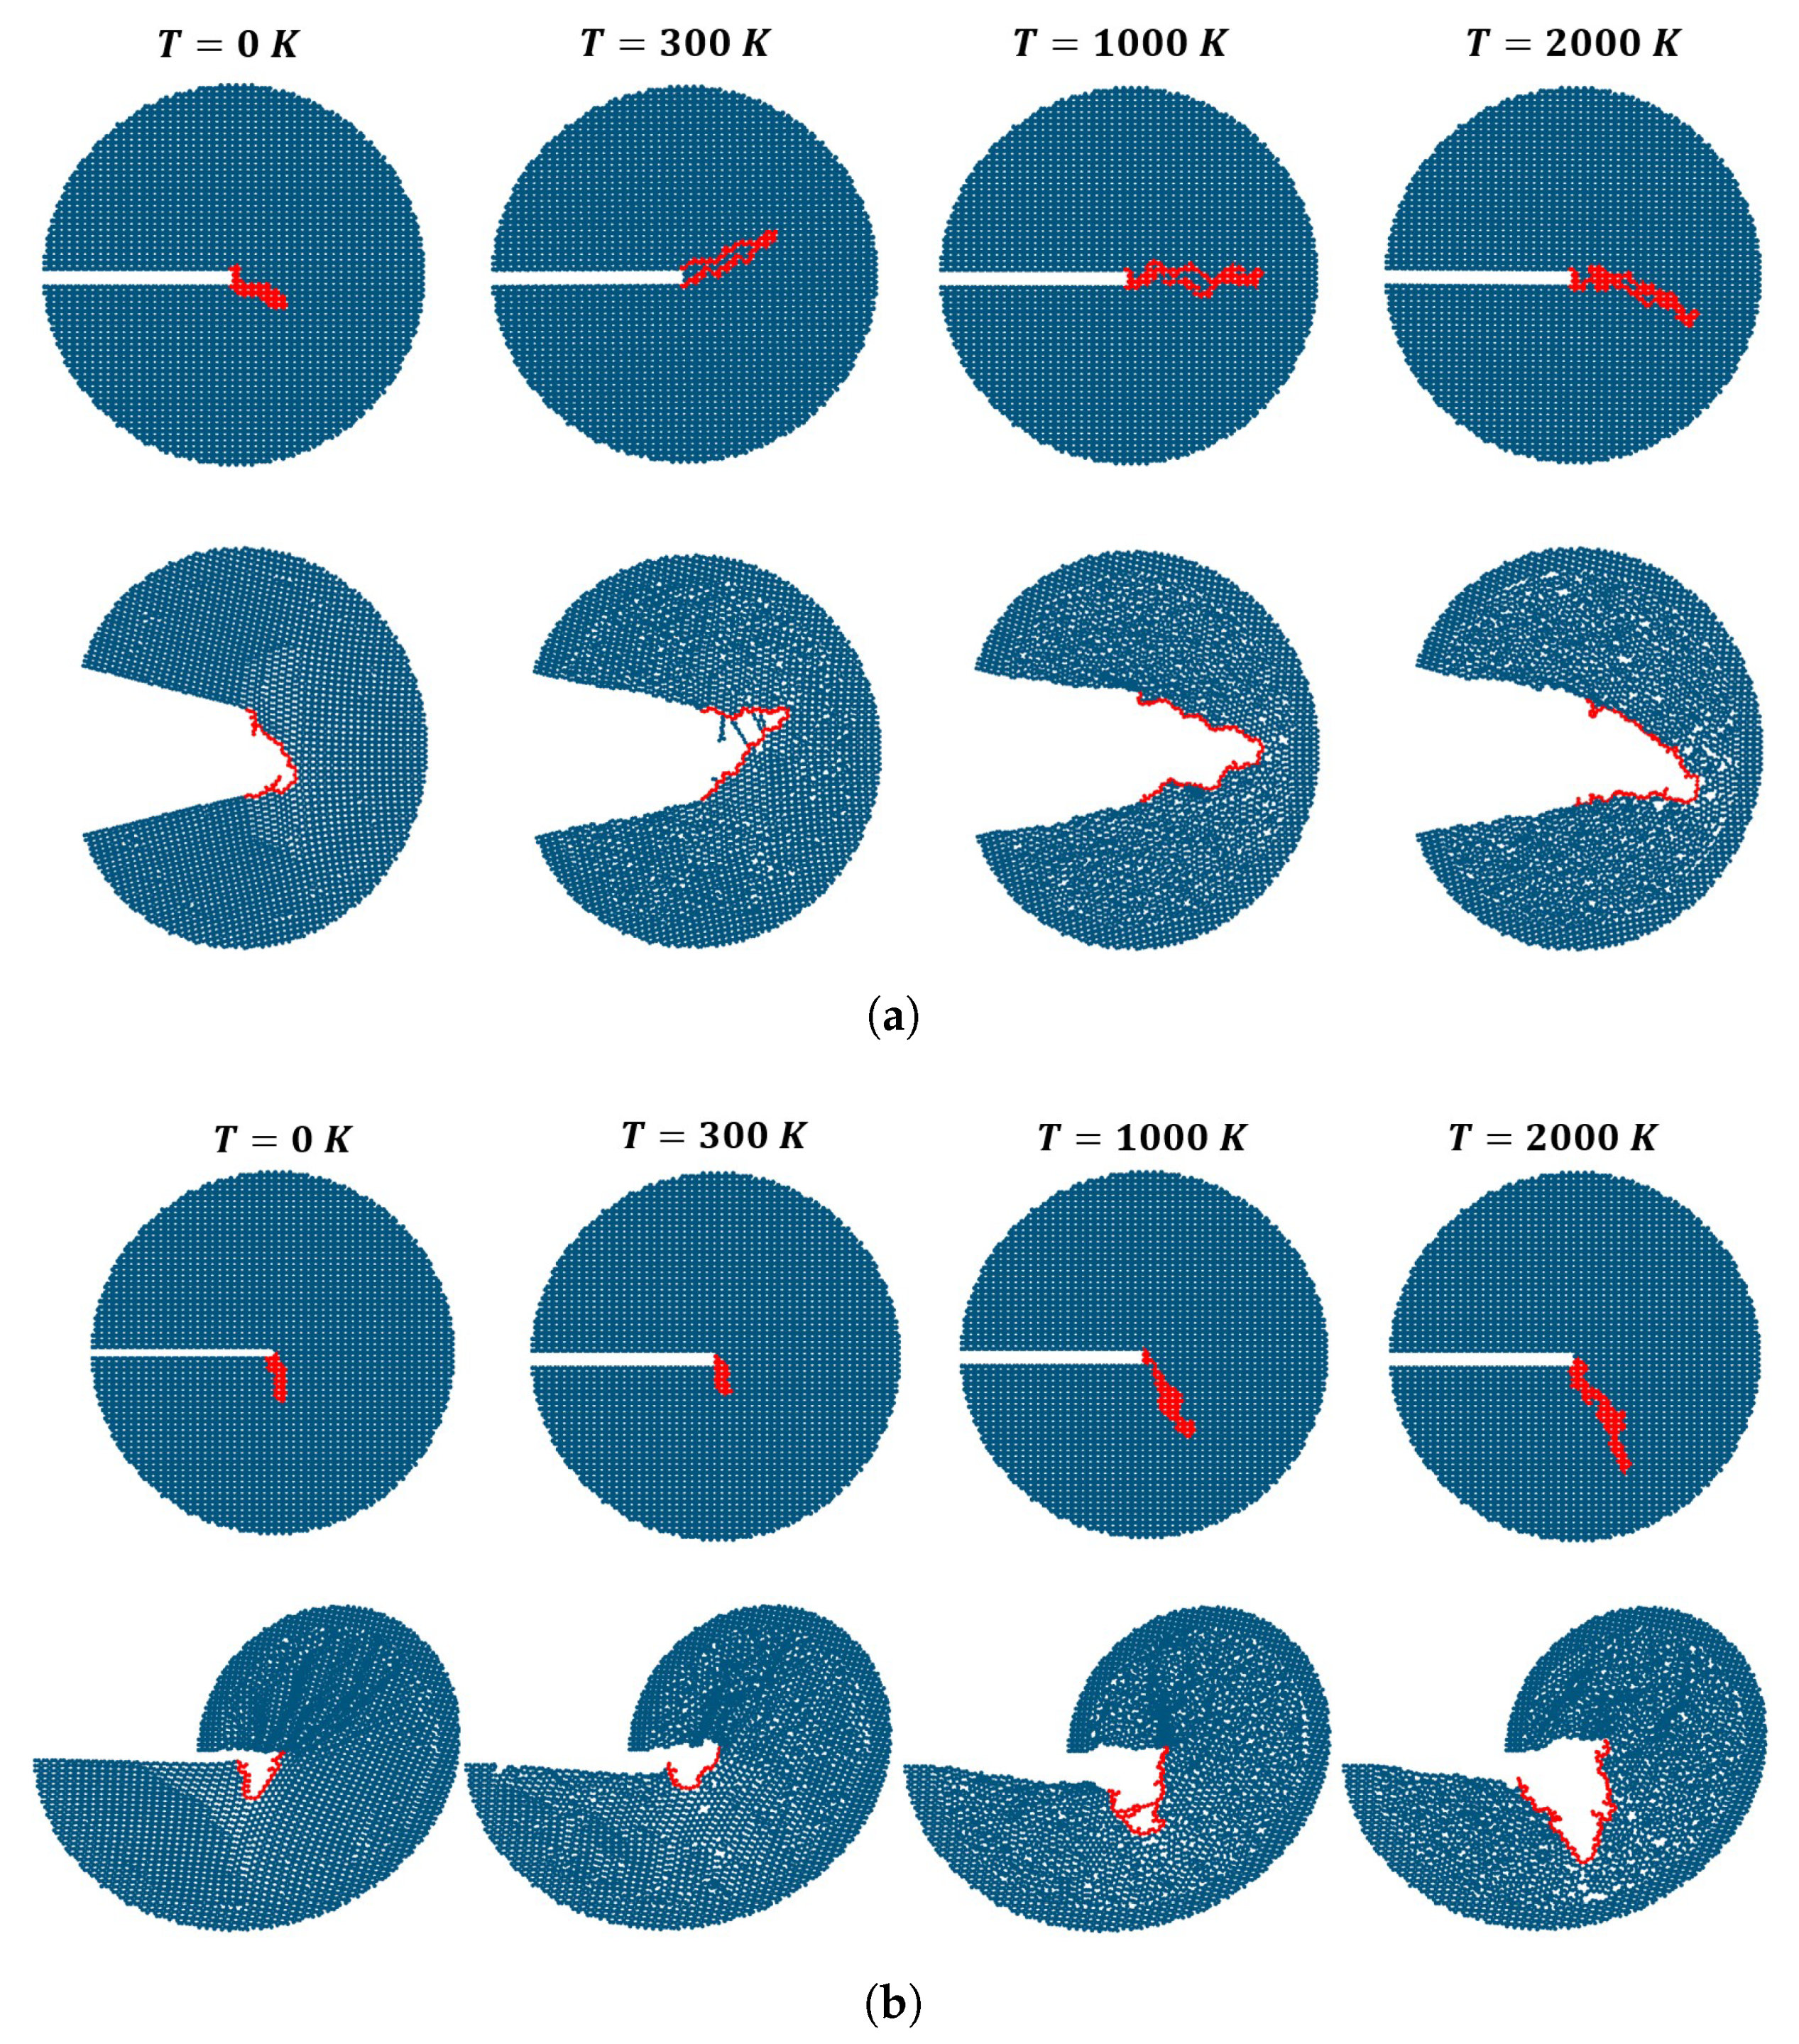
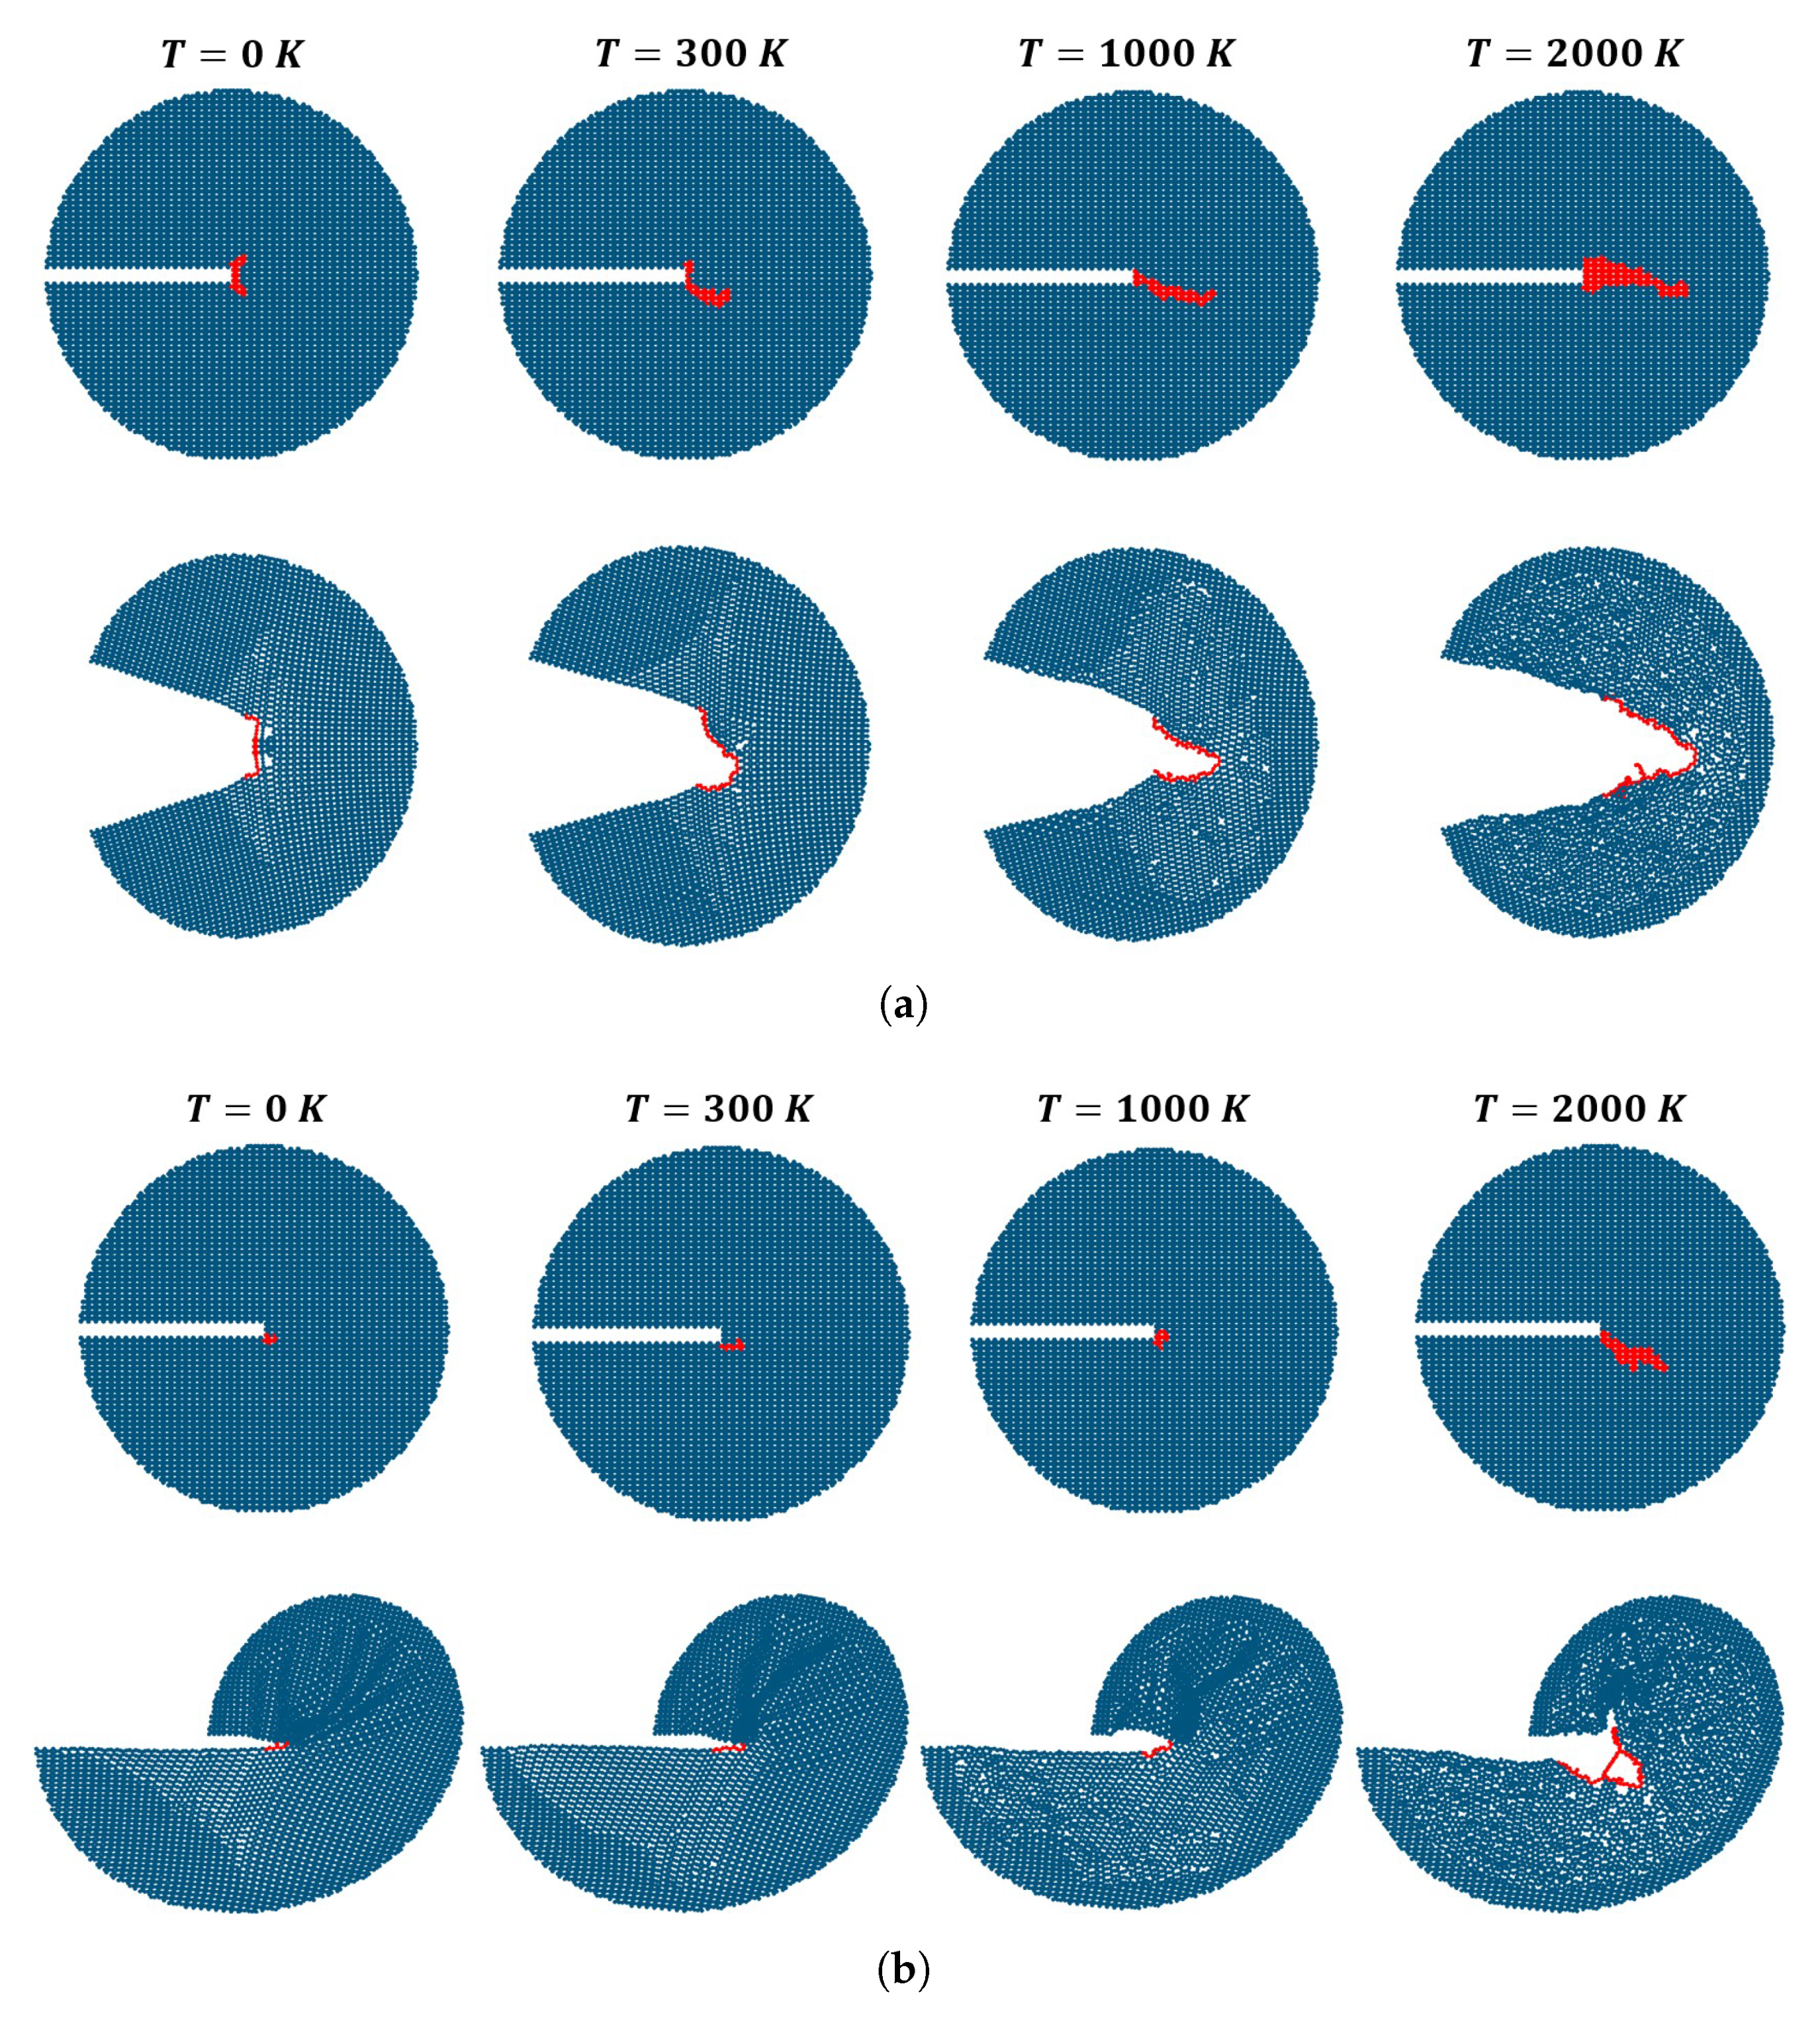
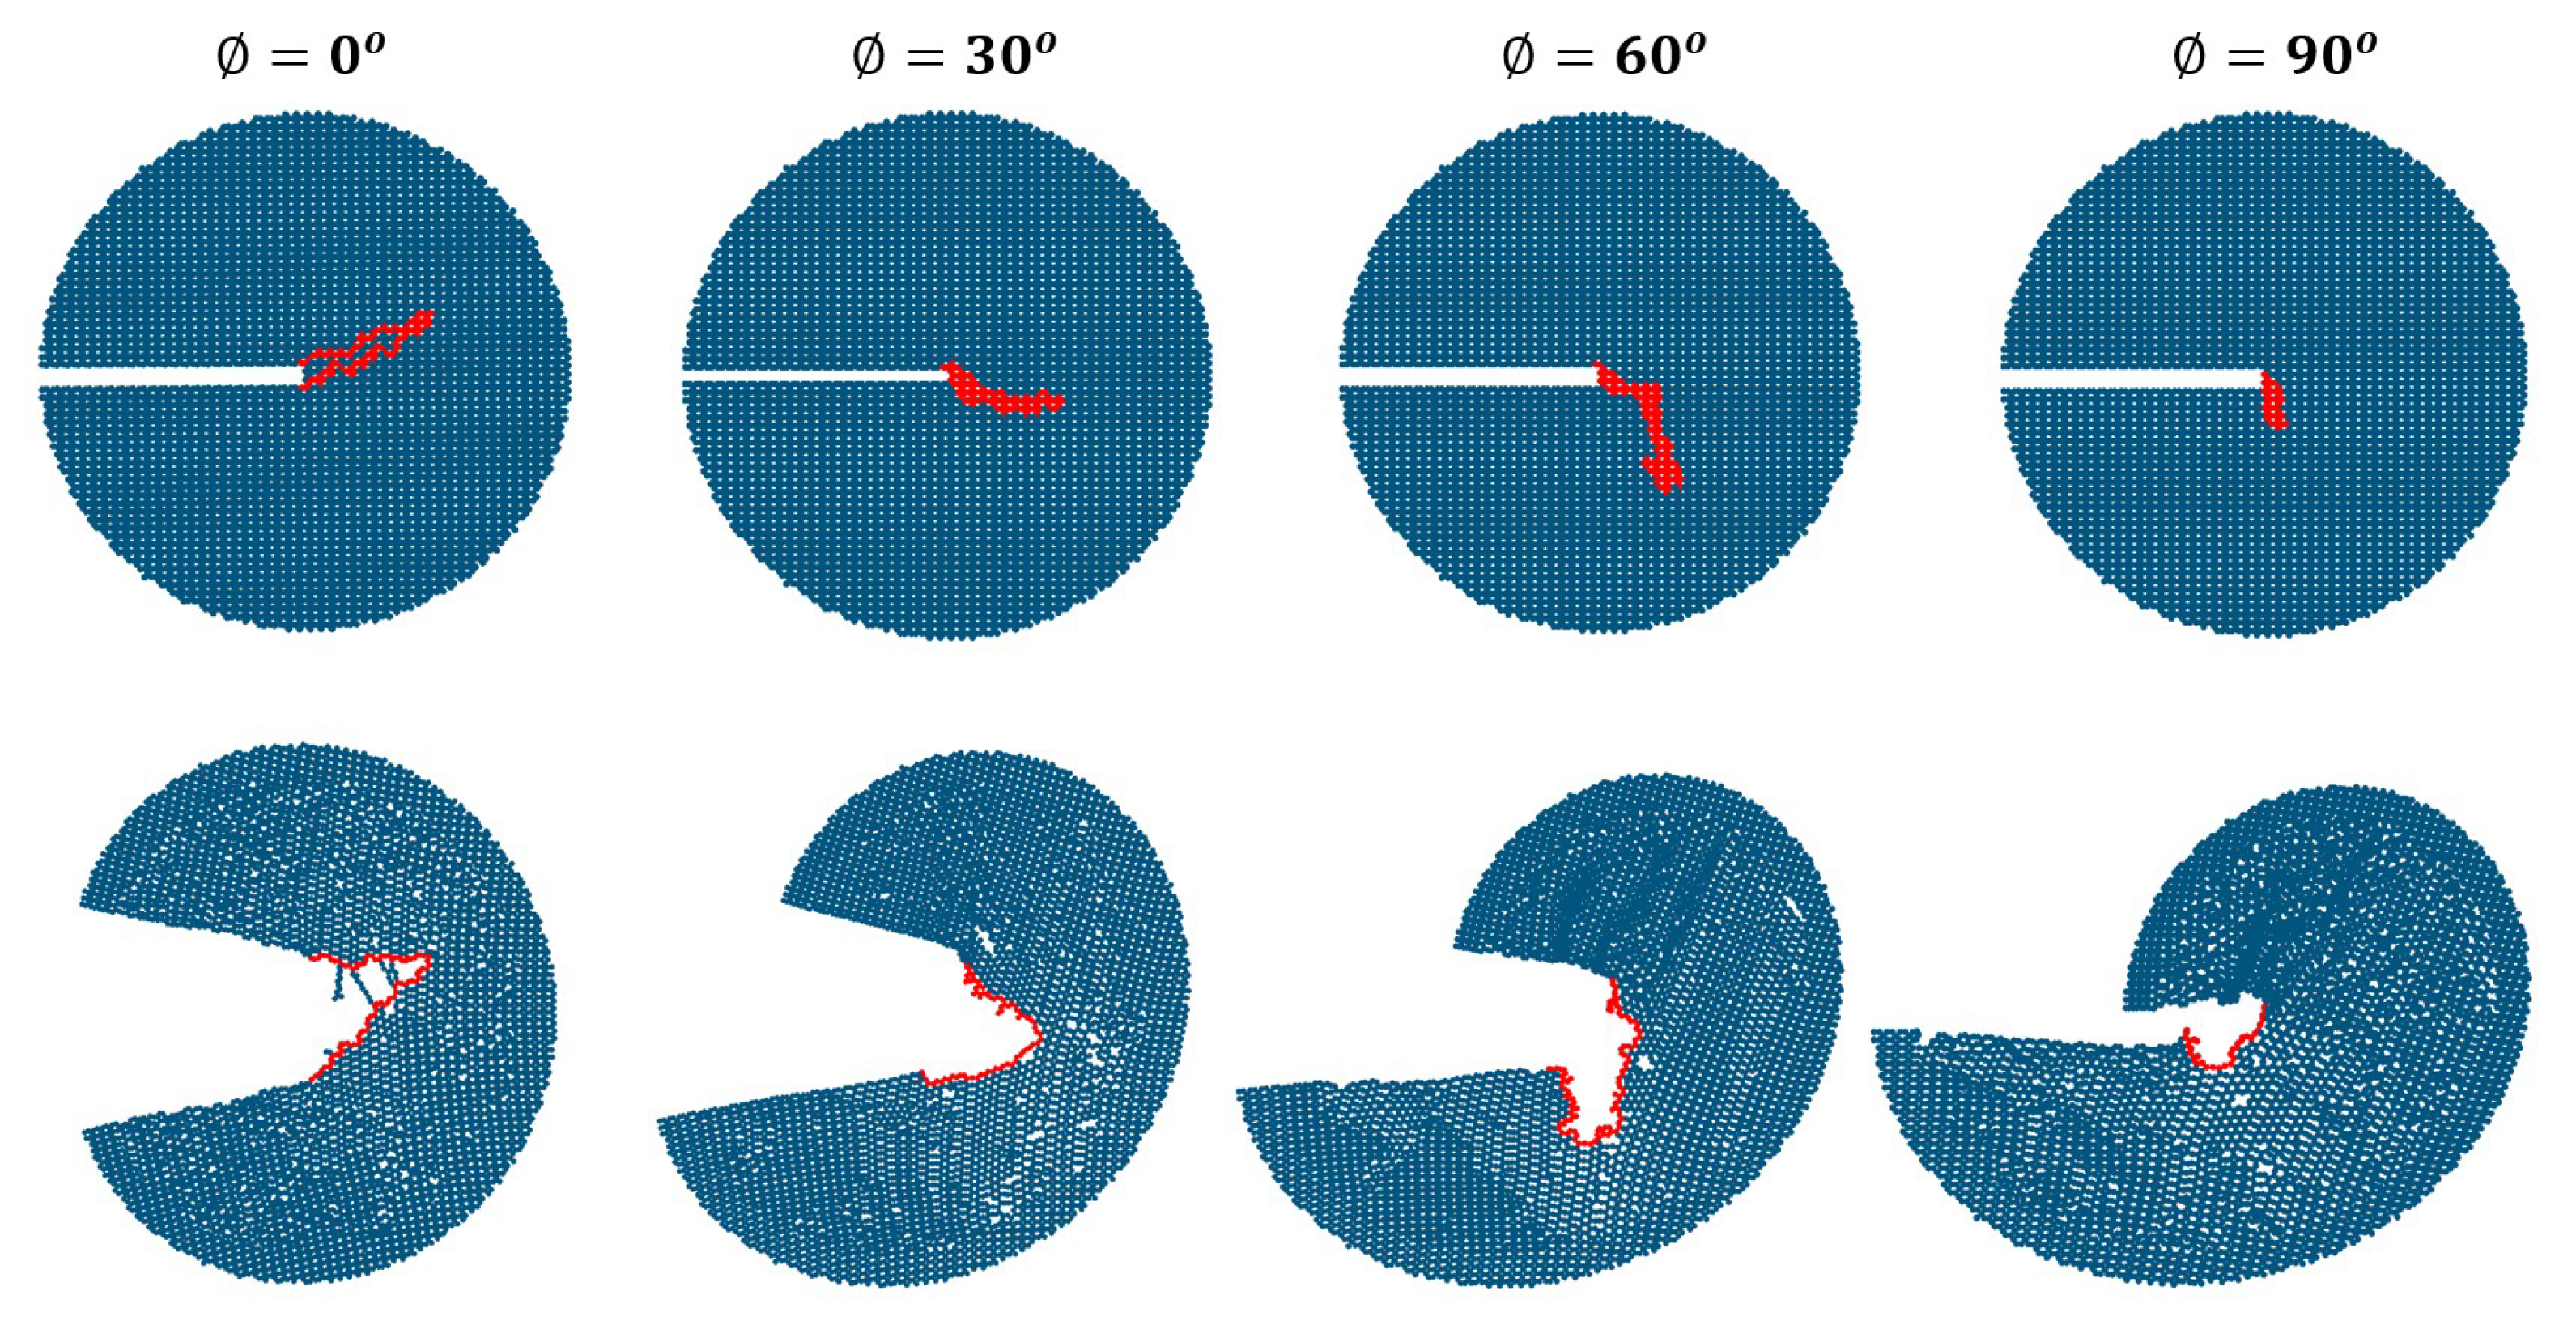
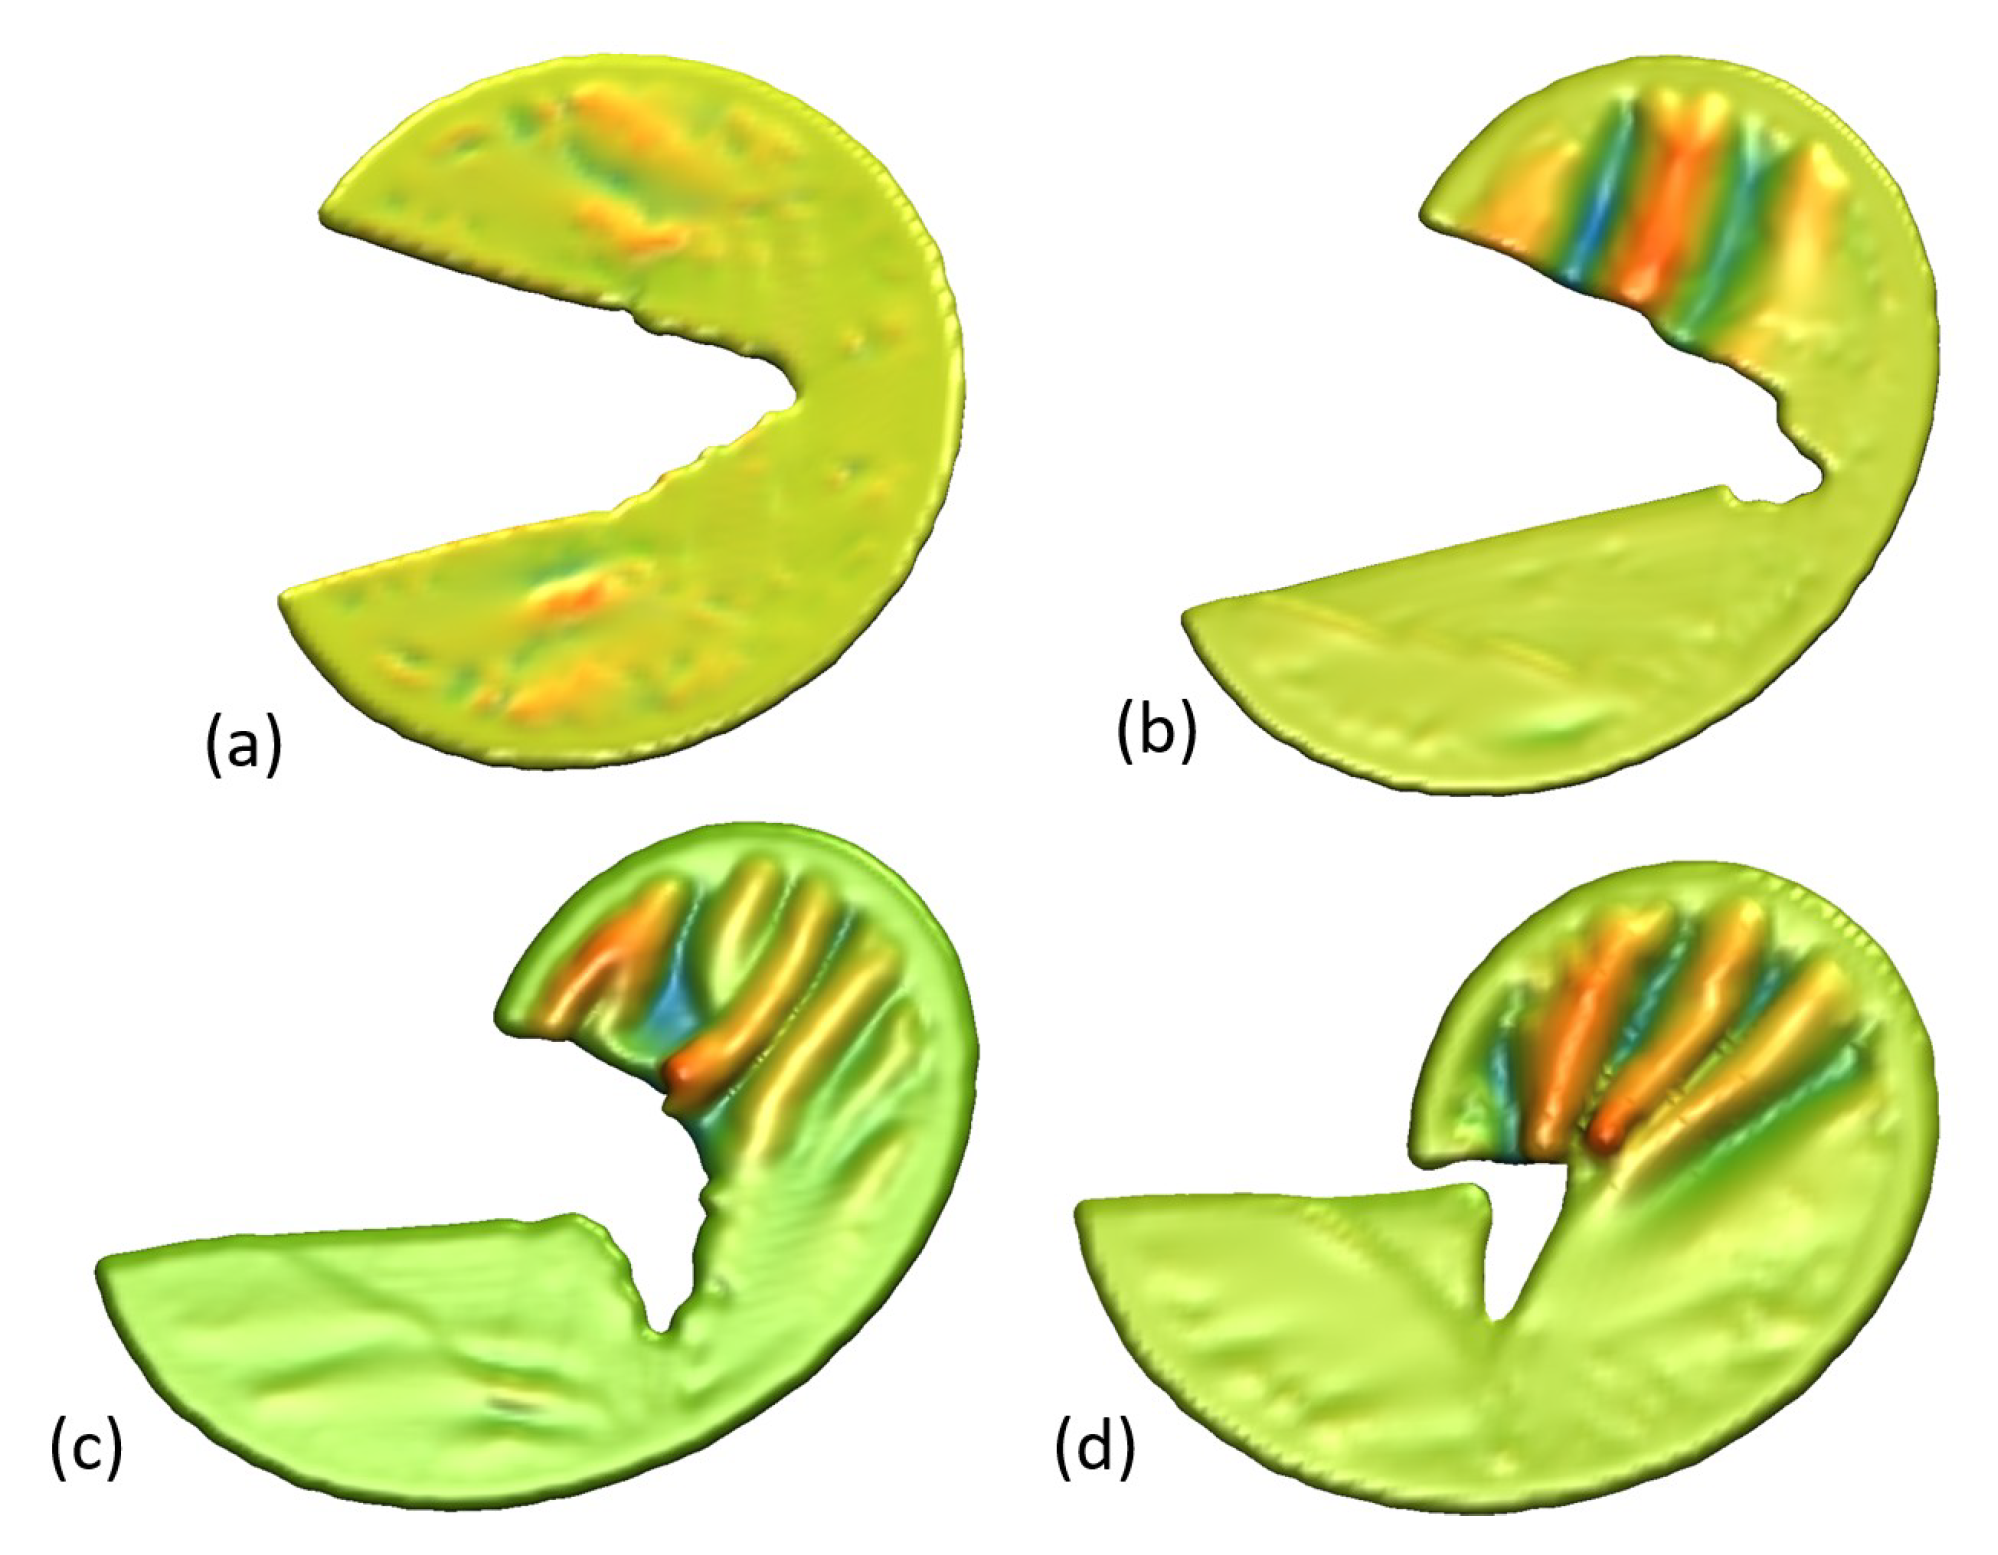
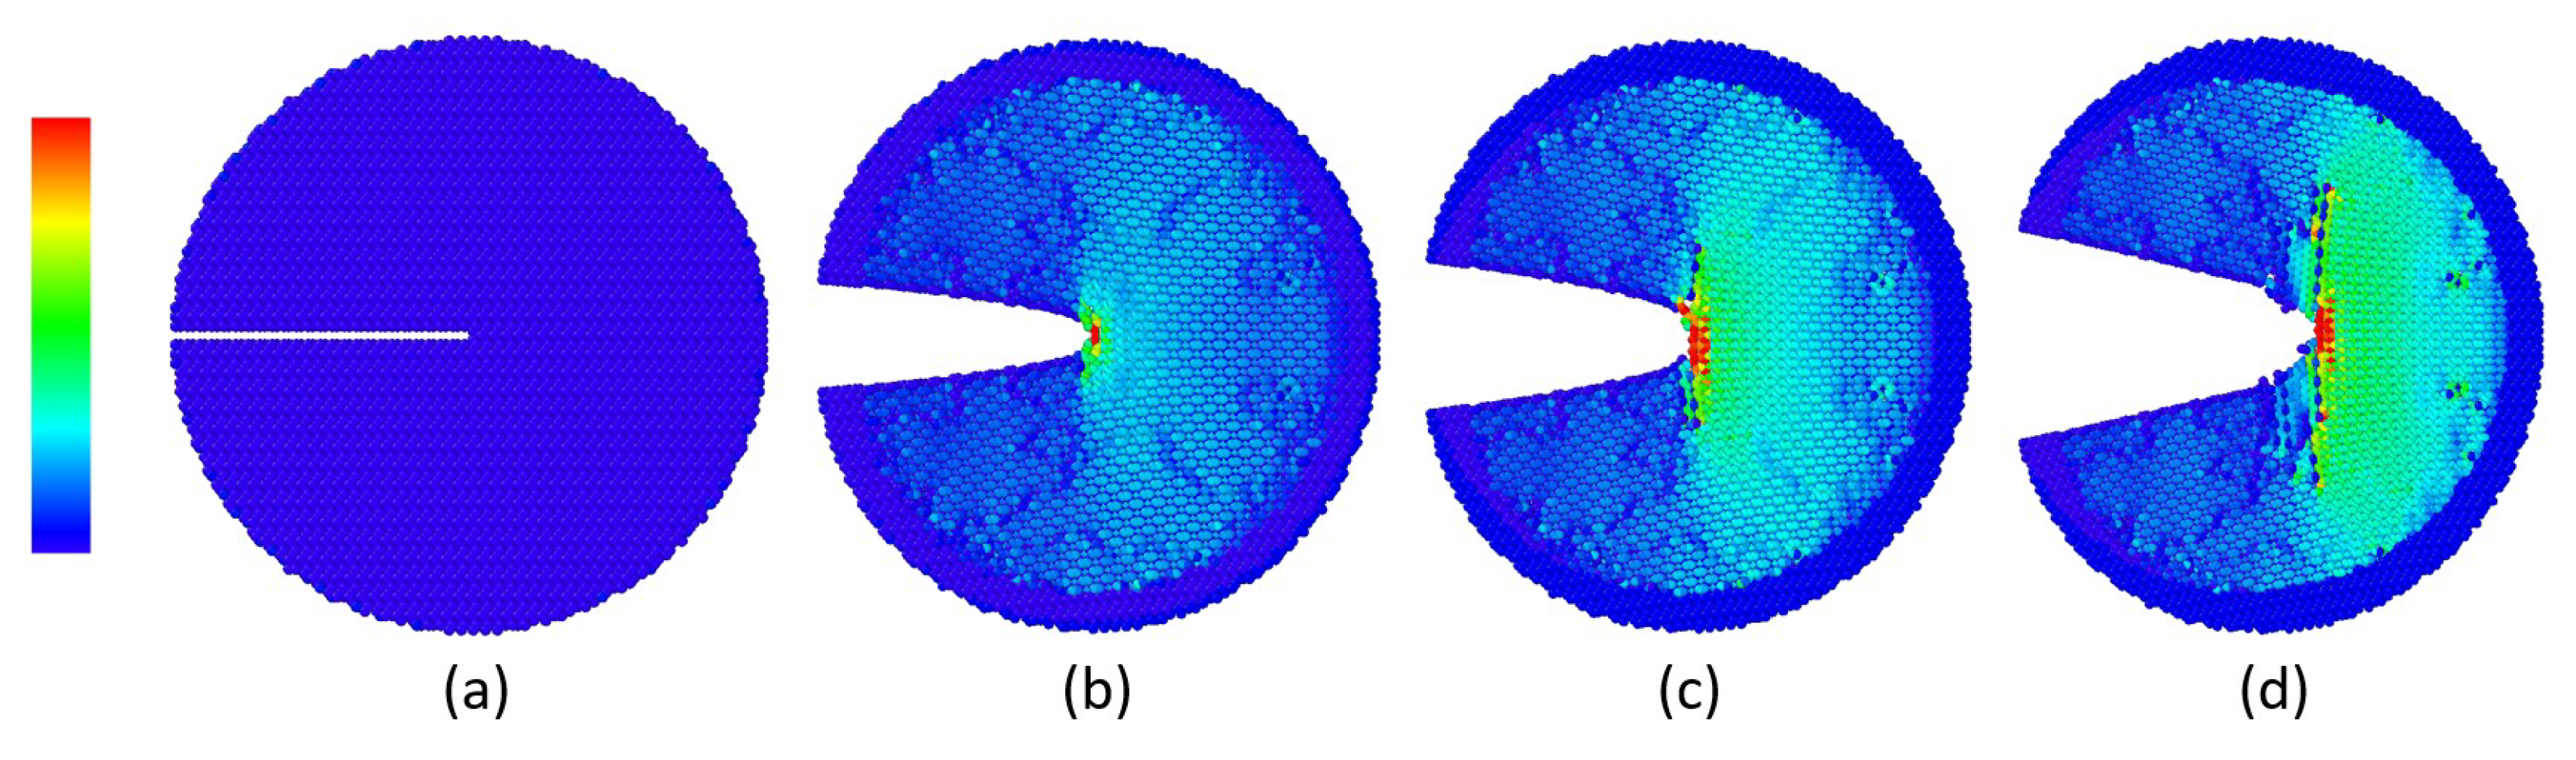
We employ MD simulations to investigate the SIF and crack propagation path of tetragraphene under mixed mode I and mode II loading. MD simulations are chosen instead of DFT due to the need for a larger simulation domain to accurately capture fracture properties, which exceeds the computational feasibility of DFT. The LAMMPS package is used for these simulations [34], with carbon atom interactions in the TG sheets represented by the Tersoff–Erhart–Albe potential [35] with a cutoff distance of 2.2 Å. The Erhart–Albe–Tersoff potential was selected due to its demonstrated accuracy in modeling carbon-based materials under large deformation and fracture conditions [36,37,38,39], offering reliable bond-breaking behavior with low computational cost.
Our MD model features a circular simulation domain with a radius of 65 Å centered on the crack tip, as depicted in Figure 5, ensuring that the boundary lies within the K-dominant zone. To introduce initial horizontal cracks with varying edge chiralities and tip shapes (sharp or blunt), 2, 3, or 4 rows of atoms are removed along the desired crack path, depending on the target geometry. To achieve equilibrium, the crack tip asymptotic field imposed on all atoms, with boundary atoms fixed and interior atoms allowed to relax. For a linear isotropic material, the asymptotic displacement fields at the crack tip are expressed by the following [40]:
u x = 1 + ν E r 2 π [ K I cos θ 2 κ 1 + 2 sin 2 θ 2 + K II sin θ 2 κ + 1 + 2 cos 2 θ 2 ] u y = 1 + ν E r 2 π [ K I sin θ 2 κ + 1 2 cos 2 θ 2 K II cos θ 2 κ 1 2 sin 2 θ 2 ]
where u x and u y denote displacements along the x and y directions, respectively; K I and K II represent the mode I and mode II SIFs, and r and θ are the polar coordinates illustrated in Figure 5. The Poisson’s ratio is denoted with ν , and the Kolosov constant κ is expressed as
κ = 3 ν 1 + ν
under plane stress conditions, the effective SIF is expressed as
K eff = K I 2 + K II 2
and the loading phase angle
ϕ = tan 1 K II K I
indicates the ratio of mode I to mode II loading. A phase angle of 0 represents pure mode I loading, whereas 90 indicates pure mode II loading. In this study, the loading phase angle is varied from 0 to 90 to investigate its effect on the critical SIF K cr .
To model crack propagation under quasi-static loading, the loading is incremented by Δ K eff = 0.01   MPa m . After each increment, boundary atoms are fixed, and interior atoms are relaxed using the conjugate gradient method. The velocity-Verlet algorithm with a 1 fs time step integrates the atoms’ trajectories. To ensure that thermal effects are accurately represented, the atomic structure was fully relaxed separately at each temperature prior to loading, ensuring thermal equilibrium and structural stability at the respective temperature level. A two-step thermalization and relaxation process was used at each temperature point. First, initial thermalization was performed using a Berendsen thermostat to gradually increase the system temperature to the specified target, preventing thermal shock or instability. This was followed by a relaxation phase in the NVT ensemble using a Nosé–Hoover thermostat, allowing the system to reach thermal equilibrium. The atoms were relaxed until energy and temperature fluctuations stabilized, providing a realistic representation of thermal vibrations and stress redistribution. Furthermore, the structure was equilibrated before any loading was applied, ensuring that all mechanical responses and crack propagation were evaluated from a thermally relaxed state. This process was repeated for six different temperature points (0 K, 300 K, 600 K, 1000 K, 1500 K, and 2000 K) to evaluate the influence of temperature on the fracture behavior of TG.
The critical SIF is identified as the point at which a bond at the crack tip or edge ruptures, initiating crack growth. This is determined by monitoring the covalent bond lengths during loading, and declaring a bond as broken when its length exceeds the cutoff distance defined by the Erhart–Albe–Tersoff potential.
In this study, we also examine the impact of crack edge and tip structures on the fracture properties of tetragraphene. The various crack configurations analyzed in this work are illustrated in Figure 6 and Figure 7. As shown, each structure includes cracks with two distinct edge types, labeled A and B. Furthermore, we consider a crack configuration where one edge is type A and the other is type B. To evaluate the impact of crack tip structures on SIFs and crack growth, we investigate both sharp and blunt crack tips.

3. Results

The crack propagation paths in tetragraphene sheets with 2-even and 2-odd structures, encompassing various crack configurations, are illustrated in Figure 8, Figure 9 and Figure 10. The results indicate that the crack propagation path is strongly affected by both the loading phase angle and the temperature. Under pure mode I loading, the crack follows a self-similar propagation path. In contrast, under mixed-mode loading, cracks display kinking behavior while they grow; see Figure 11. When the loading phase angle is close to zero, out-of-plane deformation is minimal. In contrast, as the angle nears 90°, this deformation becomes significantly more pronounced, highlighting its significance under mode II loading. Figure 11 presents the out-of-plane deformation observed under different loading conditions. The out-of-plane deformation of the tetragraphene sheet under mixed-mode loading facilitates energy dissipation through bending, which may contribute to delaying crack propagation. This behavior has been previously observed in pre-cracked thin plates under tensile or shear loading [41] and in other two-dimensional materials [42].
Figure 12 illustrates the stress contour around the crack tip under mode I loading phase angle. The sequence from (a) to (d) depicts the crack propagation process, where stress concentration near the crack tip increases, leading to fracture evolution.
Figure 13 and Figure 14 show the critical SIF with respect to the loading phase angle, illustrating the relationship between the effective critical SIF and key parameters, including temperature, crack tip configuration, and crack edge chirality. These plots reveal that the critical SIF for mode II is consistently higher than that for mode I, a result that contrasts with typical observations in bulk materials, where mode II generally exhibits a lower critical SIF than mode I. In tetragraphene, this unusual behavior can be attributed to the out-of-plane deformation of the sheets under mode II loading. Unlike conventional bulk materials, where mode II loading often leads to shear-dominated fracture, the atomically thin nature of tetragraphene allows for significant out-of-plane deformations. This buckling effect leads to the structure absorbing a portion of the applied energy through bending, delaying bond breakage at the crack tip and necessitating greater deformation before failure occurs. The higher SIF values observed in the 2-odd structure compared to the 2-even structure further highlight the role of structural configuration in determining fracture behavior.
The influence of temperature on the critical SIFs is illustrated in Figure 13. A comparison of these plots reveals that, in general, 2-odd structures exhibit higher critical SIFs than their 2-even counterparts at corresponding temperatures. For example, as shown in Figure 14, under pure mode I loading at 300 K, the critical SIF for the 2-even-A blunt structure is 9 MPa m , whereas for the 2-odd-A blunt structure, it is 11.9 MPa m . This suggests that the structural arrangement in the 2-odd configuration enhances the material’s resistance to crack propagation, likely due to differences in bond distribution and load transfer mechanisms.
The results also demonstrate a clear decreasing trend in SIFs with increasing temperature (Figure 13), indicating that higher thermal energy weakens the material’s ability to resist fracture. Specifically, in Figure 13a, which corresponds to a 2-even-A sharp crack tip structure, the mode I critical SIF decreases from approximately 10 MPa m at 0 K to 5.2 MPa m at 2000 K. A similar trend is observed for mode II, where the critical SIF drops from 11.5 MPa m to 9.5 MPa m over the same temperature range. This decline in fracture resistance at elevated temperatures is consistent across both configurations, though the rate of reduction may vary due to structural differences.
The observed reduction in SIFs at higher temperatures can be attributed to several factors. As temperature increases, atomic vibrations intensify, weakening interatomic forces and lowering the cohesive strength of the material, a phenomenon known as thermal softening. This reduces the energy barrier for bond breaking, making crack propagation more favorable. Additionally, thermal expansion induces stress redistribution near the crack tip, which alters the local stress field and can lead to premature failure. At elevated temperatures, lattice distortions and phonon–phonon interactions also contribute to mechanical instability by disrupting atomic order and assisting crack initiation, increasing the likelihood of failure under applied stress.
These findings highlight the important impact of temperature in determining the mechanical stability of tetragraphene and suggest that its fracture behavior is highly temperature-sensitive. The superior fracture resistance of the 2-odd configuration at all temperatures indicates that it may be a more suitable candidate for applications requiring enhanced mechanical durability. Furthermore, understanding the temperature-dependent behavior of tetragraphene is essential for designing nanoscale devices and structural components that operate under extreme thermal conditions.

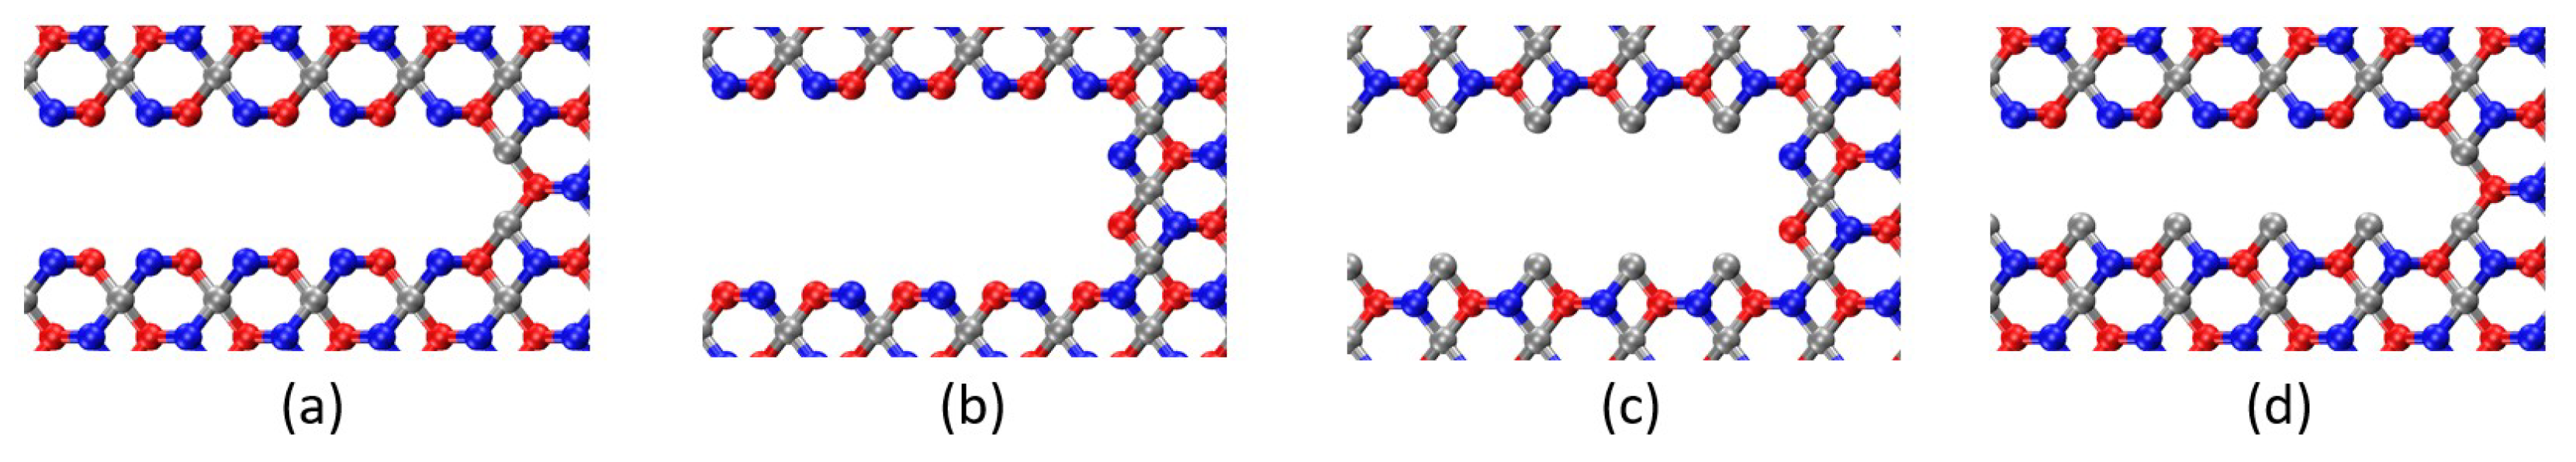
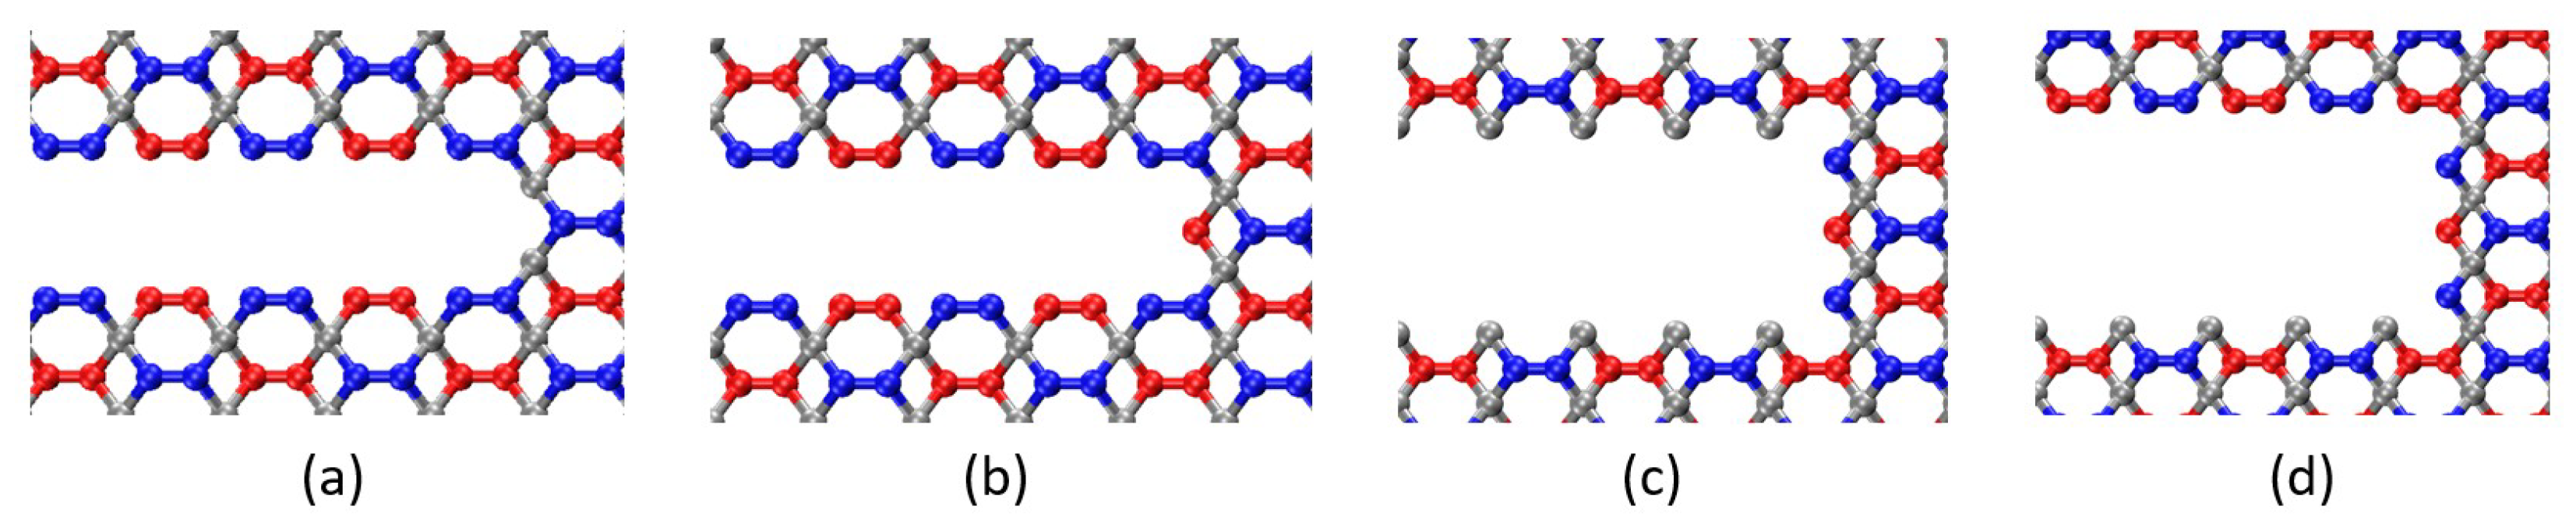
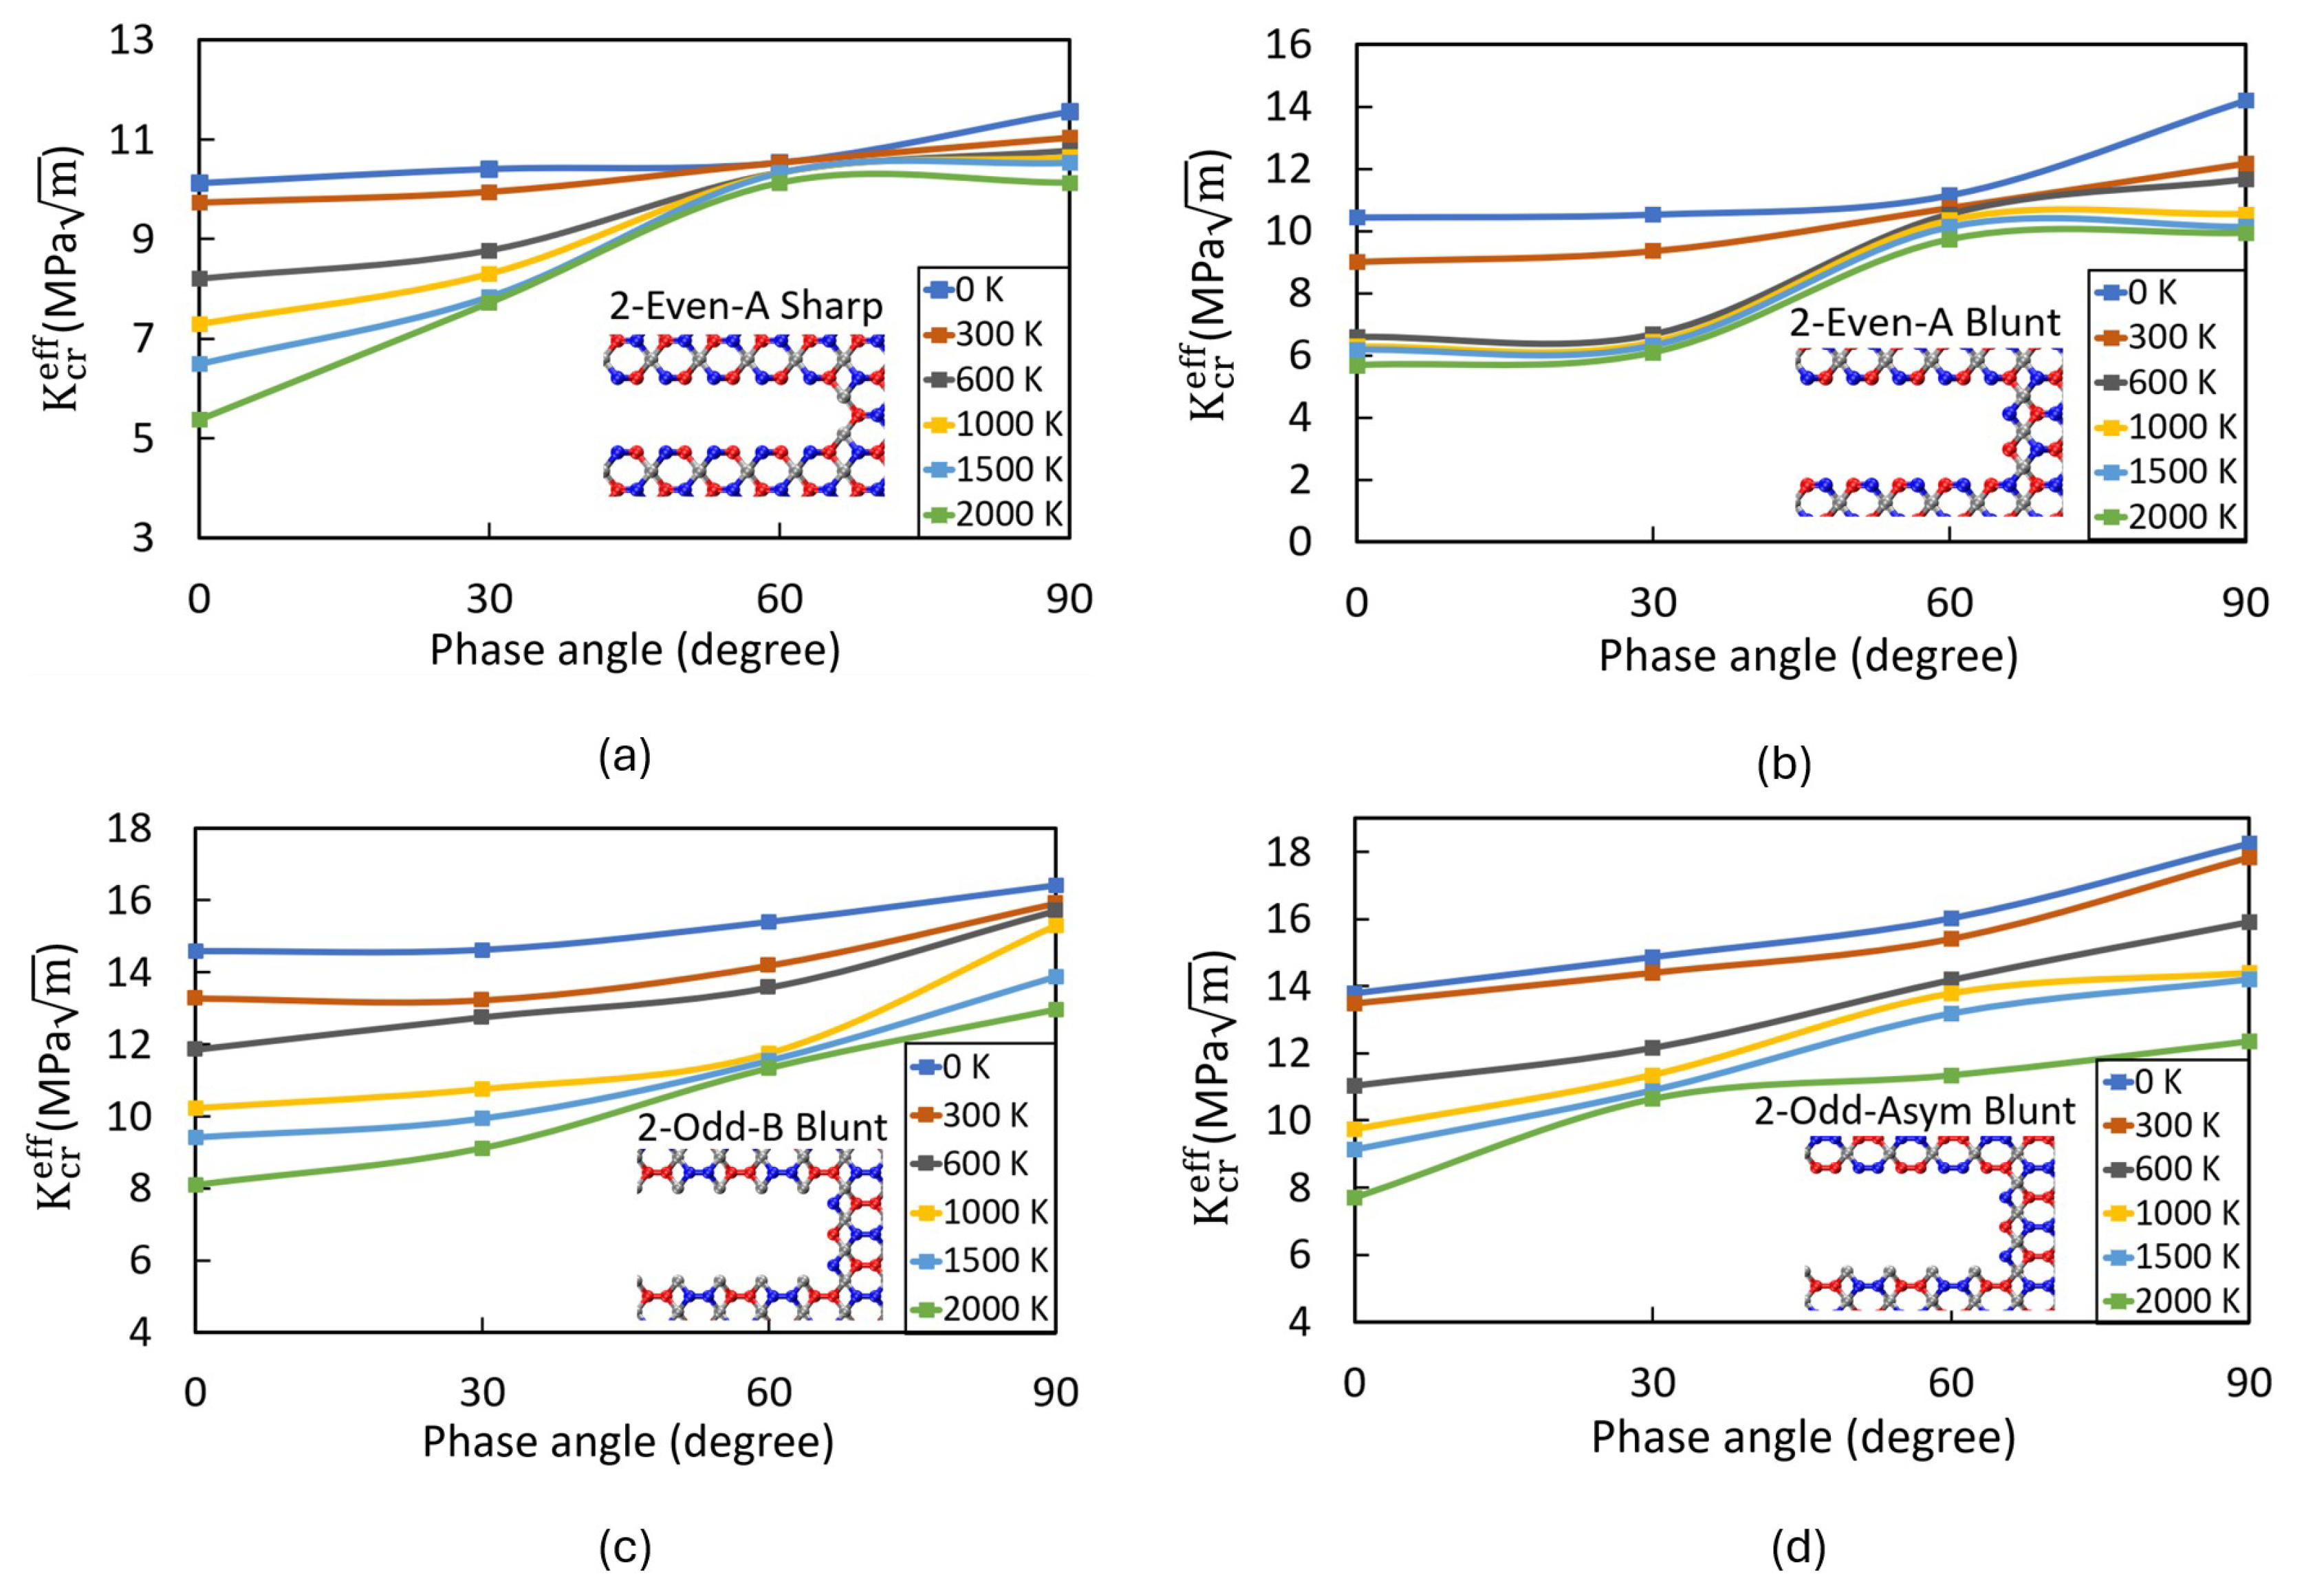
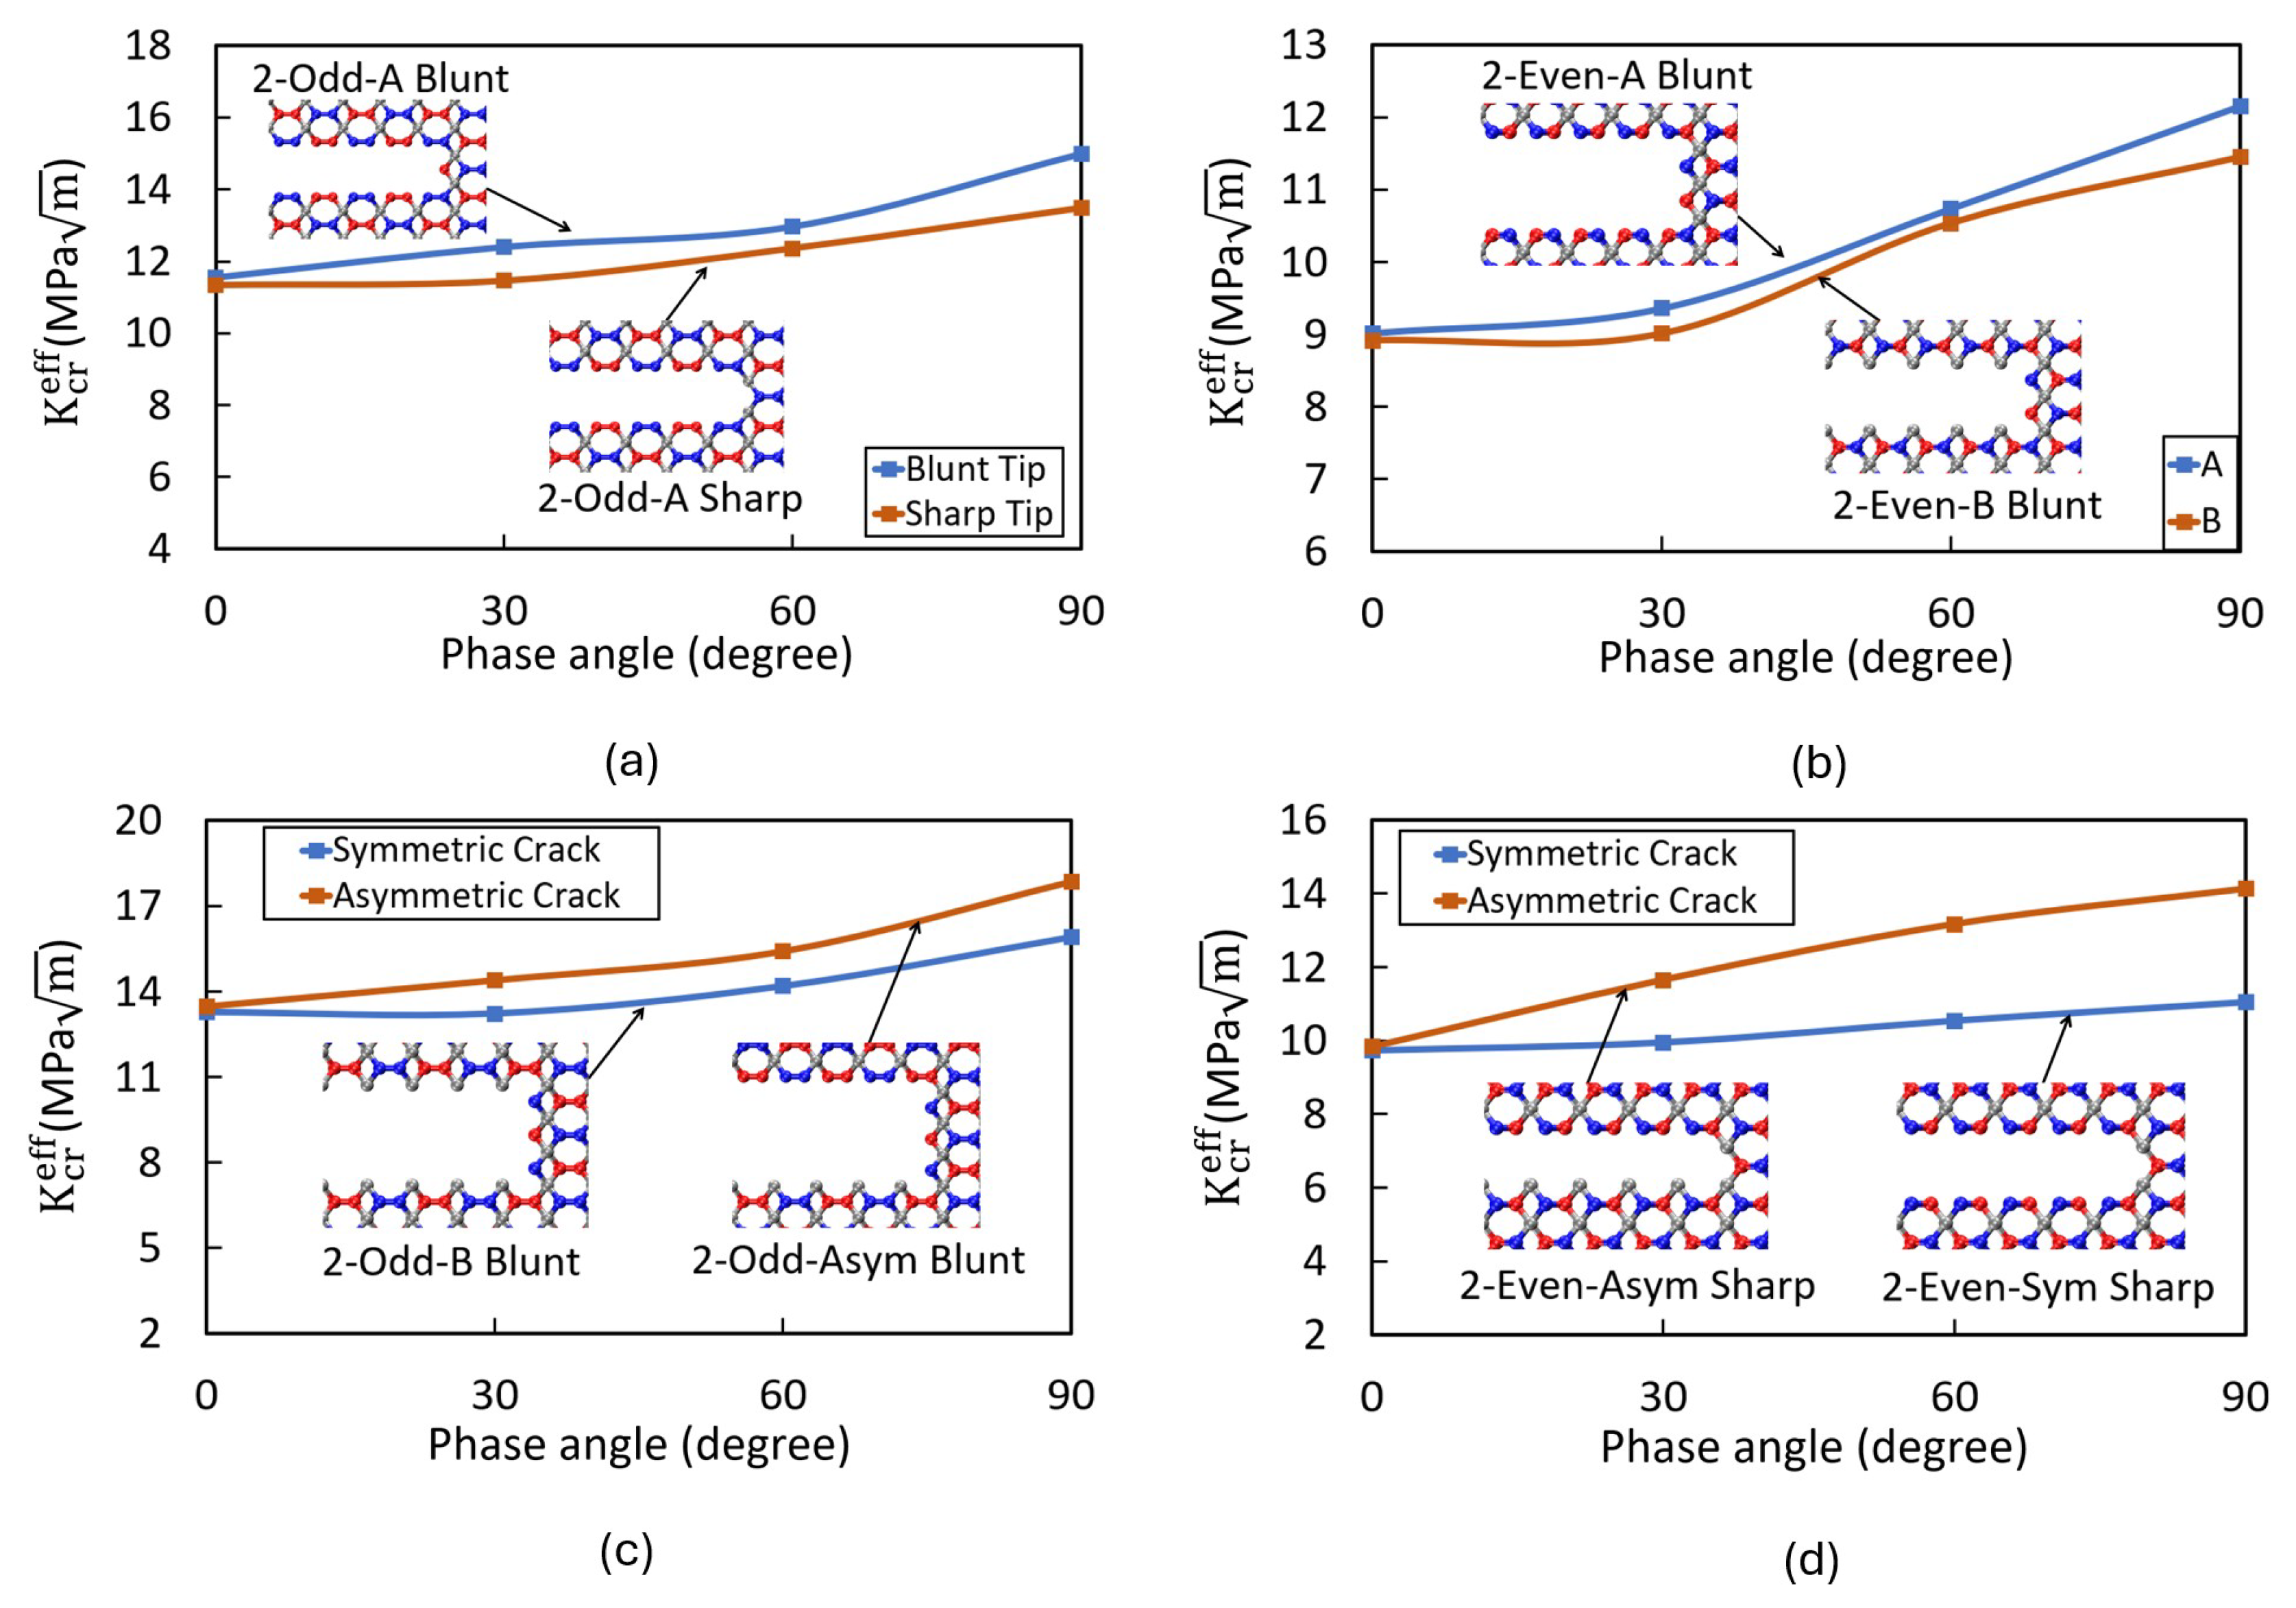
Impact of Crack Tip and Edge Structure on Critical SIF

The crack tip configuration effect on the critical SIFs is illustrated in Figure 14. The results indicate that variations in crack tip geometry have a minimal effect on the critical SIF of cracks in 2-odd structures. This suggests that the failure behavior in these structures is primarily governed by other factors, such as crack edge chirality and external loading conditions, rather than the specific shape of the crack tip.
In addition to the crack tip configuration, the impact of edge structure on the SIFs is examined in Figure 14. The results show that when the crack edges are symmetric—meaning both edges are either in configuration A or B—the critical SIF remains largely unaffected by the edge configuration. This suggests that in such cases, the stress distribution near the crack tip is more uniform, resulting in similar fracture resistance regardless of edge orientation.
However, as shown in Figure 14c,d, when the crack edges possess asymmetric chirality—where one edge has an A configuration and the other has a B configuration—the critical SIF increases compared to the symmetric case. This increase in fracture resistance can be attributed to the inherent differences in atomic bonding strength between the two edge configurations. In particular, the presence of mixed atomic structures at the crack edges leads to non-uniform stress distribution, which increases the resistance to crack propagation and enhances the material’s overall toughness. The impact of edge asymmetry increases as the phase angle increases. This is likely due to the additional shear stress components in mode II loading, which interact with the anisotropic atomic structure of the asymmetric crack edges, requiring greater energy for crack propagation. It is worth noting that this study focuses solely on the mechanical fracture behavior of tetragraphene. While the enhanced SIF in asymmetric edge configurations is attributed to variations in local bonding, we have not performed electronic structure analysis of edge types, which may further elucidate this behavior in future investigations.
Although direct experimental comparisons are not yet available for tetragraphene, insights from MD simulations of other two-dimensional materials offer useful context. For example, fracture studies on monolayer boron nitride (BN) and molybdenum disulfide (MoS2) have shown that, like TG, their critical SIF is higher under mode II loading than under mode I [43,44]. Buckling and out-of-plane deformation under mixed-mode loading have also been reported for these materials. MoS2 has reported critical SIF values in the range of 1 to 1.8 MPa m , and BN between 4.7 and 6.8 MPa m , both lower than the SIFs observed in TG, which range from 5.2 to 18 MPa m depending on crack configuration, phase angle, and temperature. These differences highlight TG’s superior fracture resistance and emphasize its potential advantages in applications requiring mechanical robustness and directional control of fracture behavior.

4. Conclusions

This study investigated the critical SIFs and crack propagation paths in tetragraphene (TG) with 2-even and 2-odd atomic configurations, considering the effects of loading phase angle, temperature, crack edge chirality, and crack tip geometry. The findings indicate that the critical SIF increases with loading phase angle. While cracks propagate straight under pure mode I loading, they exhibit kinking under mixed-mode conditions, accompanied by increasing out-of-plane deformation when the phase angle approaches mode II. This indicates that crack growth in mode II demands greater energy than mode I due to the additional energy dissipation through out-of-plane deformation.
Temperature was found to have a softening effect, with higher temperatures leading to reduced critical SIFs in both structures. Variations in crack tip geometry had minimal impact on the critical SIFs of 2-odd structures, suggesting that fracture behavior in these configurations is more influenced by crack chirality and loading conditions than by tip shape. When crack edges were symmetric, the critical SIF remained largely constant due to uniform stress distribution. In contrast, asymmetric edge chirality resulted in increased SIFs, attributed to differences in local bonding environments and stress asymmetry, thereby enhancing fracture resistance. Overall, the 2-odd structure exhibited superior fracture performance compared to the 2-even structure across all conditions studied.

Author Contributions

E.H. and A.T. collaborated on the conceptualization and methodology of this study. Both were involved in carrying out the simulations. E.H. was responsible for data curation. E.H. prepared the initial draft of the manuscript, with both E.H. and A.T. contributing to the subsequent review and editing process. All authors have read and agreed to the published version of the manuscript.

Funding

This research received no external funding.

Data Availability Statement

The raw data supporting the conclusions of this article will be made available by the authors on request.

Acknowledgments

We acknowledge the support of the University of North Carolina at Charlotte, particularly the High-Performance Computing (HPC) cluster, for providing the computational resources necessary for the simulations of this paper.

Conflicts of Interest

The authors declare no conflicts of interest.

References

  1. Pumera, M. Electrochemistry of graphene: New horizons for sensing and energy storage. Chem. Rec. 2009, 9, 211–223. [Google Scholar] [CrossRef] [PubMed]
  2. Elapolu, M.S.; Tabarraei, A.; Wang, X.; Spearot, D.E. Fracture mechanics of multi-layer molybdenum disulfide. Eng. Fract. Mech. 2019, 212, 1–12. [Google Scholar] [CrossRef]
  3. Leedahl, B.; Abooalizadeh, Z.; LeBlanc, K.; Moewes, A. Tunability of room-temperature ferromagnetism in spintronic semiconductors through nonmagnetic atoms. Phys. Rev. B 2017, 96, 045202. [Google Scholar] [CrossRef]
  4. Izadi, S.; Jabari, K.; Izadi, M.; Hamedani, K.H.; Ghaffari, A. Identification and Diagnosis of Dynamic and Static Misalignment in Induction Motor Using Unscented Kalman Filter. In Proceedings of the 2021 13th Iranian Conference on Electrical Engineering and Computer Science (ICEESC), Tehran, Iran, 18–20 May 2021; pp. 155–160. [Google Scholar]
  5. Partoens, B.; Peeters, F. From graphene to graphite: Electronic structure around the K point. Phys. Rev. B 2006, 74, 075404. [Google Scholar] [CrossRef]
  6. Geim, A.K.; Novoselov, K.S. The rise of graphene. Nat. Mater. 2007, 6, 183–191. [Google Scholar] [CrossRef]
  7. Wei, Q.; Yang, G.; Peng, X. Auxetic tetrahex carbon with ultrahigh strength and a direct band gap. Phys. Rev. Appl. 2020, 13, 034065. [Google Scholar] [CrossRef]
  8. Xu, M.; Tabarraei, A.; Paci, J.T.; Oswald, J.; Belytschko, T. A coupled quantum/continuum mechanics study of graphene fracture. Int. J. Fract. 2012, 173, 163–173. [Google Scholar] [CrossRef]
  9. Zhang, B.; Mei, L.; Xiao, H. Nanofracture in graphene under complex mechanical stresses. Appl. Phys. Lett. 2012, 101, 121915. [Google Scholar] [CrossRef]
  10. Elapolu, M.S.; Tabarraei, A. Mechanical and fracture properties of polycrystalline graphene with hydrogenated grain boundaries. J. Phys. Chem. C 2021, 125, 11147–11158. [Google Scholar] [CrossRef]
  11. Elapolu, M.S.; Tabarraei, A. Stress Corrosion Cracking of Graphene. In Proceedings of the ASME International Mechanical Engineering Congress and Exposition, Virtual, 16–19 November 2020; American Society of Mechanical Engineers: New York, NY, USA, 2020; Volume 84607, p. V012T12A030. [Google Scholar]
  12. Paci, J.T.; Xu, M.; Tabarraei, A.; Oswald, J.; Belytschko, T. Coupled quantum and continuum mechanics for the study of graphene fracture. In Abstracts of Papers of the American Chemical Society; American Chemical Society: Washington, DC, USA, 2012; Volume 244. [Google Scholar]
  13. Brandão, W.H.; Aguiar, A.L.; Fonseca, A.F.; Galvão, D.; De Sousa, J. Mechanical properties of tetragraphene single-layer: A molecular dynamics study. Mech. Mater. 2023, 176, 104503. [Google Scholar] [CrossRef]
  14. De Vasconcelos, F.M.; Souza Filho, A.G.; Meunier, V.; Girão, E.C. Electronic properties of tetragraphene nanoribbons. Phys. Rev. Mater. 2019, 3, 066002. [Google Scholar] [CrossRef]
  15. Kilic, M.E.; Lee, K.R. Tuning the electronic, mechanical, thermal, and optical properties of tetrahexcarbon via hydrogenation. Carbon 2020, 161, 71–82. [Google Scholar] [CrossRef]
  16. Esmaeili, A.; Kuhzadmohammadi, A.; Safarabadi, M. Notch stress intensity factor analysis for orthotropic media with a constrained range of anisotropic behavior. Theor. Appl. Fract. Mech. 2025, 136, 104835. [Google Scholar] [CrossRef]
  17. Esmaeili, A.; Kuhzadmohammadi, A.; Safarabadi, M. An Analytical Approach for the Near-Tip Field Around V-Notch in Orthotropic Materials. Fatigue Fract. Eng. Mater. Struct. 2025, 48, 487–501. [Google Scholar] [CrossRef]
  18. Behseresht, S.; Mehdizadeh, M. Stress intensity factor interaction between two semi-elliptical cracks in thin-walled cylinder. In Proceedings of the 28th Annual International Conference of Iranian Society of Mechanical Engineers—ISME 2020, Tehran, Iran, 27–29 May 2020; pp. 27–29. [Google Scholar]
  19. Rahmanidehkordi, A.; Ghasemi, A.H. Traffic Density Control for Heterogeneous Highway Systems with Input Constraints. IEEE Control Syst. Lett. 2024, 8, 2787–2792. [Google Scholar] [CrossRef]
  20. Nagashima, T.; Omoto, Y.; Tani, S. Stress intensity factor analysis of interface cracks using X-FEM. Int. J. Numer. Methods Eng. 2003, 56, 1151–1173. [Google Scholar] [CrossRef]
  21. Huang, R.; Wu, L.; He, Q.; Li, J. Stress intensity factor analysis and the stability of overhanging rock. Rock Mech. Rock Eng. 2017, 50, 2135–2142. [Google Scholar] [CrossRef]
  22. Garcia-Manrique, J.; Camas, D.; Lopez-Crespo, P.; Gonzalez-Herrera, A. Stress intensity factor analysis of through thickness effects. Int. J. Fatigue 2013, 46, 58–66. [Google Scholar] [CrossRef]
  23. Kilic, M.E.; Lee, K.R. First-principles study of fluorinated tetrahexcarbon: Stable configurations, thermal, mechanical, and electronic properties. J. Phys. Chem. C 2020, 124, 8225–8235. [Google Scholar] [CrossRef]
  24. de Vasconcelos, F.M.; Souza Filho, A.G.; Meunier, V.; Girão, E.C. Electronic and structural properties of tetragraphenes. Carbon 2020, 167, 403–413. [Google Scholar] [CrossRef]
  25. Kilic, M.E.; Lee, K.R. Tetrahex carbides: Two-dimensional group-IV materials for nanoelectronics and photocatalytic water splitting. Carbon 2021, 174, 368–381. [Google Scholar] [CrossRef]
  26. Rad, M.T.; Foroutan, M. Wettability of Tetrahexcarbon: MD, DFT, and AIMD Approaches. Langmuir 2023, 39, 8279–8296. [Google Scholar] [CrossRef] [PubMed]
  27. Peng, X.; Wei, Q.; Yang, G. Enhanced carrier mobility in anisotropic two-dimensional tetrahex-carbon through strain engineering. Carbon 2020, 165, 37–44. [Google Scholar] [CrossRef]
  28. Ram, B.; Mizuseki, H. Tetrahexcarbon: A two-dimensional allotrope of carbon. Carbon 2018, 137, 266–273. [Google Scholar] [CrossRef]
  29. Ordejón, P.; Artacho, E.; Soler, J.M. Self-consistent order-N density-functional calculations for very large systems. Phys. Rev. B 1996, 53, R10441. [Google Scholar] [CrossRef]
  30. Soler, J.M.; Artacho, E.; Gale, J.D.; García, A.; Junquera, J.; Ordejón, P.; Sánchez-Portal, D. The SIESTA method for ab initio order-N materials simulation. J. Phys. Condens. Matter 2002, 14, 2745. [Google Scholar] [CrossRef]
  31. Perdew, J.P.; Burke, K.; Ernzerhof, M. Generalized gradient approximation made simple. Phys. Rev. Lett. 1996, 77, 3865. [Google Scholar] [CrossRef]
  32. Troullier, N.; Martins, J.L. Efficient pseudopotentials for plane-wave calculations. Phys. Rev. B 1991, 43, 1993. [Google Scholar] [CrossRef]
  33. Kleinman, L.; Bylander, D. Efficacious form for model pseudopotentials. Phys. Rev. Lett. 1982, 48, 1425. [Google Scholar] [CrossRef]
  34. Plimpton, S. Fast parallel algorithms for short-range molecular dynamics. J. Comput. Phys. 1995, 117, 1–19. [Google Scholar] [CrossRef]
  35. Erhart, P.; Albe, K. Analytical potential for atomistic simulations of silicon, carbon, and silicon carbide. Phys. Rev. B 2005, 71, 035211. [Google Scholar] [CrossRef]
  36. Lai, S.; Setiyawati, I.; Yen, T.; Tang, Y. Studying lowest energy structures of carbon clusters by bond-order empirical potentials. Theor. Chem. Acc. 2017, 136, 20. [Google Scholar] [CrossRef]
  37. Ajori, S.; Eftekharfar, A. Mechanical properties and fracture analysis of defective penta-graphene under temperature variation: Insight from molecular dynamics. Diam. Relat. Mater. 2022, 124, 108956. [Google Scholar] [CrossRef]
  38. Winczewski, S.; Rybicki, J. Anisotropic mechanical behavior and auxeticity of penta-graphene: Molecular statics/molecular dynamics studies. Carbon 2019, 146, 572–587. [Google Scholar] [CrossRef]
  39. Tu, W.; Wang, K.; Qin, L.; Sun, Z.; Chen, J. Intrinsic mechanical properties and fracture mechanism of monolayer penta-graphene investigated by nanoindentation: A molecular dynamics study. Comput. Mater. Sci. 2019, 169, 109145. [Google Scholar] [CrossRef]
  40. Anderson, T.L. Fracture Mechanics: Fundamentals and Applications; CRC Press: Boca Raton, FL, USA, 2017. [Google Scholar]
  41. Brighenti, R. Buckling of cracked thin-plates under tension or compression. Thin-Walled Struct. 2005, 43, 209–224. [Google Scholar] [CrossRef]
  42. Yan, J.H.; Sutton, M.A.; Deng, X.; Cheng, C.S. Mixed-mode fracture of ductile thin-sheet materials under combined in-plane and out-of-plane loading. Int. J. Fract. 2007, 144, 297–321. [Google Scholar] [CrossRef]
  43. Wang, X.; Tabarraei, A.; Spearot, D.E. Fracture mechanics of monolayer molybdenum disulfide. Nanotechnology 2015, 26, 175703. [Google Scholar] [CrossRef]
  44. Tabarraei, A.; Wang, X. A molecular dynamics study of nanofracture in monolayer boron nitride. Mater. Sci. Eng. A 2015, 641, 225–230. [Google Scholar] [CrossRef]
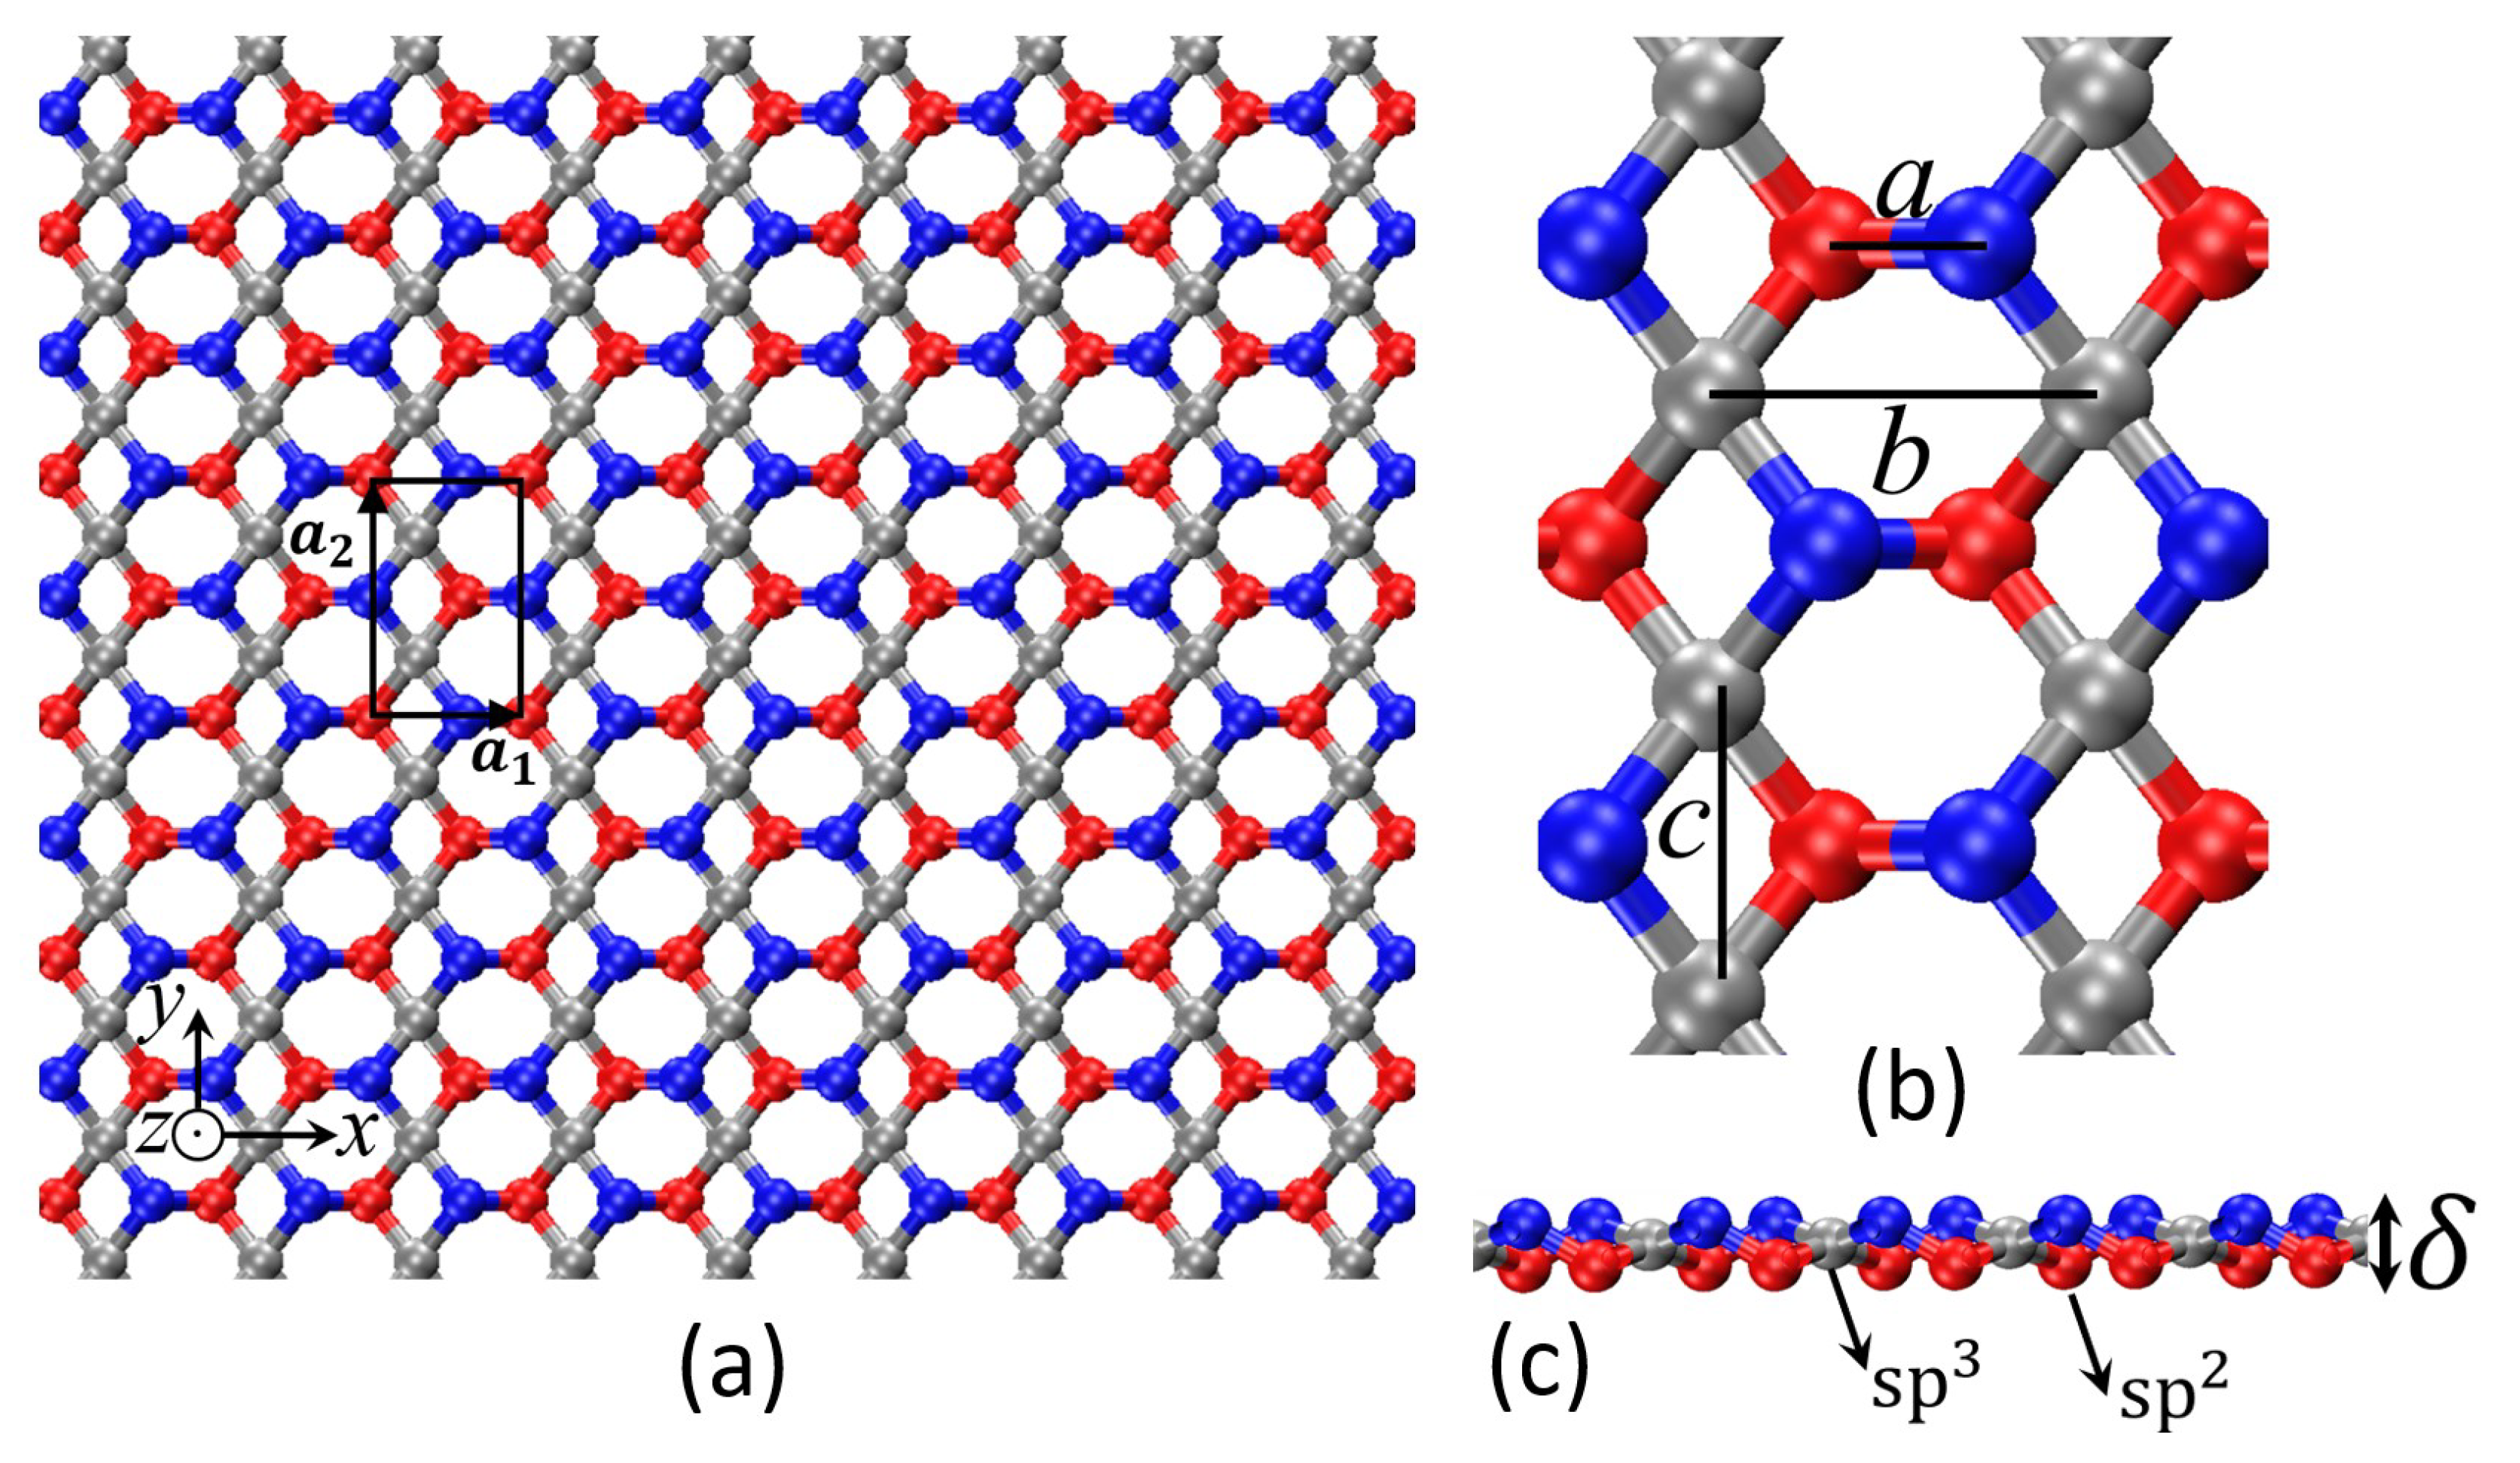
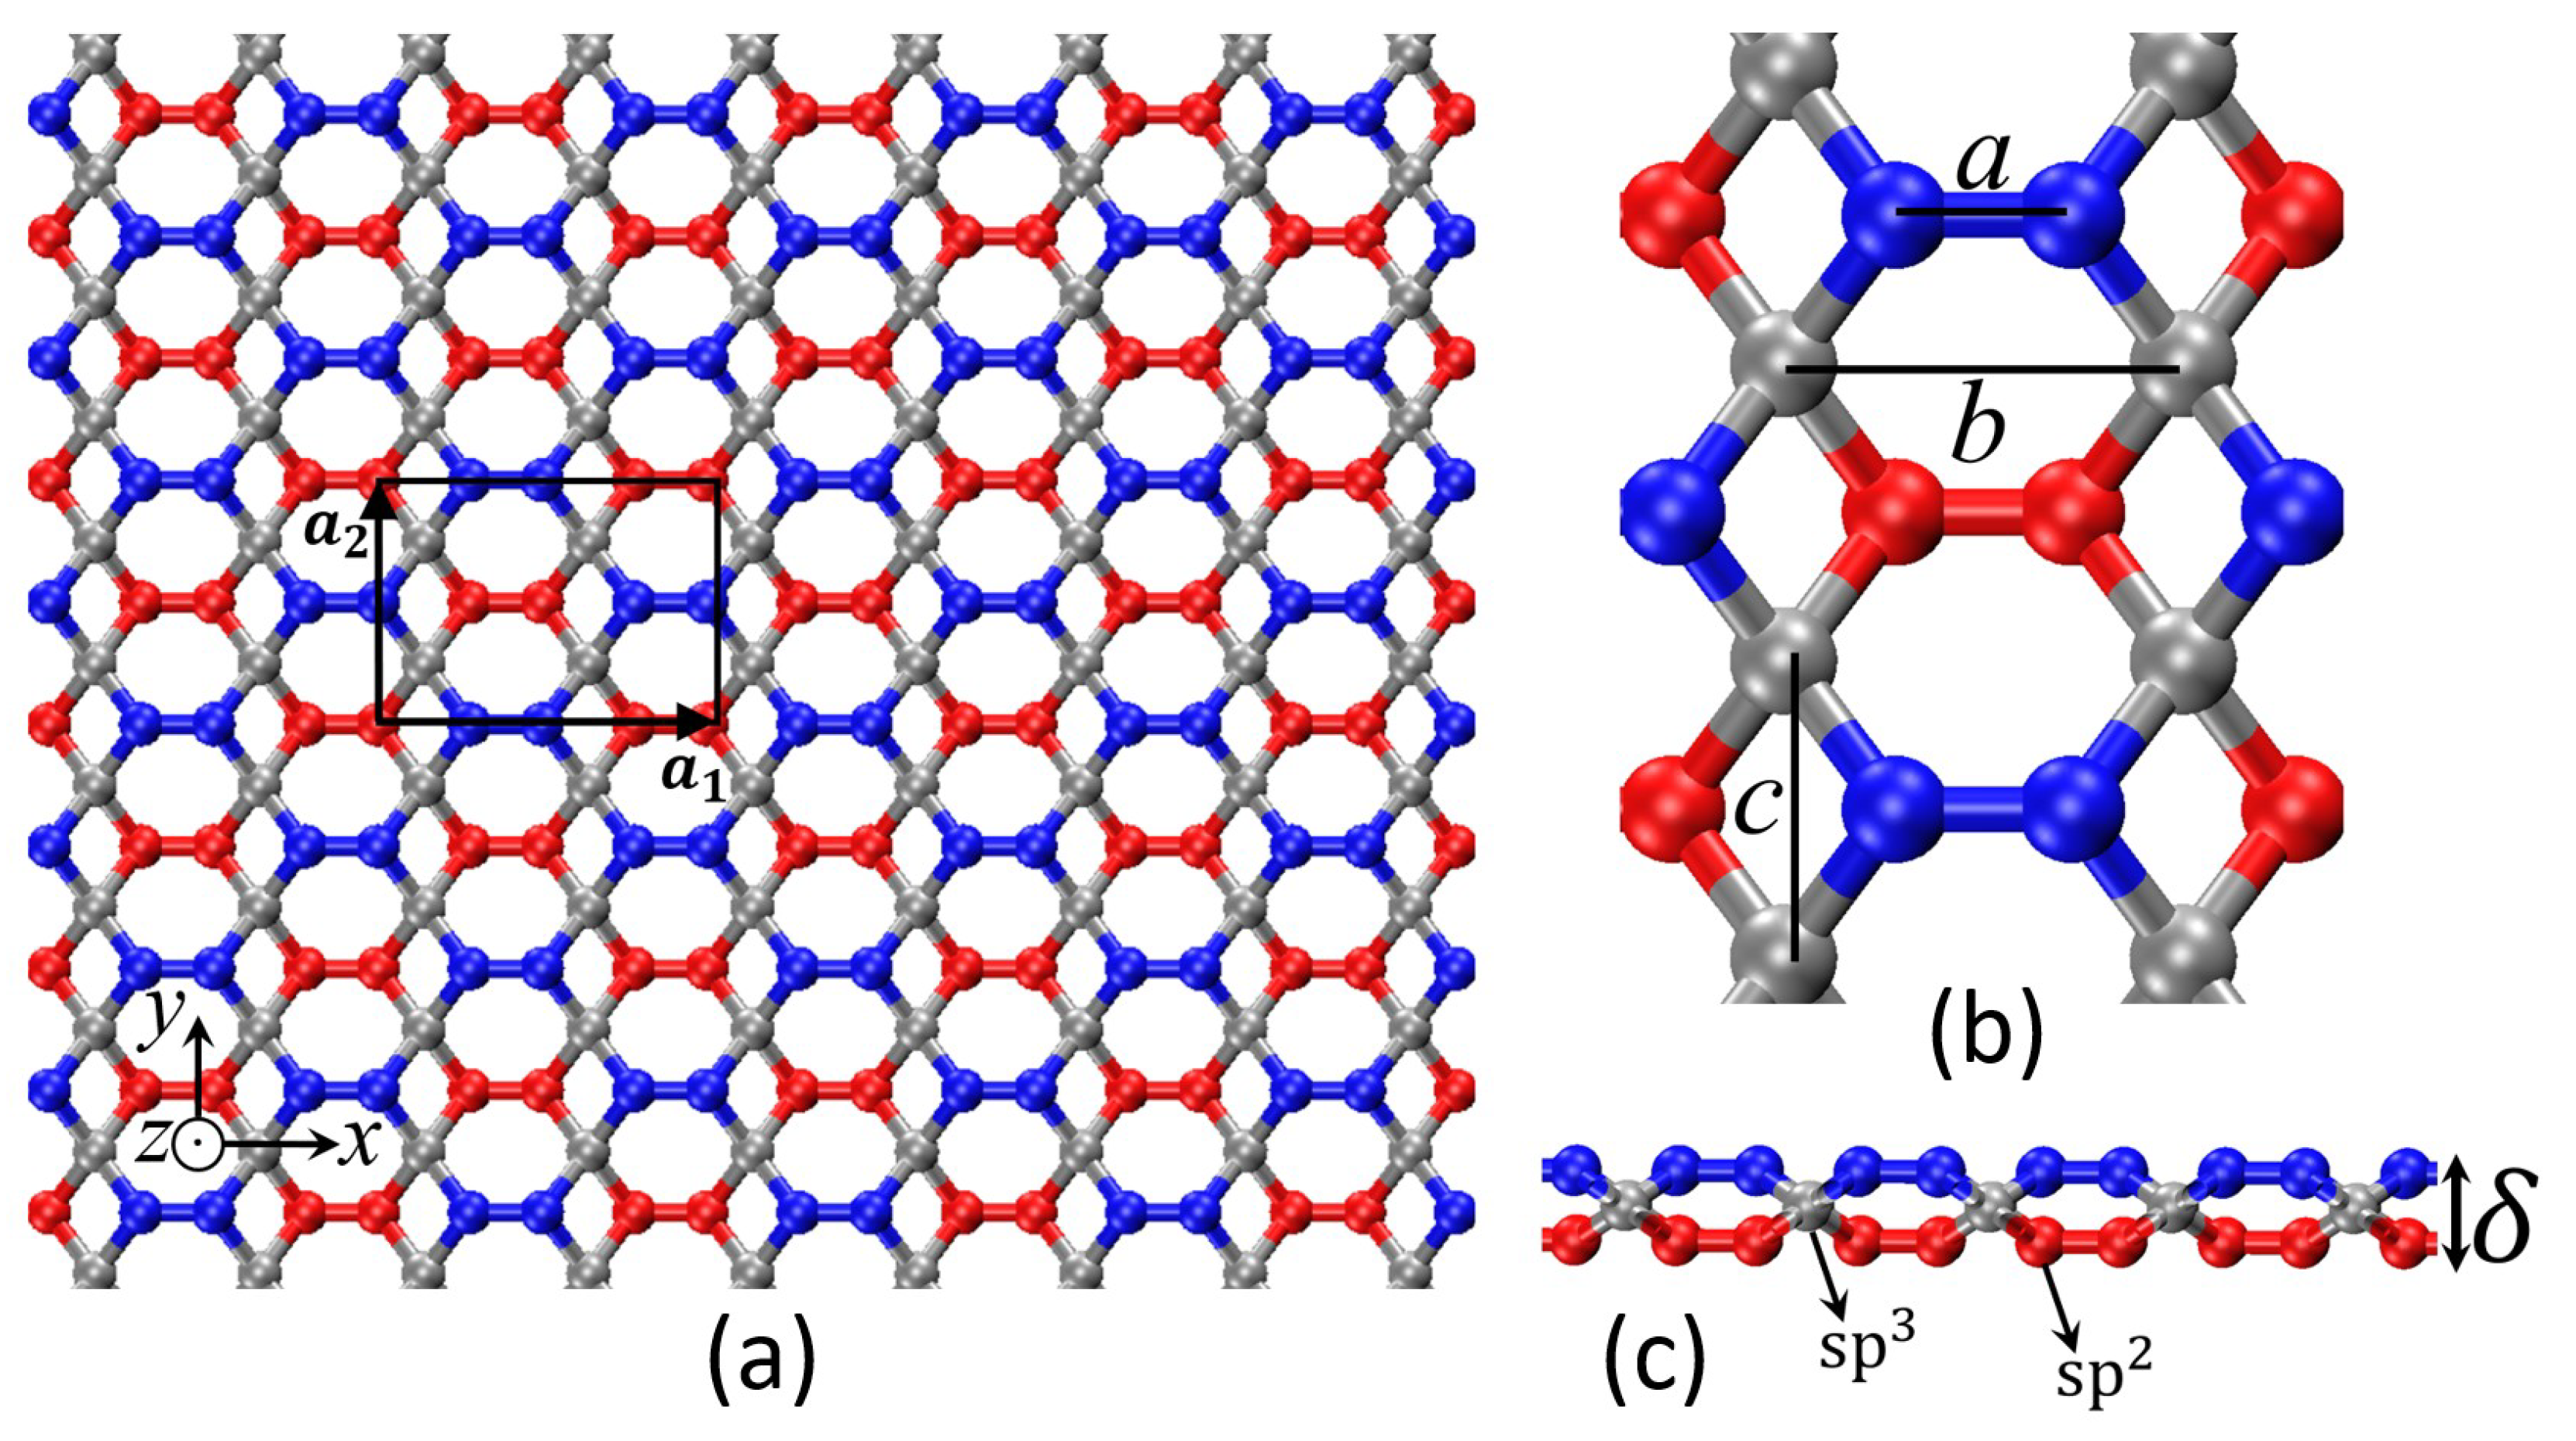
Figure 1. The 2-even tetragraphene structure is depicted in (a) with (b) top and (c) side views. The parameters δ , a, b, and c represent the thickness of the tetragraphene, the distance between two tri-coordinated atoms, the distance between two tetra-coordinated atoms, and the diagonal length of the tetragonal rings, respectively. In the visualization, tri-coordinated atoms in the upper layer are colored blue, those in the lower layer are red, and tetra-coordinated atoms in the central layer are shown in gray.
Carbon 11 00040 g001
Figure 2. The 2-odd tetragraphene structure is shown in (a), with (b) top and (c) side views. The parameters δ , a, b and c correspond to the thickness of the tetragraphene, the distance between two tri-coordinated atoms, the distance between two tetra-coordinated atoms, and the diagonal length of the tetragonal rings, respectively. In the illustration, tri-coordinated atoms in the upper layer are colored blue, those in the lower layer are red, and tetra-coordinated atoms in the central layer are shown in gray.
Carbon 11 00040 g002
Figure 3. Stress–strain curves of (a) 2-even, and (b) 2-odd bulk tetragraphene sheet.
Carbon 11 00040 g003
Figure 4. Poisson’s ratio of (a) 2-even and (b) 2-odd bulk tetragraphene sheet.
Carbon 11 00040 g004
Figure 5. The molecular dynamic model used for studying fracture properties of tetragraphene. The boundary conditions are applied to the red atoms.
Carbon 11 00040 g005
Figure 6. Illustration of the four crack types in the 2-even structure: (a) Sharp crack tip in Configuration A. (b) Blunt crack tip in Configuration A. (c) Blunt crack tip in Configuration B. (d) Asymmetric sharp crack tip.
Carbon 11 00040 g006
Figure 7. Illustration of the four crack types in the 2-odd structure: (a) Sharp crack tip in Configuration A. (b) Blunt crack tip in Configuration A. (c) Blunt crack tip in Configuration B. (d) Asymmetric blunt crack tip.
Carbon 11 00040 g007
Figure 8. Crack propagation paths (highlighted in red) in a 2-even sheet with a blunt crack tip (2-even-A blunt). (a) Phase angle of 0°. (b) Phase angle of 90°.
Carbon 11 00040 g008
Figure 9. Crack propagation paths (highlighted in red) in a 2-odd sheet with a blunt crack (2-odd-B blunt). (a) Phase angle of 0°. (b) Phase angle of 90°.
Carbon 11 00040 g009
Figure 10. Crack propagation paths comparison (highlighted in red) for a different loading phase angle at T = 300 K in a 2-even sheet with a sharp crack tip (2-even-A sharp).
Carbon 11 00040 g010
Figure 11. Buckling behavior as a function of loading phase angle: (a) ϕ = 0 , (b) ϕ = 30 , (c) ϕ = 60 , and (d) ϕ = 90 . Colored regions indicate out-of-plane deformation due to buckling.
Carbon 11 00040 g011
Figure 12. Stress contour under mode I loading in 2-even structure: (a) Initial crack, (b) Early crack opening and stress concentration at the crack tip, (c) Crack propagation with increased stress intensity, and (d) Further crack growth showing extended damage zone along the crack path. Color scale indicates stress magnitude (blue: low, red: high).
Carbon 11 00040 g012
Figure 13. Temperature effect on critical SIF: (a) 2-even-A sharp; (b) 2-even-A blunt; (c) 2-odd-B blunt; (d) 2-odd-Asymmetric blunt.
Carbon 11 00040 g013
Figure 14. Crack structure effect on critical SIF at 300 K. (a) Crack tip configuration effect. (b) Crack edge chirality effect. (c,d) Crack symmetry/asymmetry effect.
Carbon 11 00040 g014
Table 1. Structural parameters of tetragraphene.
Structural Parameters (Å)abc δ
2-even1.413.062.370.72
2-odd1.353.062.271.18
Table 2. Unit cell dimensions of tetragraphene.
Unit Cell Dimensions (Å) a x a y
2-even3.0574.734
2-odd6.1104.535
Disclaimer/Publisher’s Note: The statements, opinions and data contained in all publications are solely those of the individual author(s) and contributor(s) and not of MDPI and/or the editor(s). MDPI and/or the editor(s) disclaim responsibility for any injury to people or property resulting from any ideas, methods, instructions or products referred to in the content.

