Article

Degradation Kinetics, Mechanisms, and Antioxidant Activity of PCL-Based Scaffolds with In Situ Grown Nanohydroxyapatite on Graphene Oxide Nanoscrolls

by
Lillian Tsitsi Mambiri
and
Dilip Depan
*
Chemical Engineering Department, Institute for Materials Research and Innovation, University of Louisiana at Lafayette, P.O. Box 44130, Lafayette, LA 70504-4130, USA
*
Author to whom correspondence should be addressed.
Submission received: 28 October 2024 / Revised: 16 December 2024 / Accepted: 30 December 2024 / Published: 3 January 2025

Abstract

:
Polycaprolactone (PCL) degradation is critical in bone tissue engineering, where scaffold degradation must align with tissue regeneration to ensure stability and integration. This study explores the effects of nanofillers, hydroxyapatite (nHA), and graphene oxide nanoscrolls (GONS) on PCL-based scaffold degradation kinetics. Both PHAP (nHA-PCL) and PGAP (nHA-GONS-PCL) scaffolds exhibited changes to relaxation-driven degradation, as indicated by adherence to the Korsmeyer–Peppas model (R2 = 1.00). PHAP scaffolds showed lower activation energies (5.02–5.54 kJ/mol), promoting faster chain relaxation and degradation in amorphous regions. PGAP scaffolds, with higher activation energies (12.88–12.90 kJ/mol), displayed greater resistance to chain relaxation and slower degradation. Differential scanning calorimetry (DSC) revealed that both nanofillers disrupted the crystalline regions, shifting degradation behavior from diffusion-based to relaxation-driven mechanisms in the amorphous zones, which was also reflected by changes in crystallization temperature (Tc) and melting temperature (Tm). Additionally, PGAP scaffolds demonstrated antioxidant potential, which decreased over time as degradation progressed. These results provide a mechanistic understanding of how nanofiller-modulated degradation dynamics can be strategically leveraged to optimize scaffold performance, facilitating precise control over degradation rates and bioactivity.

Graphical Abstract

1. Introduction

Despite the seemingly mild conditions of the human body (37 °C, neutral pH, low salt concentration), significant challenges still arise for implants due to the dynamic nature of the physiological environment [1]. One of the primary challenges is managing the degradation of polymer-based scaffolds as they have to be designed to align their degradation kinetics with the rate of tissue regeneration [2]. This alignment is vital for the scaffold’s mechanical stability, successful vascularization, and tissue integration at the implant site. Suboptimal degradation rates can adversely affect the mechanical properties of the regenerating bone, particularly in load-bearing applications like spinal fusion implants, potentially leading to regeneration failure [1,3]. On the other hand, if the scaffold degrades too slowly, it can hinder the integration of new tissue or provoke chronic inflammatory responses [4].
PCL, a widely used aliphatic polyester, is known for its excellent mechanical properties, biocompatibility, and biodegradability, making it a promising scaffold material in tissue engineering. Although the addition of nanofillers to PCL has been explored in previous studies, these investigations often overlook the influence of improved interfacial bonding between PCL and nanofillers on degradation. Polyesters degrade mainly through hydrolysis of their ester bonds, a process influenced by factors like chemical structure, copolymer composition, and surface wettability [5]. Hydrolysis starts in the amorphous regions, where water molecules can easily access the polymer chains, while the more crystalline regions degrade more slowly, leading to a two-phase process [5]. In vitro, PCL often shows zero-order degradation, where surface erosion leads to a steady material loss [6]. However, in vivo, PCL typically follows first-order kinetics, with random chain scission throughout the bulk, resulting in faster molecular weight loss [6]. While hydrolysis is a second-order reaction, the overall degradation rate is not solely limited by molecular weight but also by the polymer’s crystallinity, thereby leading to varying models [6].
The degradation mechanisms of PCL vary significantly depending on experimental conditions, with conflicting studies suggesting that polymer composition and chain properties influence degradation behavior [7]. The addition of bioactive nanofillers, such as nanohydroxyapatite (nHA), introduces further complexity, as their diverse physicochemical properties also contribute to the degradation pathway. In addition to the complexity brought on by varying polymer properties, degradation is also dependent on many variables such as local filler concentration, dispersion, and interfacial interactions, and certain ceramics may catalyze hydrolytic degradation, further complicating the predictability of the degradation process [8]. When composited with polymers, nanofillers introduce intricacies such as changes in surface area and crystallinity, affecting degradation routes and mechanisms [8,9]. These factors make it difficult to accurately model or predict degradation in nanofiller-incorporated scaffolds, highlighting the need for further research.
During the breakdown of PCL and other degradable polymers, the production of small molecular weight byproducts may stimulate immune responses, leading to the generation of reactive oxygen species (ROS) [10]. These byproducts may stimulate immune responses, leading to the generation of reactive oxygen species (ROS). An overproduction of ROS can overwhelm local antioxidant defenses, ultimately resulting in oxidative stress [11,12]. Oxidative stress occurs when ROS surpass antioxidant defenses; biomaterials can promote this imbalance through degradation byproducts [13]. Consequently, oxidative stress plays a critical role in inhibiting the tissue response, potentially leading to prolonged inflammation, fibrosis, or even implant rejection [12,14].
To manage both degradation and oxidative stress, incorporating antioxidants like vitamin C, vitamin E, curcumin, and Trolox into scaffolds is a promising strategy, as they are released during degradation to counter oxidative damage [12,13]. Carbon-based nanofillers like graphene oxide nanoscrolls (GONS) provide additional benefits, such as scavenging ROS and modulating degradation kinetics, helping reduce oxidative stress while reinforcing the scaffold [15]. However, the impact of GONS on the degradation kinetics of PCL-based scaffolds remains underexplored. GONS, in combination with nHA, could influence hydrolytic degradation pathways while maintaining structural integrity [5]. The synergy between GONS’ antioxidant behavior and their reinforcement of mechanical properties offers a promising avenue for designing scaffolds that resist oxidative damage and provide controlled degradation rates.
In our previous study, we found that (in situ grown nHA on GONS) nHA-GONS’ composites retained more calcium ions than nHA alone during enzymatic degradation [16]. However, ion retention is only one aspect of scaffold functionality, as ester bond cleavage during enzymatic hydrolysis can compromise structural integrity and mechanical performance. This study investigates how nHA-GONS modulate the degradation kinetics of PCL scaffolds, focusing on ester hydrolysis and mass loss. It will also explore the interaction between degradation and GONS’ antioxidant potential, aiming to balance scaffold degradation and performance in an oxidative environment.

2. Materials and Methods

Graphene oxide (GO) aqueous dispersion (5 mg/mL) was obtained from Goographene, Merrifield, VA, USA. Methanol was acquired from Carolina Biological Supply Company, Burlington, NC, USA. PCL (average Mn 80,000), calcium nitrate tetrahydrate (Ca (NO3)2•4H2O), lysozyme, dichloromethane (DCM), and diammonium phosphate((NH4)2HPO4) were purchased from Sigma-Aldrich, Milwaukee, WI, USA. Ammonium hydroxide (NH4OH) was purchased from EMD Millipore Corporation, Burlington, MA, USA. Phosphate buffer saline (PBS) was purchased from Fisher Scientific, Manassas, VA, USA. The DPPH Antioxidant Assay Kit (2,2-diphenyl-1-picrylhydrazyl) was purchased from Dojindo Molecular Technologies, Inc., Kumamoto, Japan.

2.1. Scaffold Preparation and Enzymatic Degradation

As described previously, GONS were prepared via low-frequency ultrasonication, while nHA and nHA-GONS were prepared via wet precipitation [16]. PCL composite film scaffolds were prepared by dissolving PCL pellets in DCM, followed by solvent evaporation, and subsequently hot pressing the resulting films with 5, 10, and 20 wt.% of nHA-GONS and nHA. The naming scheme for these films was PPCL for pure PCL; PGAP5, PGAP10, and PGAP20 for nHA-GONS-PCL; and PHAP5, PHAP10, and PHAP20 for nHA-PCL, with the numbers corresponding to the nanofiller content percentages.
Enzymatic degradation of the scaffolds was studied using a lysozyme degradation test [16]. The initial dry weight of the samples (Wi) was recorded, followed by incubating in the degradation media for hydrolysis (0.1 M PBS containing 500 µg ml−1 of lysozyme at 37 °C) in an incubator for 7, 14, 28, and 35 days [16]. The membrane was removed from the degradation media, washed with distilled water, and weighed, while the extent of degradation was quantified as the change in sample weight over time. The percentage of weight loss was given by Equation (1):
W i W f W i × 100 = W l o s s %
Wi = initial weight.
Wloss = weight loss.
Wf = final weight.
The mass loss data of scaffolds containing nanofillers subjected to degradation were analyzed and fitted using various kinetic models such as zero-order, first-order, Higuchi, Korsmeyer–Peppas, and the contracting volume model to determine the most appropriate fit [17]. This approach is crucial, as each model captures distinct and common degradation mechanisms, such as constant release, concentration-dependent behavior, diffusion-driven processes, or surface erosion for scaffold degradation and release kinetics [17].

2.1.1. Zero-Order Kinetics

The zero-order rate equation describes a system where the degradation rate is independent of its concentration.
α = k     t
α = fractional mass loss.
k1 = zero-order rate constant.
t = time of immersion.

2.1.2. First-Order Kinetics

The first-order equation describes a system where the rate depends on concentration.
l n ( M t ) = k   t
Mt = mass at time t.
k2 = first-order rate constant.

2.1.3. Higuchi Model

The Higuchi model describes a square root of a time-dependent process based on Fickian diffusion. It is also known as the pseudo-zero-order rate.
α = k     t 1 2
α = fractional mass loss.
t = time of immersion.
k3 = constant reflecting the design variables of the system.

2.1.4. Korsmeyer–Peppas Model

The Korsmeyer–Peppas model generalizes transport mechanisms. The following formula represents it:
α = k     t n
k4 = rate constant.
t = time of immersion.
α = fractional mass loss.
n = degradation exponent representing the contributions of diffusion mechanisms.

2.1.5. Contracting Volume Model

The contracting volume model suggests that chemical reactions at interfaces may control the dissolution rate.
( 1 1 α ) 1 3 = k 5   t
k5 = rate constant.
t = time of immersion.
α = fractional mass loss.
The best model was chosen based on the fitness of the calculated curves to the data and was obtained using MATLAB R2022a.

2.2. Thermal Properties

The thermal behavior of the PCL composite films was tested using Perkin Elmer 4000 differential scanning calorimetry (Shelton, CT, USA, with samples with a weight between 5 and 10 mg, as described in our previous study. A first heating scan at 10 °C/min from 0 °C to 220 °C enabled the sample structure to be characterized after degradation. After annealing at 220 °C for 3 min and cooling at 10 °C/min to 0 °C, a second heating scan at 10 °C/min was recorded to analyze the behavior after erasing the thermal history.

2.3. Hydrolysis of Ester Groups

FTIR spectroscopy was employed as a quantitative tool for measuring hydrolysis. The ester index is a crucial parameter for evaluating the stability and degradation of polymers, particularly those containing ester bonds. It measures the ratio of absorbance linked to ester bonds, essentially indicating how many ester bonds remain intact over time. A faster decrease in the ester index signals a more rapid hydrolysis process, where the ester bonds break down due to the chemical reaction with water or enzymes. The hydrolysis kinetics were assessed by tracking changes over time in the ratio between the FTIR absorbances. The ratio (A1725/A1162) was determined by comparing the absorbance at 1725 cm−1, representing C=O ester stretching vibrations (A1725), with the absorbance at 1162 cm−1, representing C—C stretching vibrations, which was chosen as a reference due to its relatively constant intensity. A LUMOS II Bruker Fourier transform infrared radiation (FTIR) microscope (Billerica, MA, USA) was used to analyze changes in the ester groups in PCL. Samples were evaluated using the reflectance sampling technique. Each point was scanned 16 times with a resolution of 8 cm−1. The degradation kinetics of the scaffolds were evaluated by tracking temporal changes in specific absorbance intensity ratios.

2.4. Antioxidant Potential

The antioxidant potential of the PGAP samples was tested through radical scavenging activity using a DPPH (2,2-diphenyl-1-picrylhydrazyl) assay [18]. An amount of 0.8 mL of 95% ethanol was mixed with 0.2 mL of ethanolic DPPH solution and was used as the control group. Then, PGAP samples (weighing 2.00 ± 0.01 mg) were dissolved in 10 mL of ethanol to make the sample solution. The mixture was thoroughly shaken at room temperature. Afterward, the samples were placed in a dark room for 30 min and the absorbance at 517 nm was measured using a Fisher Unico 1000 spectrophotometer (Dayton, NJ, USA). The absorbance at 517 nm was measured and the free radical scavenging activity was calculated according to Equation (7).
1 A s a m p l e A c o n t r o l × 100 % = R a d i c a l   s c a v e n g i n g   a c t i v i t y   ( R S A )   ( % )
Asample = absorbance of the sample.
Acontrol = absorbance of the control.

3. Results and Discussion

3.1. Enzymatic Degradation

As reported in our previous study, the pure PPCL scaffold exhibited a consistent degradation pattern, with weight loss increasing from 2.5% at 14 days to 11% at 35 days (Figure 1) [16]. In contrast, the PHAP scaffolds showed varying degradation rates depending on the concentration of hydroxyapatite.
The PHAP20 exhibited an accelerated mass loss by day 35, despite having a slower initial rate. The PGAP scaffolds degraded more gradually, although the PGAP20 samples also experienced substantial degradation by the end of the 35-day study. Higher concentrations of fillers delayed the onset of degradation. However, by the third week, these scaffolds exhibited greater material loss compared with the second week. Initially, the nanofillers slowed the degradation process. Over time, as the scaffold broke down, the environment became acidic, accelerating degradation and diminishing the protective role of the fillers. The enzymatic degradation of PCL is predominantly driven by hydrolysis, where water molecules cleave the ester bonds in the PCL chains, which results in the production of carboxylic acids and alcohols. This mechanism proceeds in two key processes: (1) surface erosion onset by relatively slower diffusion compared with the rate of hydrolytic cleavage, and (2) bulk degradation, where water penetrates the entire polymer and causes uniform chain breakage throughout the PCL matrix [2].
The degradation products can diffuse out of the polymer, resulting in even degradation. However, if they remain trapped, carboxylic acids accumulate, causing autocatalysis and accelerating degradation, especially in the polymer core [2]. These acids lower the local pH, enhancing hydrolysis of nearby ester bonds by reducing the activation energy required for the reaction [6]. Furthermore, an increase in the pH of the degradation medium results in an increasing electrophilicity of the carbonyl carbon in the ester bond, making it more susceptible to nucleophilic attack by water molecules. As more ester bonds are hydrolyzed, more carboxylic acids are formed, which in turn catalyzes additional hydrolysis reactions, creating a positive feedback loop where the mass loss % increases over time [6]. Therefore, the mass loss from day 14 was less than the mass loss from day 21 in all composites.
In order to determine how degradation would proceed for the composites, various kinetic models were fitted to the degradation data using MATLAB R2022a. The fit of each model was determined using coefficients of determination obtained from the plotted linearized degradation models (Table 1). For PPCL, both the zero-order and Korsmeyer–Peppas models demonstrated a good fit (R2 closer to 1.00), indicating that PPCL either follows a combination of steady surface-based erosion (zero-order) or polymer chain relaxation (Korsmeyer–Peppas). However, the validity of the zero-order degradation was confirmed by the Korsmeyer–Peppas model, which had an n value of 1.38, indicating that the degradation was primarily dominated by surface erosion [17].
As for the PHAP and PGAP series, the Korsmeyer–Peppas model provided the best fit (R2 ≈ 1) for all composite samples. Korsmeyer–Peppas implies that degradation is driven by a combination of different mechanisms where chain relaxation dominates. Both the PHAP and PGAP series also had a value of n > 1, which indicates super case II transport as opposed to Fickian diffusion. Super case II transport refers to diffusion that results in the outer layer of the scaffold swelling upon interaction with the water molecules. This swelling then leads to stress at the boundaries, which results in polymer chain relaxation (Scheme 1). The poor fit observed for the other models, such as first-order and Higuchi, further supports the conclusion that relaxation is the dominant degradation mechanism [17]. Additionally, R2 values in the contracting volume model suggest that structural contraction plays no role in degradation.
The varying degradation rates observed across the PHAP and PGAP groups indicate a more complex mass degradation reaction mechanism influenced by nanofiller type and concentration. Studies have shown that nanofillers such as γ-Al2O3, HFO2, and similar nanomaterials play a crucial role in modifying the structure and degradation behavior of polymer nanocomposites [19]. Nanofillers alter the balance between crystalline and amorphous regions within the polymer matrix and create interfacial regions where the properties of the polymer can differ significantly from the bulk material [19]. The interfacial regions, which can be several times thicker than the filler radii, stabilize or disrupt the polymer matrix [20,21,22]. They could cause tight aggregation of polymer chains around their surfaces, stabilizing the structure and slowing degradation. Alternatively, they could increase chain mobility in the amorphous regions, resulting in faster degradation [21]. The surface of a polymer is typically more amorphous than the bulk because surface molecules have fewer neighboring chains, allowing for greater mobility and hindering crystallization. In contrast, bulk molecules are more constrained, promoting crystallization. PCL is a semi-crystalline polymer, with both crystalline and amorphous regions. During degradation, hydrolysis breaks ester bonds, increasing chain mobility and causing crystalline regions to transition to an amorphous state, making them more prone to further degradation. Nanofillers in the bulk enhance crystallization by promoting chain alignment, improving mechanical properties, but the surface remains more amorphous and susceptible to degradation due to the lack of surrounding chains.
This formation mechanism of interfacial regions affects the overall degradation pattern, where chain mobility is restricted near the filler, slowing down degradation in crystalline regions [21]. However, in areas where nanofillers disrupt the crystalline structure, chain relaxation accelerates, leading to faster degradation in the amorphous regions. This combination of stabilization and disruption creates a delayed degradation pattern, where weight loss is postponed despite ongoing chain relaxation. The disruption of crystalline domains by nanofillers increases the proportion of amorphous regions, where chain mobility is higher, facilitating faster chain relaxation and accelerating degradation consistent with the Korsmeyer–Peppas model, where n > 1 [23].
As observed, PHAP10 and PHAP5 exhibit higher k4 values, therefore their initial mass loss is higher (Table 2). On the other hand, the slower degradation of PPCL and PGAP samples can be attributed to their higher crystallinity, which limits water absorption and resists hydrolytic attack. Samples with higher n values, such as PHAP20 and PGAP20, experience more swelling. This swelling occurs due to the higher incidence of agglomerations in nHA-PCL and the increased surface area for hydrophilic interaction in nHA-GONS. During fabrication, the nanofillers act as nucleating agents, enhancing localized crystallinity around their surfaces [24,25]. Localized crystallinity makes parts of the polymer matrix more ordered and resistant to degradation. However, the overall increase in amorphous content accelerates degradation in those regions. Thus, nanofillers can increase both localized crystallinity and amorphous content, the overall degradation behavior depends on how these two phases interact [26,27]. Localized crystalline regions near the nanofillers provide structural stability, slowing mass loss, while amorphous zones degrade more rapidly due to enhanced chain mobility. This structural stability explains why weight loss may not be as significant, despite rapid degradation in the amorphous regions.
The Korsmeyer–Peppas model fits the PHAP and PGAP systems well because nHA and GONS not only disrupt crystalline regions, promoting chain relaxation and faster degradation in the amorphous zones, but also stabilize localized crystalline regions, slowing overall weight loss. This balance between amorphous degradation and crystalline stability results in a mixed degradation pattern, where polymer relaxation dominates in less-ordered regions of the PCL composites. This degradation pattern highlights the need to examine how crystallization temperature (Tc) and melting temperature (Tm) reflect changes in chain relaxation.

3.2. Thermal Behavior

The thermal behavior of the scaffolds, including Tc and Tm, was evaluated over 14 and 21 days, with initial (day 0) values taken from our previous study [16]. These thermal transitions provide a more comprehensive understanding of the degree of polymer chain mobility, specific degradation routes, and how nanofillers affect both crystalline and amorphous regions during degradation. As shown in Figure 2, for PPCL, Tc increased from 26.3 °C on day 0 to 27.3 °C by day 14, remaining constant on day 21. The Tm decreased from 57.6 °C on day 0 to 56 °C on both days 14 and 21.
However, PHAP and PGAP samples generally showed a decline in both Tm and Tc over the 21 days. For PHAP5 and PHAP10, Tm decreased by about 6–7 °C, stabilizing after 14 days. PHAP20 experienced a less observable drop of 5 °C in Tc, with Tm also falling by about 5 °C. Similarly, PGAP5 and PGAP10 saw a decline of around 4 °C in both temperatures early on, followed by slight increases. PGAP20 also showed a steady drop of about 4 °C in both thermal properties throughout the period. These consistent decreases in Tm and Tc across the samples indicate the influence of water absorption and super case II transport, as discussed in Section 3.1. The presence of water in the degradation medium disrupts the composite structure, leading to changes in crystalline and melting behavior as the material absorbs moisture [28,29].
In our study, it can be concluded that water acts as a plasticizer, meaning it reduces intermolecular forces between polymer chains and allows them to move more freely (Scheme 2) [28]. When plasticization is in effect, it primarily affects the relaxation of the amorphous chains, which in turn influences key thermal properties like Tm and Tc. The increased chain relaxation reduces the energy barrier for molecular chain movement, which directly impacts the polymer’s ability to transition between phases such as amorphous to crystalline and vice versa [28,29]. Hence, a decrease in Tm arises as water molecules reduce the cohesive forces between chains; therefore, the composites require less thermal energy to reach the point where chains can slip past each other and melt [28]. Likewise, the decrease in Tc is also observed because the chains can rearrange themselves into a crystalline form at a lower temperature. Additionally, water may also disrupt the crystalline chains by interfering with orderly packing, which also affects the rate and extent of crystallization [28,29].
The decline in thermal transitions reflects the degradation route of the composites. PHAP and PGAP degrade via chain relaxation, leading to a larger decrease in Tm and Tc. In contrast, PPCL shows a smaller decline because its degradation is not dominated by chain relaxation.
Plasticization is also in effect for PPCL but is less apparent. Regardless of the degradation route, over time, the PCL chains become more susceptible to hydrolytic or enzymatic attacks, which can break the chains more easily because the chains are less tightly packed [28]. As observed by the weight loss in our previous study, the rate of degradation accelerates over time because the increased chain relaxation means that water can more easily penetrate the polymer matrix and break bonds. Moreover, decreased thermal stability also correlates with an increased susceptibility to degradation mechanisms like hydrolysis, oxidation, or enzymatic degradation.

3.3. Hydrolysis of Ester Group

The ester index, A1725/A1162, decreases with increasing incubation time, which is then analyzed through regression to determine the cleavage rate of ester groups over time (Figure 3). As expected, the FTIR spectroscopy indicates a decreasing trend in the A1725/A1162 ratio over the 21 days for all scaffold types, reflecting the ongoing ester bond hydrolysis on the surface of the PCL composites. Starting values on day 0 show that the composites have a higher initial A1725/A1162 ratio compared with PPCL, with values ranging from 1.8 to 2.2. However, after day 14, all samples experience a decrease, with PGAP20 exhibiting the most significant reduction to 1.6.
Despite the lowest initial index ratio observed for PPCL, the ester index actually decreases gradually, reflecting a slow and steady surface degradation process in corroboration with the zero-order model observed in Figure 1. The ester index also decreases in the PHAP samples, but the decline rate is more controlled, particularly in the lower concentration sample (PHAP5). As the concentration of nHA increases in PHAP10 and PHAP20, degradation becomes slightly faster (Scheme 3). The increased degradation rate is likely due to greater surface exposure to water, which provides more sites for hydrolytic reactions [5]. PGAP samples, on the other hand, show a faster decline in the ester index compared with PHAP and PPCL. This faster decline is caused by the hydrophilic nature of GONS, which attracts water molecules and forms microenvironments that enhance ester bond hydrolysis [16].
In tandem with the weight loss (Figure 1) and the fitted degradation models, FTIR provides insight into the effects of nanofillers on the PCL matrix. Despite the decrease in the ester index, the PGAP samples show less overall weight loss compared with PPCL. This phenomenon is attributed to (1) the reinforcement provided by GONS, which help maintain structural integrity despite ester bond hydrolysis, and (2) the degradation route that follows the super case II transport, where there is some swelling on the surfaces of the scaffold that camouflages the weight loss. GONS stabilize the PCL matrix in PGAP through various mechanisms. Regardless of the dominant mechanism, bulk degradation and mass loss remain relatively slow, even as surface hydrolysis progresses. The bulk material stays structurally reinforced by GONS, which prevent rapid erosion and fragmentation. Evidently, the PPCL sample lacks reinforcement from GONS; therefore, it undergoes faster erosion, resulting in higher weight loss due to surface fragmentation and mass loss. The extent of hydrophilicity brought on by GONS is dependent on the concentration, where accelerated hydrolysis is observed particularly in higher concentrations like PGAP10 and PGAP20. Despite the accelerated hydrolysis and stress from swelling, the hexagonal lattice structure of GONS distributes stress evenly across the matrix [30,31,32]. This even stress distribution means that defects or cracks that do form are less likely to propagate, helping preserve the overall integrity of the scaffold [33]. This defect tolerance is crucial for minimizing significant mass loss over time. As a result, the scaffold remains intact, even as surface hydrolysis progresses.
Furthermore, the robust σ and π bonds in GONS provide high tensile strength, enabling the composite’s PCL matrix to endure significant mechanical stress without breaking down [34,35,36]. The strong covalent bonds between carbon atoms in the sp2-hybridized network prevent the nanoscrolls from deforming or breaking apart under stress, reinforcing the scaffold and slowing down its degradation [37]. The same phenomenon is not extended to the PHAP series, as we eluded from our previous study that nHA tends to form agglomerations due to its high surface energy, which causes the nHA to cluster [16]. In addition, the study showed that PHAP scaffolds exhibit increased mass loss and surface erosion due to these agglomerates, which contribute to faster degradation of the composite and further ester bond degradation in the PCL matrix compared with the PGAP series [16]. The presence of agglomerates creates localized stress points and facilitates hydrolysis, leading to an accelerated breakdown of ester bonds, consistent with the declining ester index over time. Like the PGAP series, the PHAP scaffolds undergo super case II transport, which leads to swelling. As a result, the weight loss is less significant than in PPCL, even though ester hydrolysis occurs more quickly.
The ester index analysis underscores the surface-driven degradation of the PGAP scaffolds, where the hydrophilic nature of GONS accelerates hydrolysis at the surface. Despite this, the reinforcement from GONS helps preserve the scaffold’s bulk integrity by reducing material erosion. The scaffolds, therefore, exhibit a controlled rate of bulk degradation, allowing them to retain structural stability while undergoing surface hydrolysis. As a decrease in the ester index has been observed, it is imperative to understand what contributes to this ease of hydrolysis.

3.4. Activation Energy

Activation energy (Ea) reflects the energy barrier for degradation processes such as hydrolysis of ester bonds (Figure 3) and thermal degradation. The Kissinger method was utilized in this study to determine Ea. The method involves DSC data obtained at constant heating rates to identify peak melting temperatures (Tp) of the reaction rates [38]. However, to utilize the Kissinger method, several conditions must be met; therefore, the validity of our approach was tested.
Firstly, the rate of reaction (c) must be expressible as a product of a temperature-dependent kinetic constant k(T) and a conversion-dependent function f(x). Therefore, the thermal degradation reaction rate can be written as:
c = d t d x = k T   f ( x )  
c = rate of reaction.
k(T) = temperature-dependent rate constant.
f(x) = conversion-dependent function.
The kinetic constant k must follow the Arrhenius equation, expressed as:
k ( T ) = k o e E a R T  
ko = pre-exponential factor (frequency factor).
Ea = activation energy (J/mol).
R = universal gas constant (8.314 J/mol·K).
T = absolute temperature (Kelvin).
To verify that our data fit this exponential relationship, values of k(T) obtained from experiments should be plotted against temperature and checked for alignment with the Arrhenius equation. Tests must be conducted at a constant heating rate:
β = d T d t > 0  
β = heating rate (°C/min or K/min).
T = temperature.
t = time.
The DSC tests must be performed with a constant heating rate during the experiments to satisfy this condition. The reaction rate as a function of temperature must have a peak (Tp), where:
d c d T = 0
and
d 2 c d 2 T < 0  
Lastly, the rate of variation of the kinetic function f(x) at the peak must be a negative constant, represented as:
q = d f d x     p < 0
q = rate of variation of the conversion-dependent function at Tp.
The activation energy was calculated from the graph plotted from:
ln β T p 2   against   1 T p
Finally, the slope of the Kissinger plot was determined, where the slope equals:
E a R
The DSC data over the 21 days met the conditions required to apply the Kissinger method; therefore, graphs were plotted for all samples and slopes were used to determine Ea. As stated in Section 3.1, the degradation model followed by PHAP and PGAP is linked to diffusion-driven polymer relaxation driving the degradation process rather than surface erosion. Activation energy plays a crucial role here, as it is the energy required to relax the polymer chains that directly affects the degradation rate, with lower values suggesting easier chain relaxation and, consequently, rapid degradation [38]. The activation energy was calculated for all samples to assess the energy required for their degradation (Figure 4). In the PHAP series, lower activation energies were observed (5.02–5.54 kJ/mol), implying that chain relaxation happens with relative ease and that the polymer structure is less stabilized and degradation is quicker, especially in the amorphous regions, which corroborates with the trends observed in Figure 1.
On the other hand, the PGAP series demonstrates much higher activation energies (12.88–12.90 kJ/mol), indicating that chain relaxation is more challenging due to the strong reinforcement provided by GONS that stabilizes the polymer matrix, making it harder for polymer chains to move and degrade. As a result, degradation is delayed, requiring more energy to initiate chain relaxation and, subsequently, mass loss. Despite the higher Ea, the degradation still follows the Korsmeyer–Peppas model, where polymer relaxation dominates; therefore, over time, the scaffold will lose structural integrity. Regardless, the stronger structural stability that GONS provides leads to slower degradation than the PHAP series and neat PCL. The lower activation energy in PPCL compared with the composites reflects the absence of significant reinforcement, allowing degradation to proceed at a constant rate without the influence of chain relaxation followed by scission.
Another factor that results in the Ea trends observed for the PGAP series is graphene oxide’s excellent thermal conductivity, which helps dissipate heat more efficiently throughout the polymer matrix [36,39]. This uniform heat distribution can prevent localized overheating, reducing the likelihood of thermal degradation and increasing the activation energy for degradation processes. As degradation progresses, the energy barrier is low enough for polymer chains to become more mobile, accelerating chain relaxation and mass loss. In the PGAP series, the high activation energies imply that chain relaxation is more difficult, but the Korsmeyer–Peppas model still applies due to the disruption of crystalline regions by GONS, leading to slower degradation [40].
Activation energy represents the threshold that polymer chains must overcome to move and rearrange, which is critical in dictating the ease of polymer relaxation and structural changes during degradation [40]. When activation energy is high, more thermal energy is needed for the polymer chains to mobilize, leading to a slower degradation process. Conversely, lower activation energy allows for quicker chain movement, accelerating both relaxation and degradation. The temperature dependence of chain relaxation is a key factor [40]. At elevated temperatures, increased thermal energy enables polymer chains to surpass the activation energy barrier more easily, speeding up relaxation and degradation [40]. At lower temperatures, insufficient energy limits chain mobility, resulting in slower relaxation and degradation [40].
Additionally, PCL exhibits viscoelastic behavior, acting as both a viscous fluid and an elastic solid where activation energy influences the shift between these states [41]. If Ea is low, as observed in PHAP and PPCL, the transition into these states becomes easier. This ease of transition allows PCL to behave more fluidly. In contrast, higher Ea preserves PCL’s elasticity for longer periods and slows its transition to a more fluid state [41]. Ea also determines how gradual stress relaxation occurs, where a polymer gradually relieves internal stress when subjected to constant strain [42,43]. Higher activation energy slows this process, as the chains require more energy to relax. In contrast, lower activation energy promotes faster stress relief, making the polymer more susceptible to deformation. In creep behavior, a polymer deforms under constant stress over time. Lower activation energy leads to faster deformation because the chains rearrange more easily. In contrast, polymers with higher activation energy resist creep and maintain structural integrity for longer periods [44,45]. In addition to all the insights discussed, Ea also helps to understand the ease of oxidative degradation, which is an important factor, in vivo, where oxygen exposure can accelerate scaffold degradation over time. Similarly, higher activation energy indicates greater stability and less ease of oxidative degradation.

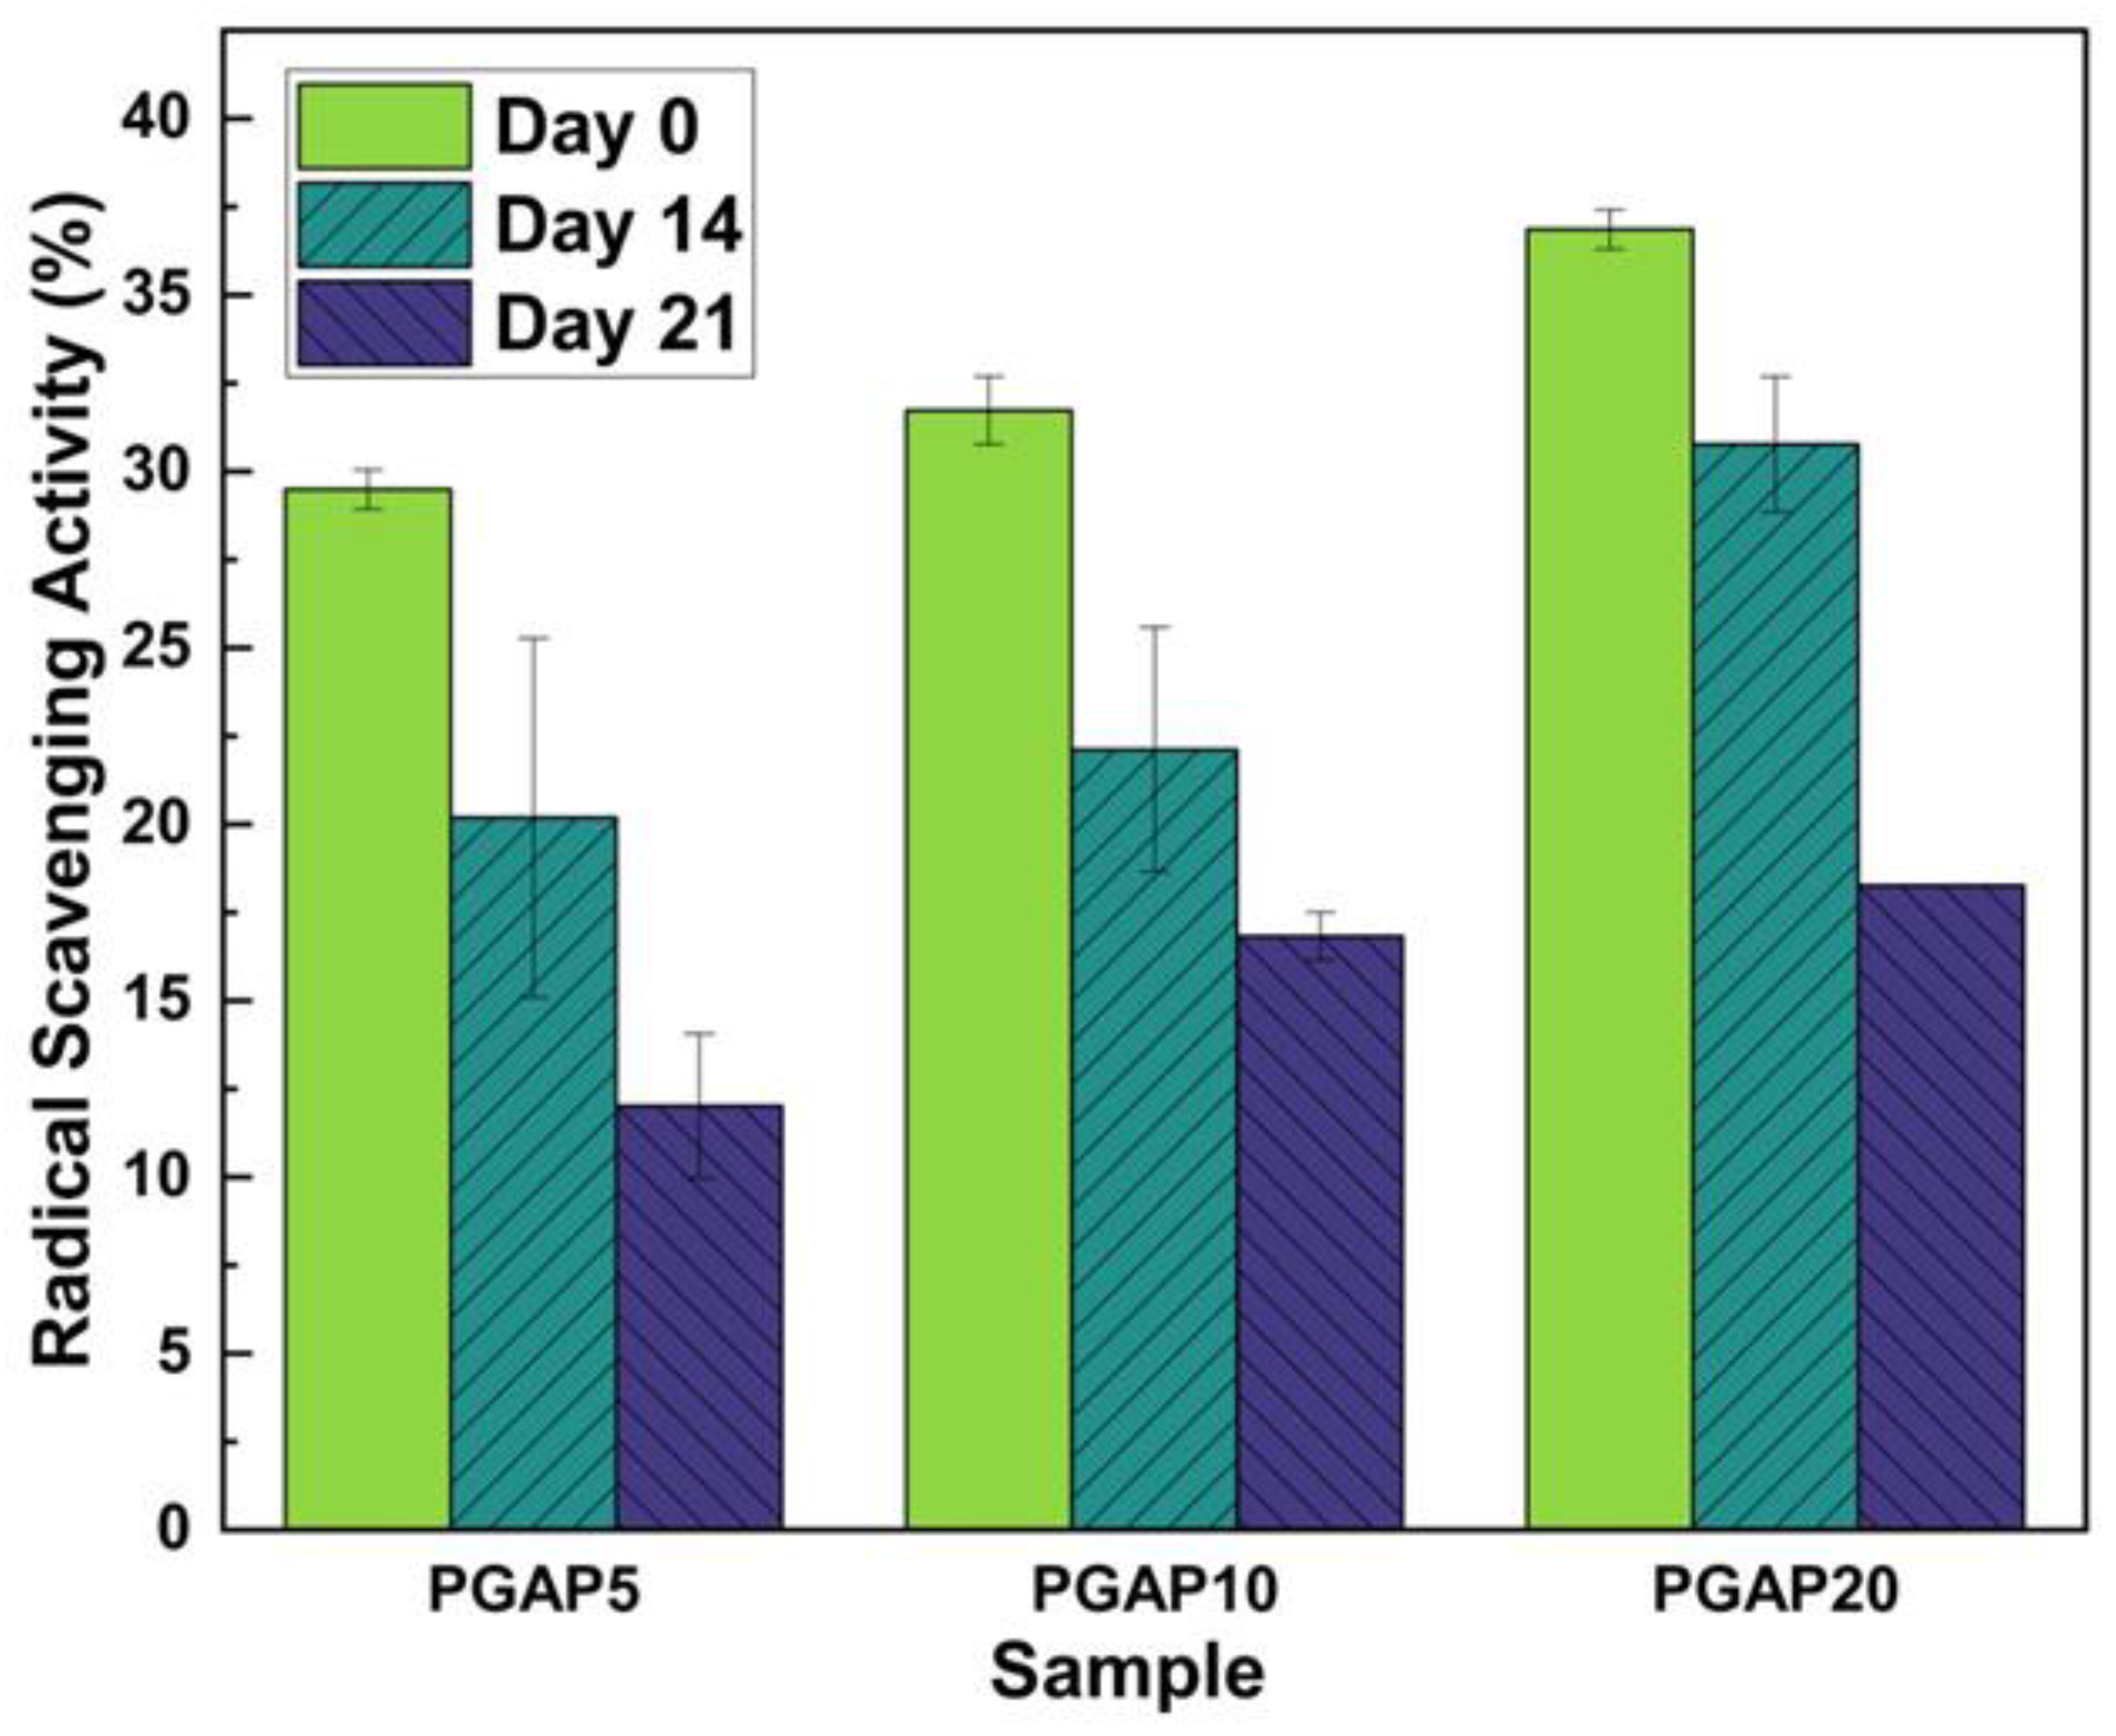
3.5. Antioxidant Properties

The antioxidant potential of the PGAP scaffolds was assessed using the DPPH assay to determine radical scavenging activity. The results indicate that the scaffolds initially exhibit some antioxidant capabilities, which wear off with degradation (Figure 5). PGAP5 starts with an RSA of 30.2% on day 0, which decreases to 20.1% by day 14 and further declines to 10.3% by day 21. Similarly, PGAP10 has an initial RSA of 32.6%, which declines to 21.3% on day 14, and 11.4% by day 21. Finally, PGAP20 shows the highest initial activity at 35.3%, then 24.7% on day 14, and 15.4% on day 21. Our study focuses specifically on the PGAP series, and as such, no comparison is made to PPCL or PHAP because neither one inherently exhibits any antioxidant properties. On the other hand, PGAP samples exhibit antioxidant capabilities that are specifically attributed to GONS. Graphene is made up of sp2-hybridized carbon atoms [15,46]. The electrons in graphene are not tied to individual atoms; instead, they can move freely over the surface. This mobility allows graphene to “absorb” or “stabilize” unpaired electrons from reactive oxygen species (ROS), such as hydroxyl radicals (·OH) [15,47,48,49].
Since the primary antioxidant ability comes from the sp2-carbon sites on GONS, which are partially covered by nHA, the initial antioxidant ability observed is moderate [50]. Consequently, the dramatic loss of RSA in nHA-GONS can be attributed to several factors. One primary mechanism involves interference from ions, particularly Ca2⁺ and PO₄3−, released as the PCL composite degrades. This release increases the ionic strength of the enzymatic degradation medium [47,48,49,50,51,52]. The enzymatic degradation in our study does not involve external factors such as cellular activity or oxidative stress. Over time, the decrease in antioxidant activity is primarily due to the physical degradation of the scaffold itself. During enzymatic degradation, the PCL matrix undergoes hydrolysis, which breaks down the ester bonds within the scaffold, resulting in fragmentation. As some of the PCL scaffold fragments and nHA-GONS are released or carried away, the accessibility of GONS for radical scavenging also decreases.
Furthermore, as degradation progresses, lysozyme absorbs on GONS (Scheme 4). Lysozyme, like most enzymes, undergoes interfacial activation when it interacts with hydrophobic surfaces; subsequently, GONS’ structure supports this activation [53]. While GONS contain polar oxygen-containing functional groups, such as hydroxyl, carboxyl, and epoxy, attached to sp3 hybridized carbon atoms, they also retain hydrophobic regions in its sp2 hybridized network, similar to pristine graphene [50]. This hydrophobicity promotes the adsorption of lysozyme onto GONS, stabilizing the enzyme in its open catalytically active form [54,55]. When lysozyme binds to the GONS’ surface, it blocks critical sp2-carbon sites needed for ROS stabilization. This binding gradually reduces the surface area available for ROS interaction, thereby diminishing GONS’ scavenging capacity [56]. This phenomenon is logical because GONS are widely used for enzyme immobilization. Their large surface areas, mechanical strengths, and functional groups support strong covalent bonding and electrostatic interactions. These properties enhance enzyme stability and efficiency in many biochemical processes [15,57,58,59].
The accumulation of ions, ongoing fragmentation, and the gradual adsorption of lysozyme create an environment where GONS lose their ability to efficiently neutralize ROS, leading to a significant decline in scavenging potential over time.

4. Conclusions

The degradation kinetics of PCL nanocomposites are heavily influenced by the type and concentration of nanofillers. PPCL exhibits steady surface-driven degradation following zero-order kinetics, whereas PHAP20 shows accelerated degradation with a weight loss three times greater than PPCL after 21 days. This behavior is attributed to chain relaxation in amorphous regions and stress caused by nHA agglomerations, aligning with the Korsmeyer–Peppas model. In contrast, PGAP20 demonstrates more gradual degradation, with 40 percent less weight loss than PHAP20 due to the structural reinforcement provided by GONS, which maintain matrix integrity while accelerating surface hydrolysis. Activation energy trends further emphasize this distinction, with PHAP exhibiting lower values between 5.02 and 5.54 kJ/mol, facilitating faster chain relaxation, while PGAP exhibits higher activation energy values of 12.88 to 12.90 kJ/mol, reflecting greater resistance to degradation. PGAP scaffolds also exhibit antioxidant activity, with RSA in PGAP20 decreasing by 56 percent over 21 days, from 35.3 percent to 15.4 percent, due to GONS’ surface degradation. These results highlight the multifunctionality potential of PGAP scaffolds in balancing surface hydrolysis and bulk reinforcement, making them suitable for oxidative environments, while PHAP and PPCL focus solely on structural stability. The findings suggest that optimizing GONS’ concentrations could further enhance scaffold performance and pave the way for advanced applications such as shape memory and self-healing scaffolds.

Author Contributions

L.T.M.: writing—original draft, investigation, formal analysis, conceptualization. D.D.: writing—review and editing, supervision, resources, funding acquisition, conceptualization. All authors have read and agreed to the published version of the manuscript.

Funding

This research was supported by the Louisiana Board of Regents Support Fund, RCS project, contract number LEQSF (2020-23)-RD-A-21.

Data Availability Statement

The original contributions presented in this study are included in the article. Further inquiries can be directed to the corresponding author.

Conflicts of Interest

The authors declare that they have no conflicts of interest regarding the publication of this paper. Declaration of generative AI and AI-assisted technologies in the writing process: During the preparation of this work, the author used ChatGPT3.5 to improve language. After using this tool, the author reviewed and edited the content as needed and takes full responsibility for the content of the published article.

References

  1. Daskalakis, E.; Hassan, M.H.; Omar, A.M.; Acar, A.A.; Fallah, A.; Cooper, G.; Weightman, A.; Blunn, G.; Koc, B.; Bartolo, P. Accelerated Degradation of Poly-ε-caprolactone Composite Scaffolds for Large Bone Defects. Polymers 2023, 15, 670. [Google Scholar] [CrossRef]
  2. Tajvar, S.; Hadjizadeh, A.; Samandari, S.S. Scaffold degradation in bone tissue engineering: An overview. Int. Biodeterior. Biodegrad. 2023, 180, 105599. [Google Scholar] [CrossRef]
  3. Salmasi, S.; Nayyer, L.; Seifalian, A.M.; Blunn, G.W. Nanohydroxyapatite Effect on the Degradation, Osteoconduction and Mechanical Properties of Polymeric Bone Tissue Engineered Scaffolds. Open Orthop. J. 2016, 10, 900–919. [Google Scholar] [CrossRef]
  4. Hegyesi, N.; Hodosi, E.; Polyák, P.; Faludi, G.; Balogh-Weiser, D.; Pukánszky, B. Controlled degradation of poly-ε-caprolactone for resorbable scaffolds. Colloids Surf. B Biointerfaces 2020, 186, 110678. [Google Scholar] [CrossRef] [PubMed]
  5. Rodenas-Rochina, J.; Vidaurre, A.; Castilla Cortázar, I.; Lebourg, M. Effects of hydroxyapatite filler on long-term hydrolytic degradation of PLLA/PCL porous scaffolds. Polym. Degrad. Stab. 2015, 119, 121–131. [Google Scholar] [CrossRef]
  6. Bartnikowski, M.; Dargaville, T.R.; Ivanovski, S.; Hutmacher, D.W. Degradation mechanisms of polycaprolactone in the context of chemistry, geometry and environment. Prog. Polym. Sci. 2019, 96, 1–20. [Google Scholar] [CrossRef]
  7. Sivalingam, G.; Karthik, R.; Madras, G. Kinetics of thermal degradation of poly(ε-caprolactone). J. Anal. Appl. Pyrolysis 2003, 70, 631–647. [Google Scholar] [CrossRef]
  8. Fiuza, C.; Polak-Kraśna, K.; Antonini, L.; Petrini, L.; Carroll, O.; Ronan, W.; Vaughan, T.J. An experimental investigation into the physical, thermal and mechanical degradation of a polymeric bioresorbable scaffold. J. Mech. Behav. Biomed. Mater. 2022, 125, 104955. [Google Scholar] [CrossRef] [PubMed]
  9. Weir, N.A.; Buchanan, F.J.; Orr, J.F.; Dickson, G.R. Degradation of poly-L-lactide. Part 1: In vitro and in vivo physiological temperature degradation. Proc. Inst. Mech. Eng. H 2004, 218, 307–319. [Google Scholar] [CrossRef] [PubMed]
  10. Mahomed, A. Ageing processes of biomedical polymers in the body. In Durability and Reliability of Medical Polymers; Elsevier: Amsterdam, The Netherlands, 2012; pp. 164–182. [Google Scholar] [CrossRef]
  11. Fagali, N.S.; A Madrid, M.; Maceda, B.T.P.; Fernández, M.E.L.; Puerto, R.M.L.; de Mele, M.F.L. Effect of degradation products of iron-bioresorbable implants on the physiological behavior of macrophages in vitro. Metallomics 2020, 12, 1841–1850. [Google Scholar] [CrossRef]
  12. Cerqueni, G.; Scalzone, A.; Licini, C.; Gentile, P.; Mattioli-Belmonte, M. Insights into oxidative stress in bone tissue and novel challenges for biomaterials. Mater. Sci. Eng. C 2021, 130, 112433. [Google Scholar] [CrossRef] [PubMed]
  13. Yao, H.; Huang, Y.; Li, X.; Li, X.; Xie, H.; Luo, T.; Chen, J.; Chen, Z. Underlying mechanisms of reactive oxygen species and oxidative stress photoinduced by graphene and its surface-functionalized derivatives. Environ. Sci. Nano 2020, 7, 782–792. [Google Scholar] [CrossRef]
  14. Liang, X.; Yang, X.; Liu, J.; Tu, L.; Wei, W.; Wang, H.; Wu, M.; Cai, L.; Zheng, Y.; Chen, Y. ROS-scavenging bioactive scaffold orchestrates bone regeneration for osteoporotic bone defect repair. Compos. B Eng. 2024, 281, 111528. [Google Scholar] [CrossRef]
  15. Hou, Y.; Wang, W.; Bartolo, P. The effect of graphene and graphene oxide induced reactive oxygen species on polycaprolactone scaffolds for bone cancer applications. Mater. Today Bio 2024, 24, 100886. [Google Scholar] [CrossRef] [PubMed]
  16. Mambiri, L.T.; Broussard, G.; Smith, J.; Depan, D. In-Situ Grown Nanohydroxyapatite on Graphene Oxide Nanoscrolls for Modulated Physicochemical Properties of Poly (Caprolactone) Composites. Macromol 2024, 4, 285–303. [Google Scholar] [CrossRef]
  17. Mansur, H.S.; Costa, H.S.; Mansur, A.A.P.; Pereira, M. 3D-macroporous hybrid scaffolds for tissue engineering: Network design and mathematical modeling of the degradation kinetics. Mater. Sci. Eng. C 2012, 32, 404–415. [Google Scholar] [CrossRef]
  18. García, A.V.; Serrano, N.J.; Sanahuja, A.B.; Garrigós, M.C. Novel antioxidant packaging films based on poly(ε-caprolactone) and almond skin extract: Development and effect on the oxidative stability of fried almonds. Antioxidants 2020, 9, 629. [Google Scholar] [CrossRef]
  19. Kumar, V.; Tang, X. New Horizons in Nanofiller-Based Polymer Composites II. Polymers 2023, 15, 4259. [Google Scholar] [CrossRef] [PubMed]
  20. Azani, M.-R.; Hassanpour, A. High-performance polymer nanocomposites: Advanced fabrication methods and critical insights. J. Polym. Res. 2024, 31, 168. [Google Scholar] [CrossRef]
  21. Sima, W.; Tang, X.; Sun, P.; Yang, M.; Yuan, T.; Shi, Z.; Yang, H.; Deng, Q. Role of a 3D Nanoskeleton in Hindering Electrical Tree Growth in Nanocomposites: Insights from in Situ Self-Fluorescence Imaging. ACS Macro Lett. 2023, 12, 866–873. [Google Scholar] [CrossRef]
  22. Sharma, M.; Chauhan, P.; Jangid, N.K.; Sharma, R. Recent Advances in Nanofillers for Multidisciplinary Applications of Polymer Nanocomposites. In Handbook of Nanofillers; Springer Nature: Singapore, 2024; pp. 1–20. [Google Scholar] [CrossRef]
  23. Plota, A.; Masek, A. Lifetime prediction methods for degradable polymeric materials—A short review. Materials 2020, 13, 4507. [Google Scholar] [CrossRef]
  24. Castilla-Cortázar, I.; Vidaurre, A.; Marí, B.; Campillo-Fernández, A.J. Morphology, Crystallinity, and Molecular Weight of Poly(ε-caprolactone)/Graphene Oxide Hybrids. Polymers 2019, 11, 1099. [Google Scholar] [CrossRef] [PubMed]
  25. Biscaia, S.; Silva, J.C.; Moura, C.; Viana, T.; Tojeira, A.; Mitchell, G.R.; Pascoal-Faria, P.; Ferreira, F.C.; Alves, N. Additive Manufactured Poly(ε-caprolactone)-graphene Scaffolds: Lamellar Crystal Orientation, Mechanical Properties and Biological Performance. Polymers 2022, 14, 1669. [Google Scholar] [CrossRef]
  26. Wu, D.; Lin, D.; Zhang, J.; Zhou, W.; Zhang, M.; Zhang, Y.; Wang, D.; Lin, B. Selective Localization of Nanofillers: Effect on Morphology and Crystallization of PLA/PCL Blends. Macromol. Chem. Phys. 2011, 212, 613–626. [Google Scholar] [CrossRef]
  27. Ajala, O.; Werther, C.; Nikaeen, P.; Singh, R.P.; Depan, D. Influence of graphene nanoscrolls on the crystallization behavior and nano-mechanical properties of polylactic acid. Polym. Adv. Technol. 2019, 30, 1825–1835. [Google Scholar] [CrossRef]
  28. Richaud, E.; Derue, I.; Gilormini, P.; Verdu, J.; Vaulot, C.; Coquillat, M.; Desgardin, N.; Vandenbrouke, A. Plasticizer effect on network structure and hydrolytic degradation. Eur. Polym. J. 2015, 69, 232–246. [Google Scholar] [CrossRef]
  29. Blasi, P.; D’Souza, S.S.; Selmin, F.; DeLuca, P.P. Plasticizing effect of water on poly(lactide-co-glycolide). J. Control. Release 2005, 108, 1–9. [Google Scholar] [CrossRef] [PubMed]
  30. Catania, F.; Marras, E.; Giorcelli, M.; Jagdale, P.; Lavagna, L.; Tagliaferro, A.; Bartoli, M. A Review on Recent Advancements of Graphene and Graphene-Related Materials in Biological Applications. Appl. Sci. 2021, 11, 614. [Google Scholar] [CrossRef]
  31. Shin, S.R.; Li, Y.-C.; Jang, H.L.; Khoshakhlagh, P.; Akbari, M.; Nasajpour, A.; Zhang, Y.S.; Tamayol, A.; Khademhosseini, A. Graphene-based materials for tissue engineering. Adv. Drug Deliv. Rev. 2016, 105, 255–274. [Google Scholar] [CrossRef] [PubMed]
  32. Ganguly, S.; Sengupta, J. Graphene-Based Nanofiller Fabrication: Opportunities and Challenges. In Handbook of Nanofillers; Springer Nature: Singapore, 2024; pp. 1–22. [Google Scholar] [CrossRef]
  33. Jodati, H.; Yilmaz, B.; Evis, Z. In vitro and in vivo properties of graphene-incorporated scaffolds for bone defect repair. Ceram. Int. 2021, 47, 29535–29549. [Google Scholar] [CrossRef]
  34. Kamatchi, T.; Saravanan, R.; Rangappa, S.M.; Siengchin, S. Effect of filler content and size on the mechanical properties of graphene-filled natural fiber-based nanocomposites. Biomass Convers. Biorefinery 2023, 13, 11311–11320. [Google Scholar] [CrossRef]
  35. Ou, L.; Tan, X.; Qiao, S.; Wu, J.; Su, Y.; Xie, W.; Jin, N.; He, J.; Luo, R.; Lai, X.; et al. Graphene-Based Material-Mediated Immunomodulation in Tissue Engineering and Regeneration: Mechanism and Significance. ACS Nano 2023, 17, 18669–18687. [Google Scholar] [CrossRef] [PubMed]
  36. Florien, N.; Gupta, S.; Poria, R.; Chaudhary, D.; Poria, R.; Rawat, T. Structure and Electrochemical Properties of Graphene, Derivatives, and Its Nanocomposites. In Electrochemical Exfoliation of Graphene and Its Derivatives. Engineering Materials; Springer: Singapore, 2024; pp. 113–136. [Google Scholar] [CrossRef]
  37. Moharana, S.; Kar, S.K.; Mishra, M.K.; Mahaling, R.N. Synthesis and Properties of Graphene and Graphene Oxide-Based Polymer Composites. In Surface Engineering of Graphene; Springer: Berlin/Heidelberg, Germany, 2019; pp. 175–201. [Google Scholar] [CrossRef]
  38. Langueh, C.; Changotade, S.; Ramtani, S.; Lutomski, D.; Rohman, G. Combination of in vitro thermally-accelerated ageing and Fourier-Transform Infrared spectroscopy to predict scaffold lifetime. Polym. Degrad. Stab. 2021, 183, 109454. [Google Scholar] [CrossRef]
  39. Bahrami, S.; Solouk, A.; Mirzadeh, H.; Seifalian, A.M. Electroconductive polyurethane/graphene nanocomposite for biomedical applications. Compos. B Eng. 2019, 168, 421–431. [Google Scholar] [CrossRef]
  40. Klimova, N.S.; Pereborova, N.V.; Makarov, A.G. Activation Energy of Deformation Processes in Polymer Textile Materials. Fibre Chemistry 2021, 53, 76–81. [Google Scholar] [CrossRef]
  41. Noroozi, N.; Thomson, J.A.; Noroozi, N.; Schafer, L.L.; Hatzikiriakos, S.G. Viscoelastic behaviour and flow instabilities of biodegradable poly (ε-caprolactone) polyesters. Rheol. Acta 2012, 51, 179–192. [Google Scholar] [CrossRef]
  42. Arcenegui-Troya, J.; Sánchez-Jiménez, P.E.; Perejón, A.; Pérez-Maqueda, L.A. Determination of the activation energy under isothermal conditions: Revisited. J. Therm. Anal. Calorim. 2023, 148, 1679–1686. [Google Scholar] [CrossRef]
  43. Tripathy, D.; Gadtya, A.S.; Sahu, B.B.; Moharana, S. Surface Engineering of Graphene-Based Polymeric Composites for Energy Storage Devices. In Emerging Nanodielectric Materials for Energy Storage; Springer: Berlin/Heidelberg, Germany, 2024; pp. 269–303. [Google Scholar] [CrossRef]
  44. Phuoc, T.X.; Chen, R.H. Modeling the effect of particle size on the activation energy and ignition temperature of metallic nanoparticles. Combust. Flame 2012, 159, 416–419. [Google Scholar] [CrossRef]
  45. Khan, N.S.; Shah, Z.; Shutaywi, M.; Kumam, P.; Thounthong, P. A comprehensive study to the assessment of Arrhenius activation energy and binary chemical reaction in swirling flow. Sci. Rep. 2020, 10, 7868. [Google Scholar] [CrossRef] [PubMed]
  46. Yu, W.; Sisi, L.; Haiyan, Y.; Jie, L. Progress in the functional modification of graphene/graphene oxide: A review. RSC Adv. 2020, 10, 15328–15345. [Google Scholar] [CrossRef]
  47. Singh, A.; Satheeshkumar, P.K. Reactive Oxygen Species (ROS) and ROS Scavengers in Plant Abiotic Stress Response. In Stress Biology in Photosynthetic Organisms; Springer Nature: Singapore, 2024; pp. 41–63. [Google Scholar] [CrossRef]
  48. Wang, Y.; Ji, D.; Chen, T.; Li, B.; Zhang, Z.; Qin, G.; Tian, S. Production, Signaling, and Scavenging Mechanisms of Reactive Oxygen Species in Fruit–Pathogen Interactions. Int. J. Mol. Sci. 2019, 20, 2994. [Google Scholar] [CrossRef]
  49. Bhaloo, A.; Nguyen, S.; Lee, B.H.; Valimukhametova, A.; Gonzalez-Rodriguez, R.; Sottile, O.; Dorsky, A.; Naumov, A.V. Doped Graphene Quantum Dots as Biocompatible Radical Scavenging Agents. Antioxidants 2023, 12, 1536. [Google Scholar] [CrossRef] [PubMed]
  50. Qiu, Y.; Wang, Z.; Owens, A.C.E.; Kulaots, I.; Chen, Y.; Kane, A.B.; Hurt, R.H. Antioxidant chemistry of graphene-based materials and its role in oxidation protection technology. Nanoscale 2014, 6, 11744–11755. [Google Scholar] [CrossRef] [PubMed]
  51. Świderek, K.; Velasco-Lozano, S.; Galmés M, À.; Olazabal, I.; Sardon, H.; López-Gallego, F.; Moliner, V. Mechanistic studies of a lipase unveil effect of pH on hydrolysis products of small PET modules. Nat. Commun. 2023, 14, 3556. [Google Scholar] [CrossRef] [PubMed]
  52. Sun, J.; Camilli, L.; Caridad, J.M.; Santos, J.E.; Liu, Y. Spontaneous adsorption of ions on graphene at the electrolyte–graphene interface. Appl. Phys. Lett. 2020, 117, 203102. [Google Scholar] [CrossRef]
  53. Mohanan, N.; Wong, C.H.; Budisa, N.; Levin, D.B. Characterization of Polymer Degrading Lipases, LIP1 and LIP2 From Pseudomonas chlororaphis PA23. Front. Bioeng. Biotechnol. 2022, 10, 854298. [Google Scholar] [CrossRef] [PubMed]
  54. Soozanipour, A.; Taheri-Kafrani, A. Enzyme Immobilization on Functionalized Graphene Oxide Nanosheets: Efficient and Robust Biocatalysts. Methods Enzymol. 2018, 609, 371–403. [Google Scholar] [CrossRef] [PubMed]
  55. Sadiq, H.; Sadiq, H.; Sohail, A.; Basit, A.; Akhtar, N.; Batool, K.; Hisaindee, S.; Asghar, L. Assessment of antioxidant activity of pure graphene oxide (GO) and composite V2O5/GO using DPPH radical and H2O2 scavenging assays. J. Solgel Sci. Technol. 2023, 108, 840–849. [Google Scholar] [CrossRef]
  56. Ramakrishna TR, B.; Nalder, T.D.; Yang, W.; Marshall, S.N.; Barrow, C.J. Controlling enzyme function through immobilisation on graphene, graphene derivatives and other two dimensional nanomaterials. J. Mater. Chem. B 2018, 6, 3200–3218. [Google Scholar] [CrossRef]
  57. Losada-Garcia, N.; Berenguer-Murcia, A.; Cazorla-Amorós, D.; Palomo, J. Efficient Production of Multi-Layer Graphene from Graphite Flakes in Water by Lipase-Graphene Sheets Conjugation. Nanomaterials 2019, 9, 1344. [Google Scholar] [CrossRef]
  58. Freije García, F.; García Liñares, G. Use of Lipases as a Sustainable and Efficient Method for the Synthesis and Degradation of Polymers. J. Polym. Environ. 2024, 32, 2484–2516. [Google Scholar] [CrossRef]
  59. Chen, M.; Wu, H.; Li, Z.; Wu, K.; Jiao, Y.; Zhou, C. Synthesis of chitin/graphene oxide composite aerogel beads for lipase immobilization. J. Porous Mater. 2020, 27, 549–554. [Google Scholar] [CrossRef]
Figure 1. Weight loss (%) of PPCL, PHAP, and PGAP scaffolds during enzymatic degradation over 35 days.
Carbon 11 00005 g001
Scheme 1. Mechanism for diffusion-driven chain relaxation.
Carbon 11 00005 sch001
Figure 2. (a) Melting temperature (Tm) and (b) crystallization temperature (Tc) of PPCL, PHAP, and PGAP scaffolds at day 0, day 14, and day 21.
Carbon 11 00005 g002
Scheme 2. Water plasticizing effect on polymer chains.
Carbon 11 00005 sch002
Figure 3. Ester index (A1725/A1162) of PPCL, PHAP, and PGAP scaffolds during enzymatic degradation over 21 days.
Carbon 11 00005 g003
Scheme 3. Mechanisms of hydrolytic and enzymatic degradation of ester bonds in PCL. Surface degradation is influenced by the highly amorphous structure and increased exposure to water, while bulk degradation is constrained by crystalline regions with less water accessibility.
Carbon 11 00005 sch003
Figure 4. Activation energy required for the degradation of PPCL, PHAP5, PHAP10, PHAP20, PGAP5, PGAP10, and PGAP20 scaffolds.
Carbon 11 00005 g004
Figure 5. Radical scavenging activity (%) of PGAP scaffolds (PGAP5, PGAP10, PGAP20) on day 0, day 14, and day 21.
Carbon 11 00005 g005
Scheme 4. Enzyme adsorption resulting in reduced RSA.
Carbon 11 00005 sch004
Table 1. Coefficient of determination (R2) for degradation models applied to PPCL, PHAP, and PGAP scaffolds, highlighting the best-fit model for each scaffold.
R2 Zero-OrderR2 First-OrderR2 HiguchiR2 KorsmeyerR2 Contracting VolumeBest Fit Model
PPCL0.720.720.550.870.69Zero Order/Korsmeyer
PHAP50.680.750.450.890.79Korsmeyer
PHAP100.830.830.630.920.70Korsmeyer
PHAP200.680.680.450.920.60Korsmeyer
PGAP50.740.740.550.930.65Korsmeyer
PGAP100.490.490.310.980.57Korsmeyer
PGAP200.680.680.460.960.52Korsmeyer
Table 2. Mass loss rate constants (k4) and diffusional exponents (n) based on the Korsmeyer–Peppas model for PPCL, PHAP, and PGAP scaffold samples.
k4 (Korsmeyer)n (Korsmeyer)
PPCL5.1 × 10−31.38
PHAP52.0 × 10−42.37
PHAP109.0 × 10−41.90
PHAP201.0 × 10−63.76
PGAP59.4 × 10−52.53
PGAP106.1 × 10−52.63
PGAP202.0 × 10−52.93
Disclaimer/Publisher’s Note: The statements, opinions and data contained in all publications are solely those of the individual author(s) and contributor(s) and not of MDPI and/or the editor(s). MDPI and/or the editor(s) disclaim responsibility for any injury to people or property resulting from any ideas, methods, instructions or products referred to in the content.

