
Identification of Differentially Expressed Intronic Transcripts in Osteosarcoma


Abstract
1. Introduction
2. Results
3. Discussion
4. Materials and Methods
4.1. Sample Description
4.2. Total RNA Isolation and Sequencing
4.3. Identification of Differentially Expressed Transcripts
4.4. Investigation of Structure and Function of lncRNAs
Author Contributions
Funding
Institutional Review Board Statement
Informed Consent Statement
Data Availability Statement
Acknowledgments
Conflicts of Interest
References
- Chen, C.; Xie, L.; Ren, T.; Huang, Y.; Xu, J.; Guo, W. Immunotherapy for osteosarcoma: Fundamental mechanism, rationale, and recent breakthroughs. Cancer Lett. 2021, 500, 1–10. [Google Scholar] [CrossRef] [PubMed]
- Luetke, A.; Meyers, P.A.; Lewis, I.; Juergens, H. Osteosarcoma treatment—Where do we stand? A state of the art review. Cancer Treat. Rev. 2014, 40, 523–532. [Google Scholar] [CrossRef] [PubMed]
- Berhe, S.; Danzer, E.; Meyers, P.; Behr, G.; LaQuaglia, M.P.; Price, A.P. Unusual abdominal metastases in osteosarcoma. J. Pediatr. Surg. Case Rep. 2018, 28, 13–16. [Google Scholar] [CrossRef] [PubMed]
- Sadoughi, F.; Maleki Dana, P.; Asemi, Z.; Yousefi, B. DNA damage response and repair in osteosarcoma: Defects, regulation and therapeutic implications. DNA Repair 2021, 102, 103105. [Google Scholar] [CrossRef] [PubMed]
- Wang, J.; Gong, M.; Xiong, Z.; Zhao, Y.; Xing, D. Bioinformatics integrated analysis to investigate candidate biomarkers and associated metabolites in osteosarcoma. J. Orthop. Surg. Res. 2021, 16, 432. [Google Scholar] [CrossRef]
- Yotsukura, S.; du Verle, D.; Hancock, T.; Natsume-Kitatani, Y.; Mamitsuka, H. Computational recognition for long non-coding RNA (lncRNA): Software and databases. Brief. Bioinform. 2017, 18, 9–27. [Google Scholar] [CrossRef] [PubMed]
- Zhang, P.; Wu, W.; Chen, Q.; Chen, M. Non-Coding RNAs and their Integrated Networks. J. Integr. Bioinform. 2019, 16. [Google Scholar] [CrossRef] [PubMed]
- Quan, Z.; Zheng, D.; Qing, H. Regulatory Roles of Long Non-Coding RNAs in the Central Nervous System and Associated Neurodegenerative Diseases. Front. Cell. Neurosci. 2017, 11, 175. [Google Scholar] [CrossRef] [PubMed]
- Pinkney, H.R.; Wright, B.M.; Diermeier, S.D. The lncRNA Toolkit: Databases and In Silico Tools for lncRNA Analysis. Noncoding RNA 2020, 6, 49. [Google Scholar] [CrossRef] [PubMed]
- Yin, X.; Jing, Y.; Xu, H. Mining for missed sORF-encoded peptides. Expert Rev. Proteom. 2019, 16, 257–266. [Google Scholar] [CrossRef]
- Vitorino, R.; Guedes, S.; Amado, F.; Santos, M.; Akimitsu, N. The role of micropeptides in biology. Cell. Mol. Life Sci. 2021, 78, 3285–3298. [Google Scholar] [CrossRef] [PubMed]
- Zhang, W.; Ren, X.; Qi, L.; Zhang, C.; Tu, C.; Li, Z. The value of lncRNAs as prognostic biomarkers on clinical outcomes in osteosarcoma: A meta-analysis. BMC Cancer 2021, 21, 202. [Google Scholar] [CrossRef] [PubMed]
- Han, J.; Shen, X. Long noncoding RNAs in osteosarcoma via various signaling pathways. J. Clin. Lab. Anal. 2020, 34, e23317. [Google Scholar] [CrossRef] [PubMed]
- Yan, M.; Pan, X.F.; Liu, Y.; Zhao, S.; Gong, W.Q.; Liu, W. Long noncoding RNA PVT1 promotes metastasis via miR-484 sponging in osteosarcoma cells. Eur. Rev. Med. Pharmacol. Sci. 2020, 24, 2229–2238. [Google Scholar] [PubMed]
- Nakaya, H.I.; Amaral, P.P.; Louro, R.; Lopes, A.; Fachel, A.A.; Moreira, Y.B.; El-Jundi, T.A.; da Silva, A.M.; Reis, E.M.; Verjovski-Almeida, S. Genome mapping and expression analyses of human intronic noncoding RNAs reveal tissue-specific patterns and enrichment in genes related to regulation of transcription. Genome Biol. 2007, 8, R43. [Google Scholar] [CrossRef] [PubMed]
- Ru, N.; Liang, J.; Zhang, F.; Wu, W.; Wang, F.; Liu, X.; Du, Y. SPRY4 Intronic Transcript 1 Promotes Epithelial-Mesenchymal Transition Through Association with Snail1 in Osteosarcoma. DNA Cell Biol. 2016, 35, 290–295. [Google Scholar] [CrossRef] [PubMed]
- Yao, H.; Hou, G.; Wang, Q.Y.; Xu, W.B.; Zhao, H.Q.; Xu, Y.C. LncRNA SPRY4IT1 promotes progression of osteosarcoma by regulating ZEB1 and ZEB2 expression through sponging of miR101 activity. Int. J. Oncol. 2020, 56, 85–100. [Google Scholar] [PubMed]
- Jin, X.M.; Xu, B.; Zhang, Y.; Liu, S.Y.; Shao, J.; Wu, L.; Tang, J.A.; Yin, T.; Fan, X.B.; Yang, T.Y. LncRNA SND1-IT1 accelerates the proliferation and migration of osteosarcoma via sponging miRNA-665 to upregulate POU2F1. Eur. Rev. Med. Pharmacol. Sci. 2019, 23, 9772–9780. [Google Scholar] [PubMed]
- Guh, C.Y.; Hsieh, Y.H.; Chu, H.P. Functions and properties of nuclear lncRNAs-from systematically mapping the interactomes of lncRNAs. J. Biomed. Sci. 2020, 27, 44. [Google Scholar] [CrossRef]
- Statello, L.; Guo, C.J.; Chen, L.L.; Huarte, M. Author Correction: Gene regulation by long non-coding RNAs and its biological functions. Nat. Rev. Mol. Cell Biol. 2021, 22, 159. [Google Scholar] [CrossRef] [PubMed]
- Yin, D.F.; Zhou, X.J.; Li, N.; Liu, H.J.; Yuan, H. Long non-coding RNA SND1-IT1 accelerates cell proliferation, invasion and migration via regulating miR-132-3p/SMAD2 axis in retinoblastoma. Bioengineered 2021, 12, 1189–1201. [Google Scholar] [CrossRef]
- Hu, Y.Z.; Hu, Z.L.; Liao, T.Y.; Li, Y.; Pan, Y.L. LncRNA SND1-IT1 facilitates TGF-beta1-induced epithelial-to-mesenchymal transition via miR-124/COL4A1 axis in gastric cancer. Cell Death Discov. 2022, 8, 73. [Google Scholar] [CrossRef]
- Liu, Z.; Li, Y.; Liu, Y.; Yang, D.; Jiao, Y.; Liu, Y. Expression and clinical significance of BDH1 in liver cancer. Medicine 2021, 100, e28013. [Google Scholar] [CrossRef]
- Han, F.; Zhao, H.; Lu, J.; Yun, W.; Yang, L.; Lou, Y.; Su, D.; Chen, X.; Zhang, S.; Jin, H.; et al. Anti-Tumor Effects of BDH1 in Acute Myeloid Leukemia. Front. Oncol. 2021, 11, 694594. [Google Scholar] [CrossRef]
- Zhang, H.; Chang, Z.; Qin, L.N.; Liang, B.; Han, J.X.; Qiao, K.L.; Yang, C.; Liu, Y.R.; Zhou, H.G.; Sun, T. MTA2 triggered R-loop trans-regulates BDH1-mediated beta-hydroxybutyrylation and potentiates propagation of hepatocellular carcinoma stem cells. Signal Transduct. Target. Ther. 2021, 6, 135. [Google Scholar] [CrossRef] [PubMed]
- Lin, L.; Li, X.; Pan, C.; Lin, W.; Shao, R.; Liu, Y.; Zhang, J.; Luo, Y.; Qian, K.; Shi, M.; et al. ATXN2L upregulated by epidermal growth factor promotes gastric cancer cell invasiveness and oxaliplatin resistance. Cell Death Dis. 2019, 10, 173. [Google Scholar] [CrossRef] [PubMed]
- Iwatsuki, M.; Mimori, K.; Sato, T.; Toh, H.; Yokobori, T.; Tanaka, F.; Ishikawa, K.; Baba, H.; Mori, M. Overexpression of SUGT1 in human colorectal cancer and its clinicopathological significance. Int. J. Oncol. 2010, 36, 569–575. [Google Scholar] [PubMed]
- Zhang, T.J.; Xu, Z.J.; Wen, X.M.; Gu, Y.; Ma, J.C.; Yuan, Q.; Lin, J.; Zhou, J.D.; Qian, J. SLIT2 promoter hypermethylation-mediated SLIT2-IT1/miR-218 repression drives leukemogenesis and predicts adverse prognosis in myelodysplastic neoplasm. Leukemia 2022, 36, 2488–2498. [Google Scholar] [CrossRef]
- Muiño, E.; Cárcel-Márquez, J.; Carrera, C.; Llucià-Carol, L.; Gallego-Fabrega, C.; Cullell, N.; Lledós, M.; Castillo, J.; Sobrino, T.; Campos, F.; et al. RP11-362K2.2:RP11-767I20.1 Genetic Variation Is Associated with Post-Reperfusion Therapy Parenchymal Hematoma. A GWAS Meta-Analysis. J. Clin. Med. 2021, 10, 3137. [Google Scholar] [CrossRef]
- Chen, J.C.; Chang, Y.W.; Hong, C.C.; Yu, Y.H.; Su, J.L. The role of the VEGF-C/VEGFRs axis in tumor progression and therapy. Int. J. Mol. Sci. 2012, 14, 88–107. [Google Scholar] [CrossRef]
- Su, J.L.; Yen, C.J.; Chen, P.S.; Chuang, S.E.; Hong, C.C.; Kuo, I.H.; Chen, H.Y.; Hung, M.C.; Kuo, M.L. The role of the VEGF-C/VEGFR-3 axis in cancer progression. Br. J. Cancer 2007, 96, 541–545. [Google Scholar] [CrossRef] [PubMed]
- Feleke, M.; Feng, W.; Song, Z.; Li, H.; Rothzerg, E.; Wei, Q.; Kõks, S.; Wood, D.; Liu, Y.; Xu, J. Single-cell RNA sequencing reveals differential expression of EGFL7 and VEGF in giant-cell tumor of bone and osteosarcoma. Exp. Biol. Med. 2022, 247, 1214–1227. [Google Scholar] [PubMed]
- Park, H.R.; Min, K.; Kim, H.S.; Jung, W.W.; Park, Y.K. Expression of vascular endothelial growth factor-C and its receptor in osteosarcomas. Pathol. Res. Pract. 2008, 204, 575–582. [Google Scholar] [CrossRef] [PubMed]
- Nathan, S.S.; Huvos, A.G.; Casas-Ganem, J.E.; Yang, R.; Linkov, I.; Sowers, R.; DiResta, G.R.; Gorlick, R.; Healey, J.H. Tumour interstitial fluid pressure may regulate angiogenic factors in osteosarcoma. Ann. Acad Med. Singap. 2009, 38, 1041–1047. [Google Scholar] [PubMed]
- Modi, A.; Vai, S.; Caramelli, D.; Lari, M. The Illumina Sequencing Protocol and the NovaSeq 6000 System. Methods Mol. Biol. 2021, 2242, 15–42. [Google Scholar] [PubMed]
- Sewe, S.O.; Silva, G.; Sicat, P.; Seal, S.E.; Visendi, P. Trimming and Validation of Illumina Short Reads Using Trimmomatic, Trinity Assembly, and Assessment of RNA-Seq Data. Methods Mol. Biol. 2022, 2443, 211–232. [Google Scholar]
- Bolger, A.M.; Lohse, M.; Usadel, B. Trimmomatic: A flexible trimmer for Illumina sequence data. Bioinformatics 2014, 30, 2114–2120. [Google Scholar] [CrossRef]
- Dobin, A.; Davis, C.A.; Schlesinger, F.; Drenkow, J.; Zaleski, C.; Jha, S.; Batut, P.; Chaisson, M.; Gingeras, T.R. STAR: Ultrafast universal RNA-seq aligner. Bioinformatics 2013, 29, 15–21. [Google Scholar] [CrossRef]
- Guo, J.-C.; Fang, S.-S.; Wu, Y.; Zhang, J.-H.; Chen, Y.; Liu, J.; Wu, B.; Wu, J.-R.; Li, E.-M.; Xu, L.-Y.; et al. CNIT: A fast and accurate web tool for identifying protein-coding and long non-coding transcripts based on intrinsic sequence composition. Nucleic Acids Res. 2019, 47, W516–W522. [Google Scholar] [CrossRef]
- Cao, Z.; Pan, X.; Yang, Y.; Huang, Y.; Shen, H.B. The lncLocator: A subcellular localization predictor for long non-coding RNAs based on a stacked ensemble classifier. Bioinformatics 2018, 34, 2185–2194. [Google Scholar] [CrossRef]
- Gong, J.; Shao, D.; Xu, K.; Lu, Z.; Lu, Z.J.; Yang, Y.; Zhang, Q.C. RISE: A database of RNA interactome from sequencing experiments. Nucleic Acids Res. 2018, 46, D194–D201. [Google Scholar] [CrossRef]


| Patient ID | Tumour | Normal | YoB * | AtDi * | Vital status | Treatment Options | AtDe * | Outcome |
|---|---|---|---|---|---|---|---|---|
| Q18B006524D | A28 | A8 | 1944 | 74 | Dead | No chemotherapy | 74 | Died from the disease |
| Q13B004130D | A9 | A3 | 1990 | 22 | Dead | Chemotherapy and wide resection | 26 | Died from the disease |
| Q17B001640B | B5 | B1 | 1992 | 24 | Alive | Chemotherapy and wide resection | Alive with no evidence of the disease | |
| Q10B040965M | A4 | A55 | 1990 | 20 | Alive | Chemotherapy and wide resection | Alive with no evidence of the disease | |
| Q16B040208X | A33 | A25 | 1999 | 17 | Dead | Chemotherapy and wide resection | 18 | Died from the disease |
| Q19B013567K | A1 | - | 1956 | 63 | Dead | Chemotherapy and wide resection | 64 | Died from the disease |
| Q18B028621H | A4 | A1 | 1992 | 26 | Alive | Chemotherapy and wide resection | Alive with no evidence of the disease | |
| Q09B042936F | B21 | B9 | 1992 | 17 | Alive | Chemotherapy and wide resection | Alive with no evidence of the disease | |
| Q08B047467N | A18 | A3 | 1994 | 14 | Alive | Chemotherapy and wide resection | Alive with no evidence of the disease | |
| Q11B045903J | A5 | A31 | 1985 | 25 | Alive | Chemotherapy and wide resection | Lost to follow up | |
| Q14B020064N | A9 | A1 | 1990 | 24 | Alive | Chemotherapy and AKA* | Alive with no evidence of the disease | |
| Q05B030211M | A29 | A30 | 1988 | 17 | Alive | Chemotherapy and AKA | Alive with no evidence of the disease | |
| Q18B014955A | A15 | A23 | 2001 | 17 | Dead | Chemotherapy and wide resection | 18 | Died from the disease |
| Q19B005830Y | A2 | - | 2002 | 17 | Alive | Chemotherapy and wide resection | Alive with metastasis of the disease | |
| Q16B027819Y | A23 | A16 | 1995 | 17 | Alive | Chemotherapy and wide resection | Alive with no evidence of the disease | |
| Q19B001229R | A30 | A22 | 2005 | 13 | Alive | Chemotherapy and wide resection | Alive with no evidence of the disease | |
| Q01B033022A | B2 | A1 | 1985 | 16 | Dead | Chemotherapy and AKA | 17 | Died from the disease |
| Q12B042591T | A1 | - | 1995 | 16 | Dead | Chemotherapy and wide resection | 18 | Died from the disease |
| Q15B001034Y | A15 | B1 | 1995 | 19 | Dead | Chemotherapy | 20 | Died from the disease |
| Q04B025963T | B28 | A1 | 1988 | 16 | Alive | Chemotherapy AKA | Alive with no evidence of the disease | |
| Q17B009637R | A2 | B1 | 1997 | 19 | Alive | Chemotherapy and wide resection | Alive with no evidence of the disease | |
| Q17B018941H | A12 | B1 | 1981 | 36 | Dead | Chemotherapy | 37 | Died from the disease |
| Q17B029593M | A7 | A23 | 1994 | 23 | Dead | Chemotherapy | 26 | Died from the disease |
| Q18B051017F | A1 | A16 | 1949 | 69 | Dead | Chemotherapy | 71 | Died from the disease |
| Q02B032169Y | B18 | B12 | 1988 | 14 | Dead | Chemotherapy and AKA | 17 | Died from the disease |
| Q05B009812W | A29 | A32 | 1983 | 21 | Alive | Chemotherapy and wide resection | Alive with no evidence of the disease | |
| Q19B051495P | B19 | A2 | 2005 | 14 | Alive | Chemotherapy | Alive with no evidence of the disease | |
| Q19B052024A | B2 | B6 | 1983 | 36 | Alive | Wide resection and no chemotherapy | Alive with no evidence of the disease | |
| Q17B045995J | A5 | A29 | 1939 | 78 | Dead | No chemotherapy | 80 | Died from the disease |
| Q12B019249N | A28 | A34 | 1992 | 20 | Dead | Chemotherapy and wide resection | 21 | Died from the disease |
| Q17B034037Y | B20 | B2 | 1996 | 21 | Dead | Chemotherapy | 22 | Died from the disease |
| Q19B035672T | A1 | - | 1986 | 33 | Alive | Chemotherapy | Alive with no evidence of the disease | |
| Q18B034715Y | A6 | A11 | 1999 | 19 | Alive | Chemotherapy | Alive with metastasis of the disease | |
| Q13B008611L | A13 | A5 | 1997 | 15 | Alive | Chemotherapy and wide resection | Alive with no evidence of the disease | |
| Q12B044305A | A45 | A16 | 1988 | 26 | Alive | Chemotherapy | Alive with no evidence of the disease | |
| Q18B018266Y | A1 | E1 | 1960 | 58 | Dead | Chemotherapy | 58 | Died from the disease |
| Q16B037369B | A8 | A40 | 2003 | 13 | Alive | Chemotherapy and wide resection | Alive with no evidence of the disease | |
| Q14B024855K | A15 | A29 | 1997 | 17 | Alive | Chemotherapy and wide resection | Alive with no evidence of the disease | |
| Q19B007088F | B10 | B22 | 2001 | 17 | Alive | Chemotherapy | Alive with metastasis of the disease | |
| Q13B020599E | B5 | C3 | 1997 | 15 | Dead | Chemotherapy and wide resection | 18 | Died from the disease |
| Q13B012216B | A21 | A7 | 1993 | 19 | Dead | Chemotherapy and wide resection | 24 | Died from the disease |
| Q05B005169W | B7 | A1 | 1995 | 10 | Alive | Chemotherapy and wide resection | Alive with no evidence of the disease | |
| Q13B011918Y | B10 | B36 | 1993 | 19 | Alive | Chemotherapy and wide resection | Alive with no evidence of the disease | |
| Q17B045840Y | A23 | A17 | 2000 | 17 | Alive | Wide resection and no chemotherapy | Alive with no evidence of the disease | |
| Q18B009680H | A1 | - | 2001 | 17 | Dead | Chemotherapy | 18 | Died from the disease |
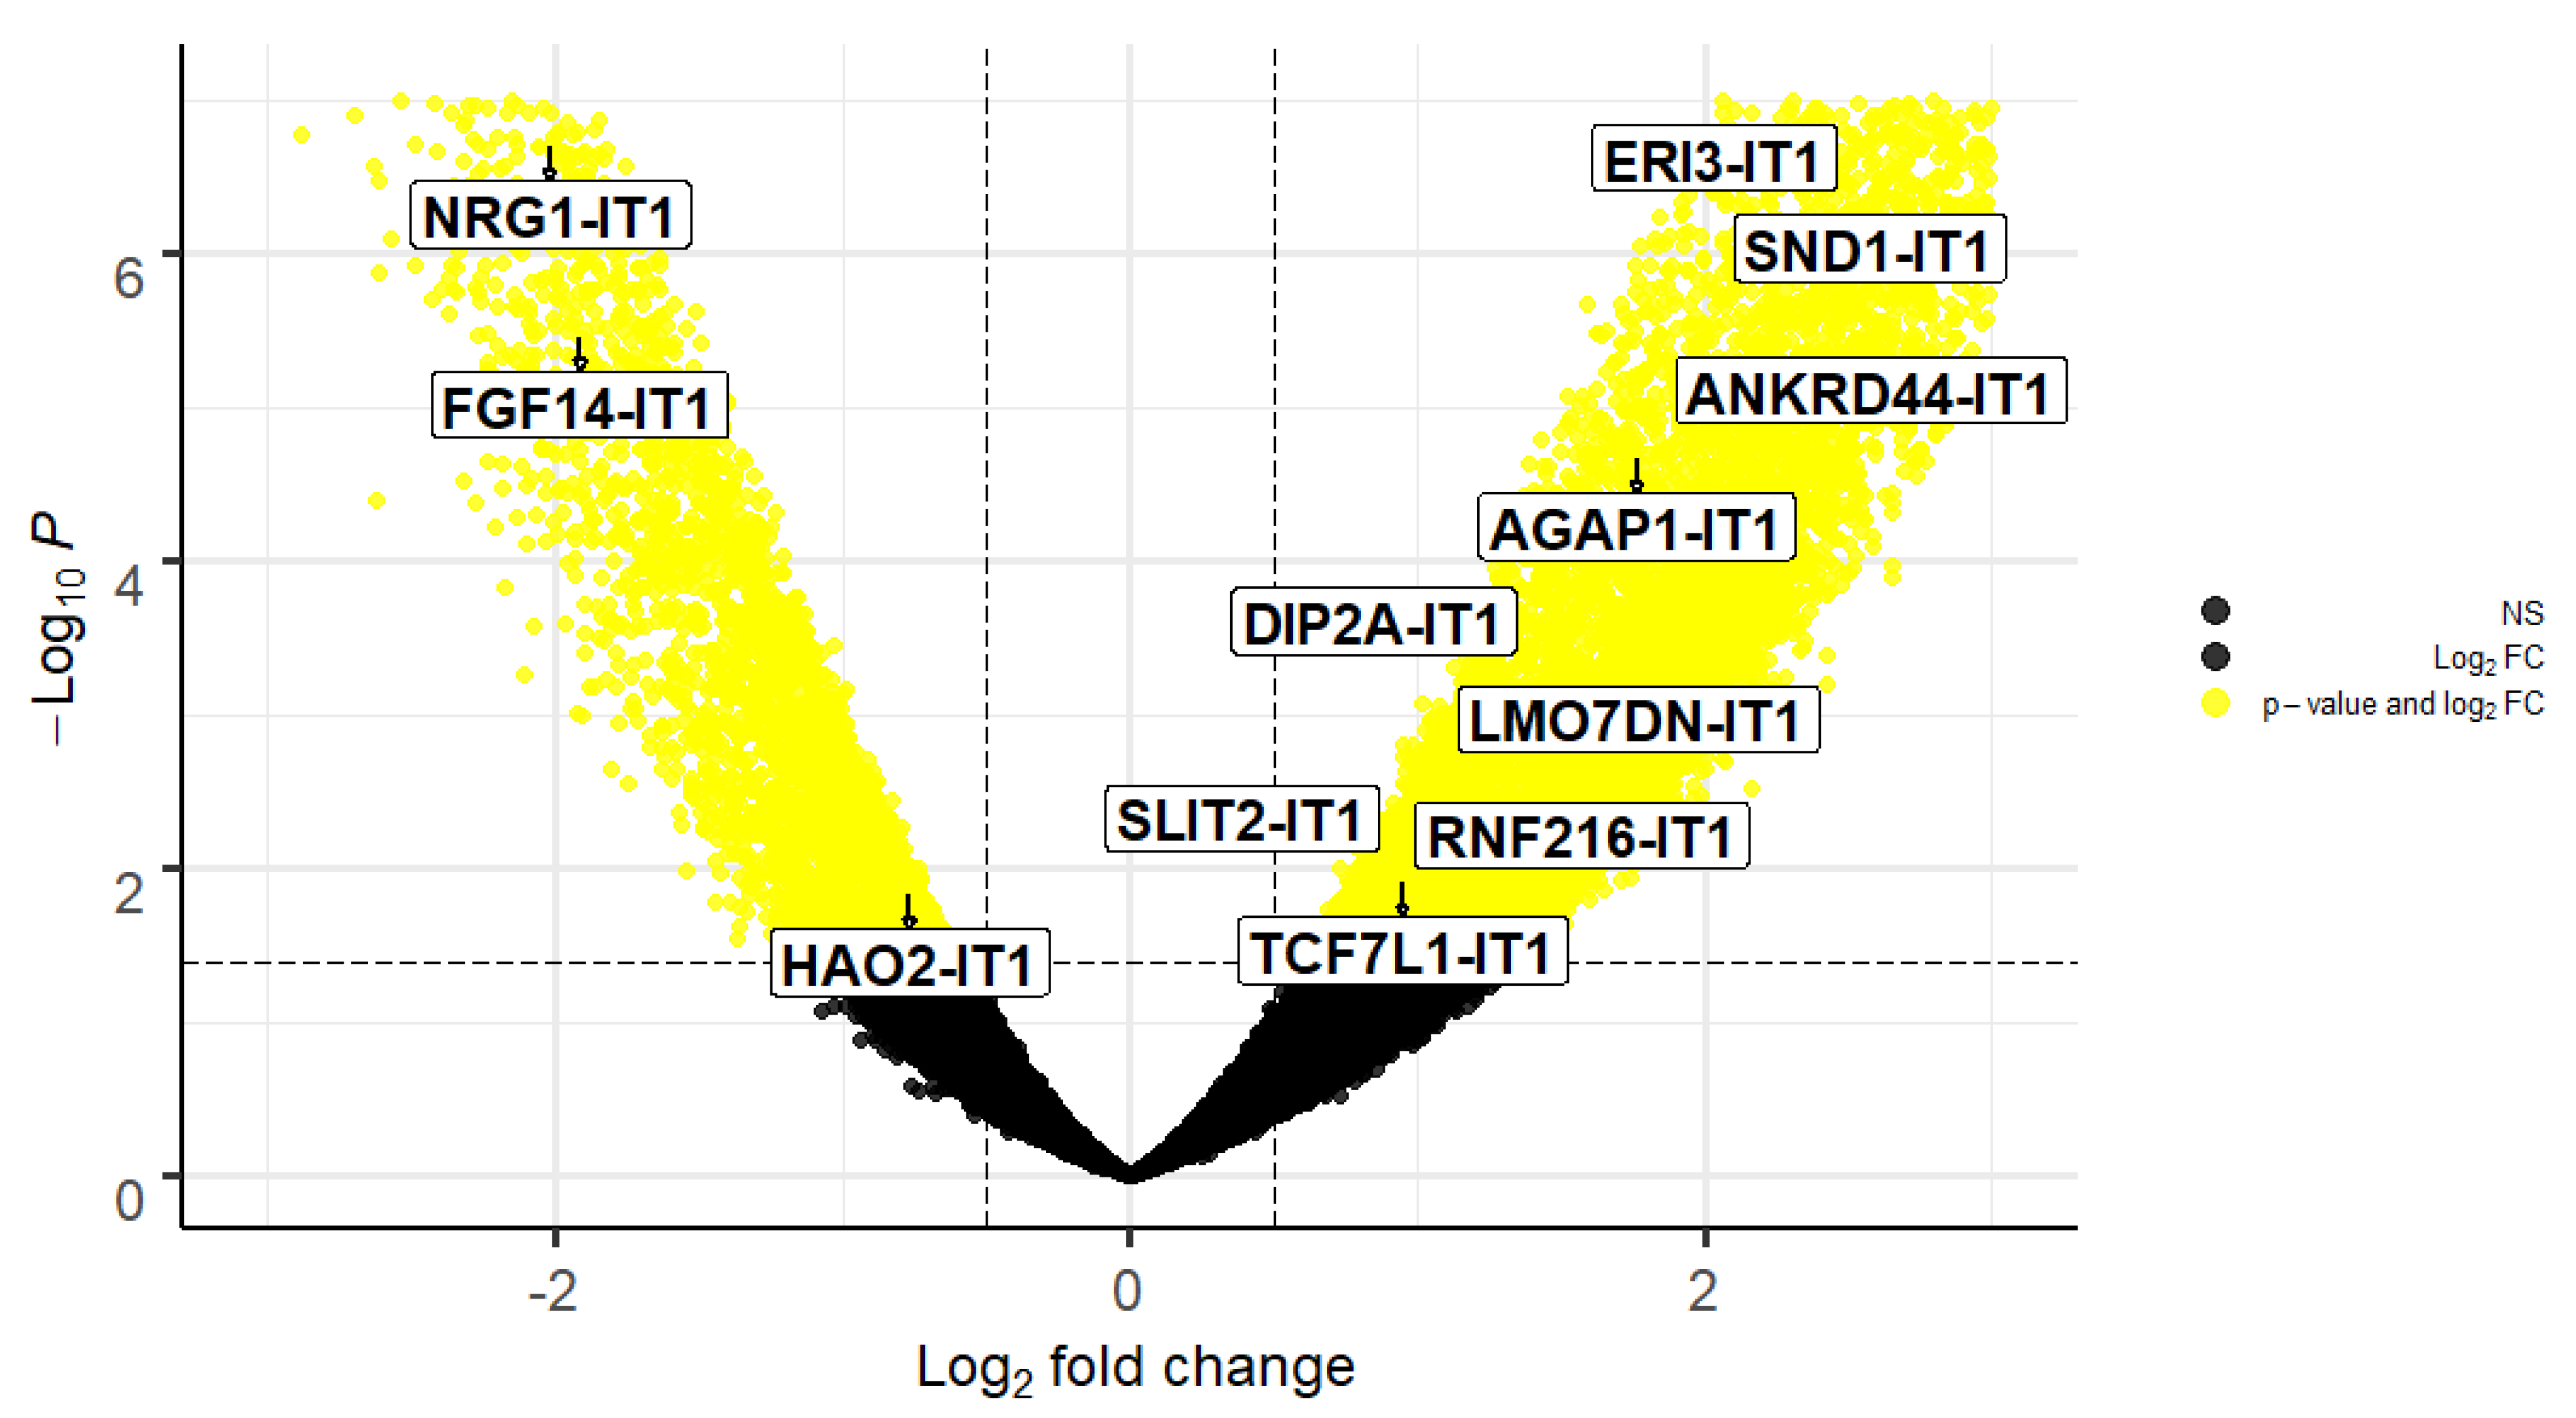
| ENSEMBL | Gene Name | Symbol | Log2Fold-Change | p-Value | padj |
|---|---|---|---|---|---|
| ENSG00000233602 | ERI3 intronic transcript 1 | ERI3-IT1 | 2.100851605 | 1.16 × 10⁻⁷ | 4.09 x10⁻⁶ |
| ENSG00000253974 | NRG1 intronic transcript 1 | NRG1-IT1 | −2.018042879 | 2.05 x 10⁻⁷ | 6.41 x10⁻⁵ |
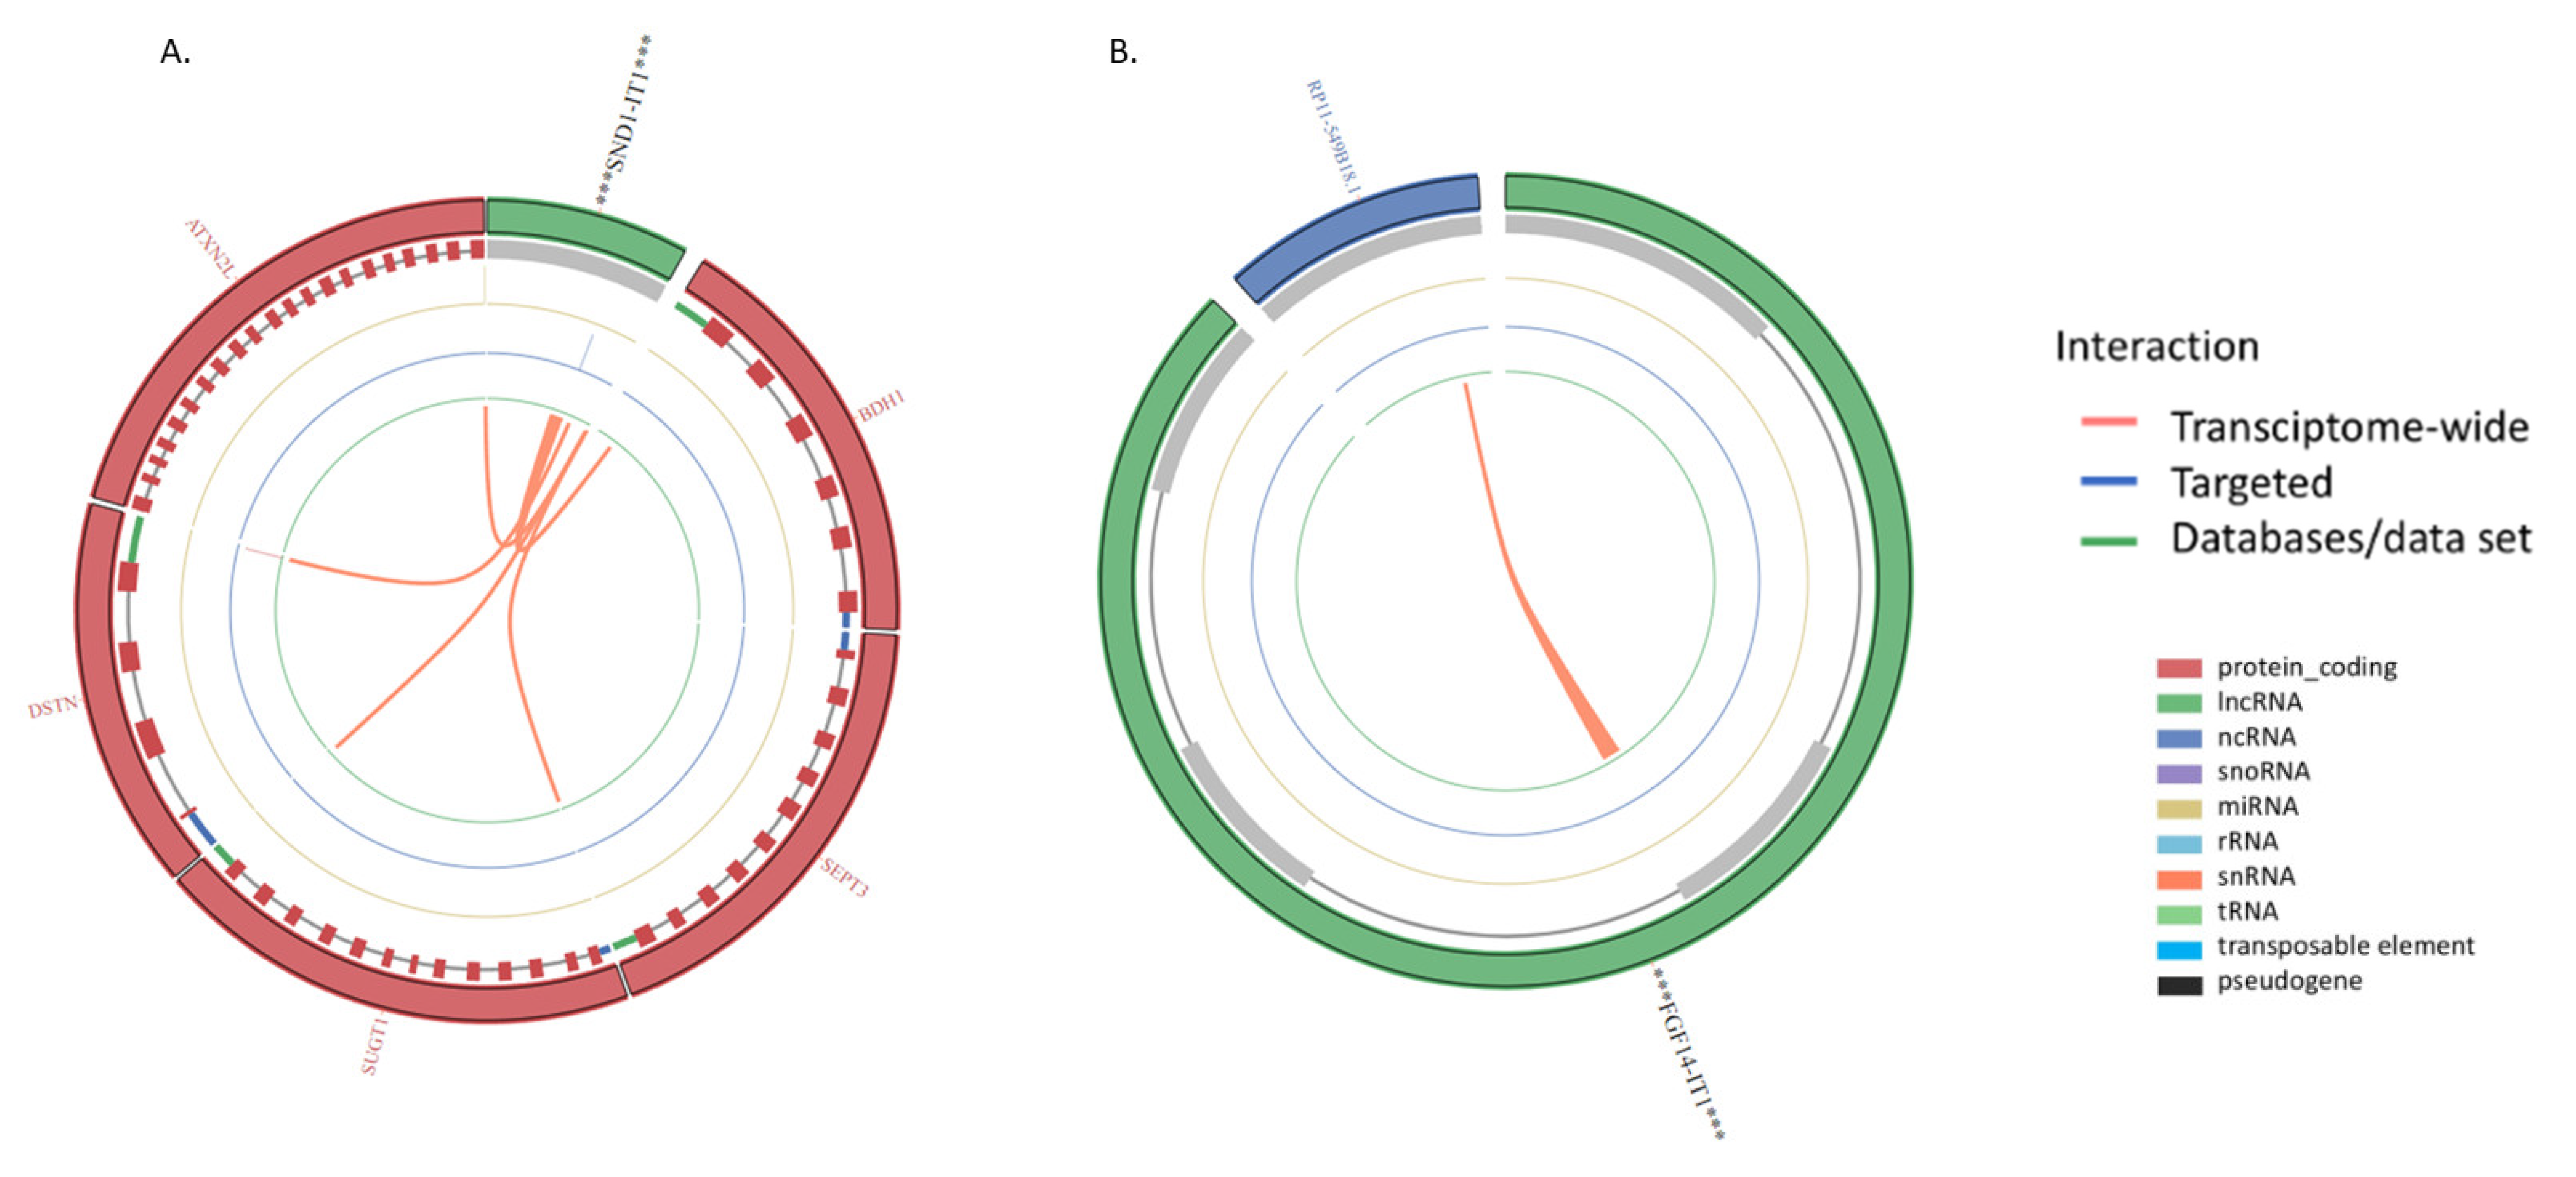
| ENSG00000279078 | SND1 intronic transcript 1 | SND1-IT1 | 2.381895579 | 1.80 x 10⁻⁶ | 3.64 x10⁻⁵ |
| ENSG00000243319 | FGF14 intronic transcript 1 | FGF14-IT1 | −1.915326152 | 3.54 x 10⁻⁶ | 6.22 x10⁻⁵ |
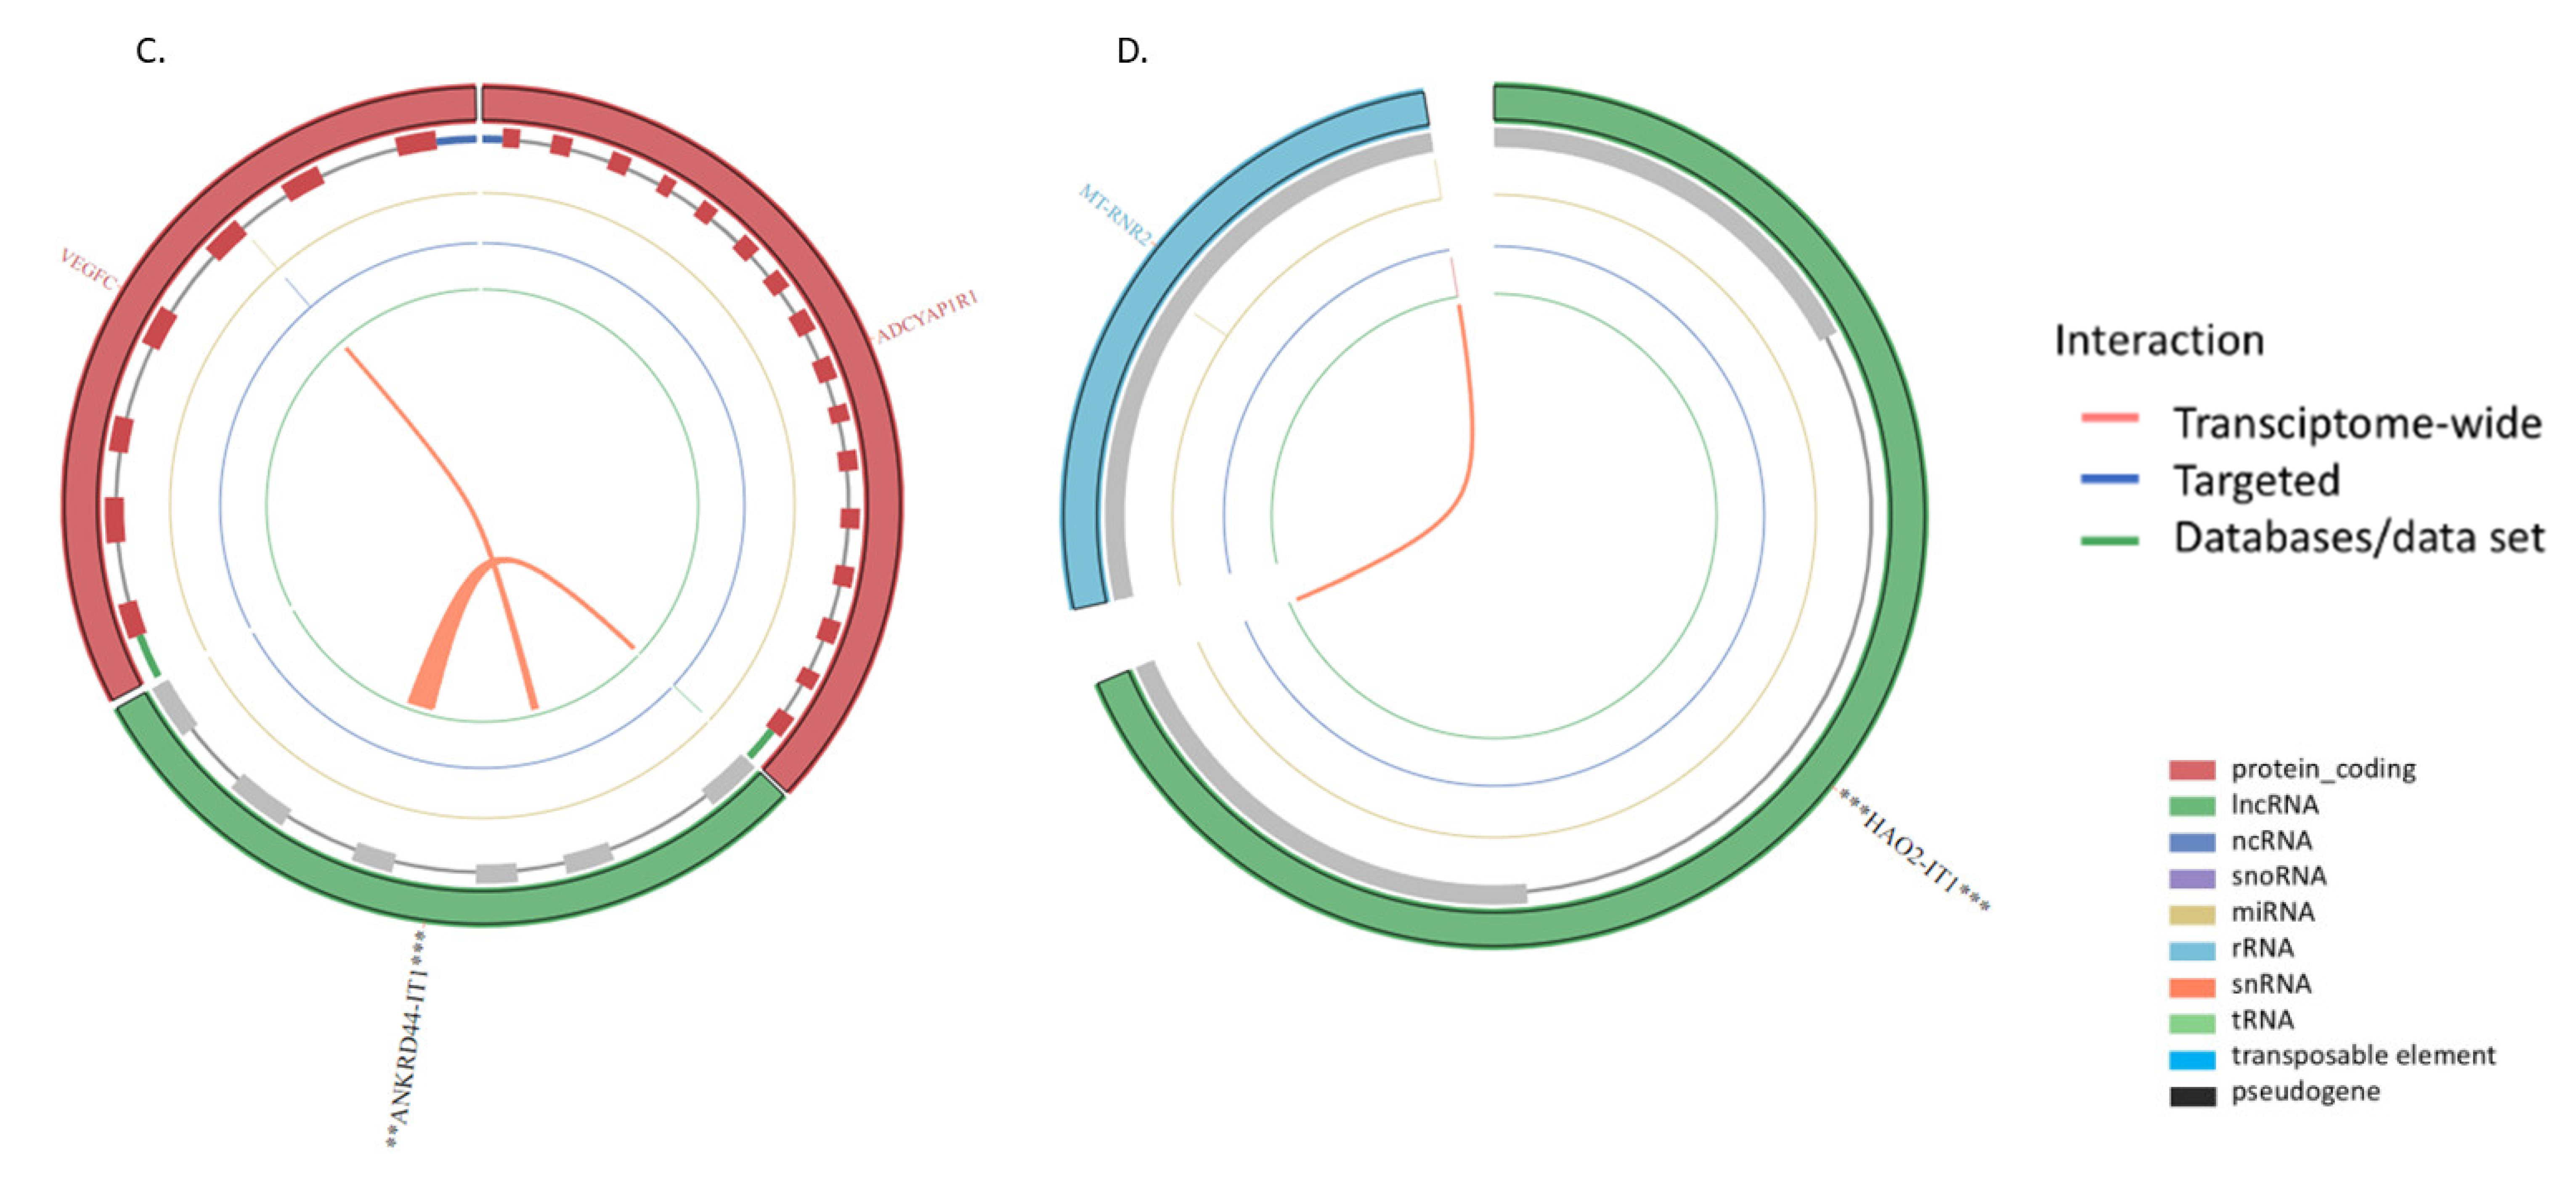
| ENSG00000236977 | ANKRD44 intronic transcript 1 | ANKRD44-IT1 | 2.03255465 | 1.52 x10⁻⁵ | 0.000197273 |
| ENSG00000235529 | AGAP1 intronic transcript 1 | AGAP1-IT1 | 1.762735181 | 2.18 x10⁻⁵ | 0.000262087 |
| ENSG00000223692 | DIP2A intronic transcript 1 | DIP2A-IT1 | 1.122484746 | 0.000484393 | 0.003011991 |
| ENSG00000223458 | LMO7DN intronic transcript 1 | LMO7DN-IT1 | 1.103657774 | 0.001667561 | 0.007934539 |
| ENSG00000248228 | SLIT2 intronic transcript 1 | SLIT2-IT1 | 0.905390354 | 0.004889451 | 0.018302346 |
| ENSG00000237738 | RNF216 intronic transcript 1 | RNF216-IT1 | 0.951215789 | 0.008326804 | 0.027567856 |
| ENSG00000231134 | TCF7L1 intronic transcript 1 | TCF7L1-IT1 | 0.951045146 | 0.012385694 | 0.037228194 |
| ENSG00000230921 | HAO2 intronic transcript 1 | HAO2-IT1 | −0.766349343 | 0.014926443 | 0.042897412 |
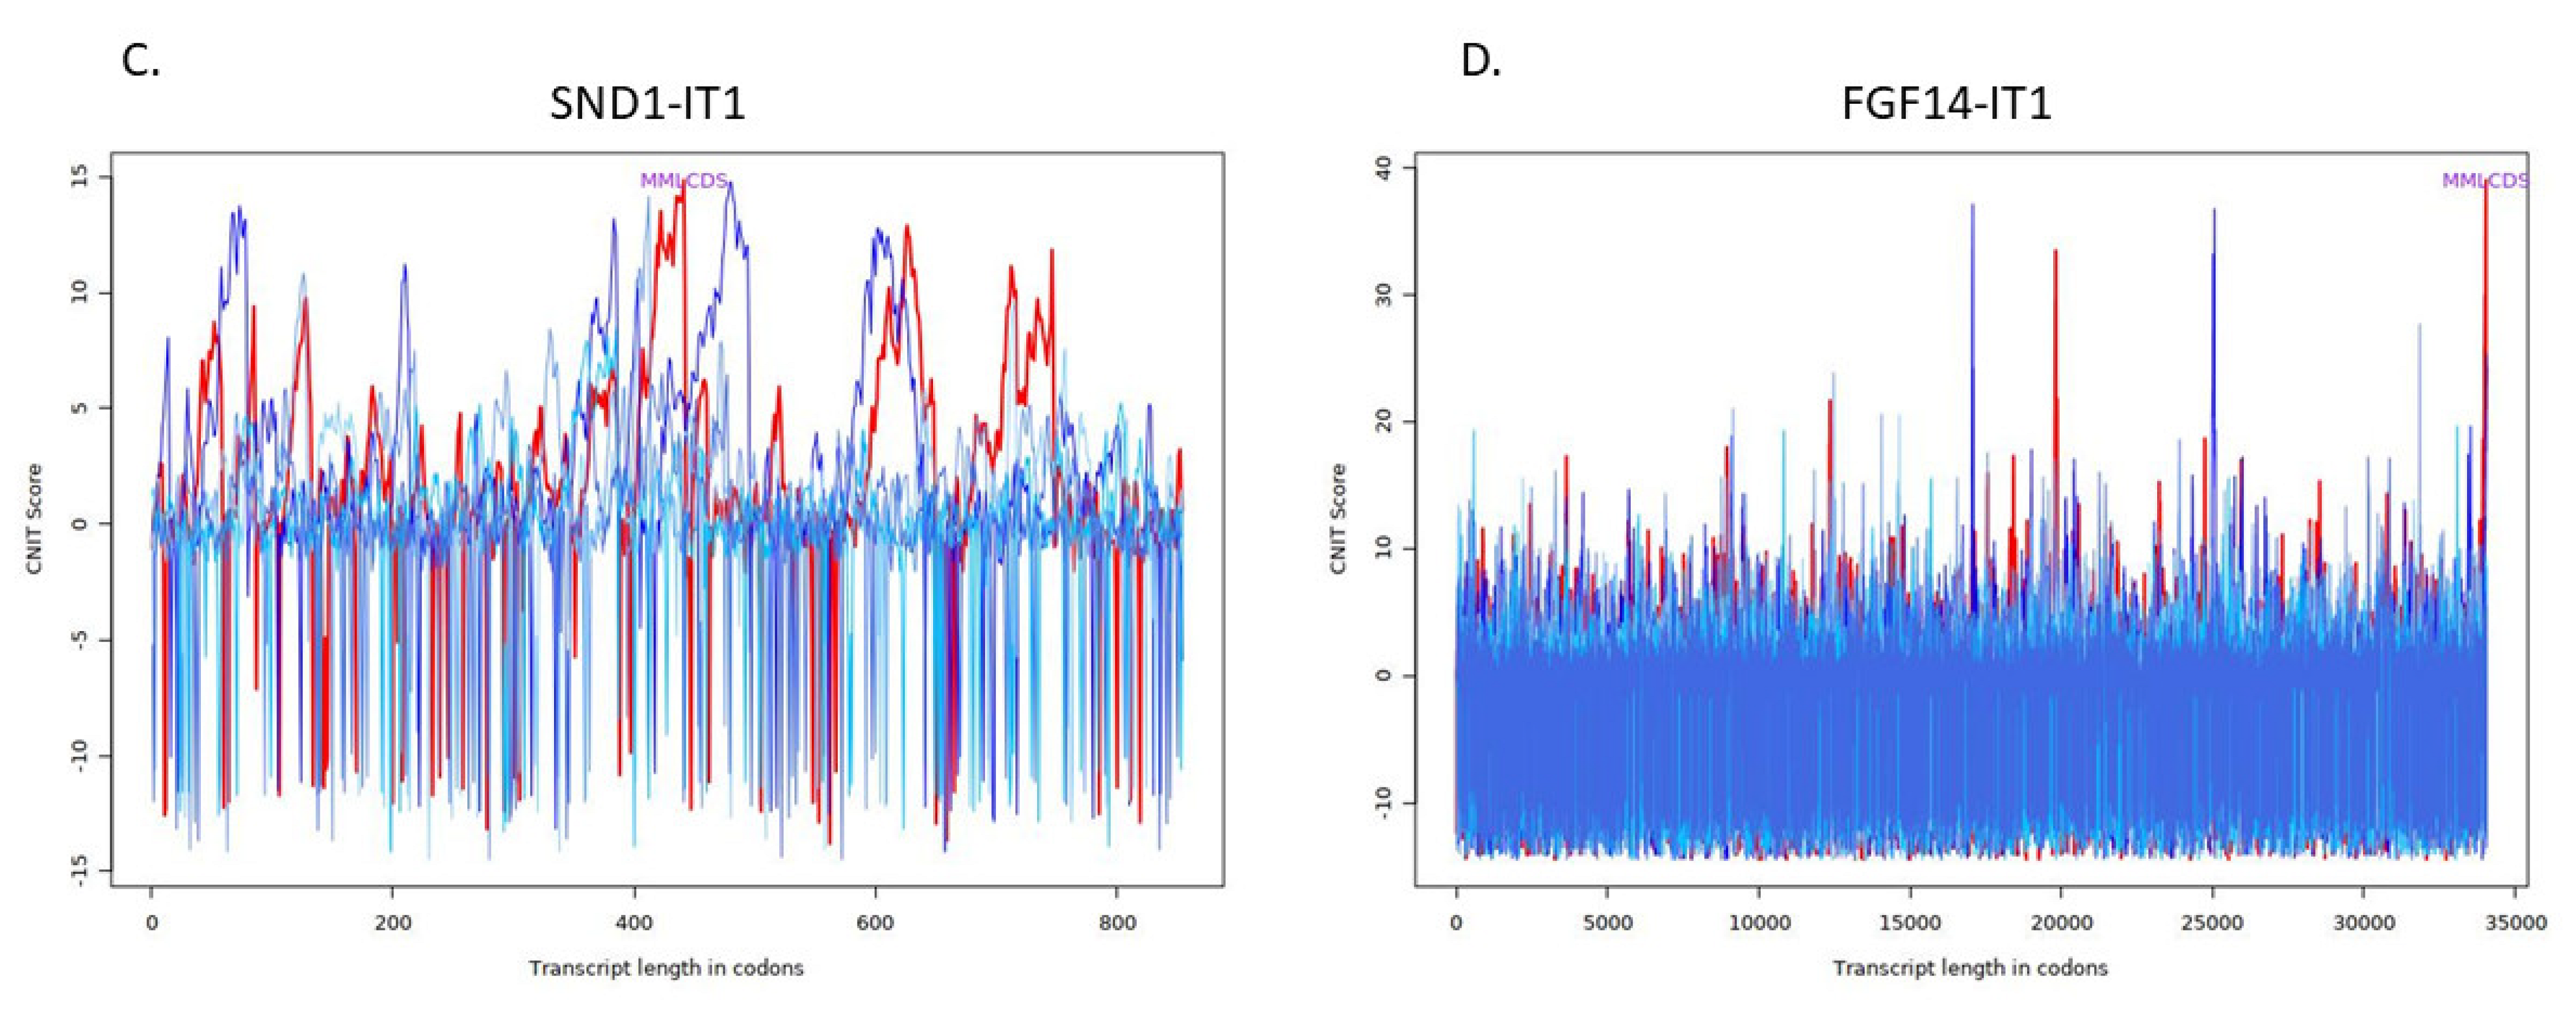
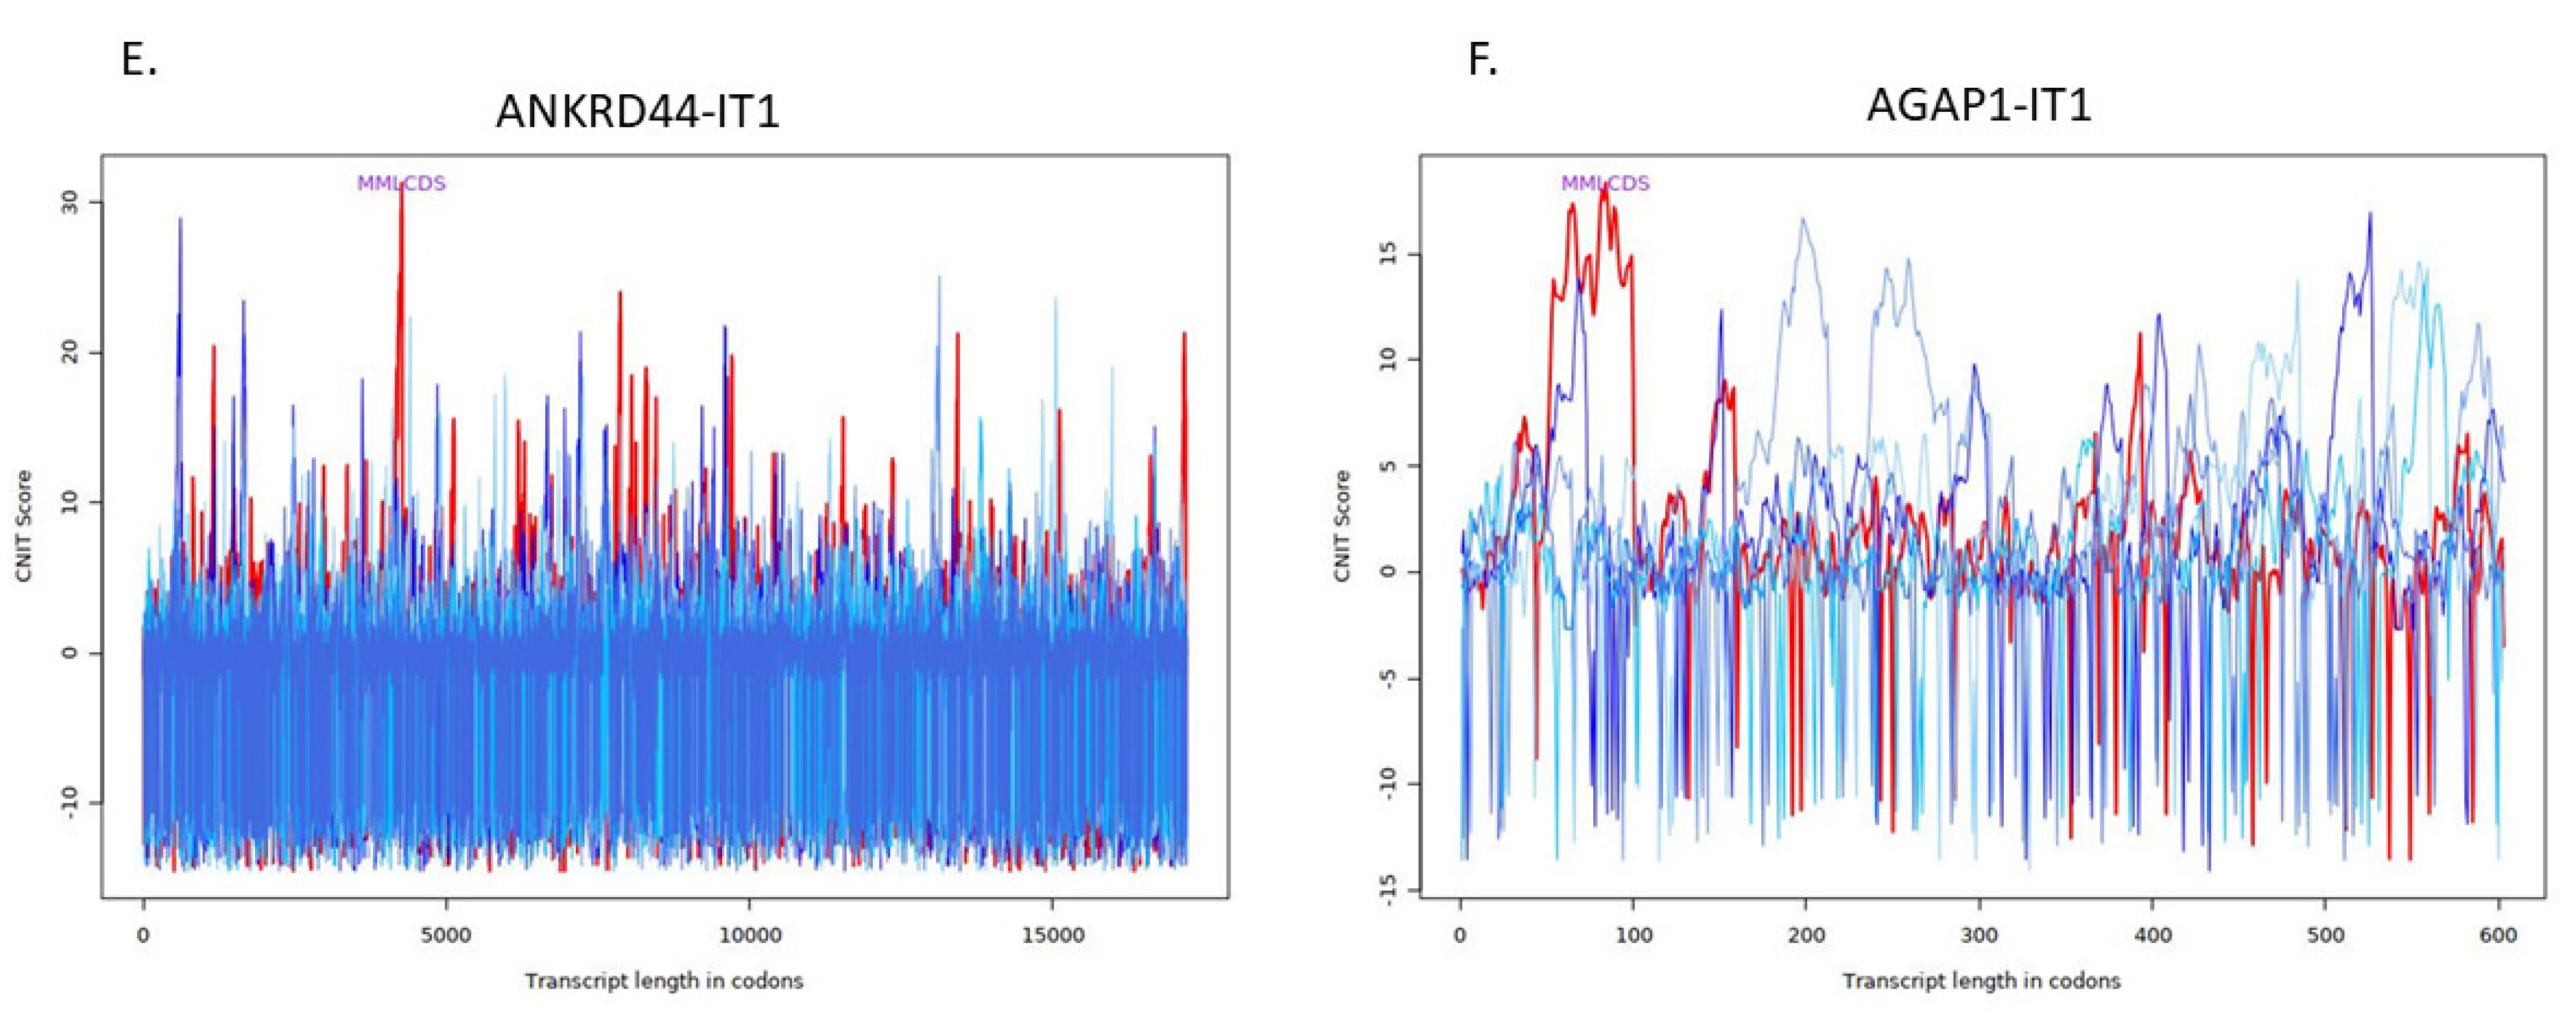
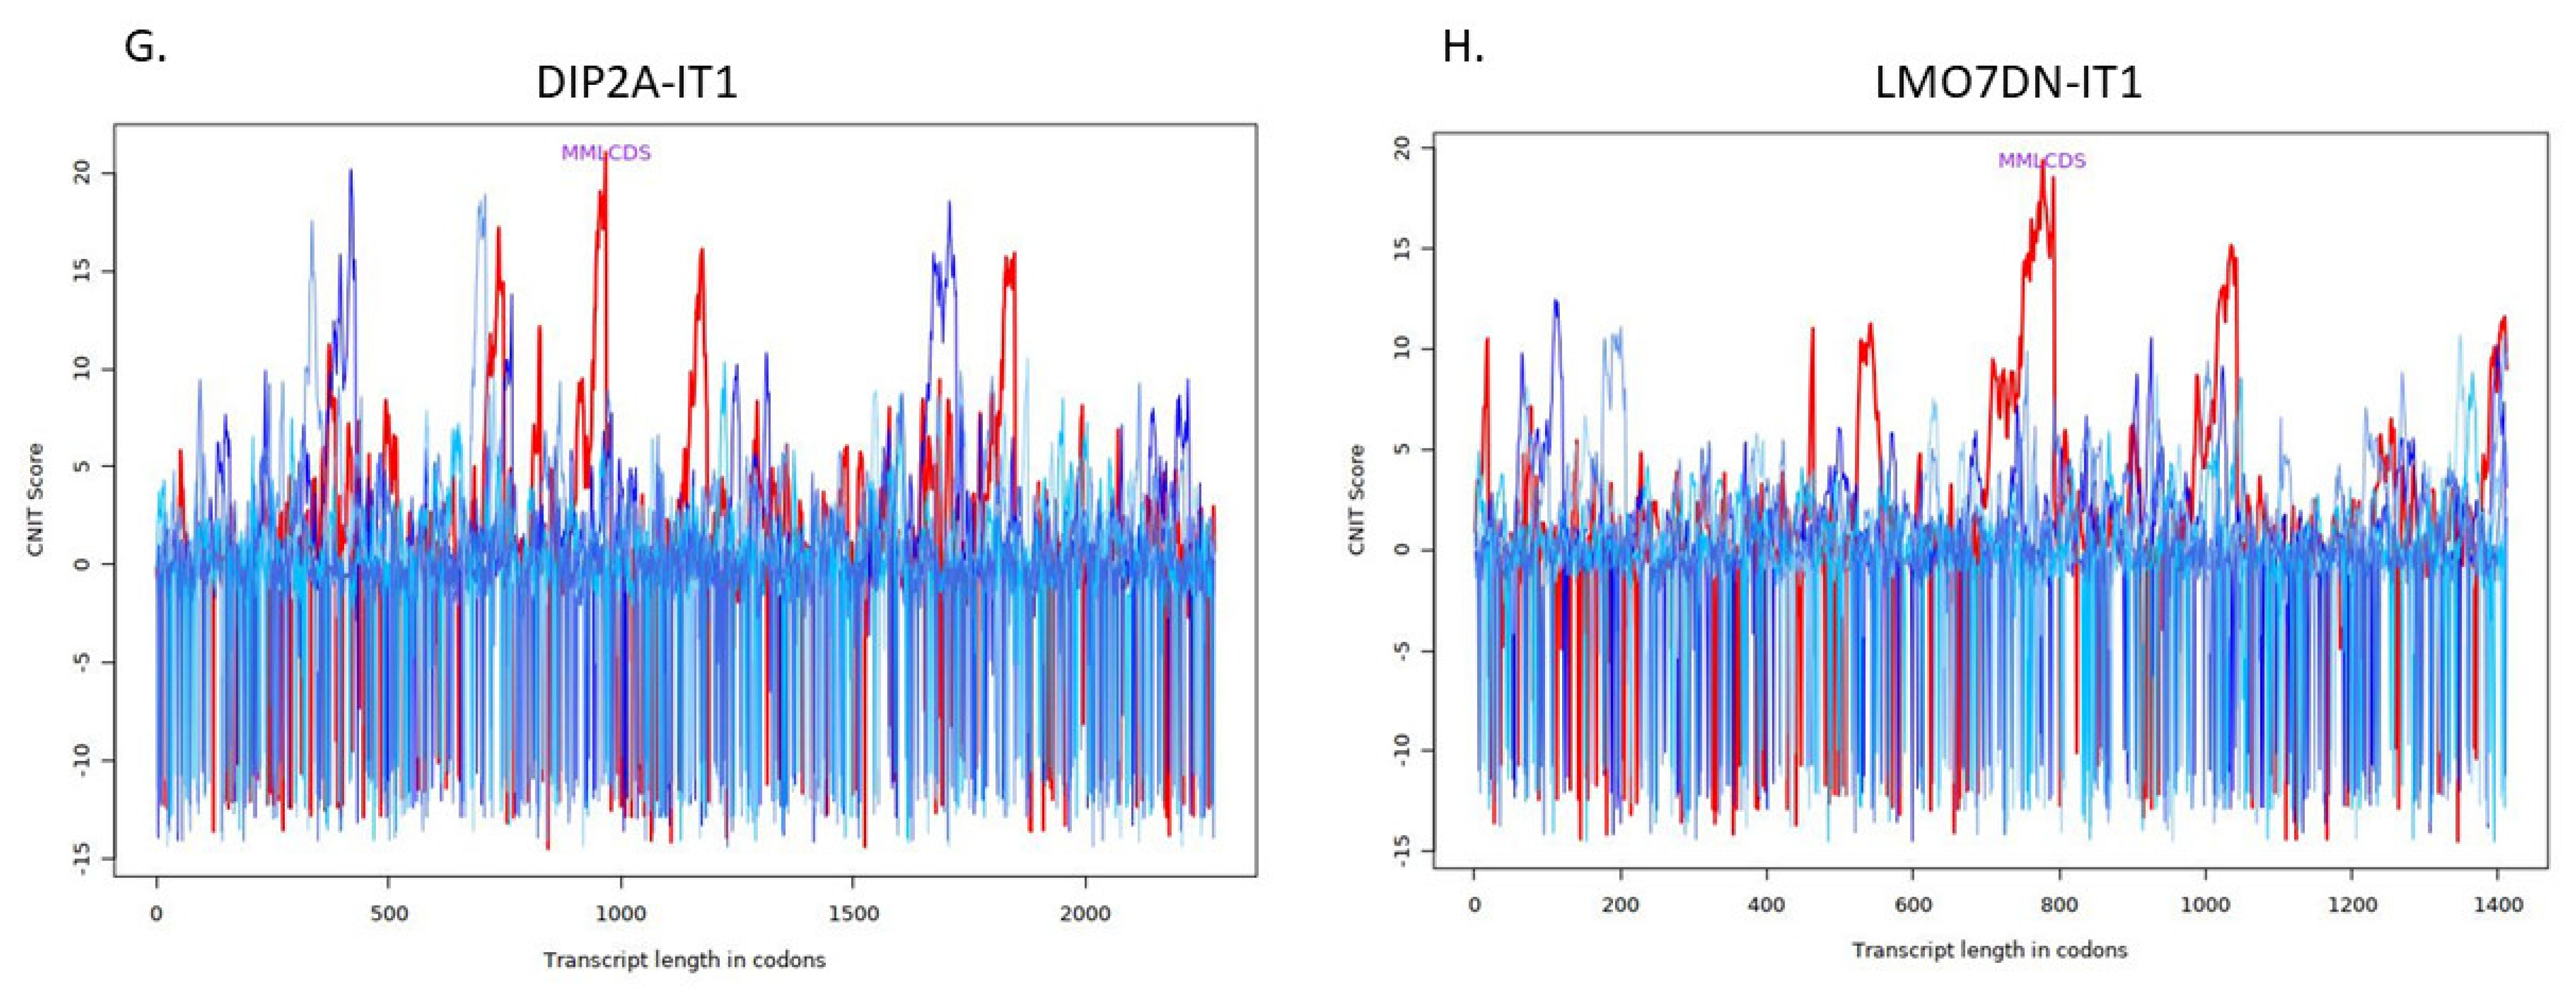
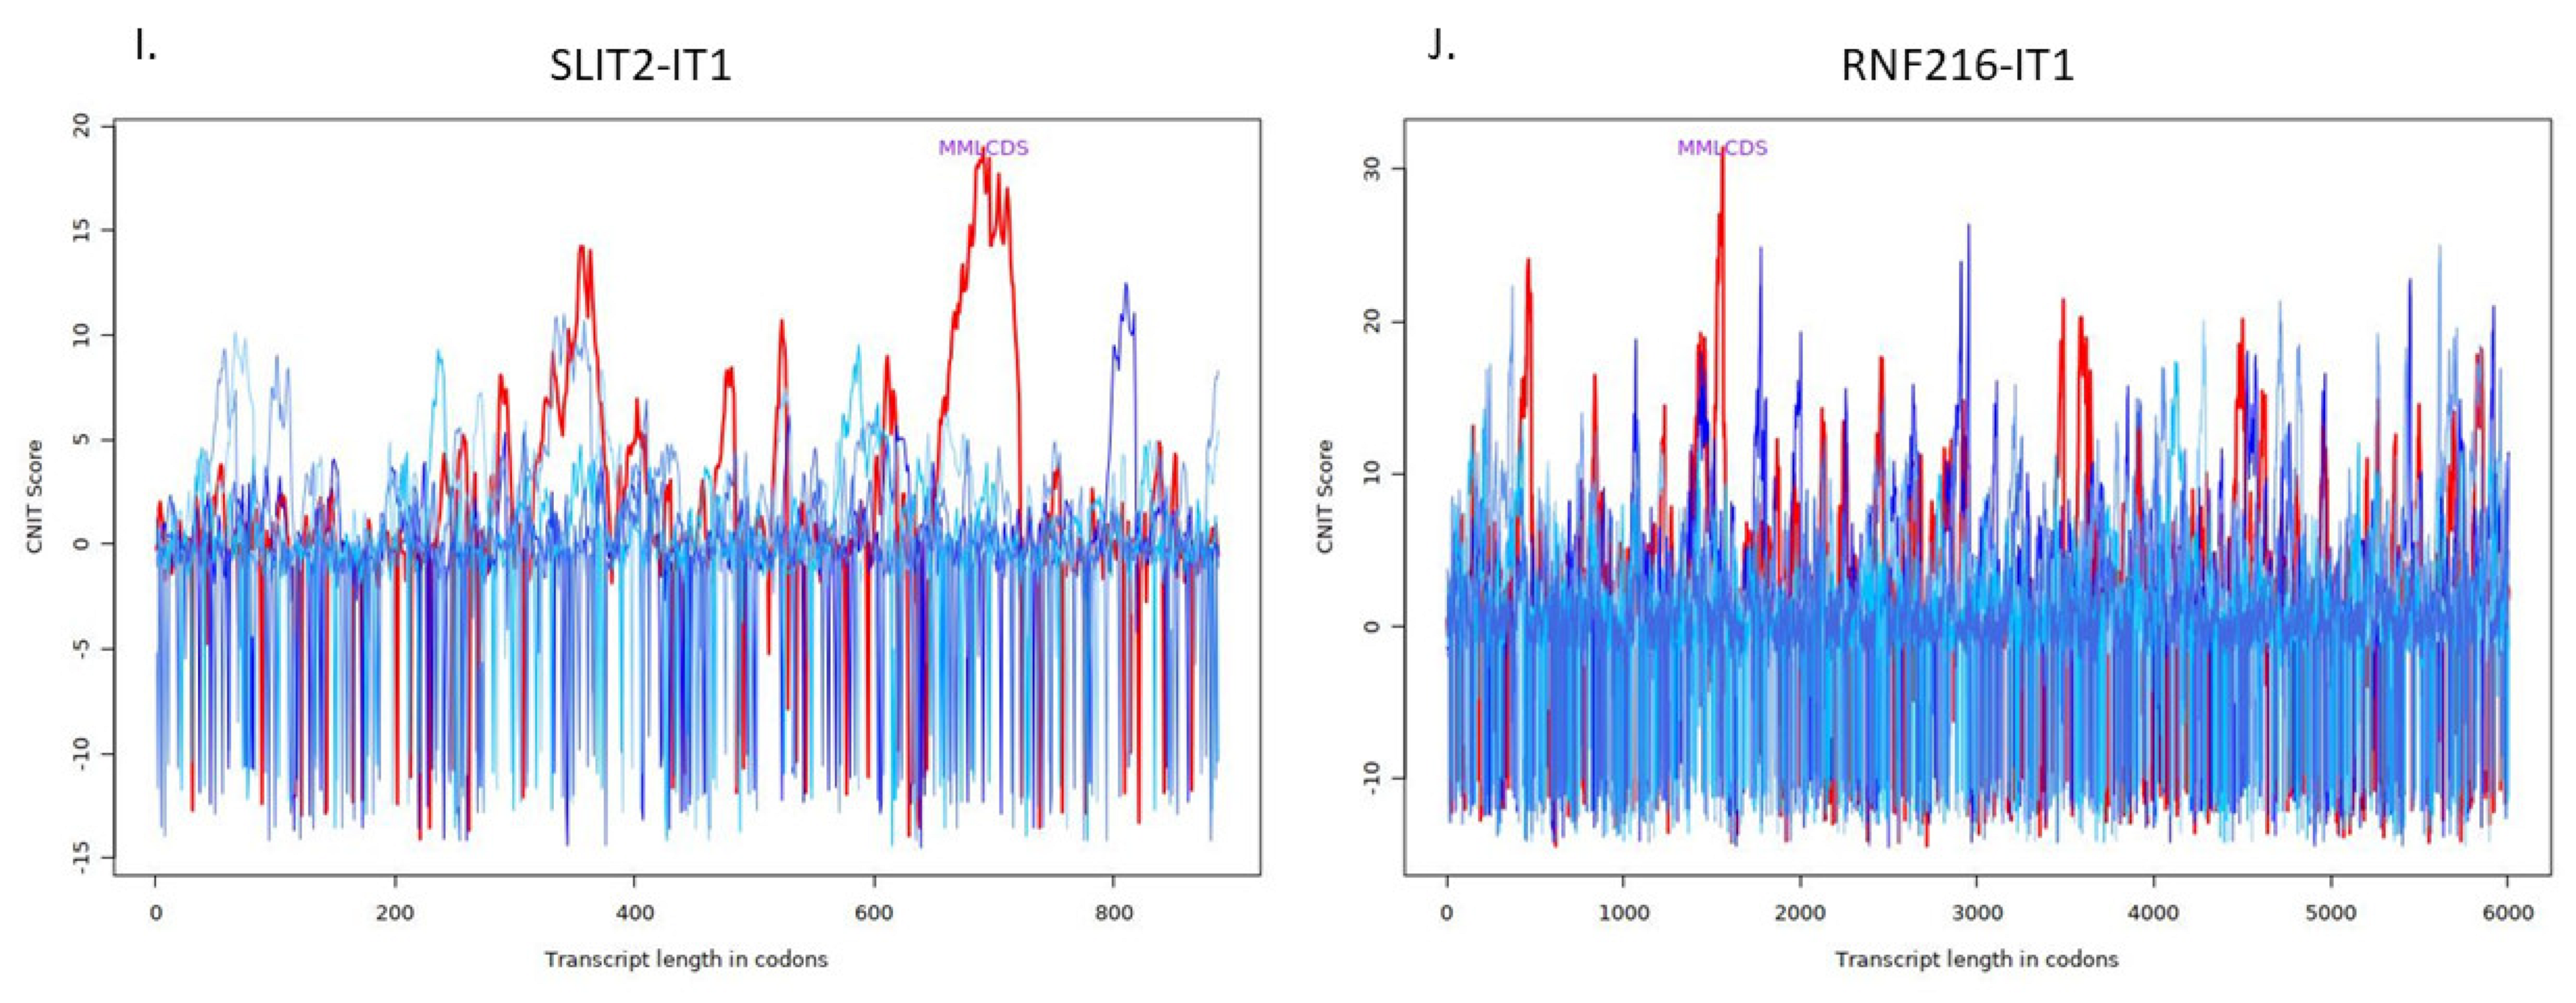
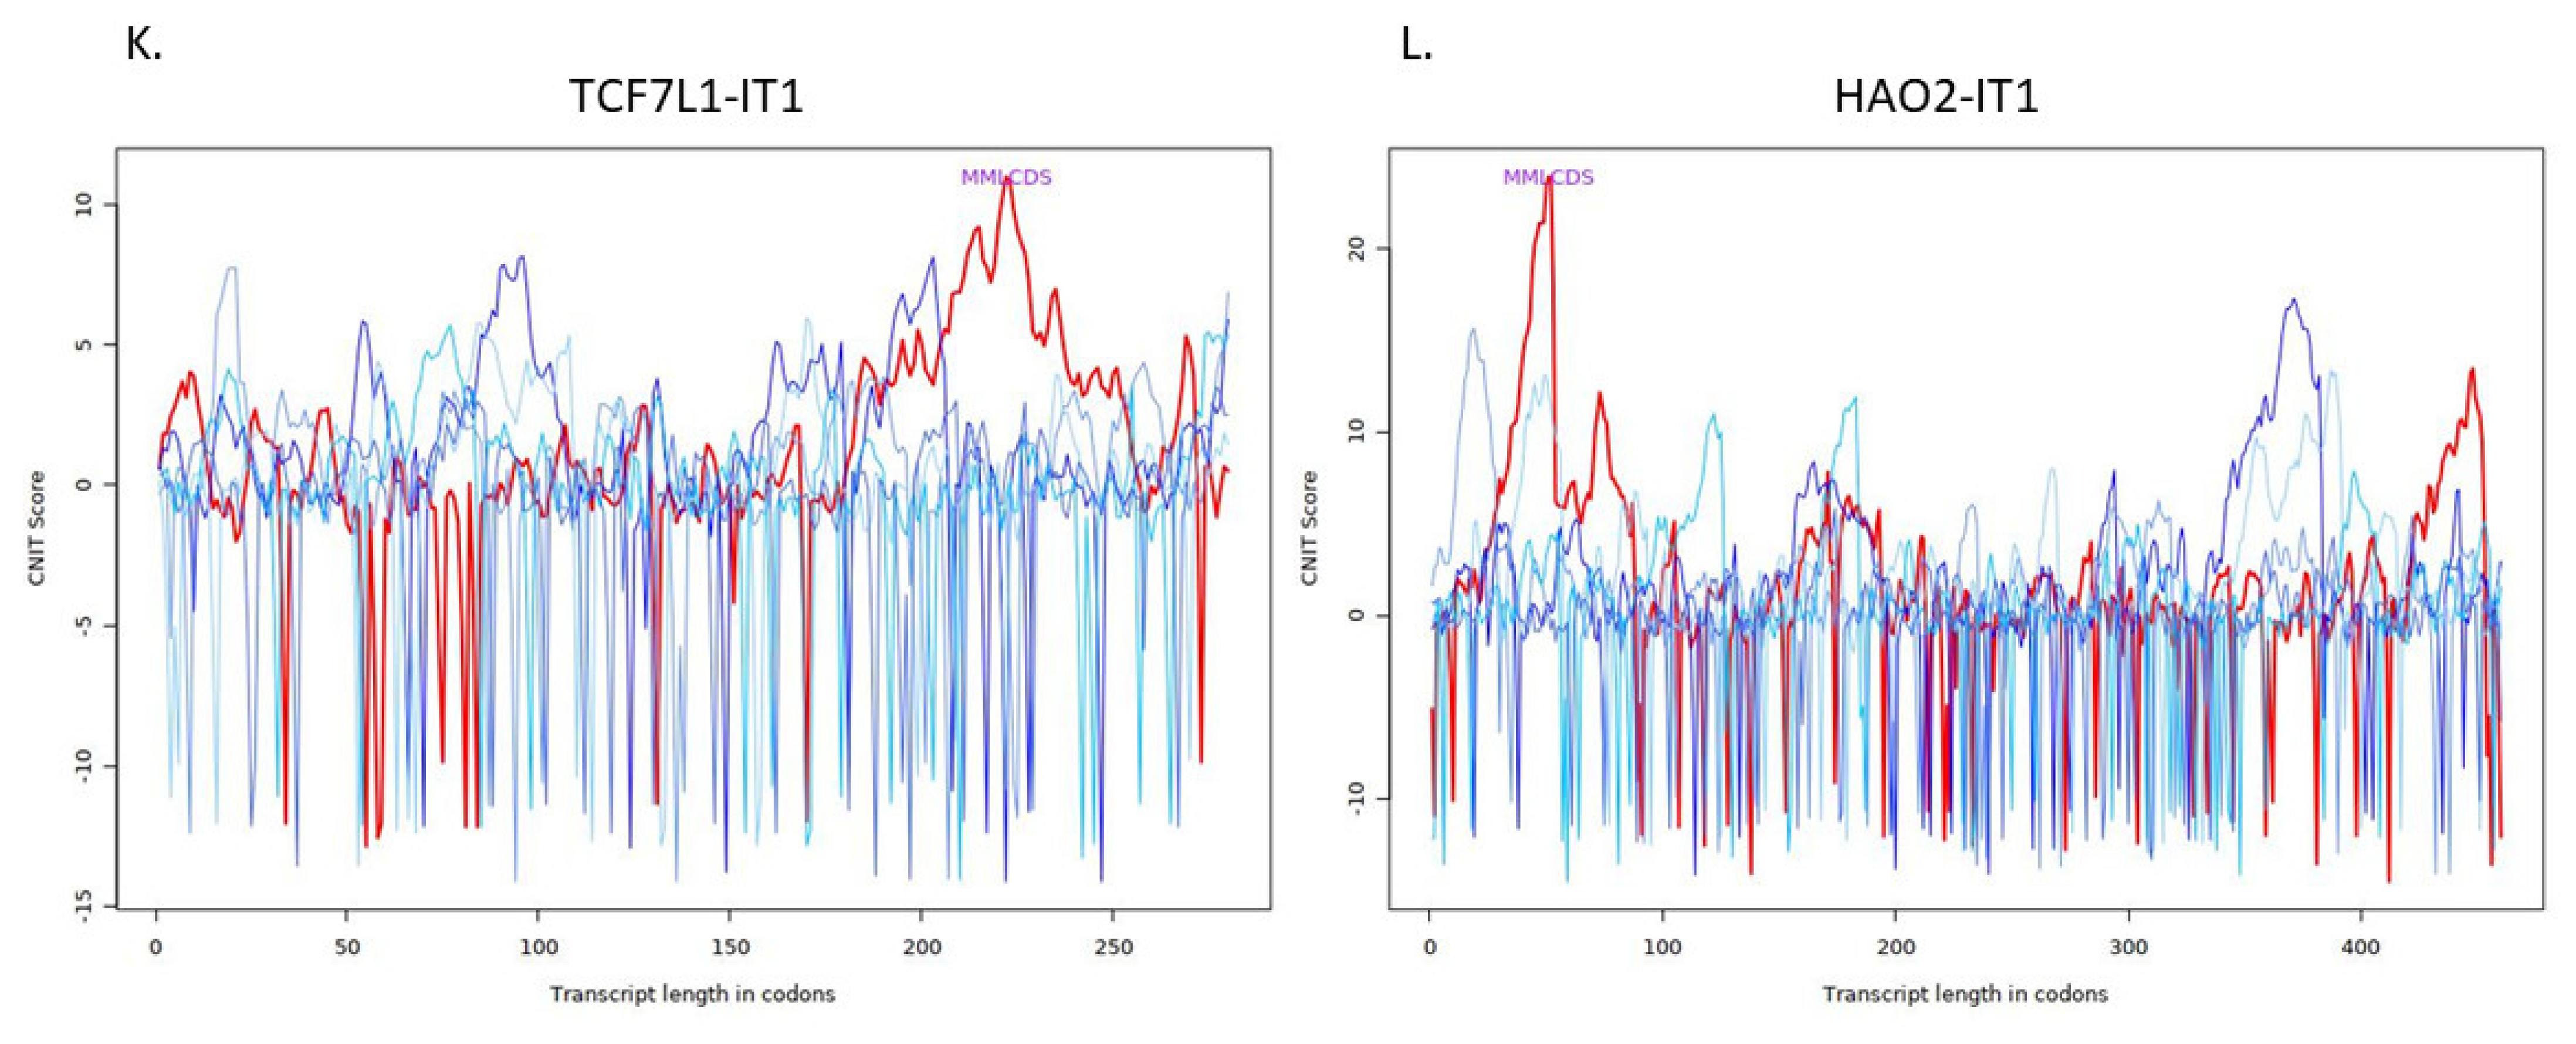
| Transcript | Condition | CNIT Score | Location |
|---|---|---|---|
| ERI3-IT1 | Noncoding | −0.2963047740200079 | Nucleus |
| NRG1-IT1 | Coding | 0.6252927037161629 | Cytoplasm |
| SND1-IT1 | Noncoding | −0.40243101938996373 | Nucleus |
| FGF14-IT1 | Coding | 0.6617306296160084 | Cytoplasm |
| ANKRD44-IT1 | Coding | 0.6338404271410529 | Cytoplasm |
| AGAP1-IT1 | Noncoding | −0.37615561437094636 | Cytosol |
| DIP2A-IT1 | Noncoding | −0.3607746484071159 | Cytosol |
| LMO7DN-IT1 | Noncoding | −0.36986001298052484 | Cytoplasm |
| SLIT2-IT1 | Noncoding | −0.3722801833195233 | Cytoplasm |
| RNF216-IT1 | Noncoding | −0.3220773653956067 | Ribosome |
| TCF7L1-IT1 | Noncoding | −0.4460247363860751 | Cytoplasm |
| HAO2-IT1 | Noncoding | −0.347525626296487 | Cytoplasm |
Publisher’s Note: MDPI stays neutral with regard to jurisdictional claims in published maps and institutional affiliations. |
© 2022 by the authors. Licensee MDPI, Basel, Switzerland. This article is an open access article distributed under the terms and conditions of the Creative Commons Attribution (CC BY) license (https://creativecommons.org/licenses/by/4.0/).
Share and Cite
Rothzerg, E.; Xu, J.; Wood, D. Identification of Differentially Expressed Intronic Transcripts in Osteosarcoma. Non-Coding RNA 2022, 8, 73. https://doi.org/10.3390/ncrna8060073
Rothzerg E, Xu J, Wood D. Identification of Differentially Expressed Intronic Transcripts in Osteosarcoma. Non-Coding RNA. 2022; 8(6):73. https://doi.org/10.3390/ncrna8060073
Chicago/Turabian StyleRothzerg, Emel, Jiake Xu, and David Wood. 2022. "Identification of Differentially Expressed Intronic Transcripts in Osteosarcoma" Non-Coding RNA 8, no. 6: 73. https://doi.org/10.3390/ncrna8060073
APA StyleRothzerg, E., Xu, J., & Wood, D. (2022). Identification of Differentially Expressed Intronic Transcripts in Osteosarcoma. Non-Coding RNA, 8(6), 73. https://doi.org/10.3390/ncrna8060073