Article

The Interplay of NEAT1 and miR-339-5p Influences on Mesangial Gene Expression and Function in Various Diabetic-Associated Injury Models

1
Department of Nephrology, University Hospital Regensburg, 93053 Regensburg, Germany
2
Regensburg Center for Biochemistry (RCB), University of Regensburg, 93053 Regensburg, Germany
*
Author to whom correspondence should be addressed.
Non-Coding RNA 2022, 8(4), 52; https://doi.org/10.3390/ncrna8040052
Submission received: 27 May 2022 / Revised: 5 July 2022 / Accepted: 8 July 2022 / Published: 13 July 2022

Abstract

:
Mesangial cells (MCs), substantial cells for architecture and function of the glomerular tuft, take a key role in progression of diabetic kidney disease (DKD). Despite long standing researches and the need for novel therapies, the underlying regulatory mechanisms in MCs are elusive. This applies in particular to long non-coding RNAs (lncRNA) but also microRNAs (miRNAs). In this study, we investigated the expression of nuclear paraspeckle assembly transcript 1 (NEAT1), a highly conserved lncRNA, in several diabetes in-vitro models using human MCs. These cells were treated with high glucose, TGFβ, TNAα, thapsigargin, or tunicamycin. We analyzed the implication of NEAT1 silencing on mesangial cell migration, proliferation, and cell size as well as on mRNA and miRNA expression. Here, the miRNA hsa-miR-339-5p was not only identified as a potential interaction partner for NEAT1 but also for several coding genes. Furthermore, overexpression of hsa-miR-339-5p leads to a MC phenotype comparable to a NEAT1 knockdown. In-silico analyses also underline a relevant role of NEAT1 and hsa-miR-339-5p in mesangial physiology, especially in the context of DKD.

Graphical Abstract

1. Introduction

With its latest report, the International Diabetes Federation estimated diabetes prevalence at 463 million people for 2019 and prognosticates an increase to 700 million by 2045. An estimated 90% of these individuals are affected by type 2 diabetes mellitus (T2DM) [1]. Approximately 40% of T2DM patients develop diabetic kidney disease (DKD), which represents the leading cause of end-stage renal disease (ESRD) with the ultimate requirement of renal replacement procedures [2]. Diabetes-mediated chronic hyperglycemia induces hyperfiltration [3] as well as the onset and development of renal injury, including chronic inflammation [4], podocyte foot process effacement and detachment leading to albuminuria [3,5,6], extracellular matrix (ECM) expansion, glomerular sclerosis [7], and a declining glomerular filtration rate (GFR) [8].
In brief, mesangial cells (MCs) are essential for maintenance of structure, function, and integrity of the glomerular capillary tuft and are in continuous cross-talk with adjacent podocytes and endothelial cells. Besides, they share characteristics with smooth muscle cells (SMCs) [9]. T2DM and recurring hyperglycemia, however, induce diabetic injury in MCs comprising hypertrophy [10], ECM protein synthesis [11], and endoplasmic reticulum (ER) stress [12]. Strikingly, T2DM can result in both proliferation and ECM accumulation [11] and, in contrast, in apoptosis and mesangiolysis [13,14]. But the underlying mechanisms, which prescribe the direction, remain elusive [15].
More than 95% of the transcriptome is non-coding, yet with structural or functional relevance [16,17]. MicroRNAs (miRNAs) and long non-coding RNAs (lncRNAs) represent two important classes of non-coding RNAs (ncRNAs) with regulatory character. After processing by Microprocessor and Dicer enzyme, miRNAs act as single-stranded transcripts with an average length of 22 nucleotides, which derive their effect by association with an Argonaut protein [18,19]. In this complex, miRNAs bind to complementary sequences of their target messenger RNAs (mRNAs) and mediate either degradation or translational repression of the mRNA [19]. In contrast, lncRNAs are longer than 200 nucleotides and have a far broader spectrum of activity, but lack protein-coding capacity. They can affect virtually every step of gene expression including pre- and post-transcriptional and -translational control, splicing, and genomic imprinting [20,21]. Research has revealed their relevance in development, cancer, and various diseases, like DKD [22,23] and renal fibrosis [24].
A single lncRNA can be involved in several mechanisms, as in the case of nuclear paraspeckle assembly transcript 1 (NEAT1). This transcript is a highly conserved lncRNA occurring in two isoforms with the same 5′-end. In humans, the short variant (3684 nucleotides), referred as NEAT1_1, is produced by early 3′-end processing while the long NEAT1_2 isoform (22743 nucleotides) is formed without poly(A) tail by RNase P cleavage at a tRNA-like structure [25,26]. As a structural element, NEAT1 comprises a core component of nuclear paraspeckles [27]; nevertheless, it also acts as competing endogenous RNA (ceRNA) [28,29,30,31,32] to de-repress [33] gene expression by competing with miRNAs for interaction with shared target mRNAs.
In the present study, we aimed to analyze the role of NEAT1 in human MCs (hMCs) in various in-vitro diabetes models. Thereby, we focused on NEAT1’s role as ceRNA and identified the miRNA hsa-miR-339-5p (miR-339-5p) as a potential interaction partner, not only for NEAT1 but also for various coding genes, which play highly relevant roles in MCs during development and progression of DKD.

2. Results

2.1. NEAT1 Expression in Human Mesangial Cells

NEAT1 expression was ascertained by quantitative polymerase chain reaction (qPCR) and in-situ hybridization (ISH) analysis. In unstimulated hMCs, we ascertained cycle threshold (CT) values of 22.98 for NEAT1_1/2 and 23.96 for NEAT1_2. Thus, NEAT1 represents a gene with moderate to high expression level. Counting back to the expression of NEAT1_1, we observed that both variants are equally strong expressed (data not shown). Detection via ISH confirmed the nuclear location with the typical inhomogeneous distribution and concentration in foci (Figure 1A). Next, we wanted to analyze alterations of NEAT1 expression in various in-vitro T2DM models. Besides high glucose (HG) treatment, hMCs were also stimulated with tunicamycin (TM) and thapsigargin (TG) as well as transforming growth factor β1 (TGFβ1) and tumor necrosis factor α (TNFα) to mimic diabetes evoked endoplasmic reticulum (ER) stress or the increased release of profibrotic or proinflammatory molecules to address multiple aspects of DKD [34]. While hMCs under hyperglycemic conditions did not exhibit changes in NEAT1 expression, all other treatments caused a significantly reduced NEAT1 expression after 24 h (Figure 1B–F). Noteworthy, short term exposure of 4 h to TG resulted in a transient but significant increase in expression. A more differentiated analysis, distinguishing between NEAT1_1 and NEAT1_2, revealed no considerable difference between these transcript variants (Supplementary Figure S1).

2.2. NEAT1 Knockdown in Human Mesangial Cells Affects Proliferation, Cell Size, and Migration

Both NEAT1 transcripts were silenced using siPOOLs (KDNEAT1; KD: knockdown), which bind exclusively within the overlapping 5-end, whereby both isoforms could be targeted. RNA expression analysis after 24 and 48 h of treatment revealed that both transcripts were significantly less expressed in KDNEAT1 hMCs compared to cells subjected to scrambled siPOOLs, which served as negative control (NCNEAT1; NC: negative control). Surprisingly, NEAT1 siPOOLs affected NEAT1_2 with more enhancement at both times (Figure 2A). The reduced amount of NEAT1 RNA after KDNEAT1 could also be confirmed by ISH. The KDNEAT1 does not seem to influence the nuclear expression pattern of the lncRNA (Figure 2B).
The reduced expression of NEAT1 affected hMC physiology. Migratory capabilities were examined by a wound-healing assay. After 8 h, the gap width after KDNEAT1 was already significantly diminished by approximately 50%. A further 4 h later, the gap was closed to two-thirds, in contrast to NCNEAT1 cells, where the space was only half covered with hMCs (Figure 2C and Figure S2). After 24 h, both gaps were completely closed. Conducting a BrdU proliferation assay, we observed a significant decrease of cell replication by 13% (Figure 2D). Furthermore, morphometric cell size analysis revealed that hMCs were 28% smaller than control cells (Figure 2E). The reduced cell size after KDNEAT1 is also supported by the ISH experiment (Figure 2B).

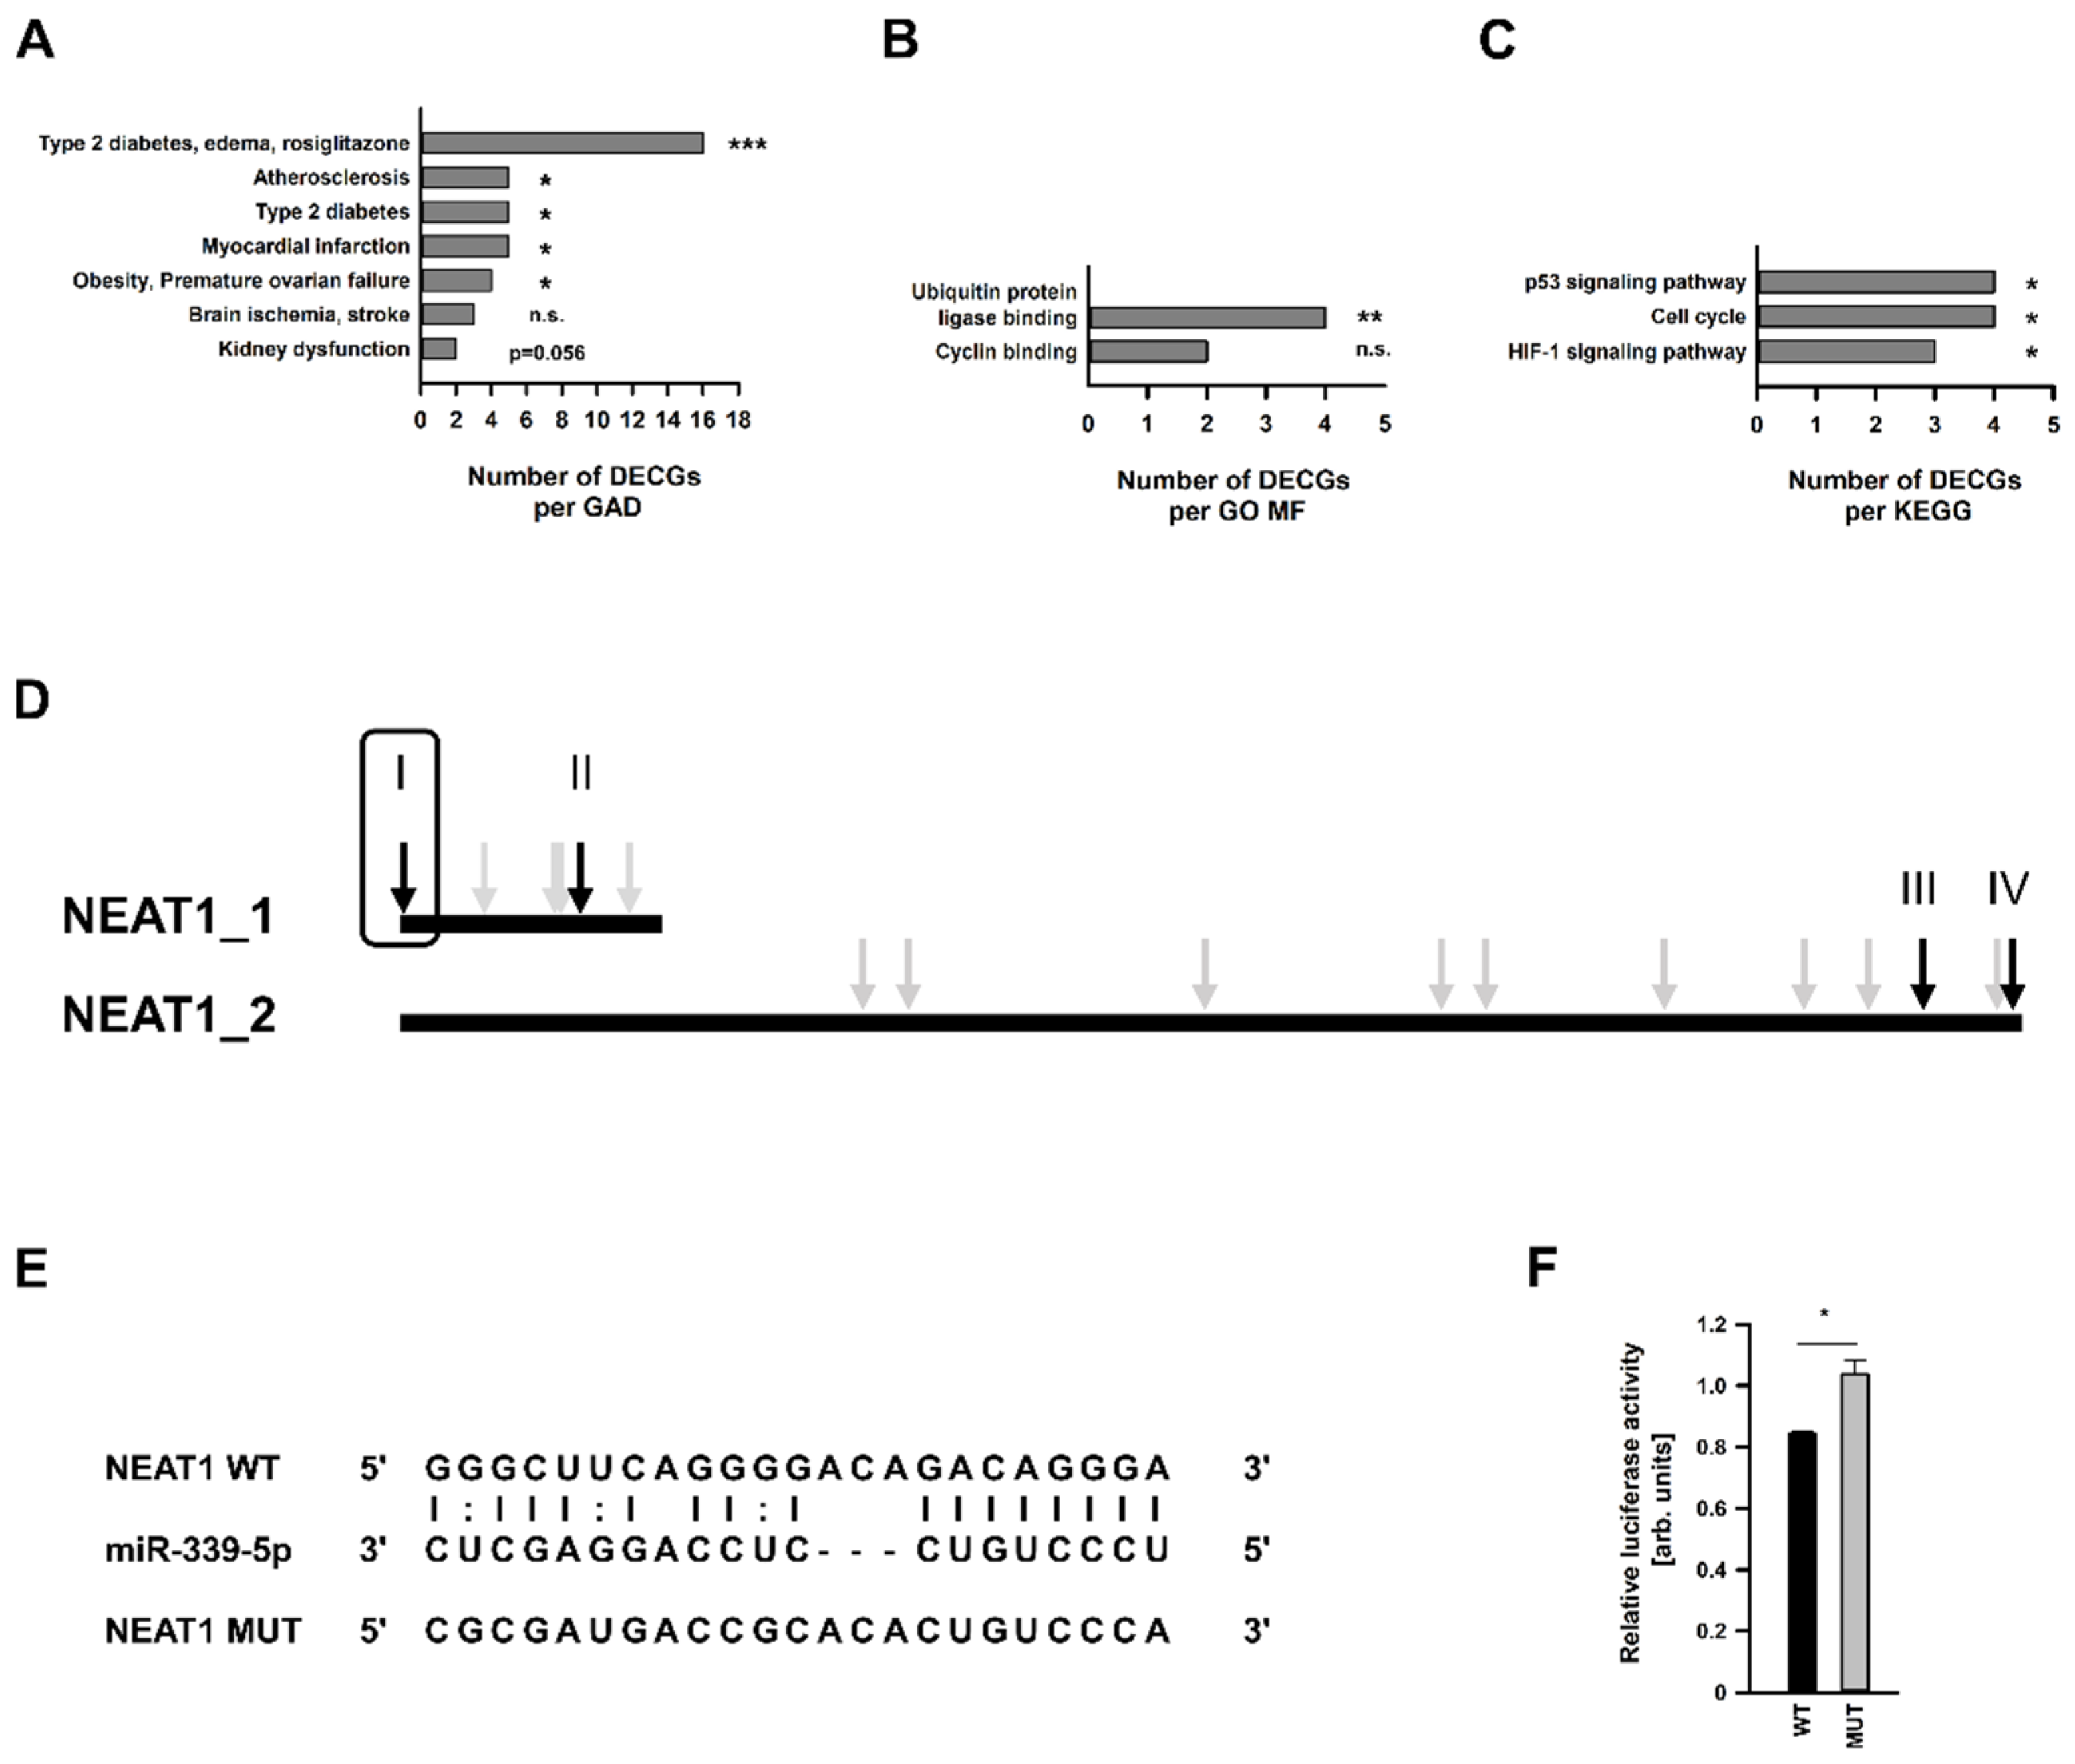
2.3. Analysis of Differentially Expressed Coding Genes after NEAT1 Knockdown

After demonstrating that NEAT1 silencing influenced hMCs’ physiology, our next aim was to identify differentially expressed coding genes (DECGs), which might play a role in these processes. Total RNA, isolated 24 h or 48 h after KDNEAT1, served as basic material for Clariom S microarray analysis. Altogether, we identified 168 DECGs (Supplementary Tables S1 and S2); 42 of these were represented in both groups. Approximately two-thirds of DECGs exhibited a reduced expression (Figure 3A). The differential expression of randomly selected DECGs was confirmed by qPCR. We validated expression of cyclin dependent kinase inhibitor 1A (CDKN1A) and TGFβ2 as examples for up- and downregulated DECGs after 24 h (Figure 3B) as well as cyclin dependent kinase 6 (CDK6) and guanine nucleotide binding protein gamma 4 (GNG4) (Figure 3C) as DECGs after 48 h of NEAT silencing. Connective tissue growth factor (CTGF) and Cyclin D1 (CCND1) were differentially expressed after both 24 h and 48 h (Figure 3D).
In-silico studies in terms of Genetic Association Database (GAD) disease analysis, Gene Ontology (GO) categories with the aspects Biological Process (BP), Cellular Component (CC), and Molecular Function (MF), as well as Kyoto Encyclopedia of Genes and Genomes (KEGG) pathways revealed a highly significant clustering and enrichment of DECGs. Figure 3E–I provides an overview of selected significantly enriched terms associated with diabetes or mesangial cells’ physiology sorted by count. Overall lists, including p values and genes, are shown in Supplementary Tables S3–S7. GAD disease analysis unveiled a direct link to 27 diseases, including diabetes (Figure 3E) and kidney dysfunction (Supplementary Table S3). Examples of significantly enriched GO BPs were cell migration (Figure 3F), and regulation of glucose metabolic process (Supplementary Table S4). Silencing NEAT1 led to an enrichment of DECGs, whose place of action is located in the ER membrane or the extracellular matrix (ECM) (Figure 3G). At molecular level, a disproportionately number of DECGs are involved in protein binding; however, insulin-like growth factor and fibronectin binding were also identified (Figure 3H). Enriched KEGG pathways were cell cycle, focal adhesion, and various signaling pathways, which are important for the development of diabetes (e.g., p53 and TGFβ) (Figure 3I).

2.4. Analysis of Differentially Expressed miRNAs after NEAT1 Knockdown

Simultaneously to the microarray for DECGs, miRNA expression was analyzed in an identical setup using the GeneChip miRNA 4.0 Array. We identified 19 and 12 differentially expressed miRNAs (DEmiRNAs), respectively, 24 or 48 h after KDNEAT1 (Supplementary Tables S8 and S9). Only two miRNAs were represented in both groups. Contrarily to DECGs, approximately two-thirds of the miRNAs exhibited an increased expression (Figure 4A). The differential expression of randomly selected DEmiRNAs was validated by qPCR (Figure 4B). For functional enrichment analysis of miRNAs, we used all DECGs as filter. Significantly enriched GO BPs led to positive regulation of SMC proliferation and regulation of cell growth (Figure 4C). We identified p53 and TGFβ1 signaling pathways as enriched KEGG pathways (Figure 4D). Figure 4C,D provides an overview of significantly enriched terms associated with diabetes or MCs’ physiology sorted by count. Overall lists, including p values as well as number of miRNAs and genes, are shown in Supplementary Tables S10 and S11.

2.5. Identification and In Silico-Characterization of the NEAT1 Binding miRNA miR-339-5p

The NEAT1 sequence was analyzed for targeting miRNAs using the online databases RNA22, mirDIP, and Starbase. Hundreds of miRNAs can bind to both NEAT1_1 and NEAT1_2; most of them have several target sites (not shown). For subsequent investigations, we excluded transcripts which were not expressed (according to mean channel intensity below 10) or not differentially expressed in our array. Three miRNAs were identified by all three databases: hsa-miR-339-5p (miR-339-5p), hsa-miR-615-3p, and hsa-miR-3180-3p. The complete list is displayed in Supplementary Table S12 (Supplementary Tables S8 and S9 show all DEmiRNAs including x fold change (xFC) and p value).
Out of these, miR-339-5p seemed to be the most promising candidate for future investigations because of the highest xFC of 2.24 and the lowest p value of p = 0.0009—compared to xFC = 1.71 and p = 0.0160 for hsa-miR-615-3p or xFC = 1.70 and p = 0.0304 for hsa-miR-3180-3p. Furthermore, the significant increase in expression was validated by qPCR, providing a xFC = 2.46 and p = 0.031 (Figure 4B).
An additional miRNA target analysis, using the databases mentioned above, revealed that this miRNA may also interfere with a 40 further DECGs from our array (Table 1). While miR-339-5p was 2.24-fold more highly expressed after KDNEAT1, the majority of these DEGCs were downregulated. Conducting in-silico analyses using only these genes, we ascertained a clear correlation to mesangial physiology in the context of diabetes. Regarding GAD diseases, we found these genes overrepresented in the terms T2DM and kidney dysfunction (Figure 5A and further: Supplementary Table S13). Two GO MFs were also found: ubiquitin protein ligase binding and cyclin binding (Figure 5B). Moreover, we identified the p53 signaling pathway, cell cycle, and HIF1 signaling pathway as significantly enriched KEGG pathways (Figure 5C). All terms stated were significantly enriched based on the algorithms used by the Database for Annotation, Visualization, and Integrated Discovery (DAVID). Additionally, we performed hypergeometric testing to calculate a p value for each term which will allow a determination if this term is actually over-represented. Using only DAVID, we also identified categories of GO BPs and GO CCs, respectively (Supplementary Tables S14 and S15).
NEAT1 was examined for miR-339-5p targeting sites using the databases RNA22 and Starbase. As shown in Figure 5D, both NEAT1 transcripts carry several binding sites for this miRNA. We decided to examine two sites for each transcript variant in accordance with the lowest binding energy indicated (data not shown). Luciferase-based reporter gene assay was conducted as described by Campos–Melo to exclude cellular or exogenous miRNA effects regulating the luciferase activity [35]. Luciferase activity of pmirGlo vector transfected hMCs, carrying either the wildtype (WT) or mutated (MUT) target sequence (Figure 5E) in its 3′-UTR, was analyzed in three independent experiments. Only one predicted binding site at the very beginning of the 5′-end of NEAT1 seemed to be targeted by miR-339-5p (Figure 5F), showing a significant difference of luciferase activity between the vector with WT or MUT sequence.

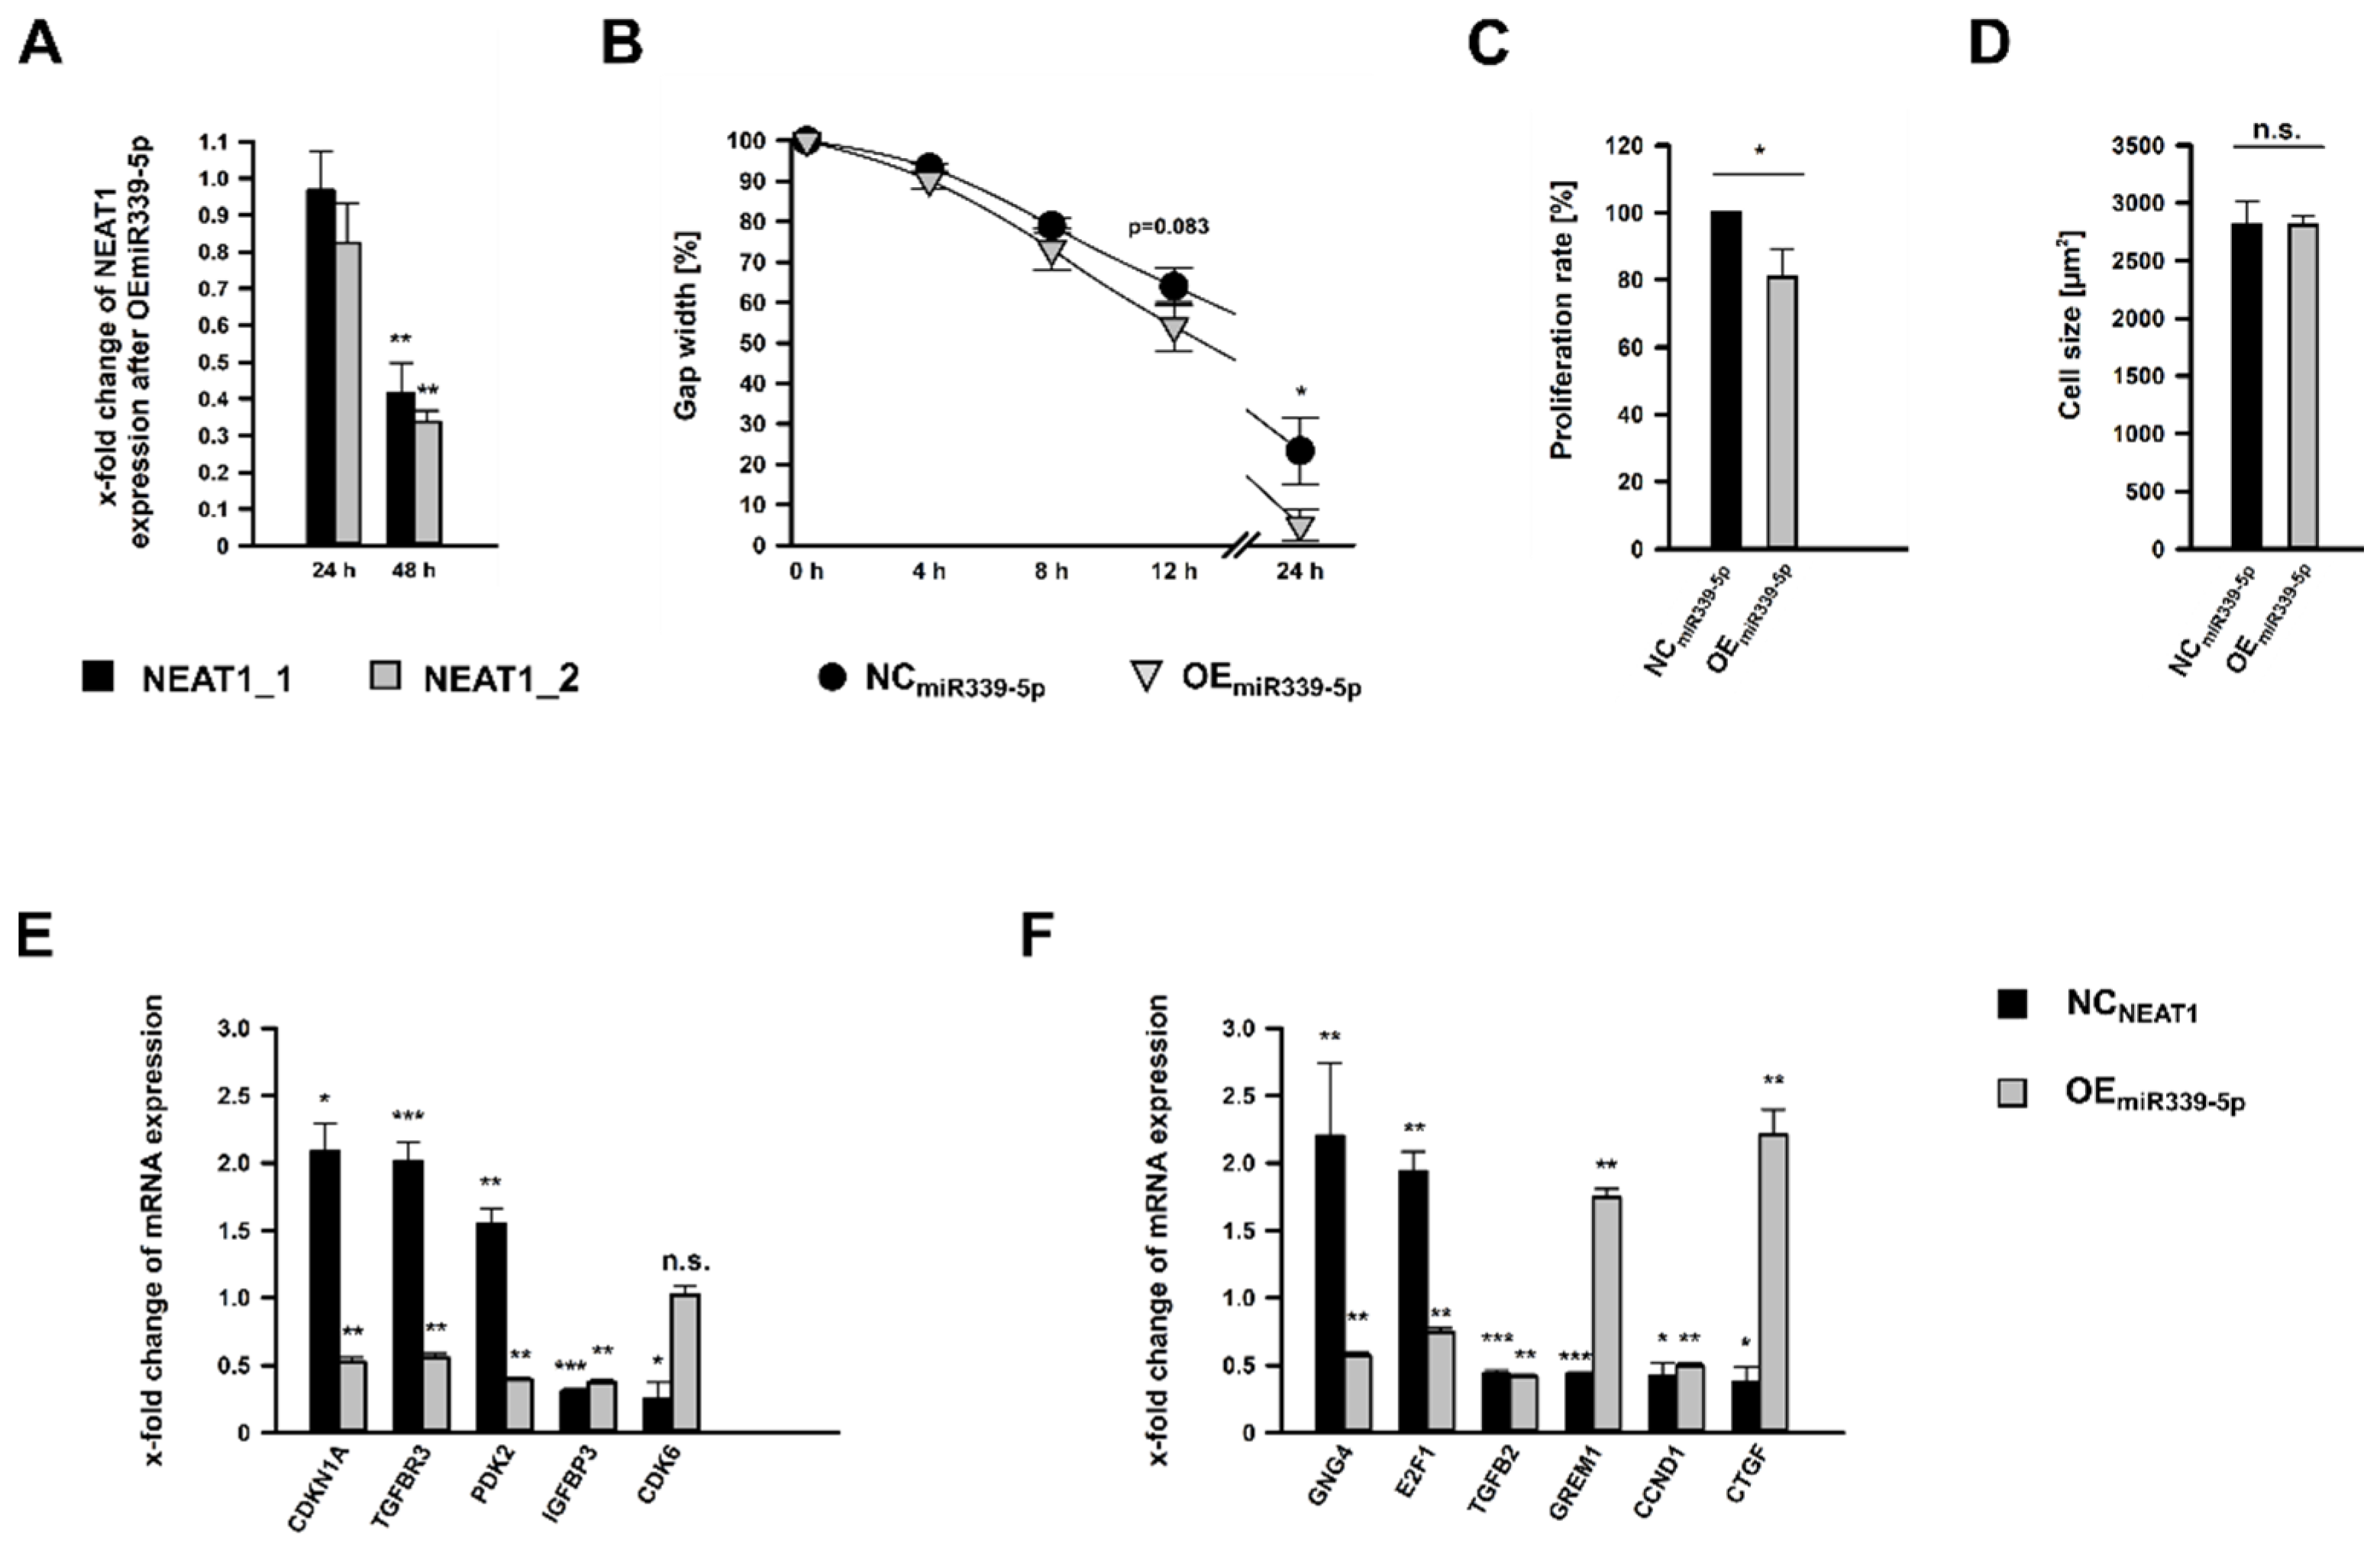
2.6. Treatment of hMCs with miR-339-5p Mimics

To analyze the role of miR-339-5p for mesangial physiology, the miRNA was overexpressed by using miR-339-5p mimics (OEmiR339-5p; OE: overexpression). In contrast to KDNEAT1 (Figure 2A), there was apparently no considerable effect on NEAT1 expression after 24 h of miR-339-5p mimic application. After 48 h, however, both transcript variants exhibited a significant reduced expression (Figure 6A). To our surprise, this treatment resulted in a stronger diminution of NEAT1 than KDNEAT1 itself, especially for NEAT1_1. Next, we examined the relevance of miR-339-5p on hMC’s physiology by examining migration, proliferation, and cell size. Albeit less pronounced, OEmiR339-5p also lead to significantly enhanced migratory capabilities compared to NC cells (NCmiR339-5p; Figure 6B and Figure S3). The gap was not entirely closed after 24 h. As with the KDNEAT1, the proliferation rate was significantly decreased, by 20% (Figure 6C). However, we could not ascertain an effect on cell size (Figure 6D).
Since KDNEAT1 as well as OEmiR339-5p lead to a reduced NEAT1 expression (Figure 2A and Figure 6A), we wondered if both also had the same effect on the expression of other genes. The mRNA expression of eleven randomly selected genes after KDNEAT1 and OEmiR339-5p, respectively, was examined. After KDNEAT1, CDKN1A, TGFB receptor 3 (TGFBR3), and pyruvate dehydrogenase kinase isoform 2 (PDK2) were upregulated while CDK6 and insulin growth factor binding protein 3 (IGFBP3) were downregulated. These genes also carry a predicted miR-339-5p binding site (Table 1). All of them— except for CDK6, which showed no change—exhibited a significantly decreased expression after OEmiR339-5p (Figure 6E). This supports the reliability of our in-silico results, which suggest an potential targeting site for miR-339-5p.
GNG4 and the transcription factor E2F1, which were increased expressed after KDNEAT1, as well as TGFβ2, Gremlin1, CCND1, and CTGF, which were less expressed after KDNEAT1, do not have a potential binding site for miR-339-5p. Interestingly, the expression of all was also significantly altered after OEmiR339-5p (Figure 6F). Yet, only TGFβ2 and CCND1 were influenced by KDNEAT1 or OEmiR339-5p, respectively, in the same manner.
In summary, OEmiR339-5p leads to stronger migration but diminished proliferation in hMCs as well as to significant changes in gene expression, including NEAT1. A luciferase activity prompted an interaction of NEAT1 and miR-339-5p, ensuing a reduced NEAT1 expression. NEAT1 was also decreased in various in-vitro diabetes experiments treating hMCs with TGFβ, TNAα, TG, or TM. Analyzing the effect of a KDNEAT1, we found many differentially expressed mRNAs and miRNAs. One of the latter was miR-339-5p, which was increased expressed. Like the OEmiR339-5p, KDNEAT1 resulted in more migration but less proliferation in hMCs. In-silico analyses support our findings. Our goal was to investigate the role of NEAT1 in hMCs in various in-vitro diabetes models [34]. We identified the miRNA miR-339-5p as potential interaction partner for NEAT1. Based on our in-silico analyses and in-vitro experiments, we found various DECGs, which might be controlled by NEAT1, miR-339-5p, or both. Moreover, these DECGs play highly relevant roles in MCs during development and progression of DKD. Therefore, our results provide further insights in the role of NEAT1 in DKD.

3. Discussion

NEAT1 is involved in various mechanisms. It can attach to active chromatin sites depending on the transcriptional status of the corresponding gene [36]. As a structural component of nuclear paraspeckles [27], it binds RNAs causing their nuclear retention, which prevents their export to the cytoplasm and thus their translation [37]. NEAT1 modulates gene expression by sponging numerous miRNAs [28,29,30,31,38]. The exact mechanism needs to be elucidated since NEAT1 localizes to the nucleus while miRNAs have their place of action in the cytoplasm. However, two recently discovered findings could provide an explanation. In LPS-nigericin-stimulated murine immortalized bone marrow-derived macrophages, up to 15–20% of Neat1 transcripts are translocated to the cytoplasm enhancing inflammasome activation [39]. Second, Castanotto et al. identified a stress-induced response complex called SIRC, which allows the relocation of miRNAs to the nucleus. Here, they revealed that miR-9 is transported back to the nucleus and then directly targets the lncRNA metastasis associated lung adenocarcinoma transcript 1 (MALAT1). Like NEAT1, MALAT1 localizes in the nucleus allowing the formation of subcellular structures [40]. Others reported an additional mechanism for how NEAT1 affects the level of cellular miRNAs: the 3′-end of NEAT1_2 harbors a binding site for Microprocessor which facilitates miRNA processing [41].
In terms of physiology and pathology, various research groups determined NEAT1 as a prognosis marker for poor survival rates and promoter of tumorigenesis [28,29,30]. With regard to DKD, others showed a positive and negative correlation, respectively, between elevated urinary NEAT1 and various podocyte damage markers like synaptopodin and podocalyxin or GFR [42]. HG-exposed proximal tubular cells (HK-2) or murine MCs (mMCs) exhibited an increase in NEAT1 expression in a dose- or time- dependent manner [31,43]. Contrarily to others, our data indicate that NEAT1 expression is not affected by HG using an osmotic control and a species model, in which NEAT1 is annotated (human or murine) [31,43,44].
Although hyperglycemic states are usually investigated to study DKD, one in-vitro model alone cannot reflect its complexity [34]. All further in-vitro DN models, tested in our approach, consistently point to a reduced NEAT1 expression. Regarding TGFβ1, however, others showed that stimulation of various cell types with this cytokine resulted in an enhanced NEAT1 expression [38,45]. Yet, this result can be appropriately put in the general context, with respect to the miscellaneous character of TGFβ. Although TGFβ has a cytostatic effect in many cell types, other cells like kidney fibroblasts and SMCs react with proliferation [46] while in hMCs, an apoptotic effect was demonstrated [47,48]. This is in line with the contradictory responses of MC to diabetic stimuli [15].
Circulating TNF receptors and TNFα in urine and serum are elevated in DCD and concomitant with protein excretion [49,50]. Although TNFα represents a key inducer of cell death, it strongly depends on the signaling molecules involved, as to which path will be chosen. Hereby, nuclear factor κB (NF-κB) and mitogen-activated protein kinase (MAPK) play a crucial role [51]. Related to MCs, TNFα was reported to serve as a relevant factor for apoptosis [52], but also for enhanced cell migration [53]. Our data revealed that TNFα stimulation leads to significantly decreased NEAT1 expression and NEAT1 silencing, and in turn, to less proliferation but more migration. NF-κB might be a direct link between TNFα and NEAT1 since Zhou et al. demonstrated regulation of NEAT1 expression via the NF-κB signaling pathway [54].
To our knowledge, there were no examinations regarding the effect of tunicamycin (TM) and thapsigargin (TG) on NEAT1 expression so far. Treatment of hMCs with TG or TM for 24 h leads to a significant diminution of NEAT1 expression. Others assessed the correlation between ER stress or cell death and the relative quantity of NEAT1 RNA in gastric cancer tissues. While NEAT1 expression was reduced, levels of ER stress and apoptosis marker proteins were elevated [55]. Taken together, the striking finding here and elsewhere is the described effects of NEAT1 silencing or TGFβ1, TNFα, TG, or TM stimulation on migration, proliferation, and cell size (and NEAT1 expression for the later), respectively, supporting the role of NEAT1 as relevant factor for various regulatory mechanisms. However, the question of whether NEAT1 has a positive or negative effect, seems to depend on the cell type and further mechanisms, which need to be elucidated in future investigations.
We conducted two microarrays after NEAT1 silencing. The fact that two thirds of mRNAs were downregulated and two thirds of miRNAs were upregulated underlines the role of NEAT1 as ceRNA [28,29,30,31]. However, others, who used a cancer cell line, observed that 69% of miRNAs showed decreased expression after KDNEAT1, assigning an implication in miRNA processing [41]. Here again, we may suppose that NEAT1 functions variably depend on cell type or cell line. In our HMC experiments, exposure to various stimuli caused a reduced cellular NEAT1 level—in contrast to others, who reported an increase in NEAT1 expression after treatment with e.g., high glucose [43,44]. We also showed that HMCs exhibited less proliferation and cell size after KDNEAT1. This is in accordance with the RNA expression analysis, e.g., the increased CDKN1A or decreased Ctgf RNA expression, which is associated with apoptosis [56] and less ECM accumulation [57], respectively. This supports the conclusion that our HMC cell line responds to a diabetes-related stimulus rather with apoptosis and mesangiolysis than with proliferation and ECM production. Accordingly, NEAT1 seems to be a relevant factor in determining the cellular response.
We also aimed to identify a miRNA, which might regulate this lncRNA, and thus affect mesangial physiology. Our data unveiled that miR-339-5p could be a notable candidate as our experiments and in-silico analyses suggest. So far, most experiments concerning miR-339-5p were conducted with cancer cells or tumor tissue, e.g., two studies focusing on p53-binding [58] protein mouse double minute 2 (MDM2), which is a direct target of miR-339-5p. Reduced Mdm2 expression results in increased amounts of p53 and p21 protein [59] as well as CDKN1A RNA [56] mediating apoptosis. Others identified miR-339-5p as biomarker for the outcome of a breast cancer therapy [60].
In a porcine epithelial cell line, however, miR-339-5p attenuated lipopolysaccharide induced p53 expression [61]. Afgar et al. directly compared the effect of OEmiR339 on the methylation level of various tumor suppressor genes in a non-cancer cell line and two neoplastic cell lines. Only the latter exhibited a decreased methylation level after miR-339 treatment resulting in changes in cell cycle [62].
To summarize these aspects, the role of both NEAT1 and miR-339-5p (often) depends on whether a cell (line) is neoplastic or non-neoplastic. Like with other cancers [28,29], NEAT1 represents a sinister predictor for a poor outcome in osteosarcoma [30]. Thereby, it also serves as ceRNA for several miRNAs, including miR-339-5p [30]. This interaction promotes proliferation, migration, and invasion while inhibiting cell apoptosis [30,63]. In contrast to this, NEAT1, sponging miR-339-5p in mouse model of hypoxic-ischemic brain damage, resulted in relieving neuronal damage by elevating Homeobox A1 (HOXA1) expression [64].
Taken together, our data demonstrate the relevance of NEAT1 and miR-339-5p for mesangial physiology. Both influence proliferation and migration as well as gene expression. In-silico investigations regarding GAD diseases, different terms of GO, and KEGG pathways substantiate this finding with respect to both KDNEAT1 and OEmiR339-5p. Therefore, identified terms such as type 2 diabetes, various GO BPs relating to proliferation as well as the GO terms extracellular matrix and cortical cytoskeleton, or p53 and TGFβ signaling pathway point to the significance of both ncRNAs in diabetes and MCs’ physiology. Additional qPCR analyses after OEmiR339-5p supported preceding in-silico studies further.
The two main limitations of this study are that only in-vitro investigations and in-silico analyses on predicted miRNA target sites of DECGs were conducted. Both are artificial and cannot cover the high complexity in vivo, but they also represent relevant tools, which allow the analysis of isolated aspects in more detail and with higher reproducibility. Human and animal studies can help to understand mechanisms in vivo. Nevertheless. we are aware that results and conditions in vivo might be different. While NEAT1 is well conserved in humans and mice, other lncRNAs exhibit only a poor conservation. However, of importance in this context is the fact that various cell populations within the kidney but also from other tissues, interact with each other either directly via cell-cell contact or messenger molecules and vesicles. This is in particular the case for widely used hMCs, which are in continuous crosstalk with endothelial cells, podocytes, and immigrated immune cells. In-vitro analyses cannot reflect this entirely.
Regarding the in-silico studies, genes with a predicted miR-339-5p binding site might not be targeted in vivo while other genes, which were negative for this, actually have a miR-339-5p targeting site. Furthermore, we could not examine the entire interaction network of NEAT1, miR-339-5p, and all coding genes. Nevertheless, in-silico analyses represent a powerful tool to correlate the data shown here and the large amount of already published data [65]. For our work, assumptions of cause and effect remain elusive. For example, both CDKN1A, with a predicted miR-339-5p binding site, and E2F1, without a predicted miR-339-5p binding site, showed enhanced expression after KDNEAT1 but lower expression after OEmiR339-5p (Figure 6E,F). However, E2F1 tightly controls the expression of CDKN1A [66]. Thus, the question arises whether the reduced CDKN1A expression is caused by interaction with miR-339-5p, by the diminished E2F1 expression, or by a third reason. Nevertheless, our data suggest that the interplay of NEAT1 and miR-339-5p influences mesangial gene expression and thus kidney physiology.

4. Materials and Methods

4.1. General Information

All experiments, if not stated otherwise, were conducted according to manufacturer’s instructions. Chemicals, kits, as well as software and devices, together with their manufacturers as well as internet addresses of databases and online tools are shown in Supplementary Tables S16–S18.

4.2. Cell Culture Maintenance

In-vitro experiments were conducted with an established immortalized hMC line. This cell line was purchased from Clonetics Corp. (San Diego, CA, USA) and then maintained and characterized as described previously [67]. Cells were cultured under sterile conditions at 37 °C in an atmosphere of 5% CO2/95% air, using hMC medium consisting of Dulbecco’s modified Eagle’s medium (DMEM 21855) supplemented with 100 U/mL penicillin, 100 µg/mL streptomycin (P/S), and 10% fetal calf serum (FCS).

4.3. ISH Localization in hMCs

In a 24 well plate, hMCs were allowed to adhere to poly-L-lysine coated cover slips overnight, prior to fixation with 4% formaldehyde for 30 min. To label and localize NEAT1 RNA, we used the ViewRNA™ ISH Cell Assay Kit including the corresponding probes set for human NEAT1 and an AxioStar Plus Observer Z1 fluorescence microscope. Target RNA was visualized with fluorescent label probes at excitation wavelengths of 488 nm. Nuclei were stained with 4′,6-diamidino-2-phenylindole (DAPI).

4.4. In-Vitro Stimulation Experiments

HMCs were seeded at 150,000 cells per well in 6-well plates and starved for 72 h by reducing the FCS content to 0.1% (hMC medium0.1%) before performing stimulation experiments (retaining cells in hMC medium0.1%). Cells were exposed to 30 mM glucose or mannitol (24.5 mM + 5.5 mM glucose in hMC medium0.1%) as osmotic control for 0.5 to 24 h. Recombinant human TGFβ1 and TNFα were used at final concentrations of 100 or 10 ng/mL, respectively, while hMC medium0.1% alone served as reference. For cells treated with 100 ng/mL TG or 100 nM TM, the corresponding amount of dimethyl sulfoxide (DMSO) was added to the control approach. All experiments were repeated at least three times.

4.5. NEAT1 Knockdown

In a double transfection procedure, 1.5 × 10⁵ hMCs were reverse transfected in solution and allowed to adhere for 48 h in a 6-well plate. Then, a second transfection mixture was added and cell were cultured for another 24 or 48 h. To generate the transfection complex, 4 µL NEAT1 or NC siPOOLs were pre-mixed in 489 μL Opti-MEM with 7 μL Lipofectamin RNAiMAX to reach a final concentration of 6.67 nM. After an incubation time of 15 min, 2.5 mL of FCS- and P/S-free medium was added to the transfection mixture.

4.6. Overexpression of miR-339-5p

In a reverse transfection procedure, 1.5 × 10⁵ hMCs were added per well (6-well plate) containing a mixture of 4 µL Lipofectamin, 4.8 µL NC or miR339-5p mimic and 491.2 µL Opti-MEM. Cells were incubated for 48 h with a final amount of 19.2 nM NC or mimic before harvesting for RNA expression analysis.

4.7. Proliferation Assay

NEAT1 was knocked down as described above. Then, 24 h after the second KD, hMCs were detached using accutase, and transferred in 96-well plates with a density of 5000 cells per well. At 24 h after cell seeding, a BrdU Cell Proliferation Assay was performed. MiR-339-5p mimic treatment was conducted, as described above, but for 30 h. Subsequently, hMCs were harvested, seeded at 4000 cells per well in 96-well plates, and allowed to adhere overnight before applying the BrdU Cell Proliferation Assay Kit. Proliferation assay was performed in triplicate and repeated four or five times.

4.8. Wound Healing Assay

To analyze hMCs’ migration capabilities after KDNEAT1 or OEmiR339-5p, one 2-well silicone cell culture insert was placed on the bottom of each well in a 12-well plate, before seeding 8.0 × 10⁴ and 1.5 × 10⁵ cells, respectively, in a reverse transfection procedure. At 24 h after NEAT1 silencing, a second KD of the lncRNA was conducted, as described above. Then, 24 h after the second KDNEAT1 or 48 h after miR339-5p mimic application, the cell culture inserts were removed, leaving a gap of 800 µm. The full width of the gap was documented immediately using an AxioStar Plus Observer Z1 microscope. Further records were taken at the same positions 4, 8, 12, and 24 h later. The assay was repeated three or four times.

4.9. Cell Size Measurement

KDNEAT1 and OEmiR339-5p were carried out as described above. Subsequently, cells were fixed with 4% formaldehyde and incubated with the Alexa Fluor 594 conjugated anti-wheat germ agglutinin (WGA) antibody to stain the cell membrane. Nuclei were visualized with DAPI. This experiment was repeated three or four times, analyzing 60–70 randomly selected cells in a blinded manner. Based on WGA membrane staining, cell size was measured using HistoQuest software.

4.10. Cloning of Luciferase Reporter Gene Vectors and Luciferase Assay

We used PmeI restriction endonuclease linearized pmirGLO luciferase vector as starting point to generate plasmids containing NEAT1 WT or MUT target sites (sequences: Supplementary Table S19). These sites were cloned using the NEBuilder HiFi DNA Assembly kit, conducting the manufacturer‘s protocol “Bridging dsDNA with a ssDNA Oligo”. Single stranded DNA oligos contained miR-339-5p WT or MUT target sequences flanked by 25–30 bases homologous to the vector sequence.
We seeded 1.2 × 10⁵ hMCs in 950 µL hMC medium per well of a 12-well plate. One transfection mixture consisted of 2 µL Lipofectamin, 2.4 µL NC or miR339-5p mimic, and 45.6 µL Opti-MEM, which was added to the cells for 8 h and then replaced by fresh hMC medium. The second transfection mixture, composed of 1.5 µg corresponding luciferase reporter gene vector and 5 µL Attractene Transfection Reagent in Opti-MEM ad 125 µL, was added for 6 h and then replaced by fresh hMC medium for another 12 h, before conducting a Dual-Glo® Luciferase Assay. Luciferase and renilla activities were measured by Tecan infinite 200 pro reader.

4.11. Expression Analysis of DECGs and DEmiRNAs

To extract total RNA and miRNA, respectively, hMCs were lysed by adding the corresponding buffer of the NucleoSpin RNA Plus Kit or the miRNeasy Mini Kit. Each RNA isolation procedure always included an on-column DNase I treatment. RNA concentration was determined by means of the NanoDrop 2000c spectrophotometer. For cDNA synthesis, we used a M-MLV reverse transcriptase system including random primers and RNasin for total RNA or the miRCURY LNA RT kit for miRNAs.
To analyze and validate gene expression, qPCR experiments were performed applying the QuantiTect SYBR Green PCR kit or miRCURY LNA SYBR Green PCR kit. All samples were run in triplicate using the ViiA 7 Real-Time PCR System. The xFC was calculated based on the 2−ΔΔCT method with peptidylprolyl isomerase B or hsa-5S-rRNA as reference genes. Primers for mRNA/lncRNA genes (sequences: Supplementary Table S20) were designed using Primer3 software. We only used oligonucleotides with an efficiency between 90 and 110%. Validation of miRNA expression was conducted with miCURY LNA miRNA PCR assays.

4.12. Clariom™ S Assay Human and GeneChip™ miRNA 4.0 Array

Changes in mRNA or miRNA expression were examined my means of the Clariom™ S Assay human and GeneChip™ miRNA 4.0 Array, respectively. The technical implementation was conducted at the Center of Excellence for Fluorescent Bioanalytics” (Regensburg, Germany; www.kfb-regensburg.de (accessed on 24 July 2018)) as described previously [22]. The data were obtained as CEL files and imported into the Transcriptome Analysis Console (TAC) software 4.0 to summarize probe set signals based on the SST-RMA algorithm. Coding genes with a mean channel intensity < 100 were excluded (which corresponds to a log 2 transformed intensity of 7.64). Further filter criteria were a xFC > 2 or <−2 and a false discovery rate (FDR) adjusted p value < 0.05. Only miRNAs with a mean channel intensity > 10 were considered (log 2 value = 3.32). Cut-offs for differential miRNA expression were defined as xFC > 1.5 or <−1.5 and p value < 0.05. Statistical analysis was based on the Fisher-exact test. Proceeding from the data obtained, the TAC software tool, miR-Interactions“ was used to identify mRNA-miRNA interaction networks.

4.13. Functional Enrichment Analyses

In terms of GAD Disease Analysis, GO categories, and KEGG pathways, the Database for Annotation, Visualization, and Integrated Discovery (DAVID) v6.8 was used to identify gene clustering and enriched pathways. An expression analysis systematic explorer (EASE) score and a p value < 0.05 were considered as significant. The online tool DIANA miRPath v.3.0 [68] was applied to conduct miRNA functional analyses using KEGG or Gene Ontology annotation, with a significance level of <0.05.

4.14. Statistics

Statistical analysis of microarray data was automatically conducted by TAC software 4.0. The database DAVID also provided statistical exploration for functional enrichment analyses. The remaining statistical analyses were performed using SPSS Statistics Version 21. Normal distribution or homogeneity of variances were ascertained by Shapiro–Wilk and Levene’s test, respectively. For two independent means, Student’s t-test was carried out. To measure the overall significance of differences in more than two means, an analysis of variance (ANOVA) was conducted, before using Student’s t-tests for post hoc pairwise comparisons. To determine if any term of GAD Disease, GO category, or KEGG pathways was statistically significant over-represented, we conducted hypergeometric testing. Statistical difference was set at the 5% level of probability.

Supplementary Materials

The following supporting information can be downloaded at: https://www.mdpi.com/article/10.3390/ncrna8040052/s1, Table S1: Differentially expressed coding genes after 24 h of silencing NEAT1, Table S2: Differentially expressed coding genes after 48 h of silencing NEAT1, Table S3: Significantly enriched GAD diseases based on all DECGs, Table S4: Significantly enriched GO BP (direct) based on all DECGs, Table S5: Significantly enriched GO CC (direct) based on all DECGs, Table S6: Significantly enriched GO MF (direct) based on all DECGs, Table S7: Significantly enriched KEGG pathways based on all DECGs, Table S8: Differentially expressed miRNAs after 24 h of silencing NEAT1, Table S9: Differentially expressed miRNAs after 48 h of silencing NEAT1, Table S10: Significantly enriched GO BP based on DEmiRNAs, Table S11: Significantly enriched KEGG pathways based on DEmiRNAs, Table S12: Identification of NEAT1 binding miRNAs using the three databases: RNA22, mirDIP, and Starbase, Table S13: Significantly enriched GAD diseases based on DECGs with potential miR-339-5p targeting site, Table S14: Significantly enriched GO BP based on DECGs with potential miR-339-5p targeting site, Table S15: Significantly enriched GO CC based on DECGs with potential miR-339-5p targeting site, Table S16: Chemicals, agents, kits, as well as software and devices with their manufacturers, Table S17: Software and devices, Table S18: Data bases and online tools, Table S19: Single stranded DNA oligo sequences for cloning of luciferase reporter gene vectors, Table S20: Primer sequences, Figure S1: x-fold changes of NEAT1_1 and NEAT1_2 expression after stimulation. Figure S2: Migration assay after KDNEAT1 in HMCs. Figure S3: Migration assay after OEmiR339-5p in HMCs.

Author Contributions

Conceptualization, S.R.-W., M.K., B.B. and M.C.B.; Data curation, S.R.-W. and M.C.B.; Formal analysis, S.R.-W., M.P., T.W. and K.H.; Investigation, S.R.-W., M.P., T.W. and K.H.; Methodology, S.R.-W., M.P., T.W., M.K. and K.H.; Project administration, S.R.-W., B.B. and M.C.B.; Resources, B.B.; Supervision, S.R.-W., K.H. and M.C.B.; Validation, S.R.-W.; Visualization, S.R.-W.; Writing—original draft S.R.-W.; Writing—review and editing, S.R.-W., M.P., T.W., M.K., K.H., B.B. and M.C.B. All authors have read and agreed to the published version of the manuscript.

Funding

This research received no external funding.

Institutional Review Board Statement

Not applicable.

Informed Consent Statement

Not applicable.

Data Availability Statement

The datasets used and/or analyzed during the current study are available from the corresponding author on reasonable request.

Conflicts of Interest

The authors declare no conflict of interest.

References

  1. Saeedi, P.; Petersohn, I.; Salpea, P.; Malanda, B.; Karuranga, S.; Unwin, N.; Colagiuri, S.; Guariguata, L.; Motala, A.A.; Ogurtsova, K.; et al. Global and regional diabetes prevalence estimates for 2019 and projections for 2030 and 2045: Results from the International Diabetes Federation Diabetes Atlas, 9th edition. Diabetes Res. Clin. Pract. 2019, 157, 107843. [Google Scholar] [CrossRef] [PubMed]
  2. Alicic, R.Z.; Rooney, M.T.; Tuttle, K.R. Diabetic Kidney Disease: Challenges, Progress, and Possibilities. Clin. J. Am. Soc. Nephrol. CJASN 2017, 12, 2032–2045. [Google Scholar] [CrossRef] [PubMed]
  3. Kriz, W.; Lemley, K.V. A potential role for mechanical forces in the detachment of podocytes and the progression of CKD. JASN 2015, 26, 258–269. [Google Scholar] [CrossRef] [PubMed]
  4. Jung, S.W.; Moon, J.-Y. The role of inflammation in diabetic kidney disease. Korean J. Intern. Med. 2021, 36, 753–766. [Google Scholar] [CrossRef]
  5. Weil, E.J.; Lemley, K.V.; Mason, C.C.; Yee, B.; Jones, L.I.; Blouch, K.; Lovato, T.; Richardson, M.; Myers, B.D.; Nelson, R.G. Podocyte detachment and reduced glomerular capillary endothelial fenestration promote kidney disease in type 2 diabetic nephropathy. Kidney Int. 2012, 82, 1010–1017. [Google Scholar] [CrossRef]
  6. White, K.E.; Bilous, R.W. Structural alterations to the podocyte are related to proteinuria in type 2 diabetic patients. Nephrol. Dial. Transplant. 2004, 19, 1437–1440. [Google Scholar] [CrossRef]
  7. Fineberg, D.; Jandeleit-Dahm, K.A.M.; Cooper, M.E. Diabetic nephropathy: Diagnosis and treatment. Nat. Rev. Endocrinol. 2013, 9, 713–723. [Google Scholar] [CrossRef]
  8. National Kidney Foundation. KDOQI Clinical Practice Guideline for Diabetes and CKD: 2012 Update. Am. J. Kidney Dis. Off. J. Natl. Kidney Found. 2012, 60, 850–886. [Google Scholar] [CrossRef]
  9. Schlöndorff, D.; Banas, B. The mesangial cell revisited: No cell is an island. JASN 2009, 20, 1179–1187. [Google Scholar] [CrossRef]
  10. Tonneijck, L.; Muskiet, M.; Smits, M.; Van Bommel, E.J.; Heerspink, H.J.L.; Van Raalte, D.H.; Joles, J.A. Glomerular Hyperfiltration in Diabetes: Mechanisms, Clinical Significance, and Treatment. JASN 2017, 28, 1023–1039. [Google Scholar] [CrossRef]
  11. Kong, Y.; Shen, Y.; Ni, J.; Shao, D.; Miao, N.; Xu, J.; Zhou, L.; Xue, H.; Zhang, W.; Wang, X.; et al. Insulin deficiency induces rat renal mesangial cell dysfunction via activation of IGF-1/IGF-1R pathway. Acta Pharm. Sin. 2016, 37, 217–227. [Google Scholar] [CrossRef] [PubMed]
  12. Yao, F.; Li, Z.; Ehara, T.; Yang, L.; Wang, D.; Feng, L.; Zhang, Y.; Wang, K.; Shi, Y.; Duan, H.; et al. Fatty Acid-Binding Protein 4 mediates apoptosis via endoplasmic reticulum stress in mesangial cells of diabetic nephropathy. Mol. Cell Endocrinol. 2015, 411, 232–242. [Google Scholar] [CrossRef] [PubMed]
  13. Locatelli, M.; Zoja, C.; Zanchi, C.; Corna, D.; Villa, S.; Bolognini, S.; Novelli, R.; Perico, L.; Remuzzi, G.; Benigni, A.; et al. Manipulating Sirtuin 3 pathway ameliorates renal damage in experimental diabetes. Sci. Rep. 2020, 10, 8418. [Google Scholar] [CrossRef] [PubMed]
  14. Hudkins, K.L.; Pinchaiwong, W.; Wietecha, T.; Kowalewska, J.; Banas, M.C.; Spencer, M.W.; Mühlfeld, A.; Koelling, M.; Pippin, J.W.; Shankland, S.J.; et al. BTBR Ob/Ob mutant mice model progressive diabetic nephropathy. J. Am. Soc. Nephrol. JASN 2010, 21, 1533–1542. [Google Scholar] [CrossRef]
  15. Abboud, H.E. Mesangial cell biology. Exp. Cell Res. 2012, 318, 979–985. [Google Scholar] [CrossRef] [PubMed]
  16. Cole, C.G.; McCann, O.T.; Collins, J.E.; Oliver, K.; Willey, D.; Gribble, S.M.; Yang, F.; McLaren, K.; Rogers, J.; Ning, Z.; et al. Finishing the euchromatic sequence of the human genome. Nature 2004, 431, 931–945. [Google Scholar]
  17. Mattick, J.S.; Makunin, I.V. Non-coding RNA. Hum. Mol. Genet. 2006, 15, R17–R29. [Google Scholar] [CrossRef]
  18. Höck, J.; Meister, G. The Argonaute protein family. Genome Biol. 2008, 9, 210. [Google Scholar] [CrossRef]
  19. Bartel, D.P. Metazoan MicroRNAs. Cell 2018, 173, 20–51. [Google Scholar] [CrossRef]
  20. Angrand, P.-O.; Vennin, C.; Le Bourhis, X.; Adriaenssens, E. The role of long non-coding RNAs in genome formatting and expression. Front. Genet. 2015, 6, 165. [Google Scholar] [CrossRef]
  21. Tripathi, V.; Ellis, J.D.; Shen, Z.; Song, D.Y.; Pan, Q.; Watt, A.T.; Freier, S.M.; Bennett, C.F.; Sharma, A.; Bubulya, P.A.; et al. The nuclear-retained noncoding RNA MALAT1 regulates alternative splicing by modulating SR splicing factor phosphorylation. Mol. Cell 2010, 39, 925–938. [Google Scholar] [CrossRef] [PubMed]
  22. Chittka, D.; Banas, B.; Lennartz, L.; Putz, F.J.; Eidenschink, K.; Beck, S.; Stempfl, T.; Moehle, C.; Reichelt-Wurm, S.; Banas, M.C. Long-term expression of glomerular genes in diabetic nephropathy. Nephrol. Dial. Transplant. Off. Publ. Eur. Dial. Transpl. Assoc.-Eur. Ren. Assoc. 2018, 33, 1533–1544. [Google Scholar] [CrossRef] [PubMed]
  23. Reichelt-Wurm, S.; Wirtz, T.; Chittka, D.; Lindenmeyer, M.; Reichelt, R.M.; Beck, S.; Politis, P.; Charonis, A.; Kretz, M.; Huber, T.B.; et al. Glomerular expression pattern of long non-coding RNAs in the type 2 diabetes mellitus BTBR mouse model. Sci. Rep. 2019, 9, 9765. [Google Scholar] [CrossRef] [PubMed]
  24. Arvaniti, E.; Moulos, P.; Vakrakou, A.; Chatziantoniou, C.; Chadjichristos, C.; Kavvadas, P.; Charonis, A.; Politis, P.K. Whole-transcriptome analysis of UUO mouse model of renal fibrosis reveals new molecular players in kidney diseases. Sci. Rep. 2016, 6, 26235. [Google Scholar] [CrossRef]
  25. Sunwoo, H.; Dinger, M.E.; Wilusz, J.E.; Amaral, P.P.; Mattick, J.S.; Spector, D.L. MEN epsilon/beta nuclear-retained non-coding RNAs are up-regulated upon muscle differentiation and are essential components of paraspeckles. Genome Res. 2009, 19, 347–359. [Google Scholar] [CrossRef]
  26. Naganuma, T.; Nakagawa, S.; Tanigawa, A.; Sasaki, Y.; Goshima, N.; Hirose, T. Alternative 3’-end processing of long noncoding RNA initiates construction of nuclear paraspeckles. EMBO J. 2012, 31, 4020–4034. [Google Scholar] [CrossRef]
  27. Sasaki, Y.T.F.; Ideue, T.; Sano, M.; Mituyama, T.; Hirose, T. MENepsilon/beta noncoding RNAs are essential for structural integrity of nuclear paraspeckles. Proc. Natl. Acad. Sci. USA 2009, 106, 2525–2530. [Google Scholar] [CrossRef]
  28. Zhao, D.; Zhang, Y.; Wang, N.; Yu, N. NEAT1 negatively regulates miR-218 expression and promotes breast cancer progression. CBM 2017, 20, 247–254. [Google Scholar] [CrossRef]
  29. Pang, Y.; Wu, J.; Li, X.; Wang, C.; Wang, M.; Liu, J.; Yang, G. NEAT1/miR-124/STAT3 feedback loop promotes breast cancer progression. Int. J. Oncol. 2019, 55, 745–754. [Google Scholar] [CrossRef]
  30. Zhang, L.; Lu, X.-Q.; Zhou, X.-Q.; Liu, Q.-B.; Chen, L.; Cai, F. NEAT1 induces osteosarcoma development by modulating the miR-339-5p/TGF-β1 pathway. J. Cell Physiol. 2019, 234, 5097–5105. [Google Scholar] [CrossRef]
  31. Yang, D.-Y.; Zhou, X.; Liu, Z.-W.; Xu, X.-Q.; Liu, C. LncRNA NEAT1 accelerates renal tubular epithelial cell damage by modulating mitophagy via miR-150-5p-DRP1 axis in diabetic nephropathy. Exp. Physiol. 2021, 106, 1631–1642. [Google Scholar] [CrossRef] [PubMed]
  32. Zhang, M.; Zheng, Y.; Sun, Y.; Li, S.; Chen, L.; Jin, X.; Hou, X.; Liu, X.; Chen, Q.; Li, J.; et al. Knockdown of NEAT1 induces tolerogenic phenotype in dendritic cells by inhibiting activation of NLRP3 inflammasome. Theranostics 2019, 9, 3425–3442. [Google Scholar] [CrossRef] [PubMed]
  33. Jia, X.; Shi, L.; Wang, X.; Luo, L.; Ling, L.; Yin, J.; Song, Y.; Zhang, Z.; Qiu, N.; Liu, H.; et al. KLF5 regulated lncRNA RP1 promotes the growth and metastasis of breast cancer via repressing p27kip1 translation. Cell Death Dis. 2019, 10, 373. [Google Scholar] [CrossRef]
  34. Slyne, J.; Slattery, C.; McMorrow, T.; Ryan, M.P. New developments concerning the proximal tubule in diabetic nephropathy: In vitro models and mechanisms. Nephrol. Dial. Transplant. Off. Publ. Eur. Dial. Transpl. Assoc.-Eur. Ren. Assoc. 2015, 30 (Suppl. 4), iv60–iv67. [Google Scholar]
  35. Campos-Melo, D.; Droppelmann, C.A.; Volkening, K.; Strong, M.J. Comprehensive luciferase-based reporter gene assay reveals previously masked up-regulatory effects of miRNAs. Int. J. Mol. Sci. 2014, 15, 15592–15602. [Google Scholar] [CrossRef] [PubMed]
  36. West, J.A.; Davis, C.P.; Sunwoo, H.; Simon, M.D.; Sadreyev, R.I.; Wang, P.I.; Tolstorukov, M.Y.; Kingston, R.E. The long noncoding RNAs NEAT1 and MALAT1 bind active chromatin sites. Mol. Cell 2014, 55, 791–802. [Google Scholar] [CrossRef]
  37. Prasanth, K.V.; Prasanth, S.G.; Xuan, Z.; Hearn, S.; Freier, S.M.; Bennett, C.F.; Zhang, M.Q.; Spector, D.L. Regulating gene expression through RNA nuclear retention. Cell 2005, 123, 249–263. [Google Scholar] [CrossRef]
  38. Zhang, Y.; Yao, X.-H.; Wu, Y.; Cao, G.-K.; Han, D. LncRNA NEAT1 regulates pulmonary fibrosis through miR-9-5p and TGF-β signaling pathway. Eur. Rev. Med. Pharmacol. Sci. 2020, 24, 8483–8492. [Google Scholar]
  39. Zhang, P.; Cao, L.; Zhou, R.; Yang, X.; Wu, M. The lncRNA Neat1 promotes activation of inflammasomes in macrophages. Nat. Commun. 2019, 10, 1495. [Google Scholar] [CrossRef]
  40. Castanotto, D.; Zhang, X.; Alluin, J.; Zhang, X.; Rüger, J.; Armstrong, B.; Rossi, J.; Riggs, A.; Stein, C.A. A stress-induced response complex (SIRC) shuttles miRNAs, siRNAs, and oligonucleotides to the nucleus. Proc. Natl. Acad. Sci. USA 2018, 115, E5756–E5765. [Google Scholar] [CrossRef]
  41. Jiang, L.; Shao, C.; Wu, Q.-J.; Chen, G.; Zhou, J.; Yang, B.; Li, H.; Gou, L.-T.; Zhang, Y.; Wang, Y.; et al. NEAT1 scaffolds RNA-binding proteins and the Microprocessor to globally enhance pri-miRNA processing. Nat. Struct. Mol. Biol. 2017, 24, 816–824. [Google Scholar] [CrossRef] [PubMed]
  42. Petrica, L.; Hogea, E.; Gadalean, F.; Vlad, A.; Vlad, M.; Dumitrascu, V.; Velciov, S.; Gluhovschi, C.; Bob, F.; Ursoniu, S.; et al. Long noncoding RNAs may impact podocytes and proximal tubule function through modulating miRNAs expression in Early Diabetic Kidney Disease of Type 2 Diabetes Mellitus patients. Int. J. Med. Sci. 2021, 18, 2093–2101. [Google Scholar] [CrossRef] [PubMed]
  43. Liao, L.; Chen, J.; Zhang, C.; Guo, Y.; Liu, W.; Liu, W.; Duan, L.; Liu, Z.; Hu, J.; Lu, J. LncRNA NEAT1 Promotes High Glucose-Induced Mesangial Cell Hypertrophy by Targeting miR-222-3p/CDKN1B Axis. Front. Mol. Biosci. 2020, 7, 627827. [Google Scholar] [CrossRef] [PubMed]
  44. Ma, J.; Zhao, N.; Du, L.; Wang, Y. Downregulation of lncRNA NEAT1 inhibits mouse mesangial cell proliferation, fibrosis, and inflammation but promotes apoptosis in diabetic nephropathy. Int. J. Clin. Exp. Pathol. 2019, 12, 1174–1183. [Google Scholar]
  45. Li, C.; Liu, Y.-F.; Huang, C.; Chen, Y.-X.; Xu, C.-Y.; Chen, Y. Long noncoding RNA NEAT1 sponges miR-129 to modulate renal fibrosis by regulation of collagen type I. Am. J. Physiol. -Ren. Physiol. 2020, 319, F93–F105. [Google Scholar] [CrossRef]
  46. Zhang, Y.; Alexander, P.B.; Wang, X.-F. TGF-β Family Signaling in the Control of Cell Proliferation and Survival. Cold Spring Harb. Perspect. Biol. 2017, 9, a022145. [Google Scholar] [CrossRef]
  47. Okado, T.; Terada, Y.; Tanaka, H.; Inoshita, S.; Nakao, A.; Sasaki, S. Smad7 mediates transforming growth factor-beta-induced apoptosis in mesangial cells. Kidney Int. 2002, 62, 1178–1186. [Google Scholar] [CrossRef]
  48. Jardim, D.P.; Poço, P.C.E.; Campos, A.H. Dact1, a Wnt-Pathway Inhibitor, Mediates Human Mesangial Cell TGF-β1-Induced Apoptosis. J. Cell Physiol. 2017, 232, 2104–2111. [Google Scholar] [CrossRef]
  49. Lampropoulou, I.T.; Stangou, M.; Sarafidis, P.; Gouliovaki, A.; Giamalis, P.; Tsouchnikas, I.; Didangelos, T.; Papagianni, A. TNF-α pathway and T-cell immunity are activated early during the development of diabetic nephropathy in Type II Diabetes Mellitus. Clin. Immunol. Orlando Fla. 2020, 215, 108423. [Google Scholar] [CrossRef]
  50. Navarro, J.F.; Mora, C.; Rivero, A.; Gallego, E.; Chahin, J.; Macía, M.; Méndez, M.L.; García, J. Urinary protein excretion and serum tumor necrosis factor in diabetic patients with advanced renal failure: Effects of pentoxifylline administration. Am. J. Kidney Dis. 1999, 33, 458–463. [Google Scholar] [CrossRef]
  51. Webster, J.D.; Vucic, D. The Balance of TNF Mediated Pathways Regulates Inflammatory Cell Death Signaling in Healthy and Diseased Tissues. Front. Cell Dev. Biol. 2020, 8, 365. [Google Scholar] [CrossRef] [PubMed]
  52. Hsu, H.; Huang, J.; Shu, H.-B.; Baichwal, V.; Goeddel, D.V. TNF-Dependent Recruitment of the Protein Kinase RIP to the TNF Receptor-1 Signaling Complex. Immunity 1996, 4, 387–396. [Google Scholar] [CrossRef]
  53. Wang, Y.; Li, M.; Xu, Y.; He, N.; Leng, L.; Li, Z. Tumor necrosis factor-α regulates matrix metalloproteinase-2 expression and cell migration via ERK pathway in rat glomerular mesangial cells. Cell Biol. Int. 2014, 38, 1060–1068. [Google Scholar] [CrossRef] [PubMed]
  54. Zhou, W.; Chen, X.; Hu, Q.; Chen, X.; Chen, Y.; Hunag, L. Galectin-3 activates TLR4/NF-κB signaling to promote lung adenocarcinoma cell proliferation through activating lncRNA-NEAT1 expression. BMC Cancer 2018, 18, 580. [Google Scholar] [CrossRef]
  55. Zhou, Y.; Sha, Z.; Yang, Y.; Wu, S.; Chen, H. lncRNA NEAT1 regulates gastric carcinoma cell proliferation, invasion and apoptosis via the miR-500a-3p/XBP-1 axis. Mol. Med. Rep. 2021, 24, 503. [Google Scholar] [CrossRef] [PubMed]
  56. Zhang, C.; Liu, J.; Wang, X.; Wu, R.; Lin, M.; Laddha, S.V.; Yang, Q.; Chan, C.S.; Feng, Z. MicroRNA-339-5p inhibits colorectal tumorigenesis through regulation of the MDM2/p53 signaling. Oncotarget 2014, 5, 9106–9117. [Google Scholar] [CrossRef]
  57. Toda, N.; Mori, K.; Kasahara, M.; Ishii, A.; Koga, K.; Ohno, S.; Mori, K.P.; Kato, Y.; Osaki, K.; Kuwabara, T.; et al. Crucial Role of Mesangial Cell-derived Connective Tissue Growth Factor in a Mouse Model of Anti-Glomerular Basement Membrane Glomerulonephritis. Sci. Rep. 2017, 7, 42114. [Google Scholar] [CrossRef]
  58. Marine, J.-C.; Lozano, G. Mdm2-mediated ubiquitylation: p53 and beyond. Cell Death Differ. 2010, 17, 93–102. [Google Scholar] [CrossRef]
  59. Jansson, M.D.; Damas, N.D.; Lees, M.; Jacobsen, A.; Lund, A.H. miR-339-5p regulates the p53 tumor-suppressor pathway by targeting MDM2. Oncogene 2015, 34, 1908–1918. [Google Scholar] [CrossRef]
  60. Bertoli, G.; Cava, C.; Castiglioni, I. MicroRNAs: New Biomarkers for Diagnosis, Prognosis, Therapy Prediction and Therapeutic Tools for Breast Cancer. Theranostics 2015, 5, 1122–1143. [Google Scholar] [CrossRef]
  61. Xie, M.; Zhang, L.; Li, L.; Fan, M.; Hou, L. MiR-339 attenuates LPS-induced intestinal epithelial cells inflammatory responses and apoptosis by targeting TLR4. Genes Genom 2020, 42, 1097–1105. [Google Scholar] [CrossRef] [PubMed]
  62. Afgar, A.; Fard-Esfahani, P.; Mehrtash, A.; Azadmanesh, K.; Khodarahmi, F.; Ghadir, M.; Teimoori-Toolabi, L. MiR-339 and especially miR-766 reactivate the expression of tumor suppressor genes in colorectal cancer cell lines through DNA methyltransferase 3B gene inhibition. Cancer Biol. Ther. 2016, 17, 1126–1138. [Google Scholar] [CrossRef] [PubMed]
  63. Li, K.; Yao, T.; Zhang, Y.; Li, W.; Wang, Z. NEAT1 as a competing endogenous RNA in tumorigenesis of various cancers: Role, mechanism and therapeutic potential. Int. J. Biol. Sci. 2021, 17, 3428–3440. [Google Scholar] [CrossRef] [PubMed]
  64. Zhao, J.; He, L.; Yin, L. lncRNA NEAT1 Binds to MiR-339-5p to Increase HOXA1 and Alleviate Ischemic Brain Damage in Neonatal Mice. Mol. Ther.-Nucleic Acids 2020, 20, 117–127. [Google Scholar] [CrossRef]
  65. Zhao, Y.; Yan, G.; Mi, J.; Wang, G.; Yu, M.; Jin, D.; Tong, X.; Wang, X. The Impact of lncRNA on Diabetic Kidney Disease: Systematic Review and In Silico Analyses. Comput. Intell. Neurosci. 2022, 2022, 8400106. [Google Scholar] [CrossRef]
  66. Hiyama, H.; Iavarone, A.; Reeves, S.A. Regulation of the cdk inhibitor p21 gene during cell cycle progression is under the control of the transcription factor E2F. Oncogene 1998, 16, 1513–1523. [Google Scholar] [CrossRef]
  67. Banas, B.; Luckow, B.; Möller, M.; Klier, C.; Nelson, P.J.; Schadde, E.; Brigl, M.; Halevy, D.; Holthöfer, H.; Reinhart, B.; et al. Chemokine and chemokine receptor expression in a novel human mesangial cell line. J. Am. Soc. Nephrol. JASN 1999, 10, 2314–2322. [Google Scholar] [CrossRef]
  68. Vlachos, I.S.; Zagganas, K.; Paraskevopoulou, M.D.; Georgakilas, G.; Karagkouni, D.; Vergoulis, T.; Dalamagas, T.; Hatzigeorgiou, A.G. DIANA-miRPath v3.0: Deciphering microRNA function with experimental support. Nucleic Acids Res. 2015, 43, W460–W466. [Google Scholar] [CrossRef]
Figure 1. NEAT1_1/2 expression in human mesangial cell (hMCs) under basal conditions and after stimulation. (A) In-situ detection of NEAT1_1/2 (green) in untreated cultured hMCs. The nuclei are stained blue by DAPI. The scale bar indicates 5 µm. (BF) Fold change of NEAT1_1/2 (grey bars) expression in hMCs after stimulation with (B) 30 mM glucose normalized to mannitol, (C) TGFβ1 normalized to medium, (D) TNFα normalized to medium, (E) thapsigargin normalized to DMSO, and (F) tunicamycin normalized to DMSO. Bars represent x-fold changes + SD. Overall significance of differences was analyzed by ANOVA, followed by Student’s t-tests for post hoc pairwise comparisons. * p < 0.05; ** p < 0.001 compared to corresponding control treatment; n = 3–4.
Ncrna 08 00052 g001
Figure 2. NEAT1 silencing in human mesangial cells (hMCs) using siPools targeting both NEAT1_1 and NEAT1_2. (A) Efficiencies of NEAT1 knockdown (KDNEAT1) after 24 or 48 h shown as x-fold changes + SD for NEAT1_1 (black bars) and NEAT1_2 (grey bars) RNA expression normalized to the expression after treatment with scrambled negative control (NCNEAT1) siRNA; n = 3. (B) In-situ detection of NEAT1_1/2 (green) in NCNEAT1 and KDNEAT1 treated hMCs. The nuclei are stained blue by DAPI. The scale bar indicates 5 µm. (C) Cell migration was analyzed by wound healing assay by measuring the gap width, directly after removing the cell culture insert (0 h) and 4 h, 8 h, and 12 h later. Black circles ± SD or grey triangles ± SD represent NCNEAT1 and KDNEAT1 treated hMCs, respectively; n = 3. (D) Proliferation rate of hMCs after KDNEAT1 (grey bar + SD) compared to NCNEAT1 (black bar). Proliferation was ascertained by a BrdU assay; n = 5. (E) Cell size in µm2 of hMCs after KDNEAT1 (grey bar + SD) compared to NCNEAT1 (black bar + SD). Cell size measurement based on WGA immunostaining followed by morphometric analyses; n = 3. Overall significance of differences was analyzed by ANOVA, followed by Student’s t-tests for post hoc pairwise comparisons. * p < 0.05; ** p < 0.001.
Ncrna 08 00052 g002
Figure 3. Analysis of differentially expressed coding genes (DECGs) in human mesangial cells (hMCs) after NEAT1 silencing compared to negative control siRNA treated cells. (A) The Venn diagram depicts the number of DECGs 24 h (left) and 48 h (right) after the NEAT1 knockdown in hMCs. The overlapping region between both circles represents genes which were differentially expressed at both times. The encircled value corresponds to the total number of DECGs, and the cyphers in the yellow or blue arrow represent the number of up- and downregulated DECGs, respectively; n = 3. (BD) Validation of selected DECGs found in the microarray via qPCR, with (B) DECGs (CDKN1A and TGFb2) after 24 h, (C) DECGs (CDK6 and GNG4) after 48 h, and (D) DECGs (CTGF and CCND1) after 24 h and 48 h. Black bars + SD show x-fold changes of gene expression in microarray (normalized to internal controls), grey bars + SD show x-fold changes of gene expression validated by qPCR (normalized to peptidylprolyl isomerase B); * p < 0.05; ** p < 0.001; n = 3–4. (EI) In-silico enrichment analyses based on all DECGs detected by microarray analysis. Illustrations show selected significantly enriched terms (p < 0.05; EASE score < 0.05), which are relevant for mesangial physiology, sorted by count of DECGs. The complete list is shown in the Supplement. (E) Functional enrichment analysis in terms of selected Genetic Association Database (GAD) diseases. (FH) Functional enrichment analysis in terms of Gene Ontology (GO) with the aspects (F) Biological Processes (BP), (G) Cellular Component (CC), and (H) Molecular Function (MF). (I) Functional enrichment analysis in terms of Kyoto Encyclopedia of Genes and Genomes (KEGG) pathways. Abbreviations: HDL: high density lipoprotein; SMC: smooth muscle cell; ER: endoplasmic reticulum; bind.: binding.
Ncrna 08 00052 g003
Figure 4. Analysis of differentially expressed miRNAs (DEmiRNAs) in human mesangial cells (hMCs) after NEAT1 silencing compared to negative control siRNA treated cells. (A) The Venn diagram indicates the number of DEmiRNAs 24 h (left) and 48 h (right) after the second NEAT1 knockdown in hMCs. The overlapping region between both circles represents miRNAs, which were differentially expressed at both times. The encircled value corresponds to the total number of DEmiRNAs, and the ciphers in the yellow or blue arrow represent the number of up- and downregulated DEmiRNAs, respectively; n = 3. (B) Validation of selected DEmiRNAs (miR-331-3p, miR-339-5p, miR-450b-5p) found in the microarray via qPCR. Black bars + SD show x-fold changes of gene expression in microarray (normalized to internal controls), grey bars + SD show x-fold changes of gene expression validated by qPCR (normalized to hsa-5S-rRNA); * p < 0.05; ** p < 0.001; n.s.: not significant; n = 3. (C,D) In-silico enrichment analyses based on DEmiRNAs, using DECGs detected by the microarray as filter. Illustrations show selected significantly enriched terms (p < 0.05; EASE score < 0.05), which are relevant for mesangial physiology, sorted by count. The complete list is shown in the Supplement. (C) Functional enrichment analysis in terms of Gene Ontology (GO) Biological Processes (BP). (D) Functional enrichment analysis in terms of Kyoto Encyclopedia of Genes and Genomes (KEGG) pathways. Abbreviations: TGFb: transforming growth factor b; SMC: smooth muscle cell; PI3K-Akt: phosphatidylinositol 3-kinase—protein kinase B; FOXO: forkhead box O.
Ncrna 08 00052 g004
Figure 5. Functional enrichment analysis of differentially expressed coding genes (DECGs) in human mesangial cells (hMCs) with predicted miR-339-5p targeting site. Significant enriched terms in respect of (A) Genetic Association Database (GAD) diseases (the complete list is shown in the Supplement), as well as (B) Molecular Function (MF). (C) Functional enrichment analysis in terms of Kyoto Encyclopedia of Genes and Genomes (KEGG) pathways. Abbreviation: HIF: hypoxia induced factor. Selected significant terms (according to DAVID integrated algorithms) are sorted by count. Additionally, significance regarding actual over-representation of a particular term was analyzed by hypergeometric testing. * p < 0.05; ** p < 0.01; *** p < 0.001; n.s. = not significant. (D) Predicted miR-399-5p targeting sites for NEAT1_1/2 indicated by grey and black arrows. Loci marked with black arrows were analyzed via luciferase reporter gene assays. Information and result for the site with the framed black arrow are shown in (E,F) in this figure. (E) Potential interaction site of miR-339-5p and NEAT1. The sequences of miR-339-5p, wildtype (WT) NEAT1 and designed mutated (MUT) NEAT1 are shown. (F) Dual-luciferase reporter assay in hMCs showing the effect of miR-339-5p cotransfected with pmirGlo vector containing either WT or MUT NEAT1 sequence, displayed by black bar + SD or grey bars + SD, respectively, n = 3–4. DECG (grey bars). Significance was analyzed by Student’s t-test. * p < 0.05.
Ncrna 08 00052 g005
Figure 6. Effects of miR-399-5p overexpression (OEmiR339-5p) on human mesangial cells (hMCs) using miR-339-5p mimics. (A) Reduced expression of NEAT1_1/2 after OEmiR339-5p was detected after 24 or 48 h, shown as x-fold changes + SD for NEAT1_1 (black bars + SD) and NEAT1_2 (grey bars + SD), normalized to the expression after treatment with negative control RNA (NCmiR339-5p); n = 4. (B) Cell migration was analyzed by wound healing assay by measuring the gap width, directly after removing the cell culture insert (0 h) and 4 h, 8 h, 12 h, and 24 h later. Black circles ± SD or grey triangles ± SD represent hMCs subjected to NCmiR339-5p and OEmiR339-5p, respectively; n = 4. (C) Proliferation rate of hMCs after OEmiR339-5p (grey bar + SD) compared to NCmiR339-5p treated cells (black bar + SD). Proliferation was ascertained by a BrdU assay; n = 4. (D) Cell size in µm2 of hMCs after OEmiR339-5p (grey bar + SD) compared to NCmiR339-5p treated cells (black bar+ SD). Cell size measurement based on WGA immunostaining followed by morphometric analyses; n = 3. (E) x-fold change of mRNA expression of selecteup- or downregulated differentially expressed coding genes with predicted miR-339-5p binding site after KDNEAT1 (black bars + SD) and OEmiR339-5p (grey bars + SD), respectively, compared to the corresponding NCNEAT1 or NCmiR339-5p, n = 3–4. (F) x-fold change of mRNA expression of selecteup- or downregulated differentially expressed coding genes without predicted miR-339-5p binding site after KDNEAT1 (black bars + SD) and OEmiR339-5p (grey bars + SD) compared to the corresponding NCNEAT1 or NCmiR339-5p, n = 3–4. Significance was analyzed by Student’s t-tests. * p < 0.05; ** p < 0.01; *** p < 0.001; n.s. = not significant.
Ncrna 08 00052 g006
Table 1. x-fold changes (xFC) of DECGs with predicted miR339-5p binding site.
Upregulated DECGsDownregulated DECGs
NamexFCNamexFC
SERPINE1−11.82EPB412.03
EDN1−11.13CBFA2T22.07
RGS4−4.77RAB152.08
IGFBP3−4.19PDK22.17
SKP2−3.55CUX12.39
NT5DC3−3.3MXD42.54
DDAH1−3.17ITPK12.55
VGLL3−3.09SMC1A2.65
FLNA−3.01CDKN1A2.75
ENTPD7−2.97TGFBR32.89
LBH−2.95BTBD22.92
DCP2−2.93MAN2A23.19
SRGN−2.91OAS37.21
HMGCR−2.66
CDK6−2.57
NAV3−2.53
LBR−2.45
GSKIP−2.4
RUFY2−2.29
ATXN1−2.2
TACC1−2.2
PDE4D−2.19
COPZ1−2.19
CCDC50−2.17
DUSP5−2.16
TMEM2−2.08
ENC1−2.03
Publisher’s Note: MDPI stays neutral with regard to jurisdictional claims in published maps and institutional affiliations.

