
MicroRNA Isoforms Contribution to Melanoma Pathogenesis


Abstract
:1. Introduction
2. Results
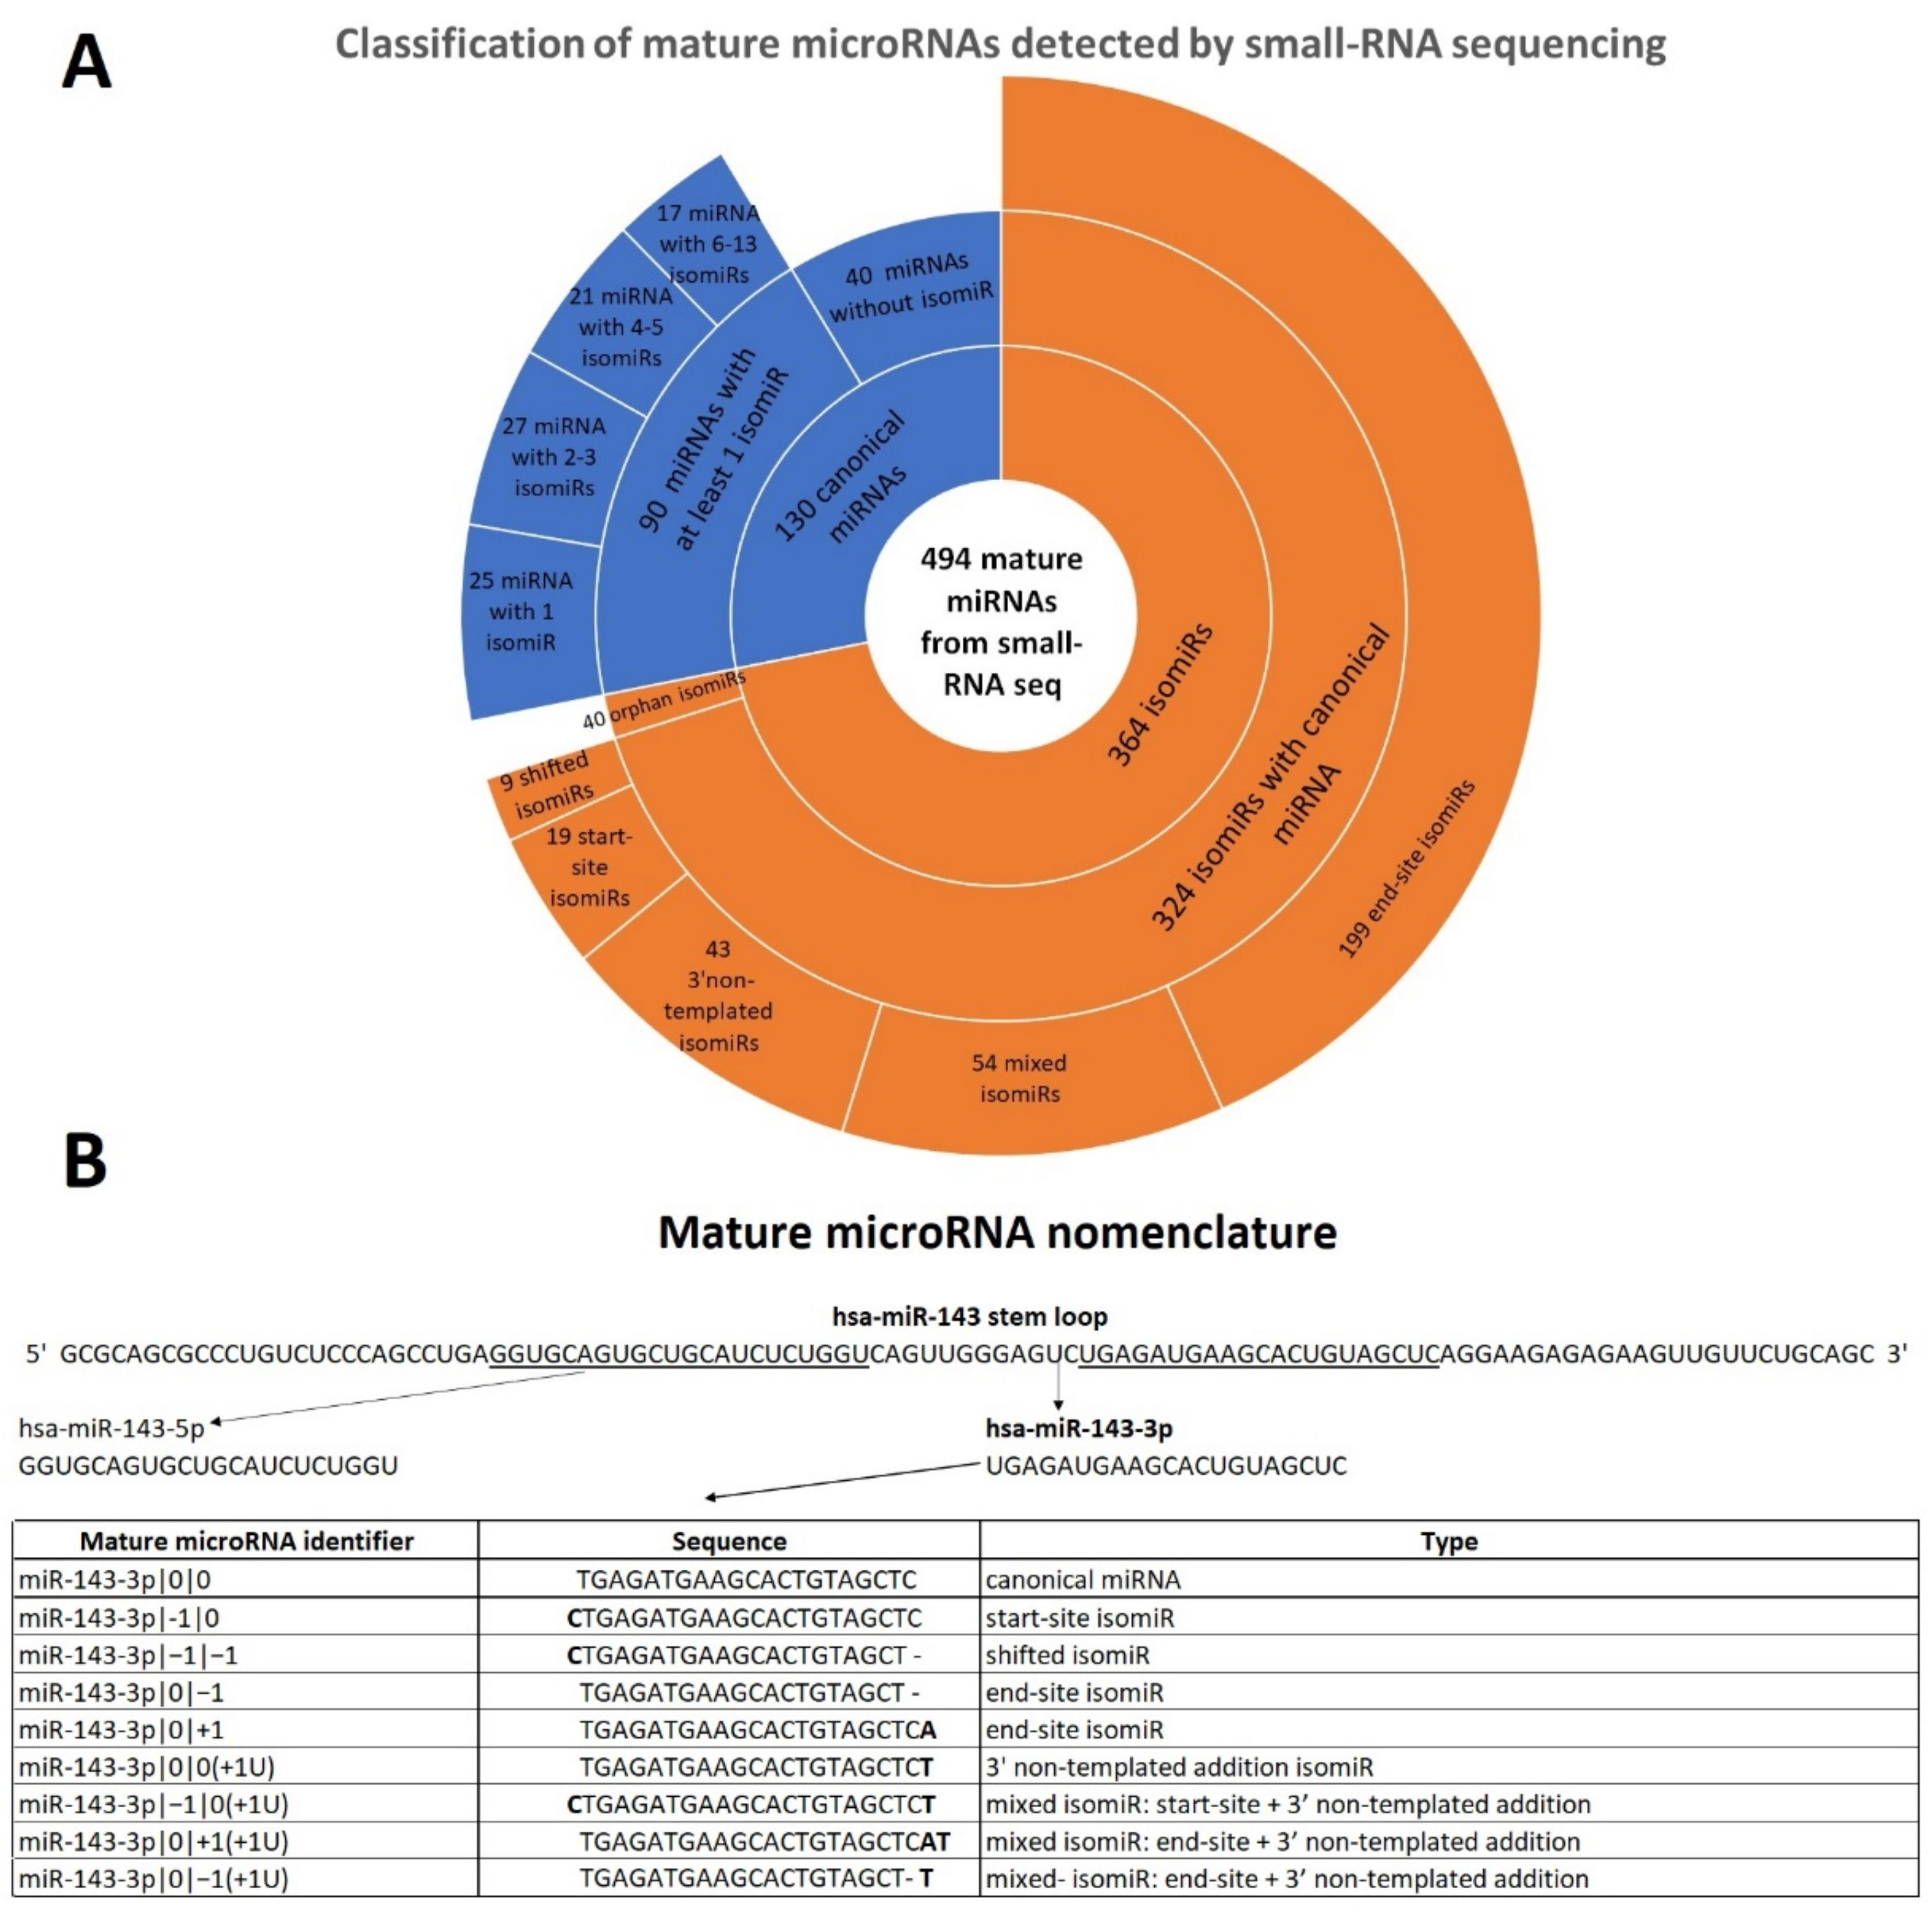
2.1. Mature microRNA Profile and miRNA Variants Characterization in Early-Stage Melanoma Samples
2.2. End-Site isomiRs Are the Most Abundant and Expressed isomiRs in FFPE Samples
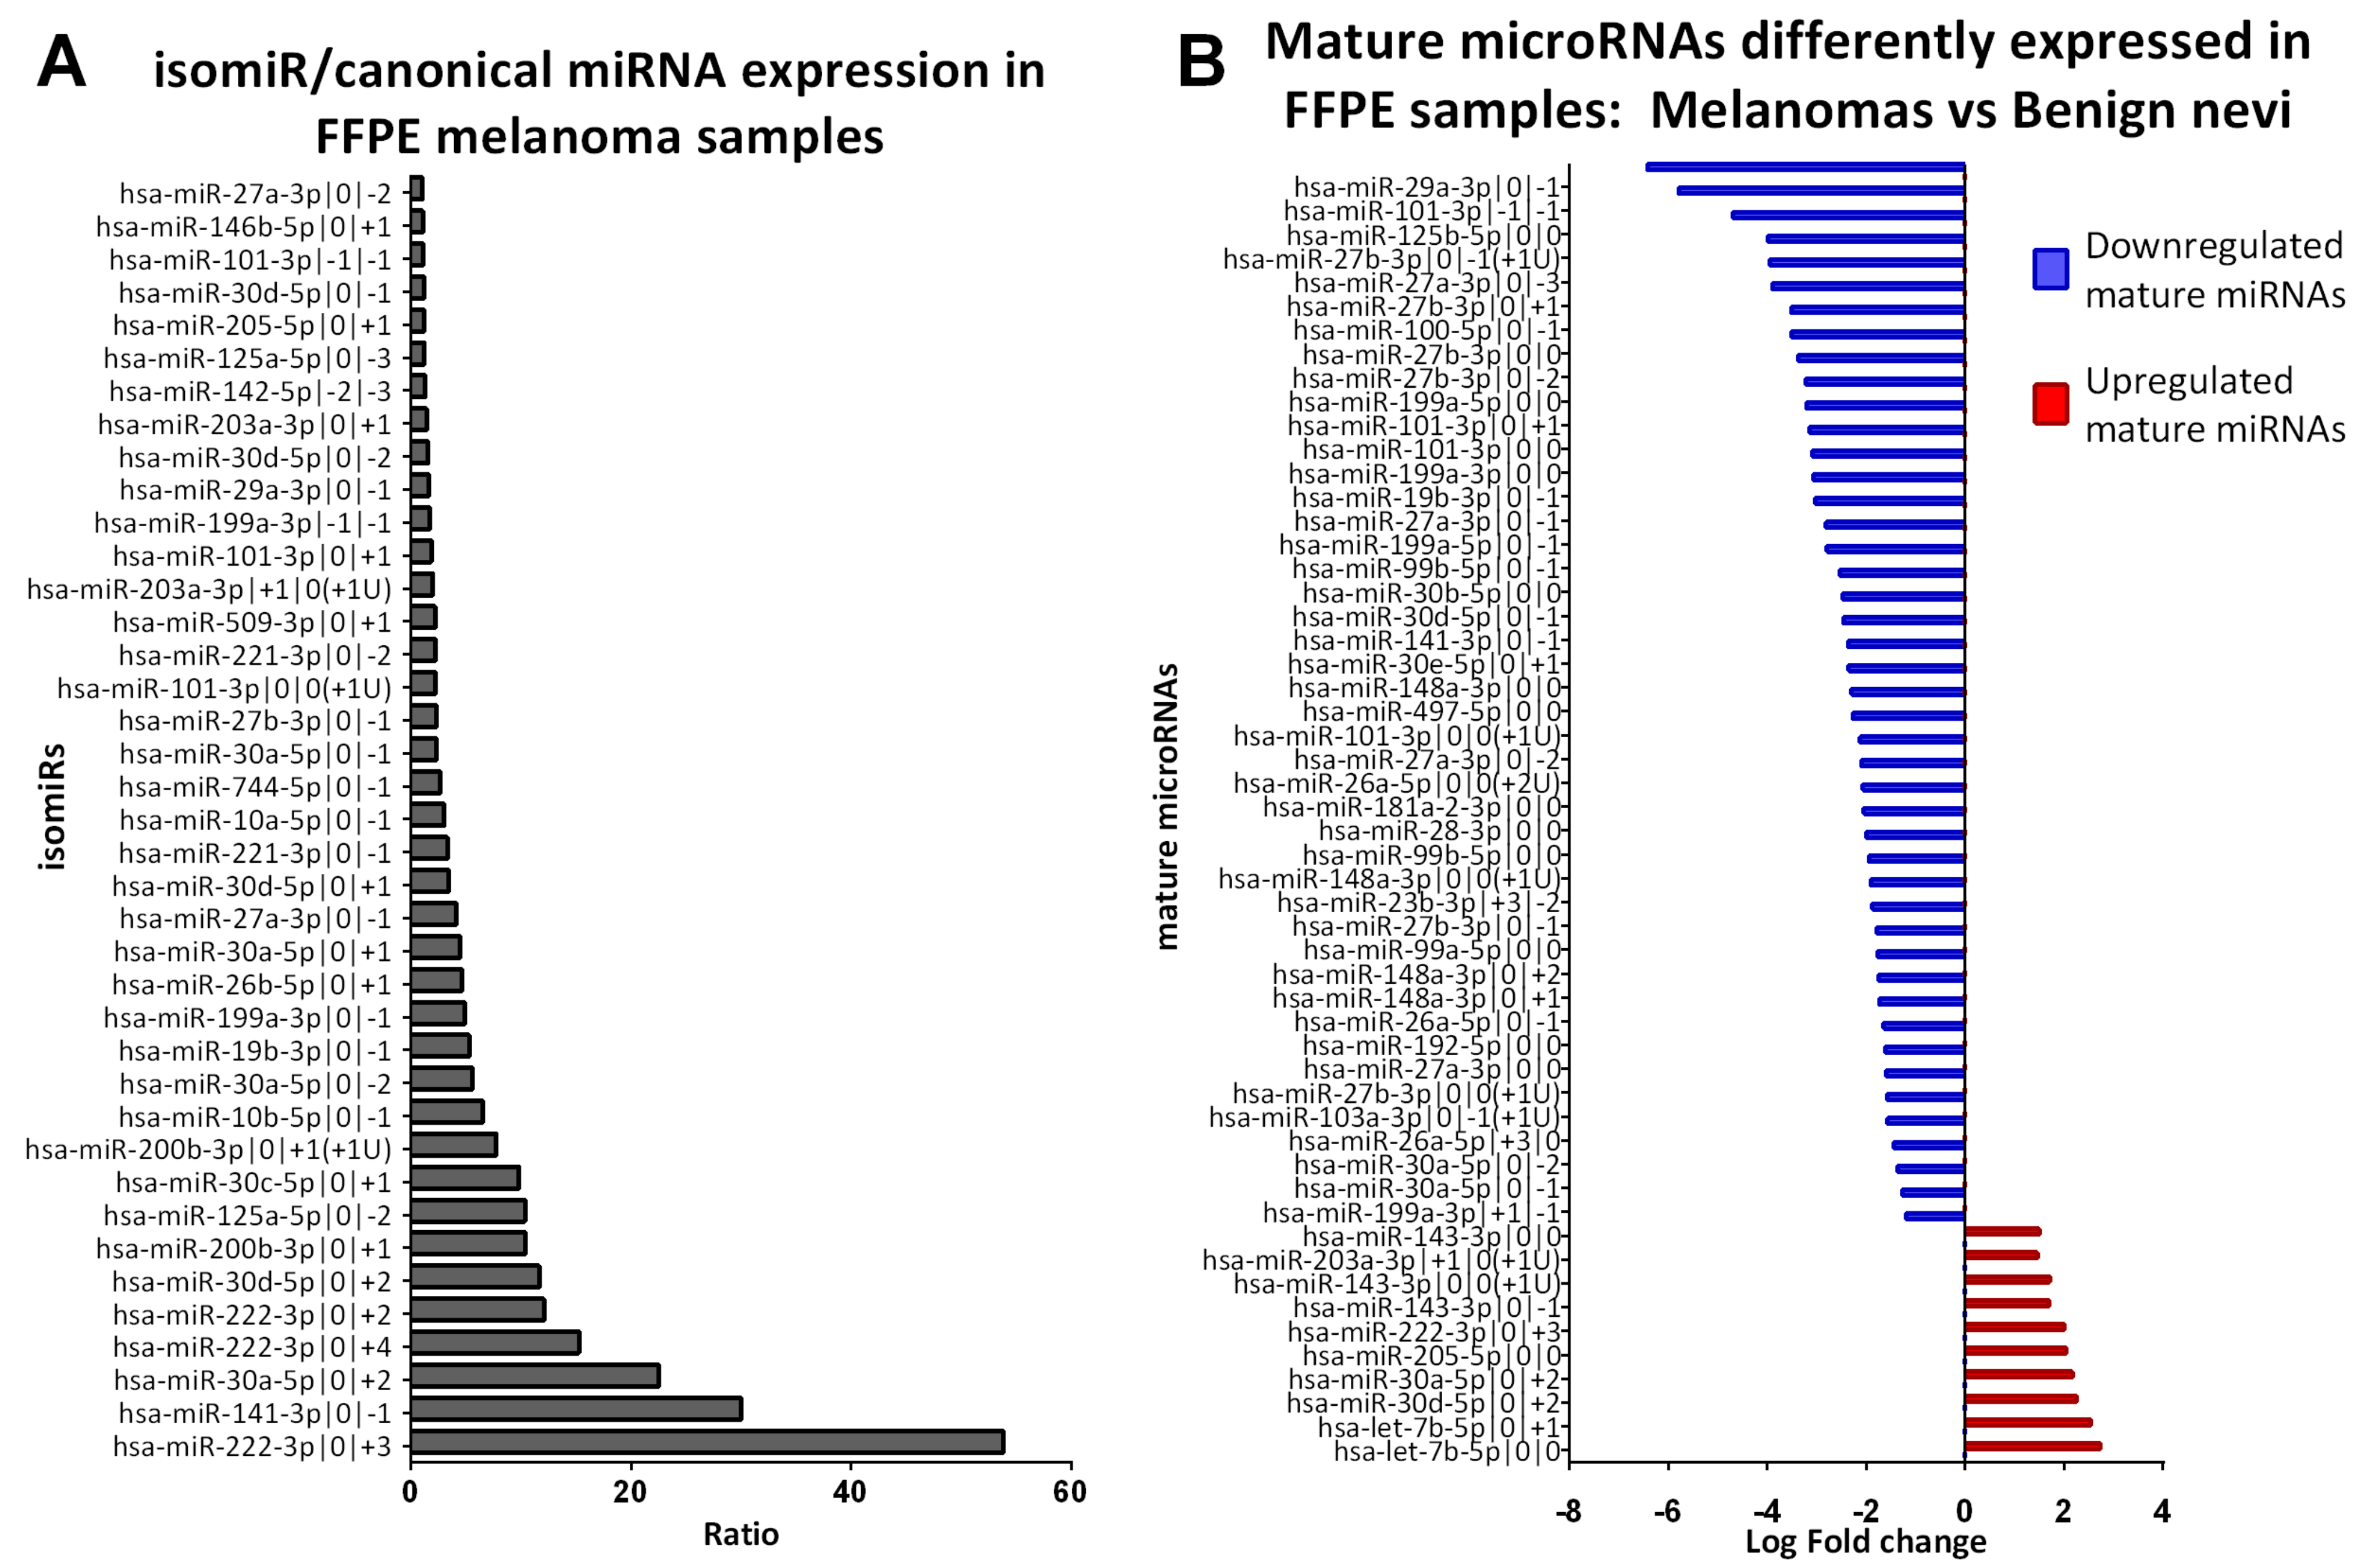
2.3. Identification of isomiRs More Expressed Than the Canonical Form in Early-Stage Melanoma
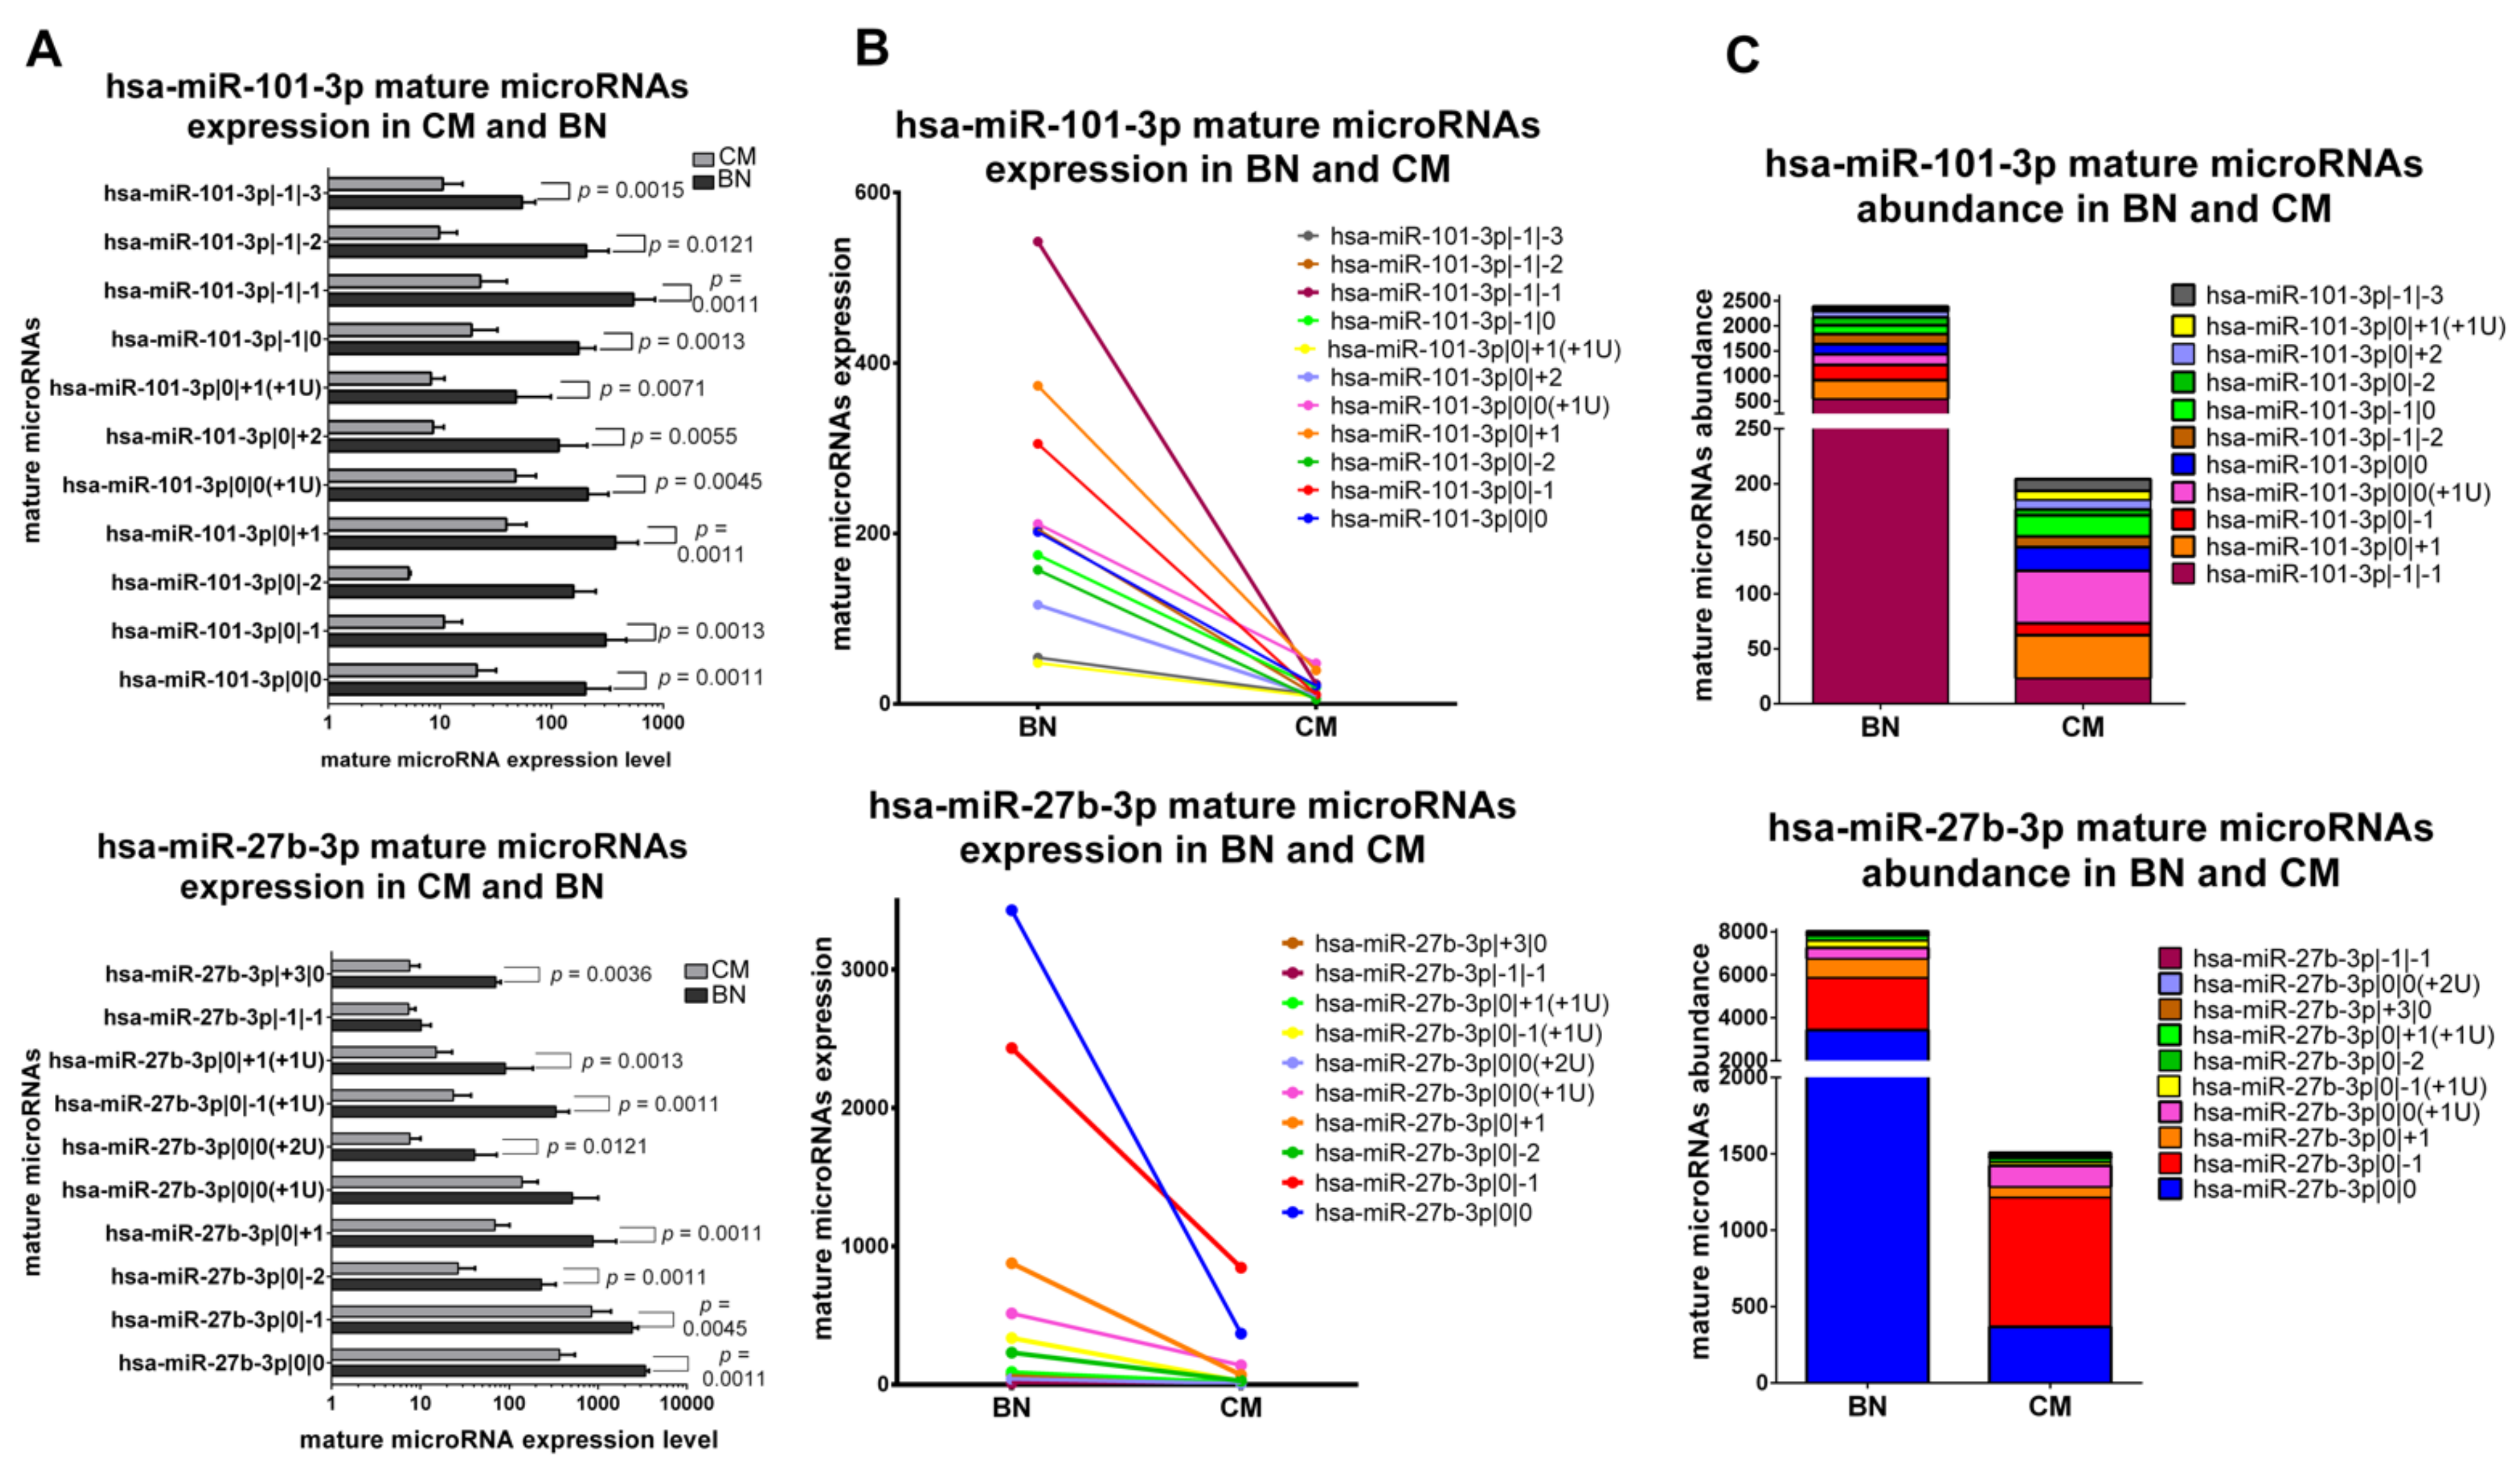
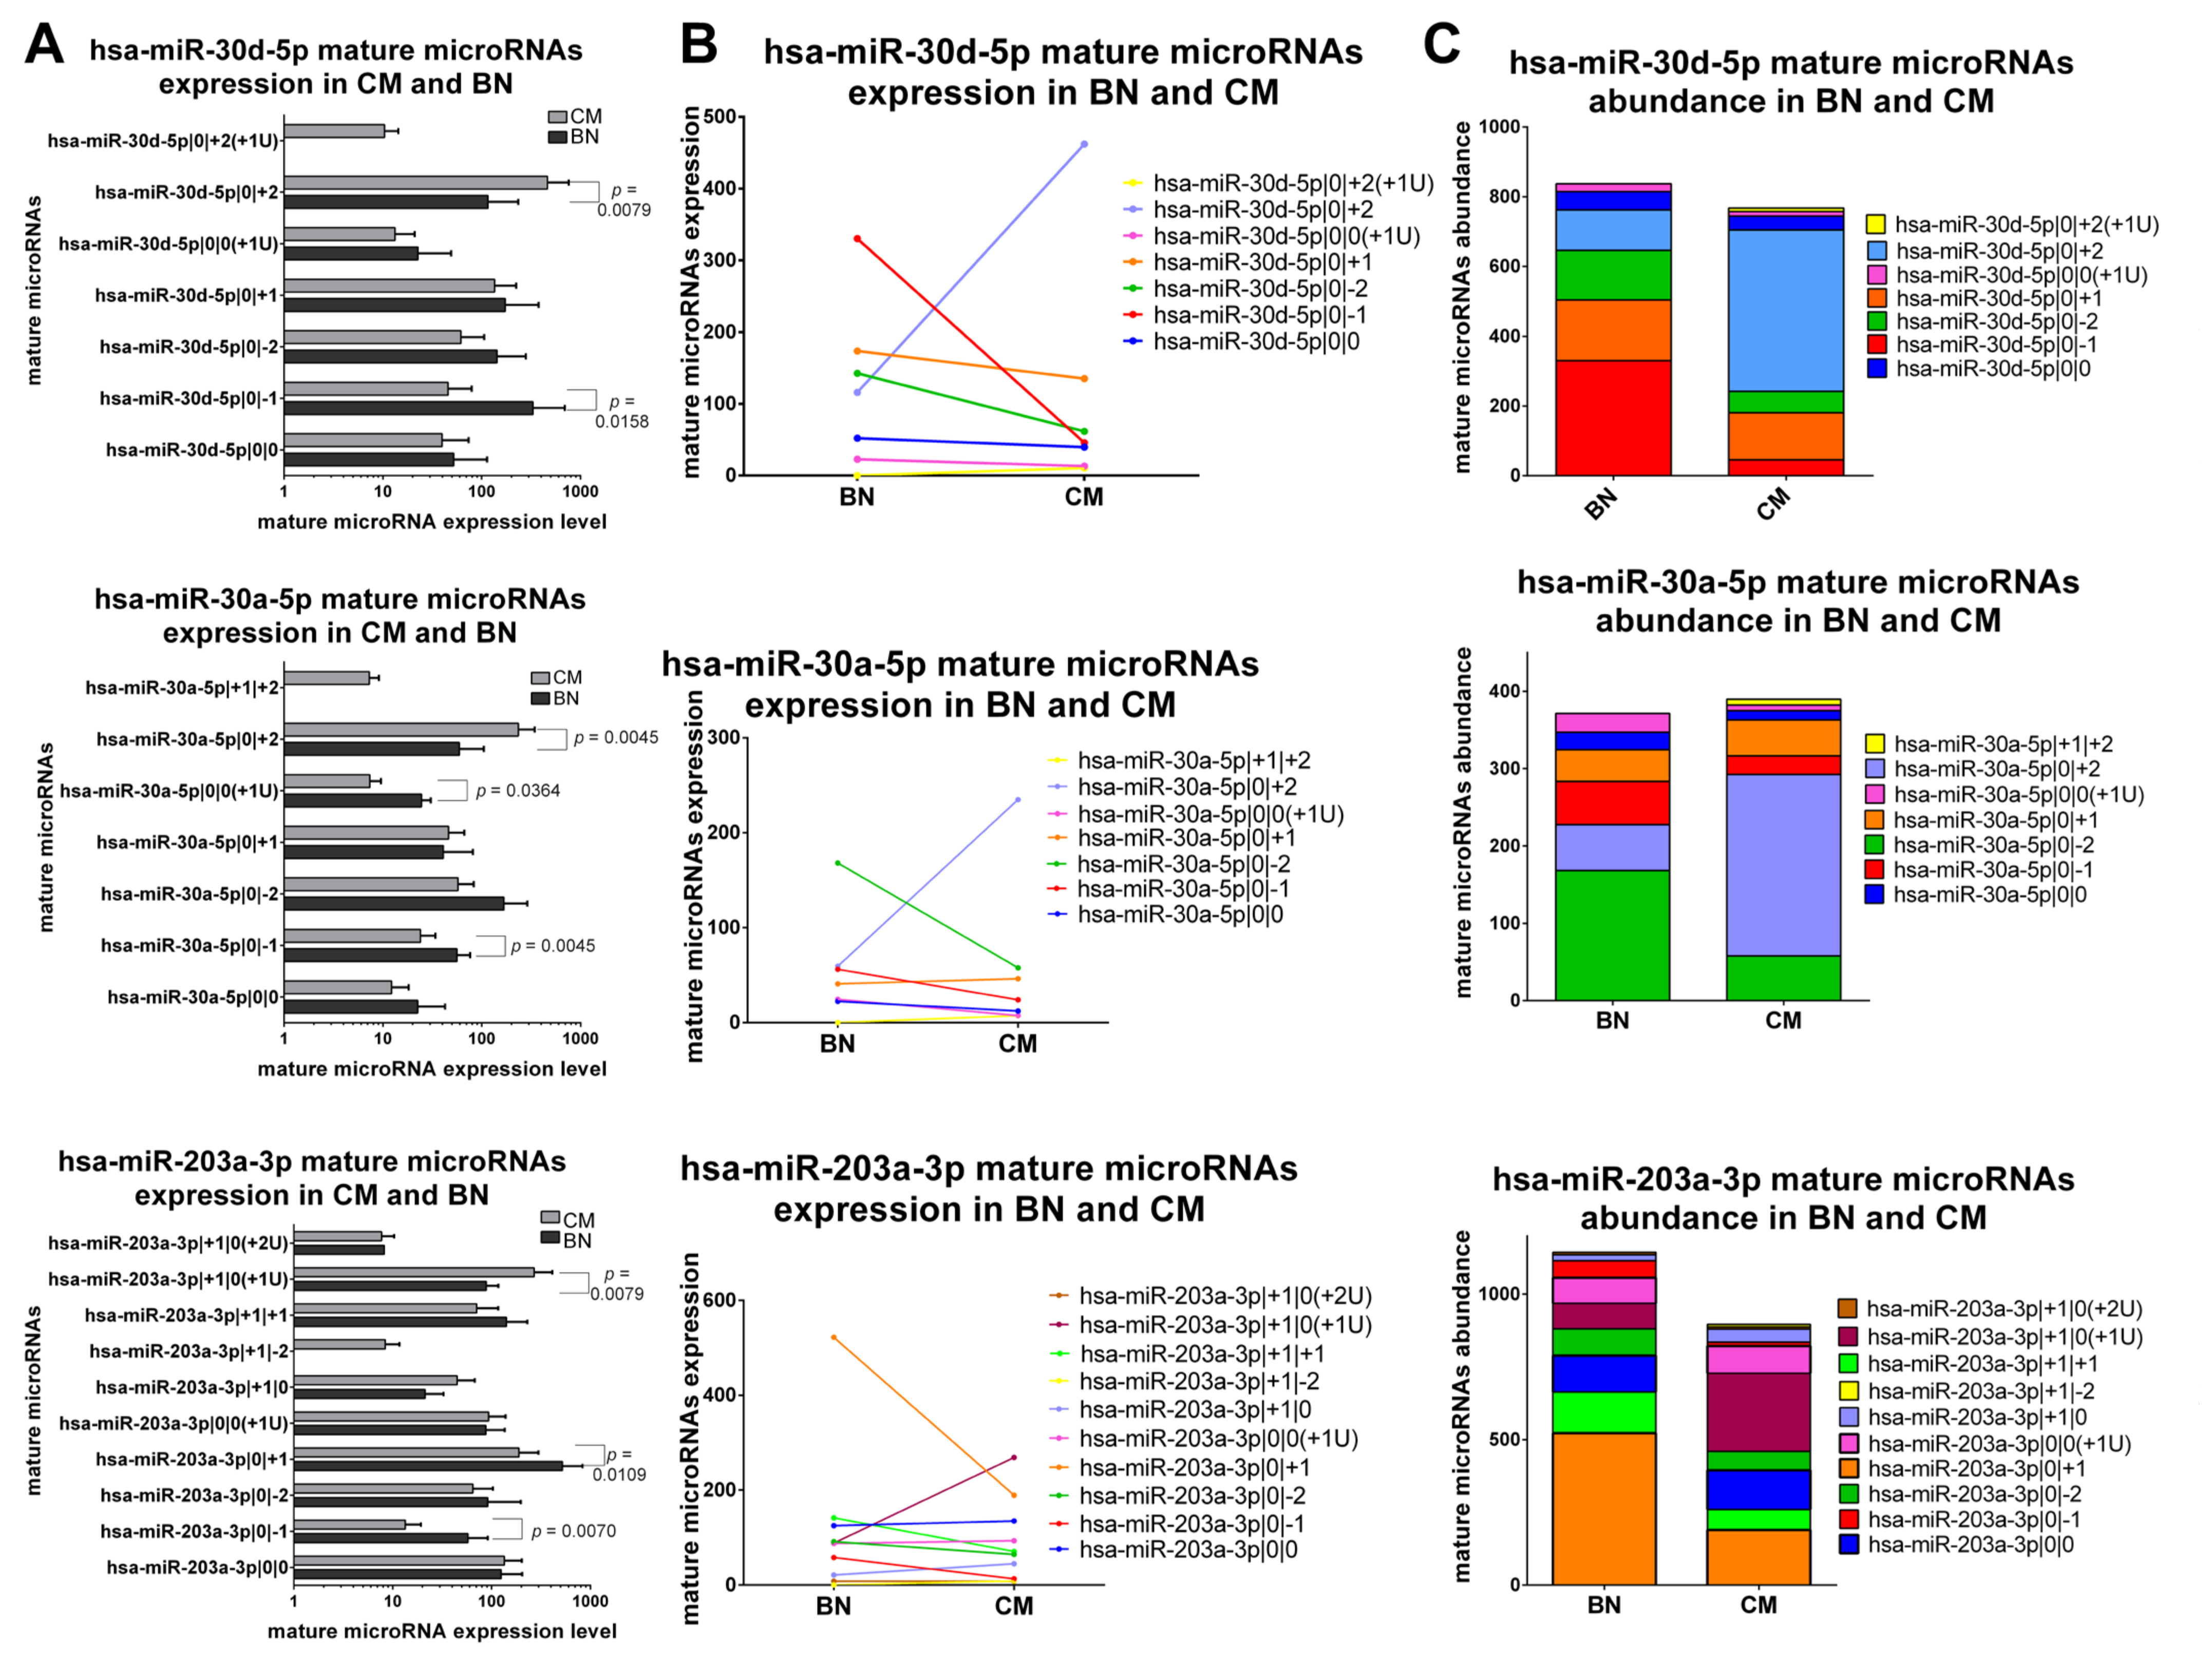
2.4. Benign Nevi and Early-Stage Melanoma Present a Different Mature microRNA Expression Profile
2.5. Classification of isomiRs with a Potentially Relevant Role in Early-Stage Melanoma
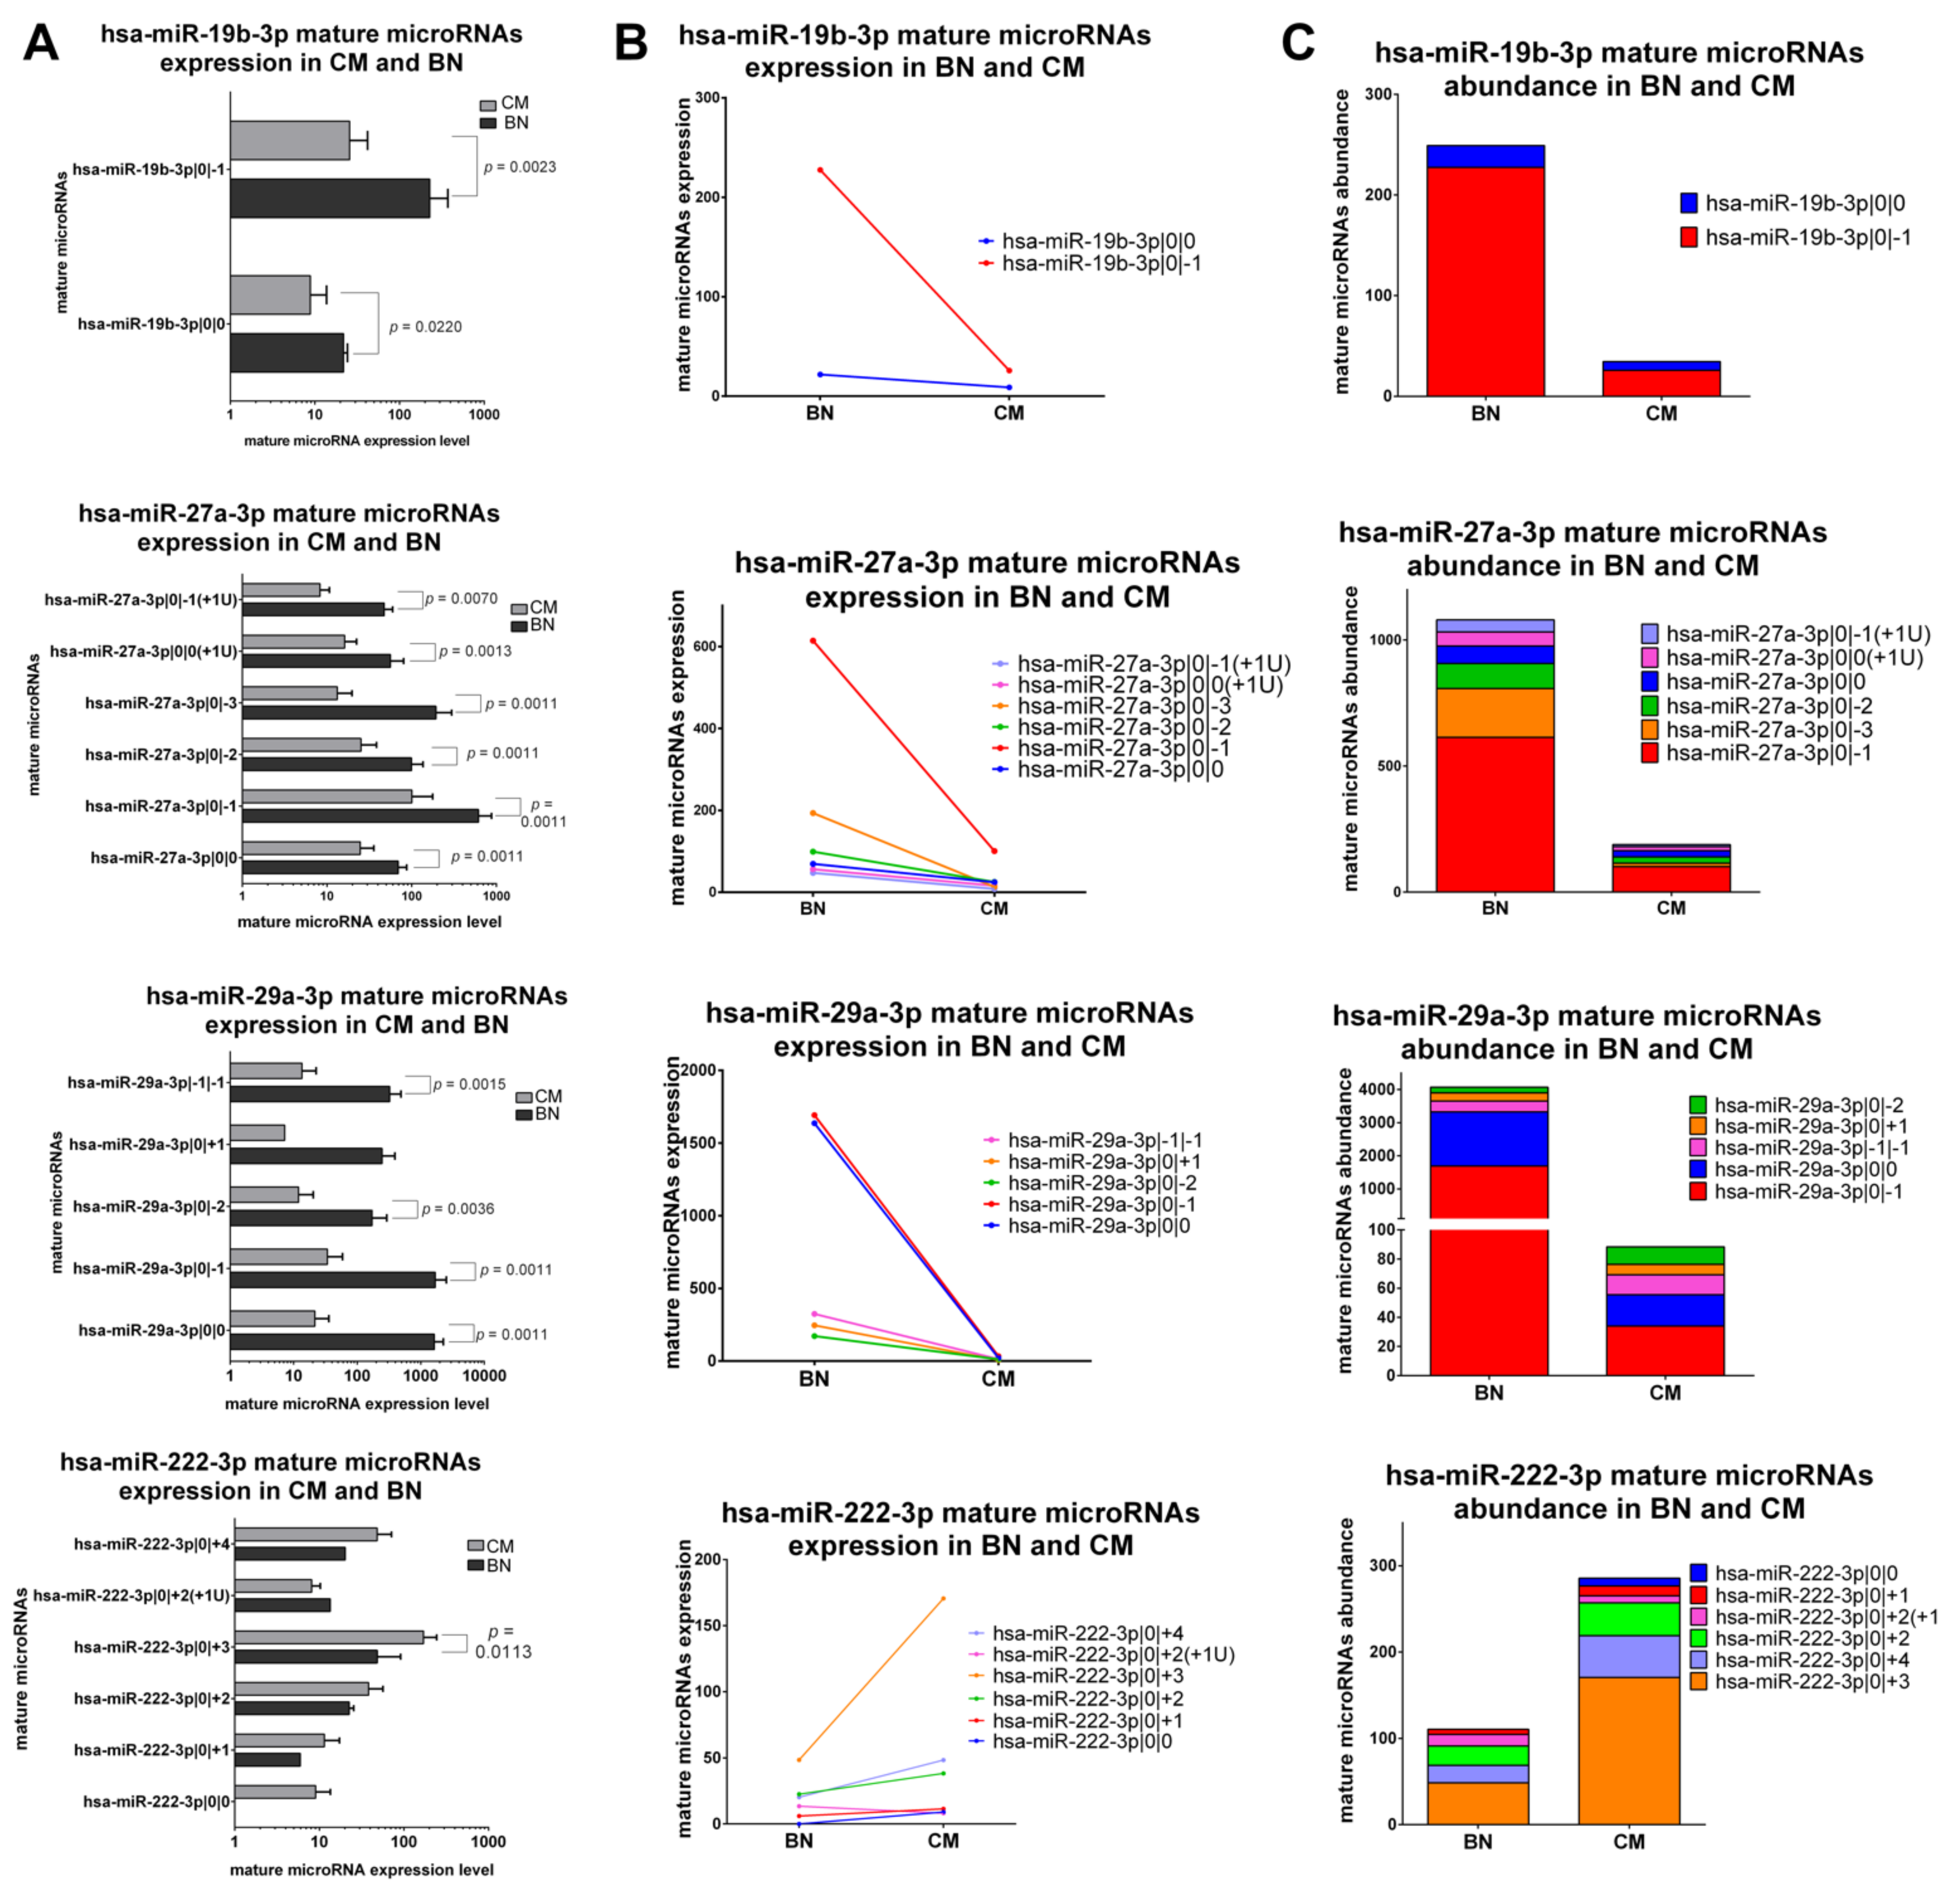
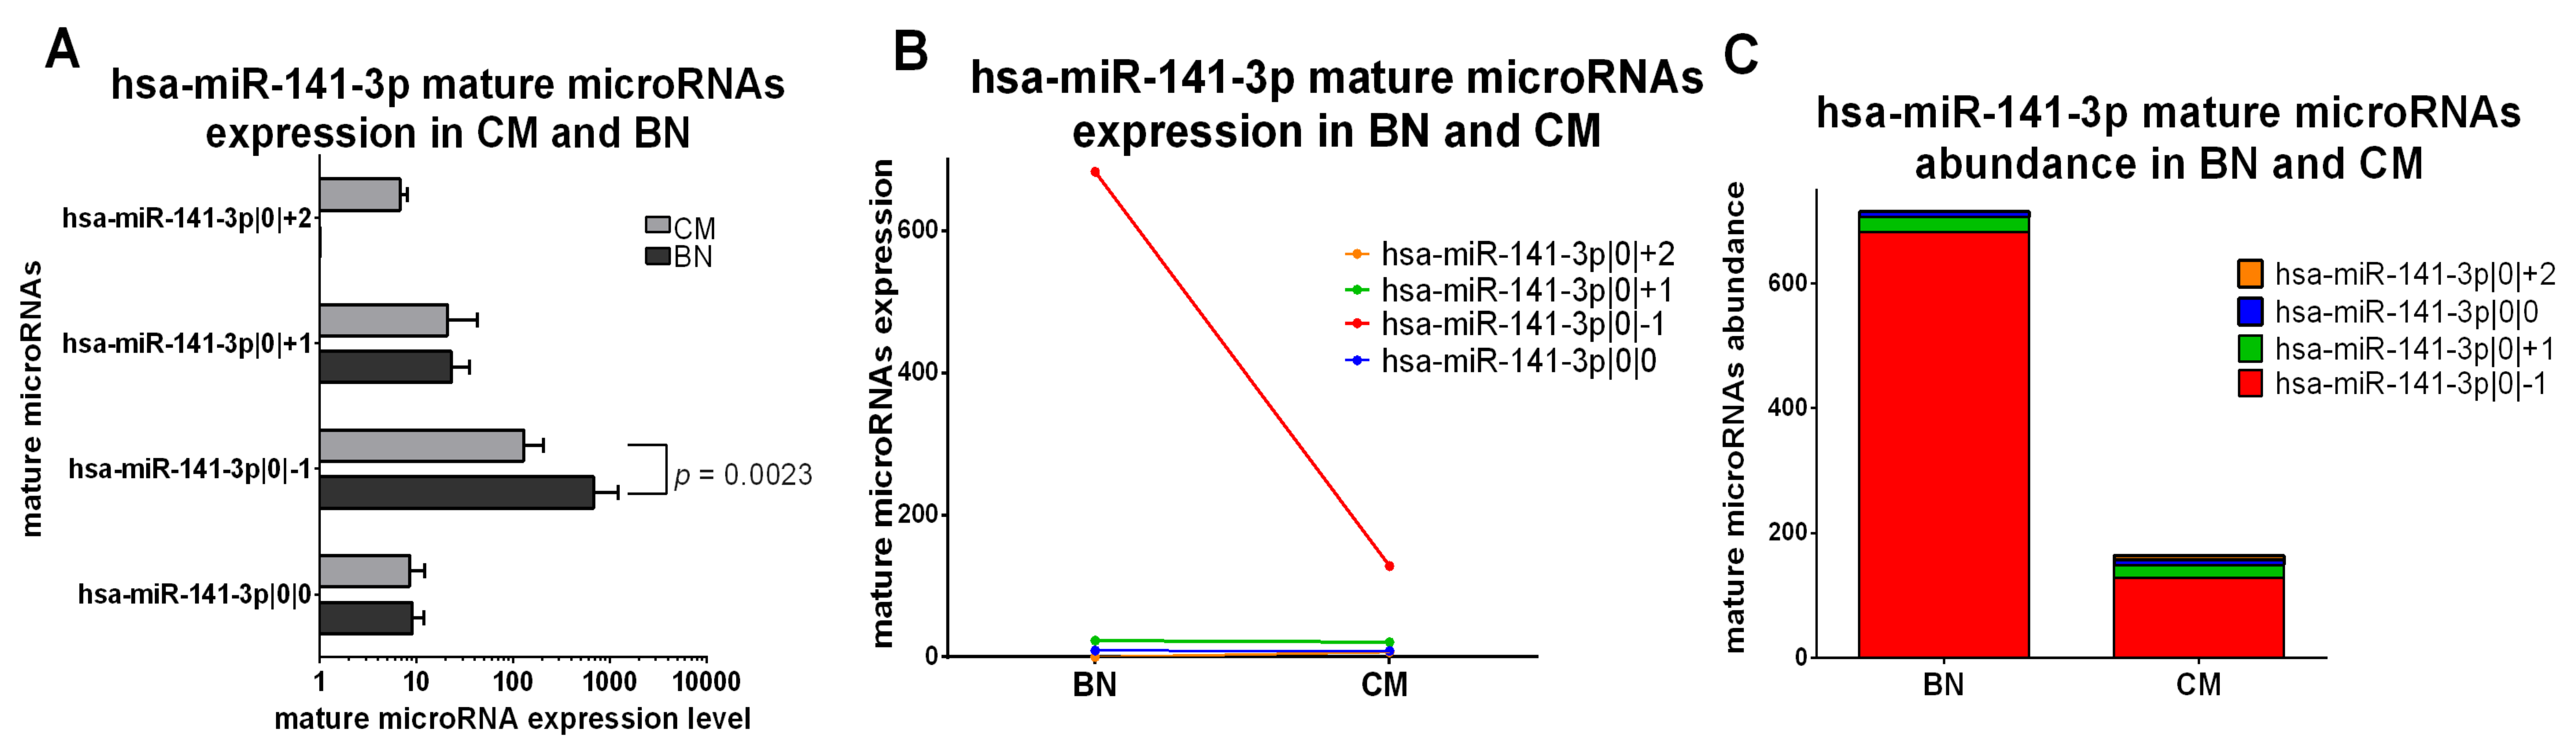
2.5.1. IsomiRs with a Similar Trend in Early-Stage CM vs. BN and Similar Relative Abundance
2.5.2. IsomiRs with a Similar Trend in CM vs. BN and Different Relative Abundance
2.5.3. IsomiRs with Opposite Trend in CM vs. BN and Similar Relative Abundance
2.5.4. IsomiRs with Opposite Trend in CM vs. BN and Different Relative Abundance
2.6. IsomiR Classification in Fresh-Frozen Primary Melanoma and Metastasis from TCGA Database
2.7. Identification of the isomiRs More Expressed Than the Canonical Form in Fresh Primary Melanoma Samples from TCGA
2.8. IsomiR Expression Contributes to Distinguish Primary Melanoma and Metastasis
2.9. Identification of isomiRs Associated with Driver GeneMutations in TCGA Samples
2.9.1. Identification of Mature microRNAs Associated with Mutated NF1
2.9.2. Identification of Mature microRNAs Associated with Mutated BRAF
2.9.3. Identification of Mature microRNAs Associated with Mutated NRAS
3. Discussion
4. Materials and Methods
4.1. FFPE Samples and Small-RNA Sequencing Data
4.2. IsomiR Analysis of TCGA SKCM Cohort
4.3. IsomiR Identification
4.4. IsomiR Labeling and Classification
4.5. Statistical Analysis
5. Conclusions
Supplementary Materials
Author Contributions
Funding
Institutional Review Board Statement
Informed Consent Statement
Data Availability Statement
Conflicts of Interest
References
- Gershenwald, J.E.; Scolyer, R.A. Melanoma Staging: American Joint Committee on Cancer (AJCC) 8th Edition and Beyond. Ann. Surg. Oncol. 2018, 25, 2105–2110. [Google Scholar] [CrossRef]
- Rastrelli, M.; Tropea, S.; Pigozzo, J.; Bezzon, E.; Campana, L.G.; Stramare, R.; Alaibac, M.; Rossi, C.R. Melanoma m1: Diagnosis and therapy. In Vivo 2014, 28, 273–285. [Google Scholar] [PubMed]
- Shain, A.H.; Yeh, I.; Kovalyshyn, I.; Sriharan, A.; Talevich, E.; Gagnon, A.; Dummer, R.; North, J.; Pincus, L.; Ruben, B.; et al. The Genetic Evolution of Melanoma from Precursor Lesions. N. Engl. J. Med. 2015, 373, 1926–1936. [Google Scholar] [CrossRef] [PubMed]
- Helgadottir, H.; Tuominen, R.; Olsson, H.; Hansson, J.; Hoiom, V. Cancer risks and survival in patients with multiple primary melanomas: Association with family history of melanoma and germline CDKN2A mutation status. J. Am. Acad. Dermatol. 2017, 77, 893–901. [Google Scholar] [CrossRef]
- Tsao, H.; Niendorf, K. Genetic testing in hereditary melanoma. J. Am. Acad. Dermatol. 2004, 51, 803–808. [Google Scholar] [CrossRef]
- Read, J.; Wadt, K.A.; Hayward, N.K. Melanoma genetics. J. Med. Genet. 2016, 53, 1–14. [Google Scholar] [CrossRef] [PubMed] [Green Version]
- Yarchoan, M.; Albacker, L.A.; Hopkins, A.C.; Montesion, M.; Murugesan, K.; Vithayathil, T.T.; Zaidi, N.; Azad, N.S.; Laheru, D.A.; Frampton, G.M.; et al. PD-L1 expression and tumor mutational burden are independent biomarkers in most cancers. JCI Insight 2019, 4, e126908. [Google Scholar] [CrossRef] [Green Version]
- Davis, E.J.; Johnson, D.B.; Sosman, J.A.; Chandra, S. Melanoma: What do all the mutations mean? Cancer 2018, 124, 3490–3499. [Google Scholar] [CrossRef]
- Cancer Genome Atlas, N. Genomic Classification of Cutaneous Melanoma. Cell 2015, 161, 1681–1696. [Google Scholar] [CrossRef] [Green Version]
- Davies, H.; Bignell, G.R.; Cox, C.; Stephens, P.; Edkins, S.; Clegg, S.; Teague, J.; Woffendin, H.; Garnett, M.J.; Bottomley, W.; et al. Mutations of the BRAF gene in human cancer. Nature 2002, 417, 949–954. [Google Scholar] [CrossRef]
- Maertens, O.; Johnson, B.; Hollstein, P.; Frederick, D.T.; Cooper, Z.A.; Messiaen, L.; Bronson, R.T.; McMahon, M.; Granter, S.; Flaherty, K.; et al. Elucidating distinct roles for NF1 in melanomagenesis. Cancer Discov. 2013, 3, 338–349. [Google Scholar] [CrossRef] [Green Version]
- Menzies, A.M.; Long, G.V. Systemic treatment for BRAF-mutant melanoma: Where do we go next? Lancet Oncol. 2014, 15, e371–381. [Google Scholar] [CrossRef]
- Riefolo, M.; Porcellini, E.; Dika, E.; Broseghini, E.; Ferracin, M. Interplay between small and long non-coding RNAs in cutaneous melanoma: A complex jigsaw puzzle with missing pieces. Mol. Oncol. 2019, 13, 74–98. [Google Scholar] [CrossRef]
- Negrini, M.; Ferracin, M.; Sabbioni, S.; Croce, C.M. MicroRNAs in human cancer: From research to therapy. J. Cell Sci. 2007, 120, 1833–1840. [Google Scholar] [CrossRef] [PubMed] [Green Version]
- Durante, G.; Comito, F.; Lambertini, M.; Broseghini, E.; Dika, E.; Ferracin, M. Non-coding RNA dysregulation in skin cancers. Essays Biochem. 2021. [Google Scholar] [CrossRef]
- Lu, J.; Getz, G.; Miska, E.A.; Alvarez-Saavedra, E.; Lamb, J.; Peck, D.; Sweet-Cordero, A.; Ebert, B.L.; Mak, R.H.; Ferrando, A.A.; et al. MicroRNA expression profiles classify human cancers. Nature 2005, 435, 834–838. [Google Scholar] [CrossRef]
- Volinia, S.; Calin, G.A.; Liu, C.G.; Ambs, S.; Cimmino, A.; Petrocca, F.; Visone, R.; Iorio, M.; Roldo, C.; Ferracin, M.; et al. A microRNA expression signature of human solid tumors defines cancer gene targets. Proc. Natl. Acad. Sci. USA 2006, 103, 2257–2261. [Google Scholar] [CrossRef] [PubMed] [Green Version]
- Griffiths-Jones, S.; Grocock, R.J.; van Dongen, S.; Bateman, A.; Enright, A.J. miRBase: microRNA sequences, targets and gene nomenclature. Nucleic Acids Res. 2006, 34, D140–144. [Google Scholar] [CrossRef] [PubMed]
- Cloonan, N.; Wani, S.; Xu, Q.; Gu, J.; Lea, K.; Heater, S.; Barbacioru, C.; Steptoe, A.L.; Martin, H.C.; Nourbakhsh, E.; et al. MicroRNAs and their isomiRs function cooperatively to target common biological pathways. Genome Biol. 2011, 12, R126. [Google Scholar] [CrossRef] [PubMed] [Green Version]
- Kim, V.N. MicroRNA biogenesis: Coordinated cropping and dicing. Nat. Rev. Mol. Cell Biol. 2005, 6, 376–385. [Google Scholar] [CrossRef]
- Burroughs, A.M.; Ando, Y.; de Hoon, M.J.; Tomaru, Y.; Nishibu, T.; Ukekawa, R.; Funakoshi, T.; Kurokawa, T.; Suzuki, H.; Hayashizaki, Y.; et al. A comprehensive survey of 3’ animal miRNA modification events and a possible role for 3’ adenylation in modulating miRNA targeting effectiveness. Genome Res. 2010, 20, 1398–1410. [Google Scholar] [CrossRef] [Green Version]
- Chiang, H.R.; Schoenfeld, L.W.; Ruby, J.G.; Auyeung, V.C.; Spies, N.; Baek, D.; Johnston, W.K.; Russ, C.; Luo, S.; Babiarz, J.E.; et al. Mammalian microRNAs: Experimental evaluation of novel and previously annotated genes. Genes Dev. 2010, 24, 992–1009. [Google Scholar] [CrossRef] [Green Version]
- Westholm, J.O.; Ladewig, E.; Okamura, K.; Robine, N.; Lai, E.C. Common and distinct patterns of terminal modifications to mirtrons and canonical microRNAs. RNA 2012, 18, 177–192. [Google Scholar] [CrossRef] [Green Version]
- van der Kwast, R.; Quax, P.H.A.; Nossent, A.Y. An Emerging Role for isomiRs and the microRNA Epitranscriptome in Neovascularization. Cells 2019, 9, 61. [Google Scholar] [CrossRef] [Green Version]
- Telonis, A.G.; Magee, R.; Loher, P.; Chervoneva, I.; Londin, E.; Rigoutsos, I. Knowledge about the presence or absence of miRNA isoforms (isomiRs) can successfully discriminate amongst 32 TCGA cancer types. Nucleic Acids Res. 2017, 45, 2973–2985. [Google Scholar] [CrossRef] [Green Version]
- Dika, E.; Broseghini, E.; Porcellini, E.; Lambertini, M.; Riefolo, M.; Durante, G.; Loher, P.; Roncarati, R.; Bassi, C.; Misciali, C.; et al. Unraveling the role of microRNA/isomiR network in multiple primary melanoma pathogenesis. Cell Death Dis. 2021, 12, 473. [Google Scholar] [CrossRef] [PubMed]
- Loher, P.; Karathanasis, N.; Londin, E.; Bray, P.; Pliatsika, V.; Telonis, A.G.; Rigoutsos, I. IsoMiRmap-fast, deterministic, and exhaustive mining of isomiRs from short RNA-seq datasets. Bioinformatics 2021, 37, 1828–1838. [Google Scholar] [CrossRef]
- Londin, E.; Loher, P.; Telonis, A.G.; Quann, K.; Clark, P.; Jing, Y.; Hatzimichael, E.; Kirino, Y.; Honda, S.; Lally, M.; et al. Analysis of 13 cell types reveals evidence for the expression of numerous novel primate- and tissue-specific microRNAs. Proc. Natl. Acad. Sci. USA 2015, 112, E1106–1115. [Google Scholar] [CrossRef] [PubMed] [Green Version]
- Wu, C.W.; Evans, J.M.; Huang, S.; Mahoney, D.W.; Dukek, B.A.; Taylor, W.R.; Yab, T.C.; Smyrk, T.C.; Jen, J.; Kisiel, J.B.; et al. A Comprehensive Approach to Sequence-oriented IsomiR annotation (CASMIR): Demonstration with IsomiR profiling in colorectal neoplasia. BMC Genom. 2018, 19, 401. [Google Scholar] [CrossRef] [PubMed]
- Sanchez Herrero, J.F.; Pluvinet, R.; Luna de Haro, A.; Sumoy, L. Paired-end small RNA sequencing reveals a possible overestimation in the isomiR sequence repertoire previously reported from conventional single read data analysis. BMC Bioinform. 2021, 22, 215. [Google Scholar] [CrossRef]
- Telonis, A.G.; Rigoutsos, I. Race Disparities in the Contribution of miRNA Isoforms and tRNA-Derived Fragments to Triple-Negative Breast Cancer. Cancer Res. 2018, 78, 1140–1154. [Google Scholar] [CrossRef] [Green Version]
- Loher, P.; Londin, E.R.; Rigoutsos, I. IsomiR expression profiles in human lymphoblastoid cell lines exhibit population and gender dependencies. Oncotarget 2014, 5, 8790–8802. [Google Scholar] [CrossRef] [PubMed] [Green Version]
- Heydarzadeh, S.; Ranjbar, M.; Karimi, F.; Seif, F.; Alivand, M.R. Overview of host miRNA properties and their association with epigenetics, long non-coding RNAs, and Xeno-infectious factors. Cell Biosci. 2021, 11, 43. [Google Scholar] [CrossRef] [PubMed]
- Ohira, T.; Naohiro, S.; Nakayama, Y.; Osaki, M.; Okada, F.; Oshimura, M.; Kugoh, H. miR-19b regulates hTERT mRNA expression through targeting PITX1 mRNA in melanoma cells. Sci. Rep. 2015, 5, 8201. [Google Scholar] [CrossRef] [Green Version]
- Tang, H.; Xu, X.; Xiao, W.; Liao, Y.; Xiao, X.; Li, L.; Li, K.; Jia, X.; Feng, H. Silencing of microRNA-27a facilitates autophagy and apoptosis of melanoma cells through the activation of the SYK-dependent mTOR signaling pathway. J. Cell Biochem. 2019, 120, 13262–13274. [Google Scholar] [CrossRef] [PubMed]
- Xiong, Y.; Liu, L.; Qiu, Y.; Liu, L. MicroRNA-29a Inhibits Growth, Migration and Invasion of Melanoma A375 Cells in Vitro by Directly Targeting BMI1. Cell Physiol. Biochem. 2018, 50, 385–397. [Google Scholar] [CrossRef] [PubMed]
- Felicetti, F.; Errico, M.C.; Bottero, L.; Segnalini, P.; Stoppacciaro, A.; Biffoni, M.; Felli, N.; Mattia, G.; Petrini, M.; Colombo, M.P.; et al. The promyelocytic leukemia zinc finger-microRNA-221/-222 pathway controls melanoma progression through multiple oncogenic mechanisms. Cancer Res. 2008, 68, 2745–2754. [Google Scholar] [CrossRef] [Green Version]
- Luo, C.; Merz, P.R.; Chen, Y.; Dickes, E.; Pscherer, A.; Schadendorf, D.; Eichmuller, S.B. MiR-101 inhibits melanoma cell invasion and proliferation by targeting MITF and EZH2. Cancer Lett. 2013, 341, 240–247. [Google Scholar] [CrossRef]
- Tian, Y.; Zeng, J.; Yang, Z. MicroRNA-27b inhibits the development of melanoma by targeting MYC. Oncol. Lett. 2021, 21, 370. [Google Scholar] [CrossRef]
- Poell, J.B.; van Haastert, R.J.; de Gunst, T.; Schultz, I.J.; Gommans, W.M.; Verheul, M.; Cerisoli, F.; van Puijenbroek, A.; van Noort, P.I.; Prevost, G.P.; et al. Correction: A Functional Screen Identifies Specific MicroRNAs Capable of Inhibiting Human Melanoma Cell Viability. PLoS ONE 2013, 8, bd5-bd2. [Google Scholar] [CrossRef]
- Liu, E.; Sun, X.; Li, J.; Zhang, C. miR30a5p inhibits the proliferation, migration and invasion of melanoma cells by targeting SOX4. Mol. Med. Rep. 2018, 18, 2492–2498. [Google Scholar] [CrossRef] [Green Version]
- Noori, J.; Sharifi, M.; Haghjooy Javanmard, S. miR-30a Inhibits Melanoma Tumor Metastasis by Targeting the E-cadherin and Zinc Finger E-box Binding Homeobox 2. Adv. Biomed. Res. 2018, 7, 143. [Google Scholar] [CrossRef]
- Chang, X.; Sun, Y.; Han, S.; Zhu, W.; Zhang, H.; Lian, S. MiR-203 inhibits melanoma invasive and proliferative abilities by targeting the polycomb group gene BMI1. Biochem. Biophys. Res. Commun. 2015, 456, 361–366. [Google Scholar] [CrossRef] [PubMed]
- Noguchi, S.; Mori, T.; Otsuka, Y.; Yamada, N.; Yasui, Y.; Iwasaki, J.; Kumazaki, M.; Maruo, K.; Akao, Y. Anti-oncogenic microRNA-203 induces senescence by targeting E2F3 protein in human melanoma cells. J. Biol. Chem. 2012, 287, 11769–11777. [Google Scholar] [CrossRef] [PubMed] [Green Version]
- Lohcharoenkal, W.; Das Mahapatra, K.; Pasquali, L.; Crudden, C.; Kular, L.; Akkaya Ulum, Y.Z.; Zhang, L.; Xu Landen, N.; Girnita, L.; Jagodic, M.; et al. Genome-Wide Screen for MicroRNAs Reveals a Role for miR-203 in Melanoma Metastasis. J. Invest. Dermatol. 2018, 138, 882–892. [Google Scholar] [CrossRef] [PubMed] [Green Version]
- Gaziel-Sovran, A.; Segura, M.F.; Di Micco, R.; Collins, M.K.; Hanniford, D.; Vega-Saenz de Miera, E.; Rakus, J.F.; Dankert, J.F.; Shang, S.; Kerbel, R.S.; et al. miR-30b/30d regulation of GalNAc transferases enhances invasion and immunosuppression during metastasis. Cancer Cell 2011, 20, 104–118. [Google Scholar] [CrossRef] [PubMed] [Green Version]
- Motti, M.L.; Minopoli, M.; Di Carluccio, G.; Ascierto, P.A.; Carriero, M.V. MicroRNAs as Key Players in Melanoma Cell Resistance to MAPK and Immune Checkpoint Inhibitors. Int. J. Mol. Sci. 2020, 21, 4544. [Google Scholar] [CrossRef]
- Hayward, N.K.; Wilmott, J.S.; Waddell, N.; Johansson, P.A.; Field, M.A.; Nones, K.; Patch, A.M.; Kakavand, H.; Alexandrov, L.B.; Burke, H.; et al. Whole-genome landscapes of major melanoma subtypes. Nature 2017, 545, 175–180. [Google Scholar] [CrossRef]
- Lunavat, T.R.; Cheng, L.; Einarsdottir, B.O.; Olofsson Bagge, R.; Veppil Muralidharan, S.; Sharples, R.A.; Lasser, C.; Gho, Y.S.; Hill, A.F.; Nilsson, J.A.; et al. BRAF(V600) inhibition alters the microRNA cargo in the vesicular secretome of malignant melanoma cells. Proc. Natl. Acad. Sci. USA 2017, 114, E5930–E5939. [Google Scholar] [CrossRef] [PubMed] [Green Version]
- Denaro, M.; Ugolini, C.; Poma, A.M.; Borrelli, N.; Materazzi, G.; Piaggi, P.; Chiarugi, M.; Miccoli, P.; Vitti, P.; Basolo, F. Differences in miRNA expression profiles between wild-type and mutated NIFTPs. Endocr. Relat. Cancer 2017, 24, 543–553. [Google Scholar] [CrossRef] [Green Version]
- Mueller, D.W.; Rehli, M.; Bosserhoff, A.K. miRNA expression profiling in melanocytes and melanoma cell lines reveals miRNAs associated with formation and progression of malignant melanoma. J. Invest. Dermatol. 2009, 129, 1740–1751. [Google Scholar] [CrossRef] [Green Version]
- Nabipoorashrafi, S.A.; Shomali, N.; Sadat-Hatamnezhad, L.; Mahami-Oskouei, M.; Mahmoudi, J.; Sandoghchian Shotorbani, B.; Akbari, M.; Xu, H.; Sandoghchian Shotorbani, S. miR-143 acts as an inhibitor of migration and proliferation as well as an inducer of apoptosis in melanoma cancer cells in vitro. IUBMB Life 2020, 72, 2034–2044. [Google Scholar] [CrossRef]
- Wang, J.; Fang, Y.; Liu, Y.F.; Wang, X.; Wang, X.L.; Wang, R.Y.; Meng, Z.D. MiR-154 inhibits cells proliferation and metastasis in melanoma by targeting AURKA and serves as a novel prognostic indicator. Eur. Rev. Med. Pharmacol. Sci. 2019, 23, 4275–4284. [Google Scholar] [CrossRef]
- Su, B.B.; Zhou, S.W.; Gan, C.B.; Zhang, X.N. MiR-330-5p regulates tyrosinase and PDIA3 expression and suppresses cell proliferation and invasion in cutaneous malignant melanoma. J. Surg. Res. 2016, 203, 434–440. [Google Scholar] [CrossRef] [PubMed]
- Shi, Q.; He, Q.; Wei, J. MicroRNA-342 Prohibits Proliferation and Invasion of Melanoma Cells by Directly Targeting Zinc-Finger E-Box-Binding Homeobox 1. Oncol. Res. 2018, 26, 1447–1455. [Google Scholar] [CrossRef] [PubMed]
- Zhang, W.; Mao, K.; Liu, S.; Xu, Y.; Ren, J. miR-942-5p promotes the proliferation and invasion of human melanoma cells by targeting DKK3. J. Recept. Signal. Transduct. Res. 2021, 41, 180–187. [Google Scholar] [CrossRef]
- Couts, K.L.; Anderson, E.M.; Gross, M.M.; Sullivan, K.; Ahn, N.G. Oncogenic B-Raf signaling in melanoma cells controls a network of microRNAs with combinatorial functions. Oncogene 2013, 32, 1959–1970. [Google Scholar] [CrossRef]
- Honda, S.; Kirino, Y. Dumbbell-PCR: A method to quantify specific small RNA variants with a single nucleotide resolution at terminal sequences. Nucleic Acids Res. 2015, 43, e77. [Google Scholar] [CrossRef] [PubMed] [Green Version]
- Martin, M. Cutadapt removes adapter sequences from high-throughput sequencing reads. EMBnet J. 2011, 17, 10. [Google Scholar] [CrossRef]


| Mature miRNAs from Small RNA Seq of FFPE Samples | |||
|---|---|---|---|
| Type | Sub-type | Total | |
| “canonical” miRNA | miRNA with isomiR(s) | 90 (18.2%) | 130 (26.3%) |
| miRNA without isomiR | 40 (8.1%) | ||
| isomiR | isomiR with canonical miRNA | 324 (65.6%) | 364 (73.7%) |
| orphan isomiR | 40 (8.1%) | ||
| Total | 494 (100%) | ||
| Classification of canonical miRNAs with isomiR(s) | |||
| Groups | Sub-groups | Total | |
| miRNA with 1 isomiR | 25 (27.8%) | 25 (27.8%) | |
| miRNA with 2-3 isomiRs | 2 isomiRs | 14 (15.6%) | 27 (30.0%) |
| 3 isomiRs | 13 (14.4%) | ||
| miRNA with 4-5 isomiRs | 4 isomiRs | 10 (11.1%) | 21 (23.3%) |
| 5 isomiRs | 11 (12.2%) | ||
| miRNA with 6-13 isomiRs | 6 isomiRs | 6 (6.7%) | 17 (18.9%) |
| 7 isomiRs | 2 (2.2%) | ||
| 8 isomiRs | 2 (2.2%) | ||
| 9 isomiRs | 3 (3.4%) | ||
| 10 isomiRs | 2 (2.2%) | ||
| 11 isomiRs | 1 (1.1%) | ||
| 13 isomiRs | 1 (1.1%) | ||
| Total | 90 (100%) | ||
| Classification of isomiRs with canonical miRNA | |||
| Groups | Sub-groups | Total | |
| End-site isomiR | 199 (61.4%) | 199 (61.4%) | |
| Start-site isomiR | 19 (5.9%) | 19 (5.9%) | |
| Shifted isomiR | 9 (2.8%) | 9 (2.8%) | |
| 3′ non-templated addition isomiR | 43 (13.2%) | 43 (13.2%) | |
| Mixed isomiR | End-site + start-site | 13 (4.0%) | 54 (16.7%) |
| End-site + 3′ non-templated addition | 34 (10.5%) | ||
| Start-site + 3′ non-templated addition | 6 (1.9%) | ||
| Shifted + 3′ non-templated addition | 1 (0.3%) | ||
| Total | 324 (100%) | ||
| Mature microRNA Name | Normalized Expression isomiR (Average, n = 20) | Normalized Expression Canonical miRNA (Average, n = 20) | Ratio isomiR/Canonical miRNA |
|---|---|---|---|
| hsa-miR-222-3p|0|+3 | 170.56 | 3.17 | 53.84 |
| hsa-miR-141-3p|0|−1 | 127.96 | 4.26 | 30.01 |
| hsa-miR-30a-5p|0|+2 | 234.85 | 10.41 | 22.55 |
| hsa-miR-222-3p|0|+4 | 48.31 | 3.17 | 15.25 |
| hsa-miR-222-3p|0|+2 | 38.26 | 3.17 | 12.08 |
| hsa-miR-30d-5p|0|+2 | 462.00 | 39.70 | 11.64 |
| hsa-miR-200b-3p|0|+1 | 44.59 | 4.29 | 10.39 |
| hsa-miR-125a-5p|0|−2 | 623.96 | 60.29 | 10.35 |
| hsa-miR-30c-5p|0|+1 | 153.33 | 15.63 | 9.81 |
| hsa-miR-200b-3p|0|+1(+1U) | 33.28 | 4.29 | 7.76 |
| hsa-miR-10b-5p|0|−1 | 2368.09 | 365.48 | 6.48 |
| hsa-miR-30a-5p|0|−2 | 57.72 | 10.41 | 5.54 |
| hsa-miR-19b-3p|0|−1 | 25.74 | 4.85 | 5.31 |
| hsa-miR-199a-3p|0|−1 | 258.78 | 52.96 | 4.89 |
| hsa-miR-26b-5p|0|+1 | 165.47 | 35.93 | 4.61 |
| hsa-miR-30a-5p|0|+1 | 46.17 | 10.41 | 4.43 |
| hsa-miR-27a-3p|0|−1 | 100.82 | 24.74 | 4.08 |
| hsa-miR-30d-5p|0|+1 | 135.04 | 39.70 | 3.40 |
| hsa-miR-221-3p|0|−1 | 39.05 | 11.80 | 3.31 |
| hsa-miR-10a-5p|0|−1 | 594.23 | 197.37 | 3.01 |
| hsa-miR-744-5p|0|−1 | 24.67 | 9.36 | 2.63 |
| hsa-miR-30a-5p|0|−1 | 23.98 | 10.41 | 2.30 |
| hsa-miR-27b-3p|0|−1 | 845.19 | 368.31 | 2.29 |
| hsa-miR-101-3p|0|0(+1U) | 47.54 | 21.42 | 2.22 |
| hsa-miR-221-3p|0|−2 | 26.12 | 11.80 | 2.21 |
| hsa-miR-509-3p|0|+1 | 88.74 | 40.27 | 2.20 |
| hsa-miR-203a-3p|+1|0(+1U) | 268.82 | 134.91 | 1.99 |
| hsa-miR-101-3p|0|+1 | 39.31 | 21.42 | 1.83 |
| hsa-miR-199a-3p|−1|−1 | 87.92 | 52.96 | 1.66 |
| hsa-miR-29a-3p|0|−1 | 33.98 | 21.58 | 1.57 |
| hsa-miR-30d-5p|0|−2 | 61.55 | 39.70 | 1.55 |
| hsa-miR-203a-3p|0|+1 | 189.30 | 134.91 | 1.40 |
| hsa-miR-142-5p|−2|−3 | 97.82 | 76.36 | 1.28 |
| hsa-miR-125a-5p|0|−3 | 73.56 | 60.29 | 1.22 |
| hsa-miR-205-5p|0|+1 | 1221.77 | 1044.60 | 1.17 |
| hsa-miR-30d-5p|0|−1 | 45.81 | 39.70 | 1.15 |
| hsa-miR-101-3p|−1|−1 | 23.09 | 21.42 | 1.08 |
| hsa-miR-146b-5p|0|+1 | 35.42 | 33.14 | 1.07 |
| hsa-miR-27a-3p|0|−2 | 25.16 | 24.74 | 1.02 |
| Mature miRNAs Differently Expressed in FFPE Samples: CM Vs BN | |||
|---|---|---|---|
| Name | p Value (Corr) | Regulation | Log FC |
| Canonical miRNAs | |||
| hsa-let-7b-5p|0|0 | 1.0E-02 | up | 2.73 |
| hsa-miR-205-5p|0|0 | 9.3E-03 | up | 2.04 |
| hsa-miR-143-3p|0|0 | 4.2E-02 | up | 1.50 |
| hsa-miR-27a-3p|0|0 | 7.1E-03 | down | −1.60 |
| hsa-miR-192-5p|0|0 | 3.9E-02 | down | −1.61 |
| hsa-miR-99a-5p|0|0 | 2.1E-02 | down | −1.77 |
| hsa-miR-99b-5p|0|0 | 3.6E-02 | down | −1.94 |
| hsa-miR-28-3p|0|0 | 1.1E-02 | down | −1.99 |
| hsa-miR-181a-2-3p|0|0 | 5.8E-04 | down | −2.05 |
| hsa-miR-497-5p|0|0 | 3.4E-04 | down | −2.27 |
| hsa-miR-148a-3p|0|0 | 2.7E-03 | down | −2.29 |
| hsa-miR-30b-5p|0|0 | 3.3E-03 | down | −2.47 |
| hsa-miR-199a-3p|0|0 | 1.5E-05 | down | −3.07 |
| hsa-miR-101-3p|0|0 | 4.2E-05 | down | −3.08 |
| hsa-miR-199a-5p|0|0 | 8.9E-07 | down | −3.21 |
| hsa-miR-27b-3p|0|0 | 3.2E-06 | down | −3.38 |
| hsa-miR-125b-5p|0|0 | 9.6E-07 | down | −3.98 |
| hsa-miR-29a-3p|0|0 | 8.6E-09 | down | −6.42 |
| isomiRs | |||
| hsa-let-7b-5p|0|+1 | 5.6E-03 | up | 2.54 |
| hsa-miR-30d-5p|0|+2 | 7.2E-03 | up | 2.25 |
| hsa-miR-30a-5p|0|+2 | 1.3E-03 | up | 2.17 |
| hsa-miR-222-3p|0|+3 | 9.0E-03 | up | 2.00 |
| hsa-miR-143-3p|0|0(+1U) | 2.6E-02 | up | 1.71 |
| hsa-miR-143-3p|0|−1 | 4.5E-02 | up | 1.70 |
| hsa-miR-203a-3p|+1|0(+1U) | 4.2E-02 | up | 1.46 |
| hsa-miR-199a-3p|+1|−1 | 2.0E-02 | down | −1.19 |
| hsa-miR-30a-5p|0|−1 | 1.7E-02 | down | −1.28 |
| hsa-miR-30a-5p|0|−2 | 4.5E-02 | down | −1.36 |
| hsa-miR-26a-5p|+3|0 | 4.3E-02 | down | −1.44 |
| hsa-miR-103a-3p|0|−1(+1U) | 3.2E-02 | down | −1.57 |
| hsa-miR-27b-3p|0|0(+1U) | 5.0E-02 | down | −1.57 |
| hsa-miR-26a-5p|0|−1 | 2.0E-02 | down | −1.64 |
| hsa-miR-148a-3p|0|+1 | 3.2E-02 | down | −1.73 |
| hsa-miR-148a-3p|0|+2 | 1.7E-02 | down | −1.75 |
| hsa-miR-27b-3p|0|−1 | 2.7E-02 | down | −1.78 |
| hsa-miR-23b-3p|+3|−2 | 6.8E-03 | down | −1.87 |
| hsa-miR-148a-3p|0|0(+1U) | 1.2E-02 | down | −1.90 |
| hsa-miR-26a-5p|0|0(+2U) | 1.6E-04 | down | −2.06 |
| hsa-miR-27a-3p|0|−2 | 3.1E-03 | down | −2.10 |
| hsa-miR-101-3p|0|0(+1U) | 2.7E-03 | down | −2.12 |
| hsa-miR-30e-5p|0|+1 | 4.8E-04 | down | −2.35 |
| hsa-miR-141-3p|0|−1 | 3.8E-03 | down | −2.36 |
| hsa-miR-30d-5p|0|−1 | 8.5E-03 | down | −2.46 |
| hsa-miR-99b-5p|0|−1 | 1.1E-02 | down | −2.53 |
| hsa-miR-199a-5p|0|−1 | 6.1E-06 | down | −2.79 |
| hsa-miR-27a-3p|0|−1 | 1.3E-03 | down | −2.81 |
| hsa-miR-19b-3p|0|−1 | 2.6E-04 | down | −3.02 |
| hsa-miR-101-3p|0|+1 | 3.4E-05 | down | −3.15 |
| hsa-miR-27b-3p|0|−2 | 3.4E-05 | down | −3.23 |
| hsa-miR-100-5p|0|−1 | 1.3E-03 | down | −3.50 |
| hsa-miR-27b-3p|0|+1 | 4.7E-06 | down | −3.51 |
| hsa-miR-27a-3p|0|−3 | 9.6E-07 | down | −3.89 |
| hsa-miR-27b-3p|0|−1(+1U) | 1.2E-06 | down | −3.95 |
| hsa-miR-101-3p|−1|−1 | 1.2E-06 | down | −4.70 |
| hsa-miR-29a-3p|0|−1 | 4.0E-08 | down | −5.79 |
| Mature miRNAs and Novel miRNAs from TCGA | |||
|---|---|---|---|
| Type | Sub-type | Total | |
| ”canonical” miRNAs | miRNA with isomiR | 389 (10.52%) | 474 (12.82%) |
| miRNA without isomiR | 85 (2.30%) | ||
| isomiRs | isomiR with canonical miRNA | 2958 (80.01%) | 3216 (86.98%) |
| orphan isomiR | 258 (6.97%) | ||
| novel miRNAs | with isomiR | 1 (0.03%) | 4 (0.11%) |
| without isomiR | 3 (0.08%) | ||
| isomiRs of novel miRNAs | with novel miRNA | 1 (0.03%) | 3 (0.09%) |
| without novel miRNA | 2 (0.06%) | ||
| Total | 3697 (100%) | ||
| IsomiR classification | |||
| Groups | Sub-groups | Total | |
| End-site isomiRs | 1271 (39.52%) | 1271 (39.52%) | |
| Start-site isomiRs | 341 (10.60%) | 341 (10.60%) | |
| Shifted isomiRs | 187 (5.82%) | 187 (5.82%) | |
| 3’ non-templated addition isomiRs | 206 (6.41%) | 206 (6.41%) | |
| 5’ non-templated addition isomiRs | 3 (0.09%) | 3 (0.09%) | |
| Mixed isomiRs | start-site + end-site | 510 (15.86%) | 1208 (37.56%) |
| start-site + 3’ non-templated addition | 84 (2.61%) | ||
| end-site + 3’ non-templated addition | 465 (14.46%) | ||
| start-site + end-site + 3’ non-templated addition | 94 (2.92%) | ||
| 5’ non-templated addition + end-site | 9 (0.28%) | ||
| shifted + 3’ non-templated addition | 46 (1.43%) | ||
| Total | 3216 (100%) | ||
| Mature microRNA Name | Ratio isomiR/Canonical miRNA in 63 Late-Stage CM Samples | Ratio isomiR/Canonical miRNA in 20 Early-Stage CM Sample |
|---|---|---|
| hsa-miR-101-3p|0|0(+1U) | 1.21 | 2.22 |
| hsa-miR-125a-5p|0|−2 | 2.22 | 10.35 |
| hsa-miR-141-3p|0|−1 | 506.45 | 30.01 |
| hsa-miR-142-5p|−2|−3 | 137.60 | 1.28 |
| hsa-miR-146b-5p|0|+1 | 2.68 | 1.07 |
| hsa-miR-199a-3p|0|−1 | 5.22 | 4.89 |
| hsa-miR-199a-3p|−1|−1 | 1.14 | 1.66 |
| hsa-miR-200b-3p|0|+1 | 2.41 | 10.39 |
| hsa-miR-200b-3p|0|+1(+1U) | 67,983.34 | 7.76 |
| hsa-miR-203a-3p|+1|0(+1U) | 16.12 | 1.99 |
| hsa-miR-203a-3p|0|+1 | 6.59 | 1.40 |
| hsa-miR-222-3p|0|+3 | 3.80 | 53.84 |
| hsa-miR-222-3p|0|+4 | 57.90 | 15.25 |
| hsa-miR-26b-5p|0|+1 | 15.51 | 4.61 |
| hsa-miR-27a-3p|0|−1 | 2.53 | 4.08 |
| hsa-miR-27a-3p|0|−2 | 1.68 | 1.02 |
| hsa-miR-27b-3p|0|−1 | 522.43 | 2.29 |
| hsa-miR-29a-3p|0|−1 | 9.61 | 1.57 |
| hsa-miR-30c-5p|0|+1 | 18.70 | 9.81 |
| hsa-miR-30d-5p|0|−1 | 1.37 | 1.15 |
| hsa-miR-30d-5p|0|−2 | 33.78 | 1.55 |
| Comparison between NF1 Mutated and NF1 WT Samples | |||||
|---|---|---|---|---|---|
| Name | Sequence | Type | p (Corr) (Mutated NF1 Vs. Wild Type NF1) | Regulation (Mutated NF1 Vs. Wild Type NF1) | Log FC (Mutated NF1 Vs. Wild Type NF1) |
| hsa-miR-766-3p|0|−2 | ACTCCAGCCCCACAGCCTCA | end-site | 7.77E-02 | up | 1.17 |
| hsa-miR-584-5p|−1|−2 | ATTATGGTTTGCCTGGGACTG | mixed: start-site + end-site | 8.38E-02 | up | 1.46 |
| hsa-miR-378a-3p|−1|−1(+1U) | CACTGGACTTGGAGTCAGAAGGT | mixed: shifted + 3’non-templated addition | 7.77E-02 | down | −1.35 |
| hsa-let-7d-5p|+1|−1 | GAGGTAGTAGGTTGCATAGT | mixed: start-site + end-site | 9.29E-02 | up | 0.70 |
| hsa-miR-148a-3p|+3|−1 | GTGCACTACAGAACTTTG | mixed: start-site + end-site | 7.77E-02 | up | 1.03 |
| IsomiRs Differentially Expressed in Mutated vs. Wild Type (WT) BRAF Melanoma Samples | |||||
|---|---|---|---|---|---|
| Name | Sequence | Type | p (Corr) (mutated BRAF Vs. WT) | Regulation FC (mutated BRAF Vs. WT) | Log FC (mutated BRAF Vs. WT) |
| hsa-let-7d-3p|0|−2(+2U) | CTATACGACCTGCTGCCTTTTT | mixed: end-site + 3’ non-templated addition | 4.40E-02 | up | 0.76 |
| hsa-let-7i-3p|0|−2 | CTGCGCAAGCTACTGCCTTG | end-site | 2.12E-02 | up | 1.75 |
| hsa-miR-100-5p|+1|−1 | ACCCGTAGATCCGAACTTGT | mixed: start-site + end-site | 2.14E-02 | up | 1.96 |
| hsa-miR-100-5p|0|−1 | AACCCGTAGATCCGAACTTGT | end-site | 2.02E-02 | up | 2.00 |
| hsa-miR-100-5p|0|−1(+2U) | AACCCGTAGATCCGAACTTGTTT | mixed: end-site + 3’ non-templated addition | 7.63E-07 | up | 1.39 |
| hsa-miR-106b-3p|+1|−1 | CGCACTGTGGGTACTTGCTG | mixed: start-site + end-site | 4.49E-03 | up | 0.81 |
| hsa-miR-1247-5p|0|−1 | ACCCGTCCCGTTCGTCCCCGG | end-site | 2.02E-02 | up | 0.96 |
| hsa-miR-125b-5p|0|+1 | TCCCTGAGACCCTAACTTGTGAG | end-site | 2.44E-04 | up | 0.86 |
| hsa-miR-1307-3p|0|−2 | ACTCGGCGTGGCGTCGGTCG | end-site | 3.05E-02 | up | 0.80 |
| hsa-miR-143-3p|0|−3(+1U) | TGAGATGAAGCACTGTAGT | mixed: end-site + 3’ non-templated addition | 3.95E-02 | up | 1.06 |
| hsa-miR-143-3p|−1|−1 | CTGAGATGAAGCACTGTAGCT | shifted | 4.64E-02 | up | 1.03 |
| hsa-miR-143-3p|−1|−3 | CTGAGATGAAGCACTGTAG | mixed: start-site + end-site | 2.59E-02 | up | 1.21 |
| hsa-miR-146a-5p|0|−4 | TGAGAACTGAATTCCATG | end-site | 3.11E-02 | up | 0.87 |
| hsa-miR-154-5p|0|0 | TAGGTTATCCGTGTTGCCTTCG | canonical | 8.45E-03 | up | 0.94 |
| hsa-miR-181a-2-3p|0|+1 | ACCACTGACCGTTGACTGTACCT | end-site | 2.17E-02 | down | -1.57 |
| hsa-miR-181c-5p|0|0 | AACATTCAACCTGTCGGTGAGT | canonical | 8.45E-03 | up | 1.07 |
| hsa-miR-199a-3p|+3|−1 | GTAGTCTGCACATTGGTT | mixed: start-site + end-site | 4.49E-03 | up | 0.82 |
| hsa-miR-204-5p|0|0 | TTCCCTTTGTCATCCTATGCCT | canonical | 1.91E-02 | up | 1.95 |
| hsa-miR-204-5p|0|0(+2U) | TTCCCTTTGTCATCCTATGCCTTT | 3’ non-templated addition | 2.46E-02 | up | 0.87 |
| hsa-miR-204-5p|0|−1 | TTCCCTTTGTCATCCTATGCC | end-site | 1.40E-02 | up | 2.09 |
| hsa-miR-204-5p|0|−2 | TTCCCTTTGTCATCCTATGC | end-site | 1.60E-02 | up | 1.76 |
| hsa-miR-214-5p|+1|0 | GCCTGTCTACACTTGCTGTGC | start-site | 2.59E-02 | up | 0.96 |
| hsa-miR-296-3p|0|−2 | GAGGGTTGGGTGGAGGCTCT | end-site | 3.53E-05 | up | 0.98 |
| hsa-miR-29a-3p|0|−4(+2U) | TAGCACCATCTGAAATCGTT | mixed: end-site + 3’ non-templated addition | 4.15E-03 | up | 0.85 |
| hsa-miR-30c-2-3p|0|−2 | CTGGGAGAAGGCTGTTTACT | end-site | 1.39E-02 | up | 0.72 |
| hsa-miR-330-5p|0|−1 | TCTCTGGGCCTGTGTCTTAGG | end-site | 2.54E-02 | up | 0.78 |
| hsa-miR-342-3p|0|0(+1U) | TCTCACACAGAAATCGCACCCGTT | 3’ non-templated addition | 4.49E-03 | up | 0.70 |
| hsa-miR-342-5p|+1|+2 | GGGGTGCTATCTGTGATTGAGG | mixed: start-site + end-site | 1.09E-02 | up | 0.61 |
| hsa-miR-381-3p|0|0 | TATACAAGGGCAAGCTCTCTGT | canonical | 2.52E-02 | up | 0.94 |
| hsa-miR-409-5p|0|0 | AGGTTACCCGAGCAACTTTGCAT | canonical | 4.97E-02 | up | 0.93 |
| hsa-miR-423-5p|0|−2 | TGAGGGGCAGAGAGCGAGACT | end-site | 2.54E-02 | up | 1.06 |
| hsa-miR-432-5p|0|−1(+1U) | TCTTGGAGTAGGTCATTGGGTGT | mixed: end-site + 3’ non-templated addition | 4.64E-02 | up | 1.00 |
| hsa-miR-485-3p|0|0 | GTCATACACGGCTCTCCTCTCT | canonical | 3.05E-02 | up | 0.90 |
| hsa-miR-493-3p|0|−1 | TGAAGGTCTACTGTGTGCCAG | end-site | 9.25E-03 | up | 0.92 |
| hsa-miR-495-3p|0|0 | AAACAAACATGGTGCACTTCTT | canonical | 8.45E-03 | up | 0.89 |
| hsa-miR-518a-3p|0|0 | GAAAGCGCTTCCCTTTGCTGGA | canonical | 1.91E-02 | up | 2.55 |
| hsa-miR-519a-5p|−1|−1 | ACTCTAGAGGGAAGCGCTTTCT | shifted | 2.44E-04 | up | 3.59 |
| hsa-miR-625-3p|+1|−1(+1U) | ACTATAGAACTTTCCCCCTCT | mixed: start-site + end-site + 3’ non-templated addition | 3.90E-02 | up | 0.85 |
| hsa-miR-671-3p|0|0 | TCCGGTTCTCAGGGCTCCACC | canonical | 3.95E-02 | up | 0.84 |
| hsa-miR-6892-5p|0|−1 | GTAAGGGACCGGAGAGTAGG | end-site | 2.44E-04 | up | 0.89 |
| hsa-miR-758-5p|+2|+1 | TGGTTGACCAGAGAGCACACG | mixed: start-site + end-site | 1.90E-03 | up | 0.91 |
| hsa-miR-92a-3p|0|+1(+1U) | TATTGCACTTGTCCCGGCCTGTGT | mixed: end-site + 3’ non-templated addition | 2.14E-02 | down | −1.31 |
| hsa-miR-937-3p|0|−2 | ATCCGCGCTCTGACTCTCTG | end-site | 6.44E-03 | up | 1.09 |
| hsa-miR-942-5p|0|−2 | TCTTCTCTGTTTTGGCCATG | end-site | 7.63E-07 | up | 0.93 |
| Comparison between BRAF V600E and BRAF WT samples | |||||
| Name | Sequence | Type | p (Corr) ([V600E vs [WT]) | Regulation FC ([V600E vs. [WT]) | FC ([V600E vs. [WT]) |
| hsa-let-7b-5p|0|−1 | TGAGGTAGTAGGTTGTGTGGT | end-site | 0.0289 | up | 2.13 |
| hsa-let-7b-5p|0|−2 | TGAGGTAGTAGGTTGTGTGG | end-site | 0.0262 | up | 2.32 |
| hsa-miR-100-5p|+1|−1 | ACCCGTAGATCCGAACTTGT | mixed: start-site + end-site | 0.0234 | up | 4.35 |
| hsa-miR-100-5p|0|0 | AACCCGTAGATCCGAACTTGTG | canonical | 0.0262 | up | 3.62 |
| hsa-miR-100-5p|0|−1 | AACCCGTAGATCCGAACTTGT | end-site | 0.0089 | up | 4.59 |
| hsa-miR-125b-5p|0|0 | TCCCTGAGACCCTAACTTGTGA | canonical | 0.0323 | up | 2.70 |
| hsa-miR-125b-5p|0|−1 | TCCCTGAGACCCTAACTTGTG | end-site | 0.0262 | up | 3.02 |
| hsa-miR-146b-3p|0|0 | GCCCTGTGGACTCAGTTCTGGT | canonical | 0.0146 | up | 2.33 |
| hsa-miR-181c-5p|0|0 | AACATTCAACCTGTCGGTGAGT | canonical | 0.0262 | up | 2.22 |
| hsa-miR-204-5p|0|0 | TTCCCTTTGTCATCCTATGCCT | canonical | 0.0289 | up | 4.63 |
| hsa-miR-181a-2-3p|0|+1 | ACCACTGACCGTTGACTGTACCT | end-site | 0.0241 | down | −2.91 |
| hsa-miR-181a-2-3p|−1|−1 | AACCACTGACCGTTGACTGTAC | shifted | 0.0483 | down | −2.29 |
| Comparison between BRAF V600E-V600M and BRAF V600E samples | |||||
| Name | Sequence | Type | p (Corr) ([V600E | V600M] Vs. [V600E]) | Regulation ([V600E | V600M] Vs. [V600E]) | FC ([V600E | V600M] Vs. [V600E]) |
| hsa-let-7b-3p|0|−1(+1U) | CTATACAACCTACTGCCTTCCT | mixed: end-site + 3’ non-template addition | 0.03969 | down | −2.30 |
| hsa-miR-100-5p|0|0(+1U) | AACCCGTAGATCCGAACTTGTGT | 3’ non-template addition | 0.03969 | down | −4.14 |
| hsa-miR-125b-5p|0|0 | TCCCTGAGACCCTAACTTGTGA | canonical | 0.03969 | down | −2.77 |
| hsa-miR-221-3p|0|−1 | AGCTACATTGTCTGCTGGGTTT | end-site | 0.03969 | down | −2.29 |
| hsa-let-7a-5p|+1|−2 | GAGGTAGTAGGTTGTATAG | mixed: start-site + end-site | 0.03969 | up | 2.14 |
| hsa-miR-1247-5p|0|−1 | ACCCGTCCCGTTCGTCCCCGG | end-site | 0.03969 | up | 4.07 |
| hsa-miR-219a-1-3p|0|0 | AGAGTTGAGTCTGGACGTCCCG | canonical | 0.03969 | up | 1.75 |
| Comparison between Mutated NRAS and Wild Type (WT) NRAS | |||||
|---|---|---|---|---|---|
| Name | Sequence | Type | p (Corr)(Mutated NRAS Vs. Wild Type NRAS) | Regulation(Mutated NRAS Vs. Wild Type NRAS) | Log FC(Mutated NRAS Vs. Wild Type NRAS) |
| hsa-miR-17-3p|+1|0 | CTGCAGTGAAGGCACTTGTAG | start-site | 8.11E-02 | up | 0.92 |
| hsa-miR-17-3p|0|0 | ACTGCAGTGAAGGCACTTGTAG | canonical | 2.11E-02 | up | 0.85 |
| hsa-miR-19b-3p|0|−1 | TGTGCAAATCCATGCAAAACTG | end-site | 8.11E-02 | up | 0.79 |
| hsa-miR-20a-5p|0|−2 | TAAAGTGCTTATAGTGCAGGT | end-site | 7.26E-02 | up | 0.85 |
| hsa-miR-3614-5p|0|−1 | CCACTTGGATCTGAAGGCTGCC | end-site | 8.11E-02 | up | 0.85 |
| hsa-miR-509-3p|+4|+1 | TGGTACGTCTGTGGGTAGA | mixed: start-site + end-site | 4.66E-02 | down | −1.10 |
Publisher’s Note: MDPI stays neutral with regard to jurisdictional claims in published maps and institutional affiliations. |
© 2021 by the authors. Licensee MDPI, Basel, Switzerland. This article is an open access article distributed under the terms and conditions of the Creative Commons Attribution (CC BY) license (https://creativecommons.org/licenses/by/4.0/).
Share and Cite
Broseghini, E.; Dika, E.; Londin, E.; Ferracin, M. MicroRNA Isoforms Contribution to Melanoma Pathogenesis. Non-Coding RNA 2021, 7, 63. https://doi.org/10.3390/ncrna7040063
Broseghini E, Dika E, Londin E, Ferracin M. MicroRNA Isoforms Contribution to Melanoma Pathogenesis. Non-Coding RNA. 2021; 7(4):63. https://doi.org/10.3390/ncrna7040063
Chicago/Turabian StyleBroseghini, Elisabetta, Emi Dika, Eric Londin, and Manuela Ferracin. 2021. "MicroRNA Isoforms Contribution to Melanoma Pathogenesis" Non-Coding RNA 7, no. 4: 63. https://doi.org/10.3390/ncrna7040063
APA StyleBroseghini, E., Dika, E., Londin, E., & Ferracin, M. (2021). MicroRNA Isoforms Contribution to Melanoma Pathogenesis. Non-Coding RNA, 7(4), 63. https://doi.org/10.3390/ncrna7040063