Abstract
Designing a combustion chamber for gas turbines is considered both a science and an art. This study presents a comprehensive methodology for designing an annular combustion chamber tailored to the operating conditions of a CFM-56 engine, a widely used high bypass ratio turbofan engine. The design process involved calculating the basic criteria and dimensions for the casing, liner, diffuser, and swirl, followed by an analysis of the cooling sections of the liner. Numerical simulations using NUMECA software and the HEXPRESS meshing tool were conducted to predict the combustion chamber’s behavior and performance, employing the κ-ε turbulence model and the Flamelet combustion model. Methane was used as the fuel, and simulations were performed for three fuel injection angles: axial, 45°, and 60°. Results demonstrate that the combustion chamber is properly dimensioned and achieves complete combustion for all configurations. The pressure ratio is 0.96, exceeding the minimum design criteria. Additionally, the emissions of unburned hydrocarbons are zero, while nitrogen oxides and carbon monoxide levels are below regulatory limits. These findings validate the proposed design methodology, ensuring efficient and environmentally compliant combustion chamber performance.
1. Introduction
Combustion chambers transform fuel’s chemical energy into thermal energy. Part of the thermal energy is transformed into mechanical work in the turbine to move the compressor and fan. The nozzle converts some remaining energy into kinetic energy, producing the necessary thrust to move the aircraft. Combustors are classified as can, annular, mixed, or can-annular and reverse flow. The desired properties for any combustion chamber are as follows [1]: complete combustion, moderate total pressure loss, stability of combustion (freedom from flameout), in-flight relight ability, proper temperature distribution at exit (no hot spots), a short length and small cross-section, wide operating range of mass flows, pressures, and temperatures, as well as work according to the required environmental limits of air pollutants.
Lefebvre and Ballal (2010) [2] summarized several criteria essential for the optimal performance of a combustion chamber. These include achieving high combustion efficiency, ensuring reliable and smooth ignition under various conditions, maintaining wide stability limits to sustain flame presence across different pressure and air/fuel ratio ranges, minimizing pressure loss, tailoring outlet temperature distribution to maximize the lifespan of turbine blades and nozzle guide vanes, reducing emissions of smoke and gaseous pollutants, preventing combustion-induced instability such as pressure pulsations, and ensuring compatibility with engine envelope in terms of size and shape. Additionally, the design should prioritize cost-effectiveness, ease of manufacturing, maintainability, durability, and the capability to utilize various fuel sources including petroleum, methane, LNG, synthetic, and biomass-based fuels.
However, even when the criteria or characteristics that the combustion chambers must meet are established, as well as an elementary structure, which consists of an inlet diffuser, fuel injector, vortex generator, and three combustion zones, primary, secondary, and dilution, and even many authors propose some standard basic methodology, there is no precise methodology for the design of annular combustion chambers, because although in recent years, multiple investigations have been developed regarding combustion chambers. Much of this research is limited to the experimental prototypes they have. Others are small in size or have a low derivation rate, which limits their applicability in the industry [3]. In the same way, Mark and Selwyn (2016) [4] numerically simulated a combustion chamber by means of Siemens NX-8.0 modeling software. The aerodynamics flow was simulated by means of the ANSYS 14.5 software suite. They simplified the model to obtain quicker results due to computational limitations and analyzed a 20° cut section for easiness. The combustor resulted to be shorter than other combustors, achieving a 96% efficiency based on the designing point combustor exit temperature.
On the other hand, Worth and Dawson (2013) [3] conducted experimental and modal dynamic analyses on an annular combustion chamber to examine the time amplitude and its correlation with the overall heat release rate in a basic annular combustion chamber setup. The combustion chamber comprised 12, 15, or 18 premixed bluff-body flames equally spaced around a fixed circumference. Numerical findings revealed the presence of two acoustic waves with time-varying amplitudes traveling in opposite directions, highlighting a statistical prevalence consistent with findings documented in existing literature. Livebardon et al. (2015) [5] presented a numerical study aiming to predict combustion noise levels in a real turboshaft engine. Their findings regarding both indirect and direct combustion noise levels align reasonably well with theoretical predictions and experimental observations reported in the literature.
In addition, different authors have applied the Large Eddy Simulation (LES) to analyze the behavior of annular combustion chambers. Wolf et al. (2012) [6] used LES to predict azimuthal modes and instabilities of annular combustion chambers based on an adequate grid and time of simulation, finding good results compared to those reported in the literature. Meloni et al. (2019) [7] developed an analysis in an annular combustion chamber using LES to predict the performance of these elements in stable operating conditions. These results indicate that this approach is currently used for the design phase, while further validation is ongoing to include different geometries and operating conditions to reduce risks and the number of tests. It is important to mention that many of the desired characteristics in a combustion chamber conflict, making it difficult to find a balance between them. These characteristics are complemented by what is established by Khandelwal B. (2019) [8], who indicated that a good design of the combustion chamber is based on the satisfaction of the basic principles of the combustion process; that is, a proper mixture ratio and the three “Ts” of good combustion (temperature of the reactants, turbulence for good mixing and time for mixing and combustion to go to completion). These fundamentals should be achieved with minimal pressure loss along the combustion chamber.
Fu et al. (2020) [9] evaluated the flow and heat transfer performance of a large annular combustion chamber in a heavy-duty gas turbine using numerical computations, examining the effects of inlet swirling strength, fuel-air ratio, and premixed gas temperature on velocity, temperature, and pressure fields. The research highlights how these factors influence synergy between velocity and temperature, impacting overall combustion efficiency and heat transfer capabilities. Zahra et al. (2021) [10] developed a design and computational analysis of an annular combustion chamber for a turbojet engine producing 1650 N of thrust with kerosene fuel. Using Computational Fluid Dynamics (CFDs) based on RANS simulation, the research evaluates dimensions, air distribution, pressure drop, and aerodynamics. It employs the RNG turbulent model and finite rate/eddy dissipation combustion model for three-dimensional simulations. Experimental and numerical comparisons show temperature uniformity at the chamber outlet, which is essential for optimizing engine performance. Balijepalli et al. (2022) [11] discussed the challenges and optimizations involved in reducing the liner length in the gas turbine engine’s combustion chamber, focusing on how this reduction affects the maximum outlet temperature and potential damage to turbine blades. The study utilizes Ansys software for designing and analyzing the combustion chamber, optimizing the pattern factor, and achieving the desired outlet temperature profile.
Jagadish et al. (2023) [12] explored a combustion chamber design using a combination of theoretical and empirical methods, acknowledging its inherent complexity. Three-dimensional simulations investigate velocity profiles, species concentration, and temperature distribution with methane (CH4) as fuel. The SST turbulence model, applied in non-orthogonal curvilinear coordinates with second-order accurate discretization, facilitates iterative solutions. ANSYS CFX 12 is utilized to analyze flow patterns within the combustion chamber and air entry openings, aiming to achieve a balanced understanding of intricate physical and chemical interactions. Chang et al. (2024) [13] designed a new combustion chamber featuring a double-stage counter-rotating swirler with vane angles set at 45°, investigating turbulent mixing enhancement through a combination of 2D-PIV experiments and Reynolds averaged numerical simulation (RANS). Various turbulence models were evaluated against experimental data, with the RNG k-ε model showing superior performance in predicting velocity distribution, recirculation zone length, and vorticity distribution. It was subsequently employed to analyze the influence of Reynolds number (Re) on flow characteristics across seven Re values ranging from 5425 to 54,245. Results indicate that higher Re numbers strengthen flow patterns, affecting turbulence and boundary layer dynamics, with a notable observation around a critical Re value of 21,698 potentially influencing turbulent behavior and wall effects.
Aim of This Work
The aeronautical gas turbine design is under increased focus due to stricter regulations and the urgency to address soaring fuel costs. This pursuit of innovation has occasionally led to novel concepts susceptible to combustion instabilities. For the above reasons, this work presents a methodology to design an annular combustion chamber by collecting information from different sources and turning it into a detailed procedure developed in parallel to designing a combustion chamber for the operating conditions of a CFM-56 engine. The methodology used involves collecting information from various sources and transforming it into a detailed procedure for designing combustion chambers. Key aspects of this work include the following:
Combustion Models and Reactions: Utilizing advanced combustion models, including the κ-ε turbulence model and Flamelet combustion model, to predict the behavior and performance of the combustion chambers through rigorous CFD simulations using NUMECA software.
CFD Simulation and Case Setup: Conducting numerical simulations to evaluate the impact of different fuel injection angles and analyzing key parameters such as velocity, temperature, and pressure fields to optimize the design for enhanced performance.
Validation and Environmental Impact: Validating the simulation results against experimental data to ensure accuracy and reliability and assessing the environmental impact by analyzing emissions of pollutants like unburned hydrocarbons, nitrogen oxides, and carbon monoxide.
Finally, this research contributes to the field of combustion chamber design for aeronautical gas turbines by providing a structured approach that meets stringent performance criteria, enhances efficiency, and promotes environmental sustainability.
2. Materials and Methods
Annular combustion chambers are the most popular in modern aircraft due to their construction advantages. Like the other types, they mainly consist of a diffuser, liner, casing, and injection system, which are the main components to which the turbine inlet guide vanes and their respective assembly components can be added. The difference with the rest is that it is a single annular liner between two inner and outer casings and a larger number of injectors, from 12 to 20, depending on the engine size. They are the ideal type of combustion chamber since their clean aerodynamic layout results in a compact unit of lower pressure loss than other combustor types [2]. Given its conditions, some other advantages that this type of chamber offers are higher performance and larger combustion volume per area of exposed metal, resulting in less weight and length.
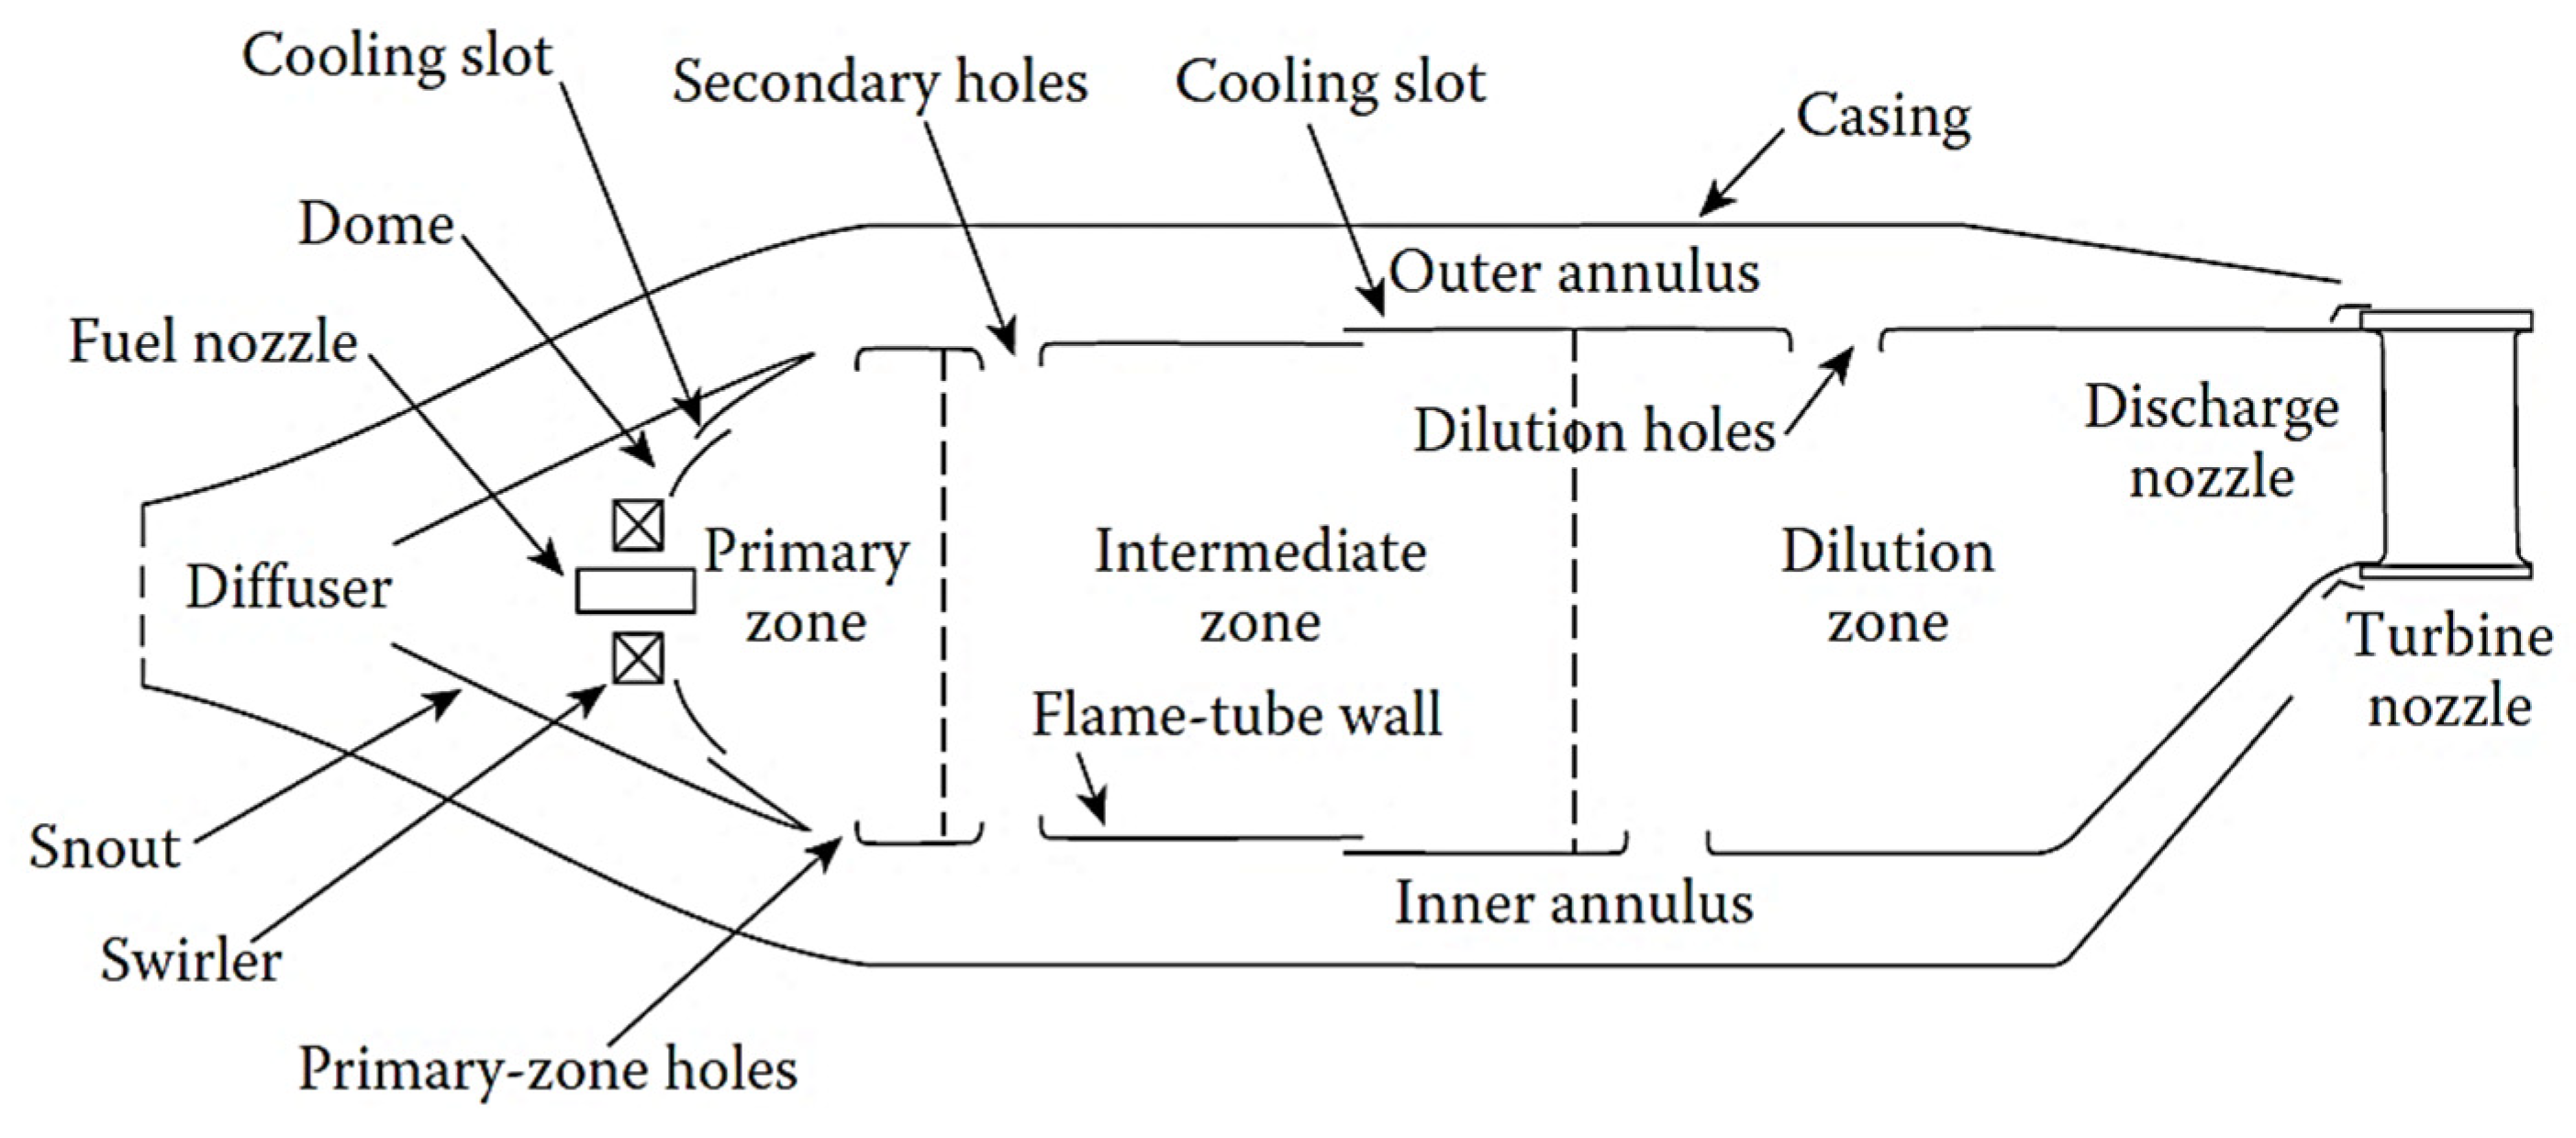
As shown in Figure 1, the combustion chamber zones are the inlet diffuser, primary, secondary, and dilution zones.
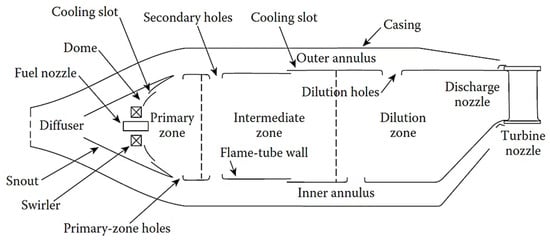
Figure 1.
Combustion chamber’s structure.
Combustion can be defined as an exothermic reaction of a fuel and an oxidant [2]. For aircraft engines, liquid fuel is used, specifically kerosene, with air as the oxidant. The combustion regime through which the combustion chambers in a gas turbine operate is deflagration. This regime is developed at subsonic speeds and carried out by the heat transfer between molecules. The main characteristic of this regime is the presence of a flame, which can be defined as a rapid chemical change occurring in a very thin fluid layer, involving steep gradients of temperature and species concentrations and accompanied by luminescence [2]. Macroscopically, the flame front can be viewed as an interface between the burned gases and the unburned mixture, in which the gases have a greater volume, temperature, and lower density than the mixture.
Aircraft engine emissions have become a major issue because of their impact on people’s health. The ICAO standards [14] for the maximum mass fraction of each of the emissions during an LTO cycle are shown in Table 1.

Table 1.
Percent of total emission mass. Source: Obtained from [14].
2.1. Procedure of Design
The combustion chamber must satisfy the requirements demanded by the industry, so special attention must be paid to the factors that influence the performance and operation of the engine. Some of these requirements could be mutually incompatible, so the designer must define the priorities according to the application.
Weight and size are always a priority for aircraft engines, so the design must focus on satisfying those requirements. A combustion chamber design requires initial values of thermodynamic, aerodynamic, geometric, and combustion properties that will be used as a starting point for the calculations. These values were determined based on the operating conditions of the CFM56-7B engine at maximum thrust (take-off condition), and on the level of technology established by Mattingly [1]. Table 2 shows the values of the design parameters used.

Table 2.
Design parameters.
Table 3 shows the thermodynamic constants values used:

Table 3.
Gas constants.
2.2. Reference Dimensions
The first step is to calculate the reference area (Aref), which is defined as the maximum cross-sectional area of the casing in the absence of a liner [15], and with this data, calculate its height (href). Equation (1) is used to calculate the reference area [16]:
For an annular chamber, a pressure loss factor of 18 is recommended by [16]. Once the area has been calculated, the height of the section (href), is determined using Equation (2):
Equations (3) and (4) are used to calculate the area corresponding to the flame tube (Aft) and its height (hft) [16]:
The root and tip radii, at any cross-section, are calculated with the Equations (5) and (6) below:
2.3. Air Mass Flow Distribution
The air is divided between primary and secondary flow at the combustion chamber inlet. The first is the air used for combustion, while the second will be used to cool the liner walls and dilute the combustion products. The fuel characteristics are shown in Table 4.

Table 4.
Fuel chemical properties.
Considering values from Table 4, the air amount for each section is calculated using Equation (7). In the primary zone, it is necessary to determine the oxygen required for a stoichiometric mixture with the fuel [17].
For the analysis, kerosene is free of contaminants, so ms = 0. With the amount of oxygen, the stoichiometric air mass flow is calculated using Equation (8).
An optimum combustion chamber is required to obtain complete combustion. To achieve this, the amount of air to enter the primary zone for combustion must contain 10% excess air, then the primary air is calculated as follows using Equation (9):
The air in the flame tube is circa 75% of the primary air [16], then it obtained Equation (10):
Once the amount of air entering the primary zone is defined, it is understood that the rest of the total air entering the DC will be secondary air , as is follows in Equation (11):
Approximately half of the total mass flow at the combustor inlet will be used for flame tube cooling. The percentage can be estimated as follows in Equation (12):
Then the cooling air ( can be calculated using Equation (13):
On the other hand, the rest of the secondary mass flow will be that which will enter the flame tube through the dilution orifices, then Equation (14) appears:
2.4. Diffuser
This will consist of three different cross-sectional planes; the air inlet plane (plane 0, compressor outlet, and defined dimensions), the middle plane (plane 1, where the air is divided between primary and secondary), and the outlet plane (reference plane, inlet to the primary zone, defined dimensions). The compressor design criteria as the Diffuser Pressure Ratio (πd) equal to 0.98 and combustion velocity (VB) as 60 m/s.
In addition to the input data, the physical and geometrical properties in plane 1 are calculated using Equations (15)–(22) detailed in Table 5:

Table 5.
Equations to physical and geometrical properties.
The diffuser angle is obtained considering all the variables of Equation (23) obtained from [18]:
Once the angle is obtained, the length from the combustor inlet to the snout, which divides the primary flow from the secondary flow, is calculated using Equation (24):
It is also possible to estimate the total length using Equation (25):
Snout area (As) and the height (hs) are given by Equations (26) and (27):
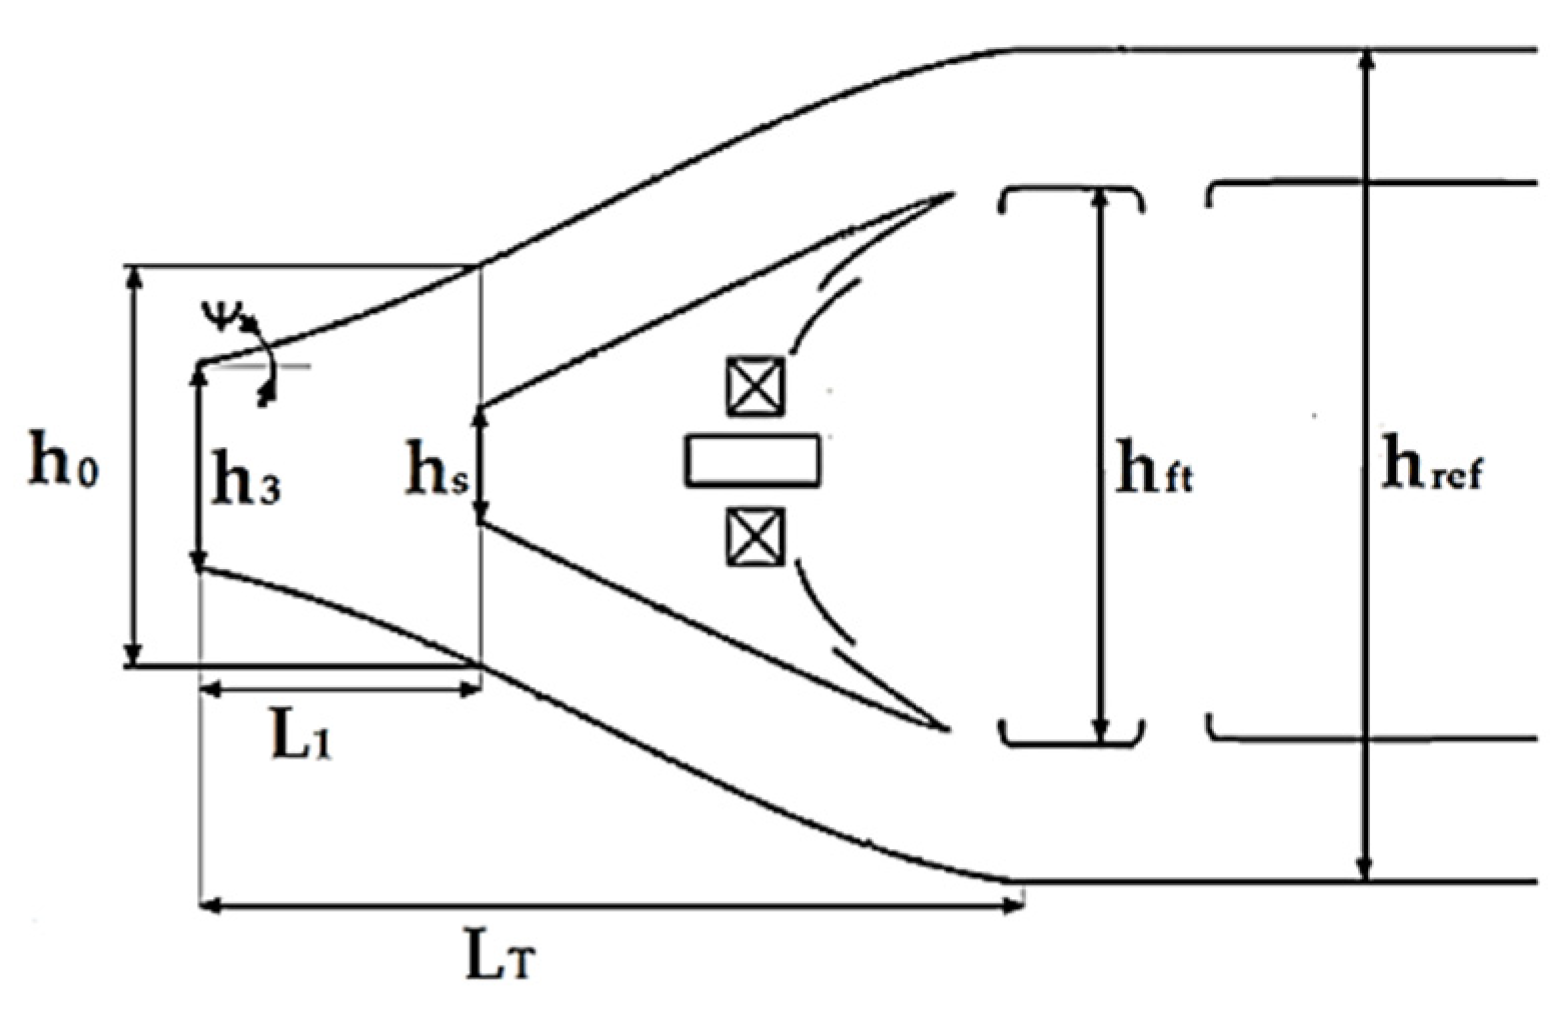
Figure 2 shows schematically the previously described zones, considering all each variable calculated with the previously described equations. It is important to mention that airflow apportioning was obtained from [4].
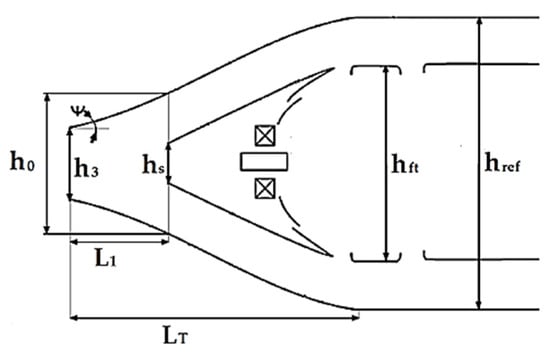
Figure 2.
Diffuser combustor geometry.
2.5. Combustor Lengths
Length of the primary zone and length of the secondary zone can be calculated using Equations (28) and (29).
On the other hand, the length of the dilution zone is important to consider the Temperature Traverse Quality (TTQ), whose value for an annular combustion chamber is close to 0.25 [16]. With this value and the pressure loss factor, the corresponding equation is solved for x, the result of which is the ratio of dilution zone length to flame tube height . The equations for the calculation of the Traverse Temperature Quality are shown in Table 6 (Equations (30)–(33)):

Table 6.
Equations for Temperature Traverse Quality for different pressure loss factors.
Once the ratio of dilution zone length to flame tube height has been calculated, the length of the dilution zone is calculated using Equation (34):
2.6. Swirler
The swirler is designed based on Clemente, choosing a thin straight, vane axial swirler. Table 7 shows the swirler design characteristics recommended by [18].

Table 7.
Swirler design criteria. Source: [18].
2.7. Flame Tube Cooling
Film cooling through holes was used, and a Z-ring geometry was chosen because the efficiency is higher compared with other techniques and manufacturing costs are lower [19]. In order to simplify the design, calculations are made based on the conditions for one injection section. The cooling air per section is calculated using Equation (35):
The number of cooling hole slots is calculated using Equation (36).
The distance between each cooling slot ranges between 40 and 80 mm, choosing 40 mm, due to the length of the combustor. The diameter of the cooling holes (Dcool) is set at 2.4 mm, a size commonly used in the industry. The area of each hole is calculated using Equation (37):
The air mass flow entering each cooling slot is different, choosing a 35/25/20/20 percent distribution of air for each slot, respectively. Then Equation (38) is used:
The area needed for the intake of that amount of air is calculated using Equation (39):
Finally, the number of cooling holes per section is calculated using Equation (40):
2.8. Dilution Holes
Two rows of dilution holes are considered, with 2/3 of the flow entering the first row and the remainder entering the second row. The flow entering each row is calculated using Equations (41) and (42).
The mass flow of the exhaust gases inside the flame tube is different in each section, so they are calculated using Equations (43) and (44):
In addition, the pressure delta across the flame tube needs to be calculated using Equation (45):
Notice that %ΔPft equal to 3%. Using the Cranfield Design Method [2], calculations per row are performed using Equations (46)–(49).
Row 1: Hole effective diameter (dj1). Notice that J is the momentum-flux ratio equal to 6.6.
Then, the number of holes for row 1:
Row 2: Hole effective diameter (dj2):
Number of holes for row 2:
Since the holes are not parallel to the flow, a discharge coefficient (CD) is required to determine their actual geometric diameter, resulting in Equation (50):
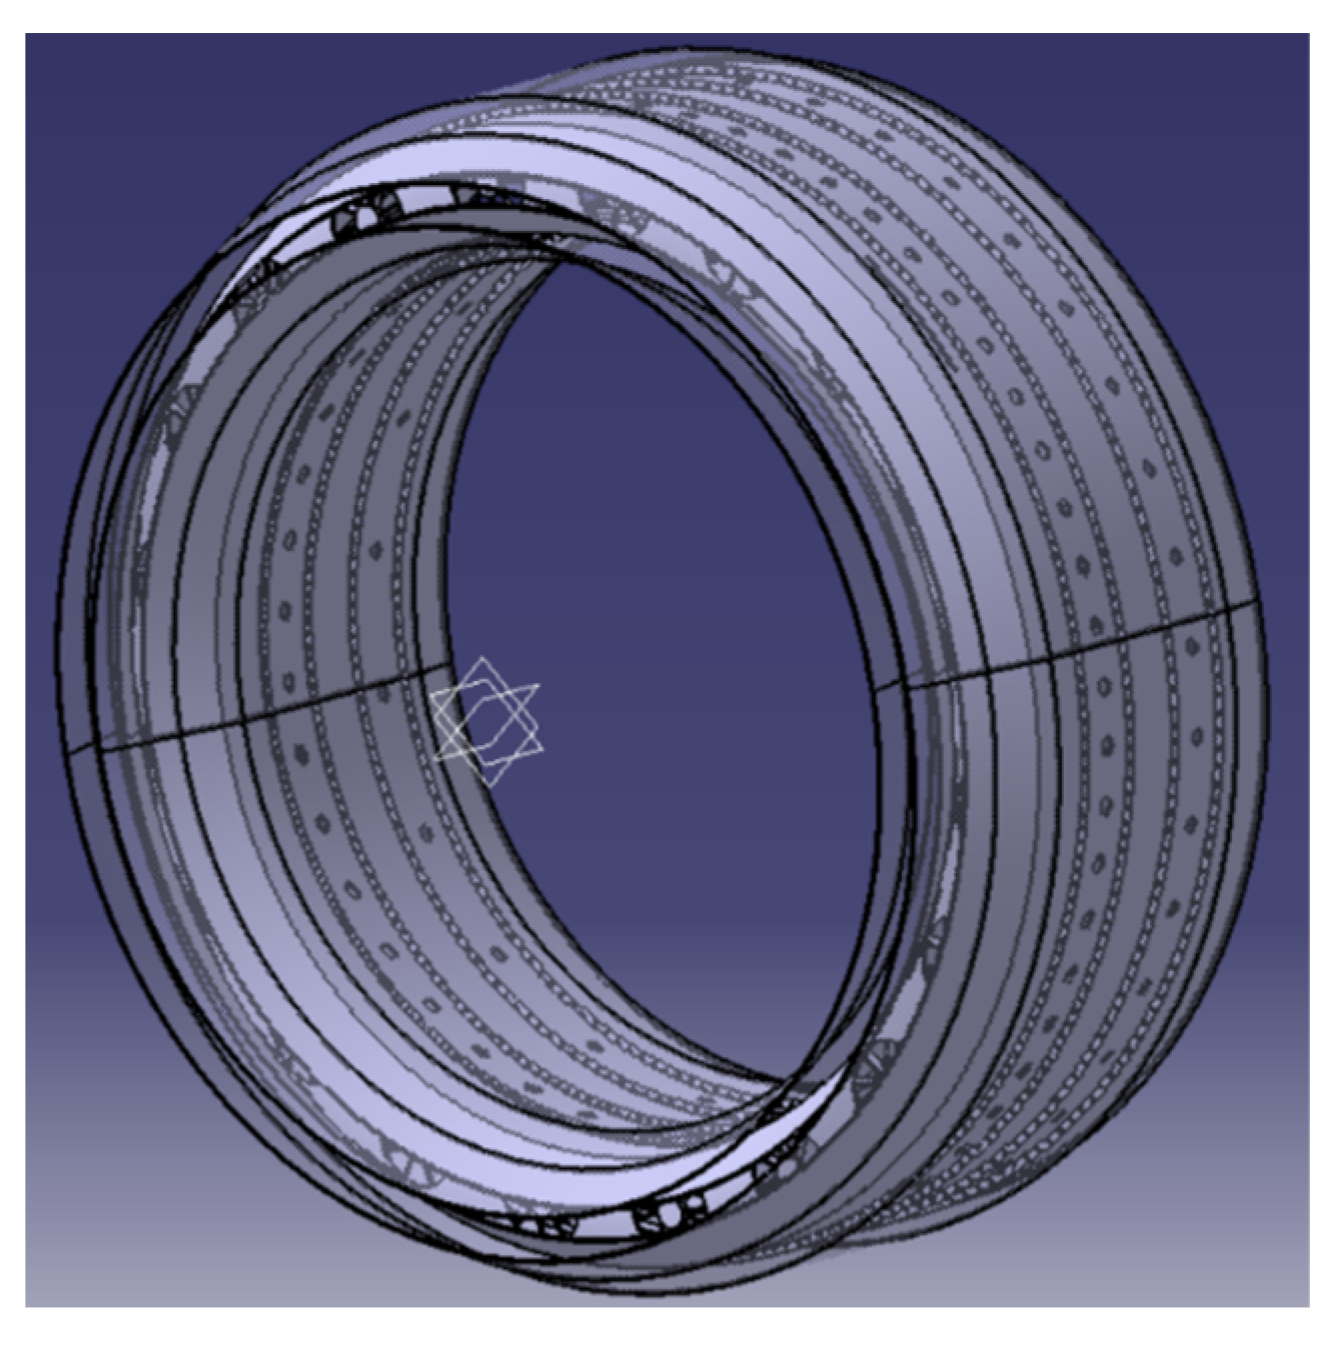
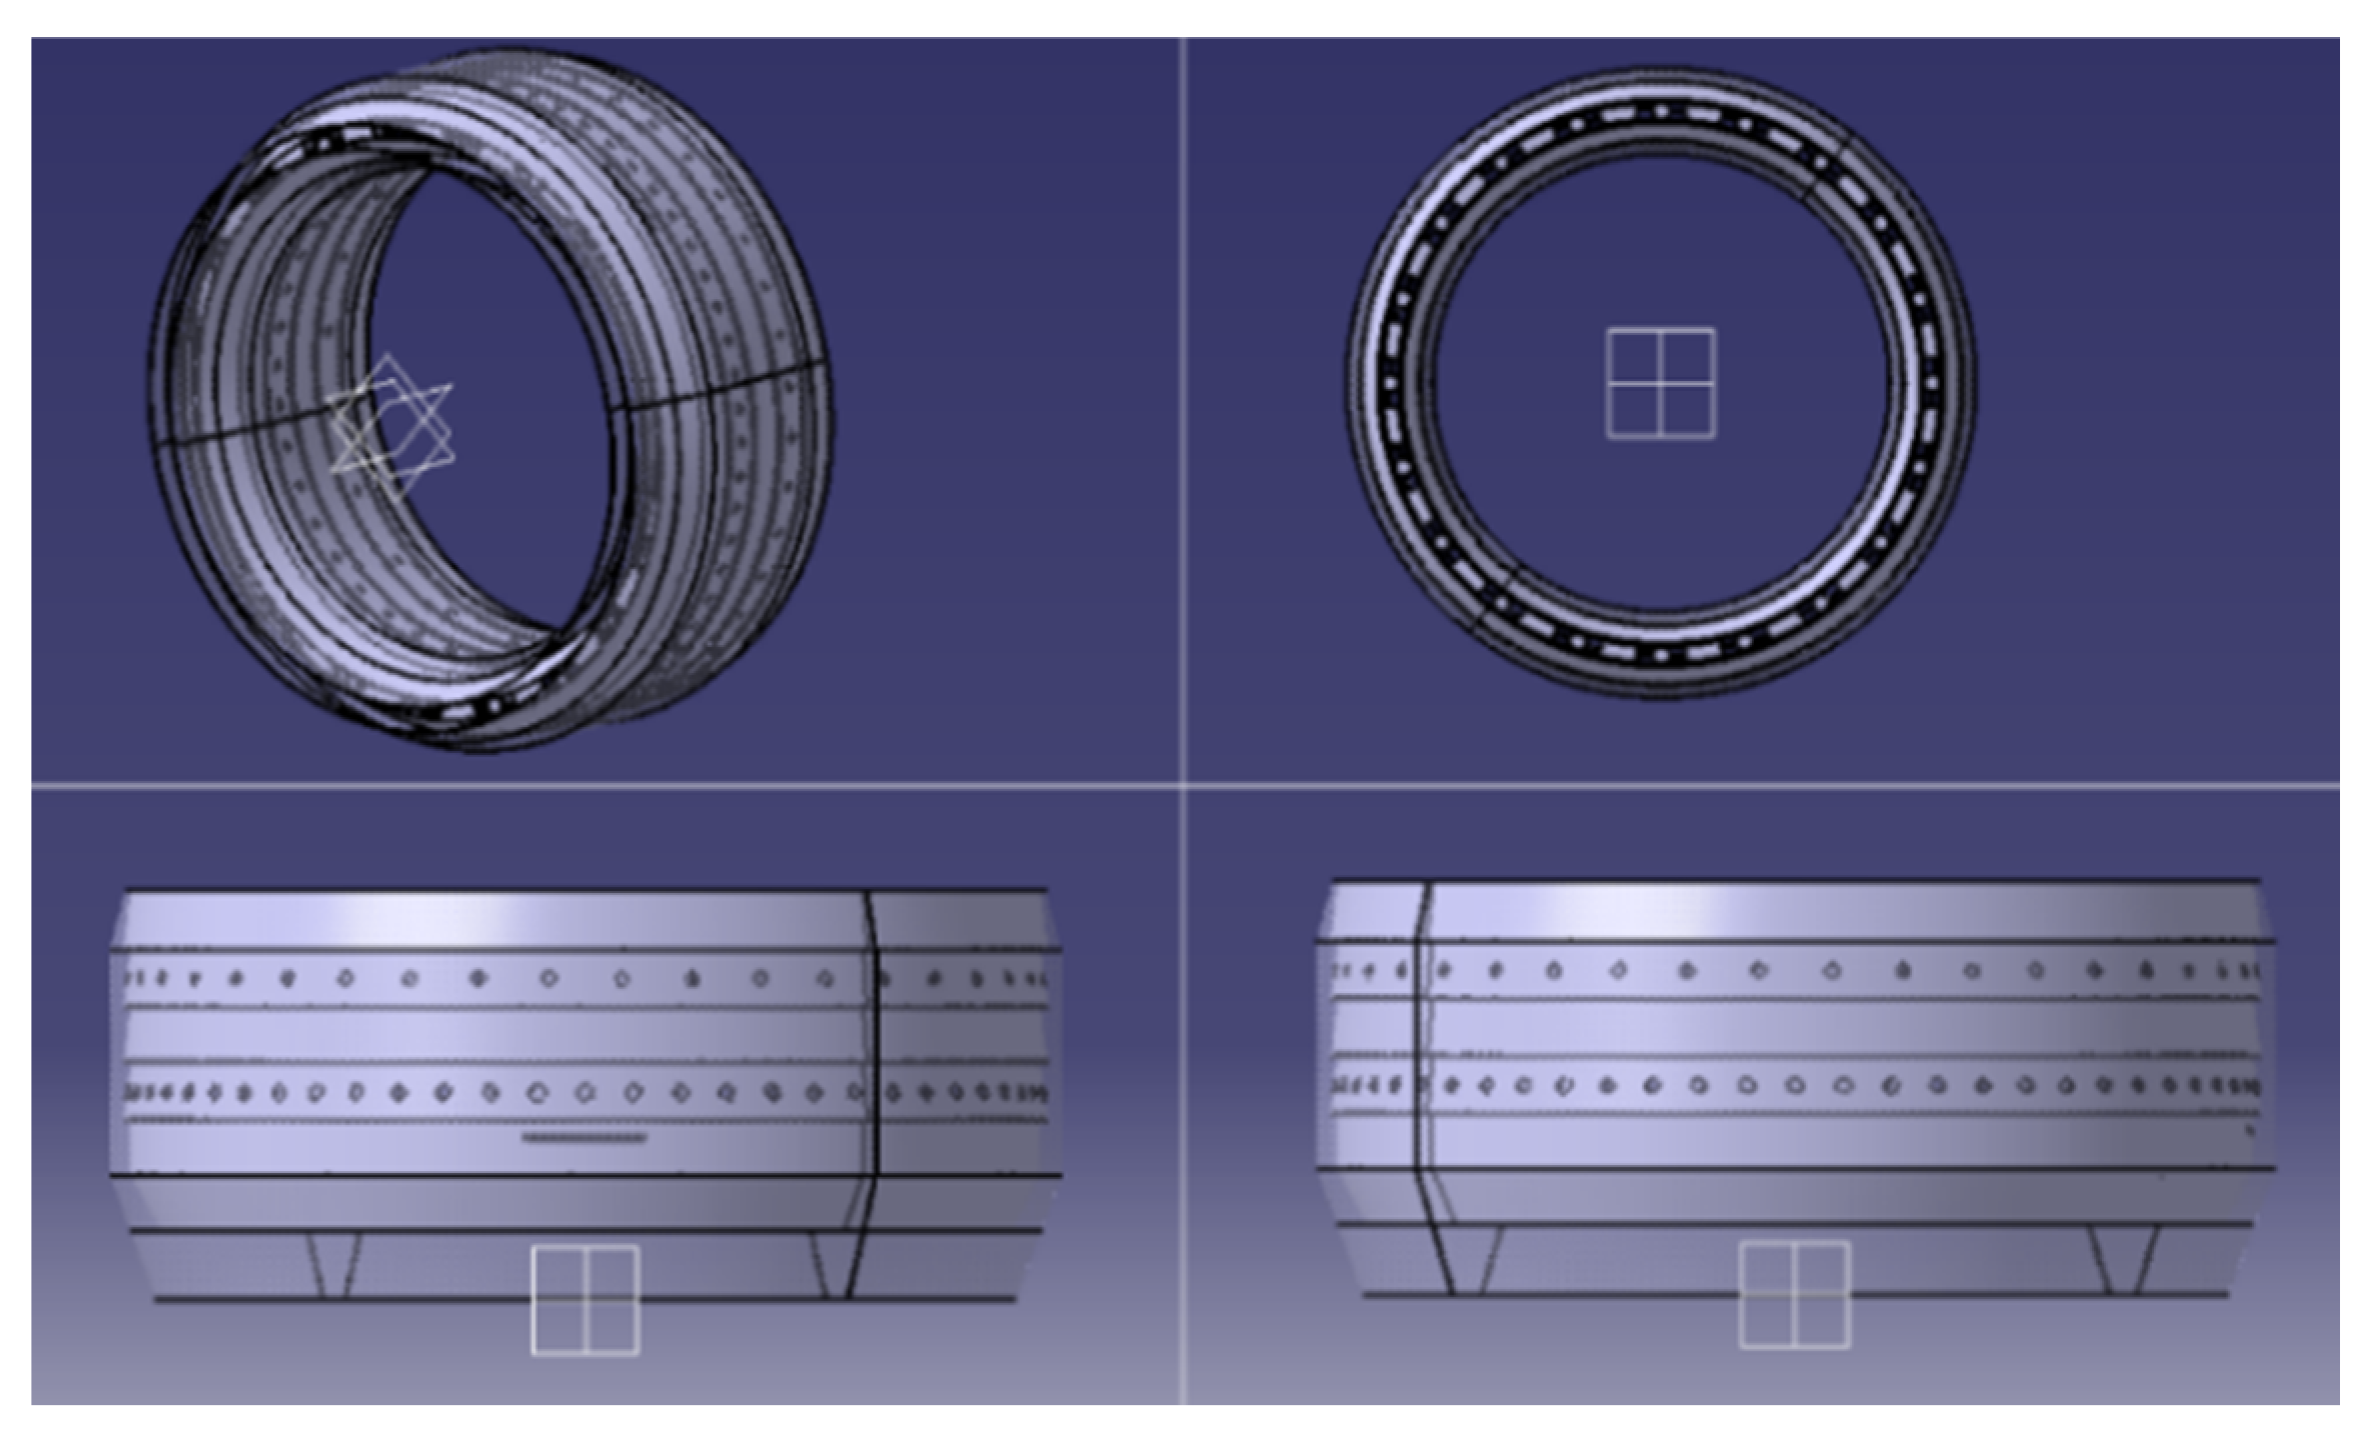
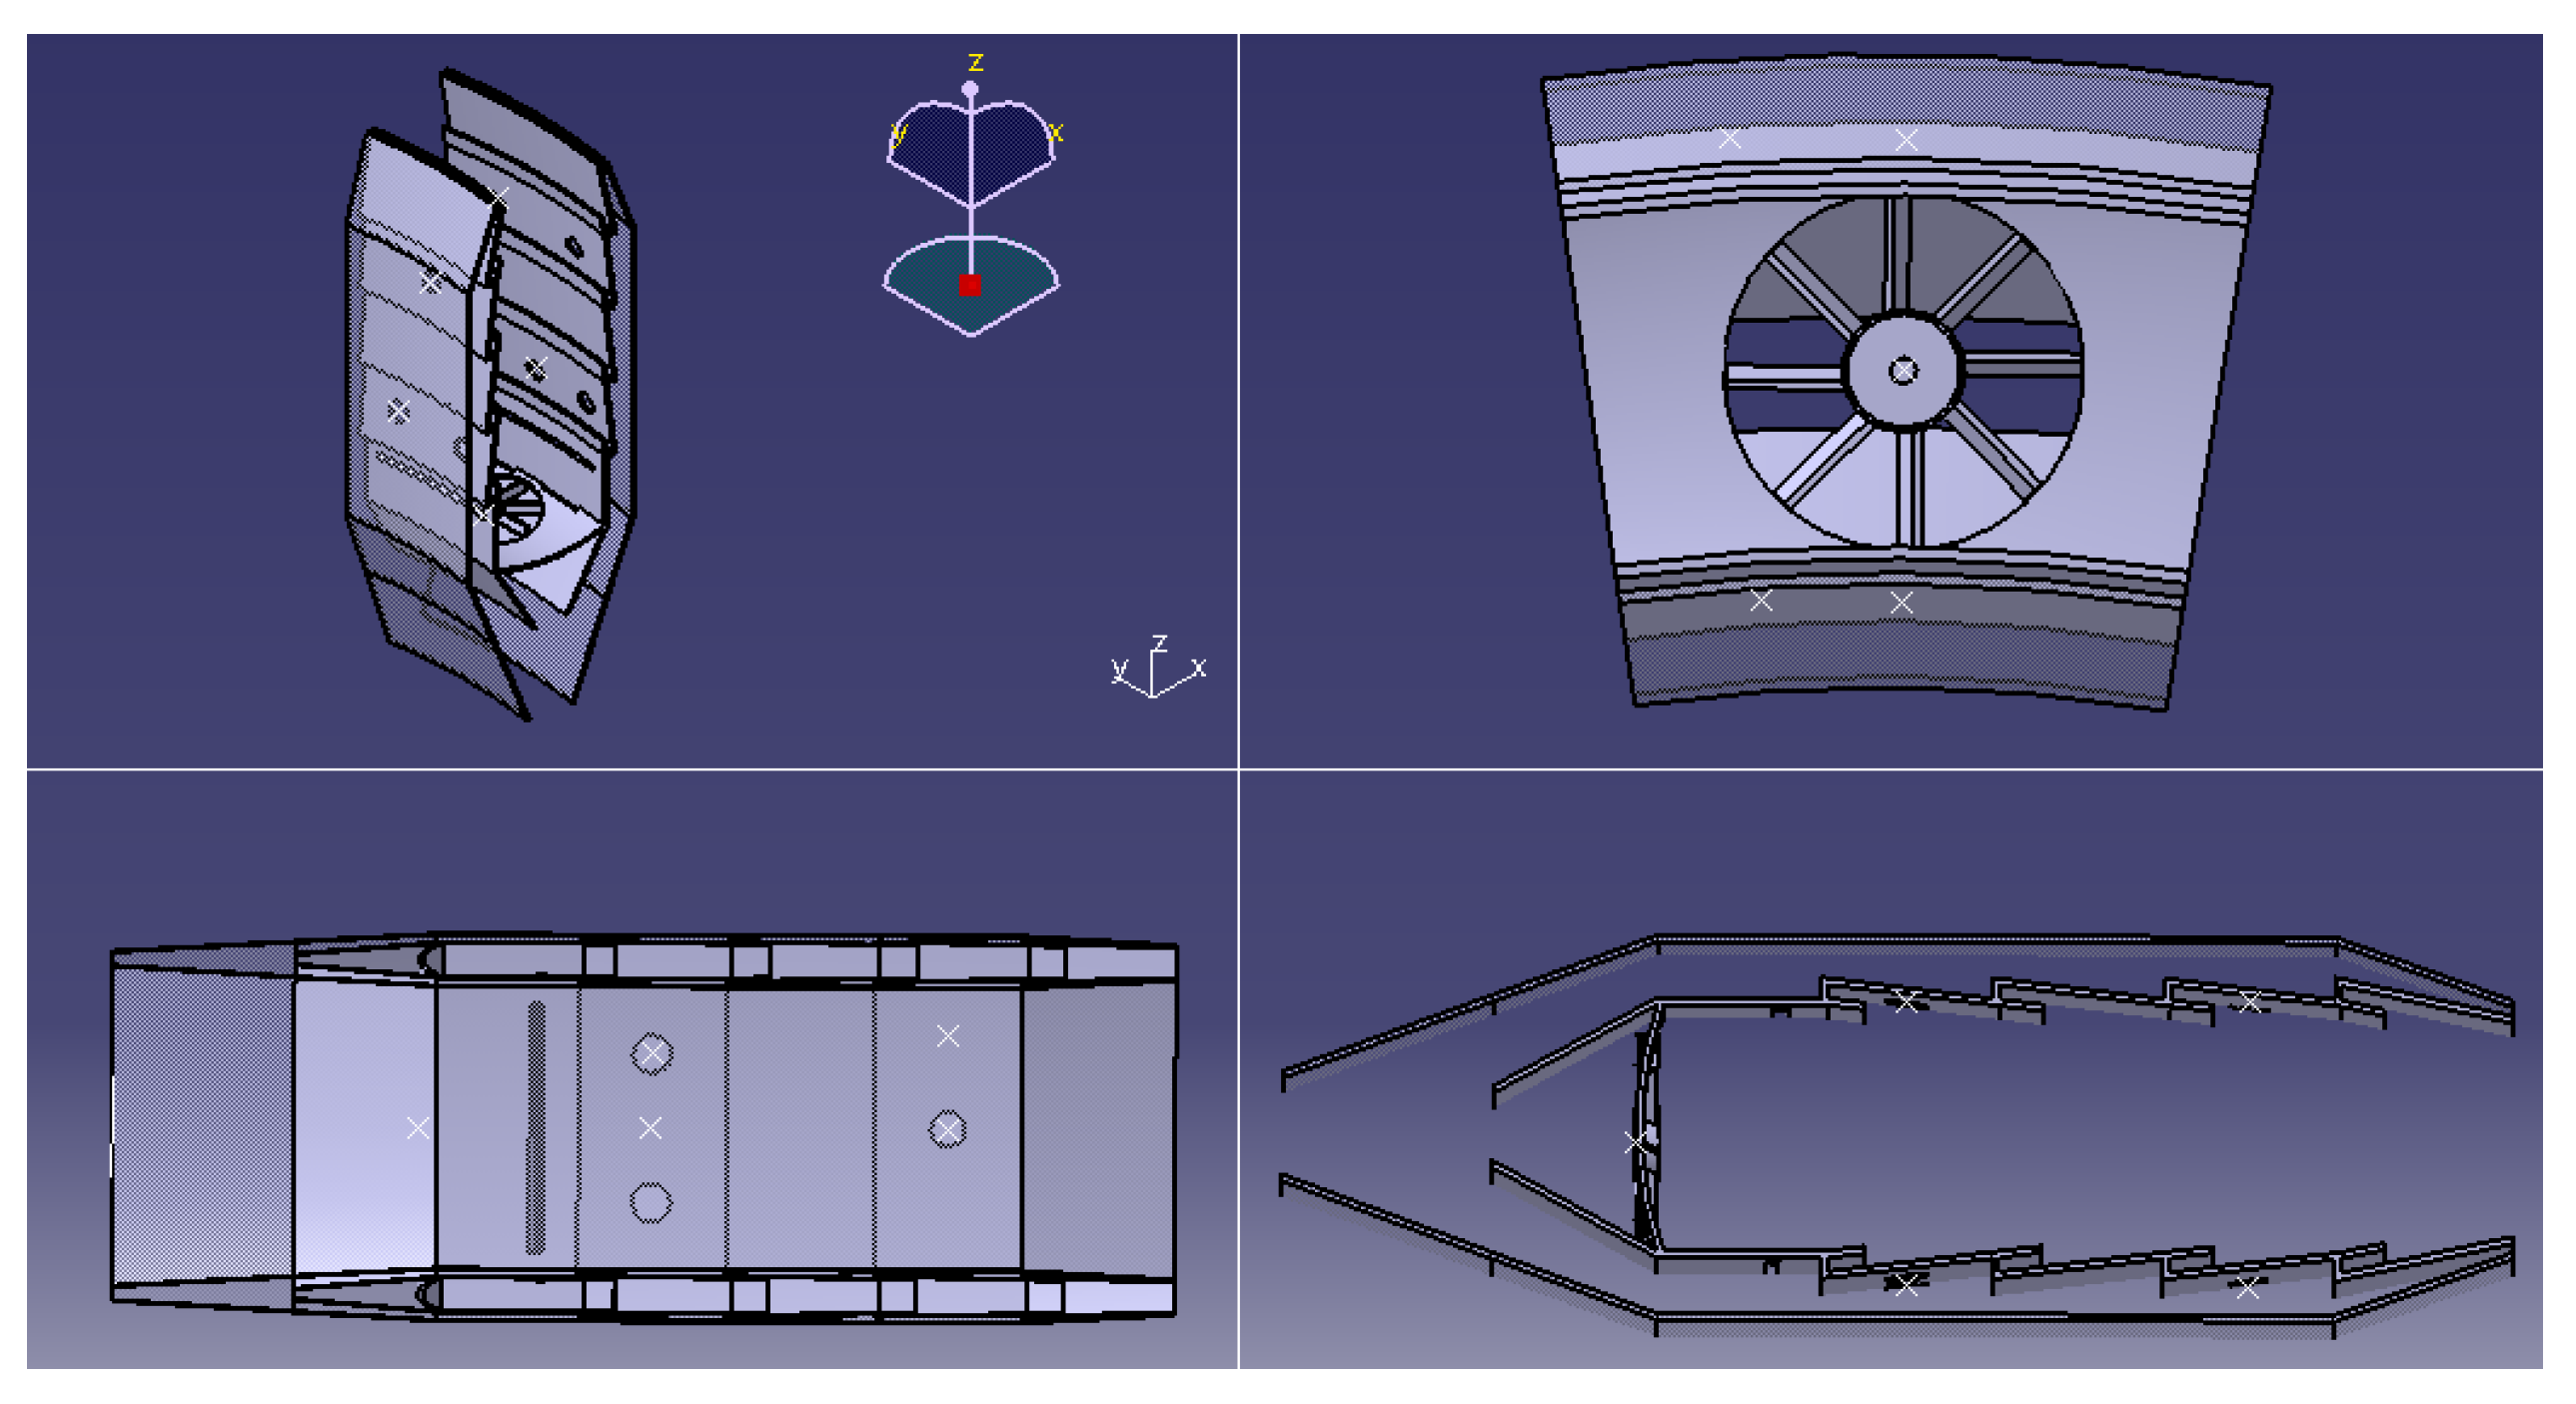
According to Lefebvre, the recommended discharge coefficient value for annular combustion chambers should be CD = 0.6. However, the calculations have been completed, so we have enough measurements to design the camera, whose results obtained when designing it in CATIA-V5 software are shown in Figure 3 and Figure 4 [20].
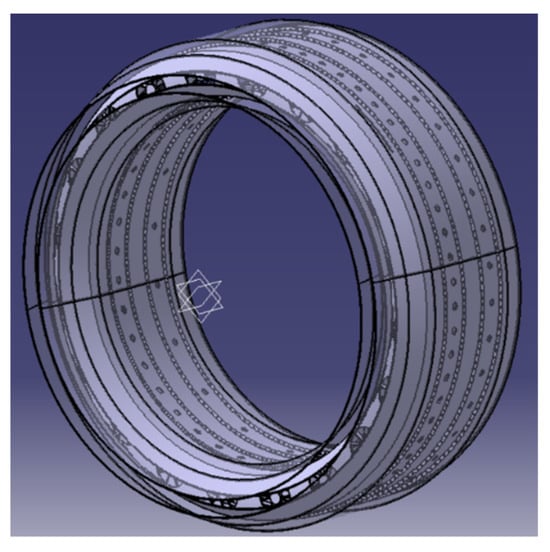
Figure 3.
Isometric view of the combustion chamber.
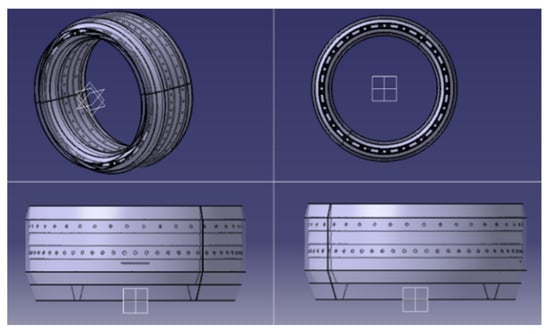
Figure 4.
Combustion chamber viewed from different points of view.
On the other hand, it is important to design the combustor without defects, as these might reduce the performance and represent a security risk [17].
2.9. Analysis Section
An analysis section, consisting of an annular portion with an angle of 18°, including the swirler and the respective fuel injector, is chosen to simplify the analysis and decrease the computational cost (See Figure 5). This section is exported to the CFD section in a compatible format.
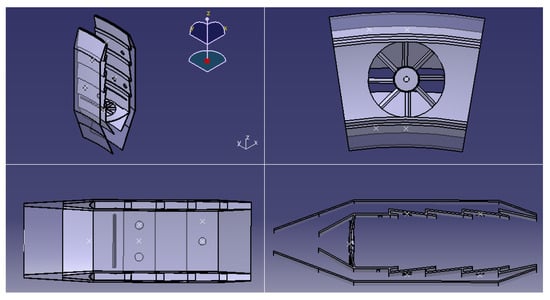
Figure 5.
Views of the analysis section.
2.10. Mesh Generation
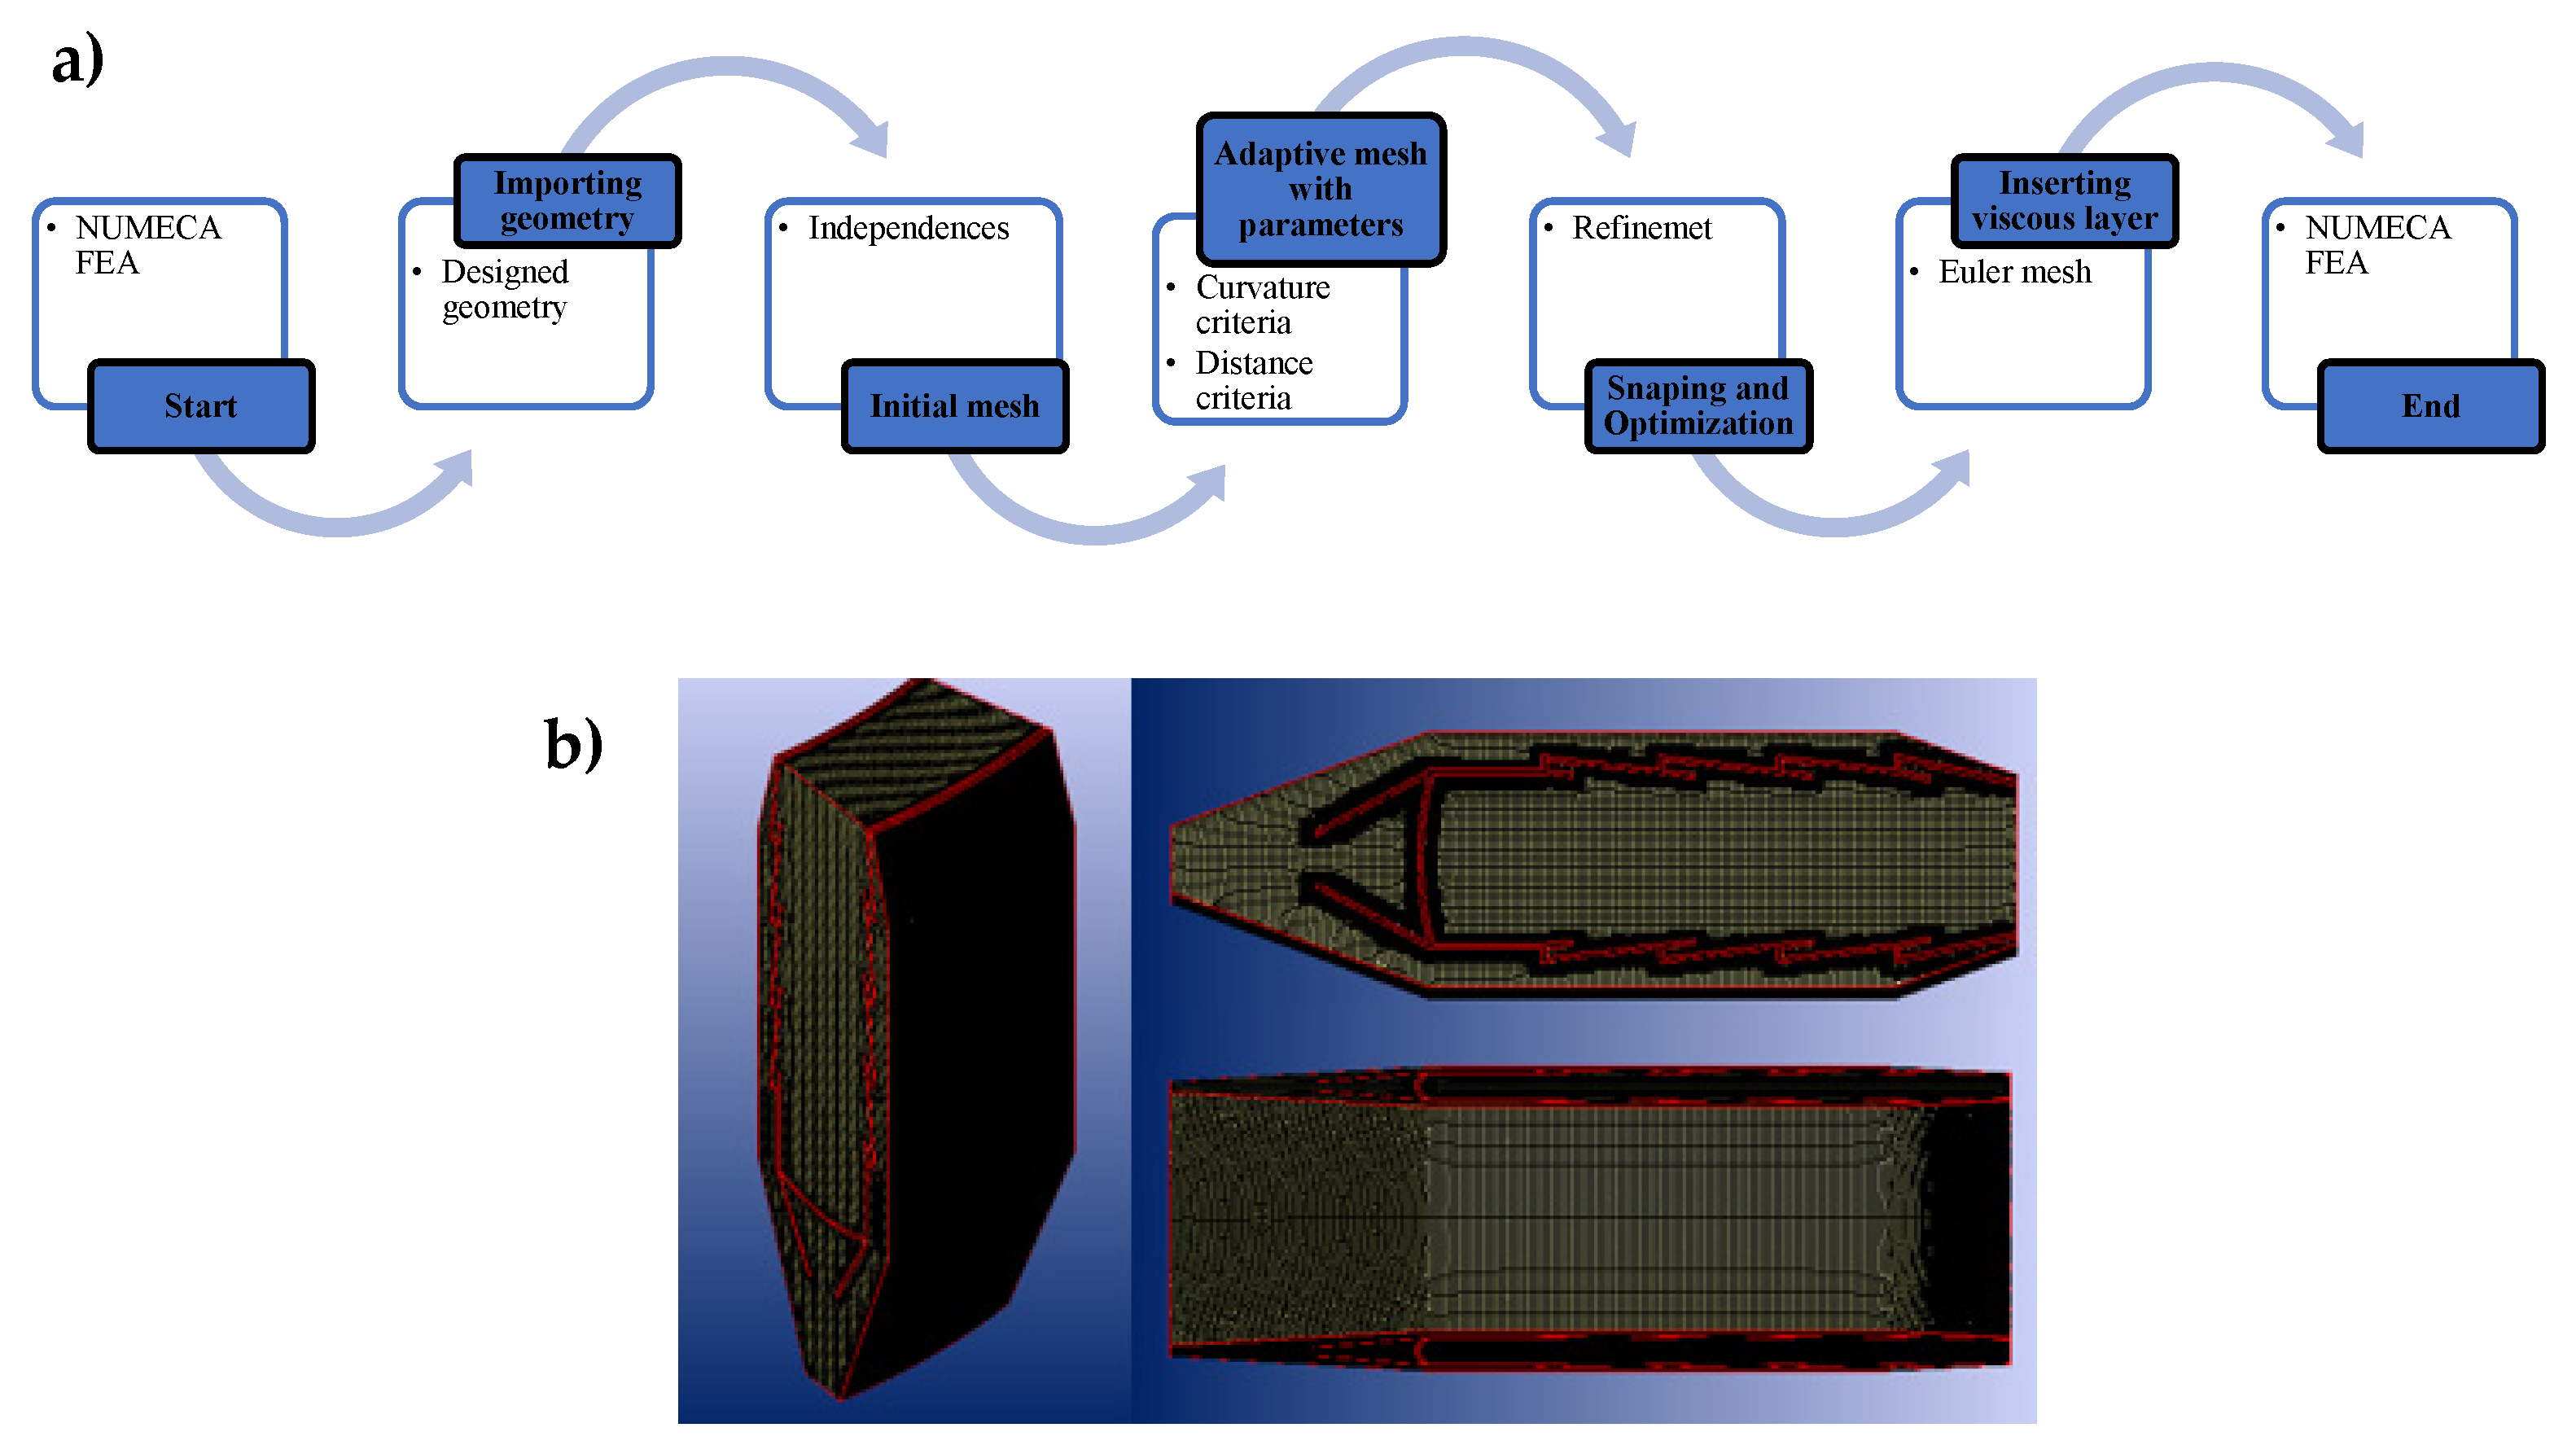
NUMECATM Academic version was used to perform the analysis [21]. The complexity of the geometry and the tools available in HEXPRESSTM to control the software were given. The characterization of the domain and a preliminary mesh were performed in ANSYSTM 19.2 software, saving it in a format compatible with HEXPRESSTM. The software generates a high-quality hexahedral grid through 5 defined steps as described below (see Figure 6a):
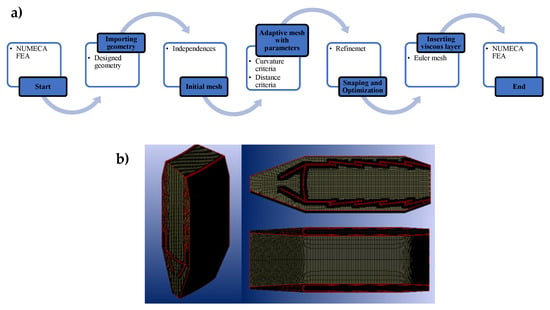
Figure 6.
(a) Flowchart and (b) distribution of cells in the mesh.
- (1)
- Importing the geometry;
- (2)
- Generating an initial mesh;
- (3)
- Adapting the mesh using flexible parameters, e.g., curvature and distance criteria allows high control over the distributions of grid points;
- (4)
- Snaping and optimization and anisotropic refinement keep the overall cell count as low as possible;
- (5)
- Inserting a viscous layer by the Euler mesh inflation method allows the insertion of high-quality viscous layers with a smooth transition.
This technique inserts layers of cells with a high aspect ratio for accurately solving the boundary layer. The technique is based on the successive subdivision of the cells close to the walls, having a higher robustness and meshing speed than other techniques. The main parameter for consideration in the insertion of the viscous layer is y1+, a non-dimensional value related to the viscous layer that should be 30 < y1+ < 50.
The result was a hexahedral unstructured mesh with approximately 7M cells, a boundary layer on the surfaces of interest and high quality. Notice that the mesh satisfied the criterion mentioned about the y1+, which was not the same as the 5M cells proposed in the grid independence study; here, the main point was to use a 7M as a grid for the productive runs. Figure 6b shows the distribution of the cells in the mesh.
2.11. Initial and Boundary Conditions
The conditions under which the simulation was carried out were those of the engine operating in a take-off regime. For practical purposes, the simulation was carried out by burning methane instead of kerosene to reduce the simulation’s complexity [22]. The implementation of methane as fuel in the aeronautic industry has been studied since the 1970s and even in earlier studies [23] and actually is a novel topic in several investigations [24]; in the same sense, the use of aeronautic turbines for electrical generation using methane as fuel is becoming an attractive field in recent years [25]. Even more, in some power plants with aeroderivative gas turbines methane is used as fuel with no more implications in the design that the modification of the injectors [26]. According to Zhang et al. (2016) [27], the use of simpler fuels to emulate the behavior of complex jet fuels is an important need for the development of physics-based models to quantify the emissions and performance predictions in combustors modeling, concluding that any alternative jet fuels must be totally interchangeable with actual fuels without compromising the performance nor the flight safety [12].
The fuel mass flow was recalculated to avoid exceeding the maximum permissible temperature inside the combustor, obtaining the value shown and the rest of the simulation conditions in Table 8.

Table 8.
Initial and boundary conditions.
Fuel injection was performed axial to the flow and at 45° and 60° concerning the horizontal, using surfaces designed for this purpose, located at the back of the swirler, which replace the injector. The turbulence model chosen was , as it fits the requirements of the problem, such as a high Reynolds number and compatibility with the Flamelet model for combustion-related calculations [28,29,30].
3. Results and Discussions
3.1. CFD Results
Three different simulations were performed, each with a different fuel injection angle. Also, Navier–Stokes equations are considered to solve this analysis [31]. In the first configuration, the fuel is injected axial to the flow, for the second and third configurations, the fuel is injected conically, with an injection angle of 45 and 60° for the horizontal, respectively.
3.1.1. Axially Injected Fuel
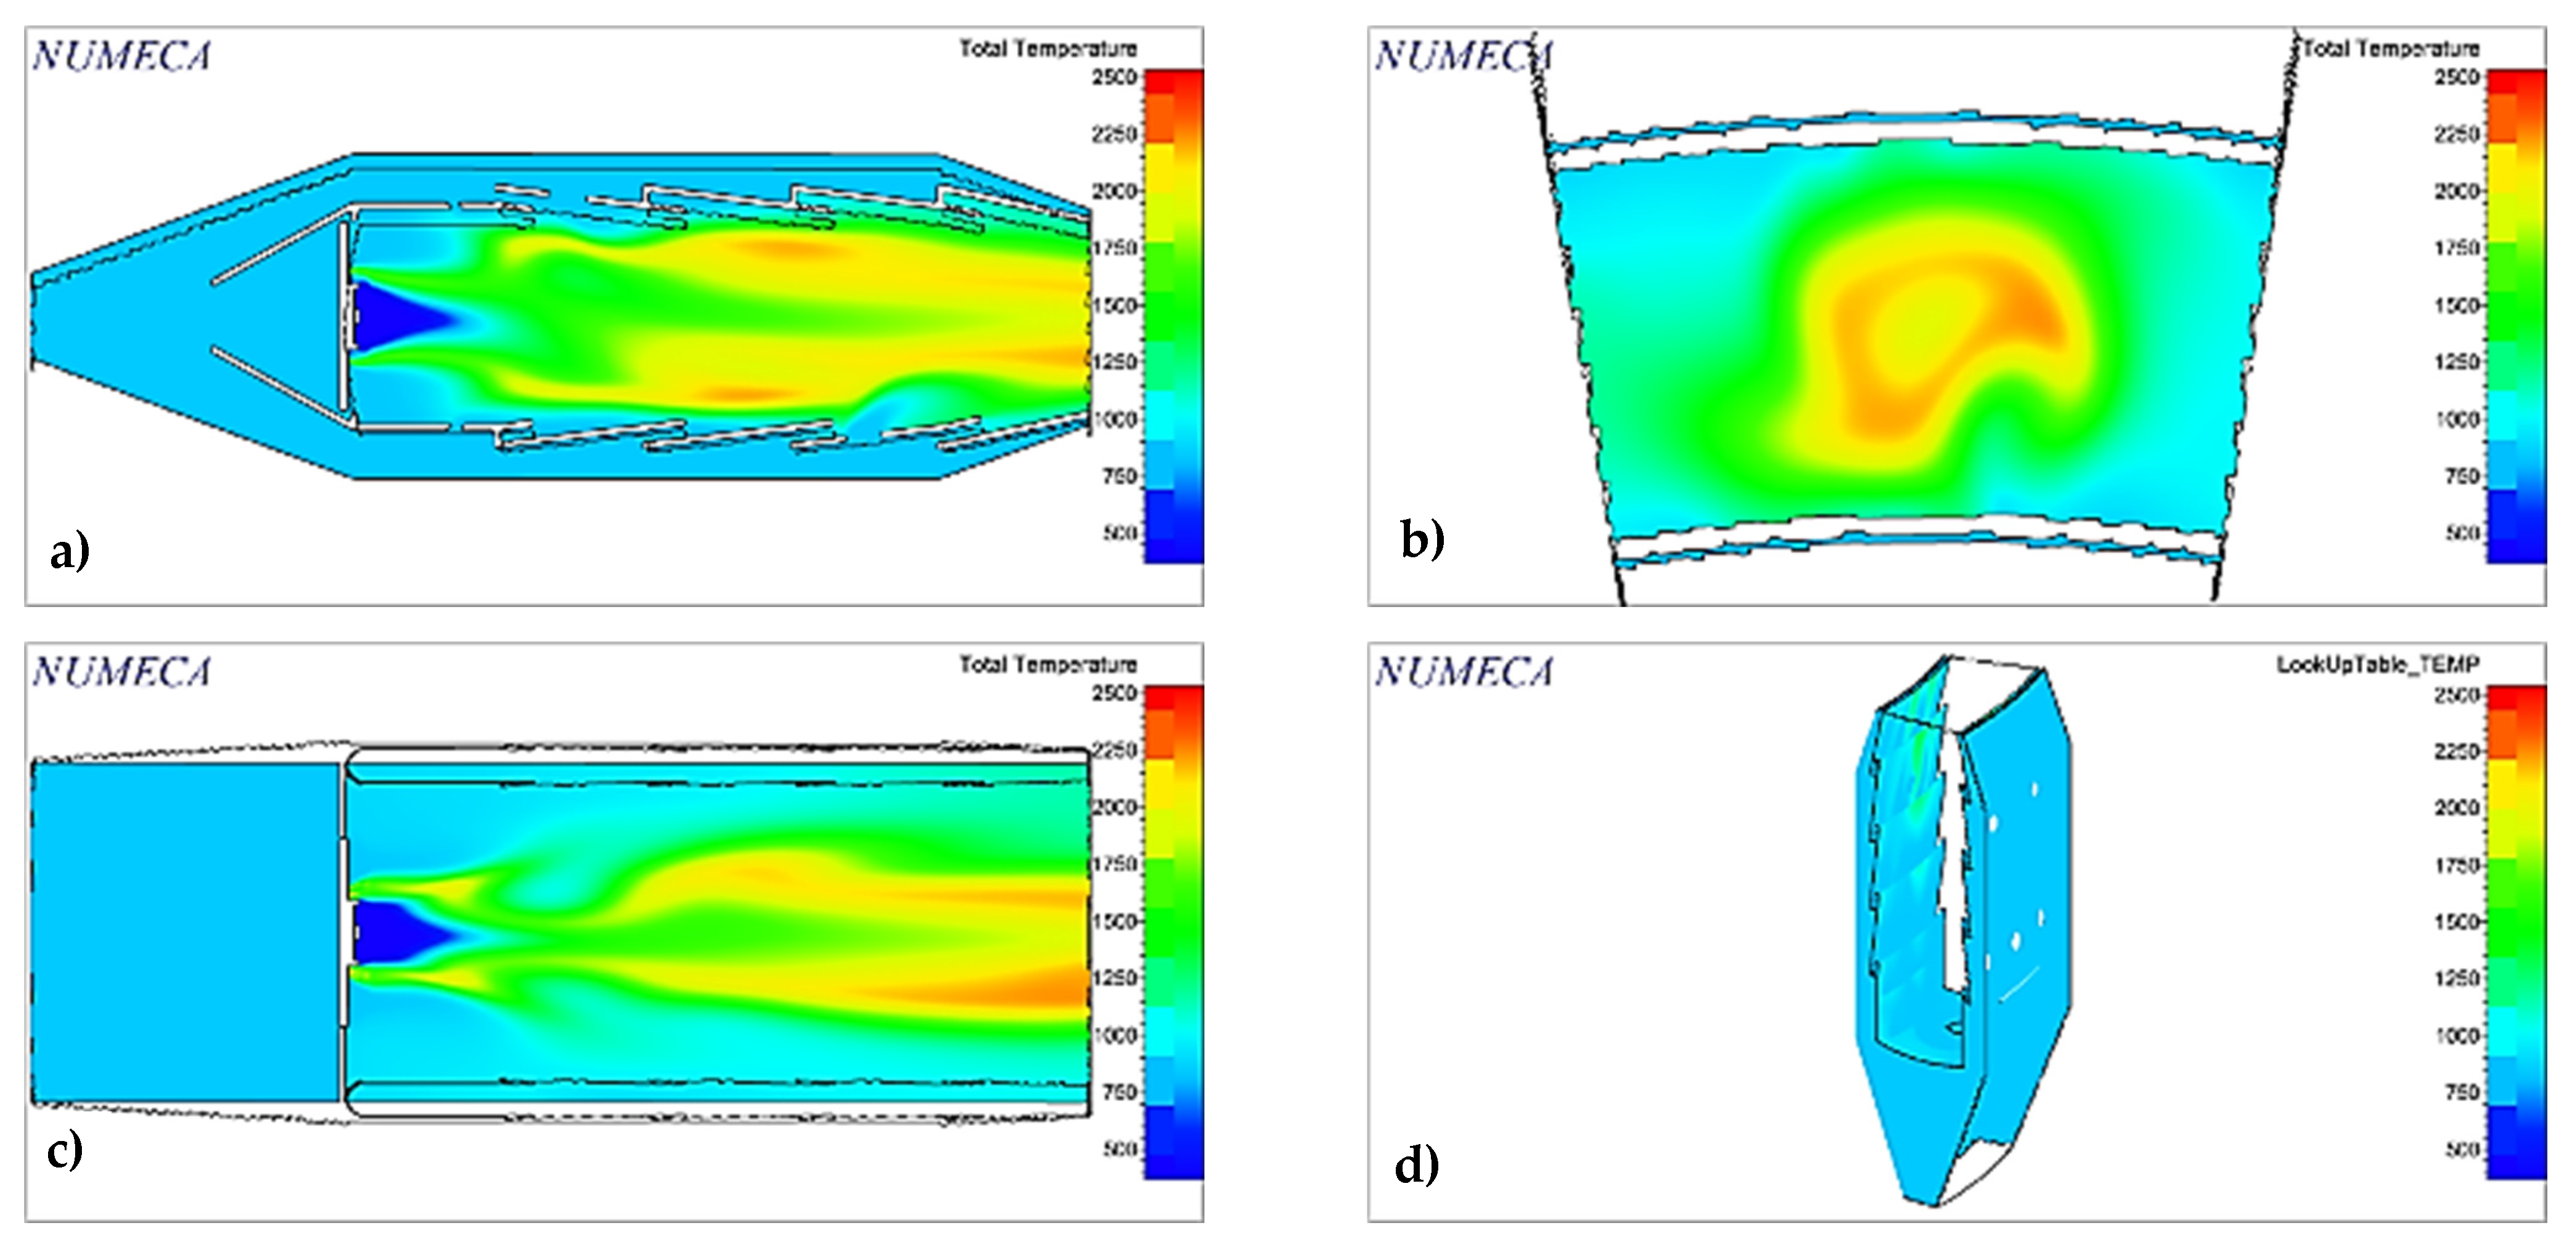
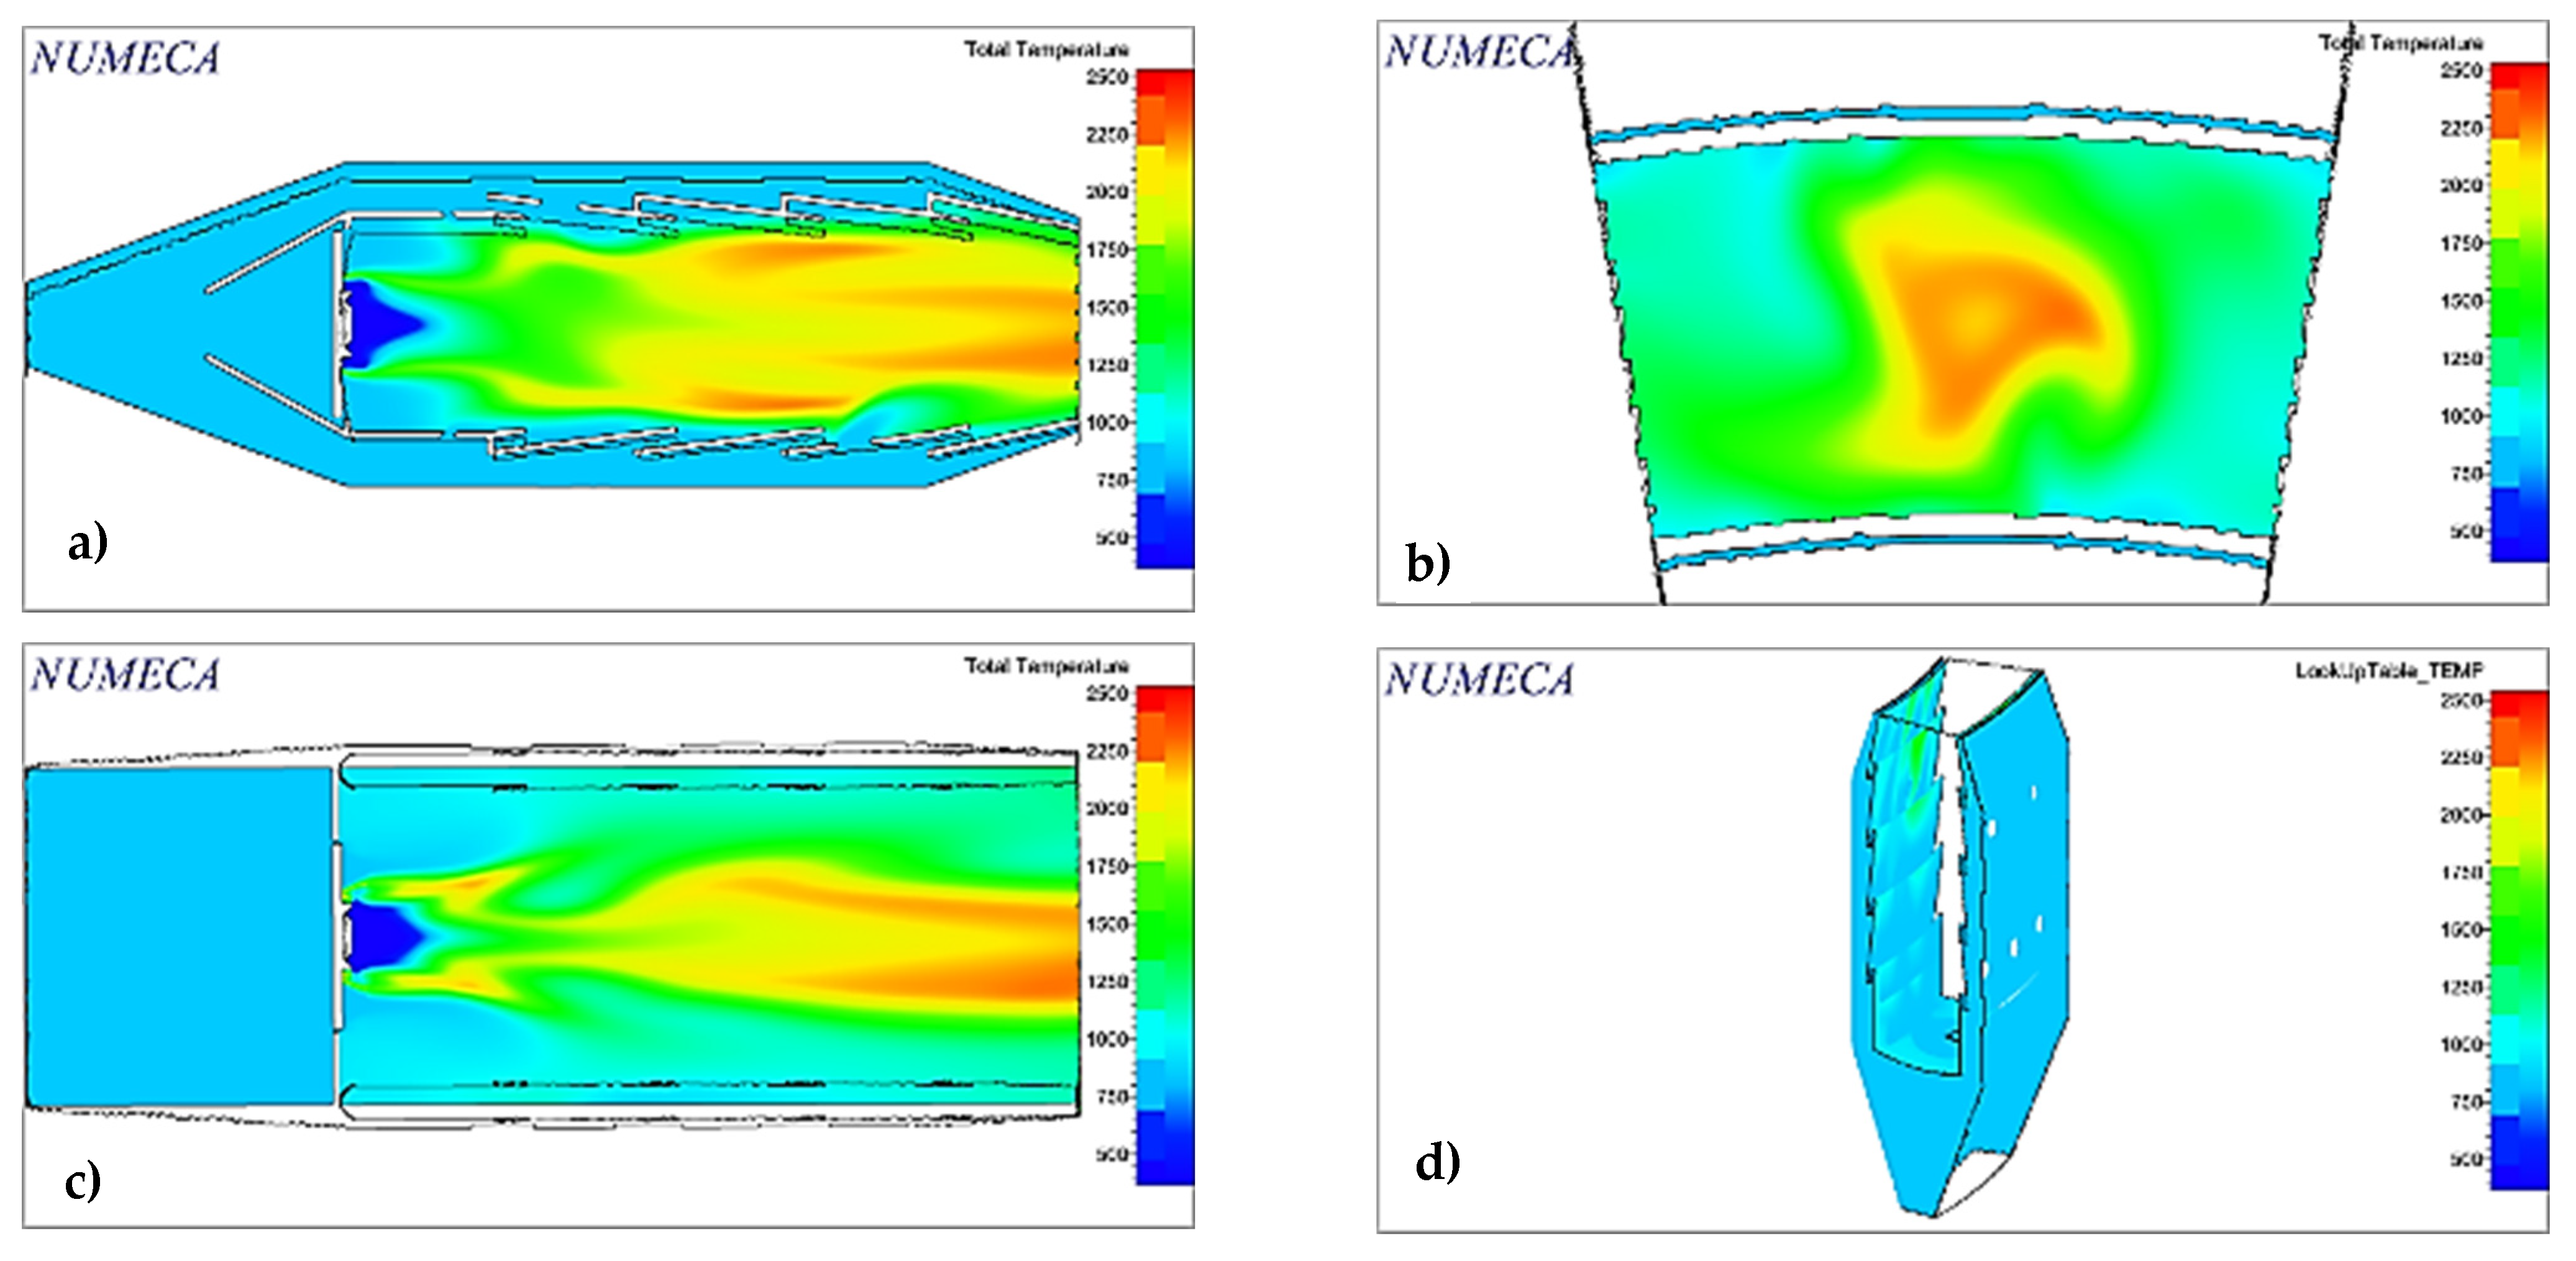
The methane is injected perpendicular to the annular surface at a rate of 0.054 kg/s. However, this configuration was inefficient because the combustor outlet temperature presents a non-uniform distribution and exceeds the maximum allowed temperatures, as shown in Figure 7. Figure 7b shows that the outlet temperature has values near 2400 K, which is undesirable for the turbine stator blade as we just mentioned that the maximum value allowed at the stator blades is 1700 K [25].
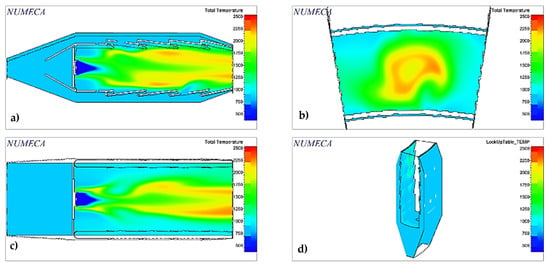
Figure 7.
Total temperature contours in different combustor planes: (a) midplane in y-direction; (b) combustor outlet; (c) midplane in x-direction; (d) isometric view of the flame tube.
The higher temperature zones indicate the presence of traces of fuel that are burning outside the combustion zone; however, all the fuel is burned inside the combustion chamber, which avoids HC contamination. Furthermore, it can be observed that the temperature of the internal walls of the flame tube (Figure 7d) and the lateral boundaries remain at temperature levels below 1100 K, indicating that the distribution of the secondary flow and the cooling holes are working correctly.
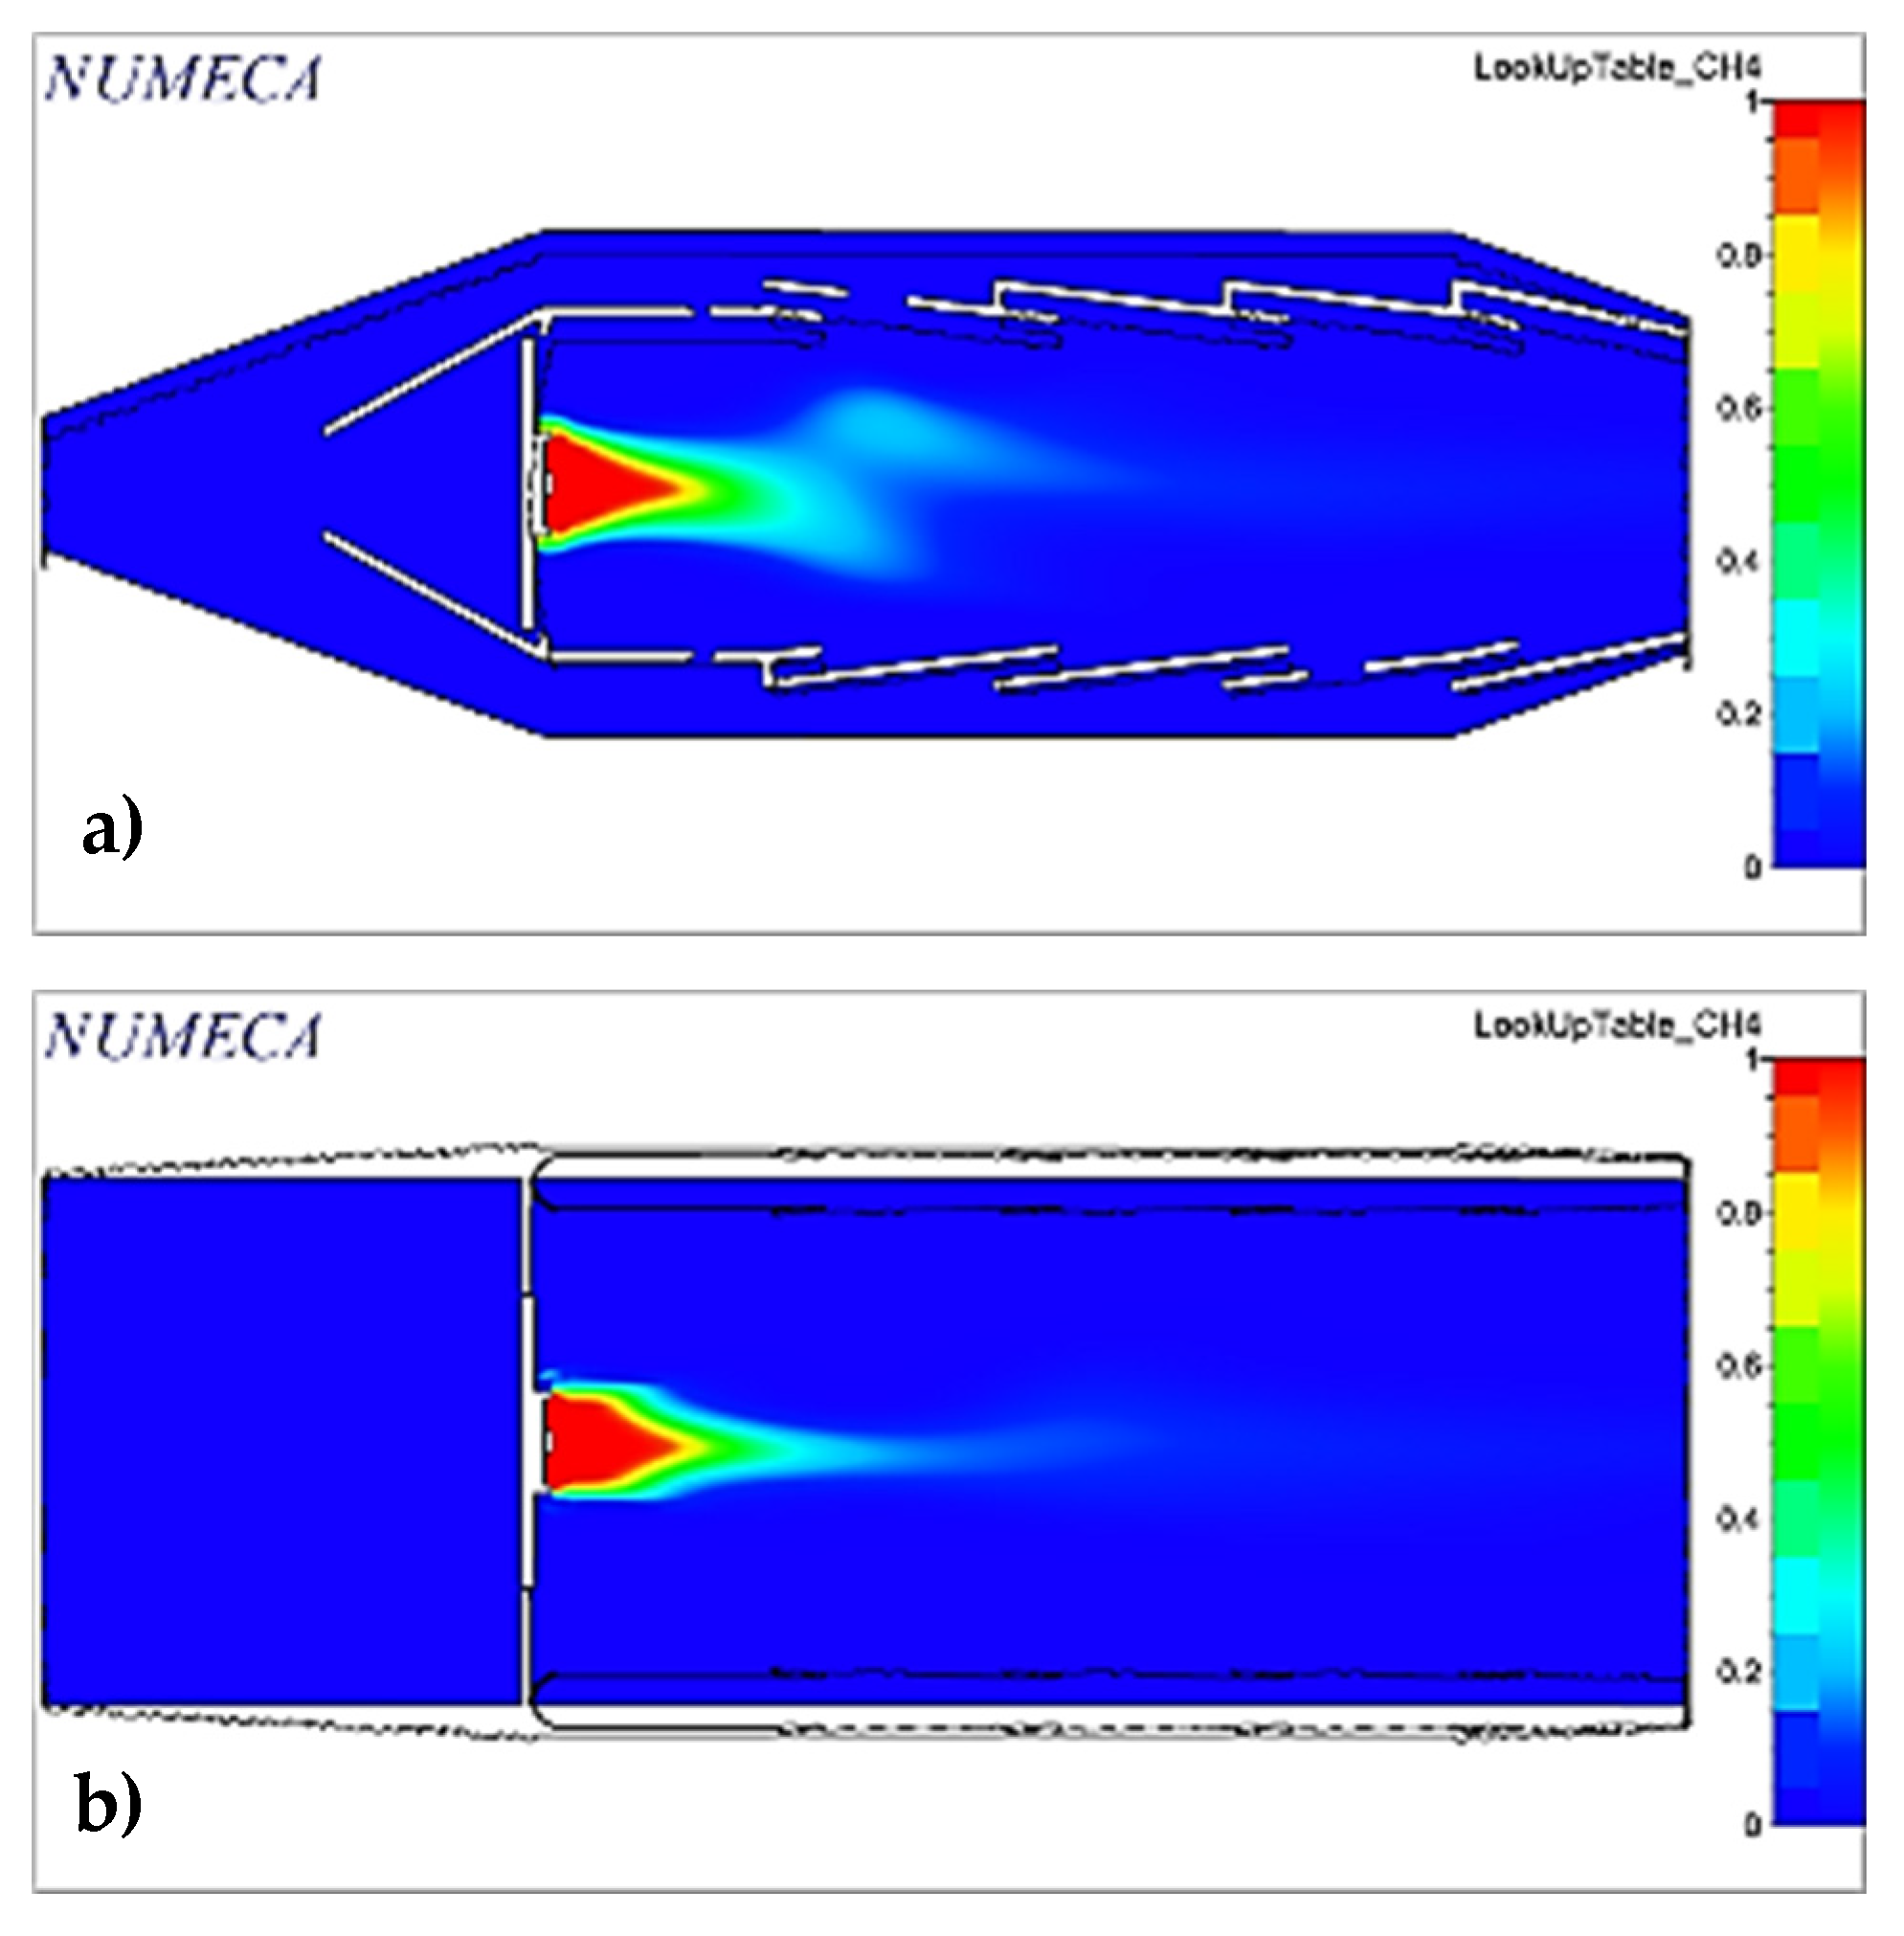
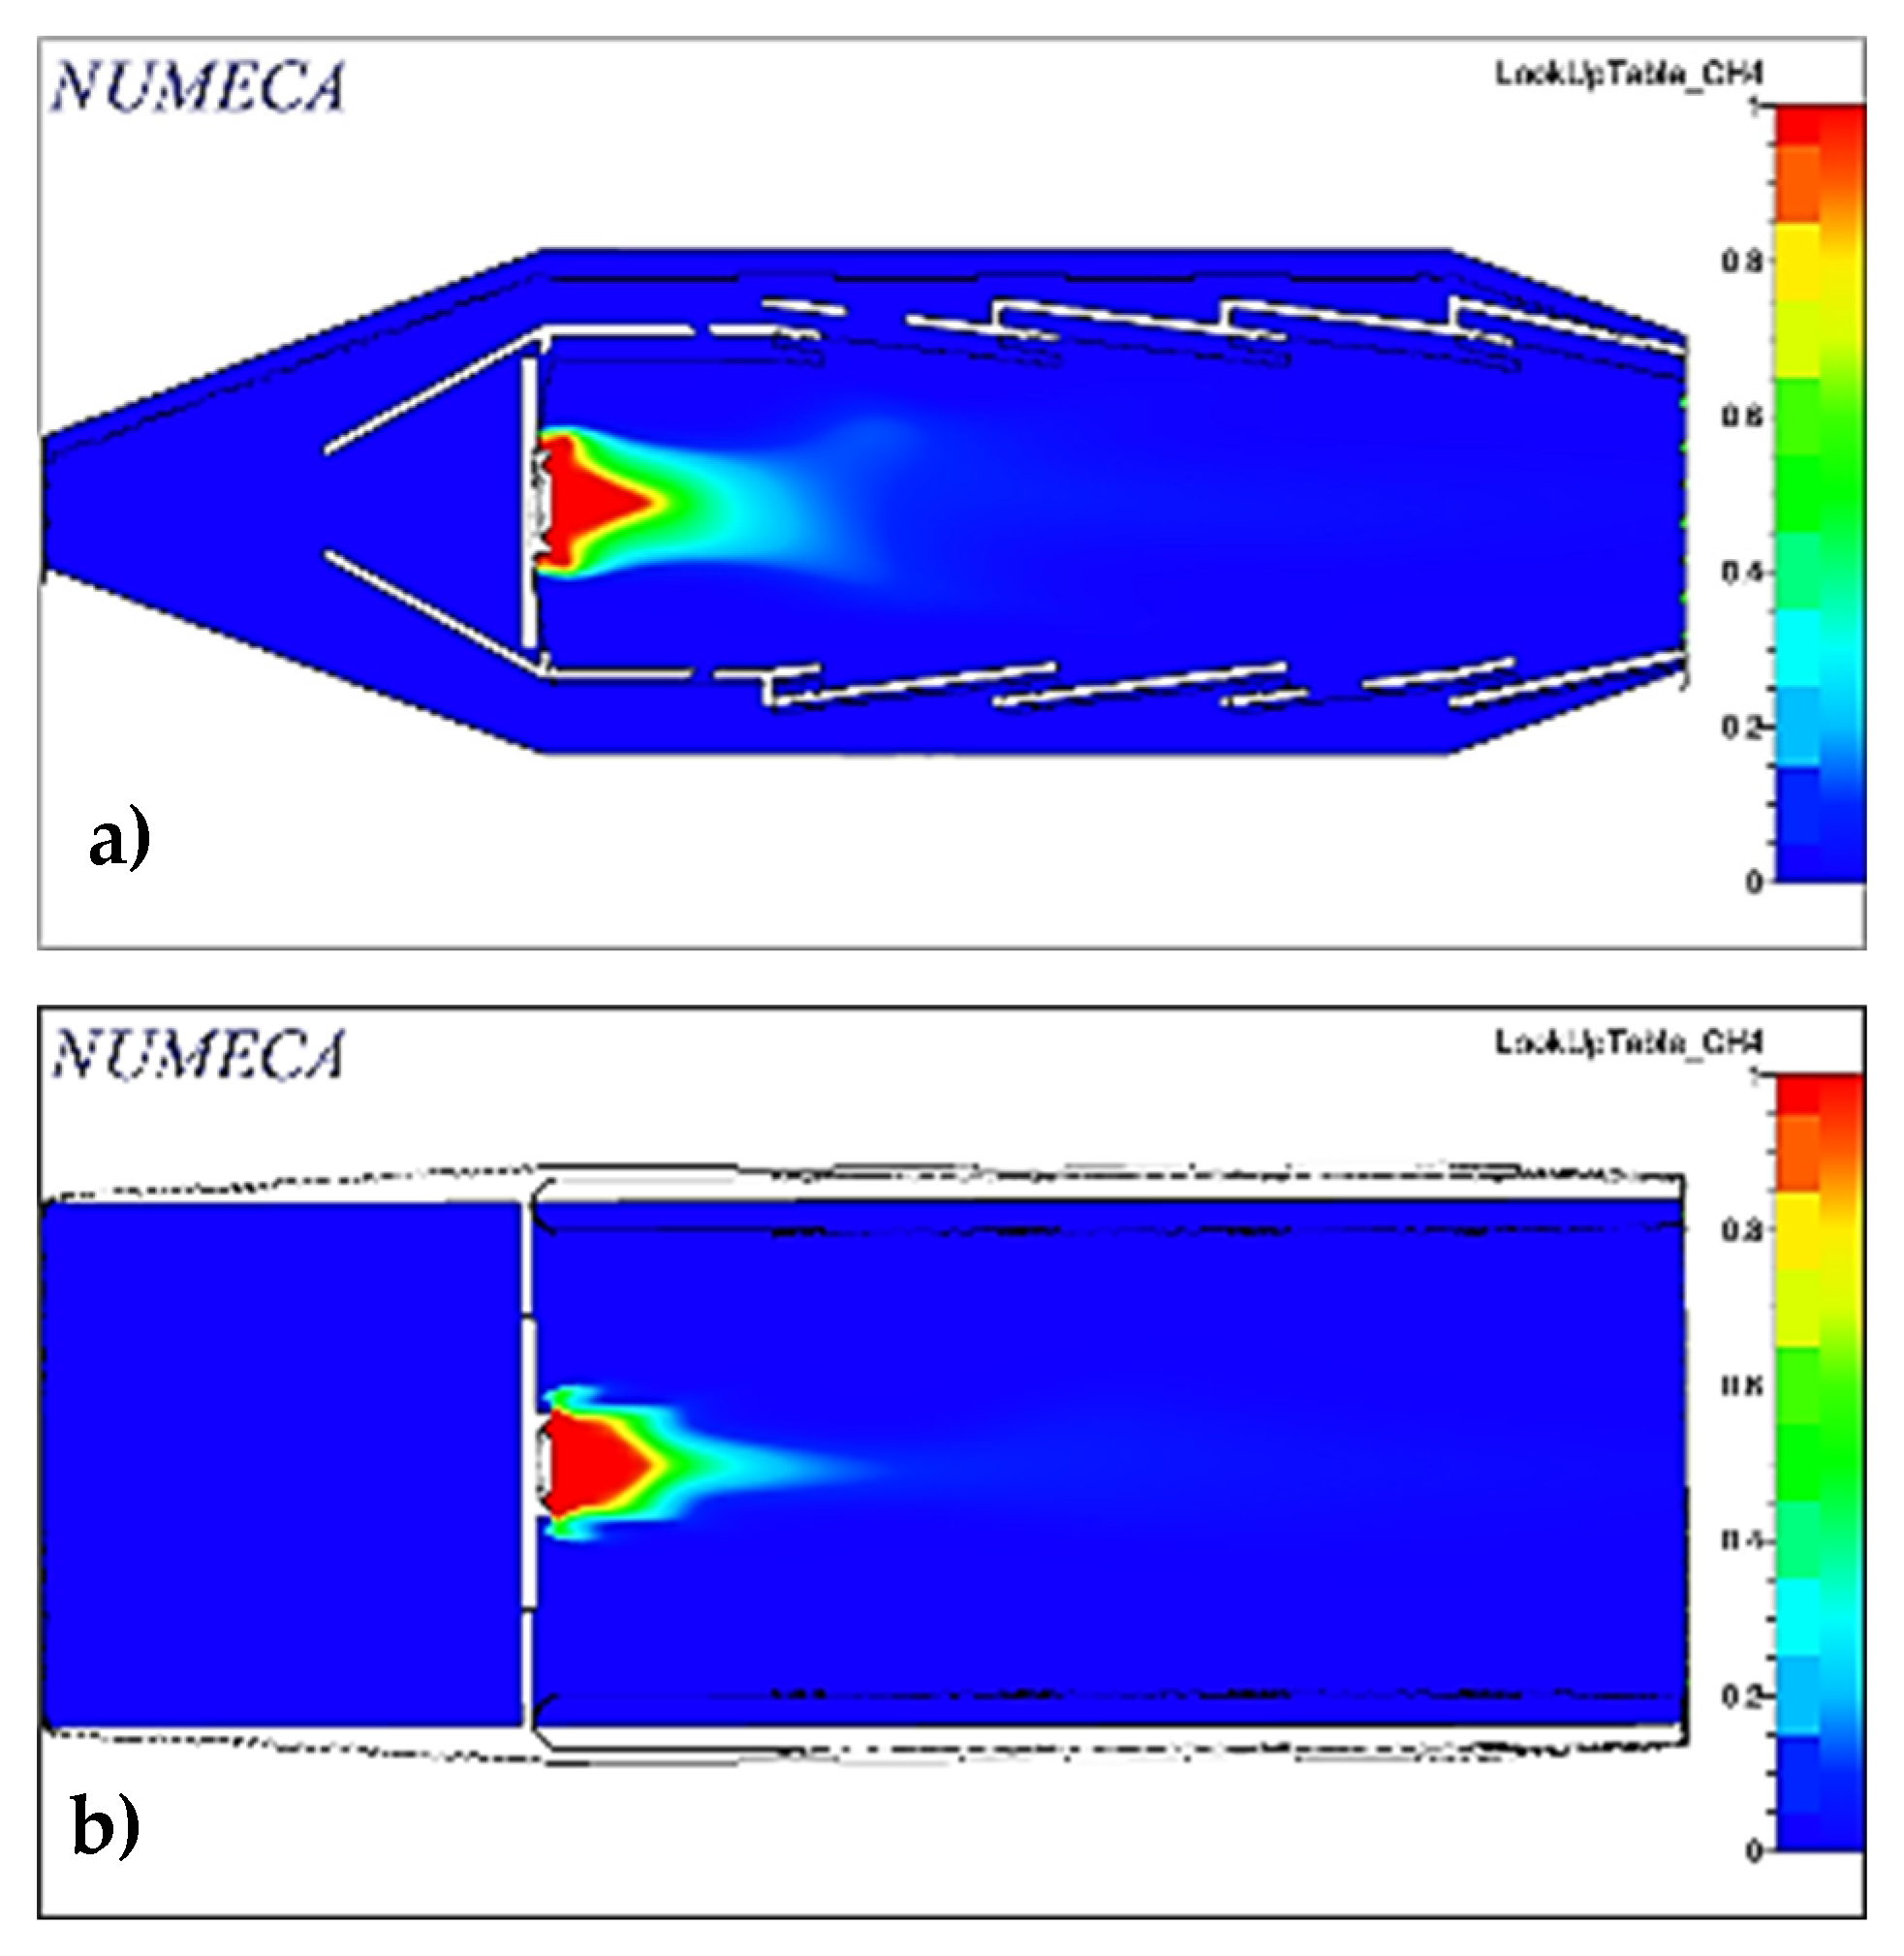
Another important factor in the combustion process is the fuel–air mixture for which the fraction of CH4 in the domain is analyzed, as shown in Figure 8 in which it can be observed that the dilution of the fuel is not symmetrical, and the mixing distance is relatively large.
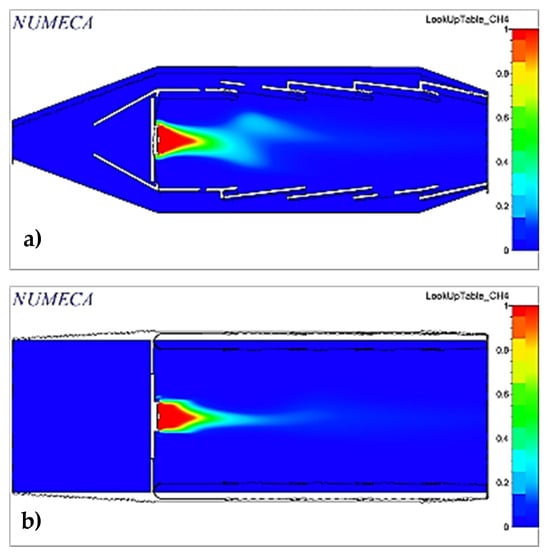
Figure 8.
Fuel mass fraction through the domain: (a) midplane in y-direction; (b) midplane in x-direction.
The fuel is completely mixed, meaning that complete combustion occurs and occurs completely inside the chamber. Complete combustion indicates that the number of hydrocarbons at the combustor outlet is zero, fulfilling the requirement of no unburned hydrocarbons at the turbine inlet.
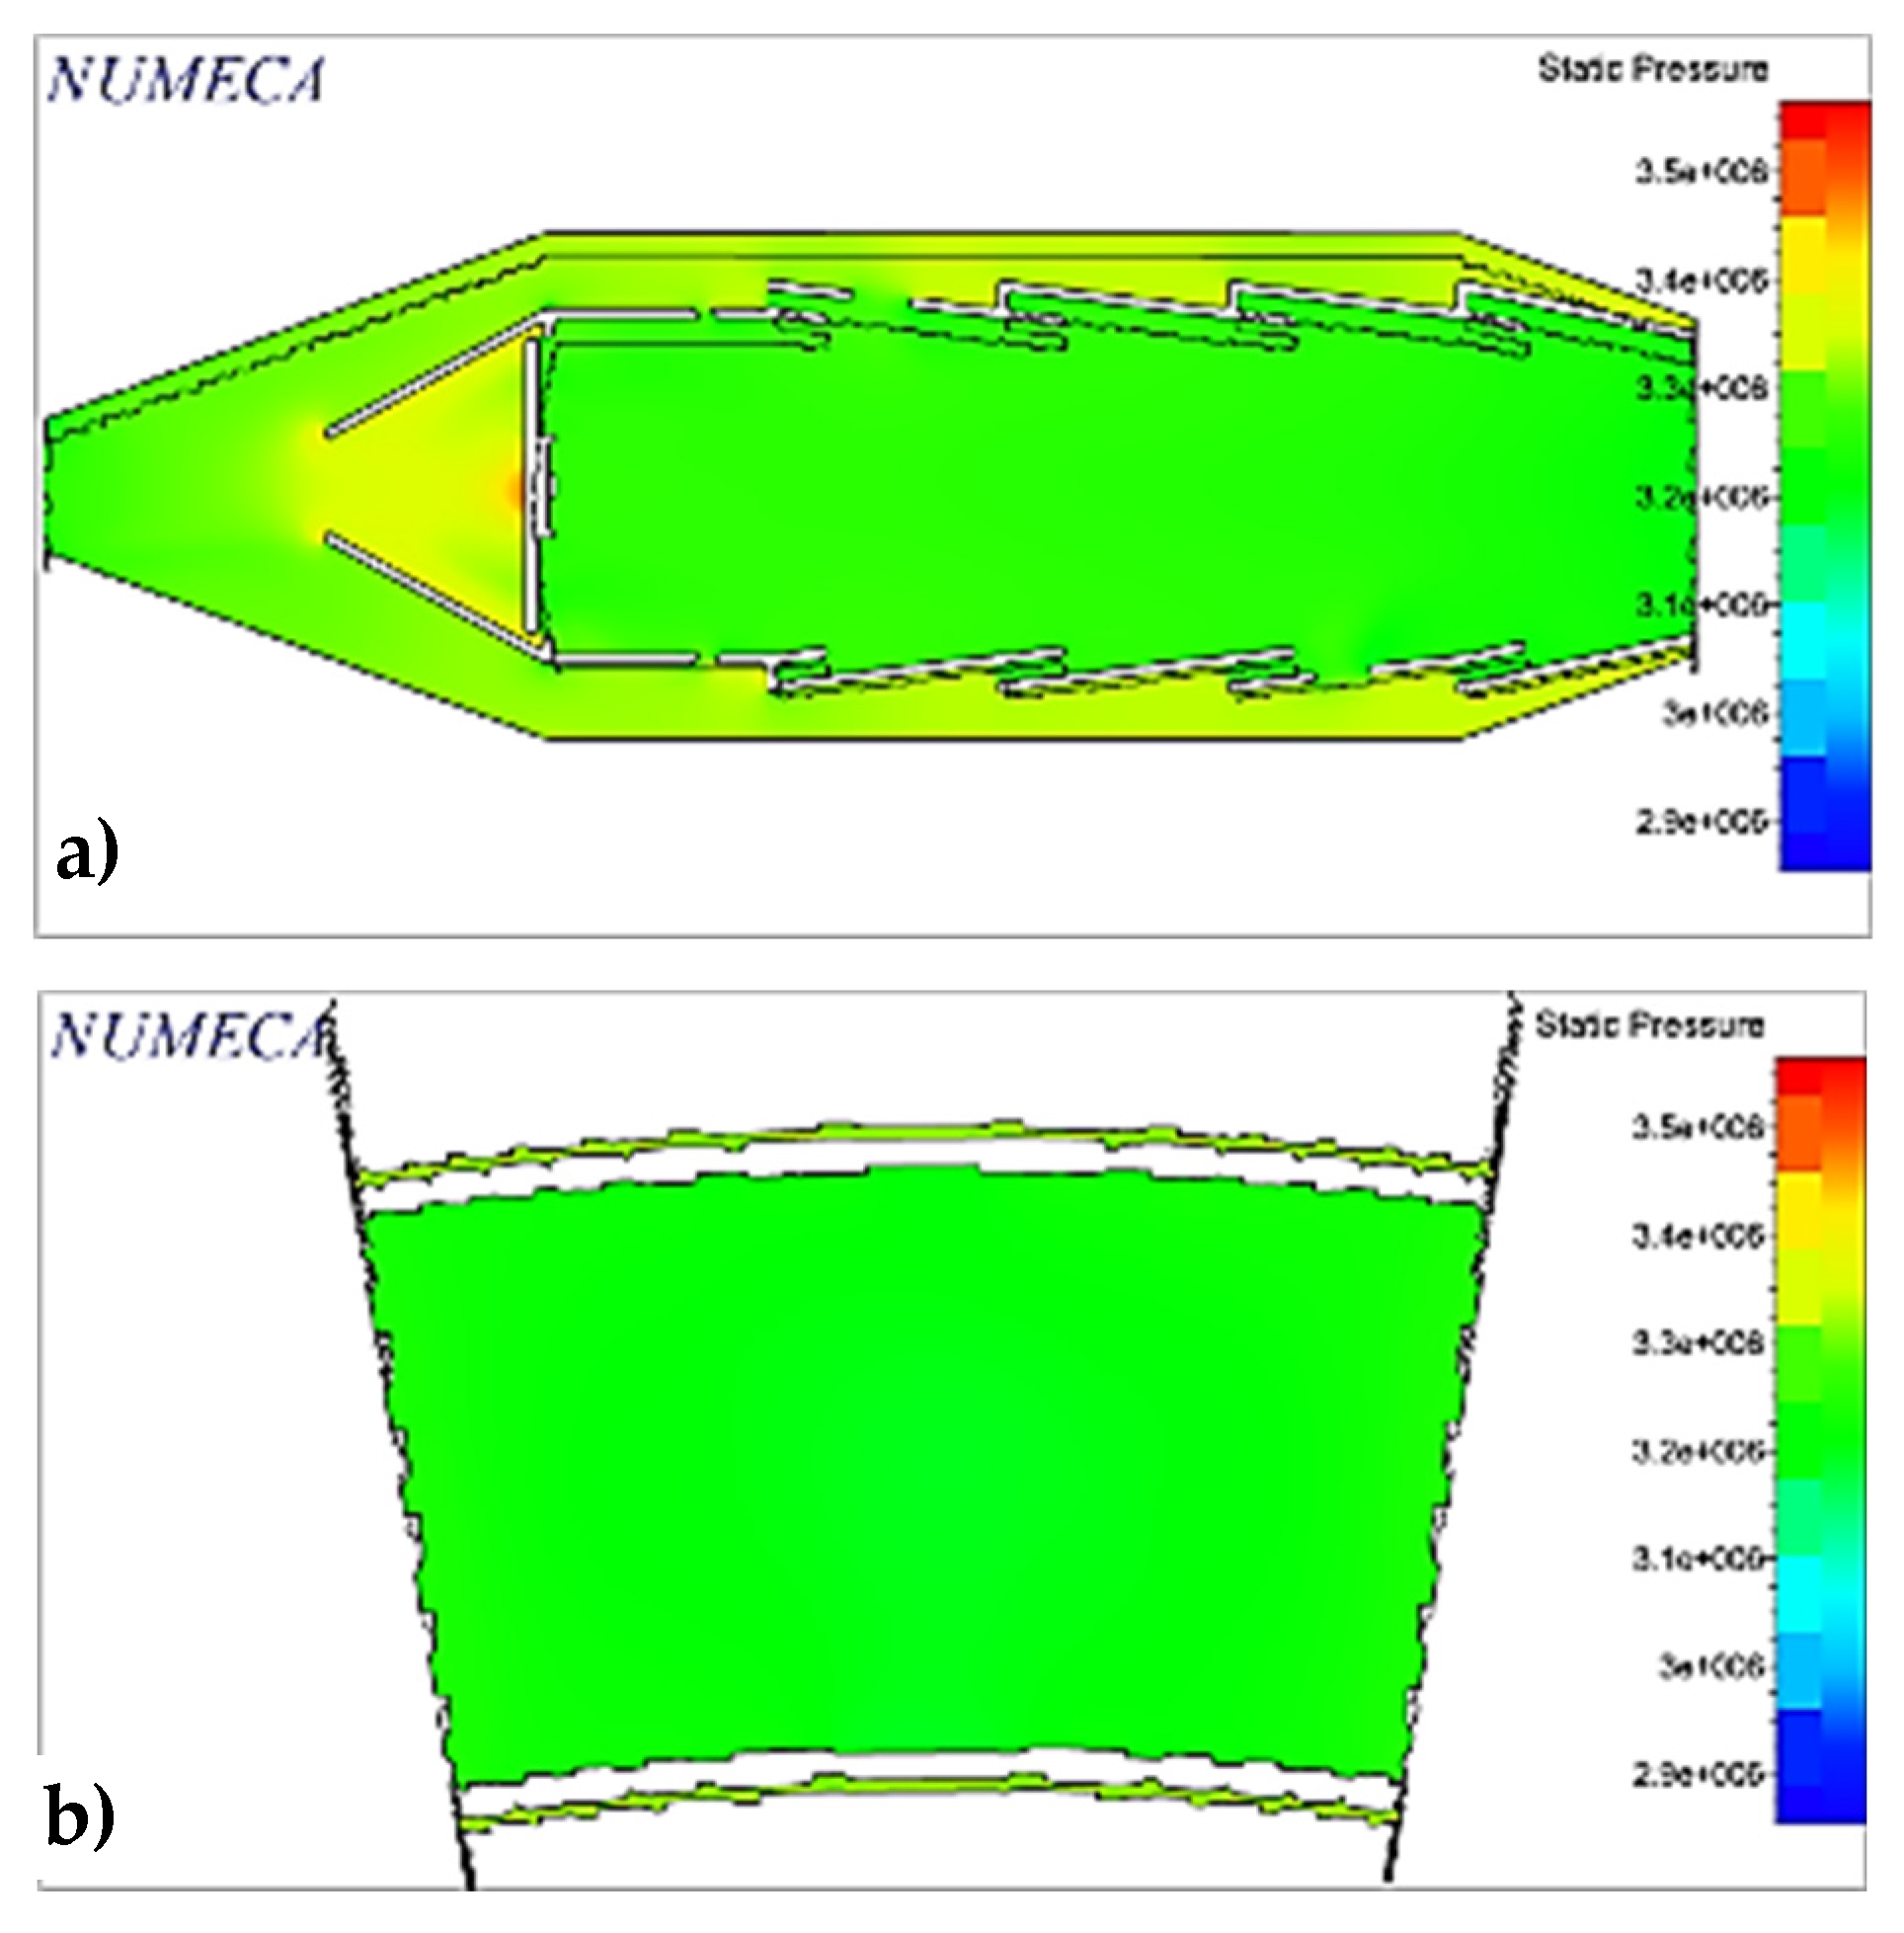
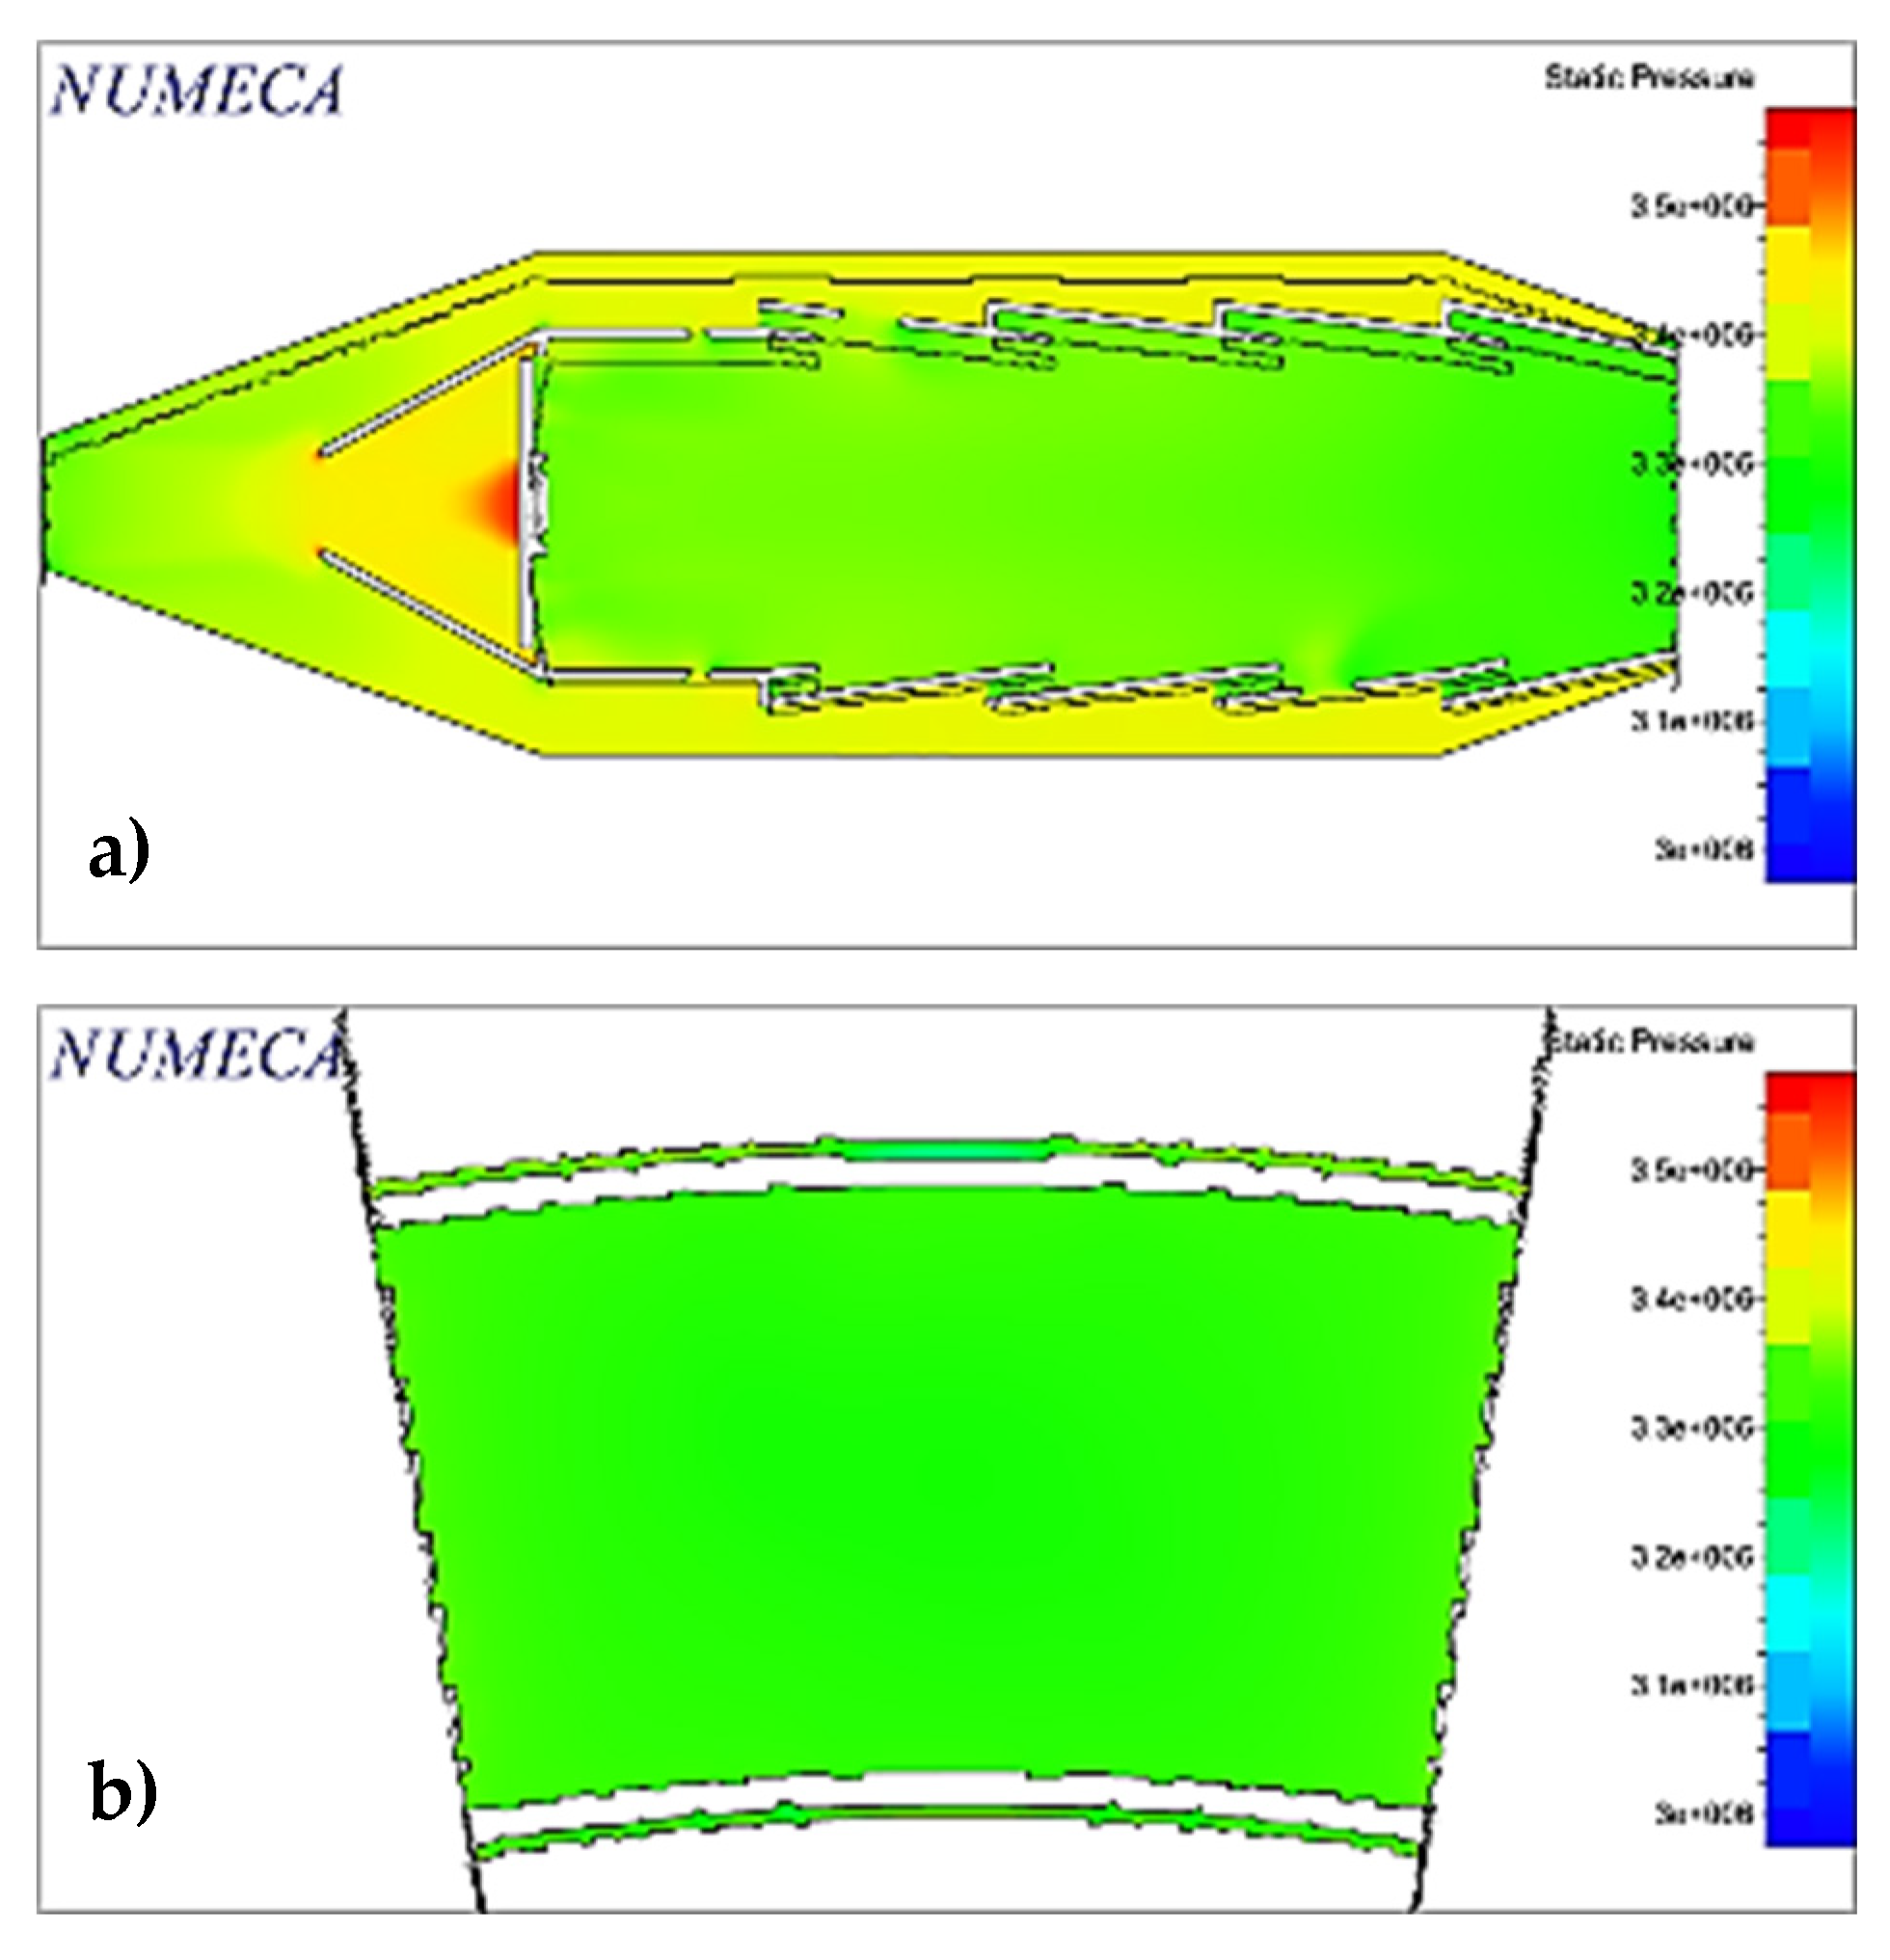
Ideally, the combustion process occurs at constant pressure. However, in the actual process, there may be some pressure losses due to the combustion process. For this case, these losses resulted in a reported pressure ratio of 0.958, which is entirely in agreement with the theory, which recommends a minimum of 0.94. Figure 9 shows the static pressure contour in the domain, where a uniform distribution can be observed on the outside of the combustion chamber.
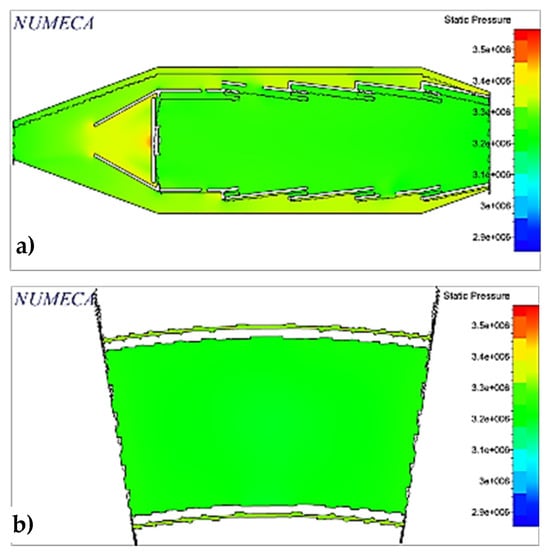
Figure 9.
Static pressure in two planes: (a) midplane in y-direction; (b) combustor outlet.
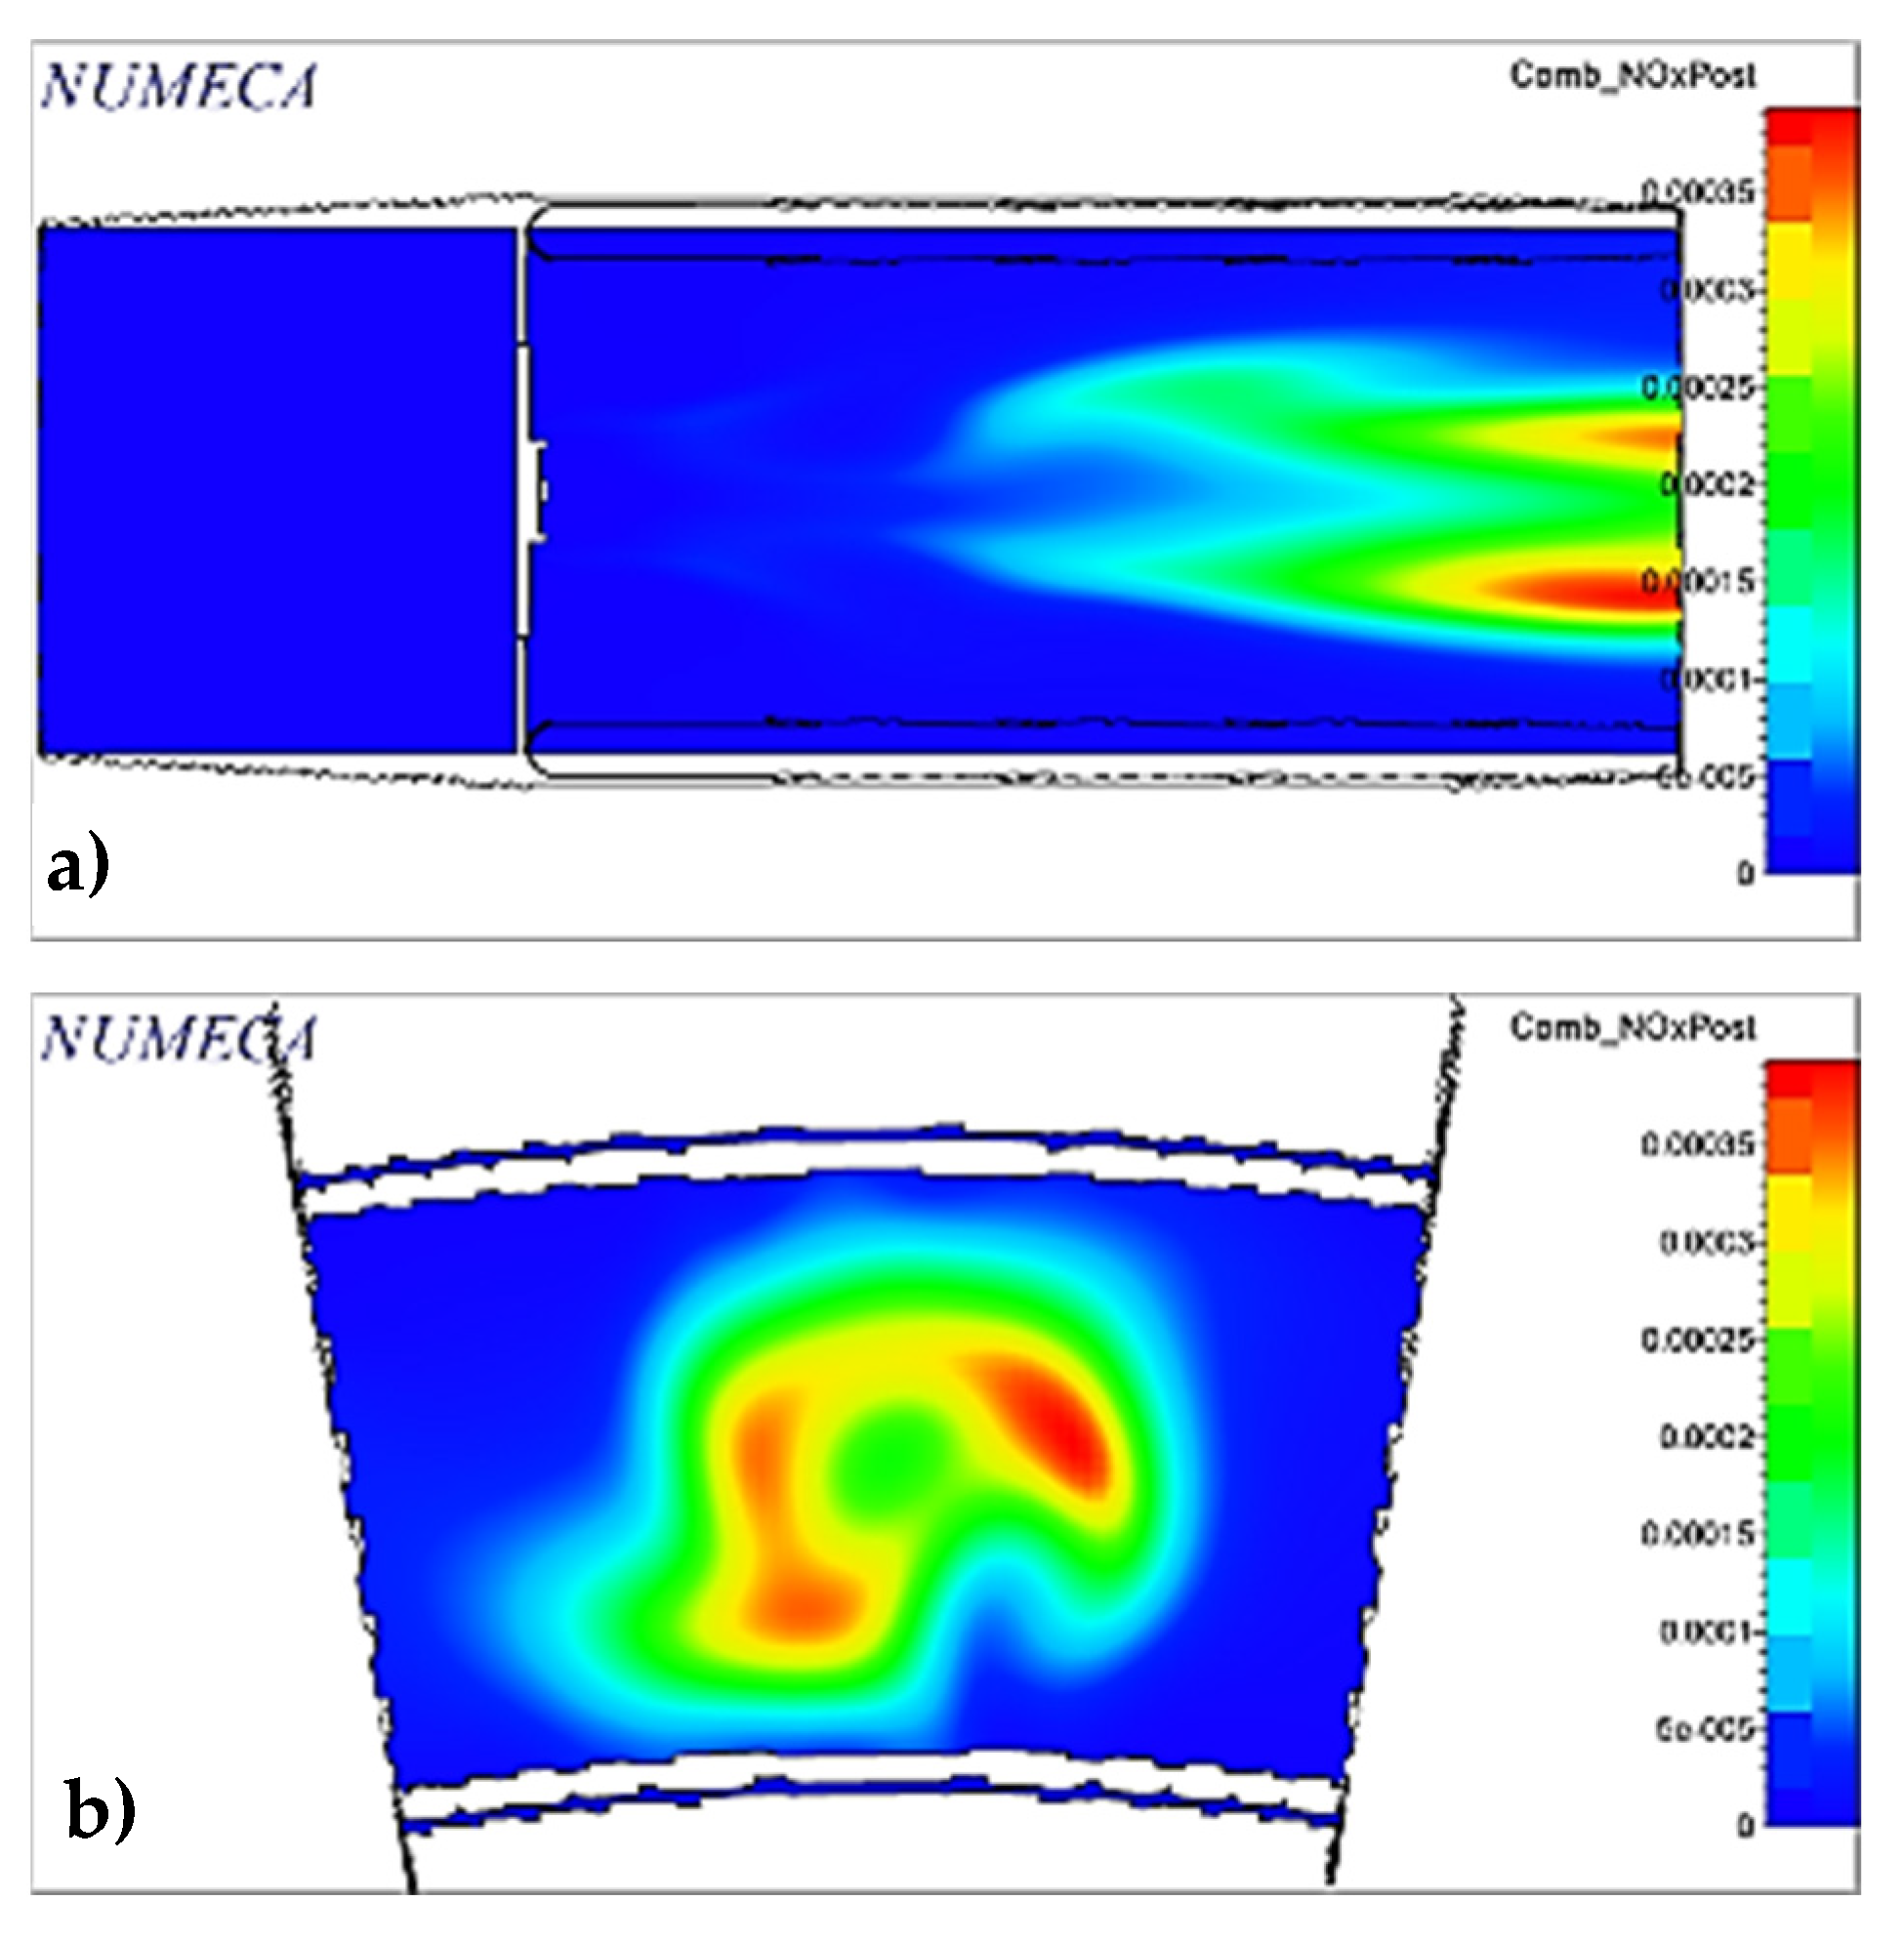
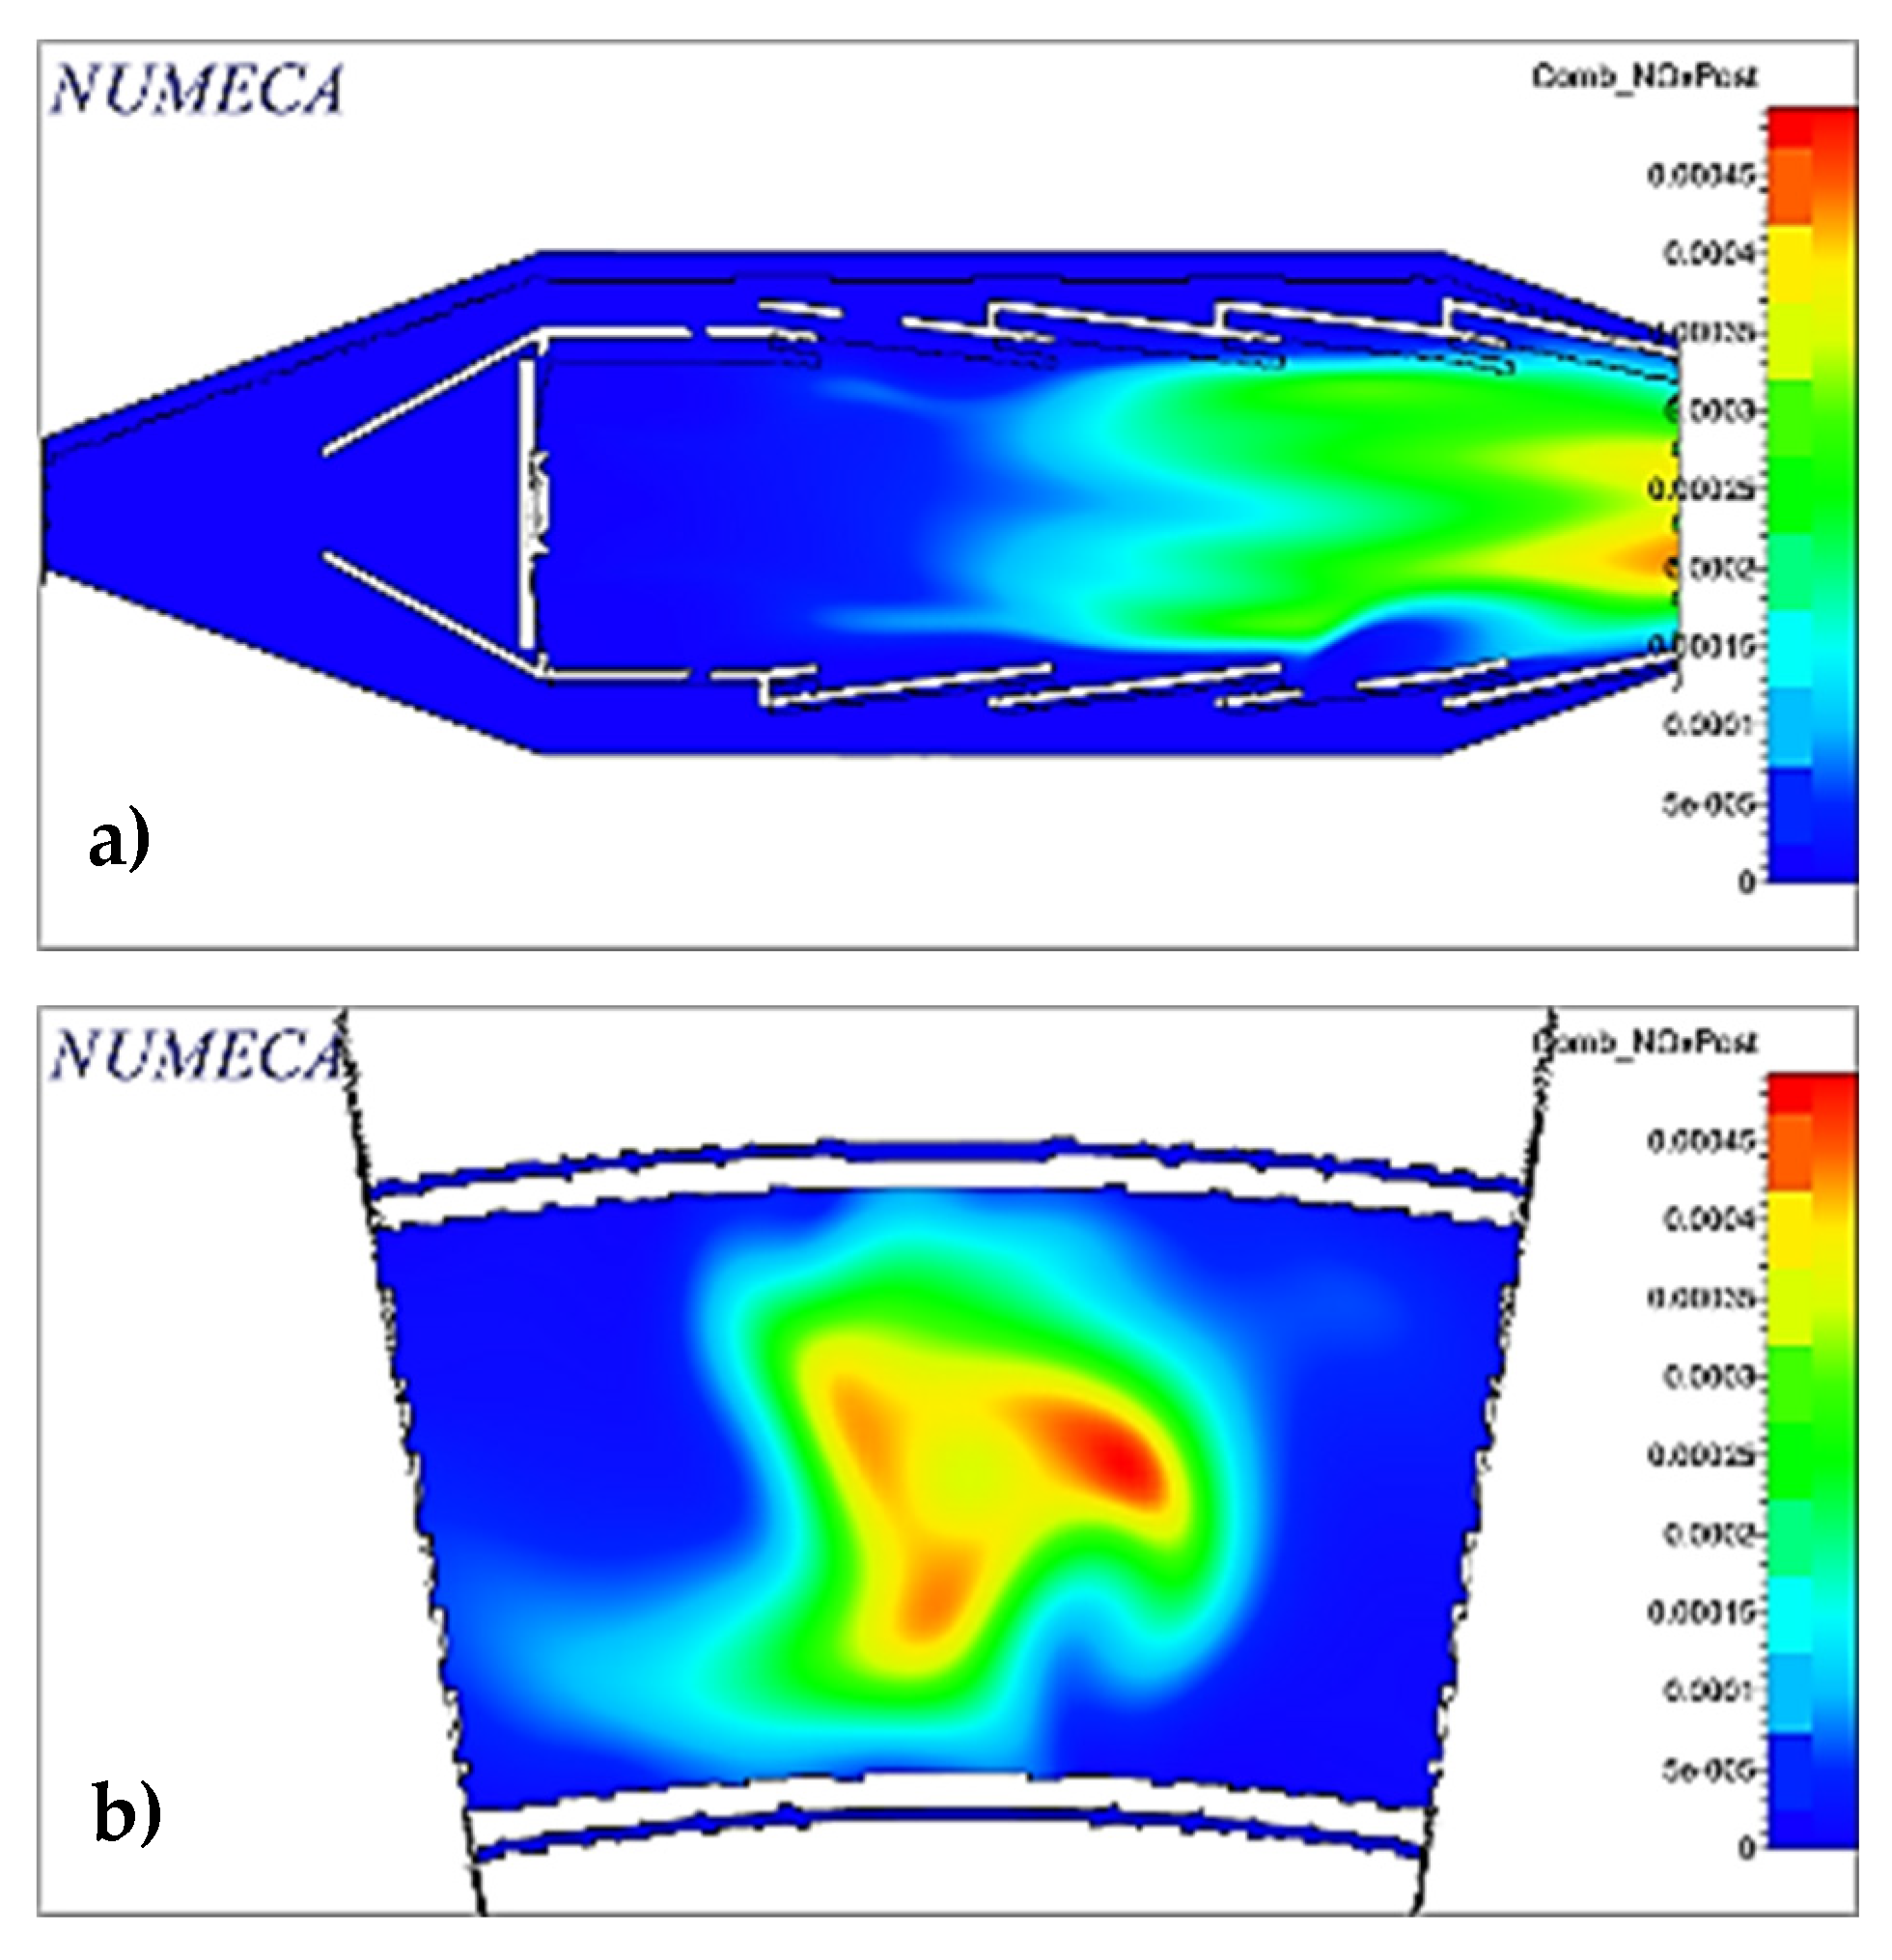
Figure 10 shows the contour of the nitrogen oxides present in the combustion process, whose maximum value does not exceed 0.0004 mass fraction, and the total emission at the outlet is below the values established in Table 1, so the chamber operates in a NOx emission regime allowed by the authority, as mentioned in Bahr [14]. However, it is important to mention that the maximum concentration is found in the regions where the temperature exceeds the maximum temperature allowed, which indicates that a better combustion process could reduce these pollutants.
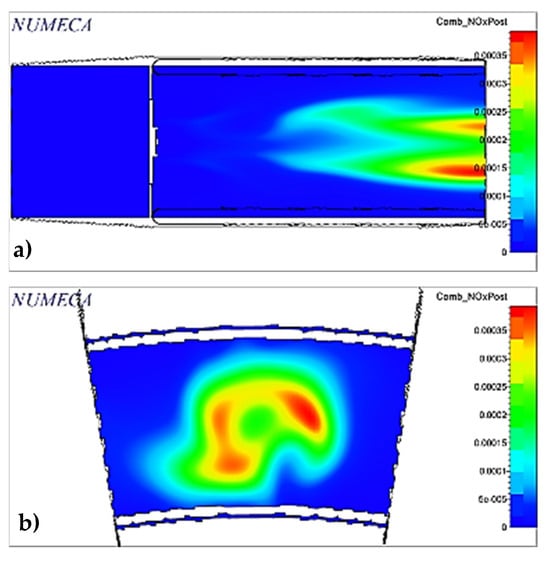
Figure 10.
NOx in two planes: (a) midplane in x-direction; (b) combustor outlet.
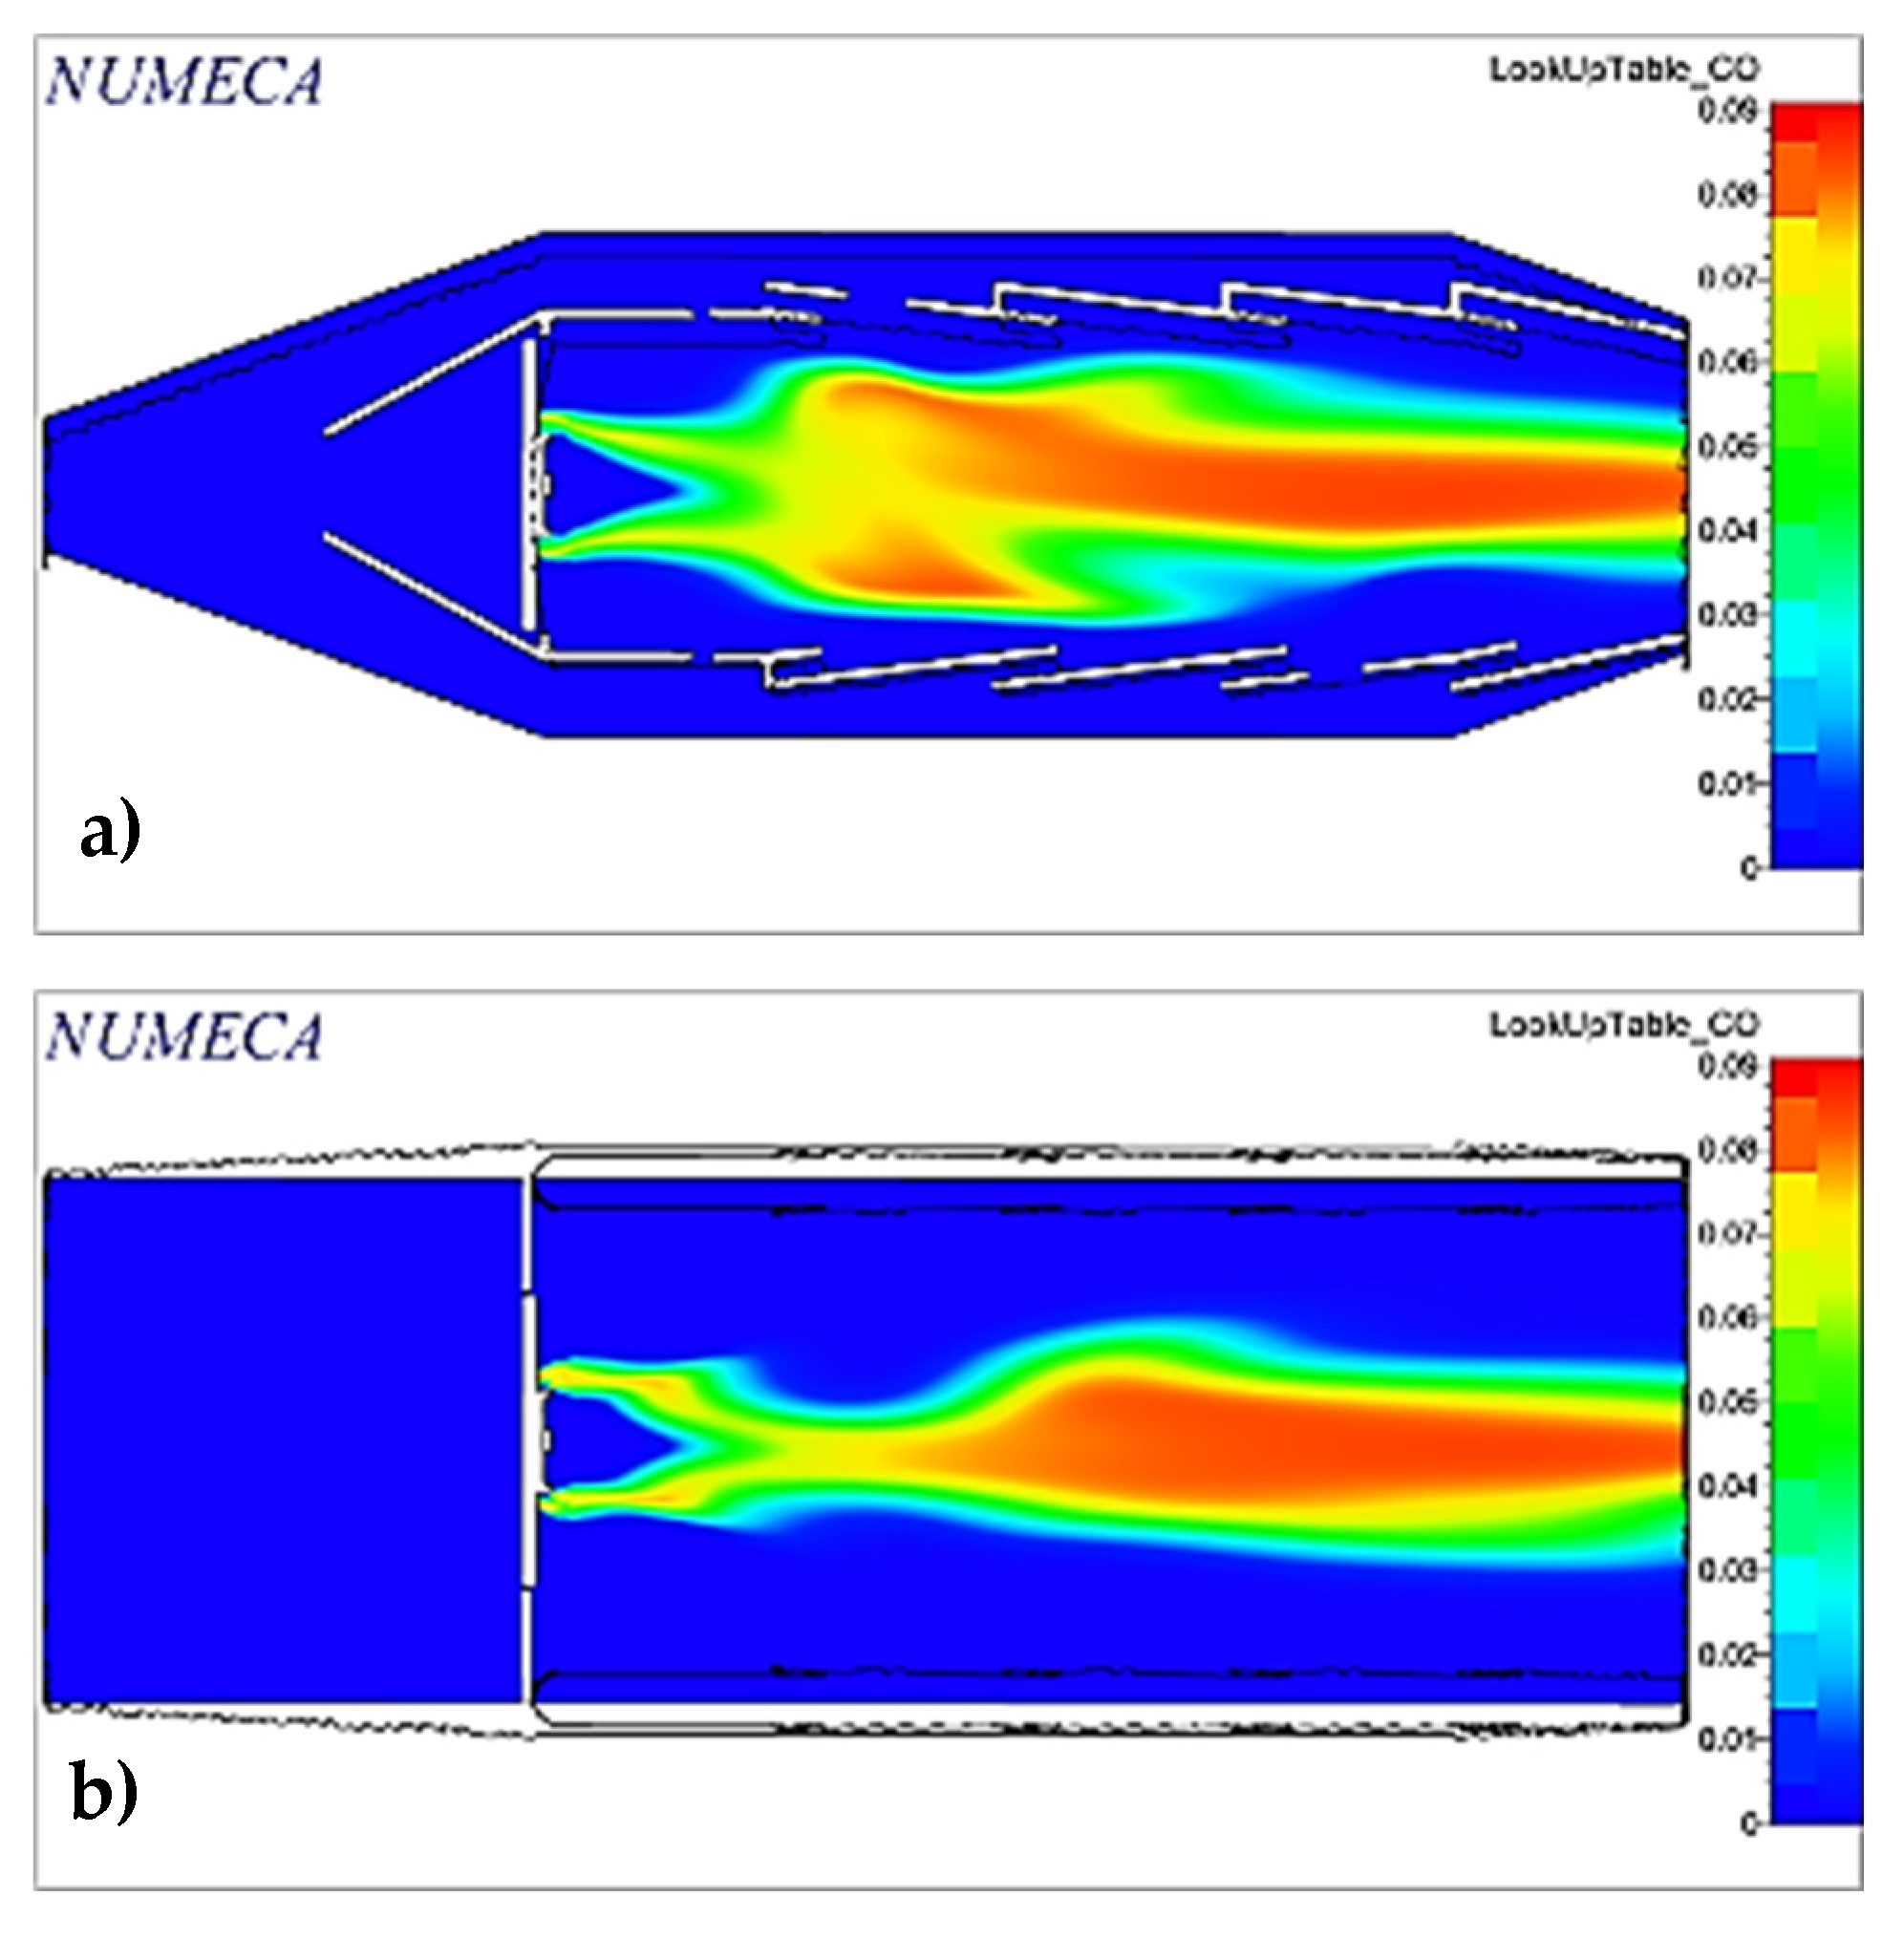
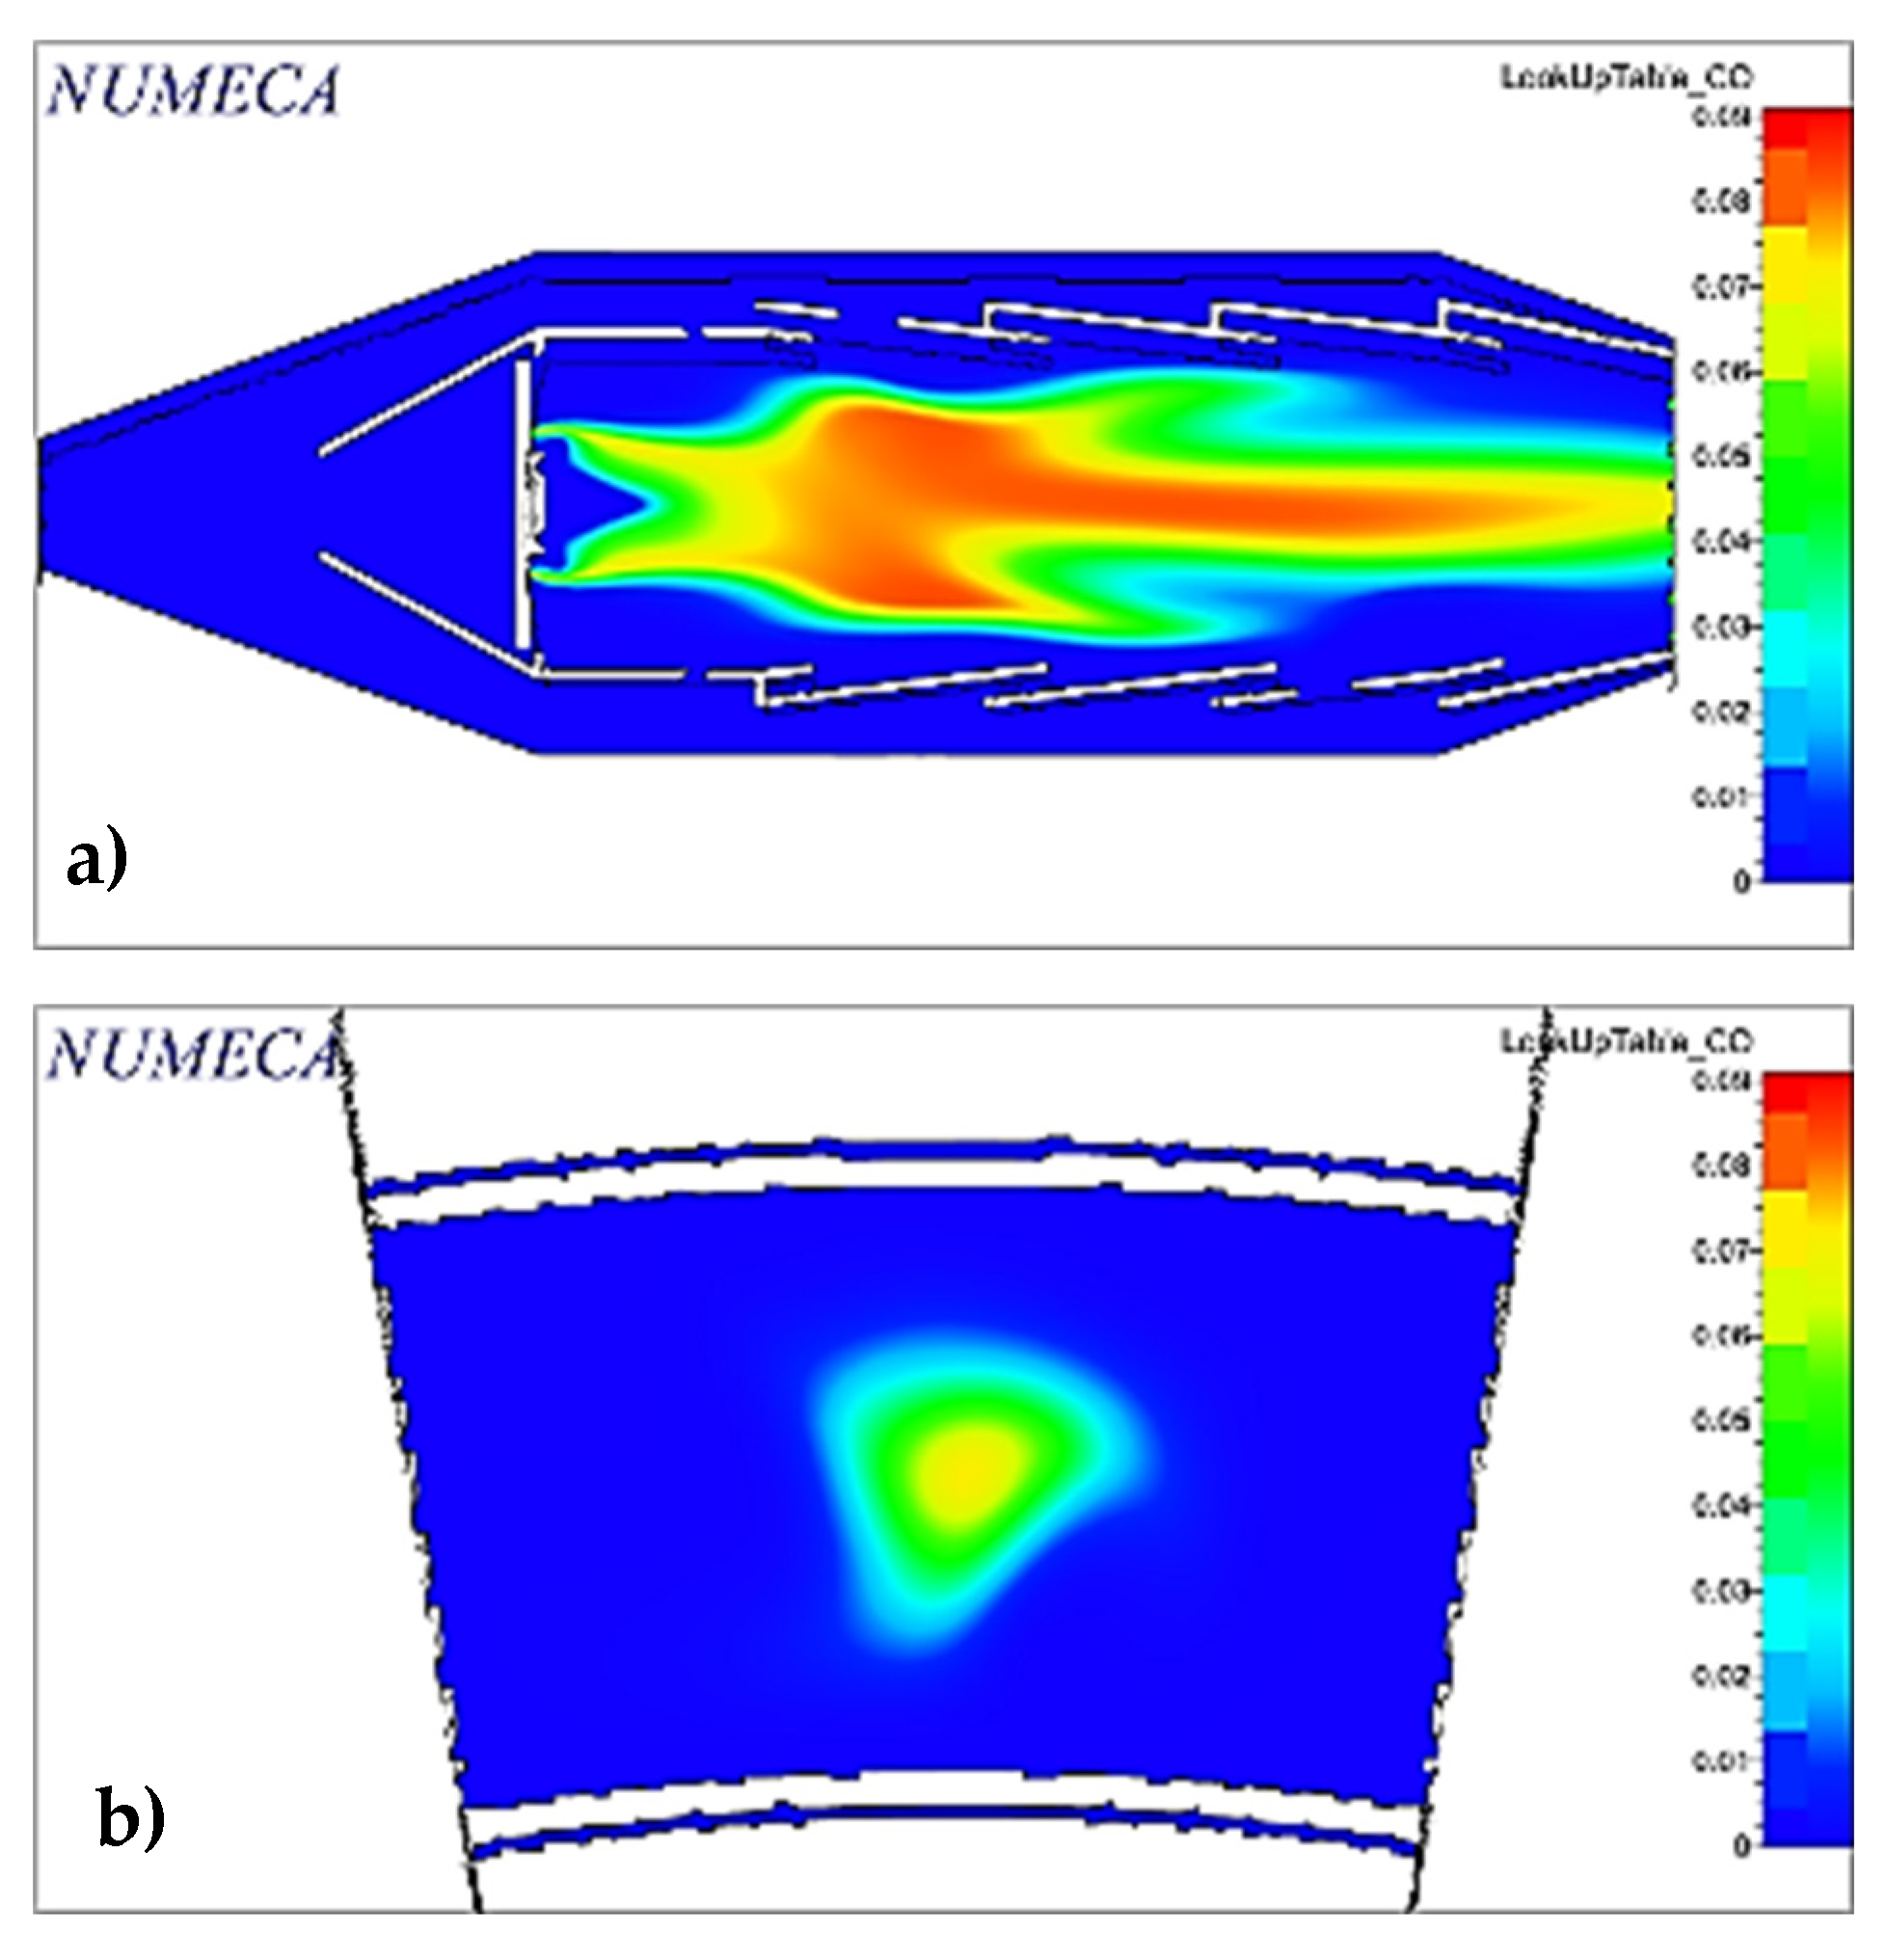
Figure 11 shows the mass fraction contours of CO emissions through the domain, where the total mass fraction at the combustor outlet is lower than indicated in Table 1.
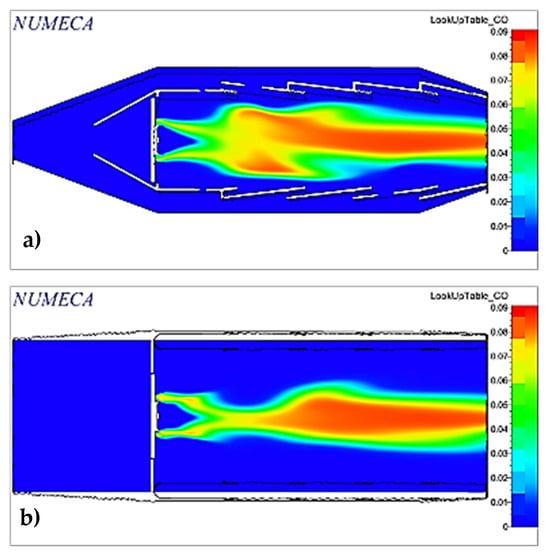
Figure 11.
CO in two planes: (a) midplane in y-direction; (b) midplane in x-direction.
On the other hand, the formation of CO occurs due to the lack of oxygen for complete combustion, so it can be considered that the cooling fluid fails to reach the center of the combustion chamber.
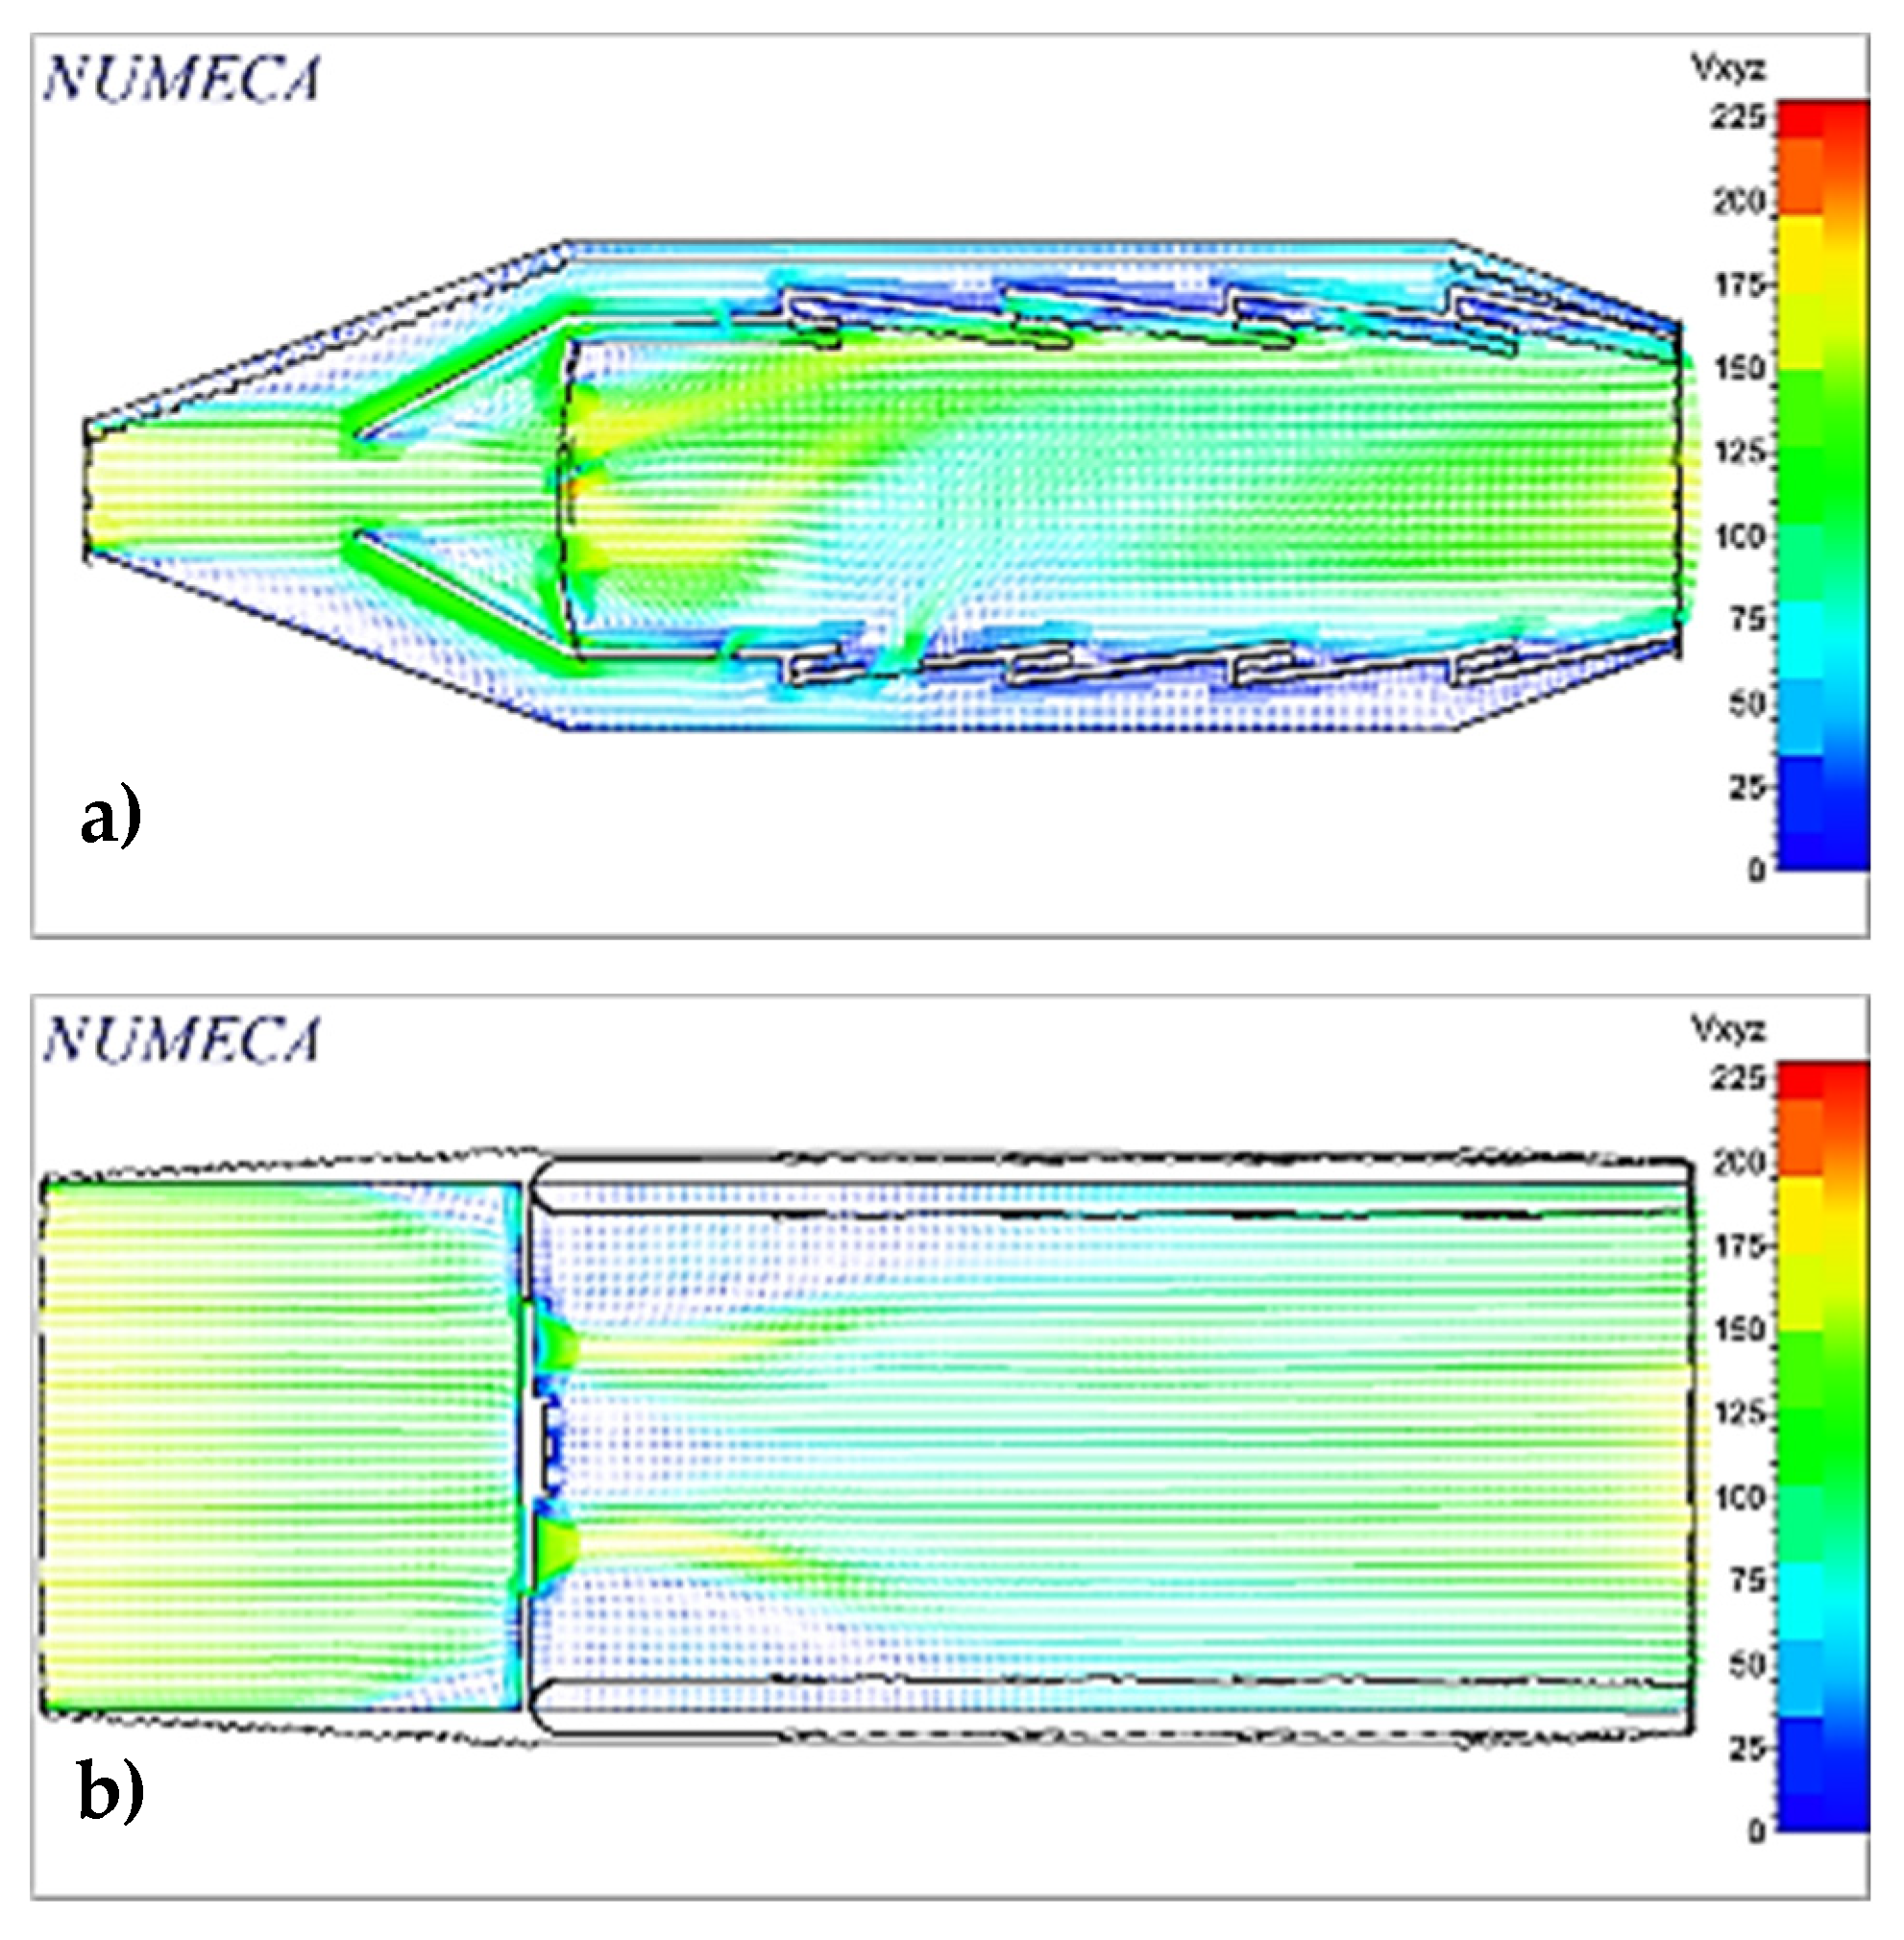
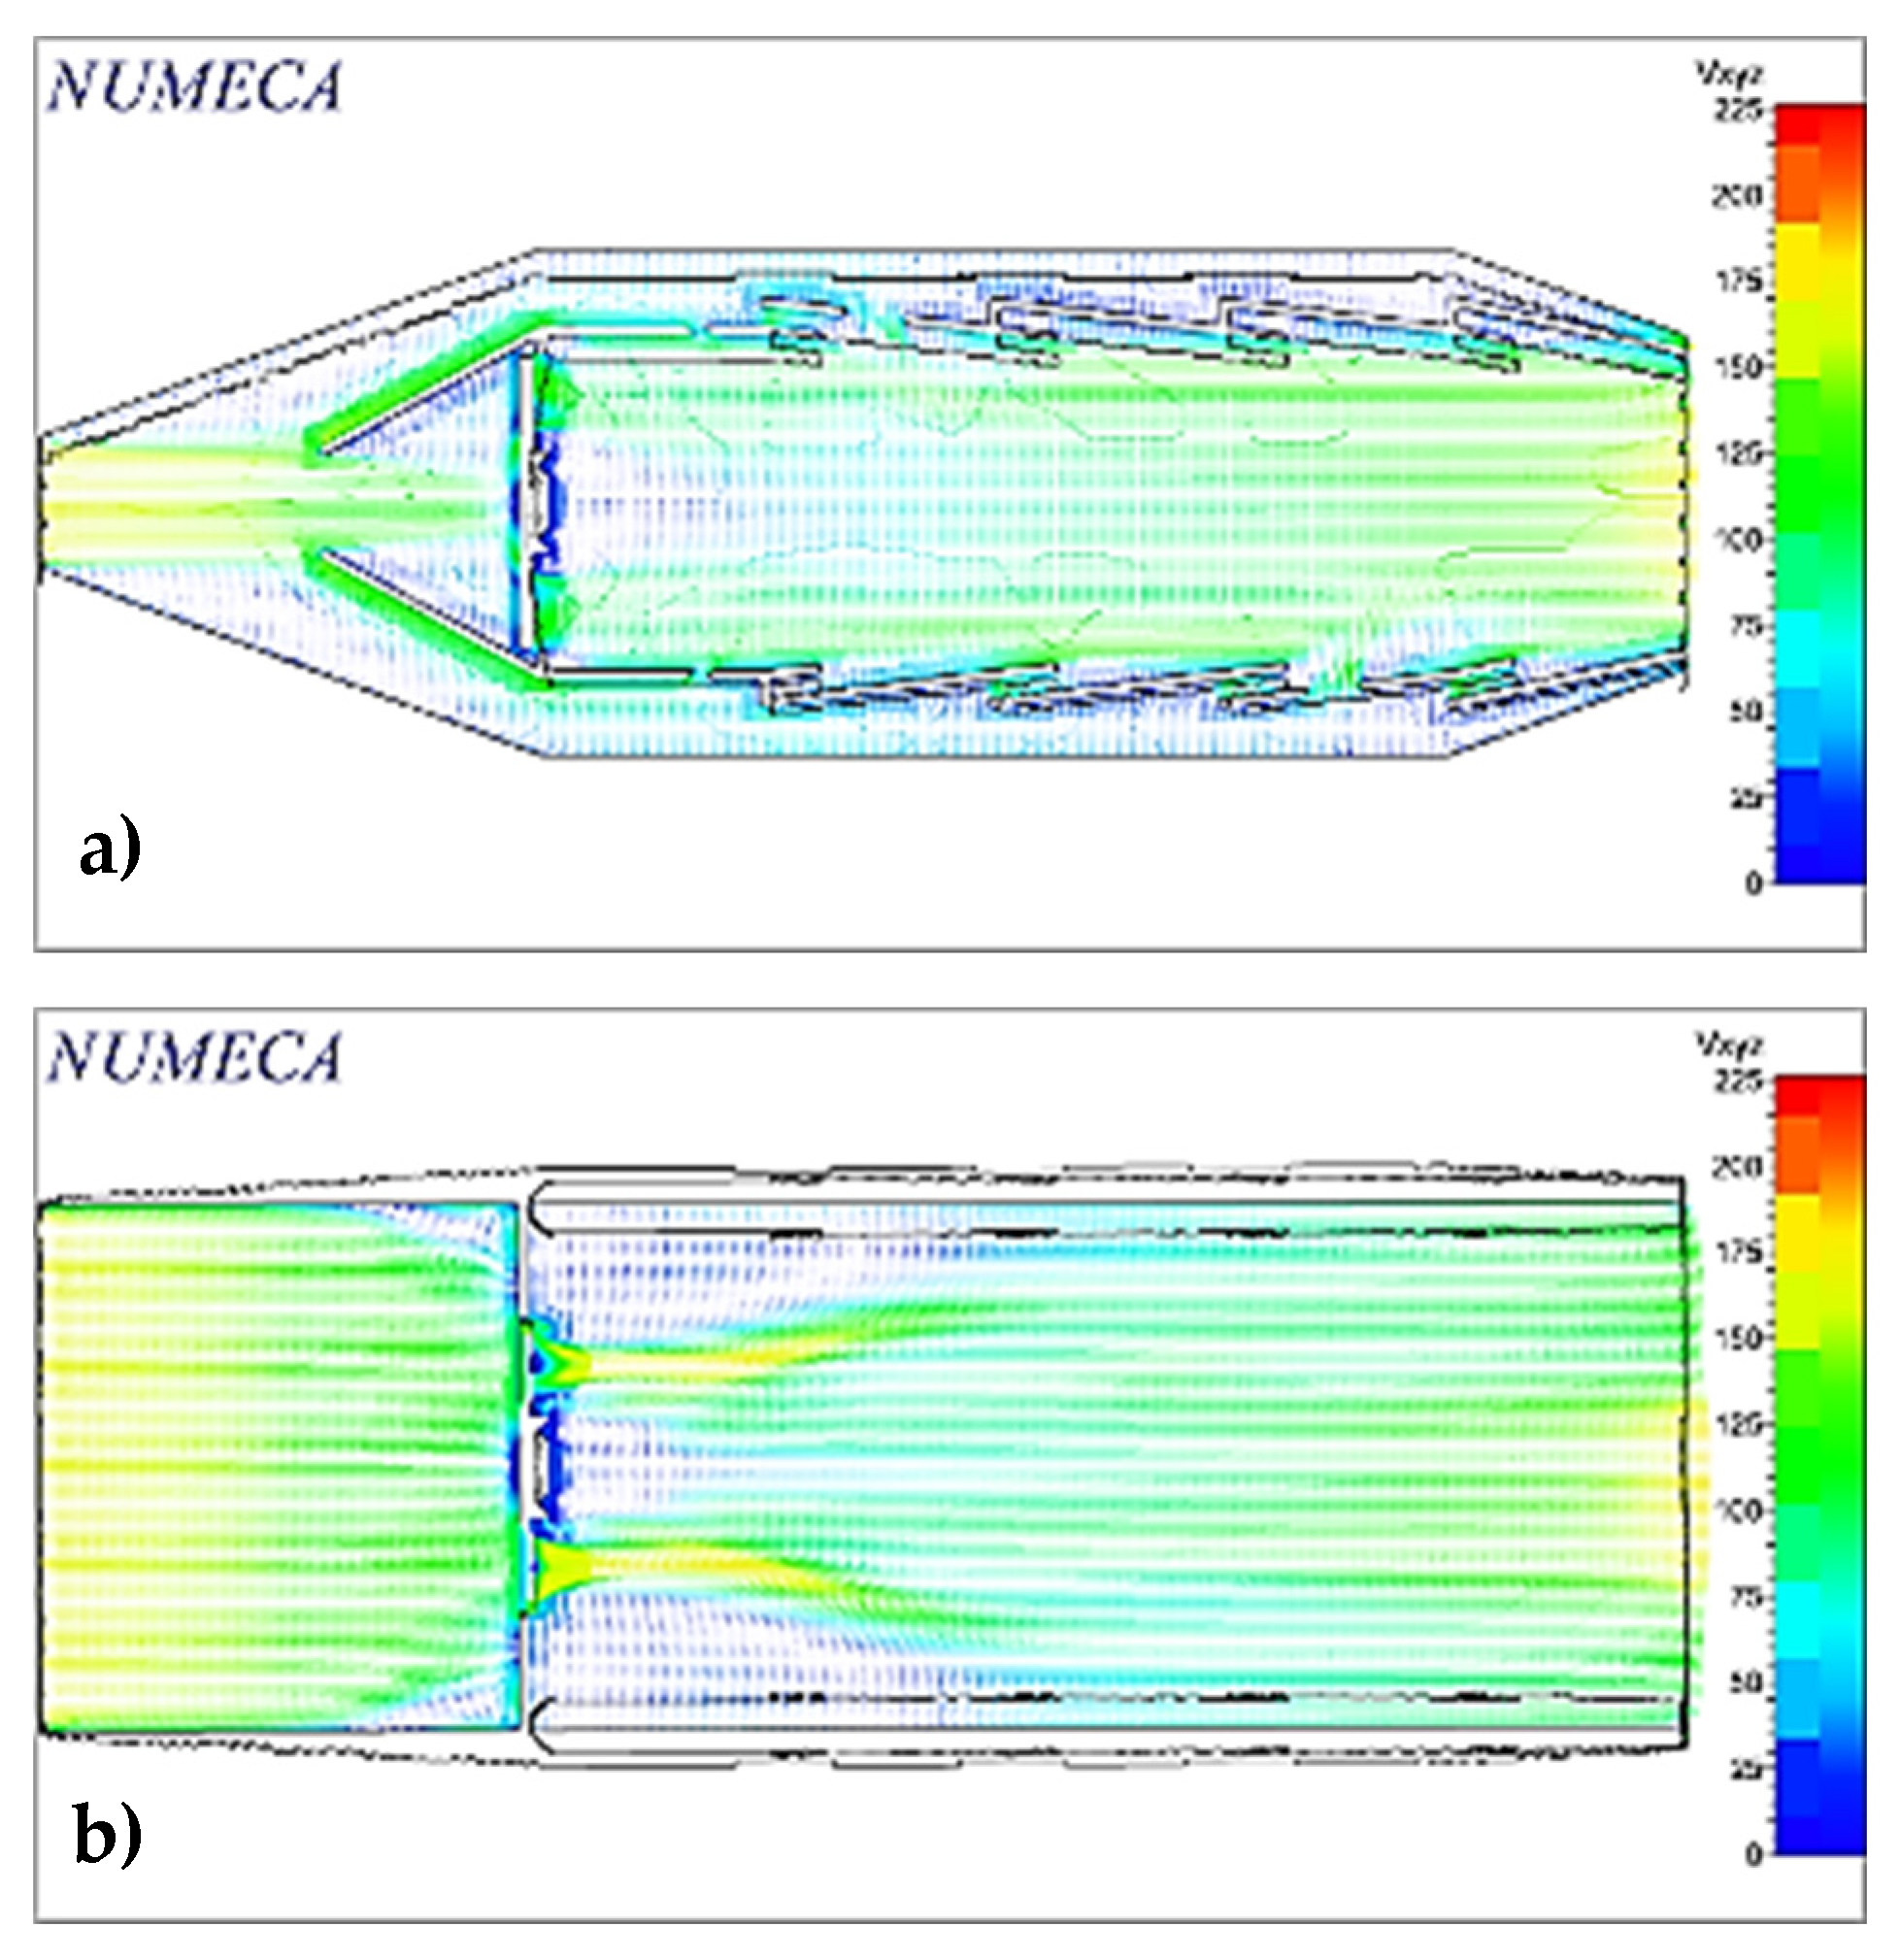
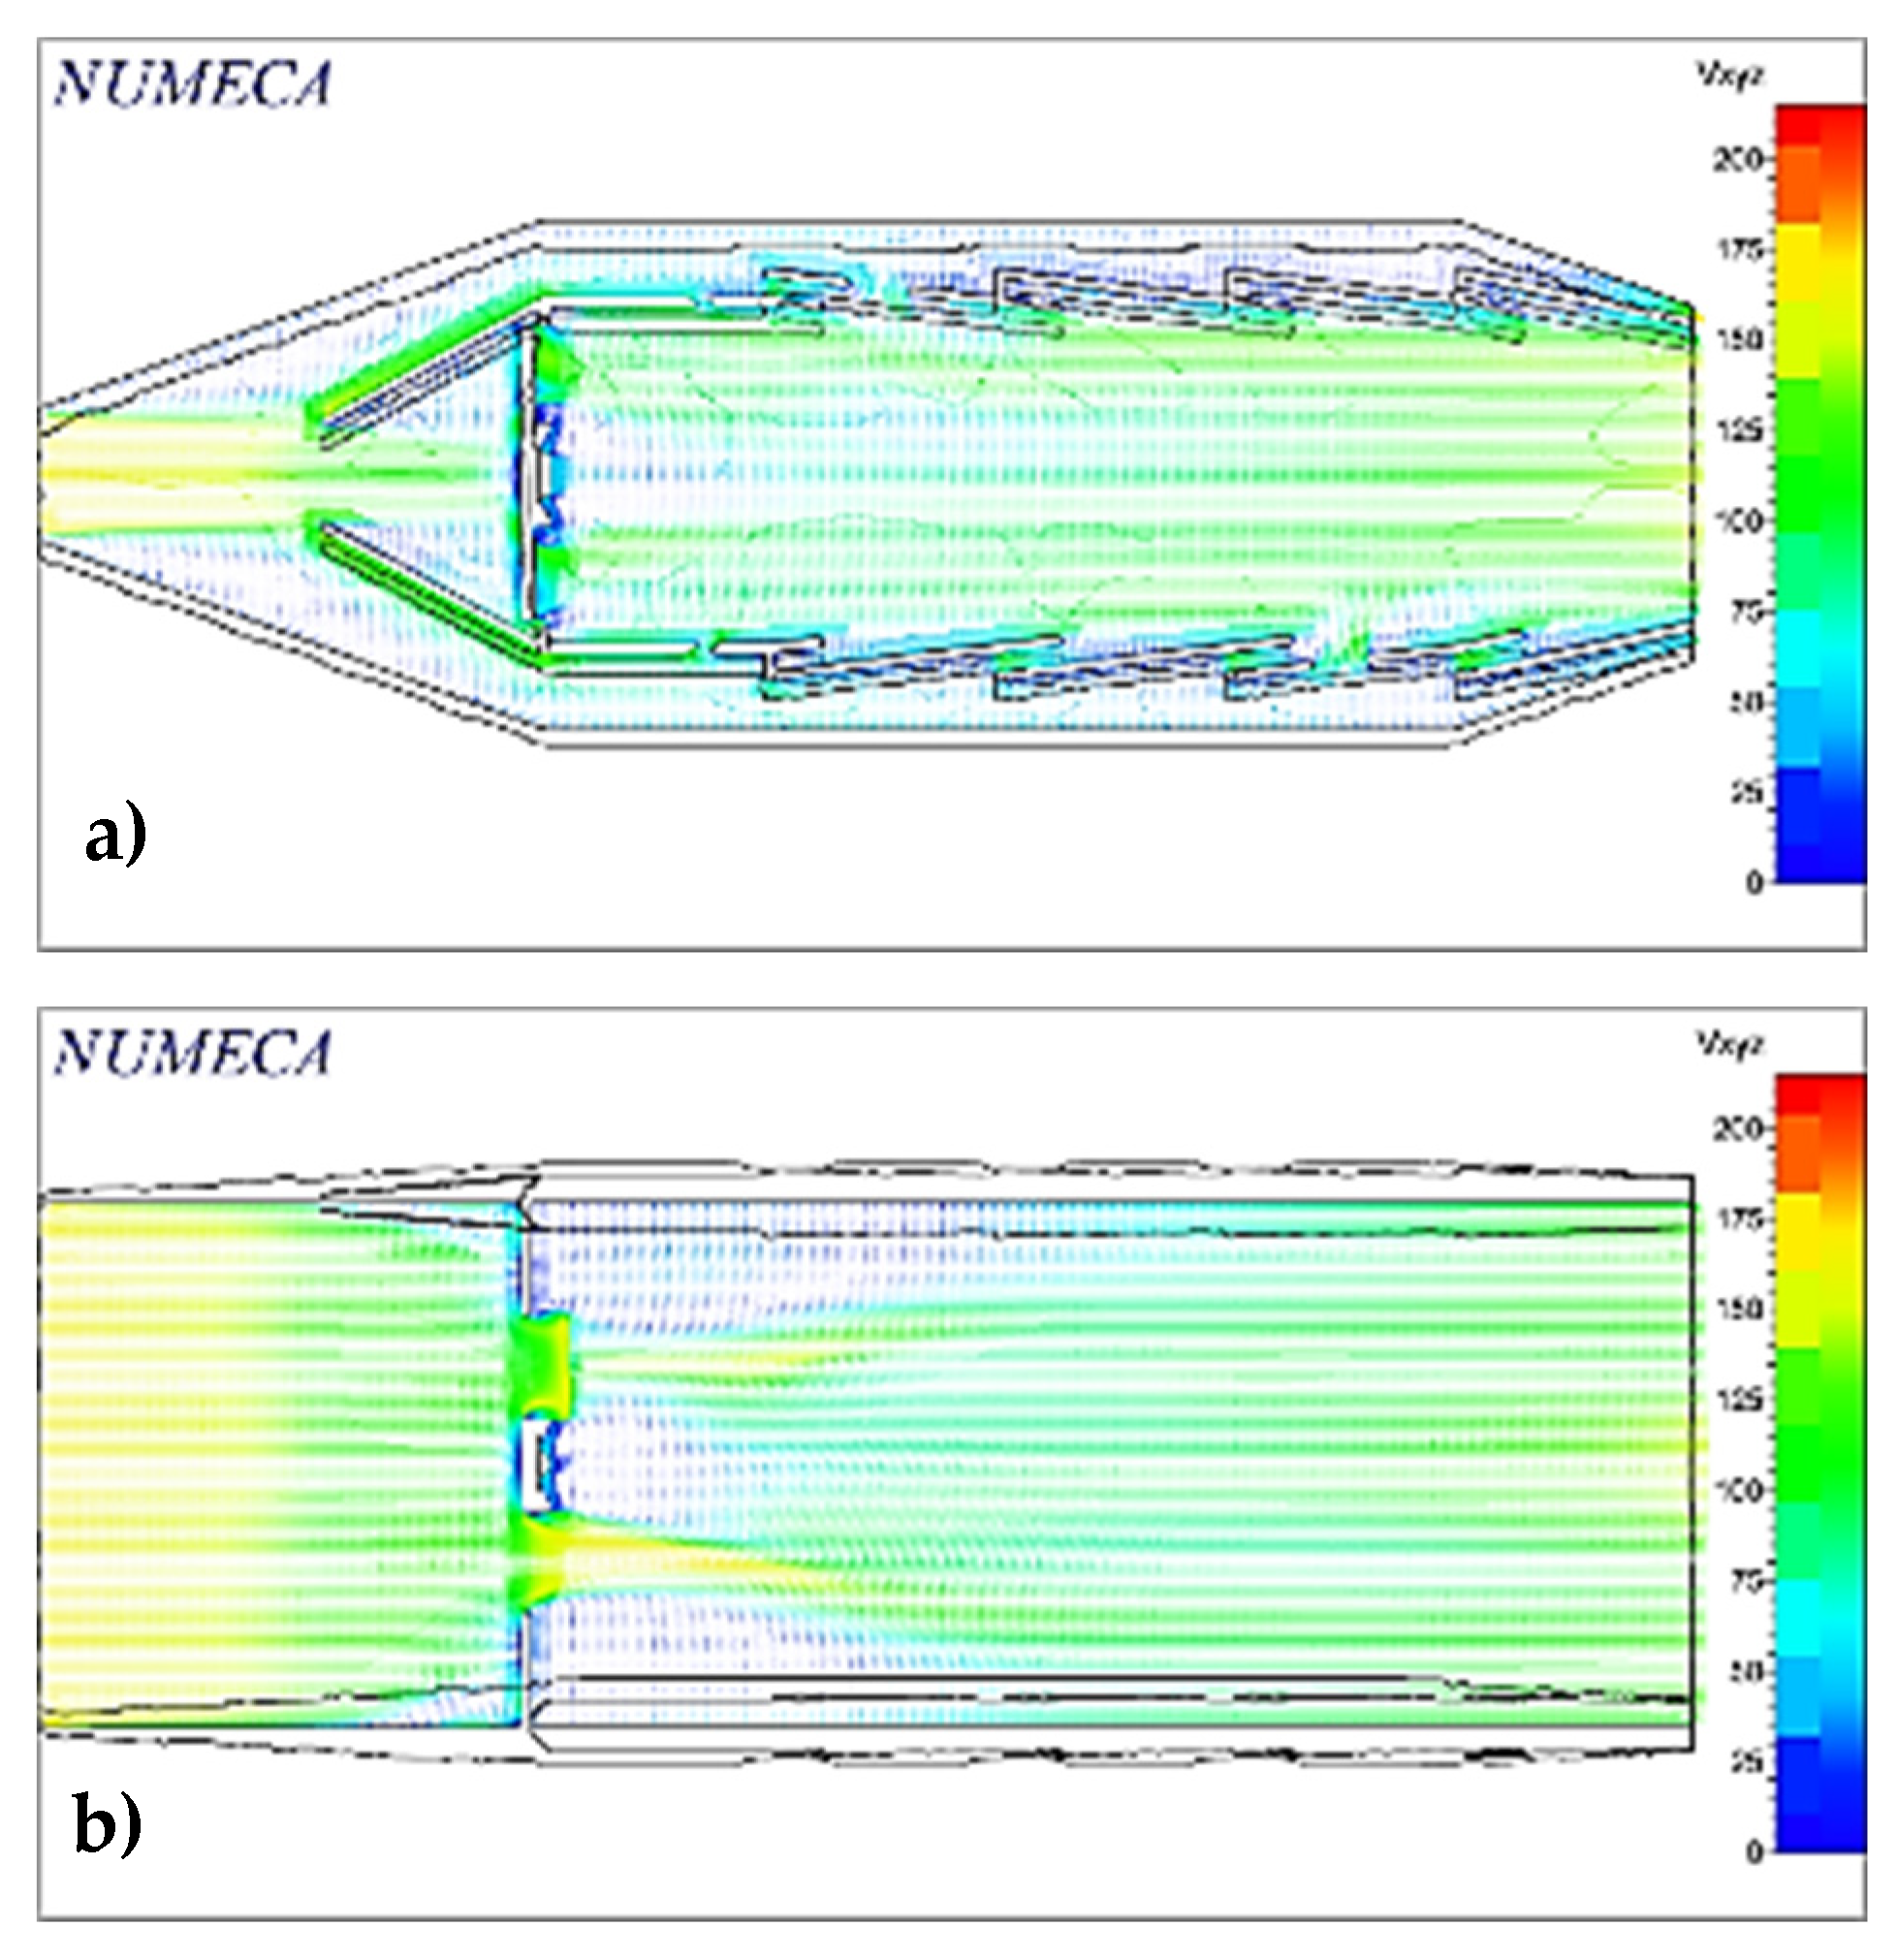
Figure 12 shows the velocity vectors in two planes of the domain. The action of the diffuser, decreasing the velocity at the inlet of the liner, can be seen. The swirler blades’ influence in redirecting the flow axially entering the combustor can also be observed.
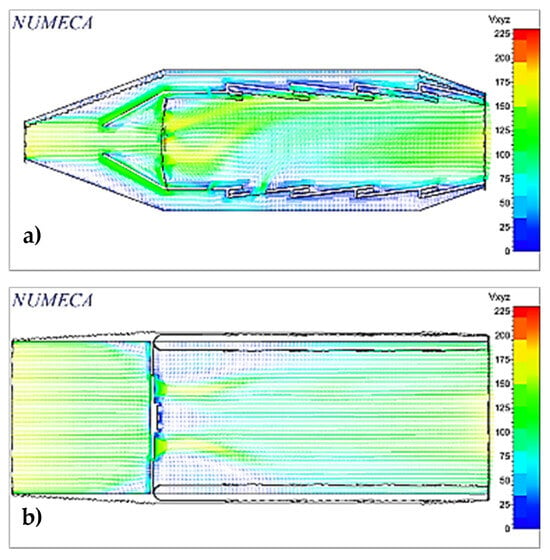
Figure 12.
Vectors of absolute velocity in two planes: (a) midplane in x-direction; (b) midplane in y-direction.
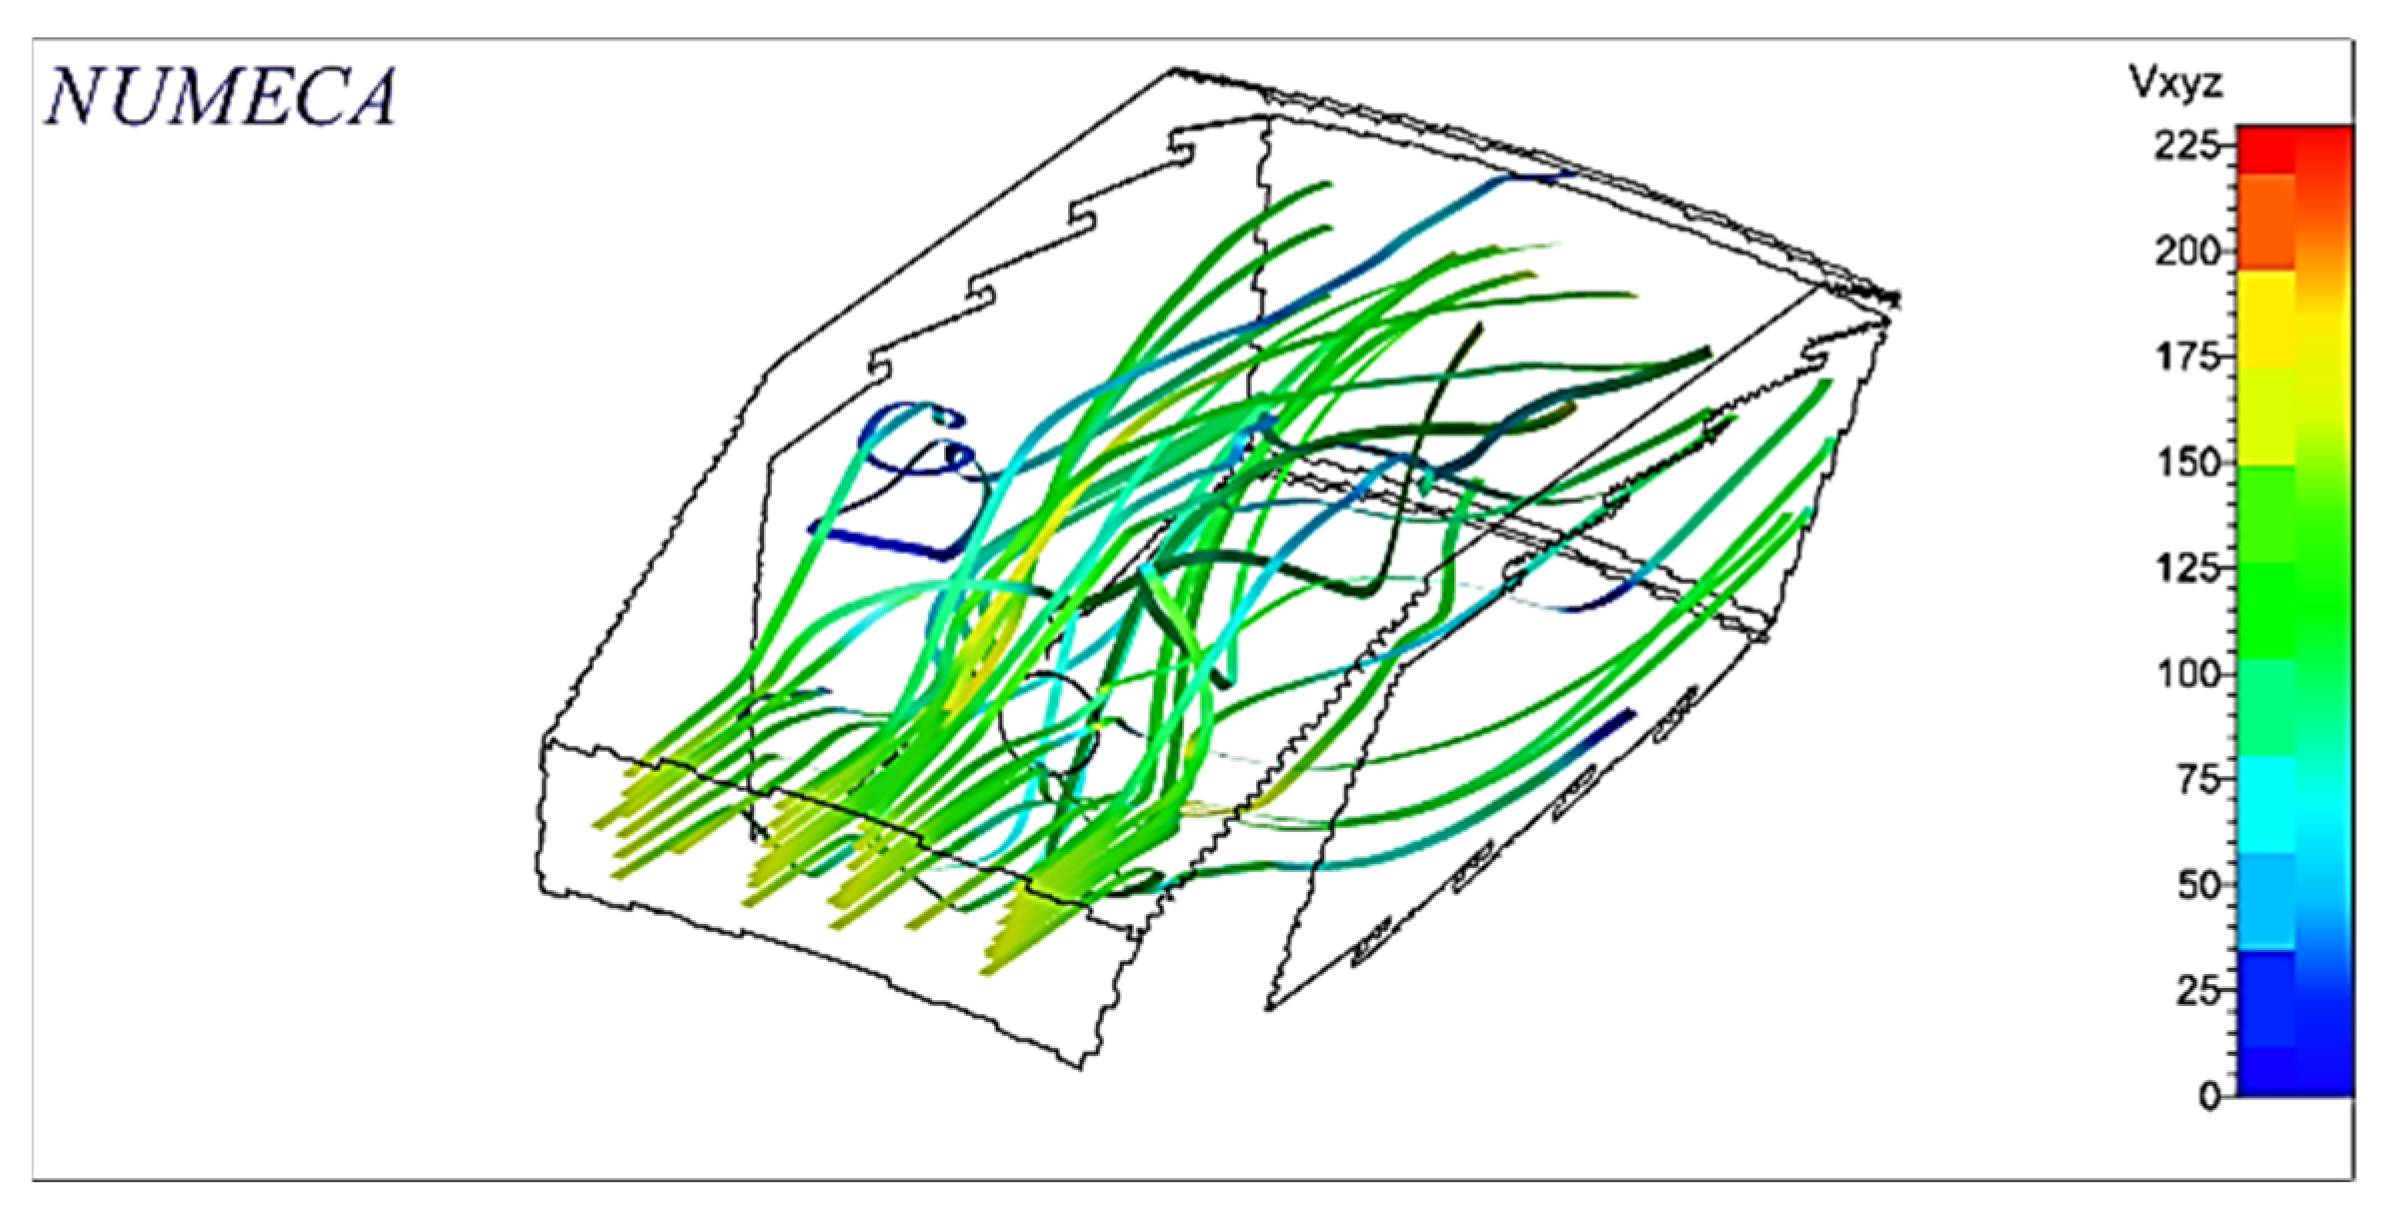
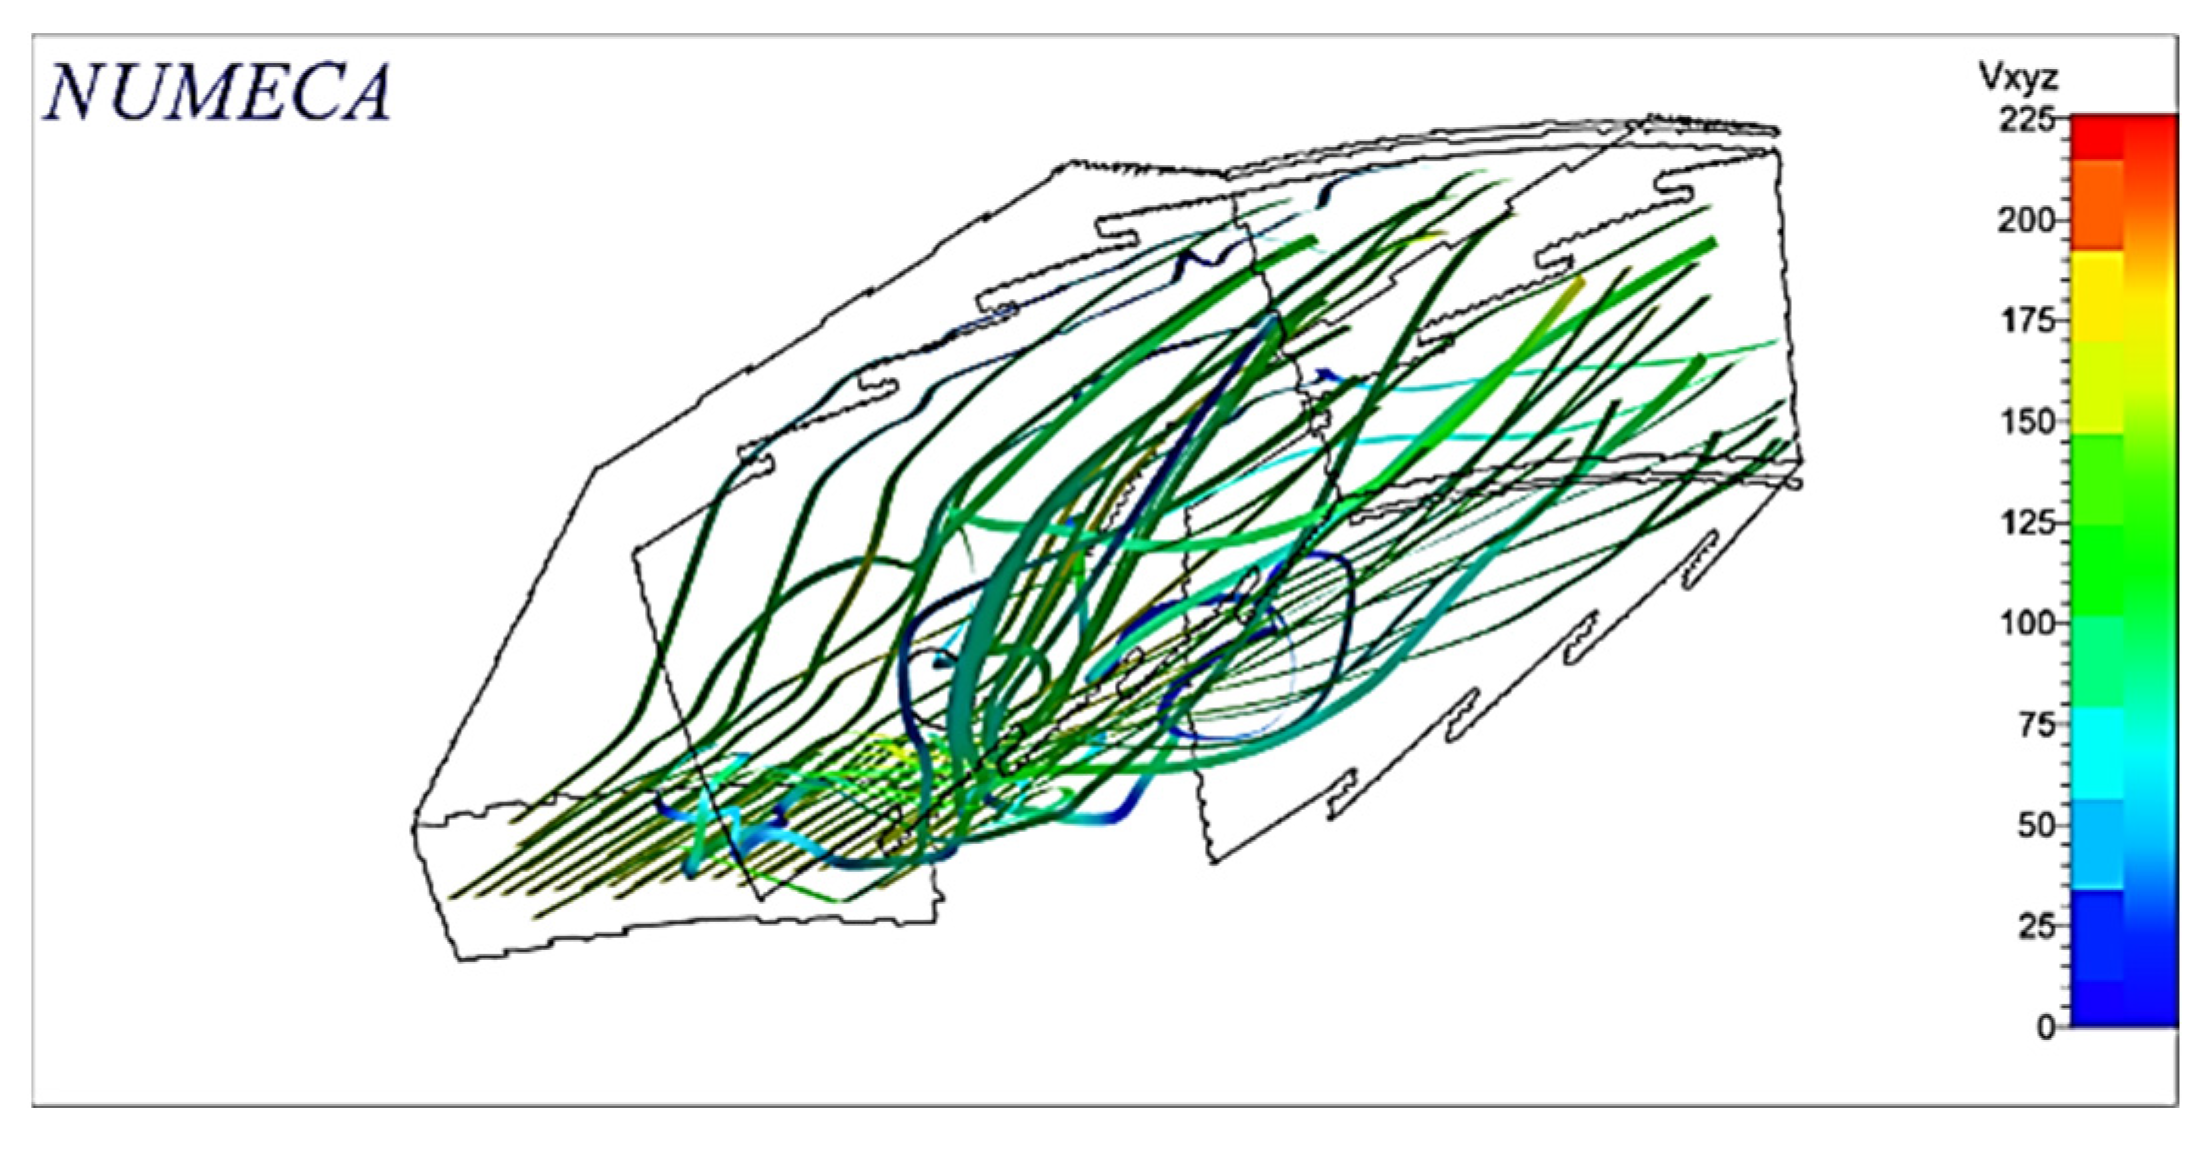
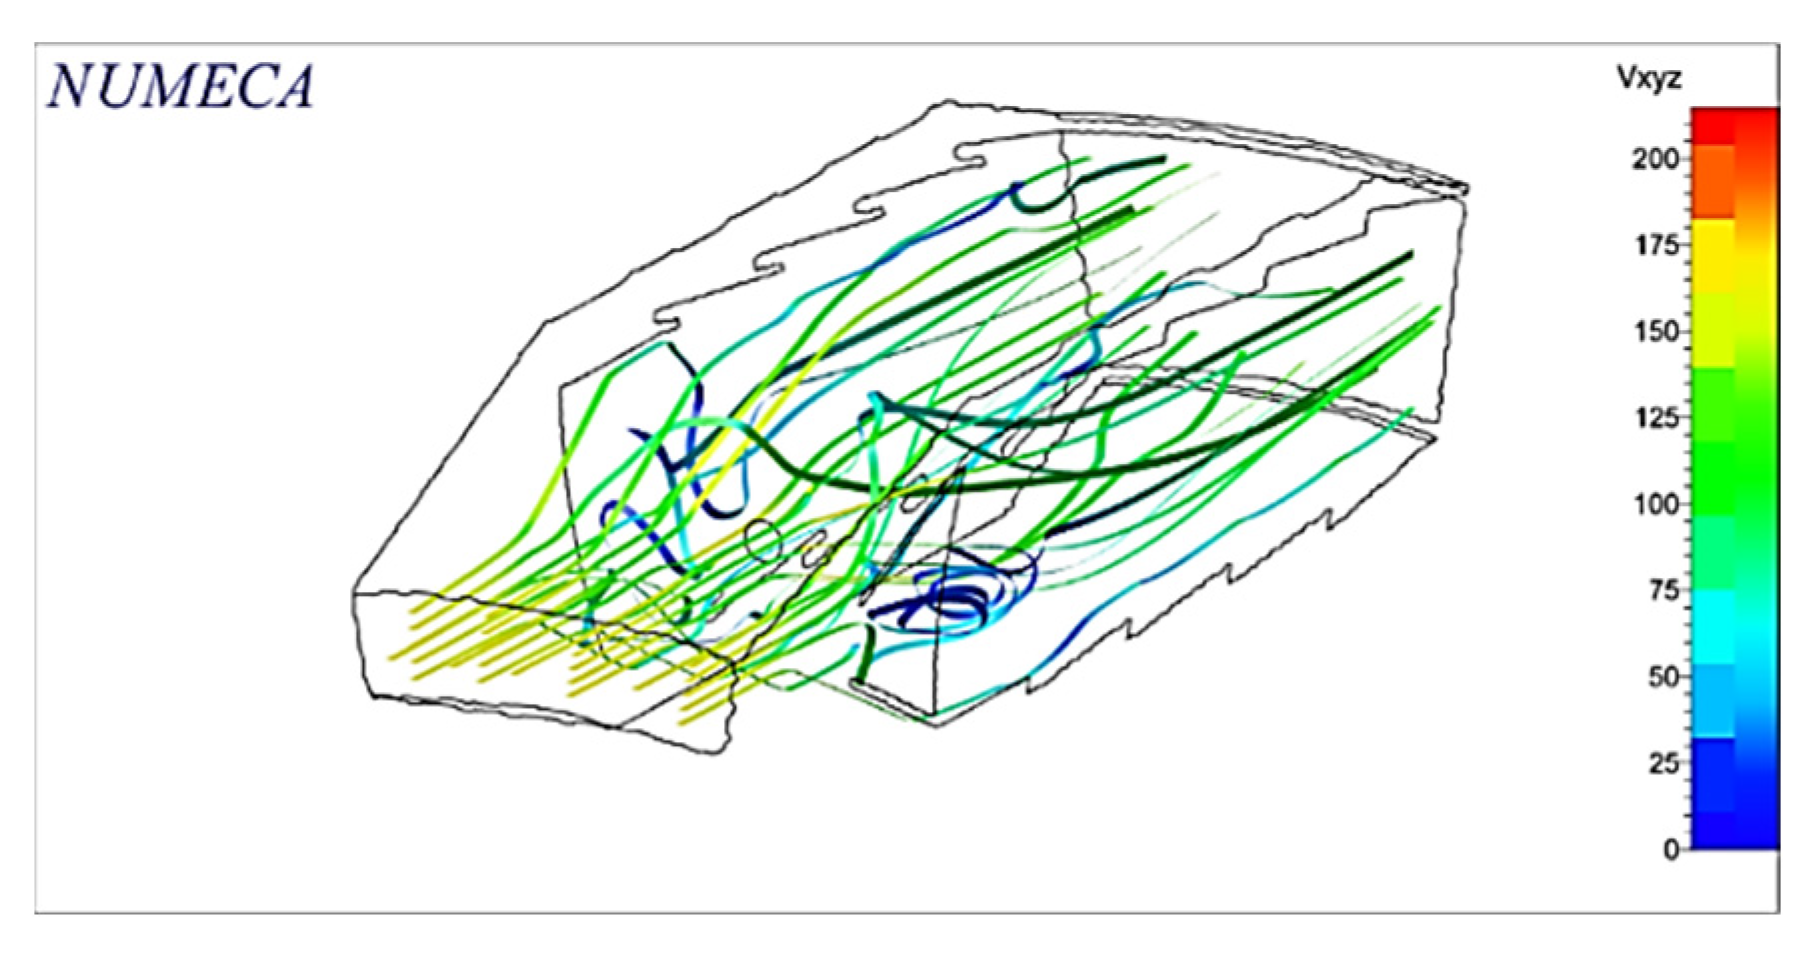
Streamlines were also traced from the chamber inlet, whose behavior is shown in Figure 13 in which it is possible to observe the rotation given to the flow by the swirler, which is essential for the mixing process.
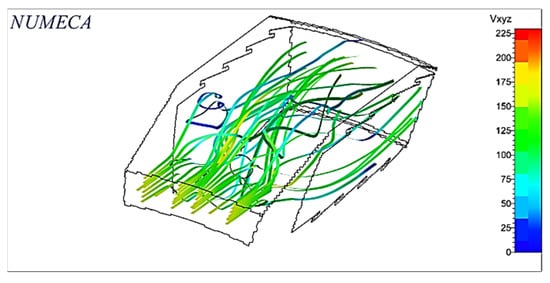
Figure 13.
Streamlines from the combustor inlet.
In general, the results show that even when most of the desirable characteristics are met in a combustion chamber, the pressure and direction of fuel injection cause the fuel to burn outside the primary zone, presenting exit temperatures higher than permissible temperatures and causing the formation of NOx and CO, which is why the configuration with axial fuel injection is ruled out.
3.1.2. Fuel Injected at 60°
In this configuration, the fuel is injected through the lateral surface of a truncated cone, whose apothem has an angle of 60° with respect to the axis, through which the same 0.054 kg/s of CH4 center as in the other configurations.
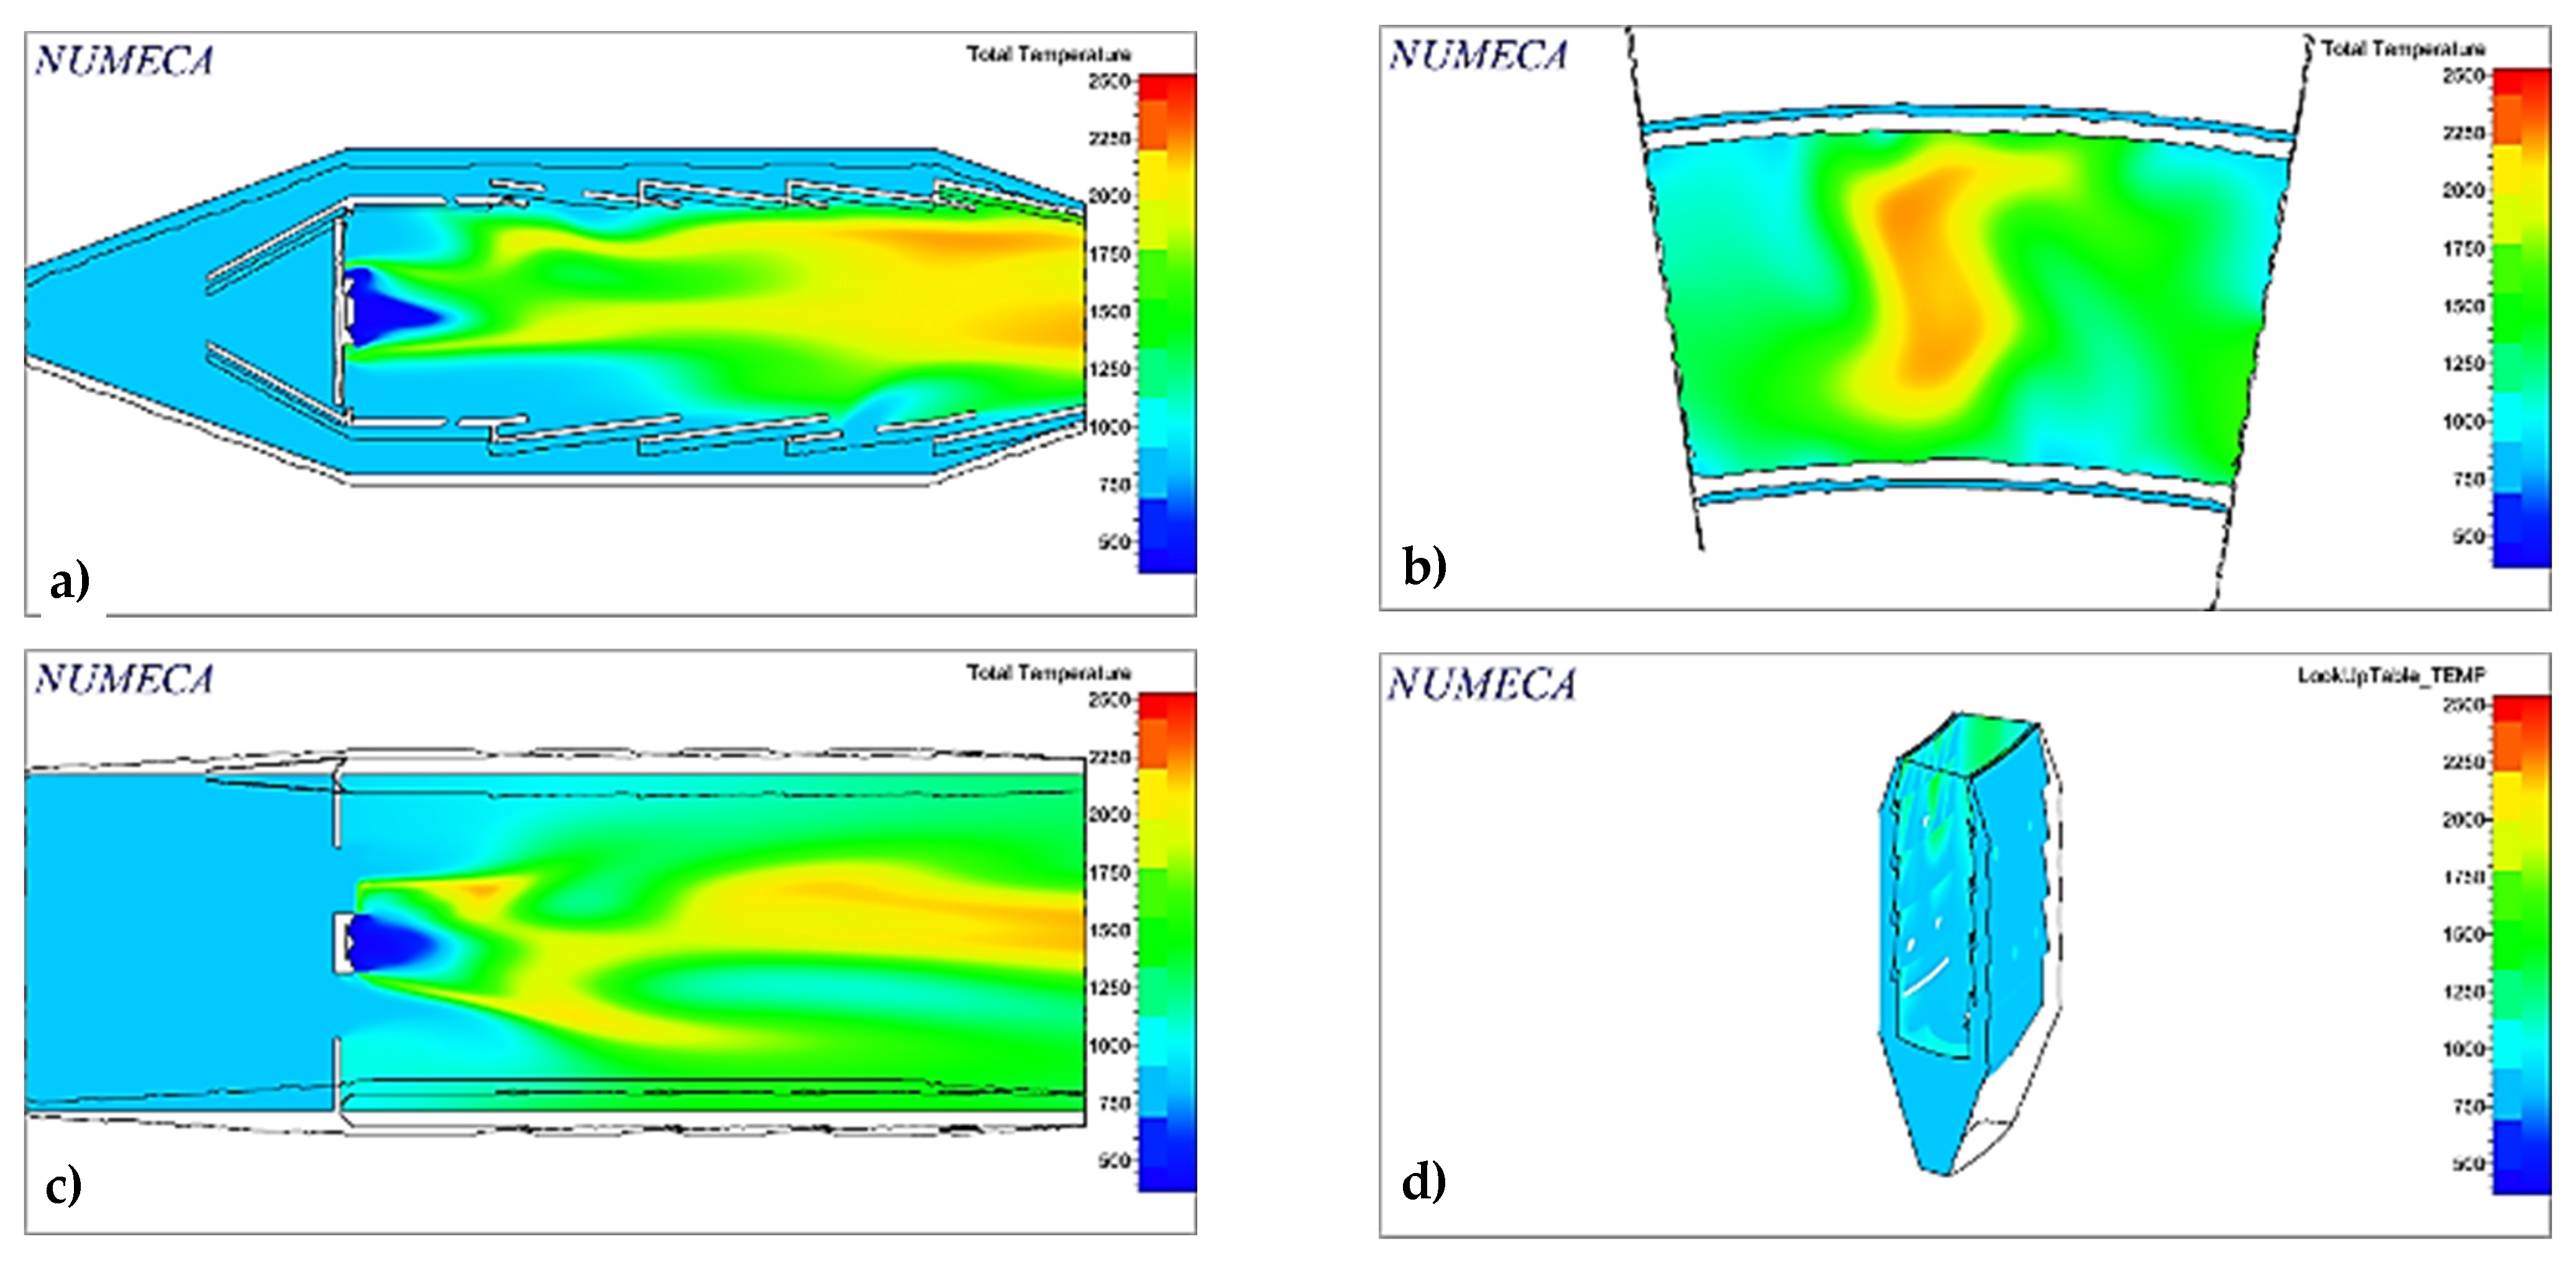
The wide fuel injection angle increases the maximum temperature zone, as shown in Figure 14b. However, the maximum temperature is 50 K lower than the previous configuration 1.
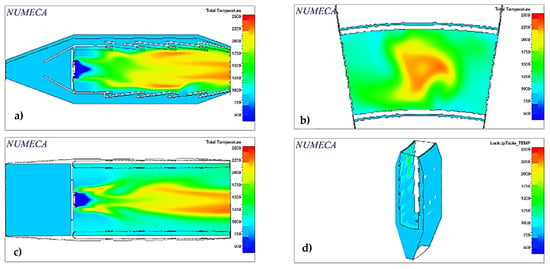
Figure 14.
Total temperature contours in different combustor planes: (a) midplane in y-direction; (b) combustor outlet; (c) midplane in x-direction; (d) isometric view of the liner (Conf. 2).
Compared to the first case, the highest temperature zones are closer to the fuel inlet zone, visible in Figure 14a,c, meaning that the flame length decreased, as well as the possible hot spots at the outlet. Figure 14d shows the temperature contour in the liner and lateral boundaries, where the maximum values are below 1100 K, so the cooling and secondary air distribution holes are working correctly.
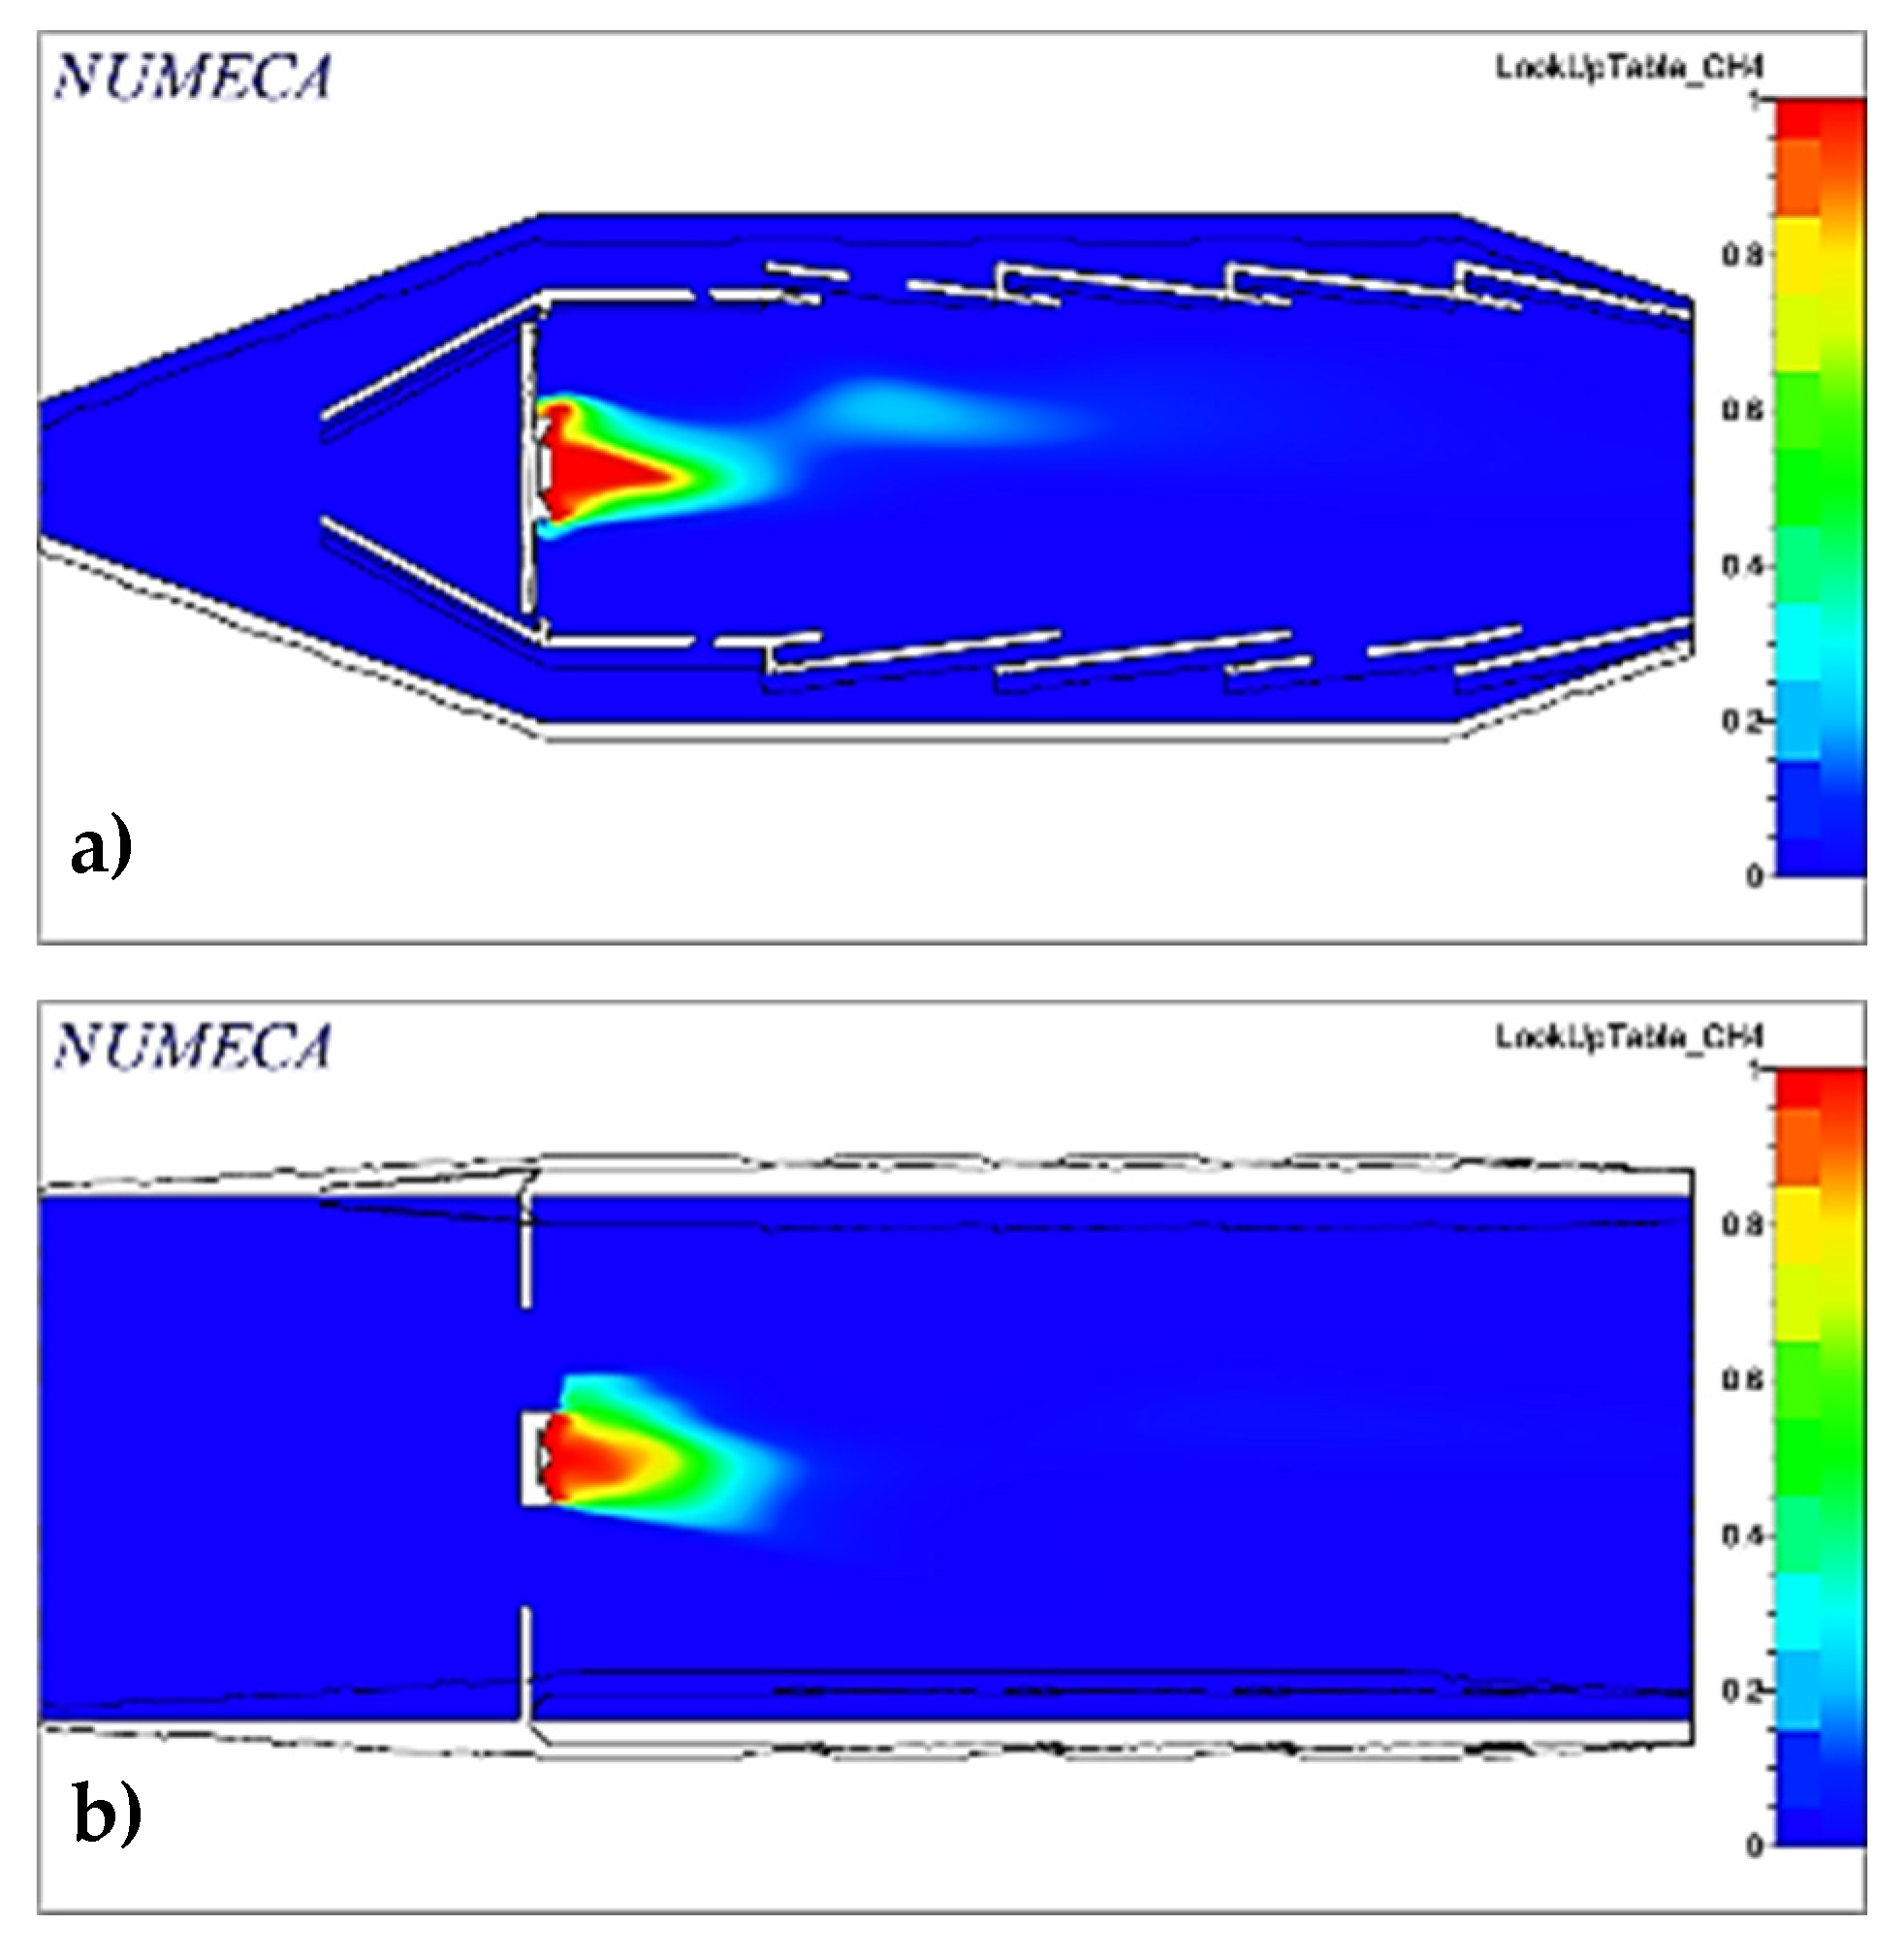
As already indicated, a requirement for a good combustion process is to be able to generate an adequate fuel–air mixture, so Figure 15 shows the fraction of CH4 in the middle planes of the domain. The fuel is wholly mixed over a short distance compared to configuration 1. This indicates that complete combustion is obtained and that the process occurs entirely inside the chamber.
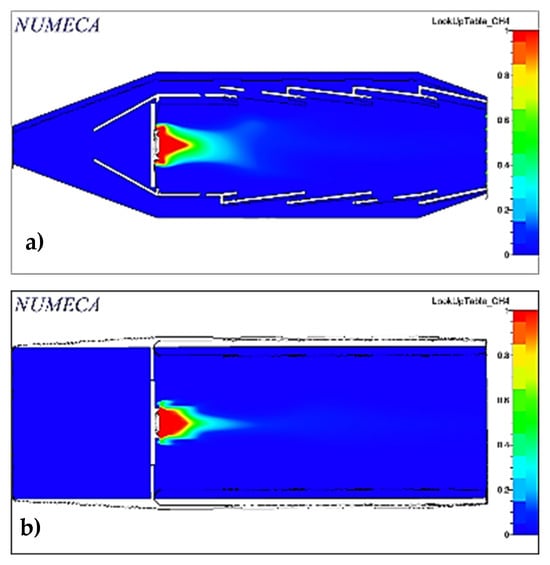
Figure 15.
Fuel mass fraction through the domain: (a) midplane in y-direction; (b) midplane in x-direction (Conf. 2).
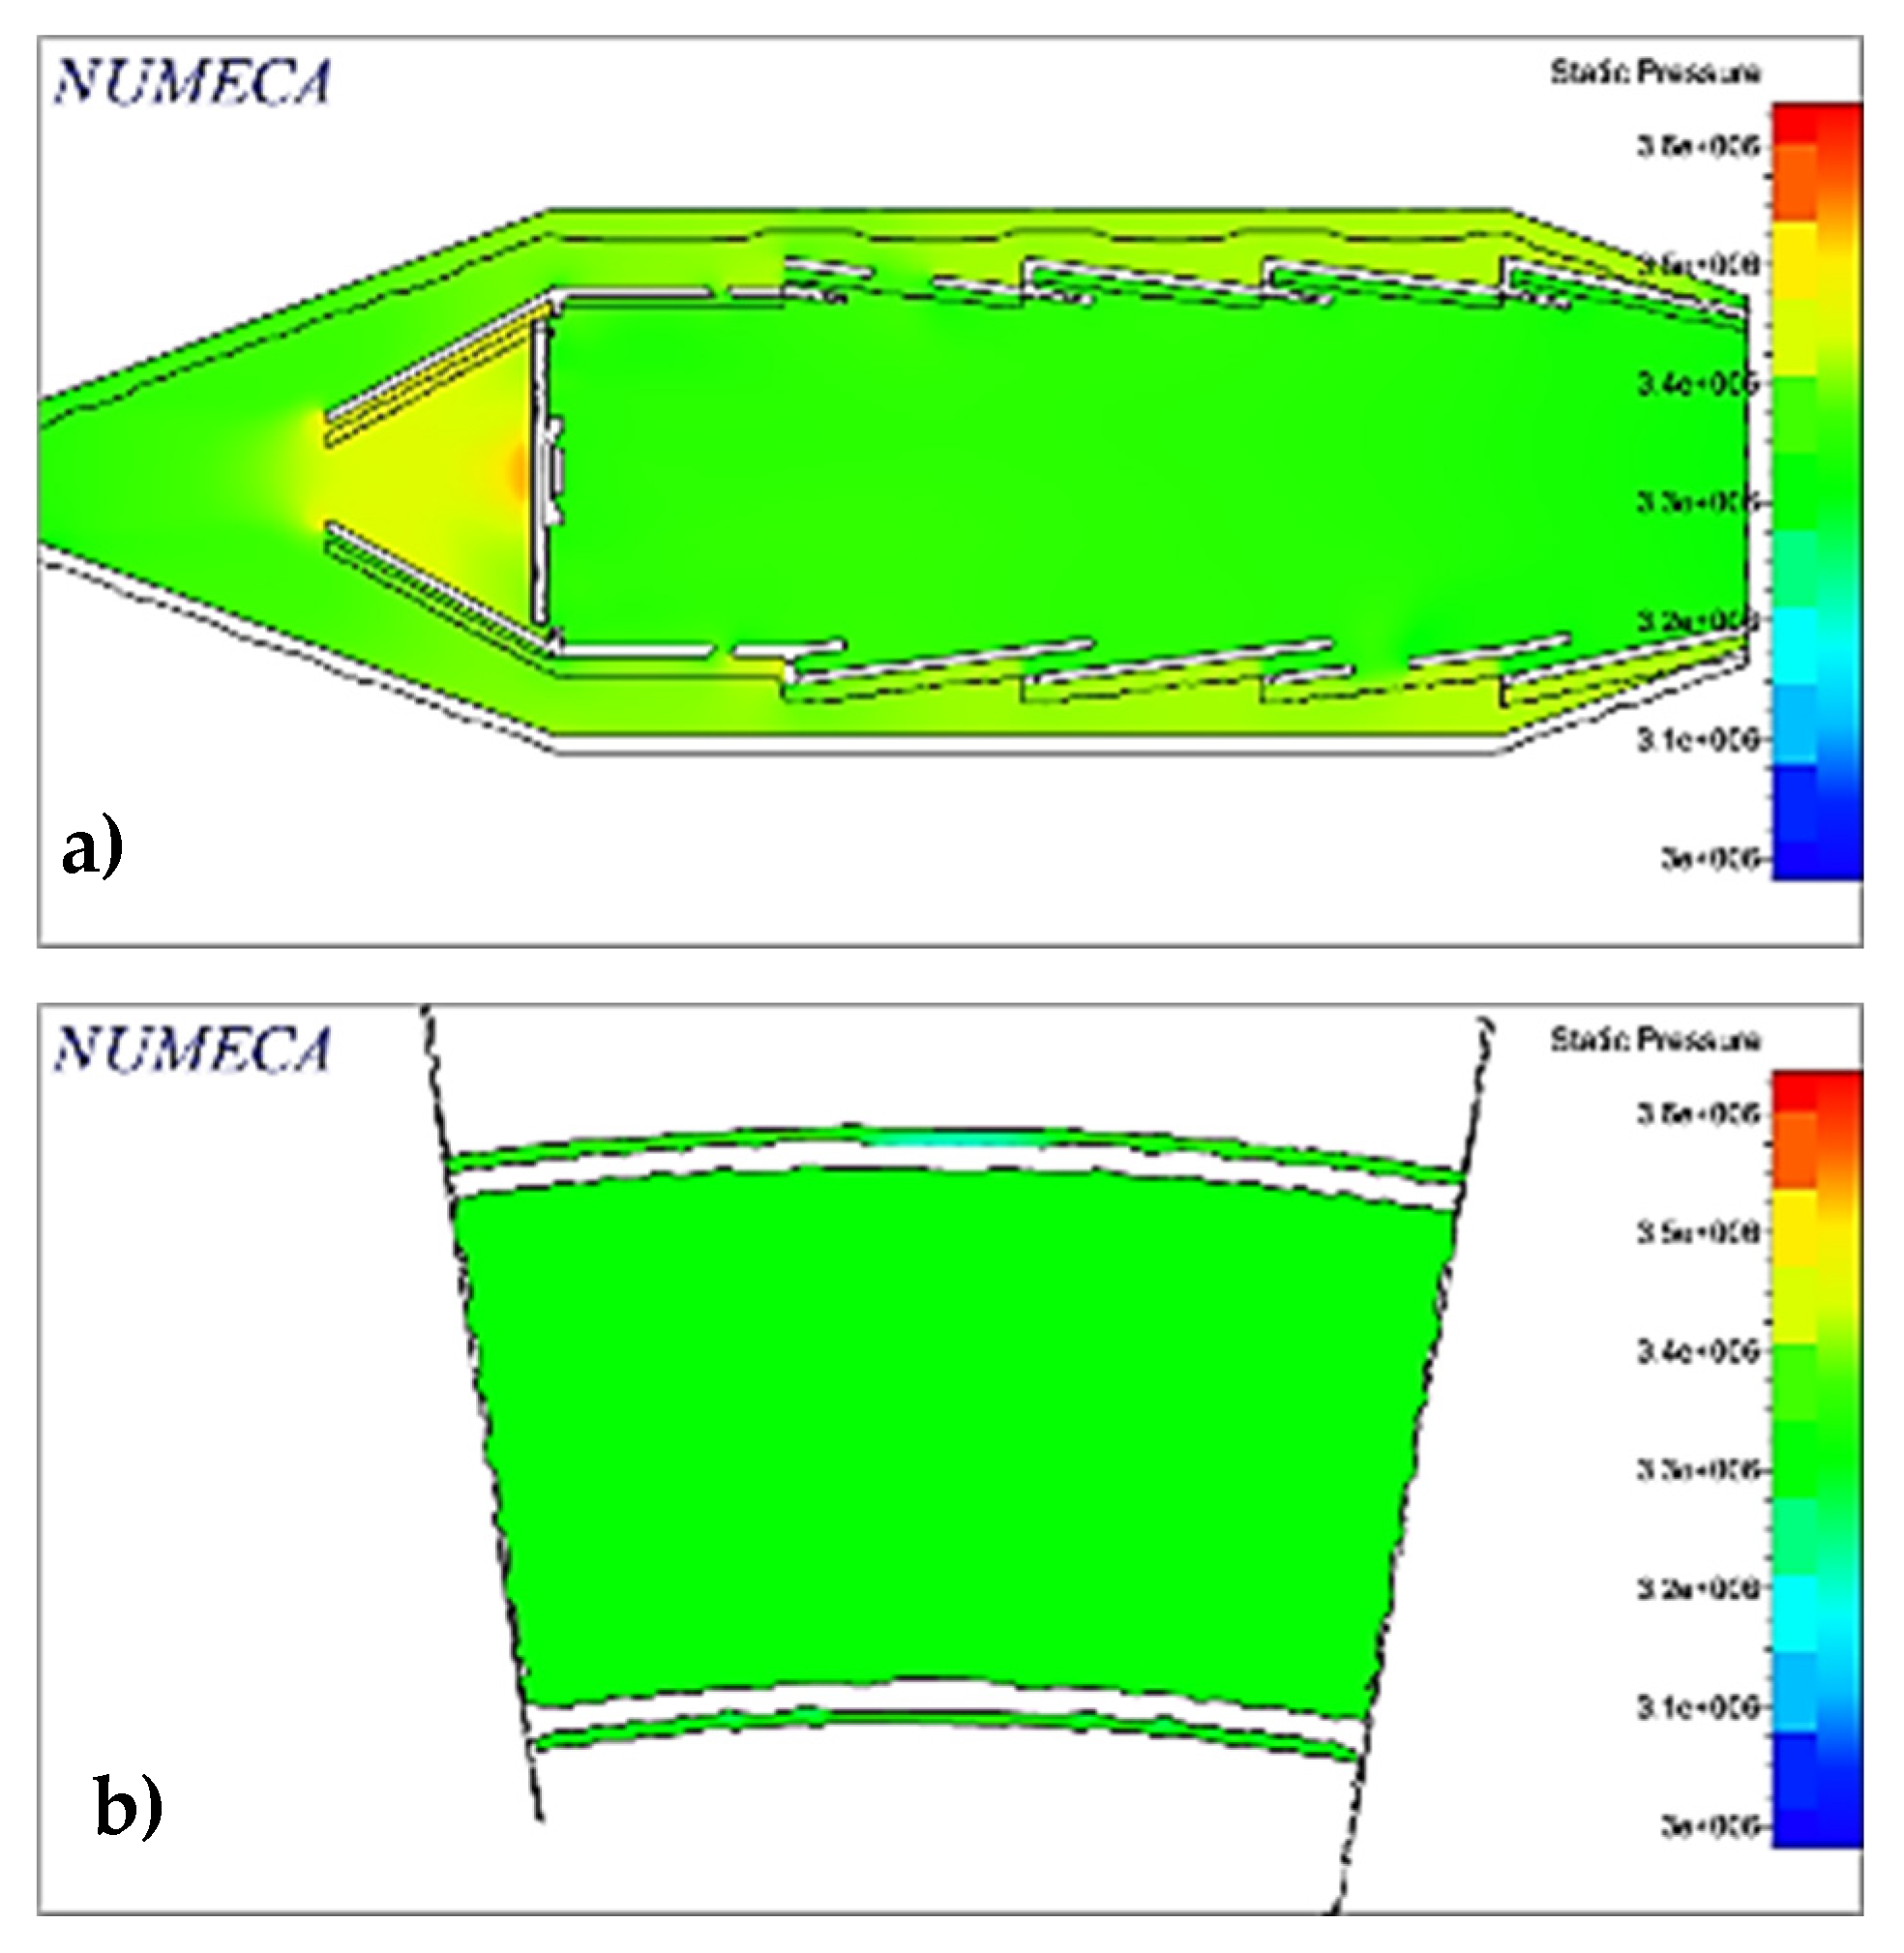
The pressure inside the domain is not significantly altered, obtaining a pressure ratio of 0.955, higher than the minimum. This can be seen in the pressure contour of Figure 16, which presents high-pressure points in the center of the vortex generator or even at the nozzle edge of the flame tube inlet. Notice that these values are not relevant since they only indicate flow deceleration zones.
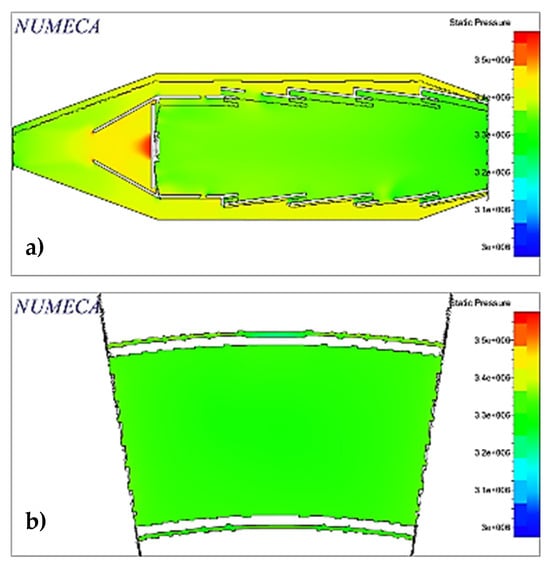
Figure 16.
Static pressure in different planes: (a) midplane in y-direction; (b) combustor outlet.
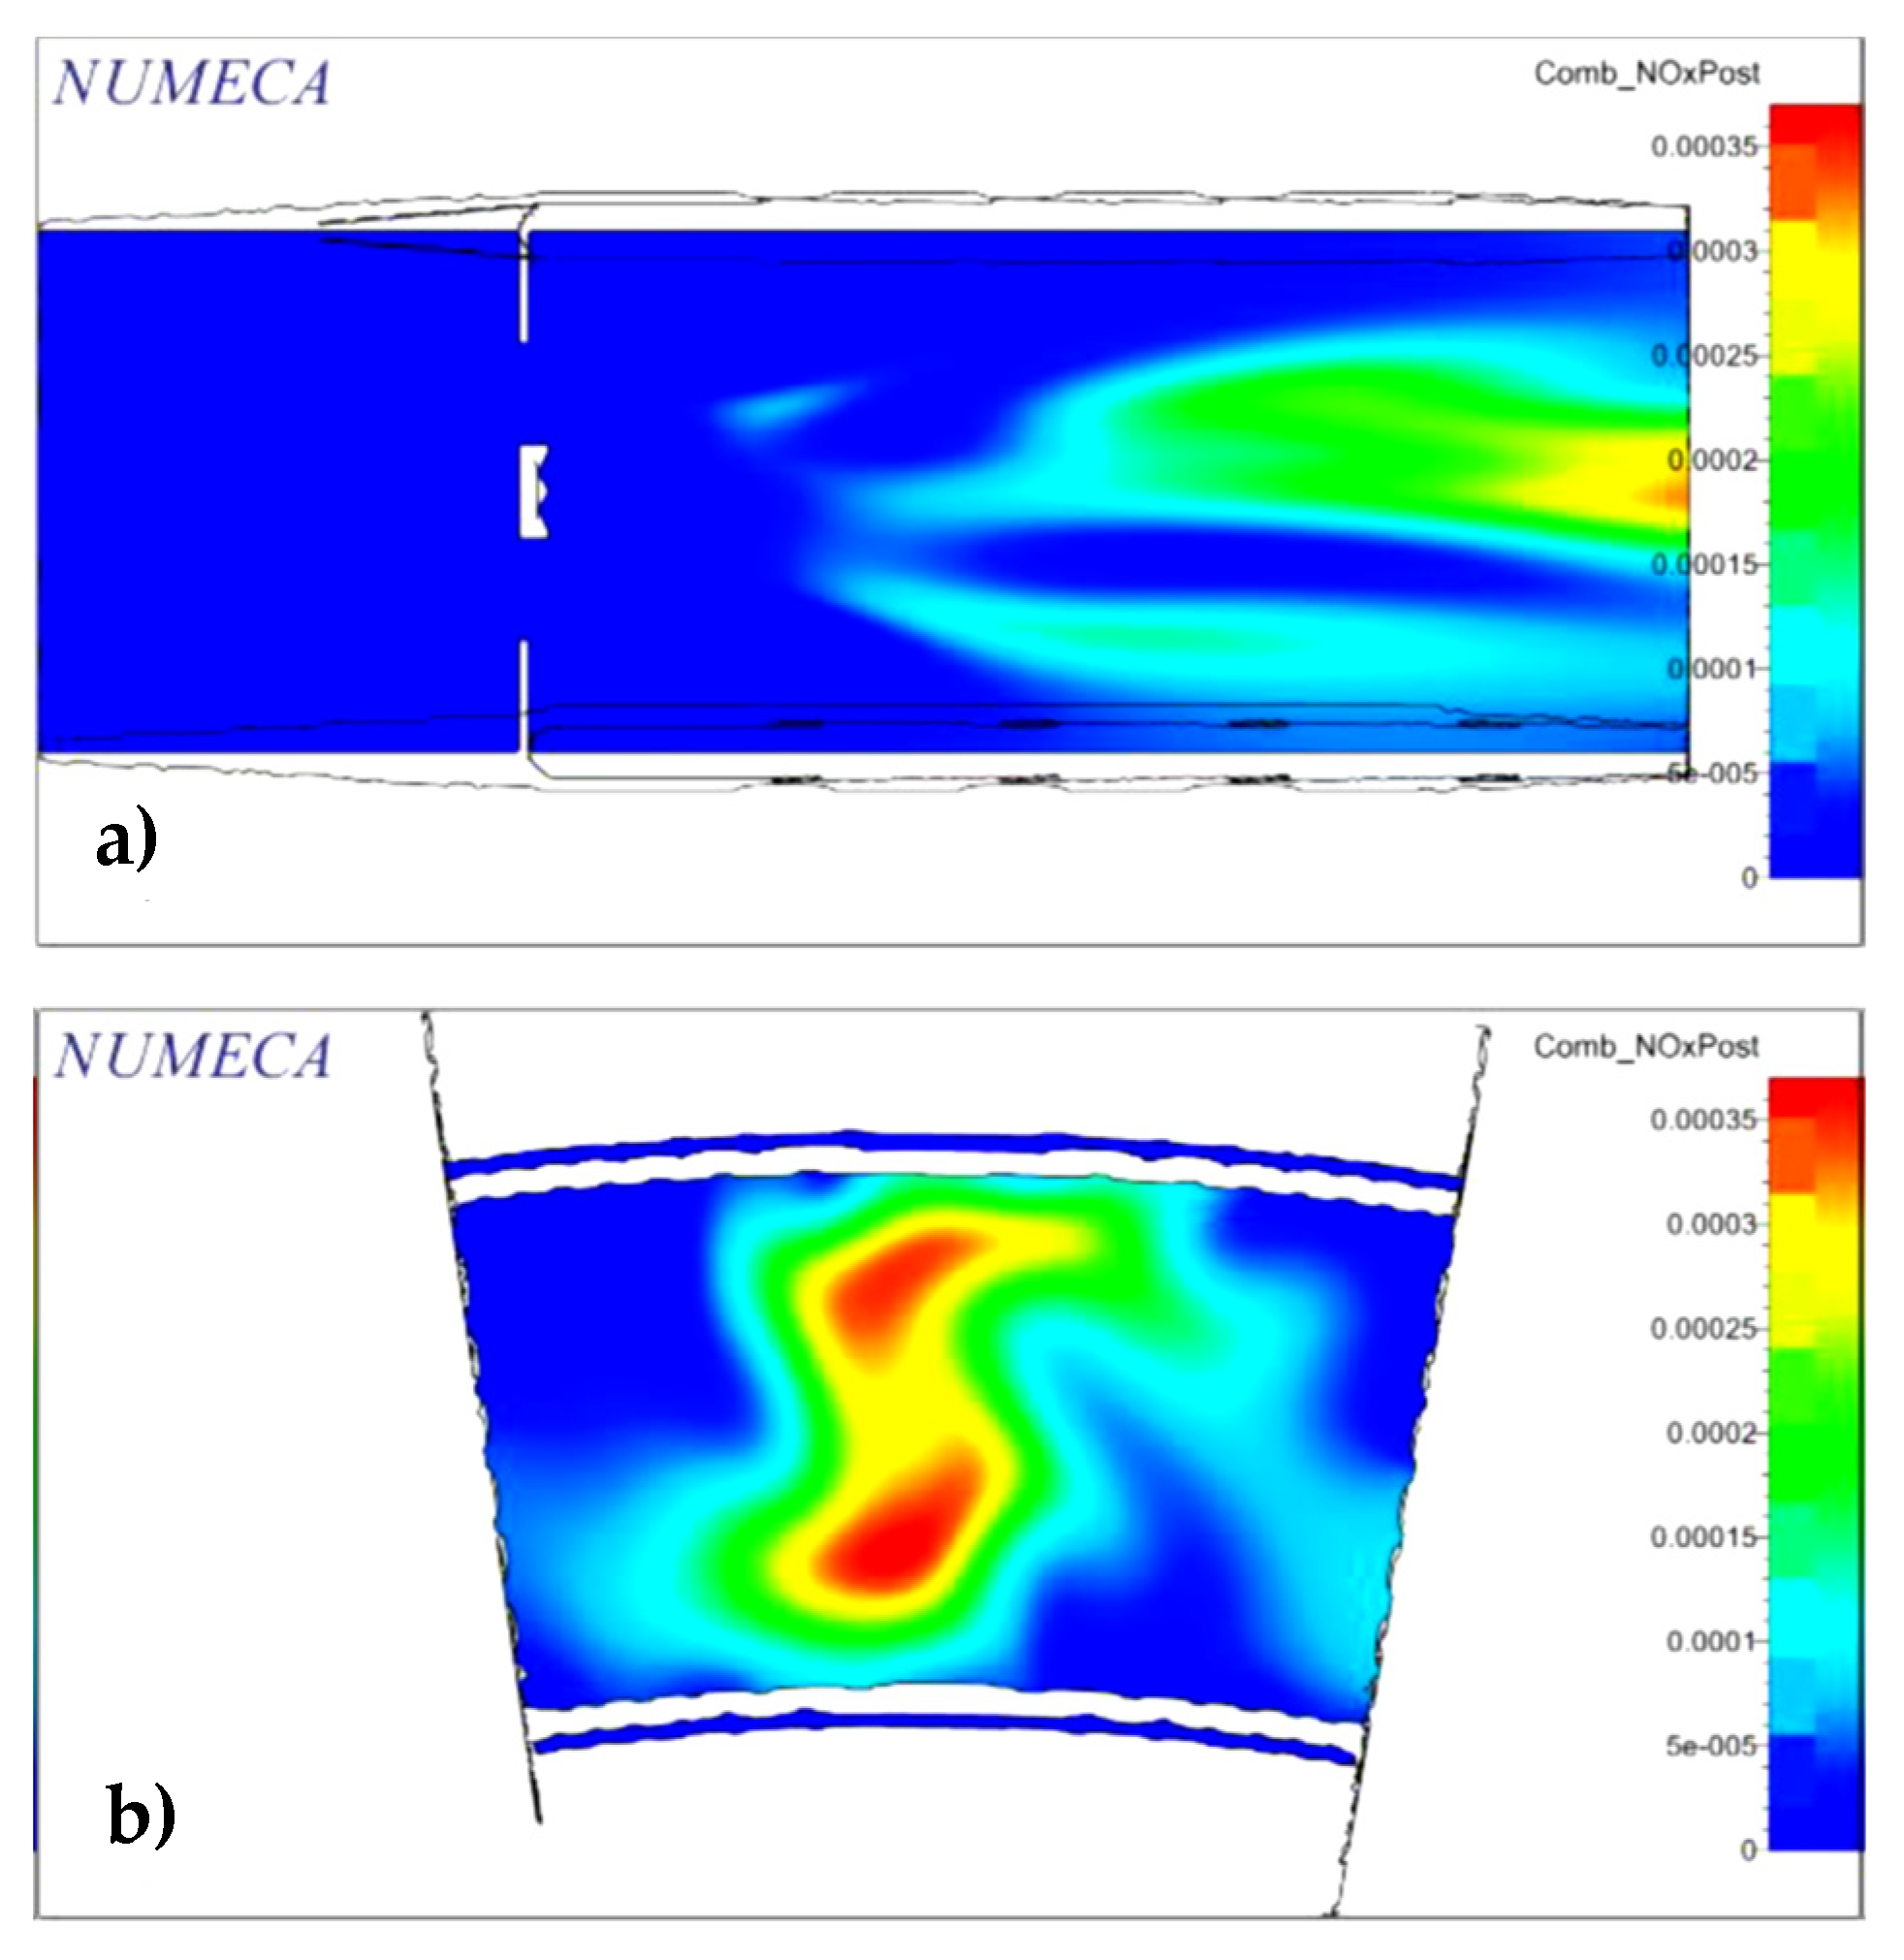
Figure 17 shows the mass fraction of nitrogen oxides generated by this configuration in which, as well as in configuration 1, the total is still lower than that established in Table 1. It is important to highlight that the formation of NOx is related to high temperatures, so there is a larger formation area, although of a smaller magnitude than in the first case.
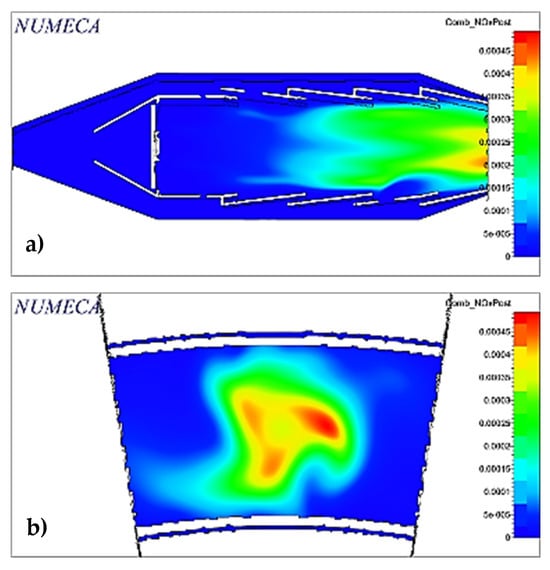
Figure 17.
NOx in two planes: (a) midplane in x-direction; (b) combustor outlet (Conf. 2).
Figure 18 shows the mass fraction of carbon monoxide (CO) in the middle plane as well as at the outlet. The maximum and total values are lower than those indicated in Table 1, so the maximum allowed is not exceeded.
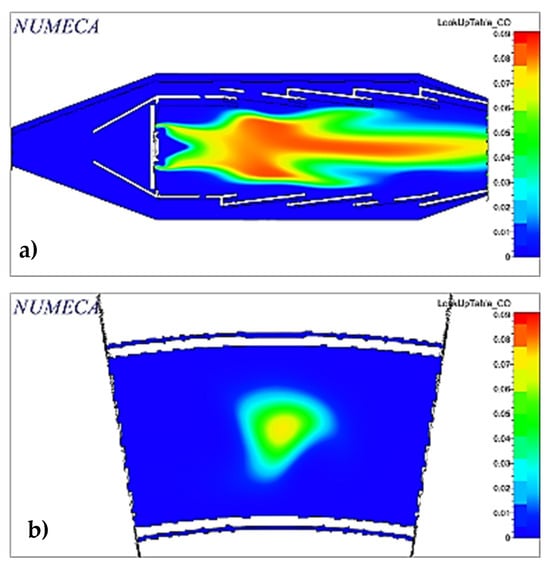
Figure 18.
CO in two planes: (a) midplane in y-direction; (b) combustor outlet.
It can also be observed that CO is formed in the intermediate zone, which indicates that the primary and secondary holes fail to introduce the necessary amount of oxygen, which is why complete combustion is not achieved in said zone.
The velocity variation is shown through the vectors shown in Figure 19, where the work done by the diffuser can be seen, by decreasing the inlet velocity so that combustion can be performed correctly. The direction of the secondary flow inlet to the primary can also be seen through the dilution holes.
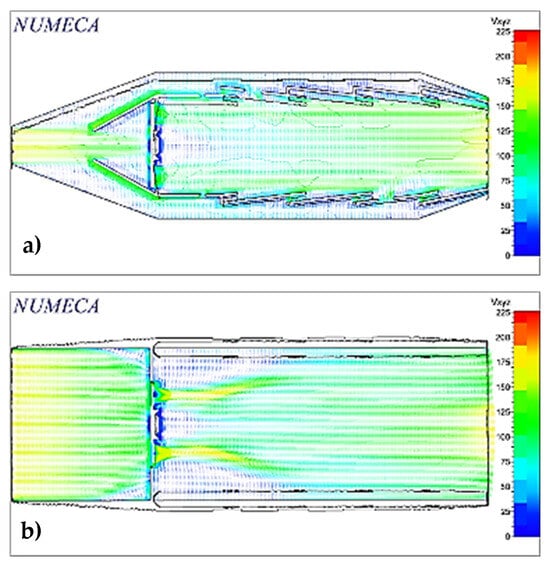
Figure 19.
Vectors of absolute velocity in two planes: (a) midplane in y-direction; (b) midplane in x-direction (Conf. 2).
The streamlines plotted in Figure 20 show the redirection caused by the swirler and the flow path from the chamber inlet to the outlet. The importance of the swirler in mixing is high since turbulence is a mandatory requirement when performing non-premixed combustion.
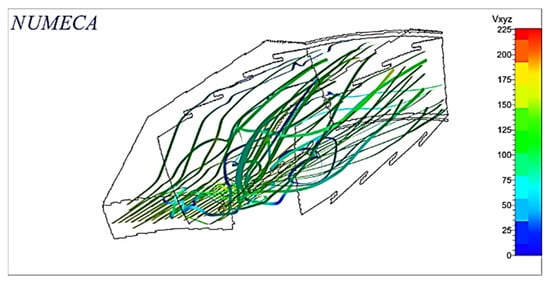
Figure 20.
Streamlines from the combustor inlet (Conf. 2).
It is important to mention that even when there are no modifications in the geometry, a change in the streamlines occurs; the variation of the expansion wave of the flame front causes this change. However, it is also important to emphasize that the outlet temperatures are still higher than the allowable ones and before making geometric changes, an injection annulus of 45° will be analyzed [30,32].
3.1.3. Fuel Injected at 45°
The fuel enters the domain through the lateral surface of a truncated cone, but in this case the apothem has an angle of 45°, and the inlet mass flow rate of CH4 is the same as in the previous cases.
It is observed that it has a better distribution than the previous one, where a high percentage of the surface is below 1800 K since the average temperature at the outlet is the lowest found in the simulations (see Figure 21), which is similar to the information reported in reference [33].
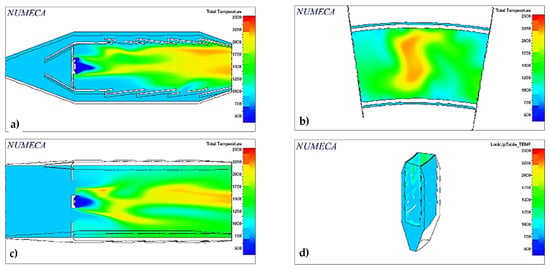
Figure 21.
Total temperature in different planes of the chamber: (a) midplane in y-direction; (b) chamber outlet; (c) midplane in x-direction; (d) isometric view of the flame tube (Conf. 3).
As in the first case, the maximum temperature on the walls of the liner remains below 1300 K, which indicates that the distribution of the secondary air and the cooling holes were designed correctly.
Compared to the first configuration, in this one the distance required for the fuel to completely mix with the air is lower, with complete combustion inside the combustor occurring, and no portion of the fuel leaves the combustion chamber. This behavior can be seen in Figure 22, which is the CH4 fraction contour along the combustion chamber.
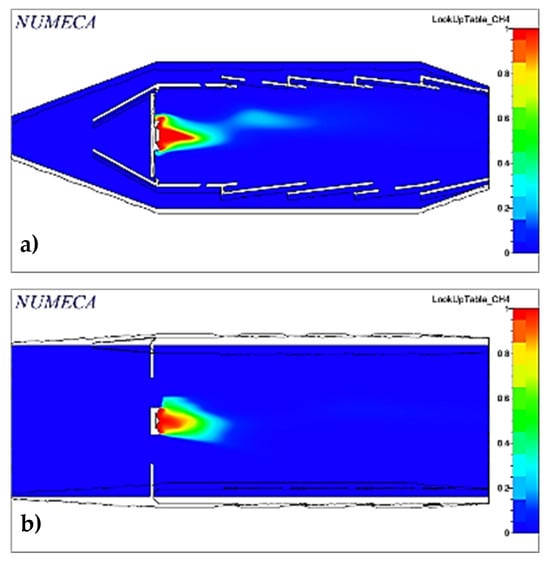
Figure 22.
Fuel mass fraction through the domain (a) midplane in y-direction; (b) midplane in x-direction (Conf. 3).
The pressure inside the chamber does not present significant variations, as it can be observed that it remains practically constant throughout the chamber and at the outlet [34]. The pressure ratio value obtained was 0.96, being the configuration with the best performance in that sense (see Figure 23). As with the previous configurations, this value is acceptable, being greater than 0.94.
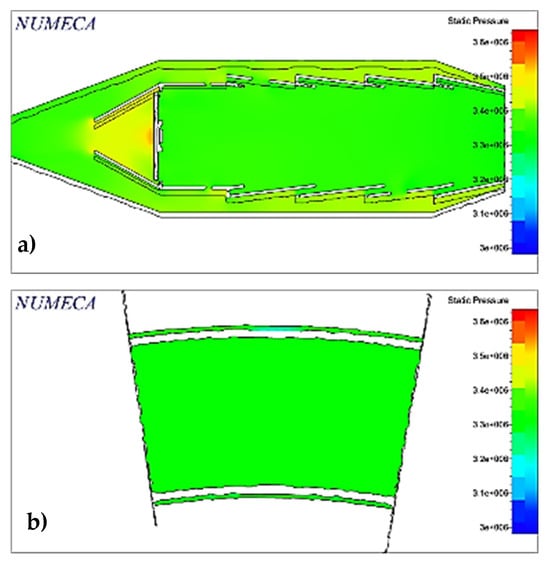
Figure 23.
Static pressure in different planes: (a) midplane in y-direction; (b) combustor outlet.
The contours of nitrogen oxides generated are shown in Figure 24, whose maximum mass fraction value and total are below those established in Table 1, operating in a regime of permitted NOx emissions.
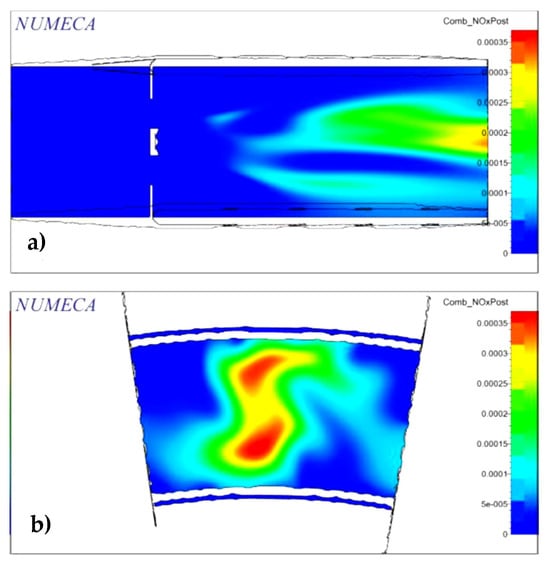
Figure 24.
NOx in two planes: (a) midplane in x-direction; (b) combustor outlet (Conf. 3).
Figure 25 shows the velocity vectors. In this image, the work conducted by the diffuser to decrease the velocity at the inlet of the liner, the direction of the fuel, and the entry of secondary air through the dilution and cooling holes can be seen.
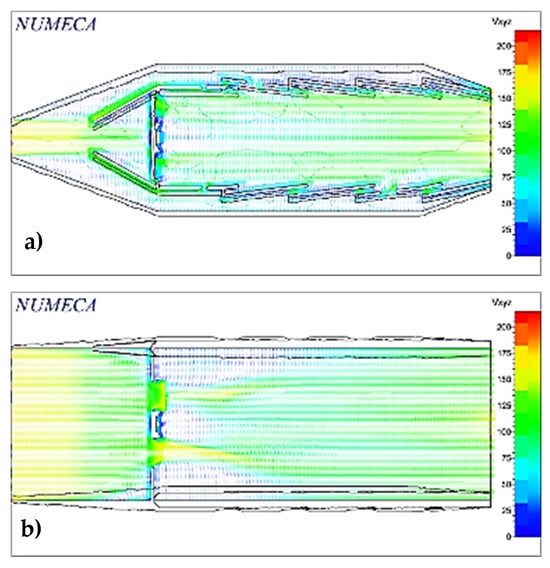
Figure 25.
Vectors of absolute velocity in two planes: (a) midplane in y-direction; (b) midplane in x-direction (Conf. 3).
Figure 26 shows an image of streamlines used to visualize the flow better. The swirler’s rotation is observed, which is vital to mixing air and fuel efficiently.
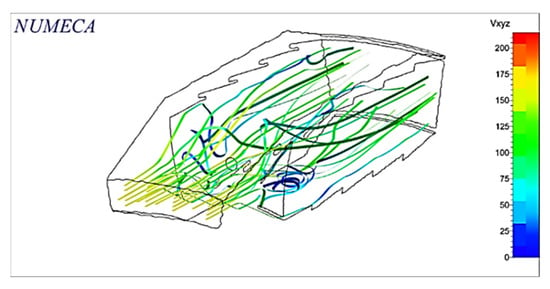
Figure 26.
Streamlines from the combustor inlet (Conf. 3).
4. Conclusions
The presented study outlines a robust methodology for designing an annular combustion chamber that adheres to the operating conditions of the CFM56 engine. The comprehensive numerical analysis validates the design’s accuracy and performance. The key findings obtained are defined as follows:
- ➢
- The designed combustor size is appropriate, ensuring the entire combustion process occurs within the chamber. Complete combustion is achieved, with unburned hydrocarbons at the exit being null, which is critical for efficient operation and environmental compliance.
- ➢
- The emissions of NOx and CO are significantly below the regulatory limits. This indicates the design’s effectiveness in controlling harmful emissions, which is crucial for meeting environmental standards.
- ➢
- The simulated cases reported a pressure ratio close to 0.96, which falls within the acceptable design criteria of a minimum value of 0.94. This demonstrates the combustor’s efficiency in maintaining pressure levels necessary for optimal engine performance.
- ➢
- The diffuser and swirler components effectively slow down the inlet flow velocity and generate the required turbulence for proper mixing. This is essential for achieving stable combustion and uniform temperature distribution.
- ➢
- The design of the dilution and cooling zones effectively maintains liner temperatures at levels that prevent material damage, ensuring the longevity and reliability of the combustor.
- ➢
- Conical fuel injection at a 45° angle proved superior to axial injection, resulting in a more uniform temperature profile at the outlet, shorter mixing distances, and reduced flame length. This configuration also minimized emissions, enhancing overall combustor performance.
Author Contributions
L.A.M.-P. and F.S.-L., Formal analysis, Writing—original draft, Conceptualization, Methodology, Software, and Validation. J.G.B.-S., M.A.C.-P., J.M.-T. and W.W.-Á., Conceptualization, Methodology, and Validation. R.A.G.-L., Conceptualization, Formal Analysis, and Writing—review and editing. All authors have read and agreed to the published version of the manuscript.
Funding
This work was completed in the LABINTHAP of the IPN. This work was supported by the research grant 20241361.
Institutional Review Board Statement
Not applicable.
Informed Consent Statement
Not applicable.
Data Availability Statement
The original contributions presented in the study are included in the article, further inquiries can be directed to the corresponding author.
Acknowledgments
Thanks to the Instituto Politécnico Nacional—ESIME Zacatenco, and the National Council of Science and Technology (CONACYT). Thanks also to NUMECA International for the software provided for this project.
Conflicts of Interest
The authors declare that they have no known competing financial interests or personal relationships that could have appeared to influence the work reported in this paper.
Abbreviations
| rr | Root radius |
| rt | Tip radius |
| rm | Mean radius |
| h | Heigh |
| R | Gas Constant |
| Compressor Delivery Air Mass flow | |
| Compressor Delivery Temperature | |
| Compressor Delivery Pressure | |
| Pressure Loss Factor | |
| Total Pressure Loss in the Combustor | |
| mc | Number of Carbon atoms in the fuel |
| mh | Number of Hydrogen atoms in the fuel |
| ms | Number of sulfur atoms in the fuel |
| NA | Does not apply |
| Pressure loss in the secondary flow, approximately 4%. |
References
- Mattingly, J.D.; Heiser, W.H.; Pratt, D.T. Aircraft Engine Design, 2nd ed.; American Institute of Aeronautics and Astronautics, Inc.: San Francisco, CA, USA, 2002. [Google Scholar]
- Lefebvre, A.H.; Ballal, D.R. Gas Turbine Combustion Alternative Fuels and Emissions, 3rd ed.; CRC Press: Boca Raton, FL, USA, 2010. [Google Scholar]
- Worth, N.A.; Dawson, J.R. Modal Dynamics of Self-Excited Azimuthal Instabilities in an Annular Combustion Chamber. Combust. Flame 2013, 160, 2476–2489. [Google Scholar] [CrossRef]
- Mark, C.P.; Selwyn, A. Design and Analysis of Annular Combustion Chamber of a Low Bypass Turbofan Engine in a Jet Trainer Aircraft. Propuls. Power Res. 2016, 5, 97–107. [Google Scholar] [CrossRef]
- Livebardon, T.; Moreau, S.; Poinsot, T.; Bouty, E. Numerical Investigation of Combustion Noise Generation in a Full Annular Combustion Chamber. In Proceedings of the 21st AIAA/CEAS Aeroacoustics Conference, Dallas, TX, USA, 22–26 June 2015; AIAA AVIATION Forum. American Institute of Aeronautics and Astronautics: Reston, VA, USA, 2015. [Google Scholar]
- Wolf, P.; Balakrishnan, R.; Staffelbach, G.; Gicquel, L.Y.M.; Poinsot, T. Using LES to Study Reacting Flows and Instabilities in Annular Combustion Chambers. Flow Turbul. Combust. 2012, 88, 191–206. [Google Scholar] [CrossRef]
- Meloni, R.; Ceccherini, G.; Michelassi, V.; Riccio, G. Analysis of the Self-Excited Dynamics of a Heavy-Duty Annular Combustion Chamber by Large-Eddy Simulation. J. Eng. Gas Turbines Power 2019, 141, 111016. [Google Scholar] [CrossRef]
- Khandelwal, B. Theory of Aerospace Propulsion—Second Edition P. M. Sforza Elsevier Butterworth-Heinemann, The Boulevard, Langford Lane, Kidlington, Oxford, OX5 1GB, UK. 2017. Xx; 827pp. Illustrated £82.99. ISBN 978-0-12-809326-9. Aeronaut. J. 2019, 123, 1310–1311. [Google Scholar] [CrossRef]
- Fu, Z.; Gao, H.; Zeng, Z.; Liu, J. Numerical Analysis on Multi-Field Characteristics and Synergy in a Large-Size Annular Combustion Chamber with Double Swirlers. Comput. Model. Eng. Sci. 2020, 122, 805–830. [Google Scholar] [CrossRef]
- Ghahramani, Z.; Zareh, M. Design, Numerical and Experimental Investigation of High Swirling Flow in an Annular Combustion Chamber. Int. J. Adv. Des. Manuf. Technol. 2021, 14, 73–83. [Google Scholar] [CrossRef]
- Balijepalli, R.; Dasore, A.; Rajak, U.; Siva Kumar Reddy, Y.; Varma, T.N. Design and Optimisation of Annulus Combustion Chamber of Gas Turbine Engine: An Analytical and Numerical Approach BT—Advancement in Materials, Manufacturing and Energy Engineering; Verma, P., Samuel, O.D., Verma, T.N., Dwivedi, G., Eds.; Springer Nature: Singapore, 2022; Volume II, pp. 553–567. [Google Scholar]
- Jagadish, V.; Anandarao, G.; Maddaiah, K.C.; Hussain, S.; Krishna, V.S. Design and Analysis of Gas Turbine Combustion Chamber. AIP Conf. Proc. 2023, 2492, 20031. [Google Scholar] [CrossRef]
- Liu, C.; Yang, J.; Dong, Q.; Lai, C.; Zhao, J.; Lin, J.; Liu, M. Experimental and Numerical Study on Flow Field Characteristics of a Combustion Chamber with Double-Stage Counter-Rotating Swirlers. Int. Commun. Heat Mass Transf. 2024, 151, 107245. [Google Scholar] [CrossRef]
- Bahr, D.W. Aircraft Turbine Engine NOx Emission Limits: Status and Trends. In Proceedings of the ASME 1992 International Gas Turbine and Aeroengine Congress and Exposition, Cologne, Germany, 1–4 June 1992. [Google Scholar]
- Langston, L.S. Gas Turbines. In Encyclopedia of Energy; Cleveland, C.J., Ed.; Elsevier: New York, NY, USA, 2004; pp. 221–230. ISBN 978-0-12-176480-7. [Google Scholar]
- Boyce, M.P. Gas Turbine Engineering Handbook; Elsevier: Oxford, UK, 2006. [Google Scholar]
- Knight, H.; Walker, R. The Component Pressure Losses in Combustion Chambers; Cranfield University: Cranfield, UK, 2012. [Google Scholar]
- Clemente Mendoza, A.A. Diseño de Generadores de Vórtice de Una Cámara de Combustión de Turbina de Gas. Master’s Thesis, Instituto Politécnico Nacional, Unidad Zacatenco, Mexico City, Mexico, 2019. [Google Scholar]
- Pegemanyfar, N.; Pfitzner, M. State-of-the-Art Combustor Design Utilizing the Preliminary Combustor Design System PRECODES. In Proceedings of the ASME Turbo Expo 2008: Power for Land, Sea, and Air, Berlin, Germany, 9–13 June 2008; Volume 3. [Google Scholar]
- Shahril, A.; Samin, R.; Juraidi, J.M.; Daut, J. Structural Analysis of Brake Disc Using Dynamic Simulation. ARPN J. Eng. Appl. Sci. 2015, 10, 7805–7808. [Google Scholar]
- Bozorgi, A.; Javidpour, E.; Riasi, A.; Nourbakhsh, A. Numerical and Experimental Study of Using Axial Pump as Turbine in Pico Hydropower Plants. Renew. Energy 2013, 53, 258–264. [Google Scholar] [CrossRef]
- Abou-Taouk, A.; Whiddon, R.; Sigfrid, I.; Eriksson, L.-E. CFD Investigation of Swirl-Stabilized Flexi-Fuel Burner Using Methane-Air Mixture for Gas Turbines. In International Society for Airbreathing Engines, ISABE, Gothenburg; American Institute of Aeronautics and Astronautics Inc.: Reston, VA, USA, 2011; pp. 1–13. [Google Scholar]
- Snow, D.B.; Avery, B.D.; Bodin, L.A.; Htc, L.T.V.; Baldasare, P.; Htc, L.T.V.; Washburn, G.F.; Ktc, L.T. V Nasa Tm. 1974. Available online: https://ntrs.nasa.gov/citations/19740024319 (accessed on 26 May 2024).
- Goldmann, A.; Sauter, W.; Oettinger, M.; Kluge, T.; Schröder, U.; Seume, J.R.; Friedrichs, J.; Dinkelacker, F. A Study on Electrofuels in Aviation. Energies 2018, 11, 392. [Google Scholar] [CrossRef]
- Saravanamuttoo, H.I.H.; Rogers, G.F.C.; Cohen, H. Gas Turbine Theory; Prentice Hall: Hoboken, NJ, USA, 2001; ISBN 9780130158475. [Google Scholar]
- Clean Energy Technologies 2022. Available online: https://doi.org/10.5772/intechopen.102298 (accessed on 26 May 2024).
- Zhang, C.; Hui, X.; Lin, Y.; Sung, C.-J. Recent Development in Studies of Alternative Jet Fuel Combustion: Progress, Challenges, and Opportunities. Renew. Sustain. Energy Rev. 2016, 54, 120–138. [Google Scholar] [CrossRef]
- Hennecke, C. Failure Detection in an Annular Combustion Chamber with Experimental and Numerical Methods. J. Aeronaut. Aerosp. Eng. 2017. Available online: https://www.semanticscholar.org/paper/Failure-Detection-in-an-Annular-Combustion-Chamber-Hennecke-VonderHaar/c0a1888f0cd2fc625dfbce13a0c5cd7b9a363c16 (accessed on 26 May 2024).
- Zeng, W.; Liu, J.; Yu, L.; Ma, H.; Zheng, W. Reaction Kinetic Simulation of the Combustion and Emission Characteristics of a Dual-Fuel Aero-Engine. Fuel 2019, 237, 352–360. [Google Scholar] [CrossRef]
- Benim, A.C.; Iqbal, S.; Meier, W.; Joos, F.; Wiedermann, A. Numerical Investigation of Turbulent Swirling Flames with Validation in a Gas Turbine Model Combustor. Appl. Therm. Eng. 2017, 110, 202–212. [Google Scholar] [CrossRef]
- García-León, R.A.; Perez Rojas, E. Analysis of the Amount of Heat Flow between Cooling Channels in Three Vented Brake Discs. Ing. Univ. 2017, 21, 71–96. [Google Scholar] [CrossRef]
- García-León, R.A.; Afanador-García, N.; Gómez-Camperos, J.A. Numerical Study of Heat Transfer and Speed Air Flow on Performance of an Auto-Ventilated Disc Brake. Fluids 2021, 6, 160. [Google Scholar] [CrossRef]
- Habibi, F.I.; Hartono, F.; Prayogo, H. Optimization of an Annular Combustion Chamber for Micro Turbo Jet System. IOP Conf. Ser. Mater. Sci. Eng. 2019, 645, 12009. [Google Scholar] [CrossRef]
- Tuma, J.; Kubata, J.; Betak, V.; Hybl, R. Experimental and Numerical Research of a Novel Combustion Chamber for Small Gas Turbine Engines. EPJ Web Conf. 2013, 45, 01091. [Google Scholar] [CrossRef]
Disclaimer/Publisher’s Note: The statements, opinions and data contained in all publications are solely those of the individual author(s) and contributor(s) and not of MDPI and/or the editor(s). MDPI and/or the editor(s) disclaim responsibility for any injury to people or property resulting from any ideas, methods, instructions or products referred to in the content. |
© 2024 by the authors. Licensee MDPI, Basel, Switzerland. This article is an open access article distributed under the terms and conditions of the Creative Commons Attribution (CC BY) license (https://creativecommons.org/licenses/by/4.0/).

