Article

Interrupter Technique Revisited: Building an Experimental Mechanical Ventilator to Assess Respiratory Mechanics in Large Animals
1
Dipartimento di Fisiopatologia Medico Chirurgica e dei Trapianti, Università degli Studi di Milano, 20133 Milan, Italy
2
Intensive Care Unit, 1st Department of Respiratory Medicine, Medical School, National and Kapodistrian University of Athens, Thoracic Diseases General Hospital of Athens ‘Sotiria’, 11527 Athens, Greece
*
Author to whom correspondence should be addressed.
Fluids 2024, 9(6), 142; https://doi.org/10.3390/fluids9060142
Submission received: 9 April 2024 / Revised: 1 June 2024 / Accepted: 8 June 2024 / Published: 14 June 2024
(This article belongs to the Special Issue Respiratory Flows)

Abstract

:
Large animals are increasingly used as experimental models of respiratory diseases. Precise characterization of respiratory mechanics requires dedicated equipment with specific characteristics which are difficult to find together in the same commercial device. In this work, we describe building and validation of a computer-controlled ventilator able to perform rapid airways occlusions during constant flow inflations followed by a prolonged inspiratory hold. A constant airflow is provided by a high pressure source (5 atm) connected to the breathing circuit by three proportional valves. The combined action of three 2-way valves produces the phases of the breath. During non-inspiratory breath phases, airflow is diverted to a flowmeter for precise feedback regulation of the proportional valves. A computer interface enables the user to change the breathing pattern, trigger test breaths or run predetermined breaths sequences. A respiratory system model was used to test the ability of the ventilator to correctly estimate interrupter resistance. The ventilator was able to produce a wide range of constant flows (0.1–1.6 L/s) with the selected timing. Errors in the measurement of interrupter resistance were small (1 ± 5% of the reference value). The device described reliably estimated interrupter resistance and can be useful as a measuring tool in large animal research.

1. Introduction

Large animals, like sheep and pigs, are frequently used as experimental models of respiratory diseases, such as acute lung injury, emphysema and asthma [1,2,3]. In many instances, the functional impact of the disease and the effect of a therapeutic intervention require precise characterization of the mechanics of the respiratory system and of its parts, i.e., lungs and chest wall.

1.1. Techniques for Assessment of Respiratory Mechanics in Large Animals

Different techniques for assessing respiratory mechanics in large animals have been described.
The least squares fit (LSF) method was originally developed for spontaneous breathing [4,5], but can be readily applied during mechanical ventilation [6]. On the assumption that the respiratory system behaves similarly to a dashpot in parallel with a spring, respiratory compliance and resistance can be obtained as the values which minimize the difference between measured driving pressure and that calculated from measured flow and volume according to the dashpot-spring model [4,5,6]. This approach can be implemented with a commercial mechanical ventilator, but the mechanical description it provides is limited, as it implicitly neglects respiratory system viscoelasticity.
The forced oscillation technique (FOT) has been successfully used during mechanical ventilation. In essence, it consists of the application of a pressure (or flow) wave to the respiratory system, and of the measurement of the system response in terms of flow (or pressure) [7]. Although FOT application during mechanical ventilation is technically challenging [7], suited commercial devices are available for laboratory use, but only for small or medium-sized animals [8].
The static and quasi-static properties of the respiratory system and of its parts can be characterized using the super syringe method, which consists of a large syringe driven by a piston able to inflate or deflate the respiratory system in steps or continuously, at fixed velocity. This method requires disconnection of the anesthetized and paralyzed subject from the mechanical ventilator and availability of custom-made equipment [9].
Another technique which allows a comprehensive assessment of respiratory mechanics during positive-pressure mechanical ventilation is the rapid airway end-inspiratory occlusion method [10]. As the ventilator described in this work is based on this technique, the rapid airway end-inspiratory occlusion method will be described here in some detail.
Flow and pressure (Paw) are measured at airway opening, immediately before the entrance of the endotracheal tube, and volume is obtained by numerical integration of the flow. During the inspiration, the respiratory system is inflated with a constant flow (Figure 1).
Inspiration is then rapidly interrupted by the closure of the inspiratory valve of the ventilator, and pressure suddenly drops from Pmax,aw to P1,aw (panel B, Figure 1). Interrupter resistance (Rint) can be calculated as
R int = P max , aw P 1 , aw F ei
where Fei is flow immediately before airway occlusion.
In the respiratory system, Rint originates mainly from viscous pressure losses in the airways [11], with a smaller contribution from chest wall tissues [12].
During the post-inspiratory pause, Paw slowly declines from P1,aw to Pst,aw (panel B, Figure 1). In line of principle, the slow Paw decay during the post-inspiratory pause may reflect two different phenomena: on one hand pendelluft, that is pressure equilibration between units with different time-constants, and on the other stress–relaxation, deriving from the viscoelastic properties of lung and chest-wall tissues. In healthy animals, the contribution of pendelluft to Paw decay is negligible [13,14], and P1,aw − Pst,aw is thought to reflect the viscoelastic properties of lung and chest wall tissues. Stress–relaxation can be quantified in terms of additional resistance (ΔR):
Δ R = P 1 , aw P st , aw F ei
Finally, the quasi-static elastance of the respiratory system (Est) can be calculated as follows:
E st = P st , aw P ee , aw V T
where Pee,aw is Paw at the end of the expiration, and VT is the tidal volume used for the inflation.
Due to an excessive rise of airway resistance relative to the duration of the expiration, in patients with respiratory diseases deflation may be incomplete, and end-expiratory volume may be greater than equilibrium volume, so that the alveolar pressure immediately before the subsequent inspiration is greater than that at the airway opening, reflecting the inward recoil of the respiratory system. This pressure has been named intrinsic positive end-expiratory pressure (PEEPi), and it is usually caused by tidal expiratory flow-limitation, a frequent occurrence not only in the presence of chronic obstructive pulmonary disease [15,16], but also in acute respiratory failure patients ventilated at low PEEP [17,18]. If iPEEP is present, its value should be substituted to Pee,aw in order to calculate Est [19,20].
Additional information can be gathered by combining several maneuvers of the type described in sequences.
Production of isovolume sequences (i.e., breaths with the same VT but different inspiratory durations (TI) and flows) allows a thorough characterization of the resistive properties of the respiratory system in terms of flow-Rint relation. This relation should be studied at isovolume because of the known volume dependence of resistance [21].
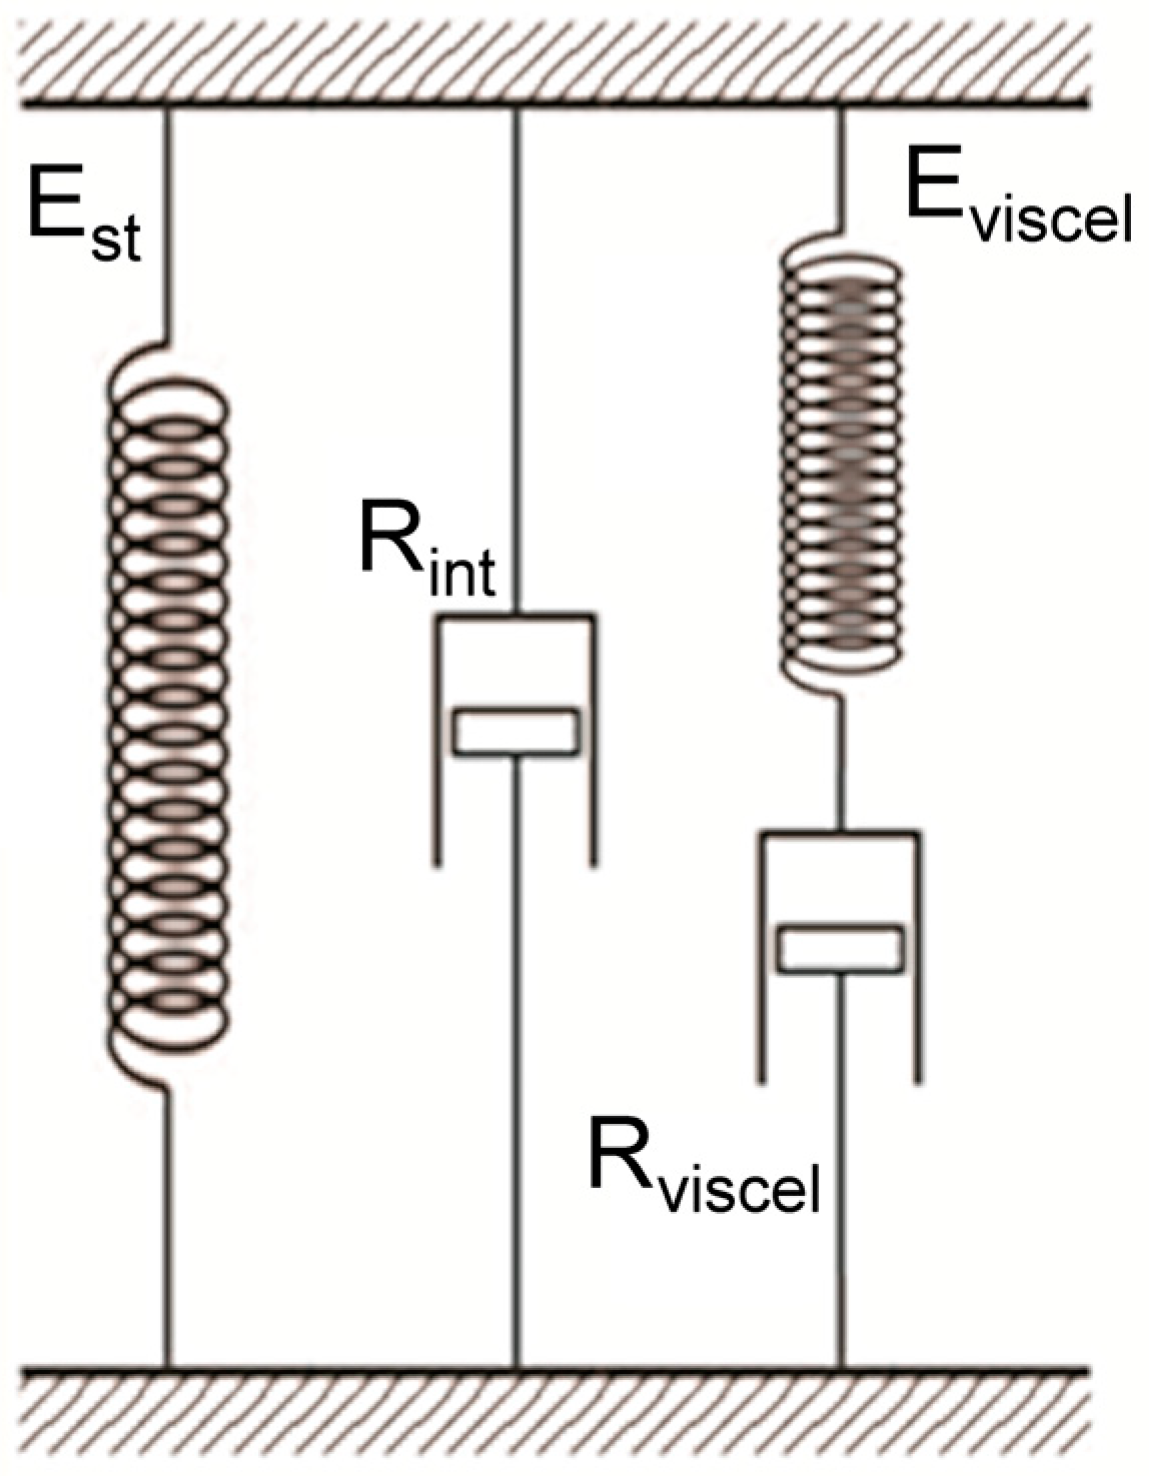
Additionally, isovolume sequences allow to further characterize respiratory system viscoelasticity. On the assumption that the viscoelastic characteristics of lung and chest-wall can be modeled as a Maxwell body, that is a dashpot (with viscoelastic resistance Rviscel) in series with a spring (with viscoelastic elastance Eviscel) (Figure 2), Rviscel and Eviscel can be obtained by interpolating the relation between TI and ΔR with the following equation:
Δ R = R viscel 1 e T I τ viscel
where τviscel, the viscoelastic time constant, is the ratio between Rviscel and Eviscel.
Figure 2. The figure shows a mechanical analogue of the whole respiratory system, composed by four mechanical elements [22]: a spring, representing quasi-static elastance (Est), is in parallel with a dashpot, representing interrupter resistance (Rint) and a Maxwell body. The Maxwell body accounts for the viscoelastic properties of the respiratory system and is made by a spring (Eviscel) in series with another dashpot (Rviscel). The total force exerted by the model is the sum of the forces exerted by all the elements in parallel, as the total pressure difference across the whole respiratory system is the sum of quasi-static elastic pressure, resistive pressure and viscoelastic pressure.
Fluids 09 00142 g002
On the other hand, the production of isoflow series (i.e., breaths with the same flow but different inspiratory durations (TI) and VT) allows the study of the quasi-static elastic characteristics in the whole inspiratory capacity range [9].

1.2. Measurements Implementation in the Laboratory Setting

All the techniques described have advantages and drawbacks, described in [7,9,10]. Their application in large animals is problematic due to the lack of specific commercial equipment.
In this study, we describe a programmable, computer-controlled positive pressure mechanical ventilator able to characterize respiratory system mechanics of large animals. We chose to implement the rapid airway end-inspiratory occlusion method as it allows to combine, in a single machine, the normal operation of a mechanical ventilator together with that of a measuring instrument which offers a good characterization of both the static and dynamic mechanical properties of the system [10].
In line of principle, a commercial mechanical ventilator for humans can be used to this purpose; however, this approach is not without drawbacks. The level of accuracy and precision of the pressure and flow transducers used by commercial mechanical ventilators is enough for clinical purposes, but may be not sufficient in an experimental setting [23], therefore additional transducers should be added to the setup [24,25]. Moreover, if the speed of the inspiratory valve of the ventilator is not sufficient, rapid valves should be inserted in the circuit [12,26]. Finally, only a limited number of respiratory maneuvers are usually available in commercial ventilators. Most of the commercial devices have buttons to introduce in the breathing pattern a post-inspiratory pause (for measurement of static recoil) or a post-expiratory pause (for measurement of PEEPi), but, in addition to that, changing more than one breathing pattern parameter at a time can be impossible due to precautionary measures. This makes the production of isovolume and isoflow sequences difficult, time-consuming and extremely tedious.
These problems have been overcome by building and validating a large animal ventilator specifically designed for the rapid airway end-inspiratory occlusion method. Programmable, custom-made ventilators have been already described [27,28], but these devices were not designed specifically for the rapid airway end-inspiratory occlusion method. Our ventilator integrates laboratory-grade sensors, and it allows the user to perform ventilator maneuvers well beyond the capability of a commercial ventilator. More importantly, sequences of maneuvers are easily programmable, reducing both the effort of the operator and the possibility of errors. Validation will focus on dynamic measurements (Rint and ΔR), as measurement of Est, a static parameter, is limited by the performance of the transducers only, while assessment of Rint and ΔR is highly dependent on the proper functioning of the ventilator, especially in the pathological condition of the respiratory system [29].

2. Materials and Methods

2.1. Description of the Ventilator

2.1.1. Principle of Operation

The ventilator is based on the same principle of operation which has been successfully used to build prototypes for smaller animals, namely rats [30,31] and rabbits [32]. Practically, a high pressure source (5 atm) is connected in series with the breathing circuit through a proportional valves group. The breathing circuit is made by three 2-way valves (inspiratory, expiratory and exhaust valve), which produce the different phases of the breathing cycle (inspiration, post-inspiratory pause, expiration, post-expiratory pause). During non-inspiratory phases, the flow to be delivered to the animal in the next inspiration is finely regulated on the basis of a feedback signal from a control flowmeter in series with the exhaust valve.
This design solves the problem of delivering a constant, load-independent flow to the animal. Briefly, let Pupstream be the pressure at the high pressure source and Paw the pressure at airway opening during the inflation, and let Rprop be the resistance offered by the proportional valves, Rbc the resistance offered by the breathing circuit and Rrs the resistance offered by the respiratory system of the animal. During inflation, Pupstream, Rprop, and Rbc are constants, while Paw and Rrs are variable. At each instant during the inflation, we have the following:
F = P upstream P aw R prop + R bc + R rs
The rise of Paw during the inflation tends to decrease the driving pressure and to reduce the flow; however, as Rprop >> Rrs, and Pupstream >> Paw, the decrease in flow during the inflation is trivial. For example, if Pupstream is 5 atm (~5000 cmH2O) and Rprop is ~3000 cmH2O s L−1, when Paw increases during inflation from 0 to 40 cmH2O, with a Rrs of 5 cmH2O s L−1, flow decreases by just less than 1%.

2.1.2. Hardware

A schematic drawing of the ventilator is shown in Figure 3.
Filtered compressed air is delivered to 3 proportional electrovalves in parallel (DV-PM-10-5000-73-V, Clippard, Cincinnati, OH, USA). The common outlet of the proportional valves is connected with a T-piece, from which air can flow either though the exhaust solenoid 2-way valve (72P9DGM, Peter Paul Electronics, New Britain, CT, USA) in series with the control flowmeter, or to two manual 3-way stopcocks, allowing the inclusion or the exclusion of the humidifier into the inspiratory line. The inspiratory solenoid 2-way valve (71P9ZGM, Peter Paul Electronics, New Britain, CT, USA) is in turn in series with a second T-piece, connected to the expiratory solenoid 2-way valve (72B11DGM, Peter Paul Electronics, New Britain, CT, USA) and to the test flowmeter, which will be in series with the animal. The exhaust and expiratory valves are normally closed, while the inspiratory is normally open.
The expiratory port of the ventilator is connected with two manual 3-way stopcocks, allowing the connection of the animal to the ambient, or to a drum where the pressure can be adjusted to positive values (to produce positive end-expiratory pressure), or to a second tank in which the pressure can be adjusted to negative values, both by means of flow-through systems.
The humidifier consists of a plexiglass chamber (19.7 × 8.1 × 5.0 cm) containing polyurethane foam semi-immersed in distilled water. During operation air flows on water surface, without bubbling. This system, although less efficient than a bubbling device in terms of humidification, adds minimal noise to the flow signal.
Flow is measured with Fleisch flowmeters (no. 3) coupled with differential pressure transducers (DP45 Validyne; Northridge, CA, USA, or model 270, Hewlett-Packard, Palo Alto, CA, USA) connected to 13-4615-35 carrier amplifiers (Gould Electronics, Valley View, OH, USA). Pressures are measured with 8507C-2 transducers (Endevco, San Juan Capistrano, CA, USA) connected to 13-4615-58 universal amplifiers (Gould Electronics, Valley View, OH, USA). Valves are operated by a DAQ card (PCI 6035E, National Instruments, Austin, TX, USA) via a custom-built power supply, which provides 12VDC for 2-way valves and 0–10 VDC for the proportional valves. The DAQ card also receives the control flow signal (for feedback regulation of the flow) and Paw signal (to stop inhalation if a safety threshold is exceeded) from the amplifiers. The PCI 6035E is controlled by a custom-built LabView program (version 6, National Instruments, Austin, TX, USA) with a user-friendly interface (see 2.1.4. Software).

2.1.3. Production of the Breathing Pattern

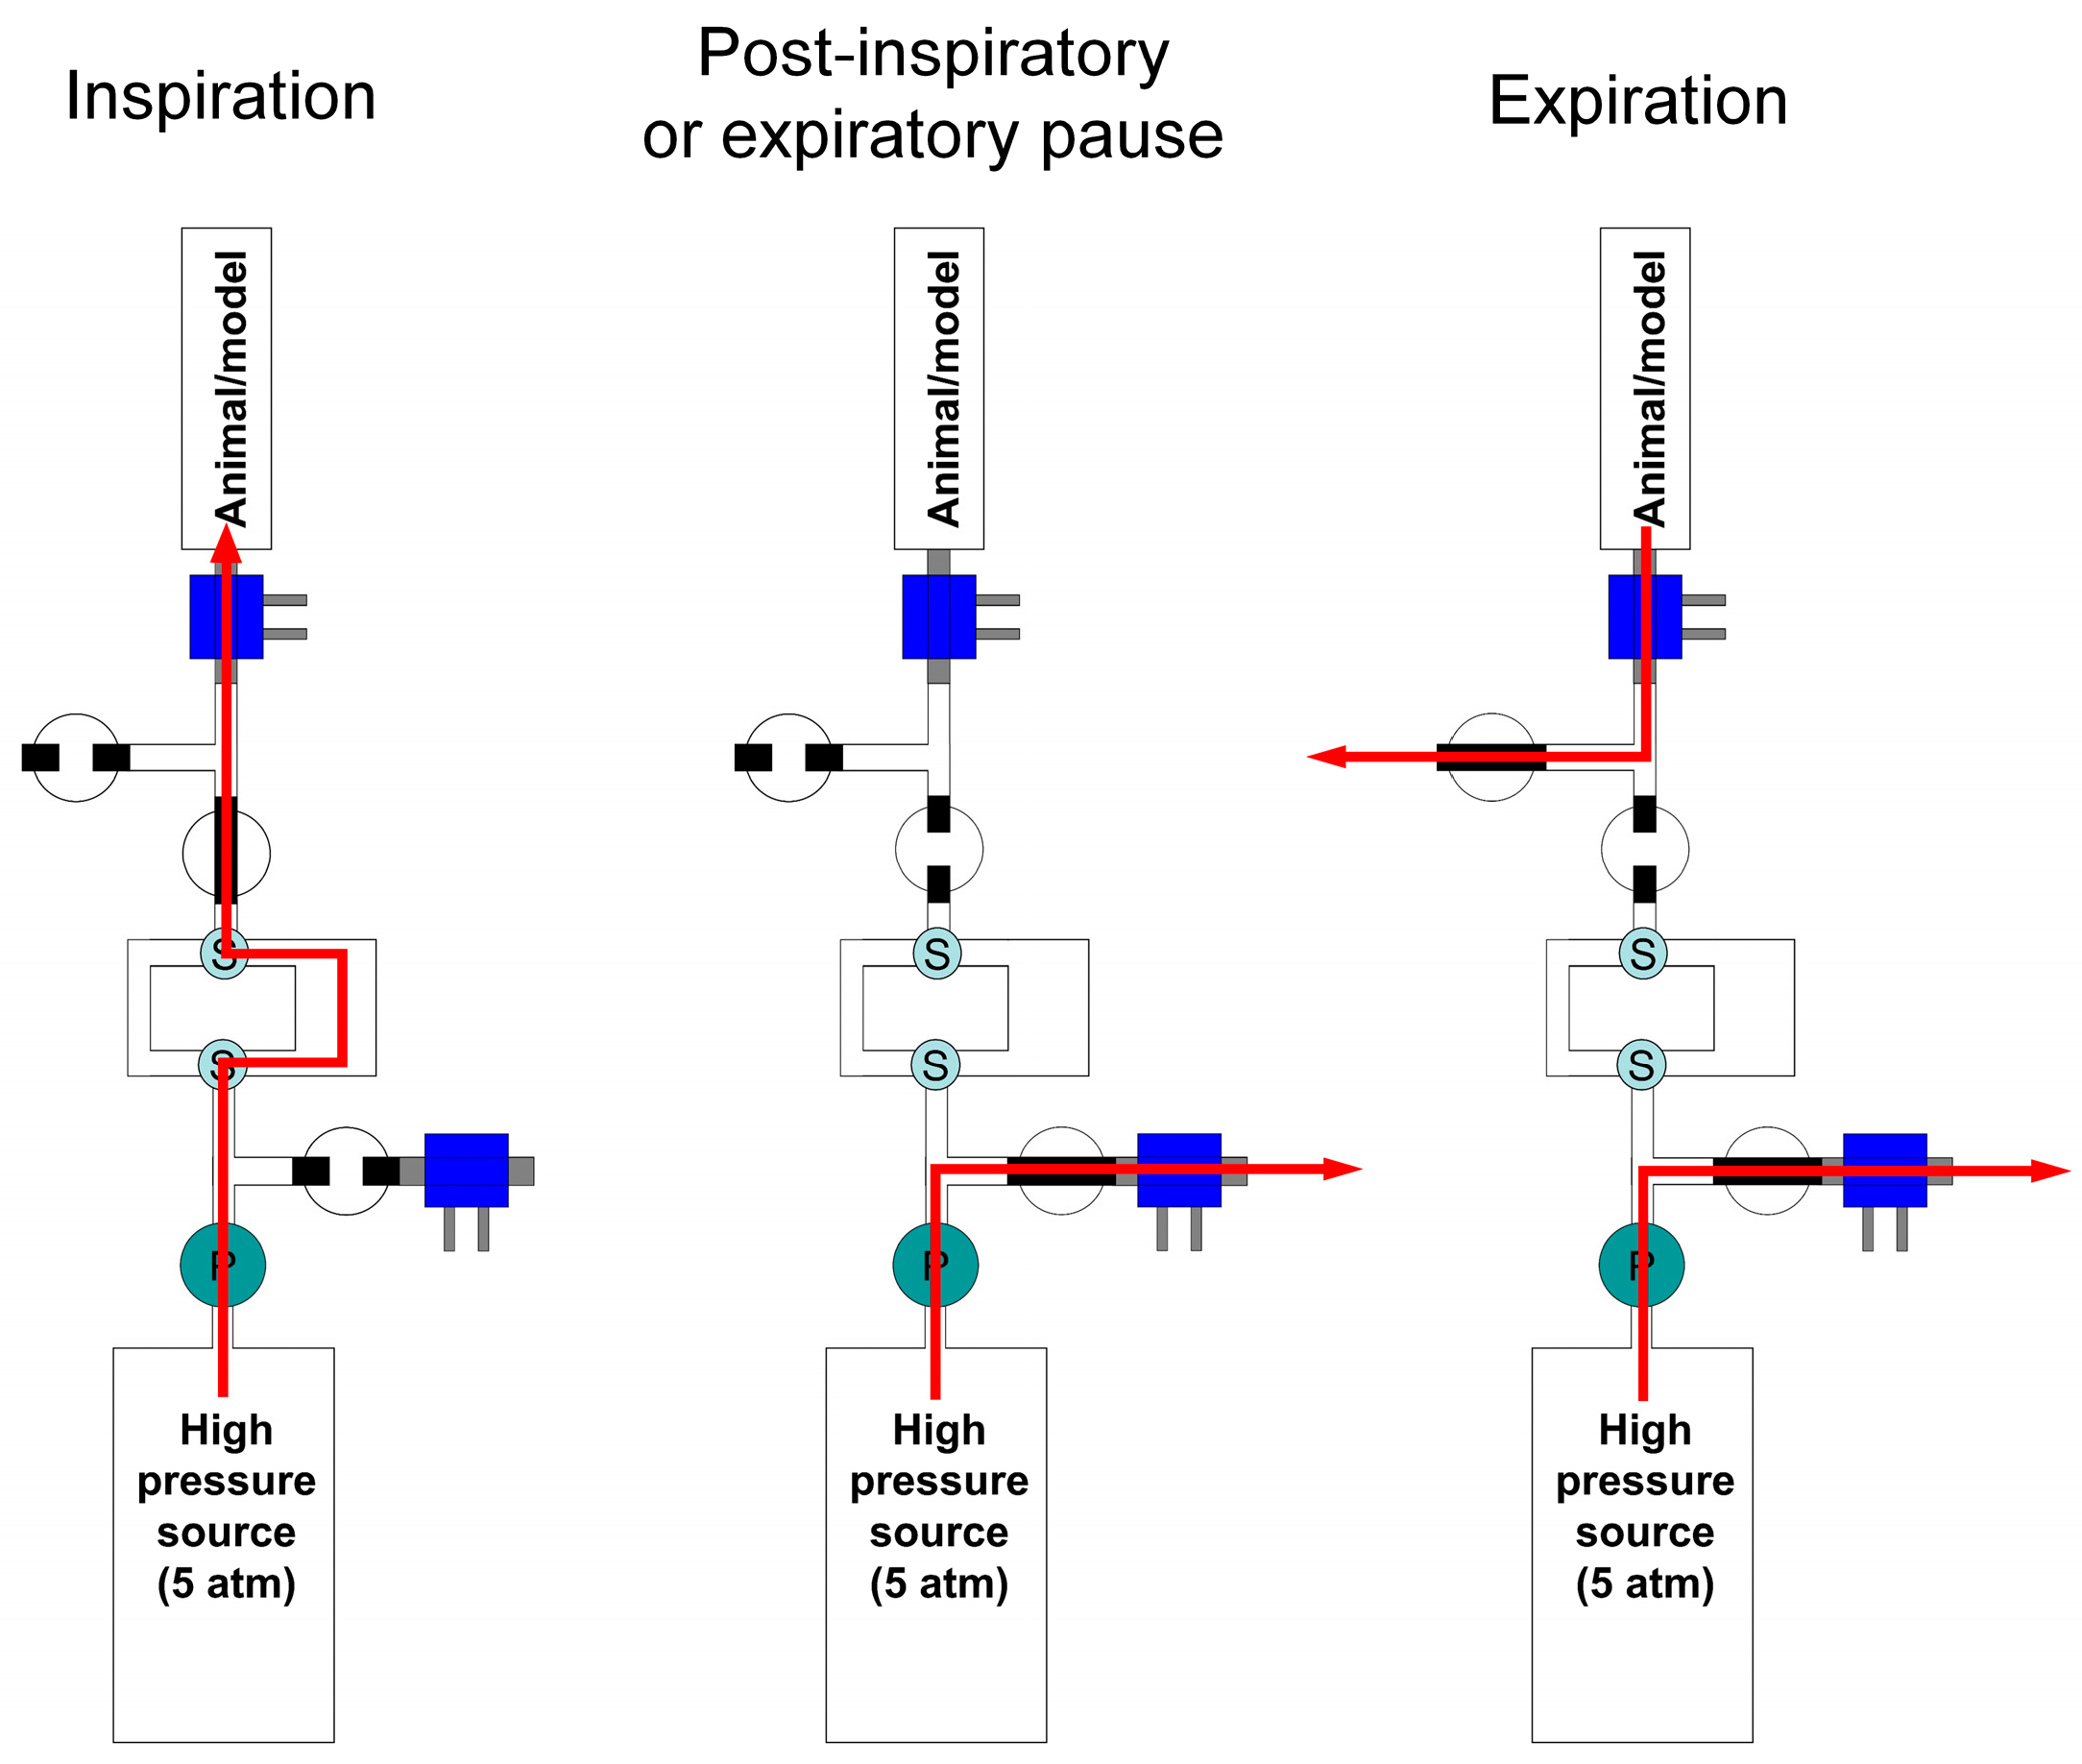
The different phases of the breathing cycle are shown in Figure 4.
During inspiration, the inspiratory valve is open, while the exhaust and expiratory valves are closed. Air flows from the high pressure source through the proportional valves and the inspiratory valve into the animal. Paw is measured continuously (with a sampling frequency of 200 Hz) and compared to a safety threshold. If the safety threshold is exceeded, the ventilator automatically switches to the next non-inspiratory phase to avoid barotrauma.
During the post-inspiratory or expiratory pause, inspiratory and expiratory valves are closed, and the exhaust valve is open, letting air flow through the control flowmeter. During this phase, the voltage to proportional valves is controlled in two steps: (a) initially, if the flow is to be changed relative to the previous inspiration, by a feedforward regulation based on previous proportional valves calibration, and (b) later, with a feedback mechanism based on the signal from the control flowmeter, enabling precise flow adjustment for the subsequent inspiration despite of proportional valves hysteresis.
During expiration, the inspiratory valve is closed and the exhaust and expiratory valves are open, allowing air to flow from the animal to the expiratory port of the ventilator. Feedforward and feedback regulation of proportional valves take place similarly as in the post-inspiratory or expiratory pause.
In order to coordinate opening and closing of the different valves during the transition from a breath phase to another, the delays of each 2-way valve have been measured applying a constant pressure (10–50 cmH2O) at the inlet of the valve and recording the flow at the outlet together with the command signal from the PCI 6035E while the valve was switched on and off. This information has been integrated in the control software in order to adjust command signals to each valve during the transition from one breath phase to another, taking into account the effective time needed for a valve to change state.

2.1.4. Software

A custom-built LabView program controls 2-way and proportional valves, and allows the operator to enter (a) the calibration factors for the control flowmeter and for airway pressure, (b) the calibration factors of the proportional valves, (c) the delays of the 2-way valves, and (d) the parameters of feedforward and feedback regulation. Acquisition of the offsets of Paw and control flow is made when the ventilator is running, the former at a specific command, the latter automatically when a breath with TI > 2.5 s is performed. The operator should specify the breathing pattern which will be generated by the ventilator in the absence of other commands. While the ventilator is operating, the user can generate the test breaths which can be delivered individually or as sequences. The operator can also pause the ventilator, which will stop at the end of the next expiratory phase.

2.2. Data Acquisition

All signals, including activation/deactivation command signals to the inspiratory and exhaust valves produced by the PCI 6035E DAQ card, have been recorded at 1000 Hz by 16-bit DAQ Card (NI PCIe-6361, National Instruments, Austin, TX, USA) and analyzed with custom-built programs offline. Volume has been obtained by numerical integration of the flow signal.
Water saturation of the air delivered by the ventilator has been measured with a humidity probe (DKRF473, Driesen + Kern GmbH, Bad Bramstedt, Germany).

2.3. Validation Procedure

To validate the ventilator, we used a pneumatic model of the respiratory system made by an artificial trachea (a plexiglass cylinder with 2.1 cm internal diameter), two interchangeable resistances, and a rubber balloon surrounded by a plastic envelope. The resistances were built by filling a plexiglass cylinder with a variable number of capillary tubes (internal diameter ~1.4 mm) in parallel. Because of the different number of capillary tubes in parallel, one resistance (higher resistance, HR) offered more resistance than the other (lower resistance, LR). The ventilator was connected to the model either via a n°10 endotracheal tube, as it will be performed with the animal, or via a direct connection. Pressure was measured through a lateral port between the test flowmeter and the endotracheal tube or between the flowmeter and the connector (Paw). Pressure was also simultaneously measured inside the rubber balloon (Pbal).
In the absence of intrinsic resistive behavior of the rubber balloon, the pressure difference Paw − Pbal reflects the resistance of all elements in series between the two sites where Paw and Pbal are sampled, and can be used, together with the corresponding flow, in order to assess the reference resistance (Rref) to which the value measured with interrupter technique can be compared. Practically, Paw, Pbal, and flow were measured between 15 and 5 ms before Pmax,aw ( P ¯ 5 15 , aw , P ¯ 5 15 , bal , and F ¯ 5 15 , respectively), so that
R ref = P ¯ 5 15 , aw P ¯ 5 15 , bal F ¯ 5 15
In the same line of reasoning, reference additional resistance (ΔRref) was assessed as the difference between the pressure inside the balloon at the instant of Pmax,aw (Pbal at Pmax,aw) and at the end of the post-inspiratory pause (Pst,bal), divided by end-inspiratory flow, as shown by the following equation:
Δ R ref = P bal at P max , aw P st , bal F ¯ 5 15
Baseline ventilation consisted of VT 0.4 L, TI 1.0 s, duration of the post-inspiratory pause (TpIp) 0.3 s, duration of expiration (TE) 1.5 s.
Three isovolume sequences were produced with or without the endotracheal tube, with LR or HR, at two levels of positive end-expiratory pressure (PEEP, 1 and 15 cmH2O). Each sequence was made by seven test breaths characterized by the same VT and TE as in baseline ventilation, TI between 0.25 and 3.0 s, TpIp 5 s. During all recordings the humidifier was included in the inspiratory line to simulate the real configuration during animal experiments.
Data were analyzed offline. For each condition, the three breaths with the same TI and flow were ensemble averaged in order to reduce the noise. For each breath, a custom-built LabView program allowed the measurement of TI, TpIp, TE, VT, Pee,aw, Pmax,aw, P1,aw (see below), Pst,aw, Fei, P ¯ 5 15 , aw , P ¯ 5 15 , bal , F ¯ 5 15 , Pbal at Pmax,aw and Pst,bal.
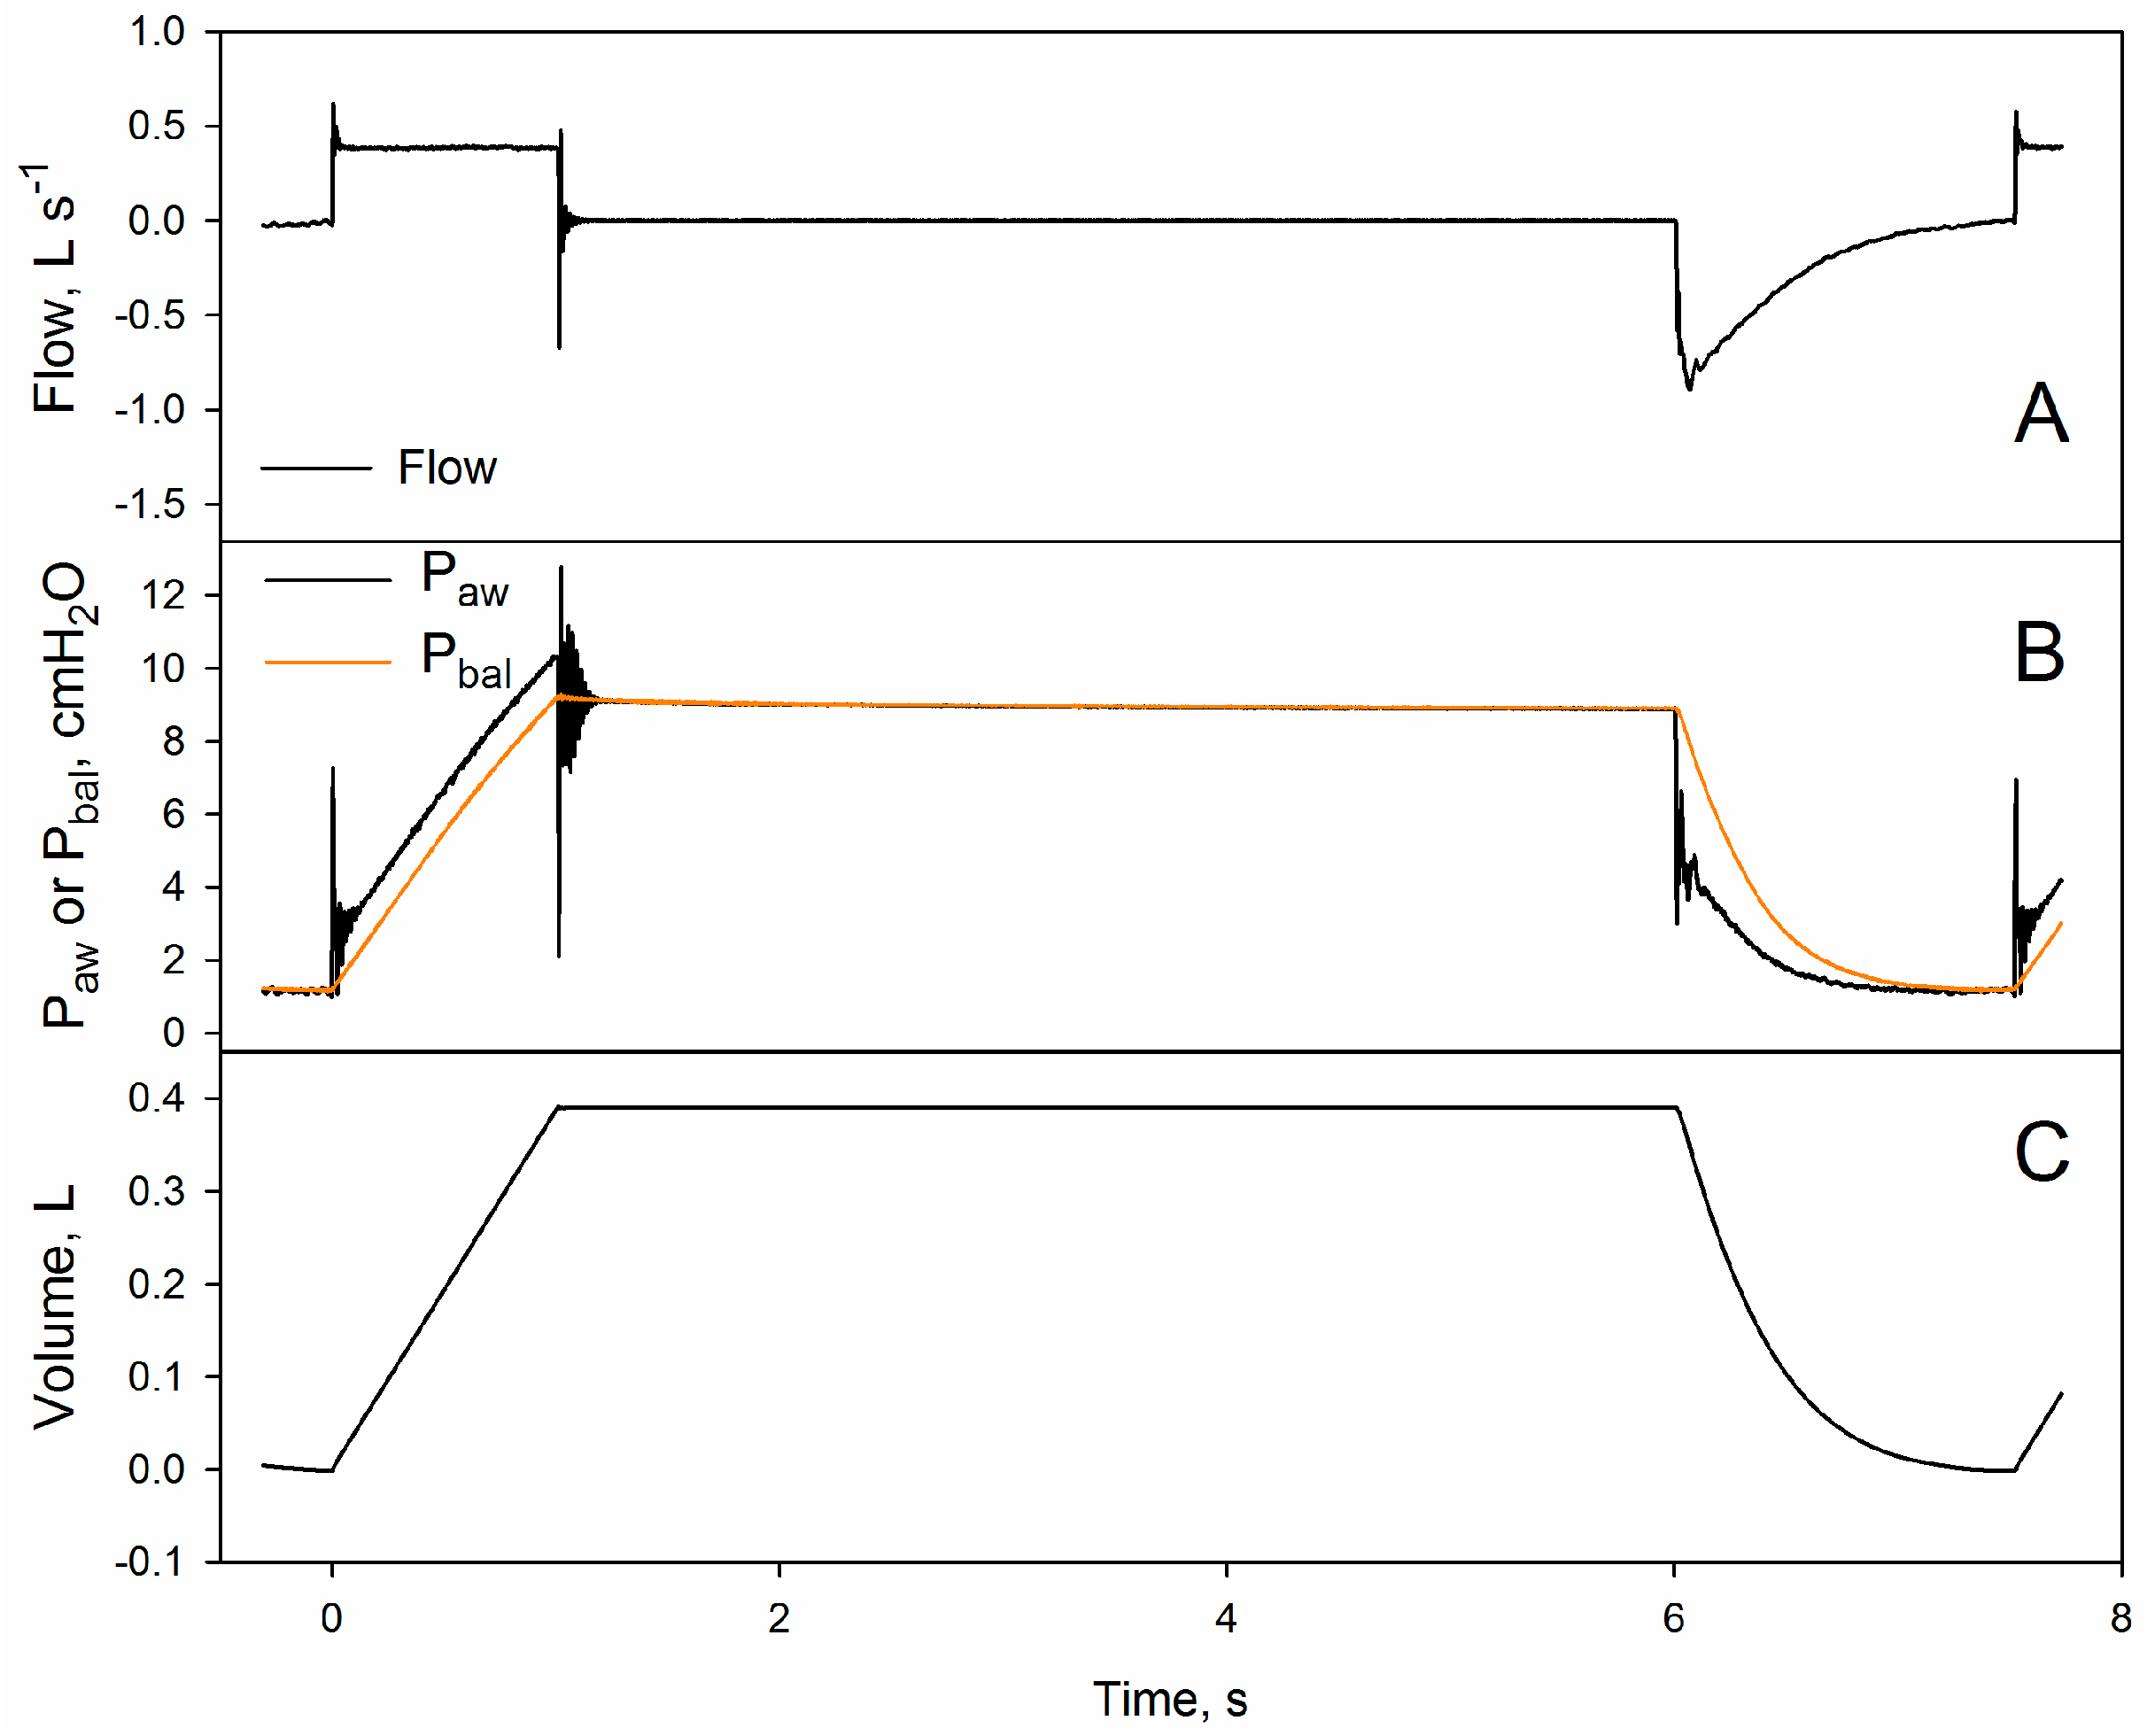
As shown in Figure 5, sudden interruption of the flow produces oscillations which prevent the direct identification of P1,aw.
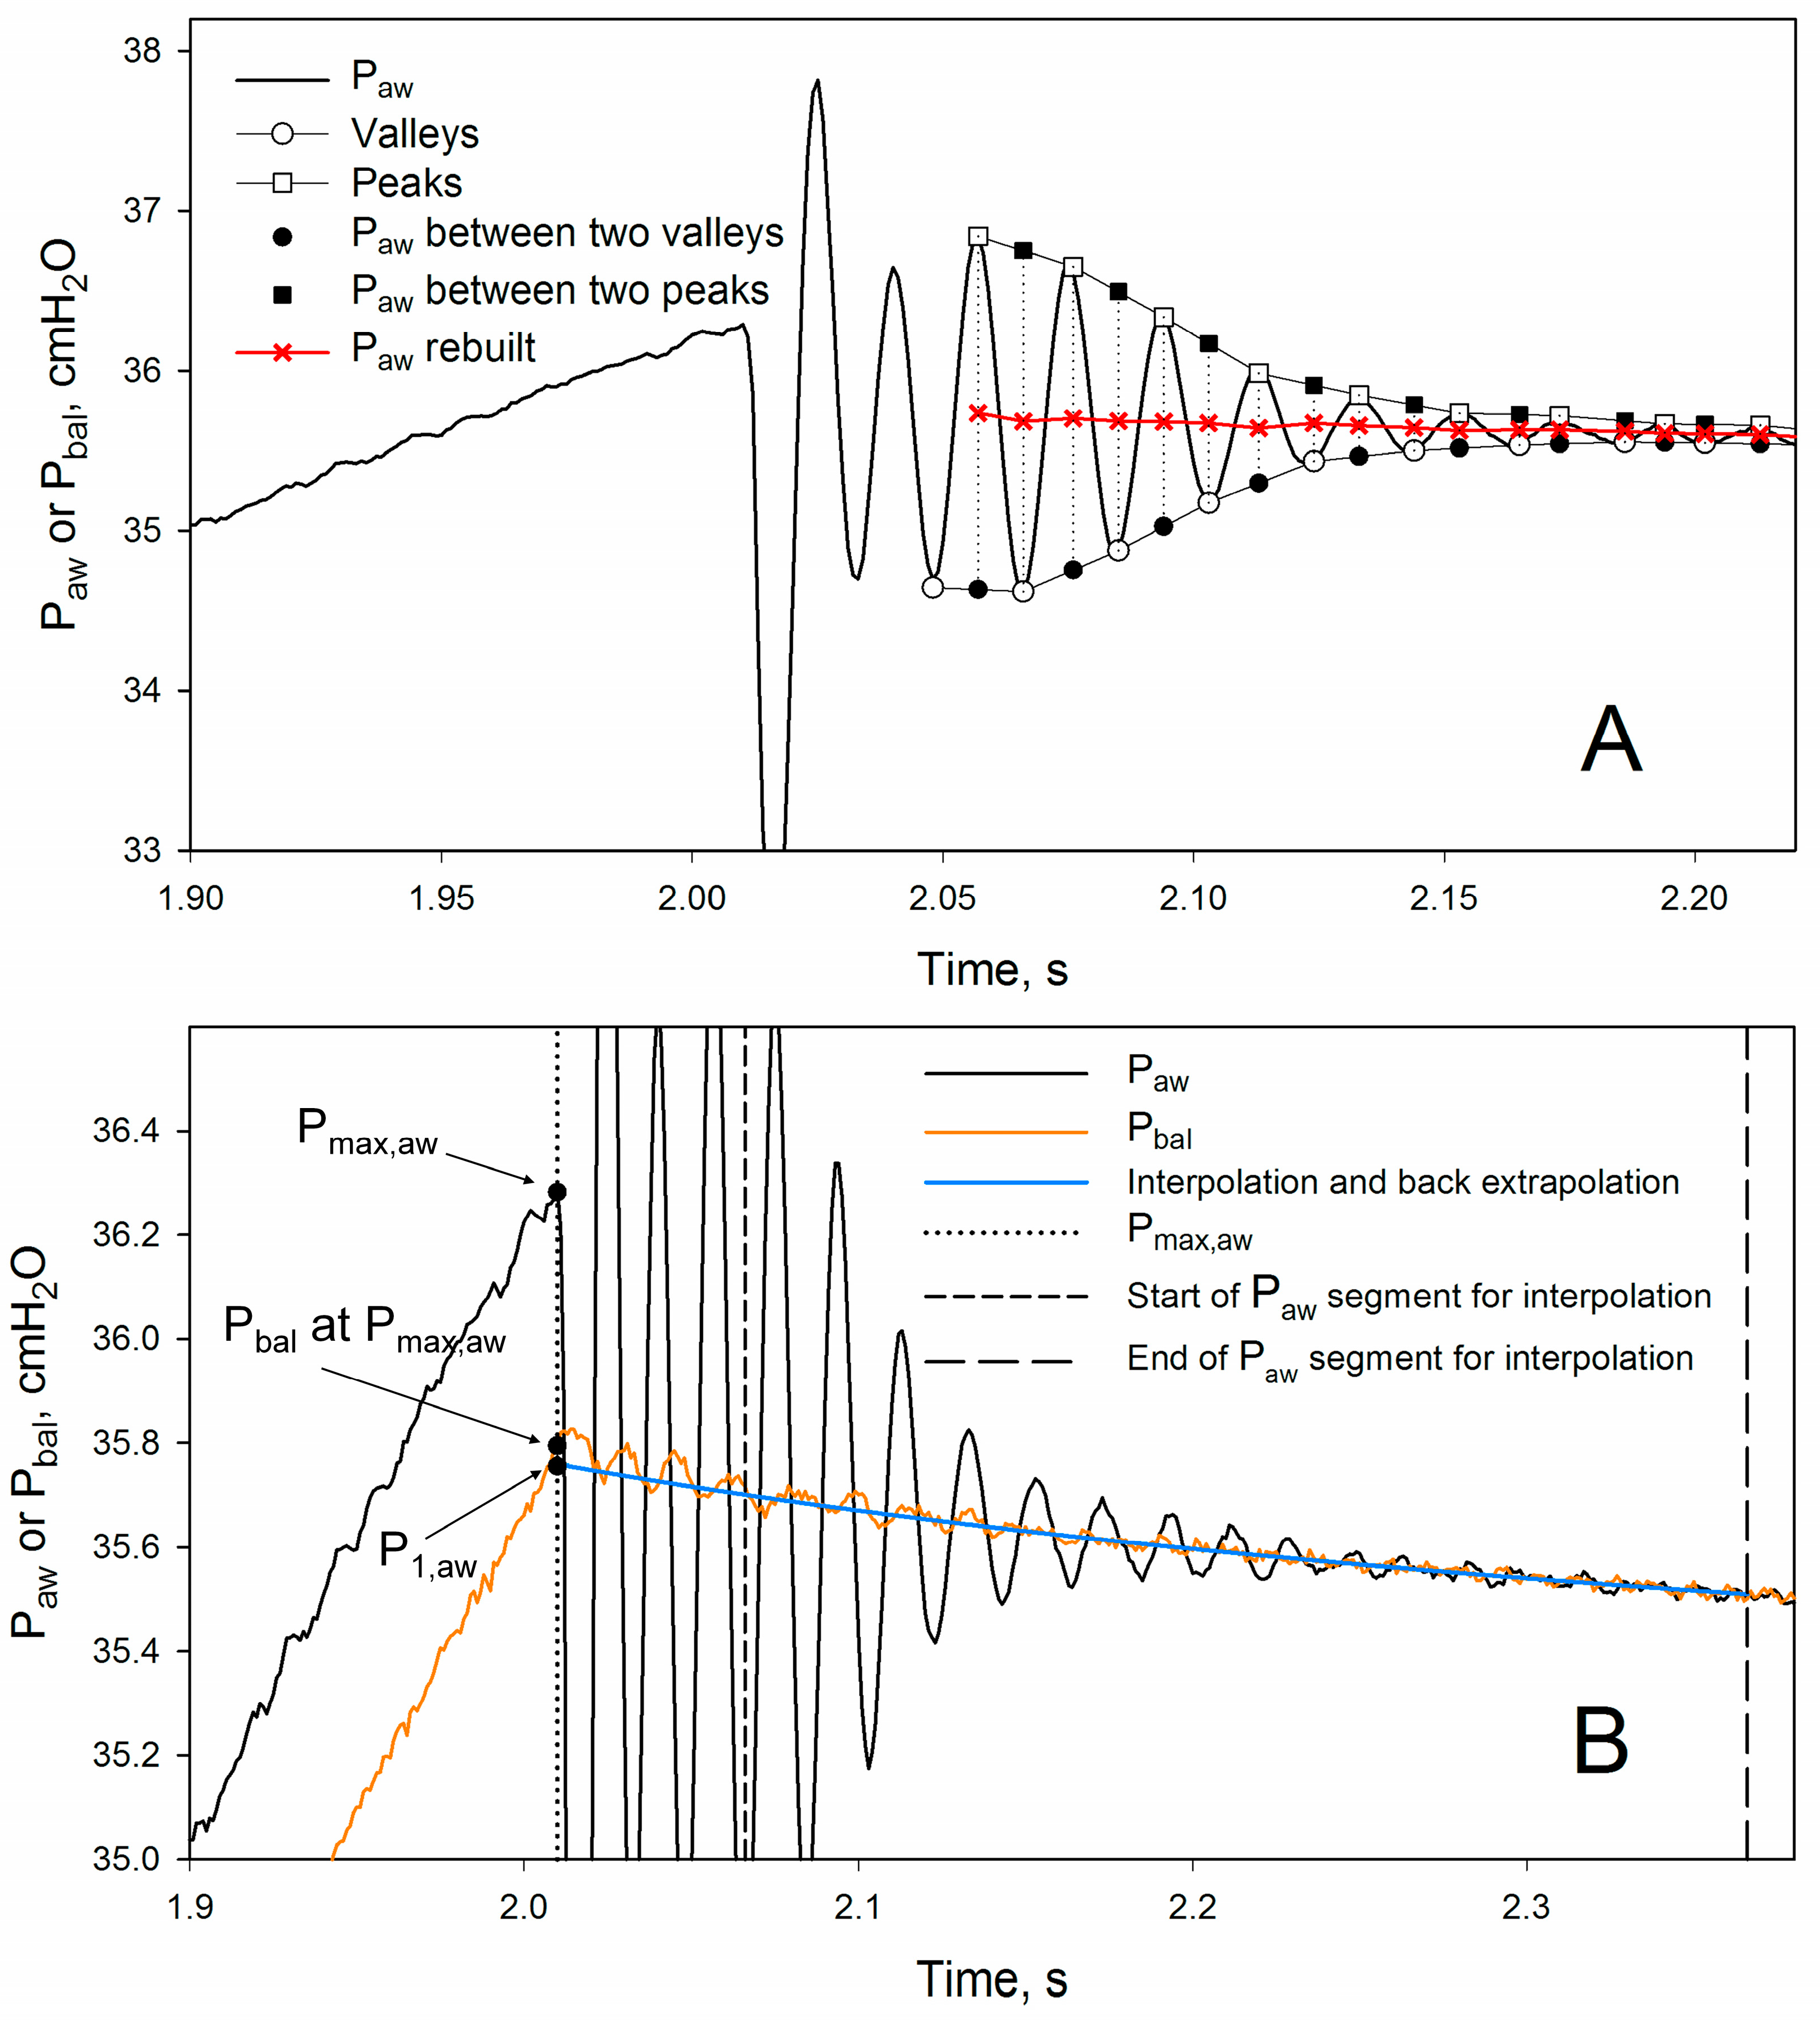
This problem is usually circumvented by interpolation of a small segment of the Paw decay immediately after the oscillations, and by back-extrapolating the interpolating function to the time of Pmax,aw [29]. With this technique, estimation of P1,aw is better the smaller the time-interval between Pmax,aw and the beginning of the Paw segment used for interpolation is. To reduce this time interval, we attempted to eliminate part of the oscillation with the procedure illustrated by Figure 6, panel A.
The first three oscillations of the artifact were discarded, because they were not symmetrical. For all remaining oscillations, peaks and valleys were identified (white squares and dots in Figure 6, respectively). Each pair of two consecutive peaks was interpolated and the values of the interpolating lines at the time of the valleys in between (black squares) were calculated. The pressures existing in the absence of the artifact at those instants were calculated as the averages of the calculated values and the relative valleys (crosses). The same procedure was performed on each pair of consecutive valleys and peaks in between. The rebuilt segment was resampled by linear interpolation at 1000 Hz and substituted with the original Paw tracing. This procedure allowed to anticipate the start of the segment to be interpolated, and consequently to reduce the distance covered by the back-extrapolation to Pmax,aw, which amounted to 55 ± 1 ms in all conditions (Figure 6, panel B).
Once data were collected, Rint and calculated according to Equation (1), and ΔR, calculated according to Equation (2), were compared with their reference values (see Equations (6) and (7)).

2.4. Statistical Methods

Analyses were performed using SPSS 29 (SPSS Inc., Chicago, IL, USA), and Sigmaplot 12.5 (Systat Software Inc., San Jose, CA, USA).
Analysis of variance was used to detect differences among experimental conditions. Relationships between variables were assessed by means of linear or nonlinear regression analysis. Agreement between measured and reference values was evaluated using Bland–Altman plots. Results are given as mean ± SD (standard deviation). The level for statistical significance was taken at p < 0.05.

3. Results

3.1. Technical Characteristics

The ventilator was able to reproduce the breathing pattern set through the operator interface. The average difference between set and measured values of TI, TpIp, TE, VT were 9 ± 6 ms, −8 ± 1 ms, 17 ± 3 ms and 12 ± 24 mL. The greater error in TE probably depends on the fact that the program controlling the ventilator performs most of the operations necessary to produce the next breath at the end of the expiration.
Insertion of the humidifier in the inspiratory line did not enhance noise in inspiratory flow, and caused water saturation of air delivered by the ventilator to rise from 18 ± 1 to 58 ± 8%. Warming of the humidifier to ~38°C increased saturation further to 95 ± 1%. With the addition of the humidifier, the acoustic compliance of the circuit of the ventilator between the inspiratory, exhaust and proportional valves rose from 0.07 to 0.42 mL cmH2O−1, corresponding to a volume increase in the same compartment from 69 to 427 mL, requiring some adjustments of the feedback parameters.

3.2. Validation

At PEEP1, balloon volume and elastance (Est) were 0.88 ± 0.04 L and 19 ± 2 cmH2O L−1, respectively. These parameters increased with PEEP15 application to 2.04 ± 0.03 L and 57 ± 6 cmH2O L−1, respectively.
Depending on the flow, Rref ranged between 2 and 6 cmH2O s L−1 in the presence of the endotracheal tube (blue circles, panels A and B, Figure 7), and between 2 and 3 cmH2O s L−1 in the absence of it (blue circles, panels C and D, Figure 7). The difference between HR and LR was rather small, amounting to 0.2–0.4 cmH2O s L−1. PEEP level had no effect on Rref (P > 0.168).
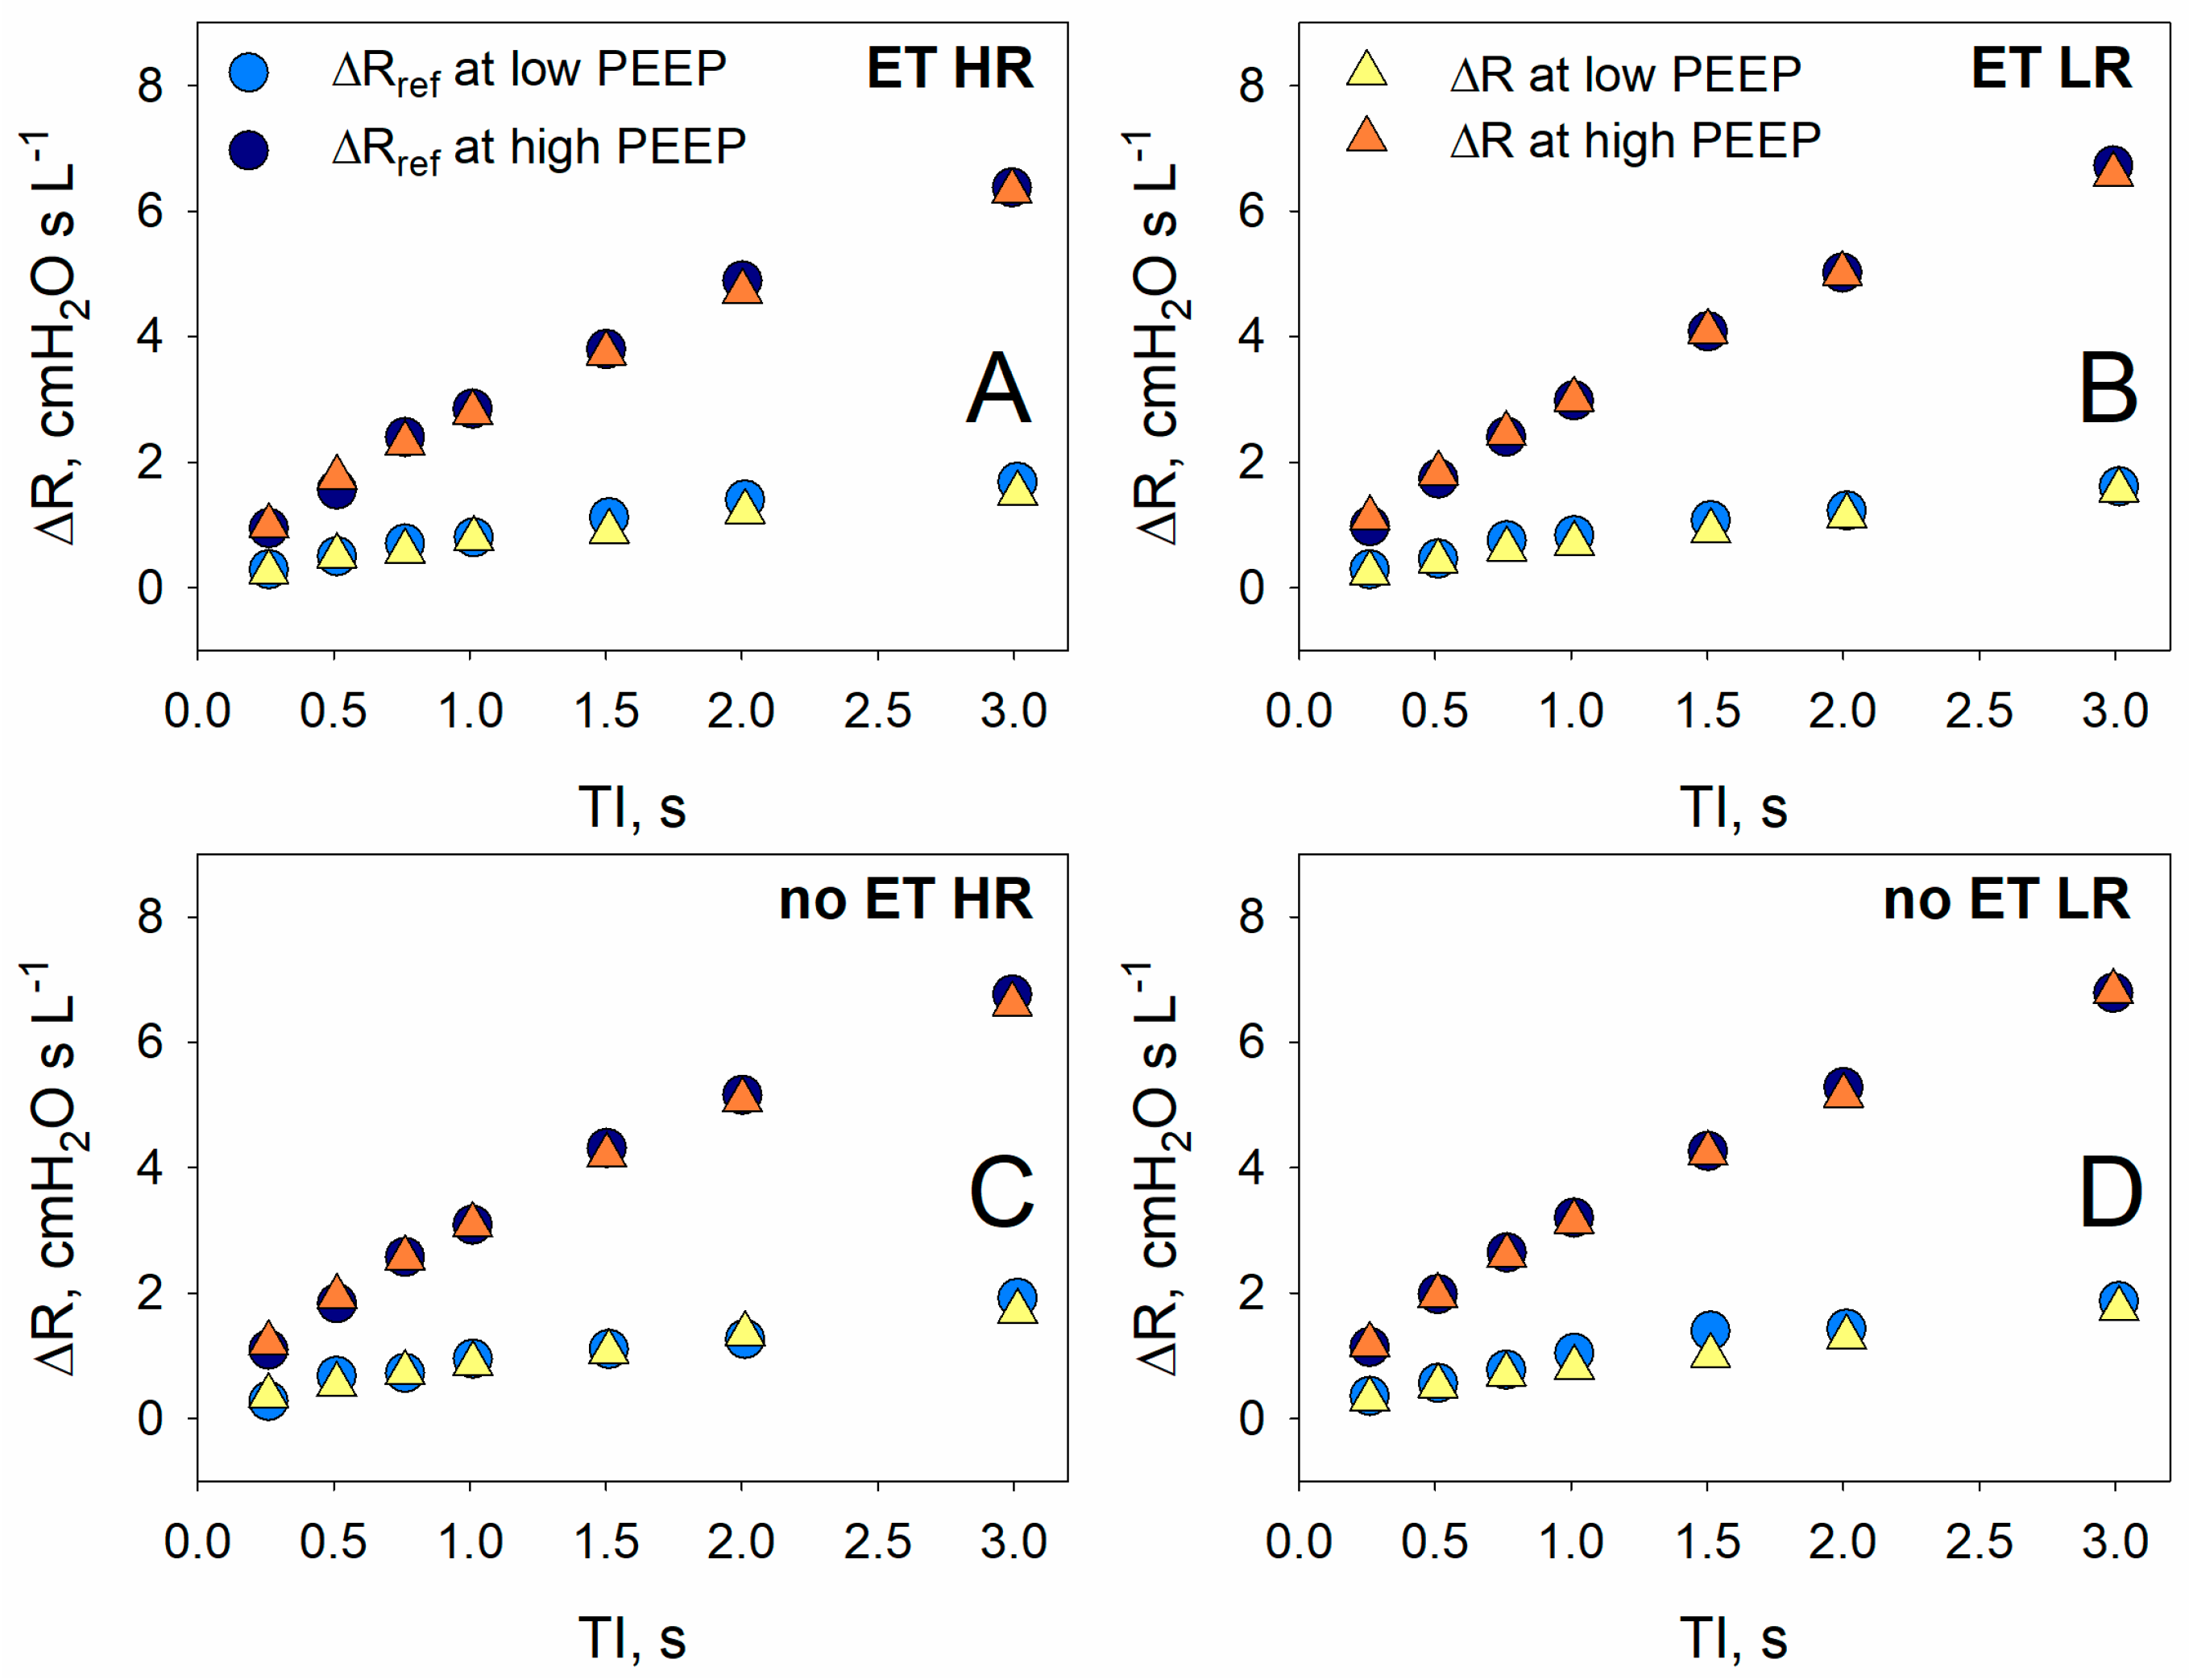
ΔRref did not change in the presence and in the absence of the endotracheal tube (P = 0.652), or with the higher or the lower resistance (P = 0.855), but it increased 3-fold from low to high PEEP (P < 0.001) (Figure 8).
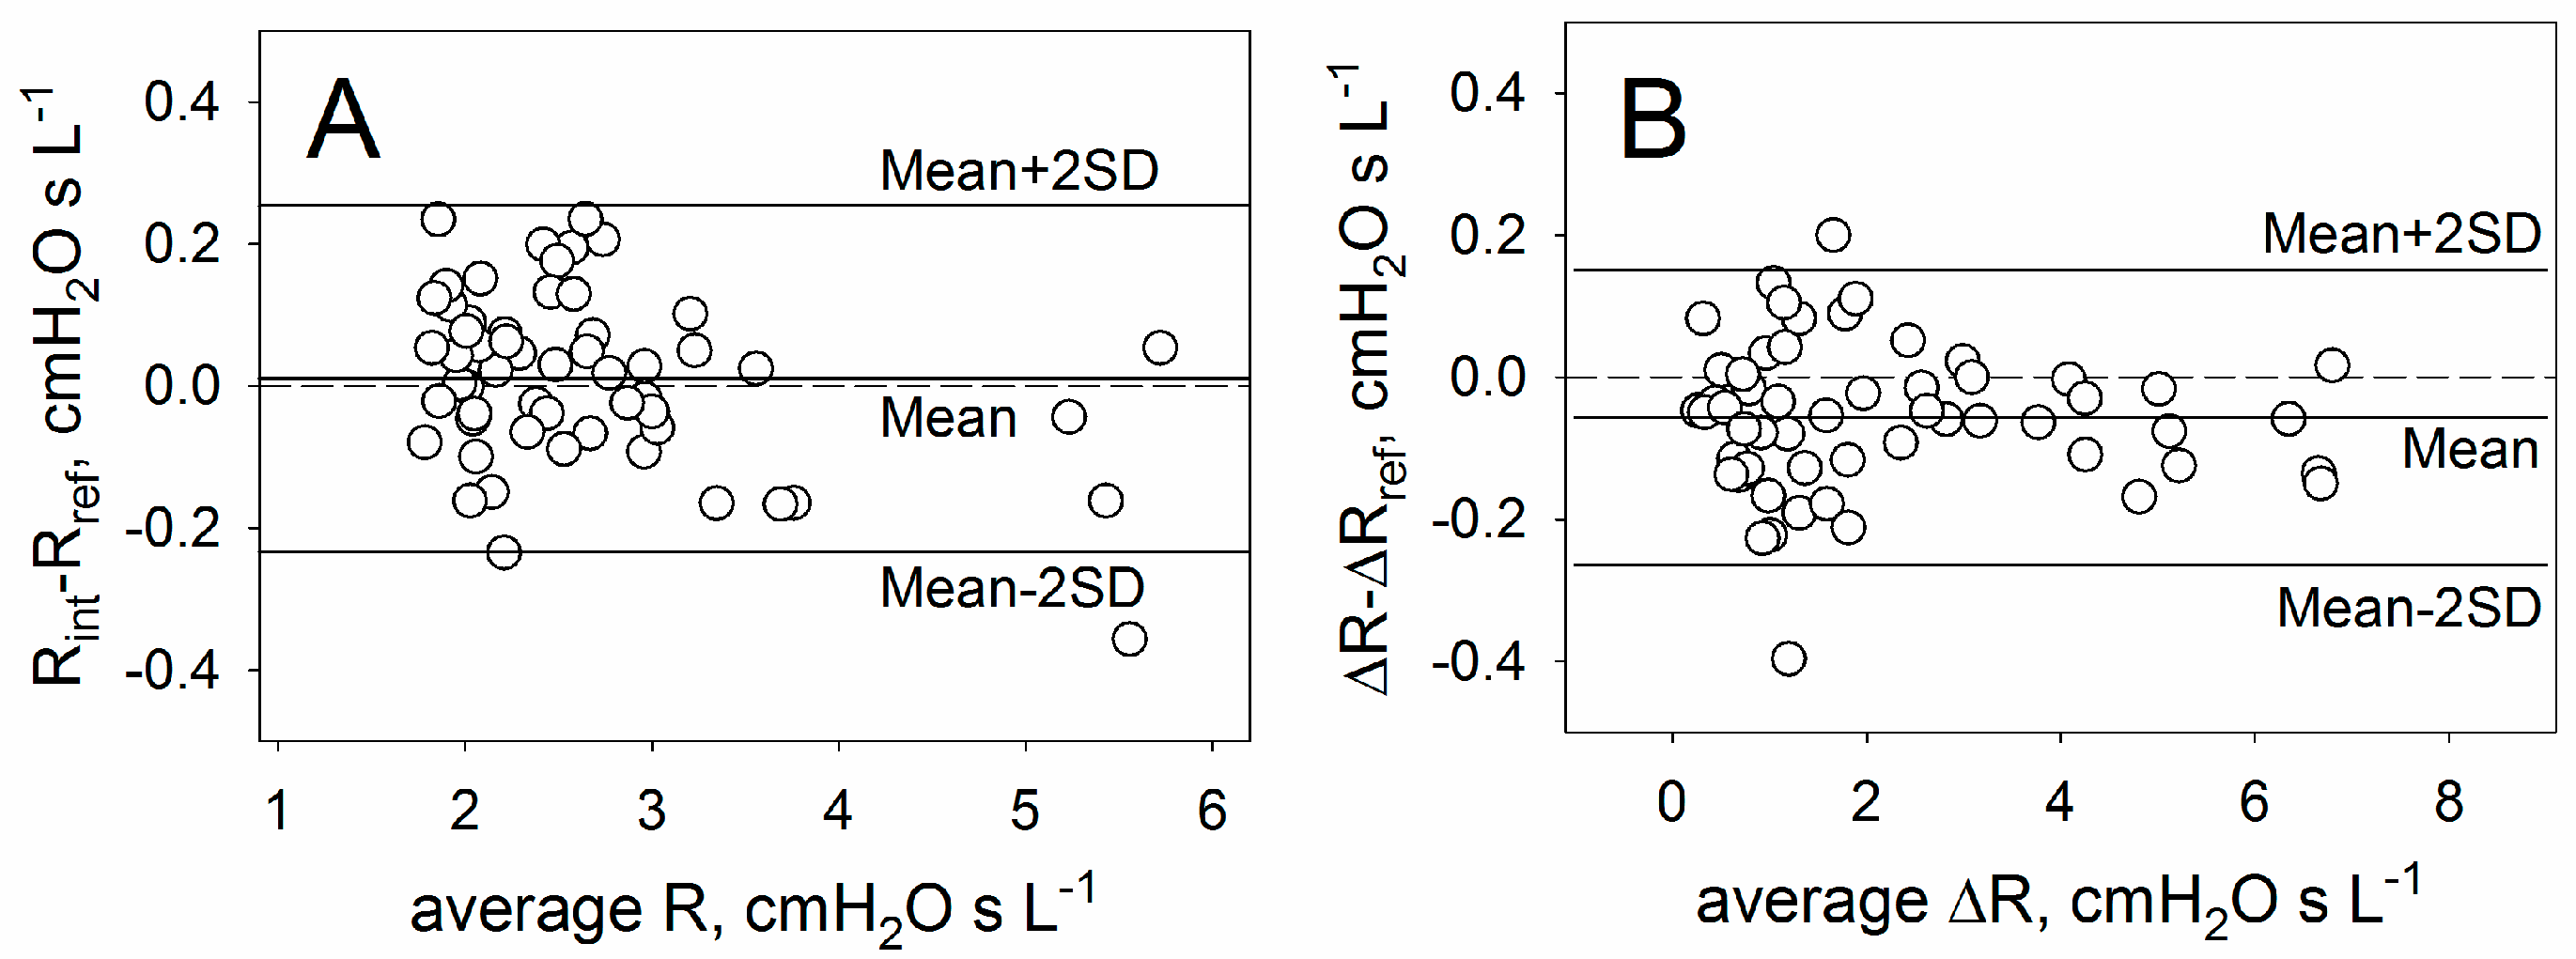
Measured Rint and ΔR closely followed their respective reference values in all conditions (Figure 7 and Figure 8). In all instances, a significant difference of Rint between HR and LR was detected (P < 0.020). The agreement between reference and measured values are shown in the Bland–Altman plots in Figure 9.
The average deviation of Rint from its reference values was 0.010 ± 0.122 cmH2O s L−1 (P = 0.625), corresponding to an insignificant bias of 1 ± 5% of the reference values and to a 95% confidence interval of −9 + 10%. In contrast, the average deviation of ΔR from its reference values was significant (−0.057 ± 0.103 cmH2O s L−1, P < 0.001). In percentage of the reference values, the bias corresponded to −5 ± 10% and the 95% confidence interval to −25 + 16%. It should be noted, however, that at low PEEP, the stress–relaxation of the model was much smaller than that measured in large mammals, so the effective percentage error of ΔR will be reduced when the ventilator is used with biological specimens. If only values at high PEEP are considered, the bias becomes −0.016 ± 0.090 cmH2O s L−1 (P = 0.369), corresponding to a percentage error of 1 ± 5% with a 95% confidence interval of −8 + 10%.

4. Discussion

The mechanical characteristics of the model used to test the ventilator were in the same order of magnitude of those measured in large mammals, including sheep, pigs and humans [26,33,34,35,36,37]. In this respect, ΔR represents an exception, as at low PEEP stress–relaxation in the model was minimal, much less than that measured in pigs or humans [26,37]. Retrospectively, an electropneumatic system as recently proposed could have been of help for ventilator testing [38]. Nevertheless, the model we used can still provide a useful estimation of the error inherent to our application of the interrupter technique, if the low PEEP ΔR data, which do not have any correspondence with actual biological values, are excluded from the calculation of percentage errors.
The ventilator was successful in detecting a small difference (<0.5 cmH2O s L−1) between lower and higher resistance, and there was a good agreement between measured interrupter resistance and its reference (95% confidence interval between −9 and 10%), as well as between additional resistance and its reference (−8 and 10%), despite the number of possible confounding factors which may interfere with these measurements, especially in the presence of a high Est [29].
A leakage at the level of the circuit between the inspiratory and expiratory valve and the test flowmeter (see Figure 3) has fatal effects on the ability of the ventilator to assess ΔR, as it would increase the fall of Paw during the post-inspiratory pause. We measured the leakage by increasing the pressure in the circuit up to 50 cmH2O, and found it negligible (<0.005 mL s−1).
Ideally, the closure of the inspiratory valve should be instantaneous [39]. Even in the presence of an ideal valve, however, a finite sampling frequency can lead to an underestimation of the resistive pressure drop from Pmax,aw to P1,aw, as Pmax,aw is inevitably underestimated by an amount which depends on the sampling frequency (SF) and on the rate of rise of Paw (a function of flow and Est), and P1,aw is overestimated by an amount which depends on SF and on the rate of Paw decay (dPaw/dt) after the occlusion. This can be represented by the following equation:
R i n t R r e f = 1 2 S F   F l o w F l o w   E s t d P a w d t
In the present experimental settings (SF 1000 Hz) this kind of error is unsubstantial, being in all conditions less than 0.05 cmH2O s L−1.
Another possible error is related to the redistribution of air in the system when flow is suddenly interrupted, and pressure equalizes in the whole system, so that a small amount of air, contained in the upstream parts of the model, flows downstream where the pressure is lower. In this case, the measured resistive pressure drop should be less than the actual one. This possibility was investigated by simulating a worst case scenario in which all the system upstream the outlet of the endotracheal tube was at Pmax,aw and immediately after the interruption pressure equalizes everywhere at P1,aw. Also in this case, the error was insignificant (<0.05 cmH2O s L−1).
More serious sources of error stem from the finite closing (and opening) time of the 2-way valves. The problem is 2-fold.
First, at the end of inspiration it is important that the exhaust valve opens only after closing of the inspiratory valve is complete. If this does not happen, part of the inspiratory flow will be diverted to the exhaust port, decreasing the flow actually delivered to the model. This possibility has been prevented by estimating the delay between the command to each valve and its complete closure or opening, and by compensating any difference in closing/opening time with the control program.
Second, a finite closing time of the inspiratory valve interferes with the measurement of Rint, as, while the valve is closing, air moves to the model, raising the pressure depending on flow and on Est, so that P1,aw is overestimated. The published correction methods to overcome this issue are based on the knowledge of the compliance of the respiratory system and of the flow profile during closure [39,40,41]. Because of technical limitations in the direct assessment of a very fast flow transient during closure [40], the best solution to assess the flow profile during closing is to gather this information indirectly, provided that it is possible to instantaneously measure the position of the valve plunger and to determine the flow–pressure relation in all intermediate positions between open and closed state [39,40]. This is impossible to do with a commercial valve like 71P9ZGM, in which plunger position cannot be measured or controlled. However, indirect evidence suggests that the effective closing time of in situ 71P9ZGM was rather short.
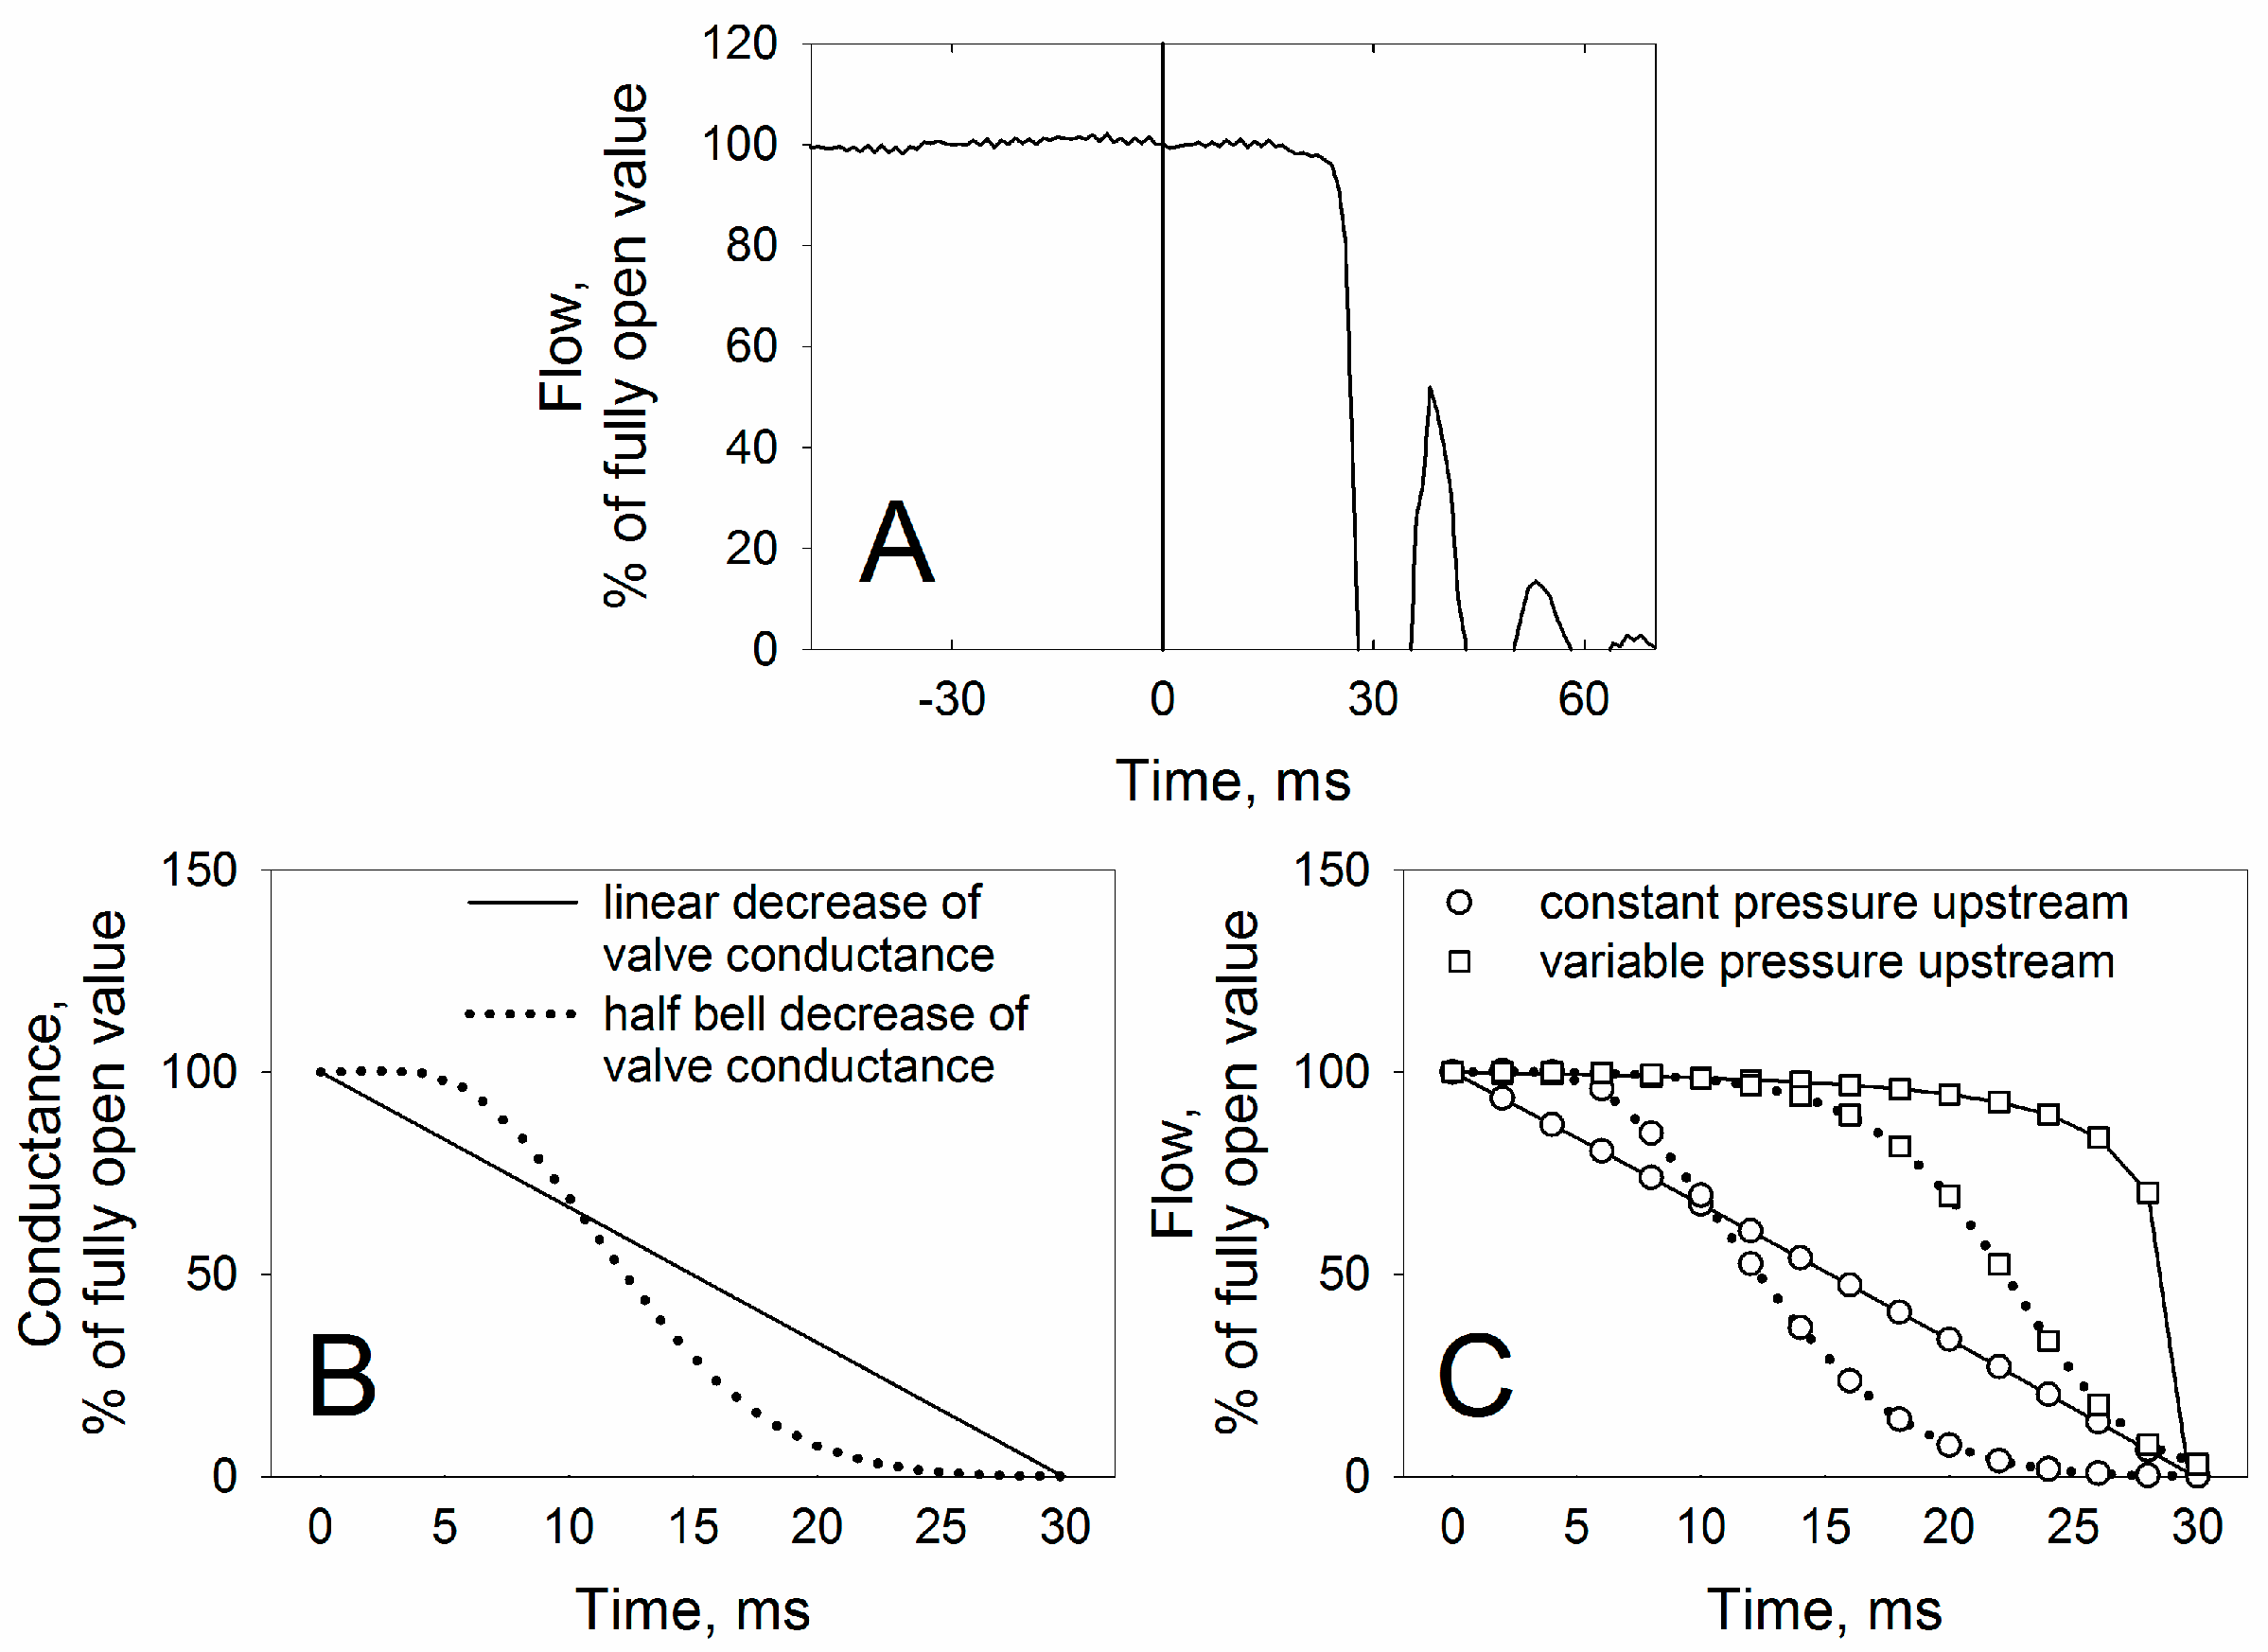
Panel A of Figure 10 shows the flow recorded during closing of the isolated inspiratory valve when the pressures upstream and downstream were 20 and 0 cmH2O, respectively. The delay between the generation of the closing signal (time 0, vertical line) and the complete closure of the valve was rather long (~28 ms), also relative to that of the other valves (11–12 ms). Apparently, flow did not decrease linearly with time immediately after the closing command, but rather remained almost constant or slightly decreased until a sudden fall to zero. Panel B of Figure 10 shows two hypothetical time-conductance relations, one linear and one half-bell shaped [29]: the corresponding flows (when upstream pressure is constant) are indicated by the circles of Panel C of the same figure. It is clear that the shape of flow shown by panel A is not compatible with a more or less gradual decrease in conductance starting from time 0, and this suggests that either the valve started to close some ms after the closing command or the initial change of conductance was modest. In addition, when the valve is mounted in the ventilator, the pressure upstream is not constant, and the changes in flow before complete closure tend to be minimized. Indeed, as the flow is proportional to the inverse of the sum of all the resistances in series (the high resistance offered by the three proportional valves plus the lower one offered by the inspiratory valve, see Equation (5)), during closure the pressure upstream to the inspiratory valve increases, limiting the decrease in inspiratory flow until the resistance offered by the inspiratory valve is very high (compare circles and squares in panel C of Figure 10).
Operatively, Pmax,aw was taken at the instant after which Paw falls suddenly, which corresponds to the flow before its rapid decline to zero (Fei). If so, effective closing time (from Pmax,aw to zero flow) becomes very short, and probably the effect of leakage on P1,aw becomes negligible.
Finally, another factor interfering in the assessment of P1,aw (and therefore of Rint and ΔR) is represented by high frequency pressure oscillations after the rapid interruption, which prevent a direct measurement of this parameter. In our settings, the duration of the oscillations was greater than previously reported [29]. The presence of the endotracheal tube is a major contributor to the genesis of the oscillations, as it provides an inertance which is one order of magnitude greater than that of the other parts of the system. Indeed, when the model did not include the endotracheal tube the persistence of the oscillations was markedly reduced. An additional reason for this phenomenon is probably the great rate of decrease in flow during the closure of the inspiratory valve, when it works inside the ventilator with a variable pressure upstream, as the greater the deceleration is, the greater the inertial pressure that will be produced. Whatever the reason, oscillations represent a problem, since the longer the duration of the back-extrapolation is, the greater the error in P1,aw estimation, if the shape of the rate of Paw decay is not known a priori. This issue was solved by reconstructing Paw as shown in Figure 6, so that the duration of the back-extrapolation was brought back to reasonable limits. A drawback of this approach is the necessity to use a high sampling frequency in order to follow faithfully the transients.

5. Limitations

The prototype is still under development, and efforts are being made to reduce the physical dimensions of the apparatus (in particular of the humidifier), and to improve the stability of the high pressure source, which may be responsible of some residual inaccuracies of the flow. At the moment, the maximal inspiratory flow which can be delivered to the animal is ~ 2.2 L s1, sufficient for most applications. Addition of other proportional valves in parallel can raise this limit. A major limitation of the present design is that expiration is completely passive, and, therefore, flow during expiration cannot be controlled. This feature prevents the assessment of the deflation pressure–volume relation of the respiratory system at low flows.

6. Conclusions

Despite these limitations, the device described in this work offers the possibility to ventilate a large animal during anesthesia and paralysis, while assessing respiratory mechanics in terms of interrupter resistance, additional resistance and elastance. Although the safety level of the ventilator is not high enough to be used in humans, it affords considerable protection against overdistention, and can be used continuously for hours in the experimental settings.

Author Contributions

Conceptualization, C.Z. and M.P.; methodology, C.Z., E.B., A.K. and M.P.; software, M.P.; validation, C.Z., E.B., A.K. and M.P.; formal analysis, C.Z., E.B. and M.P.; investigation, C.Z., E.B., A.K. and M.P.; resources, M.P.; data curation, C.Z., E.B. and M.P.; writing—original draft preparation, C.Z., E.B. and M.P.; writing—review and editing, C.Z., E.B., A.K. and M.P.; visualization, C.Z., E.B. and M.P.; supervision, M.P. All authors have read and agreed to the published version of the manuscript.

Funding

This research was in part funded by Ministero degli Affari Esteri e della Cooperazione Internazionale (MAECI) in the context of the project BILVOR—Biological Lung Volume Reduction to treat COPD in humans.

Data Availability Statement

Data and programs will be made available to those interested upon reasonable request.

Acknowledgments

The authors wish to thank Roberto Galli for skillful technical assistance.

Conflicts of Interest

The authors declare no conflicts of interest.

References

  1. Meeusen, E.N.; Snibson, K.J.; Hirst, S.J.; Bischof, R.J. Sheep as a Model Species for the Study and Treatment of Human Asthma and Other Respiratory Diseases. Drug Discov. Today Dis. Model. 2009, 6, 101–106. [Google Scholar] [CrossRef]
  2. Dreyfuss, D.; Saumon, G. Ventilator-Induced Lung Injury. Am. J. Respir. Crit. Care Med. 1998, 157, 294–323. [Google Scholar] [CrossRef] [PubMed]
  3. Snider, G.L.; Lucey, E.C.; Stone, P.J. Animal Models of Emphysema 1–3. Am. Rev. Respir. Dis. 1986, 133, 149–169. [Google Scholar] [CrossRef] [PubMed]
  4. Wald, A.; Jason, D.; Murphy, T.W.; Mazzia, V.D.B. A Computers System for Respiratory Parameters. Comput. Biomed. Res. 1969, 2, 411–429. [Google Scholar] [CrossRef] [PubMed]
  5. Uhl, R.R.; Lewis, F.J. Digital Computer Calculation of Human Pulmonary Mechanics Using a Least Squares Fit Technique. Comput. Biomed. Res. 1974, 7, 489–495. [Google Scholar] [CrossRef] [PubMed]
  6. Stegmaier, P.A.; Zollinger, A.; Brunner, J.X.; Pasch, T. Assessment of Pulmonary Mechanics in Mechanical Ventilation: Effects of Imprecise Breath Detection, Phase Shift and Noise. J. Clin. Monit. Comput. 1998, 14, 127–134. [Google Scholar] [CrossRef]
  7. Bates, J.H.T.; Irvin, C.G.; Farré, R.; Hantos, Z. Oscillation Mechanics of the Respiratory System. Compr. Physiol. 2011, 1233–1272. [Google Scholar] [CrossRef]
  8. Schuessler, T.F.; Bates, J.H.T. A Computer-Controlled Research Ventilator for Small Animals: Design and Evaluation. IEEE Trans. Biomed. Eng. 1995, 42, 860–866. [Google Scholar] [CrossRef]
  9. Harris, R.S. Pressure-Volume Curves of the Respiratory System. Respir. Care 2005, 50, 78–98; discussion 98–99. [Google Scholar]
  10. Milic-Emili, J.; Robatto, F.M.; Bates, J.H.T. Respiratory Mechanics in Anaesthesia. Br. J. Anaesth. 1990, 65, 4–12. [Google Scholar] [CrossRef]
  11. Bates, J.H.; Ludwig, M.S.; Sly, P.D.; Brown, K.; Martin, J.G.; Fredberg, J.J. Interrupter Resistance Elucidated by Alveolar Pressure Measurement in Open-Chest Normal Dogs. J. Appl. Physiol. 1988, 65, 408–414. [Google Scholar] [CrossRef]
  12. D’Angelo, E.; Prandi, E.; Tavola, M.; Calderini, E.; Milic-Emili, J. Chest Wall Interrupter Resistance in Anesthetized Paralyzed Humans. J. Appl. Physiol. 1994, 77, 883–887. [Google Scholar] [CrossRef] [PubMed]
  13. Barnas, G.M.; Yoshino, K.; Loring, S.H.; Mead, J. Impedance and Relative Displacements of Relaxed Chest Wall up to 4 Hz. J. Appl. Physiol. 1987, 62, 71–81. [Google Scholar] [CrossRef] [PubMed]
  14. Otis, A.B.; McKerrow, C.B.; Bartlett, R.A.; Mead, J.; McIlroy, M.B.; Selverstone, N.J.; Radford, E.P. Mechanical Factors in Distribution of Pulmonary Ventilation. J. Appl. Physiol. 1956, 8, 427–443. [Google Scholar] [CrossRef]
  15. Pecchiari, M.; Radovanovic, D.; Zilianti, C.; Saderi, L.; Sotgiu, G.; D’Angelo, E.; Santus, P. Tidal Expiratory Flow Limitation Induces Expiratory Looping of the Alveolar Pressure-Flow Relation in COPD Patients. J. Appl. Physiol. 2020, 129, 75–83. [Google Scholar] [CrossRef]
  16. Zilianti, C.; Santus, P.; Pecchiari, M.; D’Angelo, E.; Radovanovic, D. Diagnostic Insights from Plethysmographic Alveolar Pressure Assessed during Spontaneous Breathing in COPD Patients. Diagnostics 2021, 11, 918. [Google Scholar] [CrossRef]
  17. Koutsoukou, A.; Bekos, B.; Sotiropoulou, C.; Koulouris, N.G.; Roussos, C.; Milic-Emili, J. Effects of Positive End-Expiratory Pressure on Gas Exchange and Expiratory Flow Limitation in Adult Respiratory Distress Syndrome. Crit. Care Med. 2002, 30, 1941–1949. [Google Scholar] [CrossRef]
  18. Armaganidis, A.; Stavrakaki-Kallergi, K.; Koutsoukou, A.; Lymberis, A.; Milic-Emili, J.; Roussos, C. Intrinsic Positive End-Expiratory Pressure in Mechanically Ventilated Patients with and without Tidal Expiratory Flow Limitation. Crit. Care Med. 2000, 28, 3837–3842. [Google Scholar] [CrossRef] [PubMed]
  19. Laghi, F.; Goyal, A. Auto-PEEP in Respiratory Failure. Minerva Anestesiol. 2012, 78, 201–221. [Google Scholar]
  20. Rossi, A.; Gottfried, S.B.; Zocchi, L.; Higgs, B.D.; Lennox, S.; Calverley, P.M.; Begin, P.; Grassino, A.; Milic-Emili, J. Measurement of Static Compliance of the Total Respiratory System in Patients with Acute Respiratory Failure during Mechanical Ventilation. The Effect of Intrinsic Positive End-Expiratory Pressure. Am. Rev. Respir. Dis. 1985, 131, 672–677. [Google Scholar] [CrossRef]
  21. Briscoe, W.A.; Dubois, A.B. The Relationship Between Airway Resistance, Airway Conductance and Lung Volume in Subjects of Different Age and Body Size. J. Clin. Investig. 1958, 37, 1279–1285. [Google Scholar] [CrossRef] [PubMed]
  22. Mount, L.E. The Ventilation Flow-Resistance and Compliance of Rat Lungs. J. Physiol. 1955, 127, 157–167. [Google Scholar] [CrossRef] [PubMed]
  23. Sanborn, W.G. Monitoring Respiratory Mechanics during Mechanical Ventilation: Where Do the Signals Come From? Respir. Care 2005, 50, 28–52; discussion 52–54. [Google Scholar] [PubMed]
  24. D’Angelo, E.; Robatto, F.M.; Calderini, E.; Tavola, M.; Bono, D.; Torri, G.; Milic-Emili, J. Pulmonary and Chest Wall Mechanics in Anesthetized Paralyzed Humans. J. Appl. Physiol. 1991, 70, 2602–2610. [Google Scholar] [CrossRef] [PubMed]
  25. D′Angelo, E.; Calderini, E.; Tavola, M.; Bono, D.; Milic-Emili, J. Effect of PEEP on Respiratory Mechanics in Anesthetized Paralyzed Humans. J. Appl. Physiol. 1992, 73, 1736–1742. [Google Scholar] [CrossRef]
  26. D′Angelo, E.; Tavola, M.; Milic-Emili, J. Volume and Time Dependence of Respiratory System Mechanics in Normal Anaesthetized Paralysed Humans. Eur. Respir. J. 2000, 16, 665. [Google Scholar] [CrossRef] [PubMed]
  27. Jansen, J.R.; Hoorn, E.; Van Goudoever, J.; Versprille, A. A Computerized Respiratory System Including Test Functions of Lung and Circulation. J. Appl. Physiol. 1989, 67, 1687–1691. [Google Scholar] [CrossRef] [PubMed]
  28. Meyer, M.; Slama, H. A Versatile Hydraulically Operated Respiratory Servo System for Ventilation and Lung Function Testing. J. Appl. Physiol. 1983, 55, 1023–1030. [Google Scholar] [CrossRef] [PubMed]
  29. Kessler, V.; Mols, G.; Bernhard, H.; Haberthür, C.; Guttmann, J. Interrupter Airway and Tissue Resistance: Errors Caused by Valve Properties and Respiratory System Compliance. J. Appl. Physiol. 1999, 87, 1546–1554. [Google Scholar] [CrossRef]
  30. D’Angelo, E.; Koutsoukou, A.; Della Valle, P.; Gentile, G.; Pecchiari, M. The Development of Various Forms of Lung Injury with Increasing Tidal Volume in Normal Rats. Respir. Physiol. Neurobiol. 2020, 274, 103369. [Google Scholar] [CrossRef]
  31. Pecchiari, M.; Monaco, A.; Koutsoukou, A.; Valle, P.D.; Gentile, G.; D’Angelo, E. Effects of Various Modes of Mechanical Ventilation in Normal Rats. Anesthesiology 2014, 120, 943–950. [Google Scholar] [CrossRef] [PubMed]
  32. D’Angelo, E.; Koulouris, N.G.N.G.; Della Valle, P.; Gentile, G.; Pecchiari, M. The Fall in Exhaled Nitric Oxide with Ventilation at Low Lung Volumes in Rabbits: An Index of Small Airway Injury. Respir. Physiol. Neurobiol. 2008, 160, 215–223. [Google Scholar] [CrossRef] [PubMed]
  33. Fujino, Y.; Goddon, S.; Dolhnikoff, M.; Hess, D.; Amato, M.B.P.; Kacmarek, R.M. Repetitive High-Pressure Recruitment Maneuvers Required to Maximally Recruit Lung in a Sheep Model of Acute Respiratory Distress Syndrome. Crit. Care Med. 2001, 29, 1579–1586. [Google Scholar] [CrossRef] [PubMed]
  34. Navarrete-Calvo, R.; Parra, P.; Rodríguez-Gómez, I.M.; Morgaz, J.; Domínguez, J.M.; Gómez-Villamandos, R.J.; Quirós-Carmona, S.; Pineda, C.; del Mar Granados, M. Comparison of the Efficacy of Two Alveolar Recruitment Manoeuvres in Improving the Lung Mechanics and the Degree of Atelectasis in Anaesthetized Healthy Sheep. Res. Vet. Sci. 2022, 150, 164–169. [Google Scholar] [CrossRef]
  35. Wu, X.; Zheng, R.; Zhuang, Z. Effect of Transpulmonary Pressure-Guided Positive End-Expiratory Pressure Titration on Lung Injury in Pigs with Acute Respiratory Distress Syndrome. J. Clin. Monit. Comput. 2020, 34, 151–159. [Google Scholar] [CrossRef]
  36. Xia, F.; Pan, C.; Wang, L.; Liu, L.; Liu, S.; Guo, F.; Yang, Y.; Huang, Y. Physiological Effects of Different Recruitment Maneuvers in a Pig Model of ARDS. BMC Anesthesiol. 2020, 20, 266. [Google Scholar] [CrossRef] [PubMed]
  37. Calzia, E.; Stahl, W.; Handschuh, T.; Marx, T.; Fröba, G.; Bäder, S.; Georgieff, M.; Radermacher, P. Respiratory Mechanics during Xenon Anesthesia in Pigs. Anesthesiology 1999, 91, 1378. [Google Scholar] [CrossRef] [PubMed]
  38. Castaño, J.; Giraldo, M.A.; Montoya, Y.; Montagut, Y.J.; Palacio, A.F.; Jiménez, L.D. Electropneumatic System for the Simulation of the Pulmonary Viscoelastic Effect in a Mechanical Ventilation Scenario. Sci. Rep. 2023, 13, 21275. [Google Scholar] [CrossRef]
  39. Bates, J.H.T.; Hunter, I.W.; Sly, P.D.; Okubo, S.; Filiatrault, S.; Milic-Emili, J. Effect of Valve Closure Time on the Determination of Respiratory Resistance by Flow Interruption. Med. Biol. Eng. Comput. 1987, 25, 136–140. [Google Scholar] [CrossRef]
  40. Romero, P.V.; Sato, J.; Shardonofsky, F.; Bates, J.H. High-Frequency Characteristics of Respiratory Mechanics Determined by Flow Interruption. J. Appl. Physiol. 1990, 69, 1682–1688. [Google Scholar] [CrossRef]
  41. Kochi, T.; Okubo, S.; Zin, W.A.; Milic-Emili, J. Flow and Volume Dependence of Pulmonary Mechanics in Anesthetized Cats. J. Appl. Physiol. 1988, 64, 441–450. [Google Scholar] [CrossRef] [PubMed]
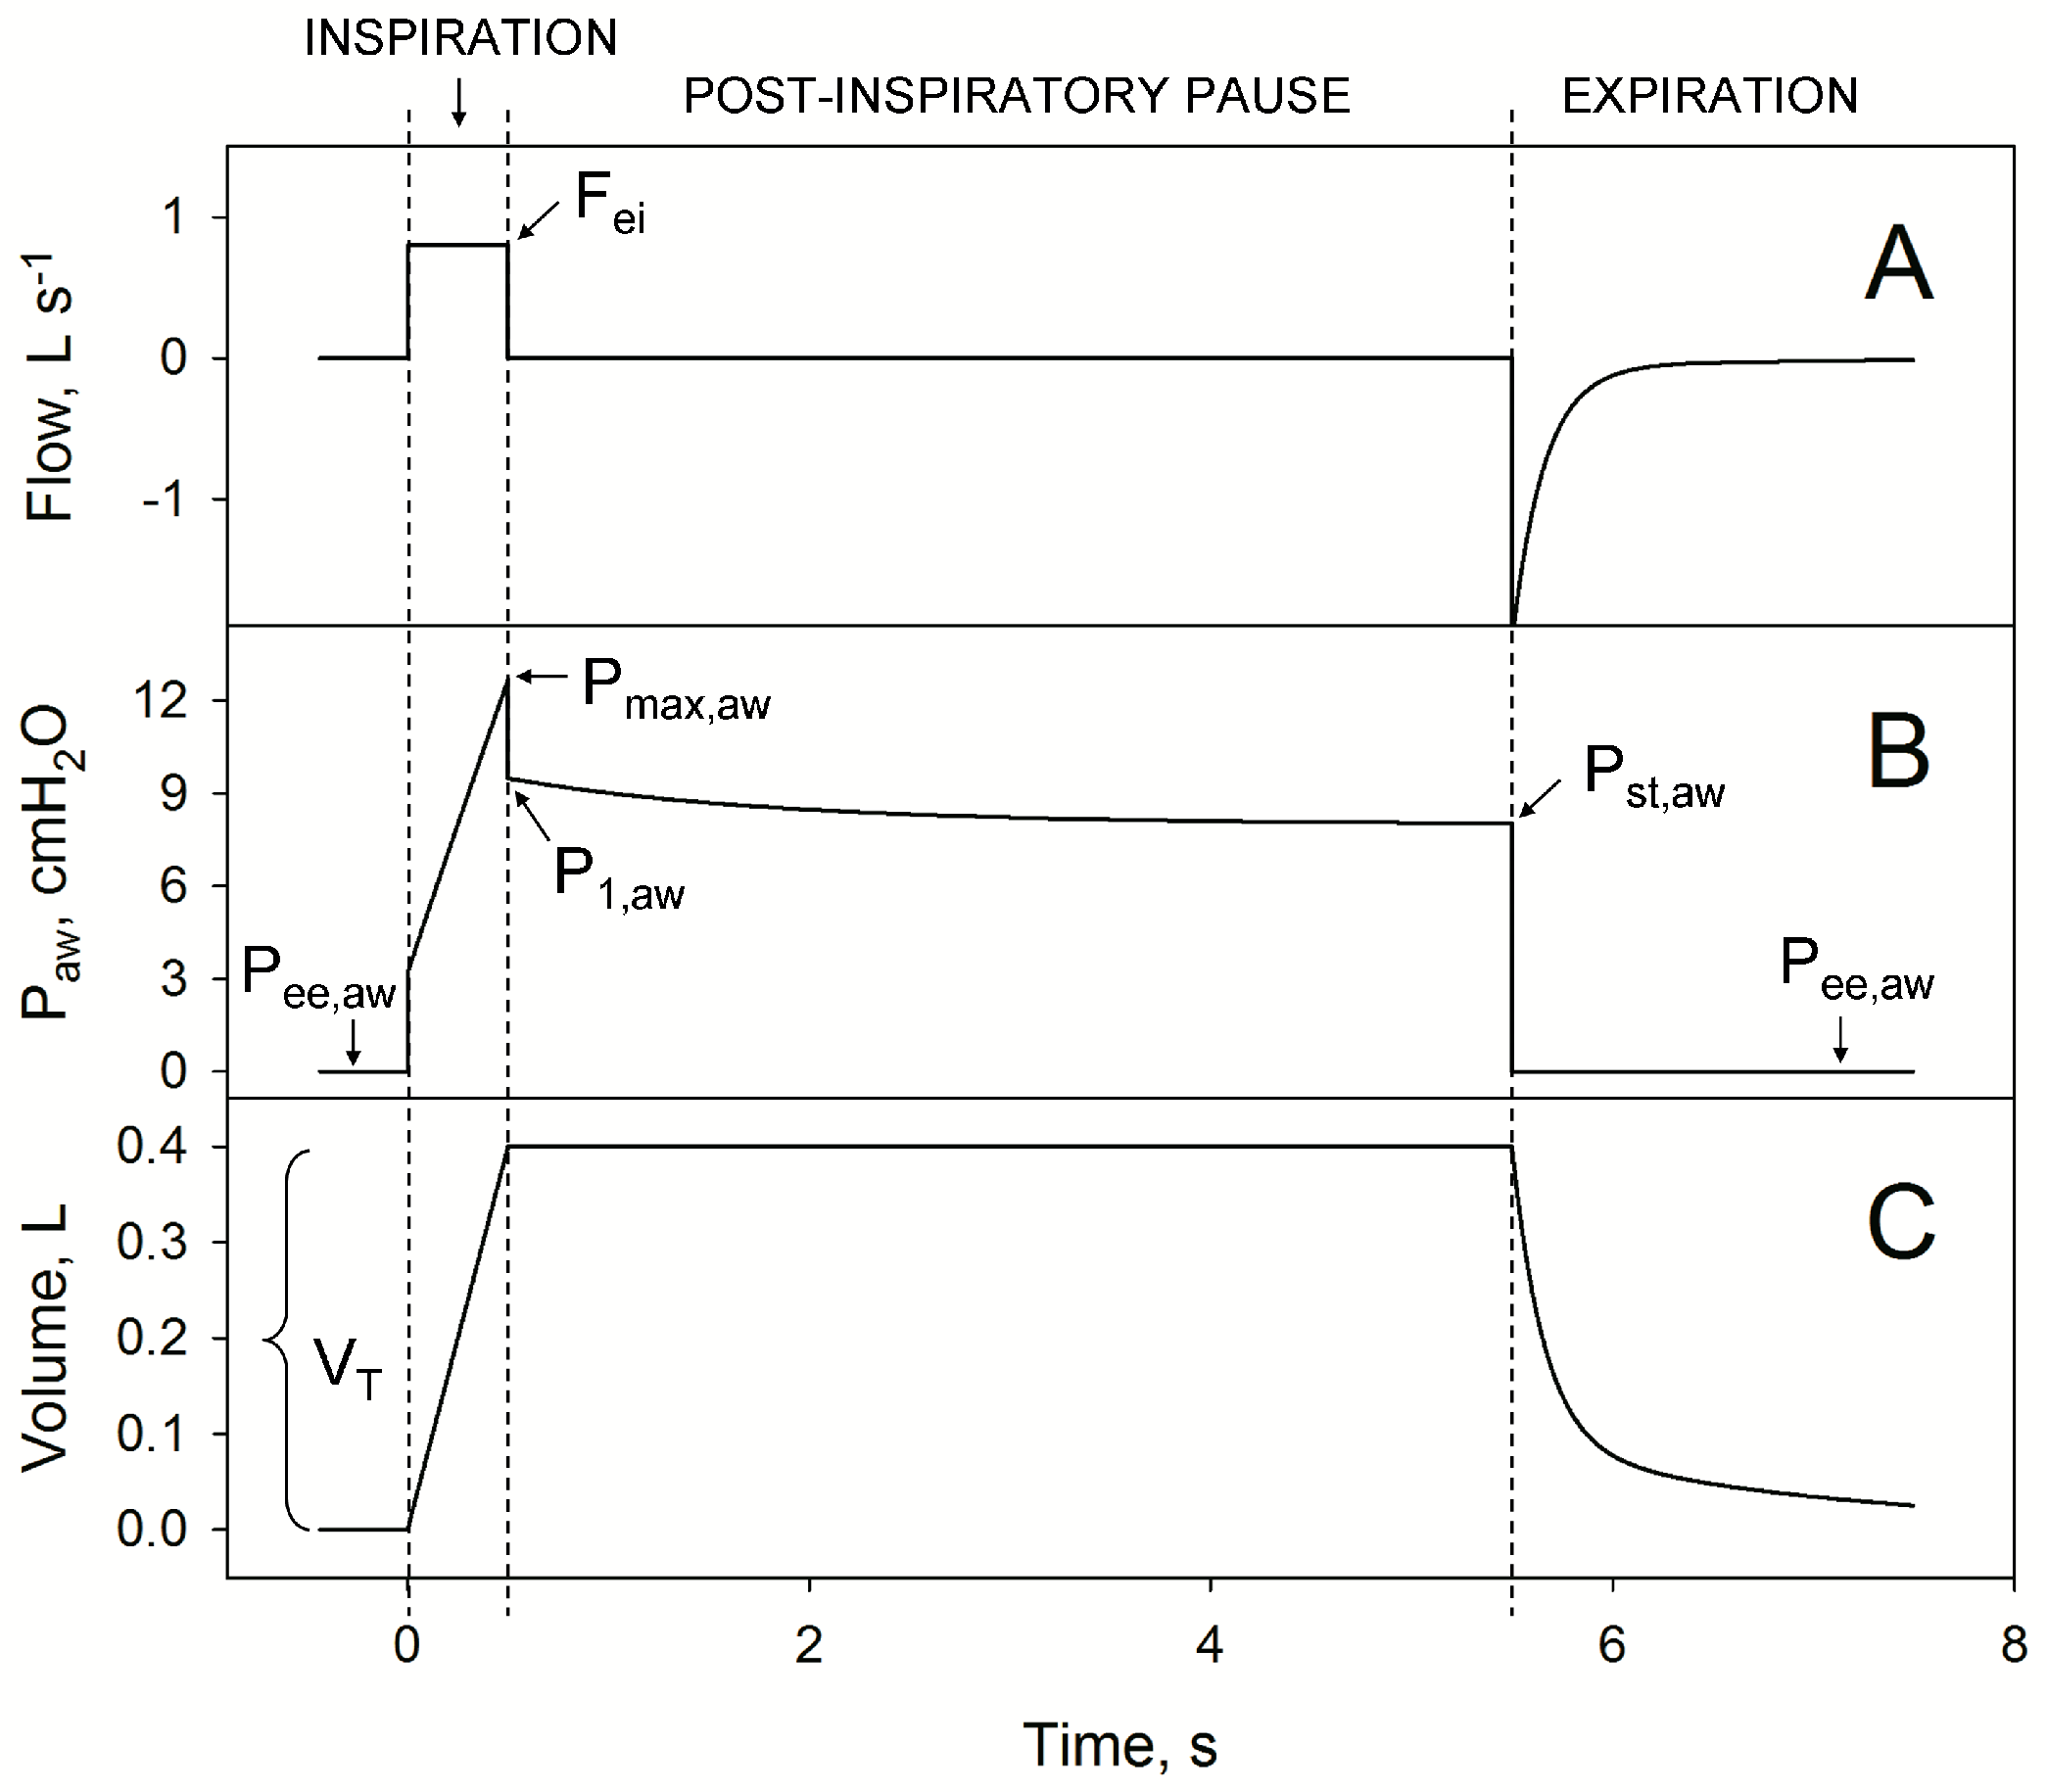
Figure 1. The figure shows the time course of flow (panel A), airway pressure (Paw, (panel B)) and volume (panel C) during a rapid occlusion after a constant flow inflation followed by a post-inspiratory pause and expiration. Fei: end-inspiratory flow; Pee,aw: end-expiratory airway pressure; Pmax,aw: airway pressure immediately before the sudden pressure drop corresponding to the rapid interruption of the flow; P1,aw: airway pressure immediately after the rapid interruption; Pst,aw: airway pressure after a 5 s inspiratory hold (post-inspiratory pause); VT, tidal volume. For the sake of clarity, the breath has been obtained by numerical simulation, representing the respiratory system according to a four element Mount’s model (shown in Figure 2), with a quasi-static elastance of 20 cmH2O L−1, an interrupter resistance of 4 cmH2O s L−1, a viscoelastic resistance of 5.9 cmH2O s L−1 and a viscoelastic elastance of 4.5 cmH2O L−1 [10].
Fluids 09 00142 g001
Figure 3. The figure shows a schematic drawing (panel A) and a photograph (panel B) of the ventilator. The 2-way valves are shown in the unpowered state. PNTtest, test pneumotachometer; PNTctr, control pneumotachometer. For a detailed description, see the text.
Fluids 09 00142 g003
Figure 4. The figure shows airflow during the different phases of a breath, in the case the humidifier has been included in the inspiratory line. Feedforward and feedback control of the flow is possible during non-inspiratory phases only.
Fluids 09 00142 g004
Figure 5. The figure shows flow (panel A), airway and balloon pressures (panel B) and volume (panel C) during a test breath recorded at 1 cmH2O positive end-expiratory pressure during ventilation of the model through the n°10 endotracheal tube (compare with Figure 1). Rapid interruption of the inspiratory flows produces a high-frequency vibration which precludes an easy identification of P1,aw.
Fluids 09 00142 g005
Figure 6. (Panel A) illustrates the procedure to eliminate part of the oscillations from Paw recordings. (Panel B) shows the interpolation and back-extrapolation procedure. The vertical dotted line shows the time at which Pmax,aw occurs. The two vertical broken lines delimit the segment which has been interpolated with a second order polynomial. This function has been back-extrapolated and its value at the time of Pmax,aw is P1,aw. The simultaneous value of Pbal (Pbal at Pmax,aw) is considered the reference against which P1,aw is compared when calculating ΔR, as, in the absence of any resistive behavior of the balloon and of leakage during the closure of the inspiratory valve, Pbal at Pmax,aw and P1,aw should be the same.
Fluids 09 00142 g006
Figure 7. Reference resistance (Rref) (blue circles) and interrupter resistance (Rint) (triangles) measured with and without the endotracheal tube inserted in the circuit (ET, (panels A and B); and no ET, (panels C and D), respectively), in the presence of the higher or lower resistance (HR, (panels A and C); and LR, (panels B and D), respectively). Measurements were performed at low (1 cmH2O) (yellow triangles) and high (15 cmH2O) PEEP (orange triangles). For Rref, results at different PEEP levels were pooled.
Fluids 09 00142 g007
Figure 8. Reference additional resistance (ΔRref) (circles) and measured additional resistance (ΔR) (triangles) assessed with and without the endotracheal tube inserted in the circuit (ET, (panels A and B); and no ET, (panels C and D), respectively), in the presence of the higher (HR) or lower (LR) resistance. Measurements were performed at low (1 cmH2O) and high (15 cmH2O) PEEP.
Fluids 09 00142 g008
Figure 9. Bland–Altman plots showing the level of agreement between reference and measured resistance (panel A) and additional resistance (panel B) for all experimental conditions.
Fluids 09 00142 g009
Figure 10. (Panel A): time course of flow generated by a constant pressure upstream of the inspiratory valve during the closure of the valve. The vertical line indicates when the closing command is delivered to the valve. (Panel B): hypothetical time course of valve conductance when conductance decreases linearly in time (continuous line) up to zero or when the time-conductance relation has a half-bell shape [29] (dotted line). (Panel C): the time courses of conductance shown by panel B have been used to calculate flow during inspiratory valve closure when upstream pressure was constant (circles) or when it was variable (squares), as it is the case when the valve operates inside the ventilator.
Fluids 09 00142 g010
Disclaimer/Publisher’s Note: The statements, opinions and data contained in all publications are solely those of the individual author(s) and contributor(s) and not of MDPI and/or the editor(s). MDPI and/or the editor(s) disclaim responsibility for any injury to people or property resulting from any ideas, methods, instructions or products referred to in the content.