Article

Effects of Nozzle Pitch Adaptation in Micro-Scale Liquid Jet Impingement

1
Department of Materials Engineering, KU Leuven, 3001 Leuven, Belgium
2
IMEC, Kapeldreef 75, 3001 Leuven, Belgium
*
Author to whom correspondence should be addressed.
Fluids 2024, 9(3), 69; https://doi.org/10.3390/fluids9030069
Submission received: 15 December 2023 / Revised: 10 February 2024 / Accepted: 27 February 2024 / Published: 7 March 2024
(This article belongs to the Special Issue Heat Transfer Enhancement Mechanisms and Techniques)

Abstract

:
With ever increasing integration density of electronic components, the demand for cooling solutions capable of removing the heat generated by such systems grows along with it. It has been shown that a viable answer to this demand is the use of direct liquid jet impingement. While this method can generally be scaled to the cooling of large areas, this is restricted by the necessity of coolant flow rate scaling. In this study, the benefits and restrictions of using increased nozzle pitch to remedy the increasing demand for overall flow rate are investigated. To this end, a model is validated against experimental findings and then used for computational fluid dynamics simulations, exploring effects of the pitch change for micro-scale nozzle diameters and nozzle-to-target spacings. It is found that while this method is efficient in adjusting the tradeoff between total coolant flow rate and pressure drop up to a certain pint, the occurrence of a hydraulic jump in the cavity causes a deterioration of its effect for large nozzle pitches.

1. Introduction

Highly dense integration of electronics leads to equally high power dissipation, making cooling solutions capable of removing the generated heat a necessity. Classical cooling solutions such as air-cooled heat sinks attached to chip packages by thermal interface material (TIM) struggle to meet this demand. Also, liquid cooled heat sinks are restricted in their performance by the thermal resistance of the TIM used for their attachment: To cool heat fluxes above 100 W/cm2 and up to 1000 W/cm2 while maintaining a reasonable device temperature, a more effective cooling solution is needed. One cooling solution that has been shown to be promising is direct liquid jet impingement; here, liquid coolant is ejected from a single or an array of nozzles directly onto the backside of the chip, foregoing any intermediary packaging or thermal interface material.
Zuckermann and Lior [1] gave a good general overview of the physics of jet impingement and different details of its application can be found in reviews such as by Ekkad and Singh [2] or Plant et al. [3]. As there are many types of impingement cooling devices, general terminology used to refer to the parts of the jet impingement cooler in this work are visualized in Figure 1. The main parts are the inlet nozzle forming the jet, the cavity, the outlet, and their relation to each other. The beneficial effect on heat transfer seen when implementing a lower cavity height as well as small nozzle diameters has been shown by Brunschwiler et al. [4] and Overholt et al. [5]. This improvement in heat transfer, however, comes at the cost of an increased pressure drop needed to drive the cooling system.
Examples of high heat transfer coefficients achieved in the literature show the effectiveness of the cooling method: Browne et al. [6] utilize nozzles with a diameter of 52 µm and 112 µm at a nozzle pitch of 250 µm and a cavity height of 200 µm to achieve heat transfer coefficients of up to 41.4 W/cm2K on a 1 × 1 mm2 heated area with water as coolant. Ndao et al. [7] use a 2 mm diameter nozzle 1.73 mm over a 2 × 2 mm2 heated area with pin fin enhanced surface, achieving a heat transfer coefficient of almost 9 W/cm2K with R134a as coolant. Although the heat transfer coefficients achieved in these works are very promising, they are achieved with considerable flow rates of coolant over a very small heated area and using peripheral draining of spent coolant. This configuration can lead to jet–jet interactions that are detrimental to the cooling performance as described in [1]. However, while this is the case, Bhunia and Chen [8] showed that the general principle is scalable from very small areas to hundreds of cm2. To alleviate the problem of jet–jet interaction, outlets can be interspersed with the inlets, removing spent coolant before it can cause a deterioration of the performance of downstream jets. A simulation study by Rattner [9] found the use of interspersed outlets to not only improve average heat transfer, but also reduce incurred pressure drop and improved temperature uniformity. This, along with the fact that the cooling performance seen on a small area becomes scalable to large areas with the inclusion of such interspersed outlets has been shown by Wei et al. [10,11]. They showed that when the dimensions of nozzle pitch, inlet and outlet diameter, and nozzle-to-target spacing are kept constant, the cooler exhibits unit cell behavior when scaling, with the cooling performance being dependent only on the flow rate of coolant per nozzle.
However, the general scalability of the cooler geometry is not a remedy for the following concern: The cooling performance of the cooler can only be assured if the flow rate per nozzle is kept constant. Increasing the area over which high performance cooling is to be applied thus means that the total flow rate needs to be increased with every added nozzle. This can quickly result in required flow rates beyond the capacity of any reasonable pump for electronics cooling. Meanwhile, the pressure drop that such a pump could achieve would be nowhere near exhausted. In order to achieve good utilization of both the flow rate a pump can deliver as well as the pressure drop at which it is able to do this, it is necessary to utilize a method of increasing the cooling performance in which the applied coolant flow and the incurred pressure drop are decoupled. In other words, if the cooling performance at a given, desired flow rate can be increased at the cost of additional pressure drop, this means that the capabilities of a given pump can be utilized to its fullest potential. Of course, however, this will always need to happen at the cost of a higher needed pump power, though that is the case for all types of upscaling of cooling.
As a method of increasing heat transfer while constraining the total available coolant flow rate, the authors performed a preliminary investigation of the use of increased nozzle pitches [12]. A heightened heat transfer coefficient was observed for small increases in nozzle pitch at the cost of a higher pressure drop. At large pitch values, however, this beneficial effect on cooling performance was found to saturate. The point at which this saturation occurs seems to be largely dependent on the applied nozzle-to-target spacing.
In this work, experimentally validated models are used to investigate the combined effects of cavity height, nozzle pitch, and nozzle diameter with regard to the aforementioned saturation effect. Using these findings, a method to determine the maximum desirable nozzle pitch for increasing cooling performance at constrained total flow rate is proposed. Section 2 describes both the experimental setup as well as the model setup, definitions of derived quantities, and model validation. The latter is carried out by comparing the results of experimental characterization for two cooler models with significantly different inlet nozzle diameters and modeling results for equivalent cooler geometries. Section 3 introduces the findings of the simulation study performed on the basis of the previously validated model. Evaluation and analysis of the modeling results are presented in Section 4 and a summary is given in Section 5.

2. Methodology

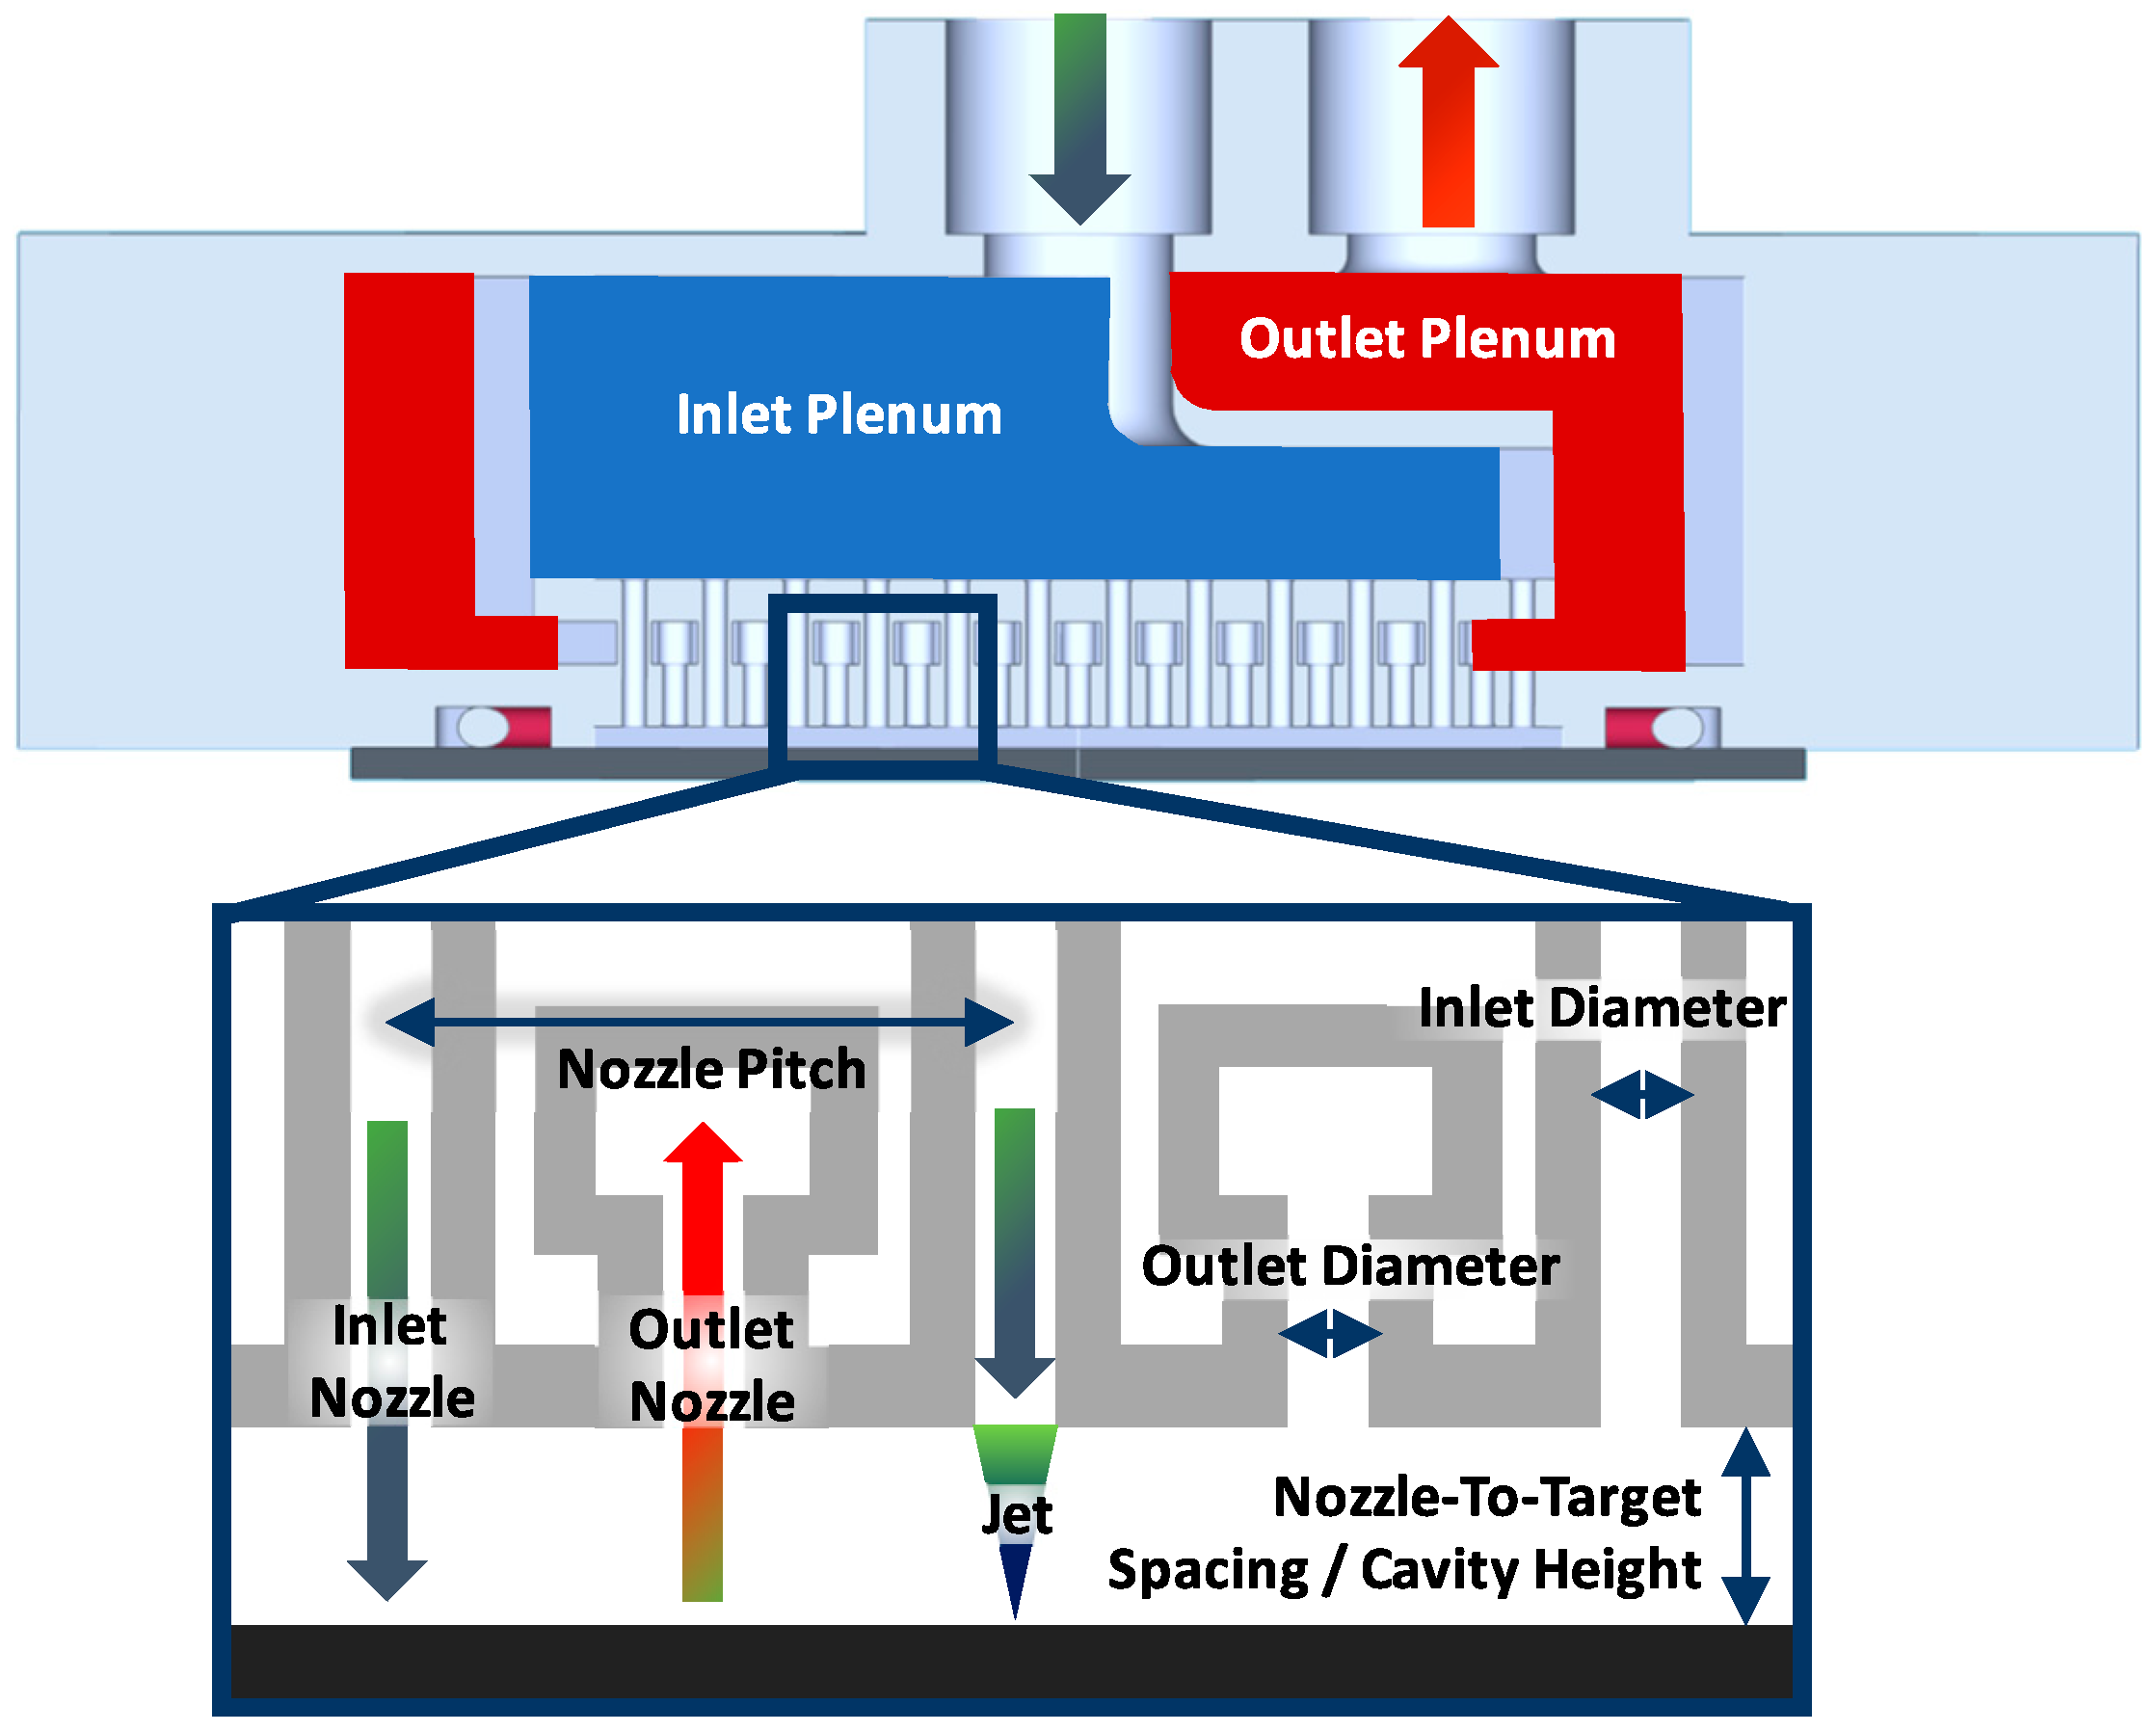
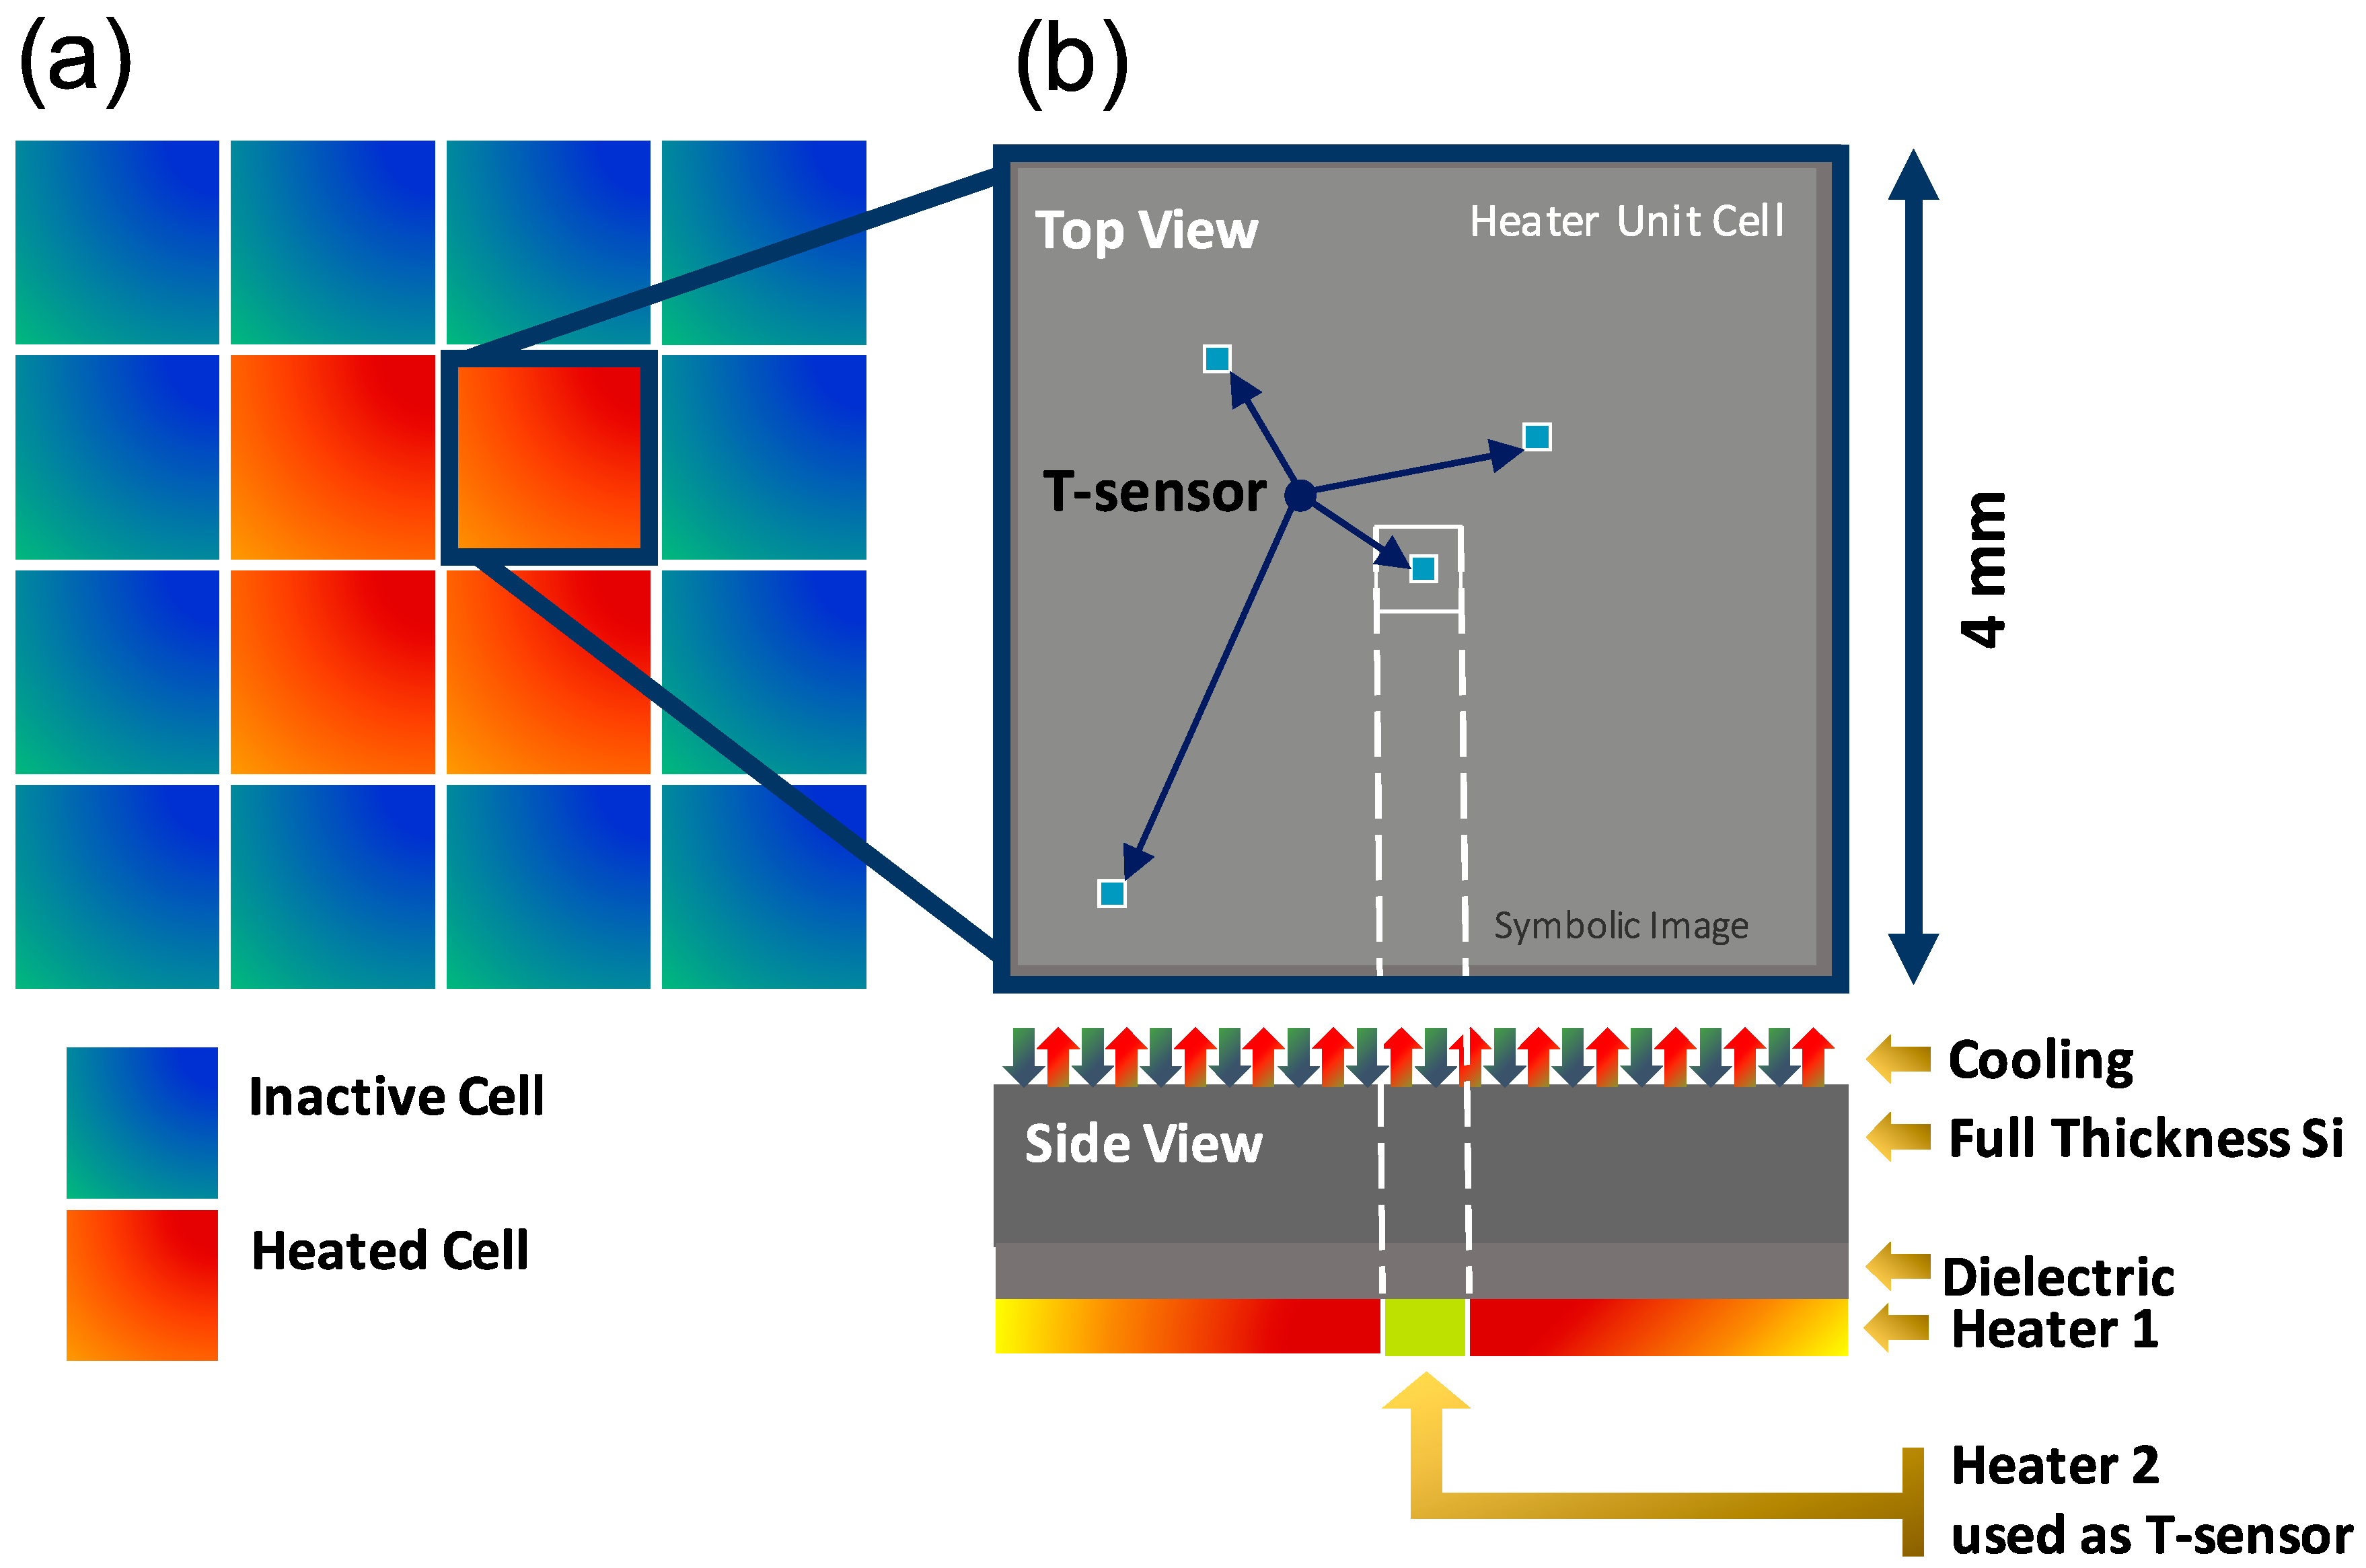
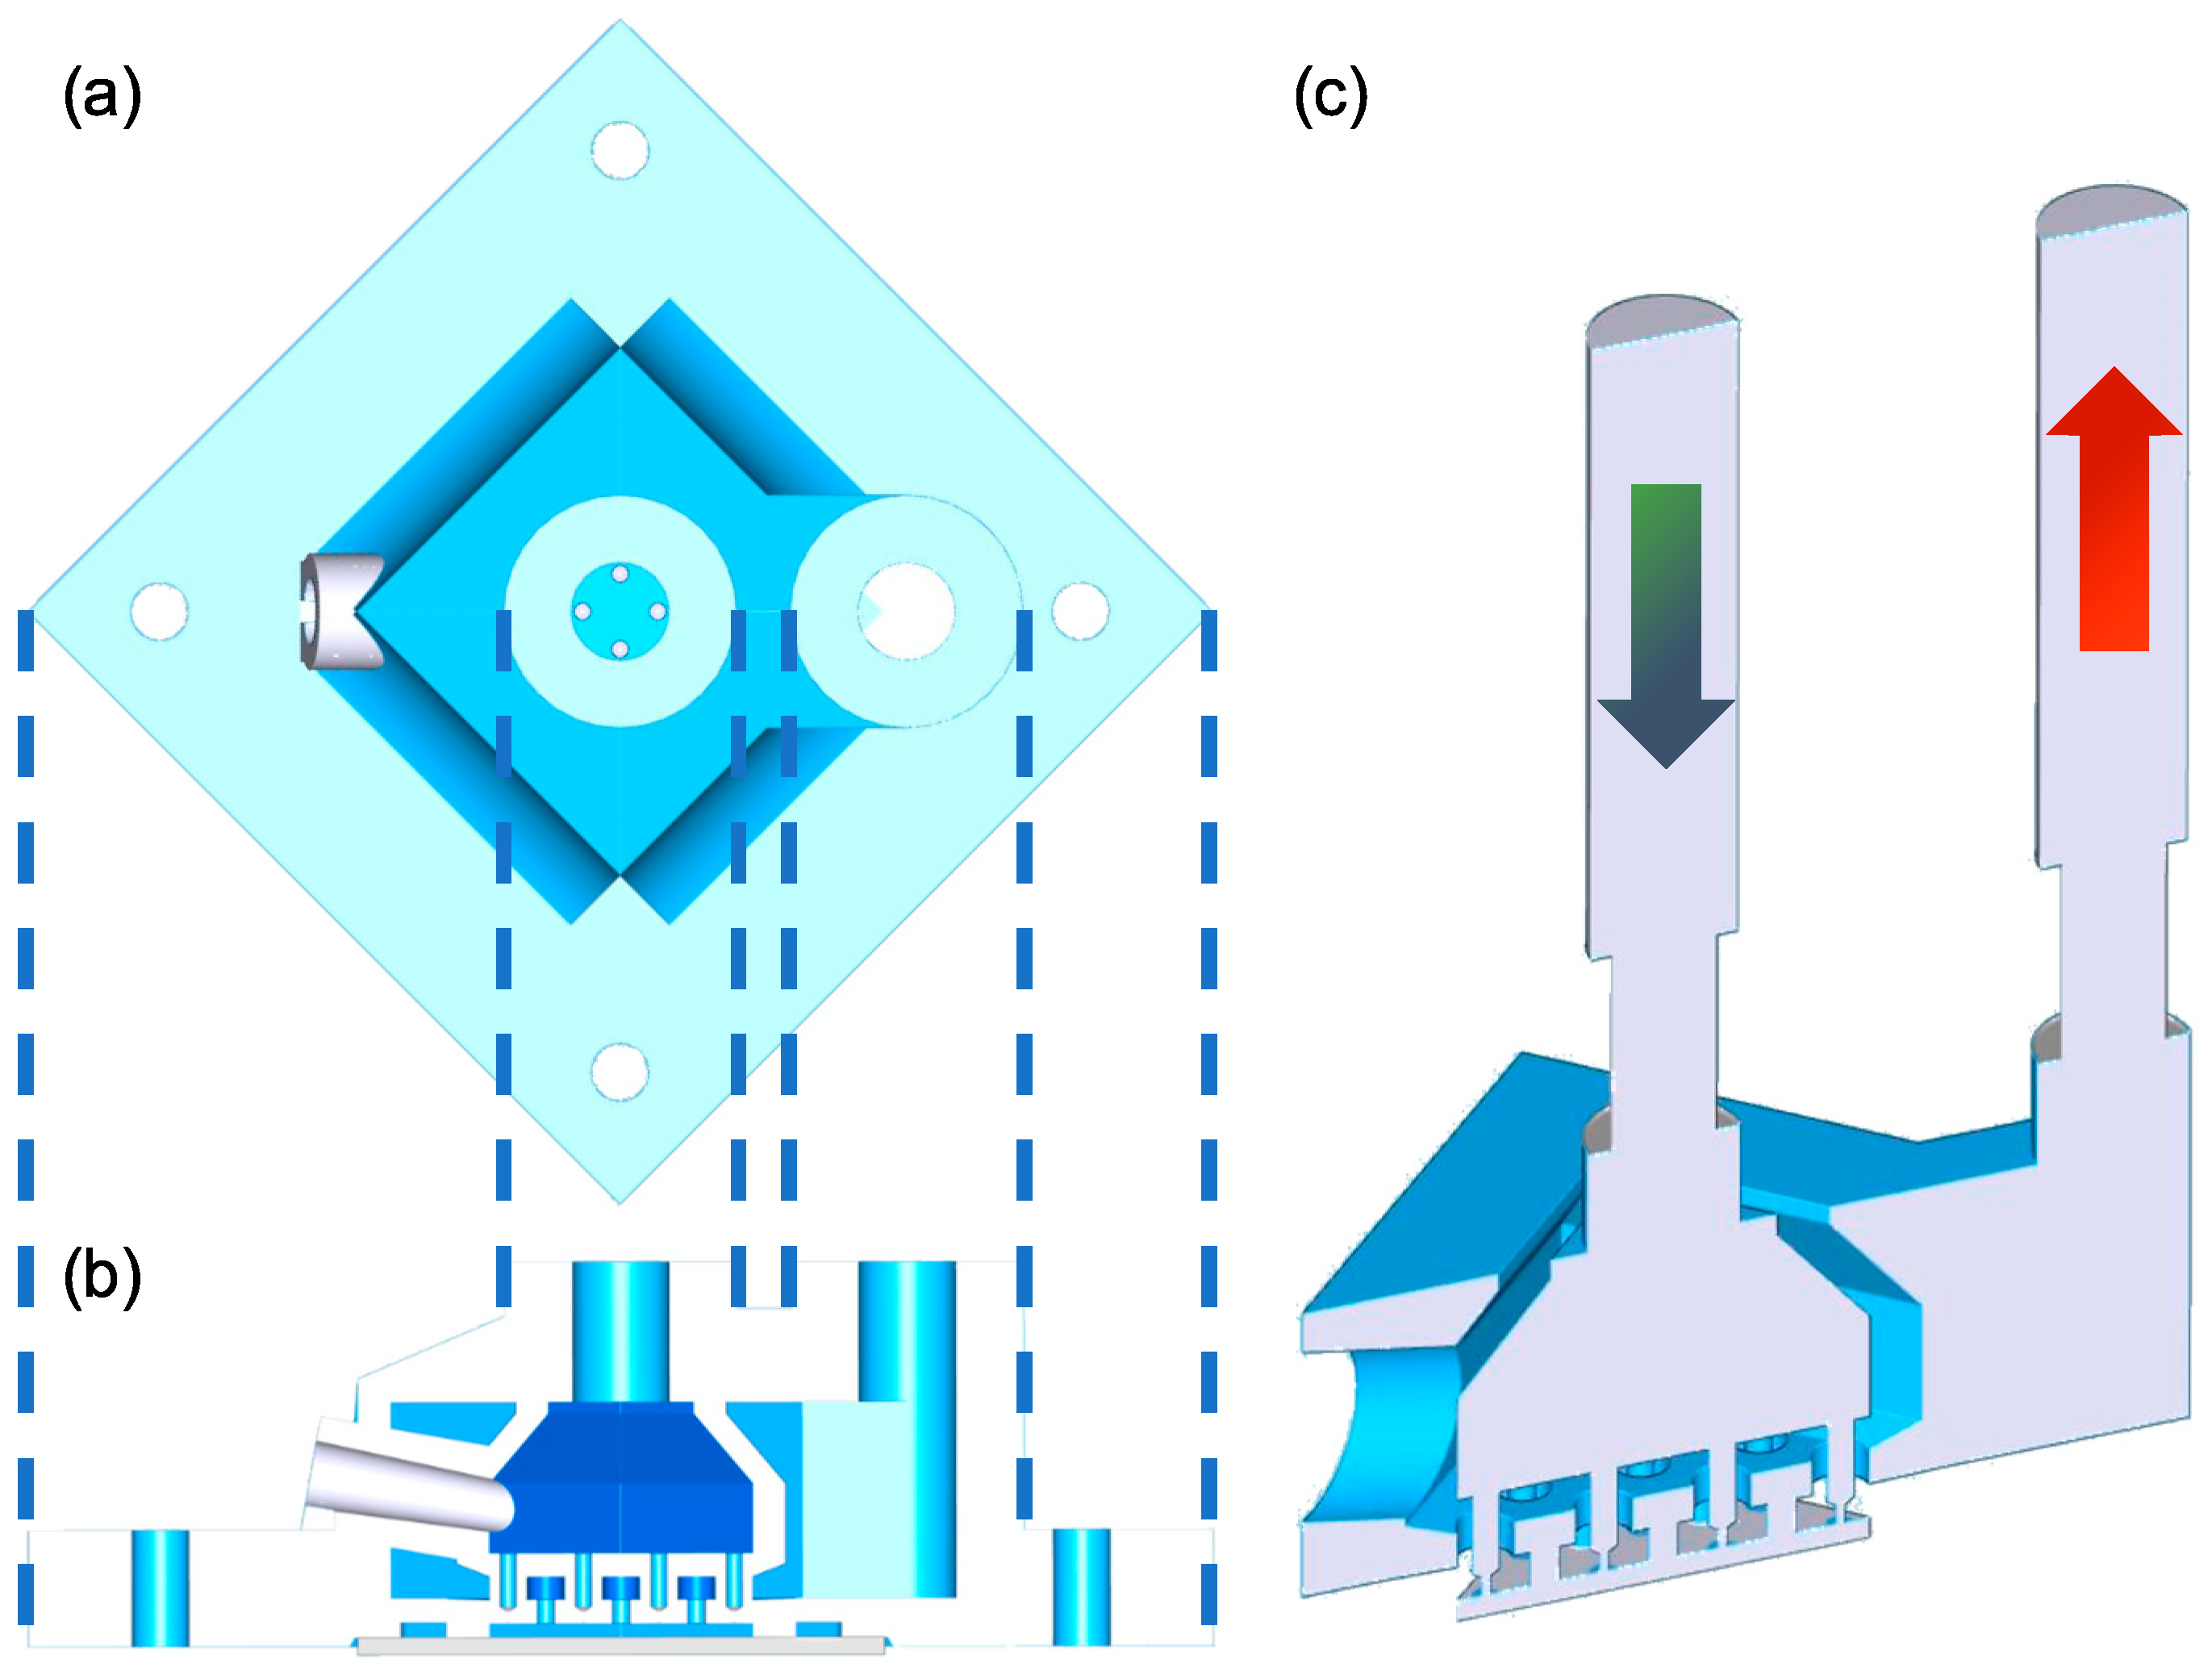
2.1. Experimental Setup
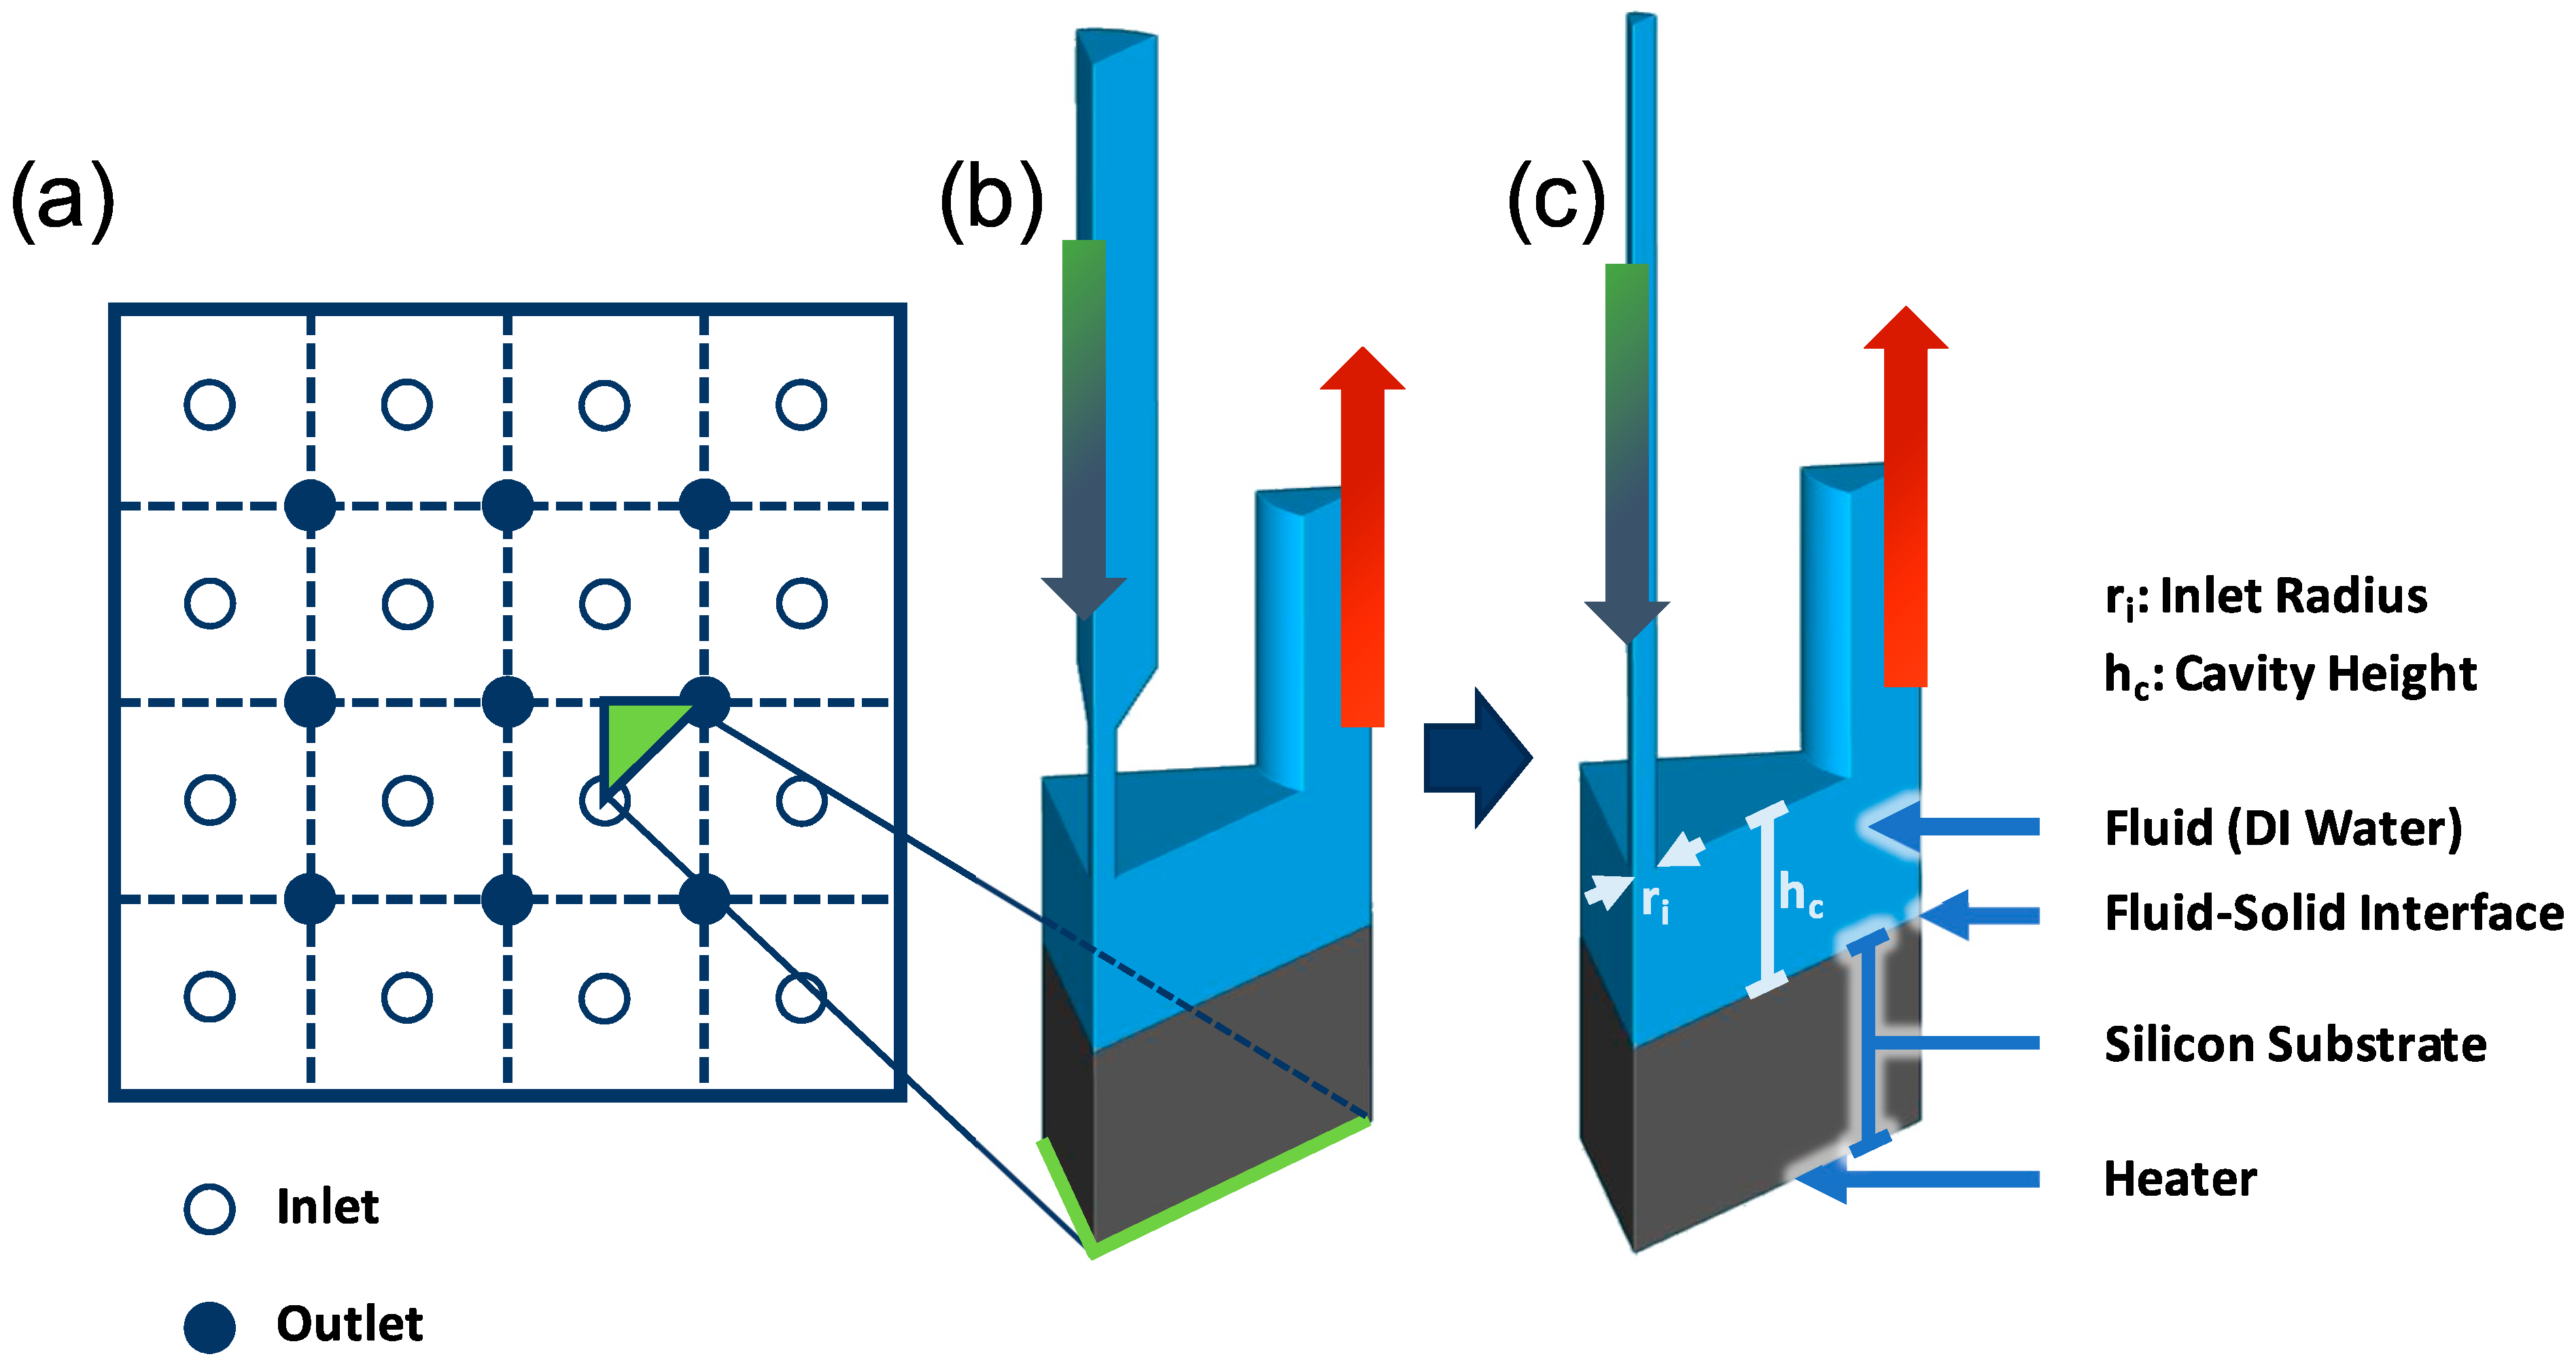
The experimental setup used for model validation in this work consists of the following: A pump capable of providing a flow rate of 3 L/min at a maximum pressure drop of 5 bar (limited for system safety) delivers DI water as coolant to a 3D printed and micro-machined impingement cooler attached to a thermal test chip described in Figure 2 and below. The spent coolant is then circulated through a heat exchanger back to the pump. The heat exchanger is driven by a secondary flow loop, providing cold coolant at 20 °C from an external chiller.
The thermal test vehicle (TTV) used in this work is an in-house developed and fabricated thermal test chip. The chip has a modular design consisting of 4 × 4 mm2 unit cells (UCs) (see Figure 2b). A single unit cell includes 4 dedicated temperature sensors of 40 × 40 µm2, a central hotspot heater of ~0.4 × 0.4 mm2 and a large uniform heater covering the remaining area. Both heaters are calibrated copper-meander heaters protected by passivation that can be used as temperature sensors, as is the case in the central hotspot heater. Heaters and sensors are all in the same back end of line (BEOL) metallization layer of the chip. Thus, while the lateral positions of the components are mutually exclusive, they are all at the same distance from the cooling applied at the chip backside, which is separated from heaters and sensors by full thickness (760 µm) silicon and a layer of dielectric SiO2. In this work, the large heater comprising most of the chip area is used for heating and the central hotspot heater is used for temperature sensing. At the location of the central heater, a temperature change compared to zero applied power is measured as the change in resistance of the sensor and converted to a temperature difference by means of the thermal coefficient of resistance (TCR) of the copper meanders. Additionally, voltage applied to the heaters (U) and the resulting current (I) are recorded for calculation of the applied heat flux as
q h e a t e r = U · I A h e a t e d ,
with the total heated area Aheated. As the configuration of the TTV used in these experiments (see Figure 2a) consists of a total of 4 × 4 unit cells amounting to a chip size of 16 × 16 mm2, but with only the main heaters of the central four cells being heated, this total heated area amounts to roughly 8 × 8 mm2. From the calculated heat flux and the measured temperature increase, an effective heat transfer coefficient can be calculated for the heater/sensor as follows:
h h e a t e r = q h e a t e r T .
This value corresponds to the total thermal resistance between the heat source and the coolant inlet temperature and also includes the thermal resistance contribution of dielectric and silicon between the sensor and the coolant chip. Assuming 1D heat transfer, the convective transfer coefficient on the chip to coolant interface can be extrapolated as
h i n t e r f a c e = 1 h h e a t e r t S i k S i + t S i O 2 k S i O 2 1 ,
with tSi and t S i O 2 as the thickness of the silicon layer and the dielectric layer, respectively. In turn, kSi and k S i O 2 are the thermal conductivities of the two materials.
For temperature sensing and heating, the TTV is connected to a voltage source and multimeters via a printed circuit board (PCB) to which the TTV is glued and wire bonded through a cutout in the PCB (see Figure 3). Screw holes in the PCB then allow the cooler to be clamped to the backside of the chip. Sealing is achieved by an O-ring, which is placed on the outer ring of inactive cells of the TTV, and watertightness ensured by the clamping of the cooler and the PCB.
The cooler itself is fabricated using a combination of stereolithography 3D printing and CNC drilling. The main body of the cooler is 3D printed as seen in Figure 4a,b. At this stage, the inlet nozzles are only partially formed and still closed. Thus, the inlet plenum requires a secondary port to facilitate extraction of unexposed resin. This port, however, is closed off by epoxy putty after printing. The inlet nozzles themselves are also created after printing by CNC drilling using 250 µm and 500 µm drills. A diameter of 250 µm is chosen, as it is shown to be advantageous for heat transfer in [12], and 500 µm is chosen as a large diameter counterpart. The relevant dimensions of the two cooler models used in this work are listed in Table 1.

2.2. Model Setup

Steady-state modeling is carried out using computational fluid dynamics (CFD) simulations in Ansys Fluent 2021R2 and 2023R2. A part of the simulations is performed using a purely hydraulic model. For the most part, however, CFD modeling is used in conjunction with Conjugate Heat transfer (CHT). The computational domain of the models is reduced by means of symmetry and by the use of two levels of detail inclusion, either representing the full cooler or reducing the simulated area to the nozzles and impingement cavity.
Figure 4c shows a negative of the impingement cooler, including an area for the pipe attachments and a part of the piping, halved by a plane of symmetry. This geometry is used for purely hydraulic simulations. For the needed simulations with conjugated heat transfer that were performed in the course of this modeling study, however, this computational domain would be quite large, even though it has already been reduced twofold. The sought after, much smaller modeling domain can be achieved by neglecting inlet and outlet plenum effects and only simulating the inlet nozzles, the impingement cavity, and the outlet nozzles. When outlets are interspersed in between inlets in a grid, as seen in Figure 5a, further domain reduction via symmetry is possible, resulting in small, nozzle level unit cells of the form shown in Figure 5b,c. The nozzle shape of Figure 5b is modeled after the nozzles created by 3D printing and drilling in the fabricated cooler, while the straight nozzle shape of Figure 5c is the mainstay of the later simulation study. That the cooling performance of these two nozzle shapes is virtually identical will be shown in Section 2.4.
The CFD simulations, of course, not only include the cooling fluid, but also a representation of the chip. The models used here employ a 720 µm thick layer of silicon interposed between the heat source, modeled as a constant heat flux boundary condition and the coolant–chip interface. Average temperature is measured at the location of the heat flux boundary condition (THFBC,av.) or at the coolant–chip interface (Tinterface,av.) and in combination with the applied heat flux (qheater) and the inlet temperature of the coolant (Tinlet); an average heat transfer coefficient is calculated either for the surface or at the heater location as follows:
h H F B C / i n t e r f a c e , a v . = q h e a t e r ( T H F B C / i n t e r f a c e ,   a v .   T i n l e t ) .
In order to include the temperature drop due the conductive thermal resistance of the silicon and the silicon oxide between the heat source in the BEOL and the chip surface, an equivalent thermal conductivity is applied for the Si substrate material in the model: this equivalent thermal conductivity is estimated using a series connection of the thermal resistance of the silicon oxide and silicon layers (the thickness and thermal conductivity), assuming a 1D heat flow through those layers from the heat source towards the silicon surface. Including the very thin oxide layer (500 nm) in the model would significantly increase the mesh size due to requiring a much finer mesh than the other domains.
In this work only the resulting effective heat transfer coefficient at the heater location, denoted as hheater, is reported. This value is used for the comparison between experiments and simulations, and also different simulated geometries. Tetrahedral meshing has been used, with 20 inflation layers being added within the fluid domain at every fluid–solid interface. Grid convergence tests are performed according to Roache [13], with grid convergence indexes remaining below 0.001 for the used mesh sizes between 400,000 and 4,000,000 elements with 20 inflation layers on all walls. All simulations are carried out in Ansys Fluent 2021R1 and 2023R2. In this framework, a velocity inlet and a pressure outlet condition are used for coolant injection and extraction. The extension of the unit cell is modeled using symmetry boundary conditions on the sides of both the fluid as well as the solid. Heating is applied as a constant heat flux boundary condition at the bottom of the solid domain.

2.3. Derived Quantities

Aside from the already described effective heat transfer, the Nusselt number and the Reynolds number are also calculated for the impinging jets for the comparison of different geometries and flow conditions. Here, the Jet-Nusselt number is calculated as
N u j e t , a v . = d i · h h e a t e r , a v . k c ,
with the inlet diameter di and the thermal conductivity of the coolant (DI water) kc. The Jet-Reynolds number is calculated as
R e j e t = d i · v i ν
with the inlet velocity vi and the kinematic viscosity of the coolant ν.
Reported heat transfer coefficients (such as the 8.7 W/cm2K reported by Brunschwiler et al. [4]) and Nusselt number (for example ranging between 10 and 80, as seen in Browne et al. [6]) are mostly calculated for the coolant–chip interface. In contrast to that, in this work, reported numbers are always calculated for the heater-location and include the thermal resistance of the TTV. Conversion to interface values can be solved by Equation (3).

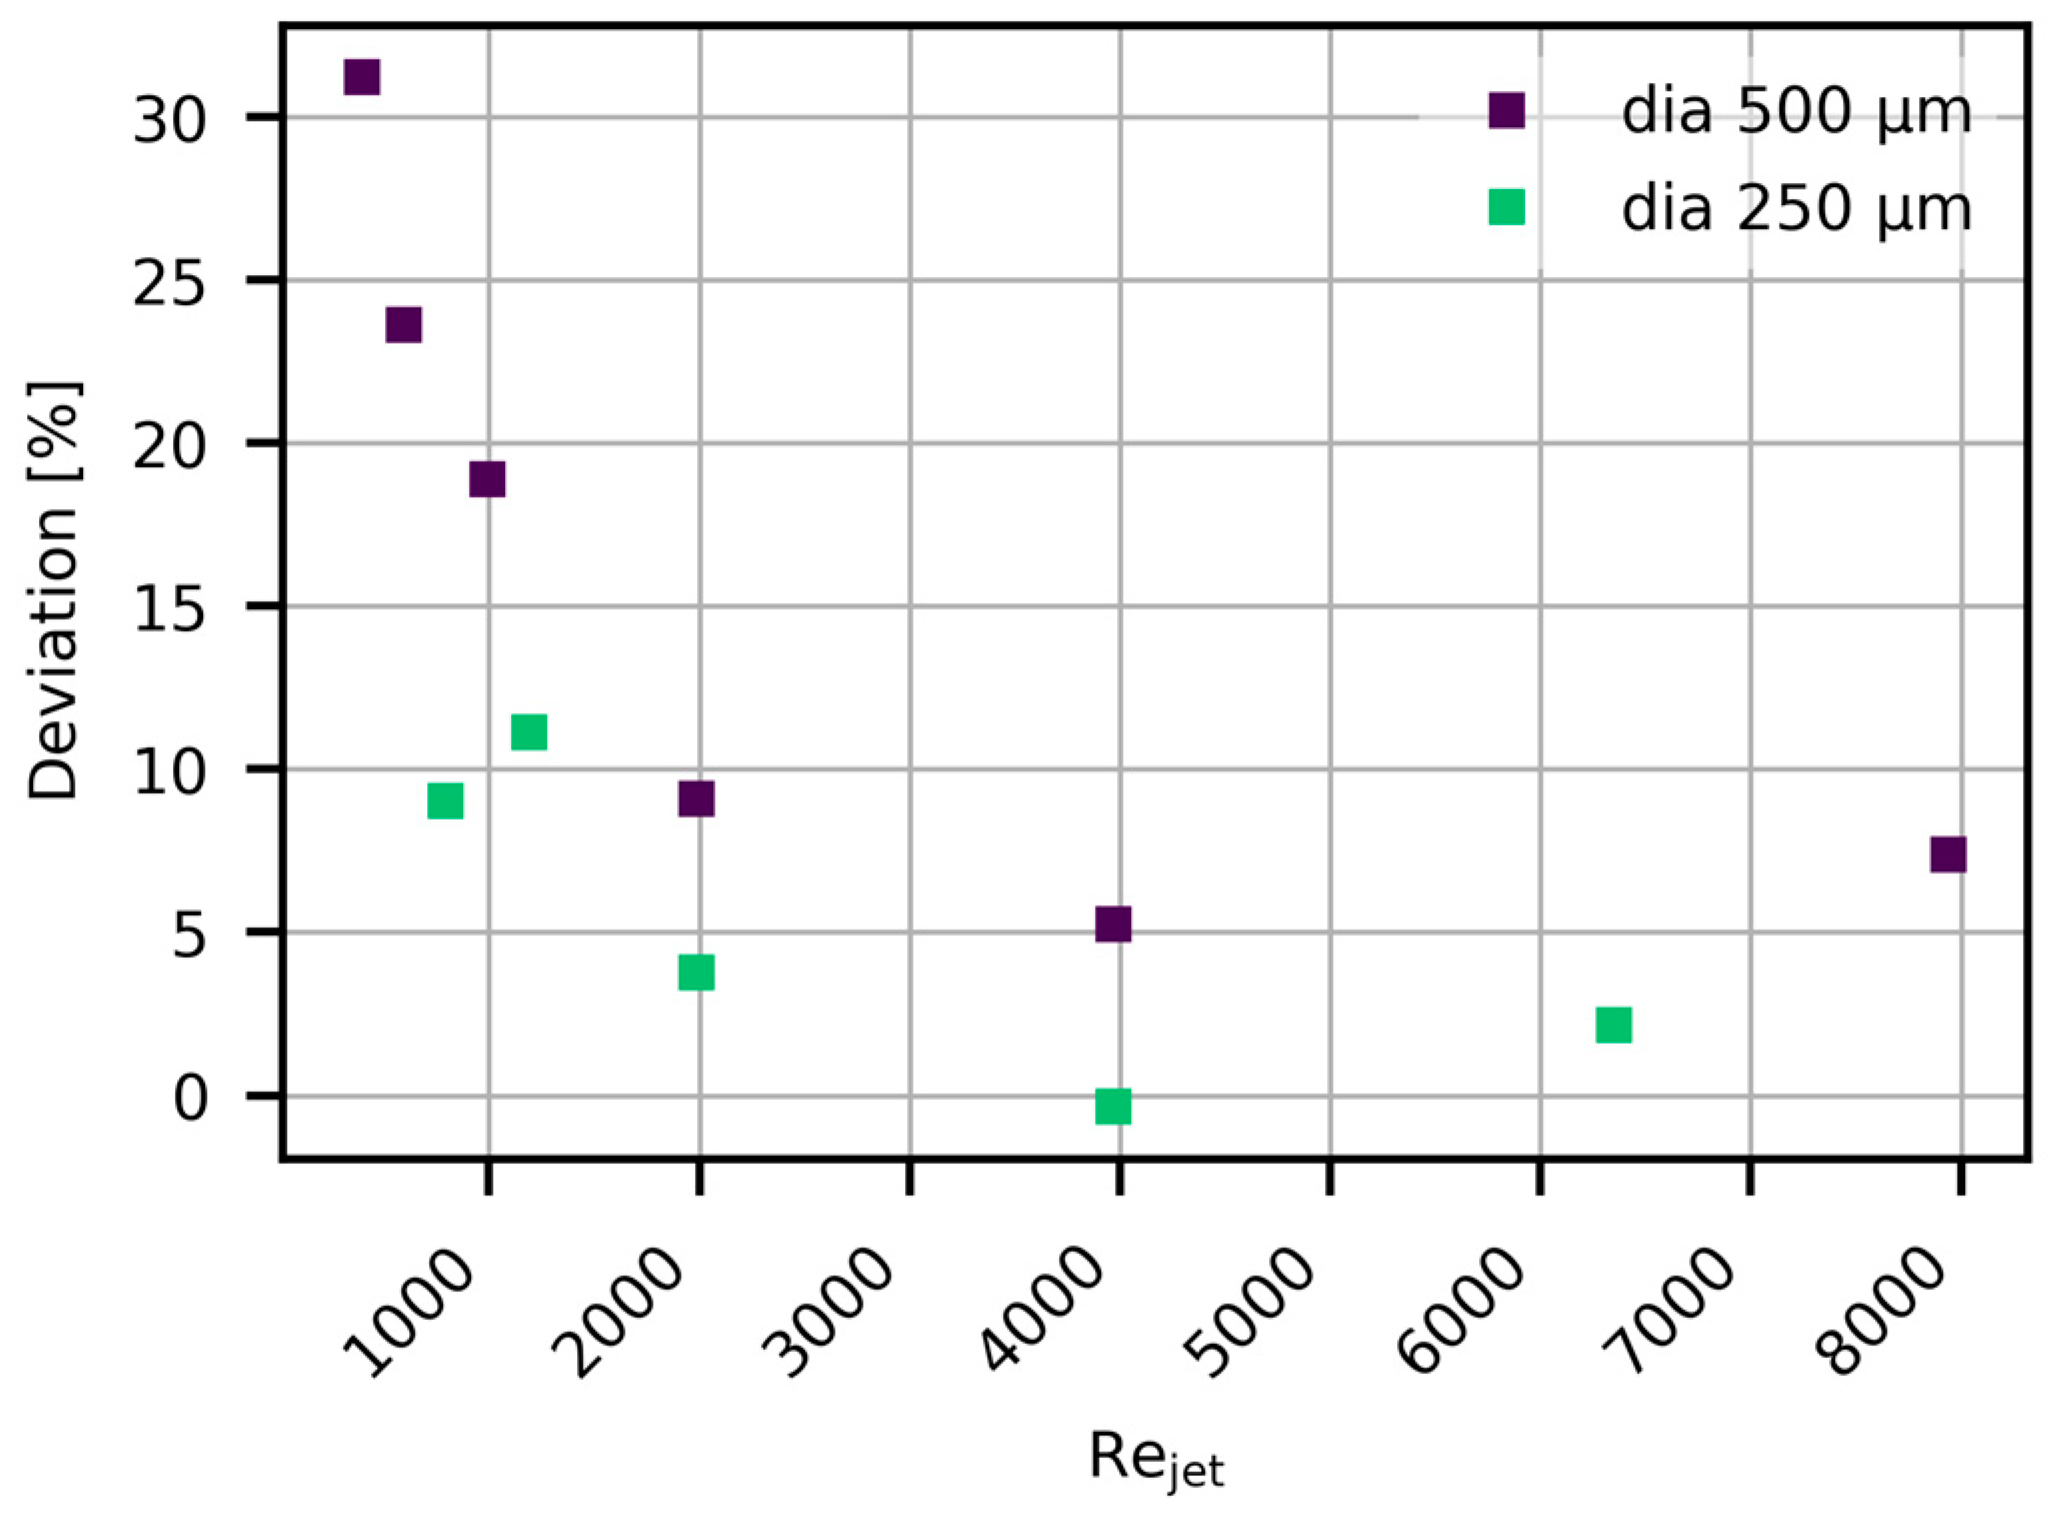
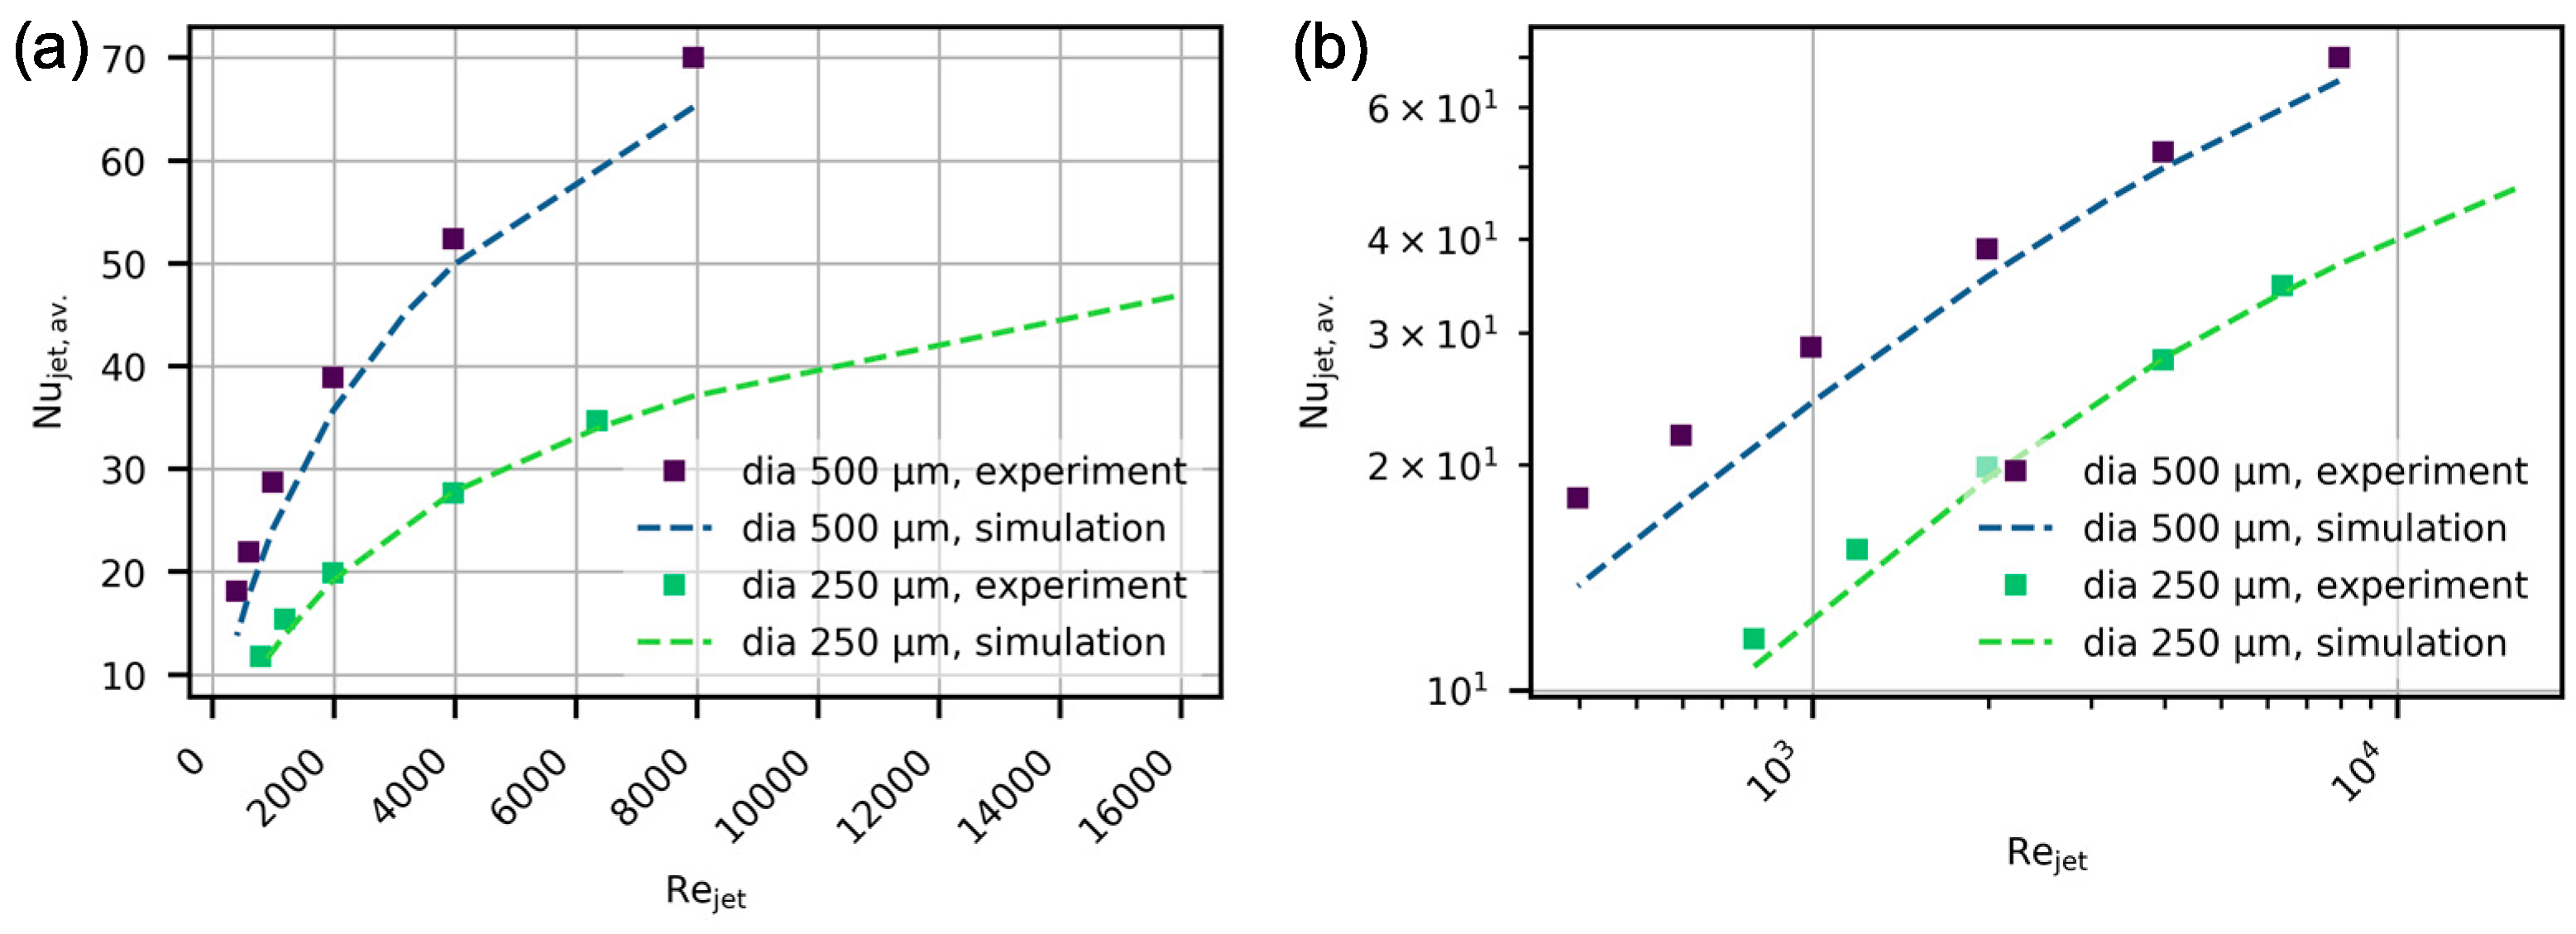
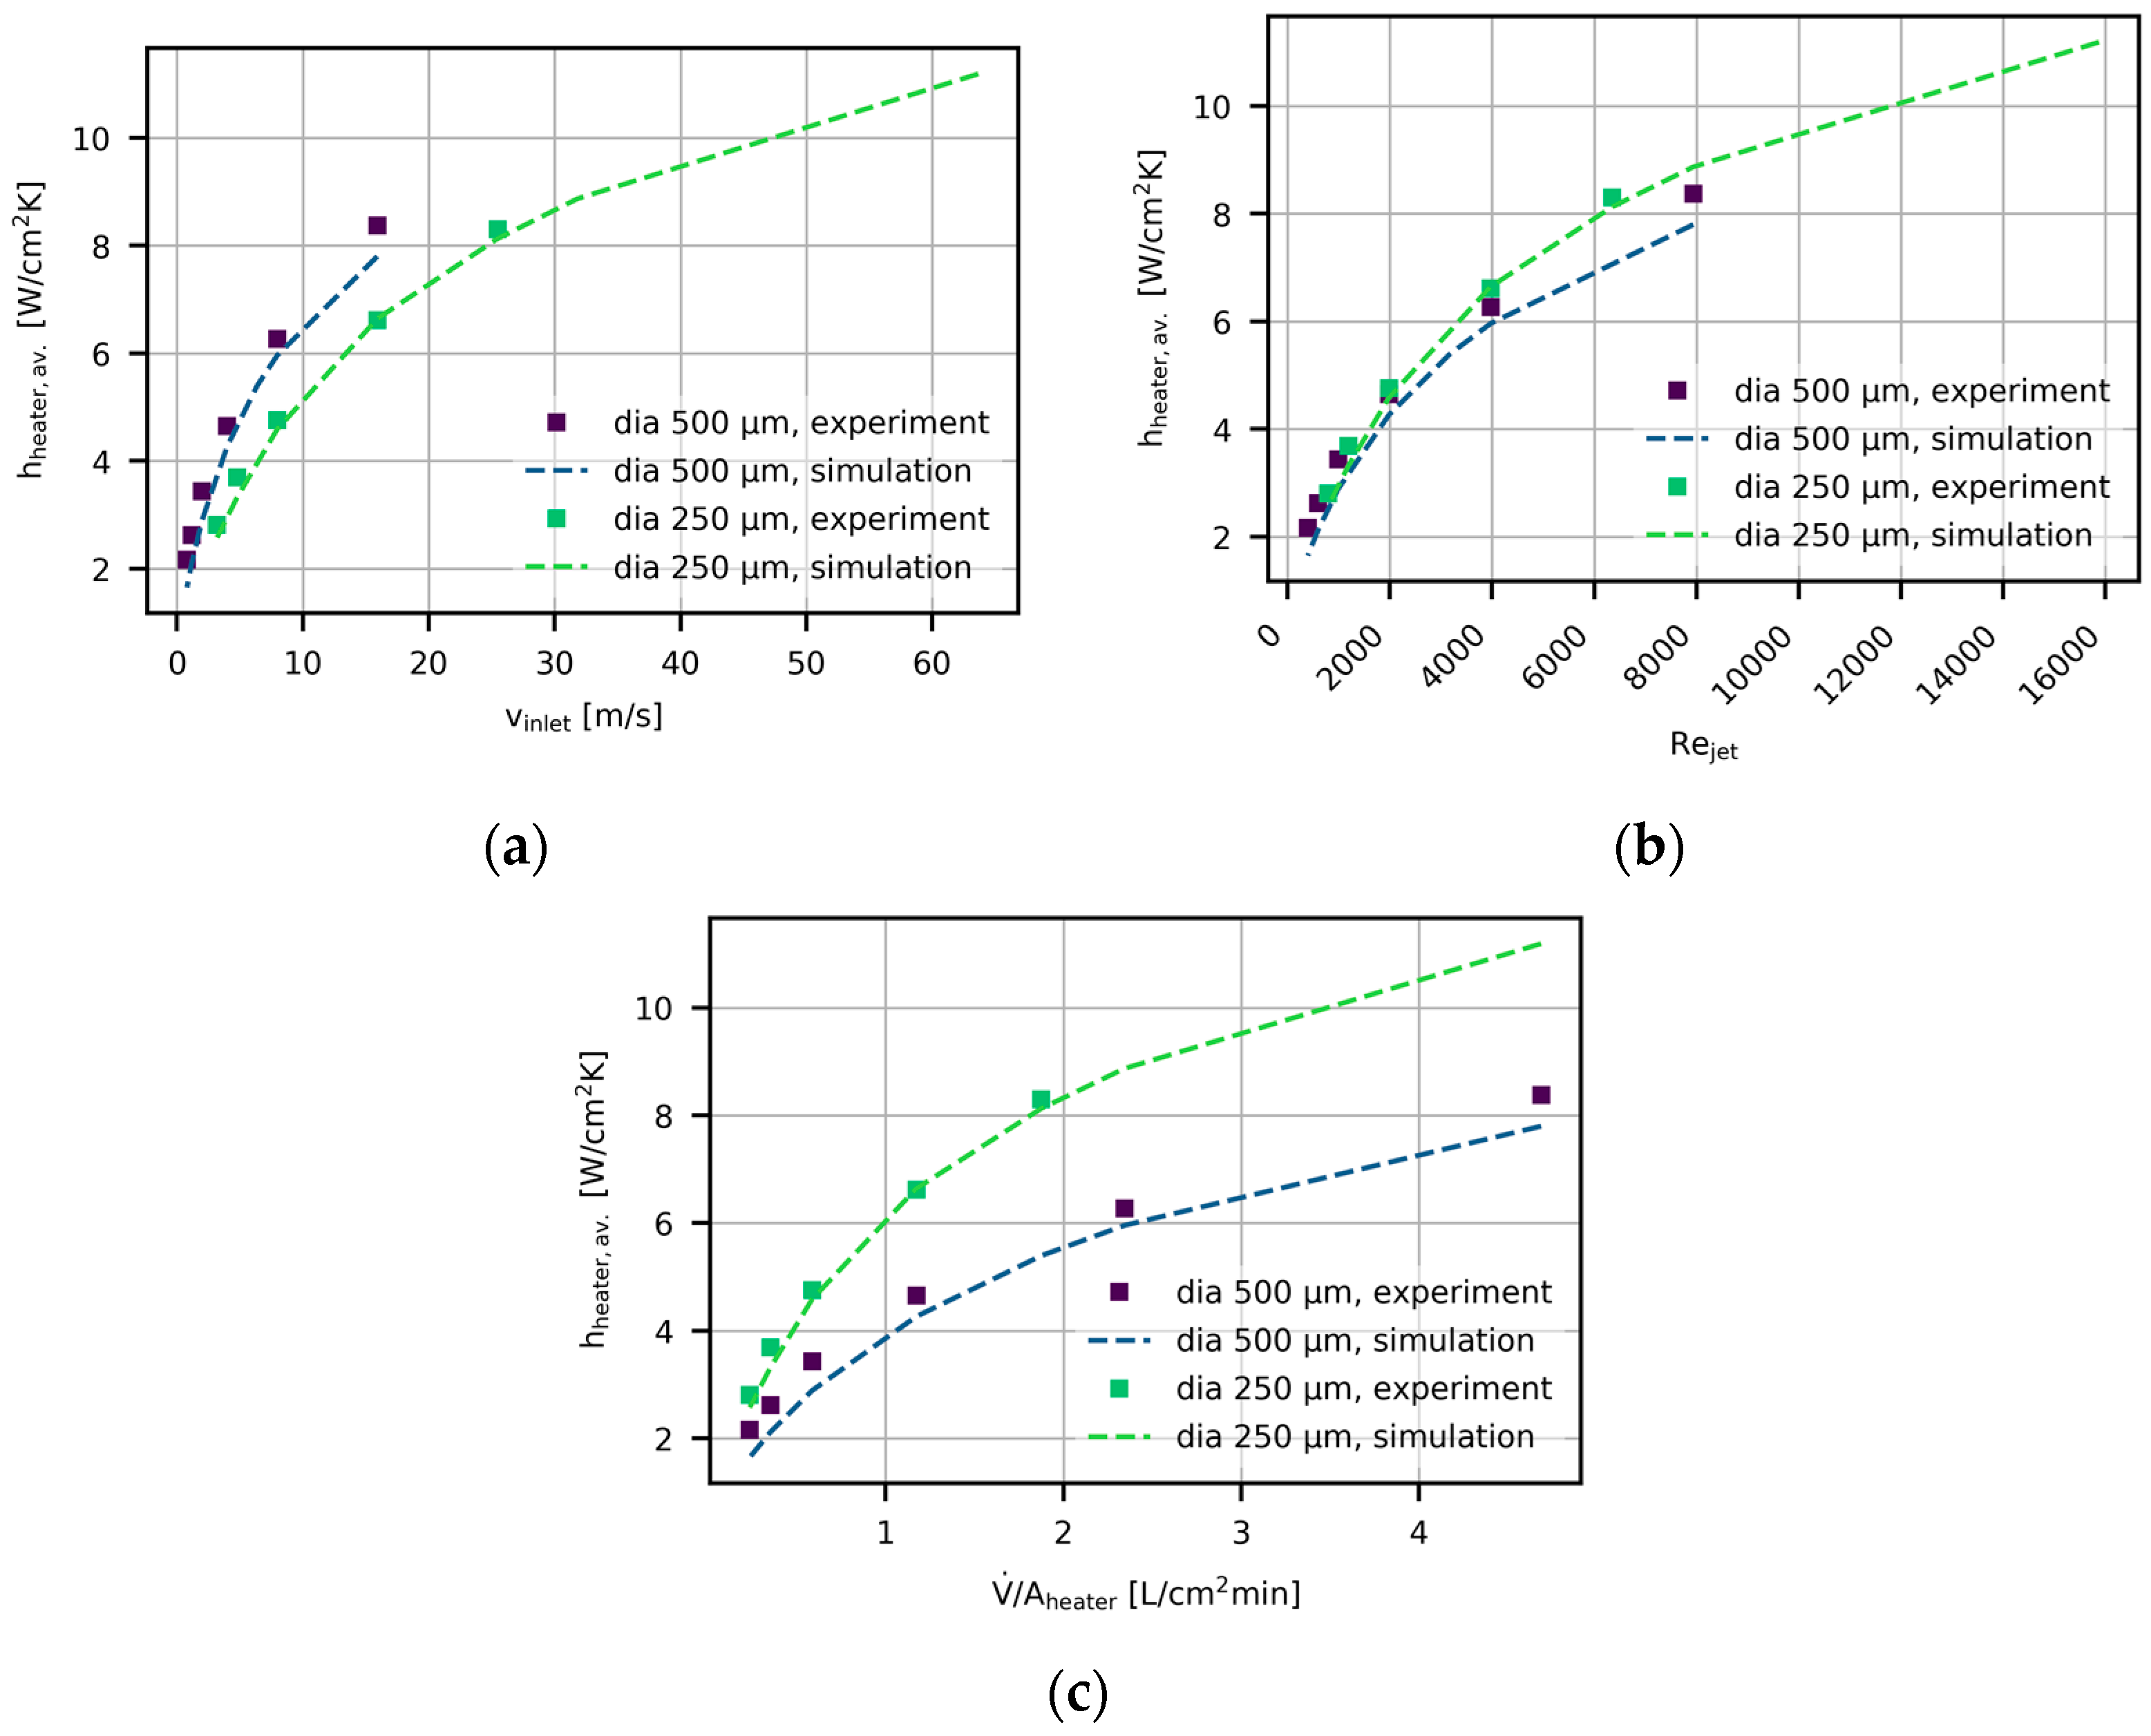
2.4. Model Validation

As the simulations are carried out in steady state, naturally, the experiments used in their validation also need to yield steady-state results. This is ensured by the following measures: A feedback loop control ensures that the pump delivers a constant, set flow rate of coolant. Coolant temperature, in turn, is kept stable utilizing a secondary cooling loop employing an external chiller. With the cooling in place, the temperature response of the system is measured for a set of different values of dissipated powers between 0 W and 20 W over a heated/cooled area of 8 × 8 mm2. For each step in dissipated power, a wait time of 3 min is used to ensure that the system has reached a stable temperature. From the slope of the measured temperature increase versus the applied power, the effective heat transfer coefficient at the sensor location can be calculated.
Experiments and simulations were performed for both cooler versions described in Table 1 for different flow rates per heated area. Simulations were carried out using the nozzle level unit cell modeling domain shown in Figure 5b. As the spread of flow rates results in Jet-Reynolds numbers between 300 and 8000, different turbulence models were tested for the simulations. Namely, k-ω, transition k-ω, and transition SST (Shear Stress Transport). Results of these simulations are compared to the experiment in Figure 6. For both 250 µm and 500 µm inlet diameter, the simulations agree well with the experiments, the transition SST appearing to give the best overall agreement.
In all cases, however, simulations show a slight underprediction of the heat transfer coefficient for lower Reynolds numbers. When plotting the percentual deviation of the simulation results from the experiment—as shown in Figure 7—it becomes clear that there is an increasing error in the simulations for smaller Reynolds numbers. This increase in error for lower flow Reynolds numbers—and with that also lower flow rates—can also be seen in the comparison of full cooler and nozzle level unit cell simulations as shown by Wei et al. [14]. Nevertheless, the deviation remains within reasonable bounds for most of the investigated spread of flow rates.
Alongside this validation of the thermal results obtained from the model, a comparison of the obtained results for the incurred pressure drop is shown in Figure 8. For both cases, the evaluated half cooler models show very good agreement with the experimental results. For the nozzle level unit cells, where only the pressure drop over the nozzles and the cavity is measured, it is expected that the model significantly underpredicts the experimental values for relatively large nozzle diameters, as shown by Wei et al. [14]. This is indeed the case for the tested 500 µm diameter nozzles, as seen in Figure 8a. In contrast to this though, for the smaller nozzle diameter of 250 µm, the nozzles contribute to the majority of the pressure drop, as seen in Figure 8b. Thus, for small nozzles, a pressure drop estimate can already be made from nozzle level unit cell simulations.
Finally, the effect of the change in nozzle shape, as seen between Figure 5b,c was investigated by simulation. As can be seen in Figure 9, the results are in excellent agreement both for different cooler geometries and for different flow rates, thus giving good confidence in the nozzle level unit cell model with straight inlet and outlet nozzles (Figure 5c), which were used for the following simulation study.
Of course, the presented method of experimental validation has its limitations and shortcomings, which also should be highlighted here. One main point to be addressed is that using a setup such as this, which attempts to mimic real application conditions, will not allow for reasonable integration of a flow visualization setup. Thus, simulated flow lines cannot be directly compared to experiments, and one needs to rely on thermal data and the measured pressure drop for an indirect validation. Smith et al. [15], however, showcase a comparison of simulation results with experimental flow visualization. An additional limitation of the experimental setup used here is the limited resolution of the thermal sensors: the thermal test chip only gives an average value of the temperature increase at the central region of each of its 4 × 4 mm2 unit cells. An example for the use of a higher resolution test chip to resolve temperature gradients caused by the flow pattern can be found in Wei et al. [16]. Also, the pressure drop in the described setup can only be measured across the whole cooler between the inlet and the outlet connections and not at the nozzle level. Nevertheless, the modular nature of both cooler and test chip creates a basis of experiments which can be expanded upon in future studies to cover the nozzle pitch adjustments suggested in this work and applied to scaled up cooling configurations.

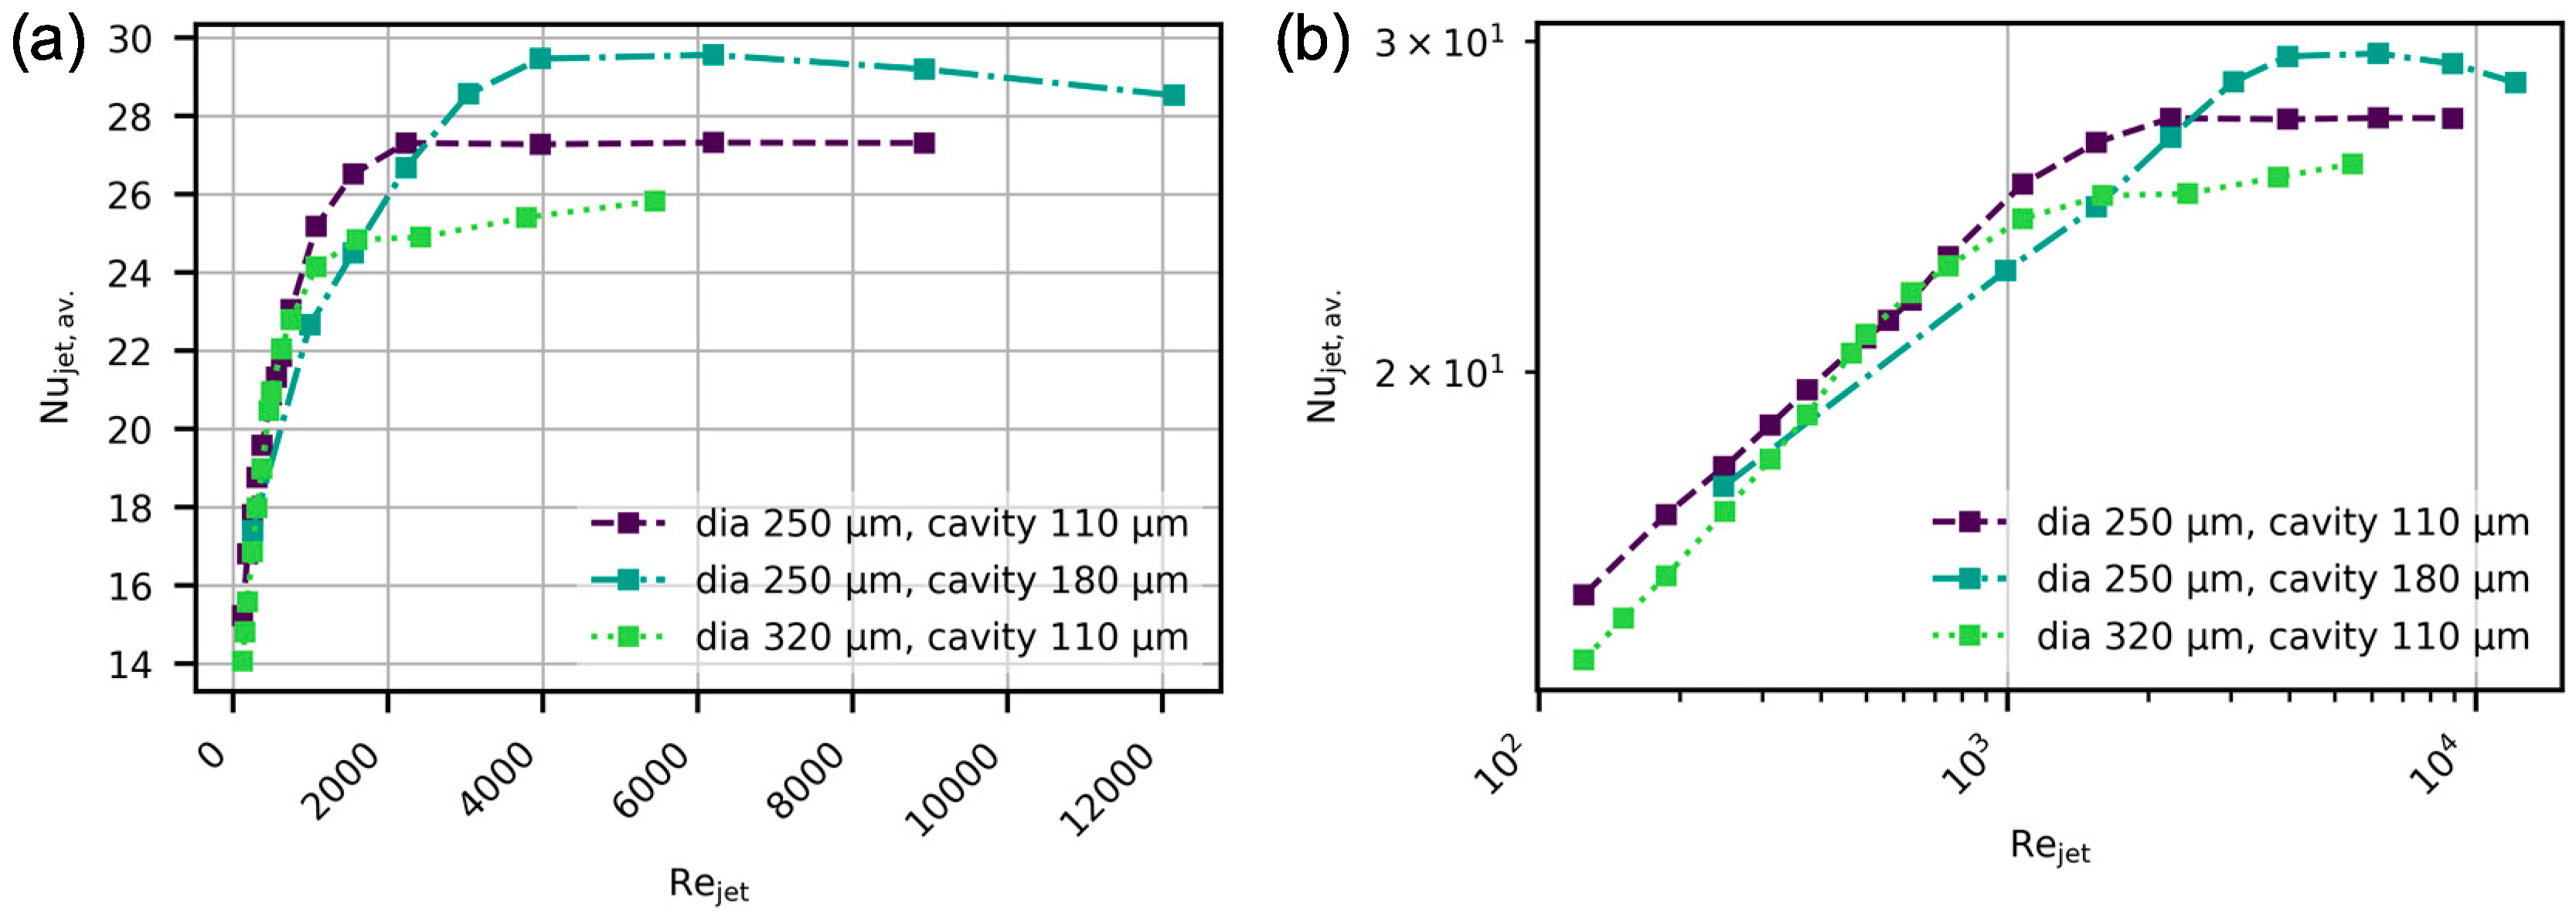
2.5. Representation of Results
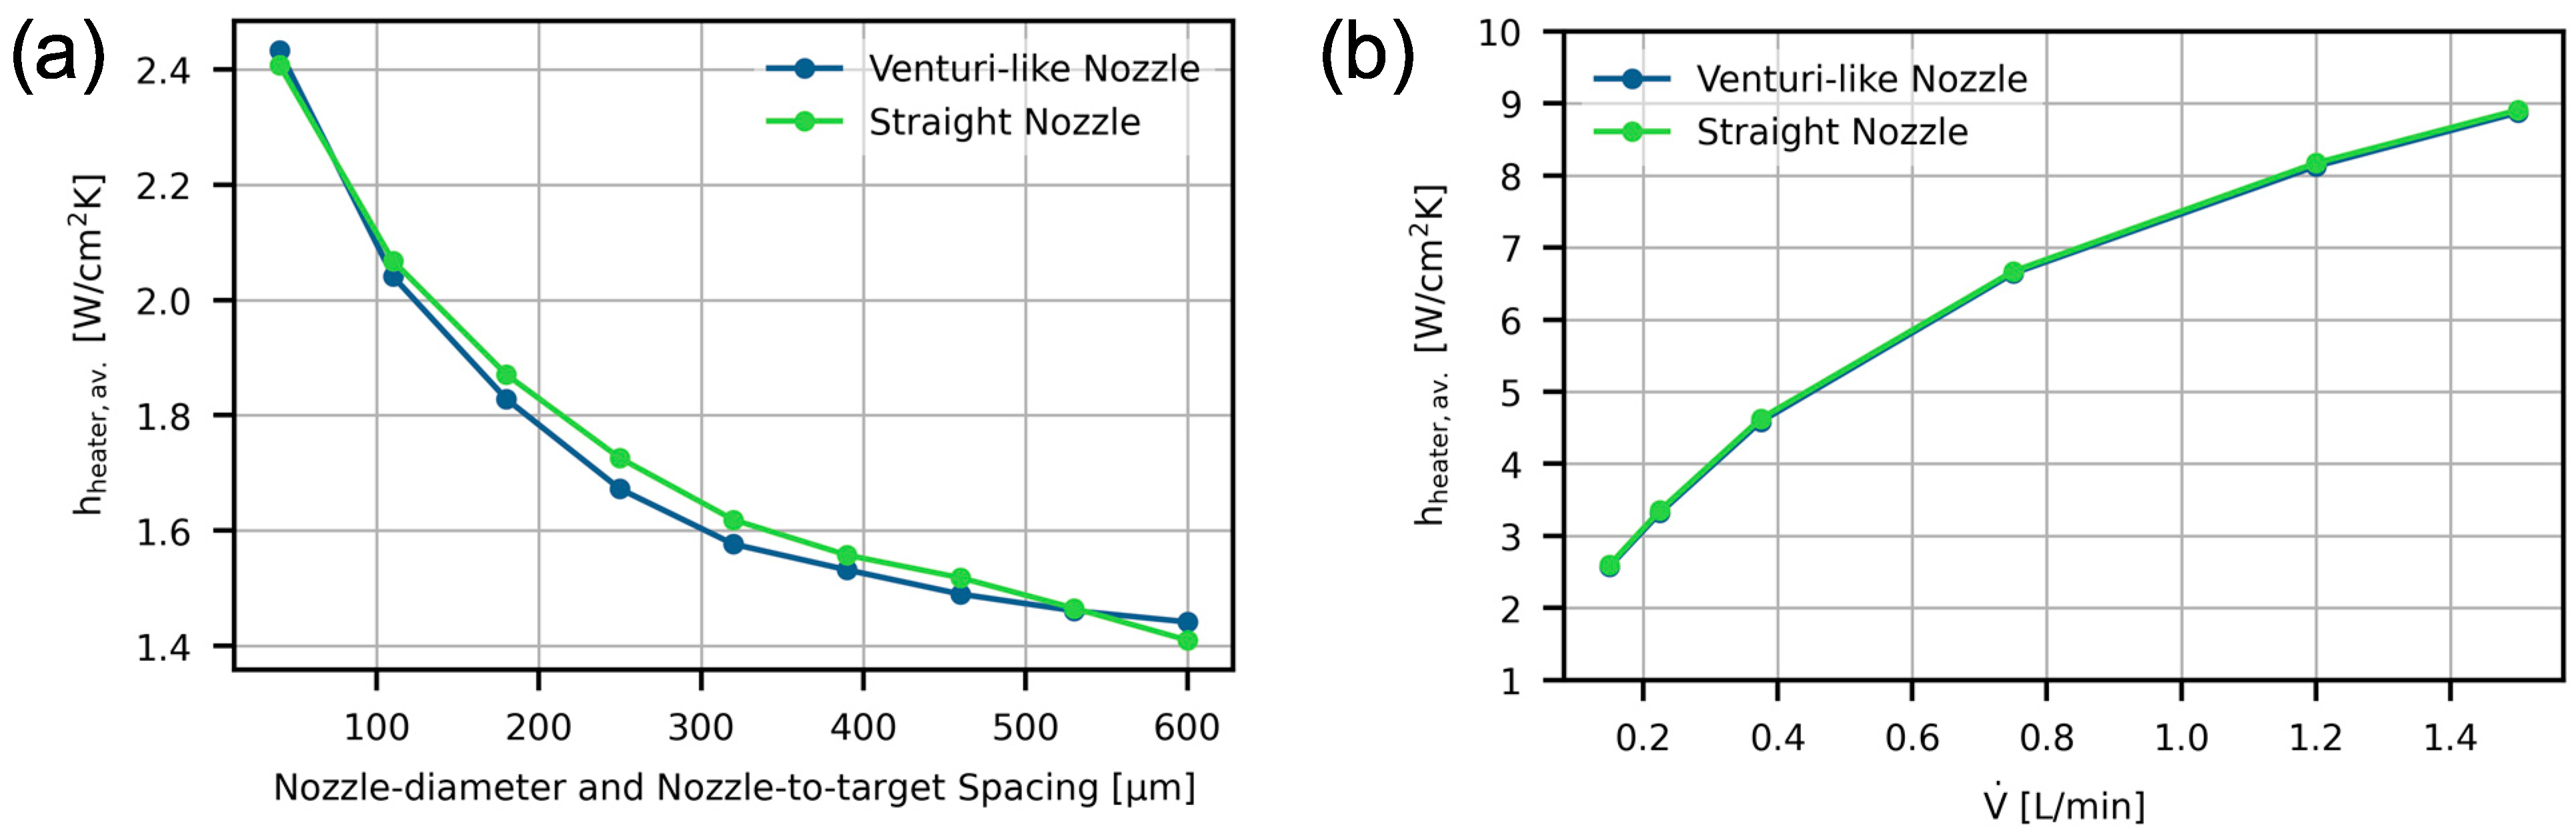
How the results obtained from experiments and simulations are presented determines what information can be gleaned from the data and what conclusions will be drawn. An example of this can be seen in Figure 10 for the previously shown model validation data. Figure 10a shows that, as expected, at an equivalent jet velocity, a geometry creating a jet of a larger diameter—500 µm—results in a better average heat transfer, as a larger region of the heated surface is covered by the high heat transfer region of the stagnation zone of the jet, directly below the inlet nozzle. This would give the impression that a larger diameter inlet nozzle is preferable, a conclusion which will be turned around when looking at other metrics. Already, a look at the heat transfer versus Jet-Reynolds number correlation (Figure 10b) would indicate that the smaller cooler version with a smaller inlet nozzle performs better. However, while this type of representation allows for good comparison of flow characteristics, it may not necessarily be showing performance differences in constrained environments. As discussed before, when scaling cooling solutions to larger areas, the necessary coolant flow rate per area to achieve a desired heat transfer becomes crucial, as the total needed flow rate scales with the area. Thus, to assess scaling compatibility of geometries, it may be advisable to check the relation to the applied coolant flow per area, as seen in Figure 10c. There it becomes clear that for a given flow per area, a smaller nozzle diameter (at the same nozzle pitch) is performing much better than a large one. However, as the following modeling study is mainly concerned with the effects of a change in nozzle pitch at constant flow rates per area, a representation depending on this constant value would fall flat. Nevertheless, a representation of the data with respect to the directly controlled variable will be of use—in this case, the aforementioned nozzle pitch.
Aside from that, for additional comparative characterization, the relation of Jet-Nusselt number to Jet-Reynolds number will also be presented, both for linear and logarithmic scaling, as shown in Figure 11.

3. Results

Simulations were performed to confirm the expected benefits of reducing nozzle diameter and cavity height (see Figure 12). Starting from this basis, the intent of this modeling study is to explore the use of increased nozzle pitch for increased cooling performance at equivalent total coolant flow rate at the cost of an increased pressure drop. To this end, the interconnected impact of nozzle pitch and cavity height are investigated.
Simulations were carried out using nozzle level unit cells with straight nozzles (as seen in Figure 5c) with identical inlet and outlet diameter. Dimensions of simulated geometries are listed in Table 2. All simulations were performed for a flow rate per area of 1.17 L/cm2min.
The main performance metrics, namely the heat transfer coefficient, the temperature gradient (both at the heater location) and the pressure drop, are plotted in Figure 13 as a function of the main varied parameter—the nozzle pitch—and in Figure 14 as a function of the Jet-Reynolds number, which changes as a result of keeping the flow rate per area constant.
Pressure drop is plotted here as a measure of comparison, as it has been shown that for small nozzle diameters, the nozzle level accounts for the vast majority of the needed pressure (see Figure 8b). The results for the heat transfer coefficient show the previously mentioned saturation after a certain increase in nozzle pitch, temperature gradient, and pressure drop show the expected exponential rise. For better comparability of the underlying characteristics of the geometries, the resulting relationship between the Jet-Nusselt number and the Jet-Reynolds number are plotted in Figure 15.
The velocity streamlines of the coolant within the cavity for different nozzle pitch values are shown in Figure 16; a circular hydraulic jump can be seen to occur within this domain. The radius of this hydraulic jump remains nearly constant for increased nozzle pitch and thus results in a vastly increased Jet-Reynolds number. The region between the position directly below the inlet nozzle and the occurrence of the hydraulic jump is characterized by high coolant velocity close to the fluid–solid interface. Due to this, the thermal boundary layer there is thinned, allowing for elevated levels of heat transfer. This is in contrast to the region beyond the hydraulic jump, where the fluid velocity close to the interface is greatly reduced, increasing the thermal boundary layer, thus worsening the heat transfer there. As the high heat transfer region upstream of the hydraulic jump remains near constant in size while the overall distance between the inlet and the outlet is increased, the average heat transfer coefficient is lowered as the relative share of the area that benefits from high heat transfer is decreased.
While the increased jet velocity for larger pitches at constant flow rate per area increases the maximum heat transfer directly beneath the jet, the growing region of deteriorated heat transfer downstream of the hydraulic jump results in a stagnation of the average cooling performance, as shown from the plots of average, maximum, and minimum cooling performance in Figure 17. Figure 18 further illustrates this effect: While the Nusselt number distribution is virtually uniform at a nozzle pitch of 1.25 mm (Figure 18a), this changes significantly with increased pitch, especially at a pitch of 3 mm, where it can be seen that a small region of heightened Nusselt number is formed around the position of the inlet nozzle, while the performance closer to the outlet is deteriorated. These areas directly correlate with the regions upstream and downstream of the occurrence of the hydraulic jump in the cavity. Here, it has to be noted, however, that the effective heat transfer coefficient (evaluated at the location of the heater) is used in the calculation of the Nusselt number, which means that the shown profile is smoothed due to lateral heat spreading in the silicon substrate between the cooled surface and the heaters.
As these simulations indicate a dependence of the position of the hydraulic jump on the cavity height, purely hydraulic simulations are performed to explore this trend. To this end, the hydraulic jump diameter is monitored for changing cavity height. The hydraulic jump diameter is defined here as twice the radial distance from the center of the inlet jet, where the hydraulic jump occurs. Figure 19 shows a near linear relationship between hydraulic jump diameter and cavity height in the investigated region of small nozzle-to-target spacings. The simulations shown in Figure 19 were performed using 250 µm inlet diameter, 4 mm nozzle pitch, and a flow rate per area of 0.585 L/cm2min; these are considerably different conditions than the previous simulations. However, the hydraulic jump diameters at 110 µm and 180 µm cavity height correspond well to the previously found points of saturation/hydraulic jump diameters, showcasing the dominant effect of the cavity height in this range of dimensions and flow rate.
A limitation of the employed steady-state nozzle level unit cell model, however, is that it cannot address possible jet–jet interactions and other deviations, which may disturb the observed formation of a hydraulic jump: Temporary deviations are not included due to the steady-state nature, and the fact that only a single jet is modeled with symmetric boundary conditions means that no real jet–jet interaction is included. To test the influence of real jet–jet interaction, simulations with extended computational domain have been performed and compared to those employing nozzle level unit cells. Figure 20a shows that when doubling the unit cell at an inlet diameter of 250 µm and a cavity height of 110 µm, the thermal response to increasing the nozzle pitch beyond the hydraulic jump diameter remains unchanged. Also, for a simulation domain modeling a full outlet and four partial inlets, the response in the change in hydraulic jump diameter with changing cavity height remains reasonably congruent with single unit cell simulations, as Figure 20b shows. Nevertheless, to deepen the understanding of the described phenomenon, further study and follow up work is needed, both in simulation, as well as in experimental nature.

4. Discussion

The simulation study in this work clearly demonstrates that the nozzle pitch is a viable variable for facilitating a tradeoff between the flow rate per area and pressure drop. This tradeoff can be vital to achieving a desired cooling performance in direct liquid jet impingement cooling when scaling the cooling to larger areas. This is achieved, as increasing the nozzle pitch allows the conversion of the total flow rate necessary to achieve a certain heat transfer into increased incurred pressure drop. However, it also becomes obvious that this tradeoff is only efficient up to a certain pitch, as the occurrence of a hydraulic jump within the impingement cavity deteriorates the performance when increasing the pitch above the diameter of this hydraulic jump. The jump radius appears to be mainly dependent on the cavity height and much less on the Jet-Reynolds and Froude numbers as found in classical free jet impingement ([17,18]): As seen in Figure 13a, for different nozzle diameters the saturation of average heat transfer occurs at the same nozzle pitch. For a larger cavity height, however, it is seen that the nozzle pitch at which this deterioration of the performance increase begins is also shifted to a higher value, which is in line with the pinch-off effect described by Brunschwiler et al. [4] for decreasing nozzle-to-target spacing. In contrast to that, Figure 16 shows a near identical hydraulic jump radius for vastly different jet inlet velocities at identical inlet diameter. Thus, it has to be assumed that in such cases of low cavity height, it is not the main jet itself that is the determining factor for the position of the hydraulic jump, but the cavity. Indeed, as shown in Figure 19, a strong, near linear dependence on the cavity height is found by simulation. While the nozzle pitch and flow rate for these models differ from the earlier ones, hydraulic jump positions for 110 µm and 180 µm cavity height correspond well to the previously found values, further cementing the dominant influence of the nozzle-to-target spacing. In addition to this, an inclusion of jet–jet interaction by extension of the simulation domain was found to have only limited influence on the results, as shown in Figure 20. However, further investigation of the phenomenon by extended simulation and experimental studies is warranted.

5. Conclusions

In this work, a well validated model was used to investigate the potential of the use of increased nozzle pitch for the increase in cooling performance at constrained total coolant flow rates, which is needed for area upscaling of the cooling solution. An investigation of a stagnation of improvement at large nozzle pitches found the presence of a hydraulic pitch within the impingement cavity to be the cause of the deterioration of performance. The position of this hydraulic pitch was confirmed in the range of used geometry dimensions and flow rates to be mainly dependent on the used cavity height.
For the design of an impingement cooler with the tradeoff between pressure drop and flow rate in mind, adjustments to their relationship can be facilitated by choosing an appropriate nozzle pitch. However, especially at small dimensions for nozzle diameter and cavity height—which are shown to be beneficial for overall heat transfer—caution needs to be taken not to increase the nozzle pitch to a value larger than a possibly occurring hydraulic jump. This restriction of the pitch can be remediated by an appropriate choice of inlet diameter. Indeed, as can be seen in Figure 13, Figure 14 and Figure 15 for smaller values of the nozzle diameter, the heat transfer coefficient saturates at higher values. This is due to the higher inlet velocity achieved by these nozzles already at lower pitch values.

Author Contributions

Conceptualization, G.E., H.O., V.C., G.V.d.P., E.B. and I.D.W.; Methodology, G.E. and H.O.; Validation, G.E. and V.C.; Formal analysis, G.E., H.O. and I.D.W.; Investigation, G.E. and V.C.; Resources, G.V.d.P. and E.B.; Data curation, G.E.; Writing—original draft, G.E.; Writing—review & editing, G.E., H.O. and I.D.W.; Visualization, G.E.; Supervision, H.O. and I.D.W.; Project administration, G.V.d.P. and E.B.; Funding acquisition, E.B. All authors have read and agreed to the published version of the manuscript.

Funding

This Research received no external funding.

Data Availability Statement

Data are contained within the article.

Conflicts of Interest

The authors declare no conflict of interest.

References

  1. Zuckerman, N.; Lior, N. Jet Impingement Heat Transfer: Physics, Correlations, and Numerical Modeling. In Advances in Heat Transfer; Elsevier: Amsterdam, The Netherlands, 2006; Volume 39, pp. 565–631. [Google Scholar] [CrossRef]
  2. Ekkad, S.V.; Singh, P. A Modern Review on Jet Impingement Heat Transfer Methods. J. Heat Transf. 2021, 143, 064001. [Google Scholar] [CrossRef]
  3. Plant, R.D.; Friedman, J.; Saghir, M.Z. A review of jet impingement cooling. Int. J. Thermofluids 2023, 17, 100312. [Google Scholar] [CrossRef]
  4. Brunschwiler, T.; Rothuizen, H.; Fabbri, M.; Kloter, U.; Michel, B.; Bezama, R.J.; Natarajan, G. Direct Liquid Jet-Impingment Cooling with Micron-Sized Nozzle Array and Distributed Return Architecture. In Proceedings of the Thermal and Thermomechanical Proceedings 10th Intersociety Conference on Phenomena in Electronics Systems, 2006, ITHERM 2006, San Diego, CA, USA, 30 May–2 June 2006; pp. 196–203. [Google Scholar] [CrossRef]
  5. Overholt, M.R.; McCandless, A.; Kelly, K.W.; Becnel, C.J.; Motakef, S. Micro-Jet Arrays for Cooling of Electronic Equipment. In ASME 3rd International Conference on Microchannels and Minichannels, Part B Cont’d; ASMEDC: Toronto, ON, Canada, 2005; pp. 249–252. [Google Scholar] [CrossRef]
  6. Browne, E.A.; Michna, G.J.; Jensen, M.K.; Peles, Y. Experimental Investigation of Single-Phase Microjet Array Heat Transfer. J. Heat Transf. 2010, 132, 041013. [Google Scholar] [CrossRef]
  7. Ndao, S.; Peles, Y.; Jensen, M.K. Effects of pin fin shape and configuration on the single-phase heat transfer characteristics of jet impingement on micro pin fins. Int. J. Heat Mass Transf. 2014, 70, 856–863. [Google Scholar] [CrossRef]
  8. Bhunia, A.; Chen, C.L. On the Scalability of Liquid Microjet Array Impingement Cooling for Large Area Systems. J. Heat Transf. 2011, 133, 064501. [Google Scholar] [CrossRef]
  9. Rattner, A.S. General Characterization of Jet Impingement Array Heat Sinks with Interspersed Fluid Extraction Ports for Uniform High-Flux Cooling. J. Heat Transf. 2017, 139, 082201. [Google Scholar] [CrossRef]
  10. Wei, T.-W.; Oprins, H.; Cherman, V.; Yang, Z.; Rivera, K.; Van der Plas, G.; Pawlak, B.J.; England, L.; Beyne, E.; Baelmans, M. Demonstration of Package Level 3D-printed Direct Jet Impingement Cooling applied to High power, Large Die Applications. In Proceedings of the 2020 IEEE 70th Electronic Components and Technology Conference (ECTC), Orlando, FL, USA, 3–30 June 2020; pp. 1422–1429. [Google Scholar] [CrossRef]
  11. Wei, T.; Oprins, H.; Cherman, V.; Yang, Z.; Rivera, K.; Van der Plas, G.; Pawlak, B.J.; England, L.; Beyne, E.; Baelmans, M. Experimental and Numerical Study of 3-D Printed Direct Jet Impingement Cooling for High-Power, Large Die Size Applications. IEEE Trans. Compon. Packag. Manufact. Technol. 2021, 11, 415–425. [Google Scholar] [CrossRef]
  12. Elsinger, G.; Oprins, H.; Cherman, V.; Van der Plas, G.; Beyne, E.; De Wolf, I. Micro-Scale Jet Cooling: A Numerical Study on Improvement Options. In Proceedings of the 2023 22nd IEEE Intersociety Conference on Thermal and Thermomechanical Phenomena in Electronic Systems (ITherm), Orlando, FL, USA, 30 May–2 June 2023; pp. 1–10. [Google Scholar] [CrossRef]
  13. Roache, P.J. Quantification of Uncertainty in Computational Fluid Dynamics. Annu. Rev. Fluid Mech. 1997, 29, 123–160. [Google Scholar] [CrossRef]
  14. Wei, T.; Oprins, H.; Cherman, V.; Beyne, E.; Baelmans, M. Conjugate Heat Transfer and Fluid Flow Modeling for Liquid Microjet Impingement Cooling with Alternating Feeding and Draining Channels. Fluids 2019, 4, 145. [Google Scholar] [CrossRef]
  15. Smith, A.H.; Bhavnani, S.H.; Knight, R.W. Improving fluid-thermal performance of impinging jet arrays with small-scale engineered surface augmentations in the fountain regions. In Proceedings of the 2023 22nd IEEE Intersociety Conference on Thermal and Thermomechanical Phenomena in Electronic Systems (ITherm), Orlando, FL, USA, 30 May–2 June 2023; pp. 1–9. [Google Scholar] [CrossRef]
  16. Wei, T.-W.; Oprins, H.; Cherman, V.; Van der Plas, G.; De Wolf, I.; Beyne, E.; Baelmans, M. Experimental characterization and model validation of liquid jet impingement cooling using a high spatial resolution and programmable thermal test chip. Appl. Therm. Eng. 2019, 152, 308–318. [Google Scholar] [CrossRef]
  17. Liu, X.; Lienhard, J.H. The hydraulic jump in circular jet impingement and in other thin liquid films. Exp. Fluids 1993, 15, 108–116. [Google Scholar] [CrossRef]
  18. Choo, K.; Kim, S.J. The influence of nozzle diameter on the circular hydraulic jump of liquid jet impingement. Exp. Therm. Fluid Sci. 2016, 72, 12–17. [Google Scholar] [CrossRef]
Figure 1. Visualization of terminology related to impingement coolers.
Fluids 09 00069 g001
Figure 2. (a) Configuration of the Unit Cell (UC)-based Thermal Test Vehicle (TTV) used in experiments consisting of a 16 × 16 mm2 chip with 8 × 8 mm2 actively heated and cooled area. (b) A schematic view of a single 4 × 4 mm2 UC.
Fluids 09 00069 g002
Figure 3. (a) Top view of the TTV attachment position on PCB and (b) a schematic cross section of the full assembly of cooler, TTV and PCB.
Fluids 09 00069 g003
Figure 4. Top view (a) and cross section (b) of the CAD design used as basis for cooler fabrication by 3D printing. (c) A negative of the CAD design representing the fluid domain used for cooler level simulations.
Fluids 09 00069 g004
Figure 5. (a) A schematic representation of the grid of inlets and interspersed nozzles and (b) a nozzle level unit cell used in simulations; (c) shows a nozzle level unit cell with simpler inlet shape, also used in simulations.
Fluids 09 00069 g005
Figure 6. Comparison of experimental results of average heat transfer coefficient for (a) 250 µm inlets and (b) 500 µm inlets against simulation with different turbulence models.
Fluids 09 00069 g006
Figure 7. Percentual deviation of the simulated average heat transfer (using transition SST turbulence model) at the heater location from the average experimental heat transfer coefficient.
Fluids 09 00069 g007
Figure 8. Comparison of simulation results for nozzle level unit cells, cooler level simulations and experimentally measured pressure drop versus flow rate per area number for 500 µm (a) and 250 µm (b) inlet diameter.
Fluids 09 00069 g008
Figure 9. Comparison of average cooling performance between experimentally used nozzle geometry (Figure 5b) and straight nozzle (Figure 5c) for different nozzle dimensions (a) and different flow rates (b).
Fluids 09 00069 g009
Figure 10. Different forms of representation of the change in average heat transfer with an increase in flow rate for a comparison of two inlet diameters. (a) A representation as heat transfer versus expected average velocity at the point of injection into the cavity. (b) Heat transfer versus Jet-Reynolds number and (c) heat transfer versus flow rate per heated/cooled area.
Fluids 09 00069 g010
Figure 11. Comparison of experiment and simulation for average Jet-Nusselt number versus Jet-Reynolds number in linear (a) and logarithmic scale (b).
Fluids 09 00069 g011
Figure 12. Simulation results showing an increased average heat transfer coefficient for going toward (a) smaller nozzle diameters and (b) smaller cavity heights.
Fluids 09 00069 g012
Figure 13. Simulation results showing the effects of increased nozzle pitch at constant flow rate per area of 1.17 L/cm2min (thus increasing jet velocity) on average heat transfer (a), temperature uniformity (b), and pressure drop (c).
Fluids 09 00069 g013
Figure 14. Simulation results showing the effects of increased nozzle pitch at constant flow rate per area as a function of the increasing Jet-Reynolds number for (a) average heat transfer coefficient, (b) temperature uniformity, and (c) pressure drop.
Fluids 09 00069 g014
Figure 15. Linear scale (a) and logarithmic scale (b) representations of the simulated average Jet-Nusselt number versus Jet-Reynolds number relationship for 250 µm and 320 µm inlet diameters and cavity heights of 110 µm and 180 µm.
Fluids 09 00069 g015
Figure 16. Showcase of the near-constant radius of the simulated hydraulic jump present within the cavity for increased nozzle pitch resulting in a considerably increased jet velocity and Jet-Reynolds number at a cavity height of 110 µm and a nozzle diameter of 250 µm.
Fluids 09 00069 g016
Figure 17. Simulation results of the separation of maximum, minimum and average Nusselt numbers after the nozzle pitch is increased beyond the diameter of the hydraulic jump. Nusselt number is plotted versus pitch (ac) and Reynolds number (df). Results for inlet diameter of 250 µm and cavity height of 110 µm are found in (a,d), for inlet diameter of 250 µm and cavity height of 180 µm in (b,e), and for inlet diameter of 320 µm and cavity height of 110 µm in (c,f).
Fluids 09 00069 g017aFluids 09 00069 g017b
Figure 18. Nujet (defined here using the effective heat transfer coefficient at the heater location) distribution for inlet diameter of 250 µm with a cavity height of 110 µm (a) for 1.25 mm nozzle pitch, (b) 2 mm nozzle pitch, and (c) 3 mm nozzle pitch.
Fluids 09 00069 g018
Figure 19. Simulation results for the hydraulic jump diameter dependent on the cavity height using a 250 µm inlet diameter, 4 mm nozzle pitch, and a flow rate of 0.585 L/cm2min.
Fluids 09 00069 g019
Figure 20. (a) Heat transfer coefficient versus nozzle pitch, comparing results for a single unit cell model and a double unit cell model. (b) Comparison of hydraulic jump results for a single unit cell model and an 8× unit cell model, which simulates a full outlet and four inlet parts.
Fluids 09 00069 g020
Table 1. Dimensions of cooler models used in the experimental setup.
CoolerInlet DiameterOutlet DiameterNozzle PitchCavity Height
I_250250 µm800 µm2290 µm600 µm
I_500500 µm800 µm2290 µm600 µm
Table 2. Dimensions of cooler models used in the model setup.
ConfigurationInlet DiameterOutlet DiameterNozzle PitchCavity Height
i250-c110250 µm250 µm350–3000 µm110 µm
i250-c180250 µm250 µm500–3500 µm180 µm
i320-c180320 µm320 µm450–3000 µm110 µm
Disclaimer/Publisher’s Note: The statements, opinions and data contained in all publications are solely those of the individual author(s) and contributor(s) and not of MDPI and/or the editor(s). MDPI and/or the editor(s) disclaim responsibility for any injury to people or property resulting from any ideas, methods, instructions or products referred to in the content.

